Analytic Enterprise: Identifying Barriers and Overcoming ... Group Presentations... · Advanced...
31
Copyright © 2009, SAS Institute Inc. All rights reserved. Analytic Enterprise: Identifying Barriers and Overcoming Challenges James Waite Sr. Training Specialist - Business Intelligence
Transcript of Analytic Enterprise: Identifying Barriers and Overcoming ... Group Presentations... · Advanced...
Copyright © 2009, SAS Institute Inc. All rights reserved.
Analytic Enterprise: Identifying Barriers and Overcoming Challenges
James WaiteSr. Training Specialist - Business Intelligence
Copyright © 2009, SAS Institute Inc. All rights reserved.
Discussion Topics
� About SAS
� Definition of Terms
� General Barriers to Adoption & Implementation
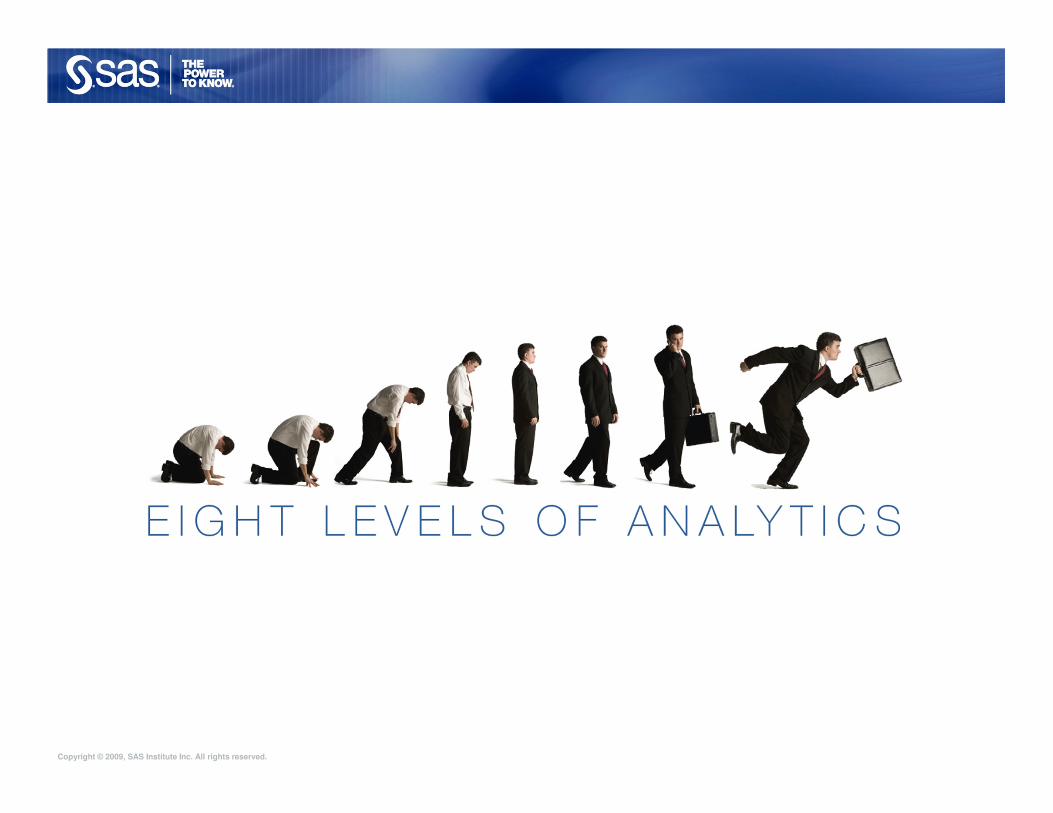
� Eight Levels of Analytics
� Barriers Specific to Business Analytics
� Q & A
Copyright © 2009, SAS Institute Inc. All rights reserved.
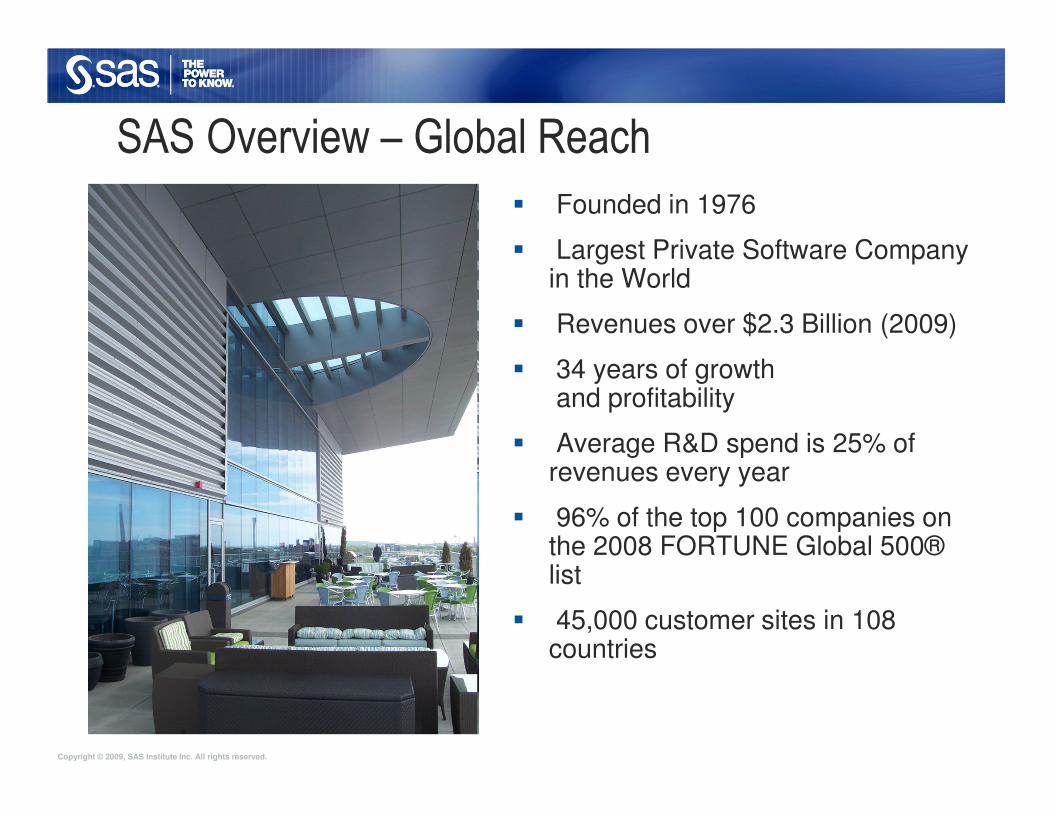
SAS Overview – Global Reach
� Founded in 1976
� Largest Private Software Company in the World
� Revenues over $2.3 Billion (2009)
� 34 years of growthand profitability
� Average R&D spend is 25% of revenues every year
� 96% of the top 100 companies on the 2008 FORTUNE Global 500® list
� 45,000 customer sites in 108 countries
Copyright © 2009, SAS Institute Inc. All rights reserved.
“We want to be the first company people call when they need to solve business problems.”
“SAS has everything it takes to achieve this: unmatched analytical capabilities, deep industry expertise, a long track record of delivering proven results, and the ability to innovate.”
Jim Goodnight, CEOSAS
Copyright © 2009, SAS Institute Inc. All rights reserved.
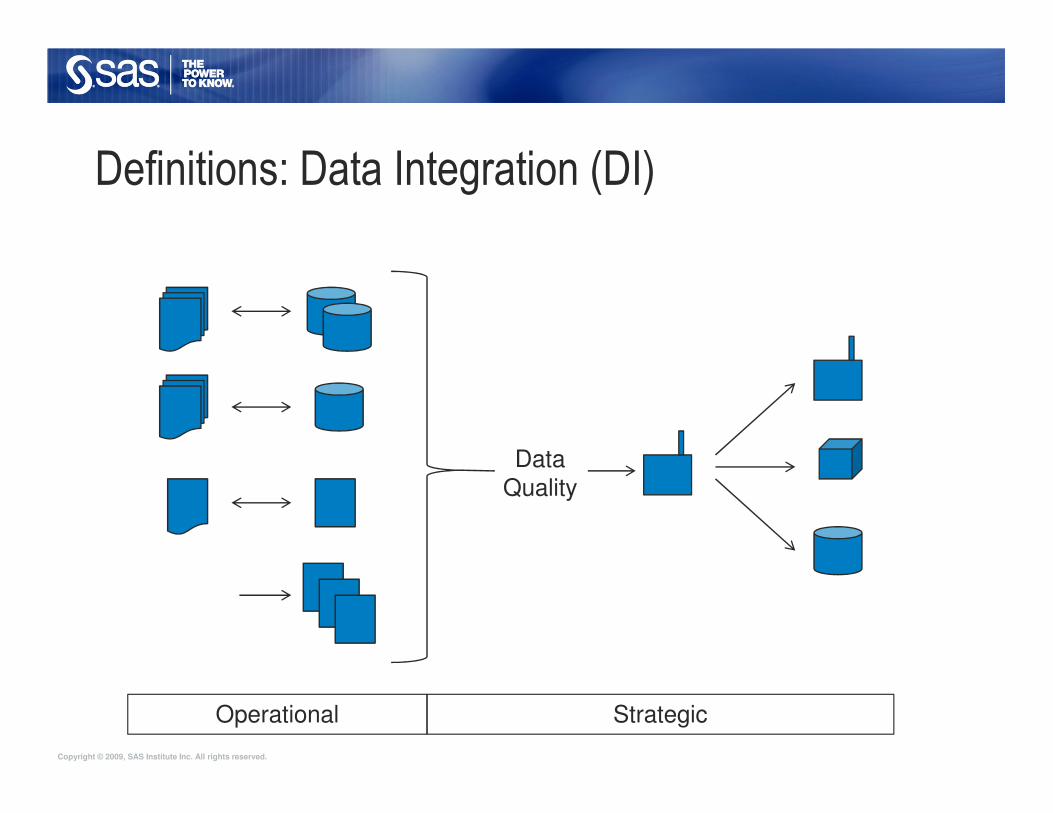
Definitions: Data Integration (DI)
DataQuality
Operational Strategic
Copyright © 2009, SAS Institute Inc. All rights reserved.
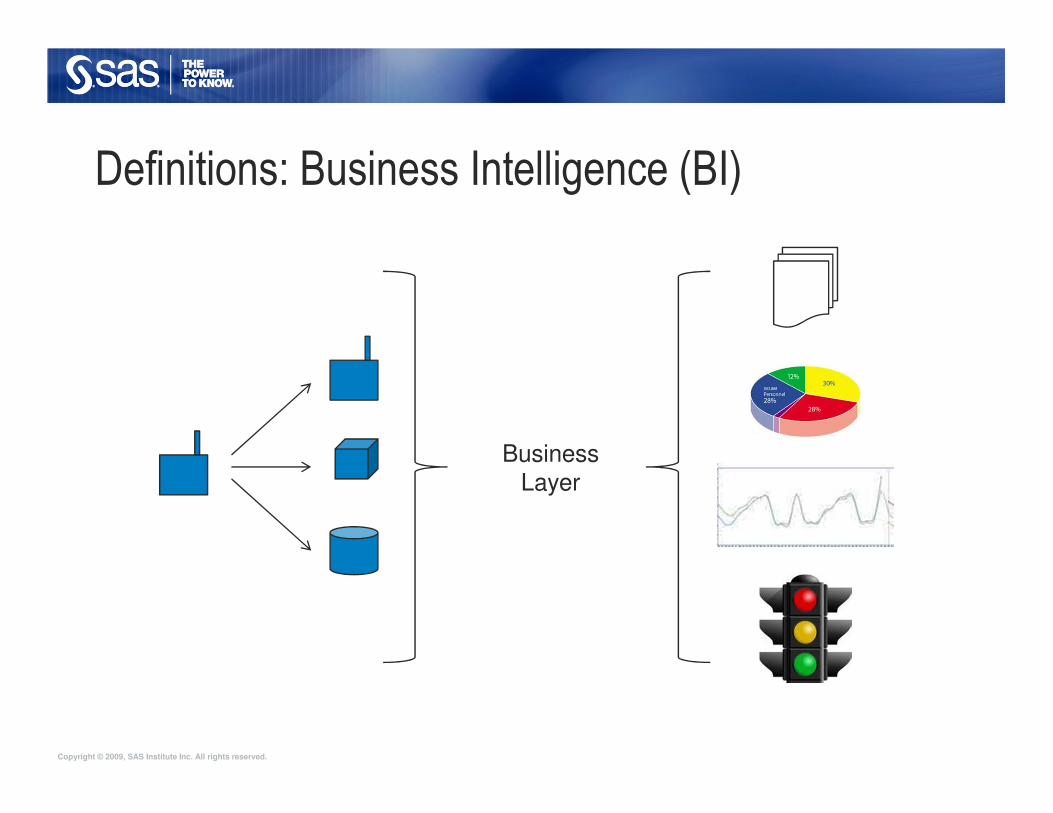
Definitions: Business Intelligence (BI)
BusinessLayer
Copyright © 2009, SAS Institute Inc. All rights reserved.
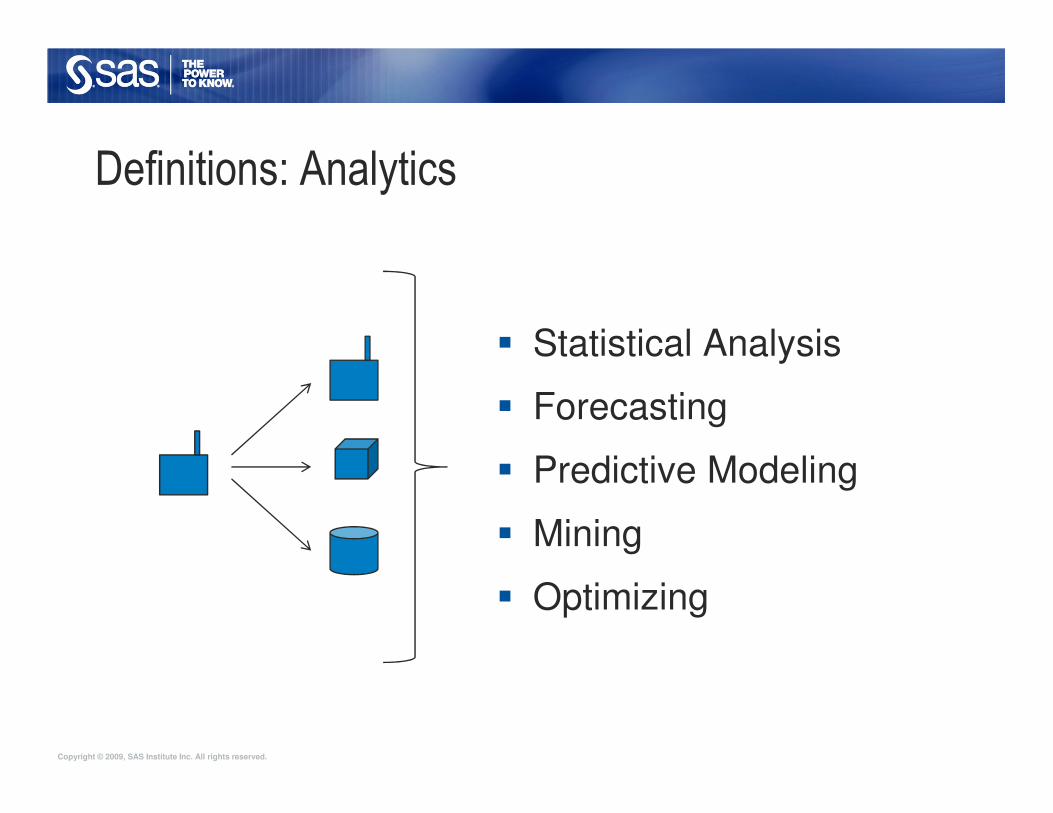
Definitions: Analytics
� Statistical Analysis
� Forecasting
� Predictive Modeling
� Mining
� Optimizing
Copyright © 2009, SAS Institute Inc. All rights reserved.
� IDC defines the Business Analytics software market as tools and applications for tracking, storing, analyzing, modelling, and presenting information in support of automating decision-making and reporting process
Opportunity Abounds

Copyright © 2009, SAS Institute Inc. All rights reserved.
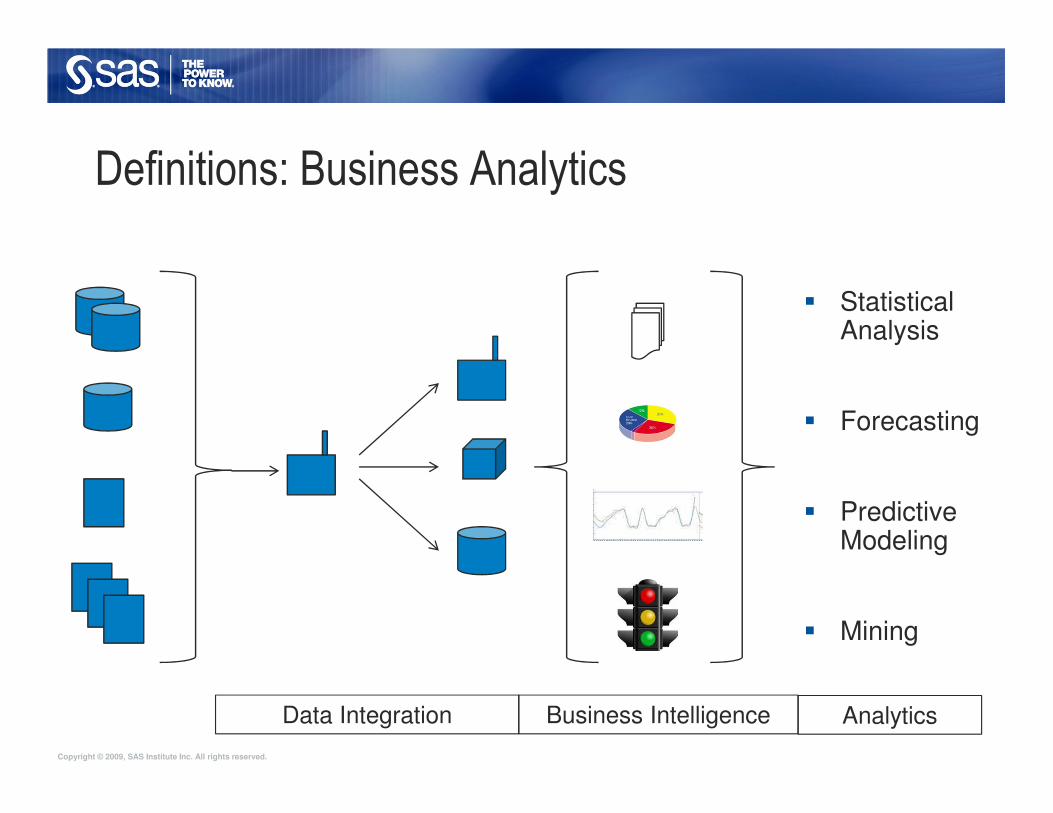
Definitions: Business Analytics
� StatisticalAnalysis
� Forecasting
� Predictive Modeling
� Mining
Data Integration Business Intelligence Analytics
Copyright © 2009, SAS Institute Inc. All rights reserved.
General Barriers to Adoption & Implementation
� Technology
� Data
� Expertise
� Culture
� Commitment
Copyright © 2009, SAS Institute Inc. All rights reserved.
Copyright © 2009, SAS Institute Inc. All rights reserved.
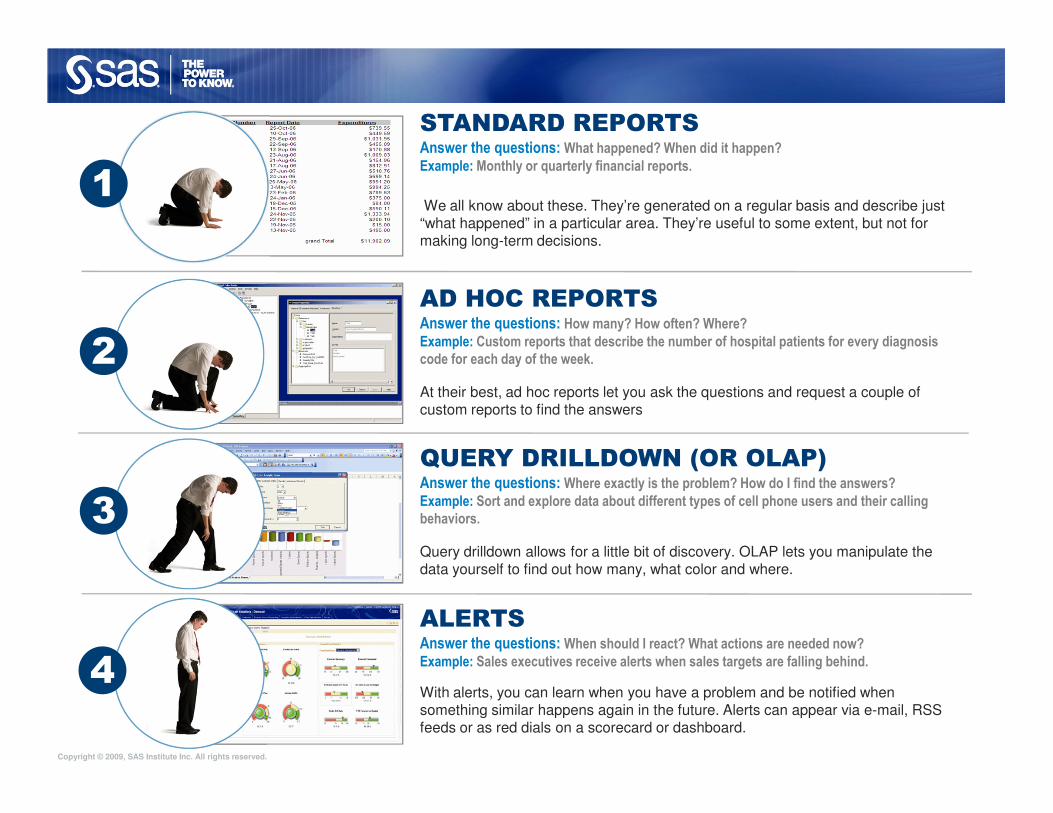
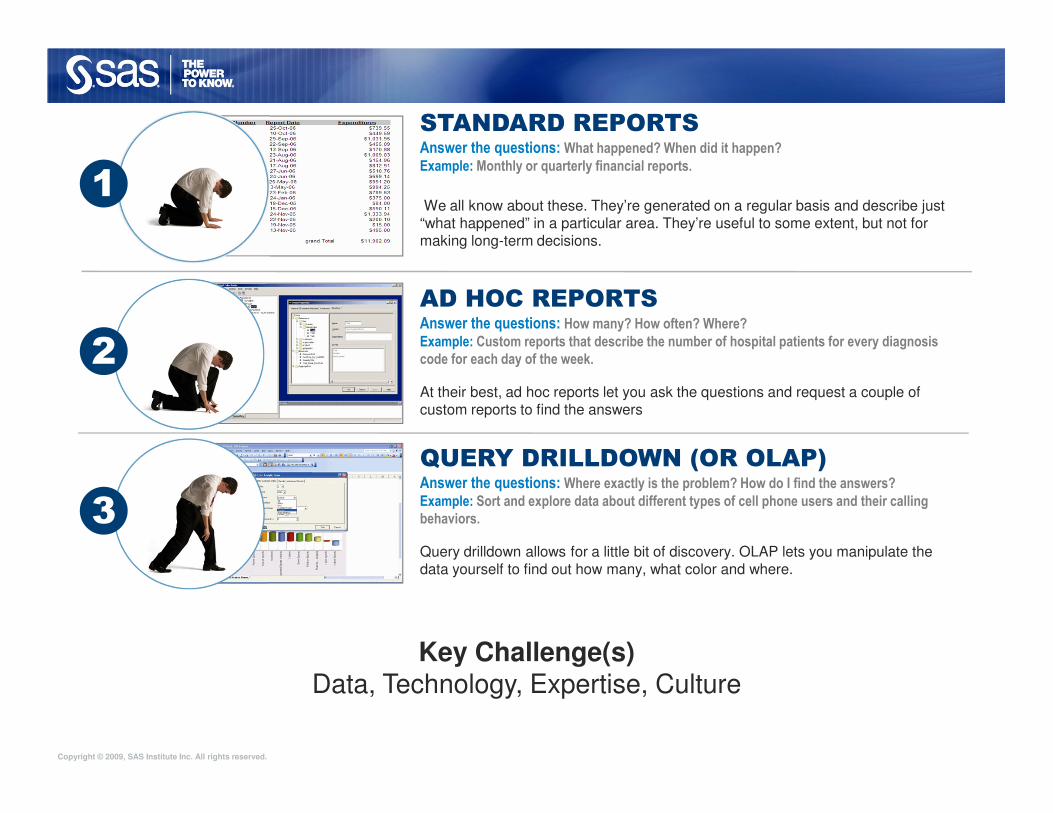
STANDARD REPORTSAnswer the questions: What happened? When did it happen?
Example: Monthly or quarterly financial reports.
AD HOC REPORTSAnswer the questions: How many? How often? Where?
Example: Custom reports that describe the number of hospital patients for every diagnosis
code for each day of the week.
QUERY DRILLDOWN (OR OLAP)Answer the questions: Where exactly is the problem? How do I find the answers?
Example: Sort and explore data about different types of cell phone users and their calling
behaviors.
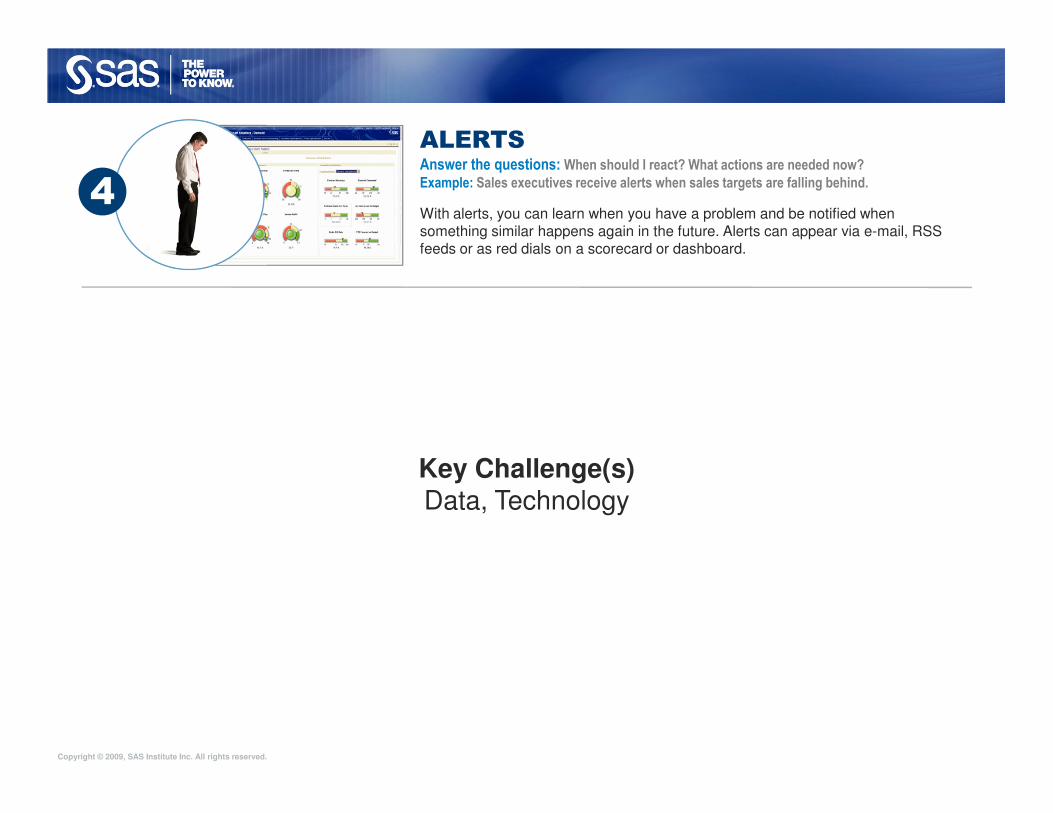
ALERTSAnswer the questions: When should I react? What actions are needed now?
Example: Sales executives receive alerts when sales targets are falling behind.
We all know about these. They’re generated on a regular basis and describe just “what happened” in a particular area. They’re useful to some extent, but not for making long-term decisions.
At their best, ad hoc reports let you ask the questions and request a couple of custom reports to find the answers
Query drilldown allows for a little bit of discovery. OLAP lets you manipulate the data yourself to find out how many, what color and where.
With alerts, you can learn when you have a problem and be notified when something similar happens again in the future. Alerts can appear via e-mail, RSS feeds or as red dials on a scorecard or dashboard.
1
2
3
4
Copyright © 2009, SAS Institute Inc. All rights reserved.
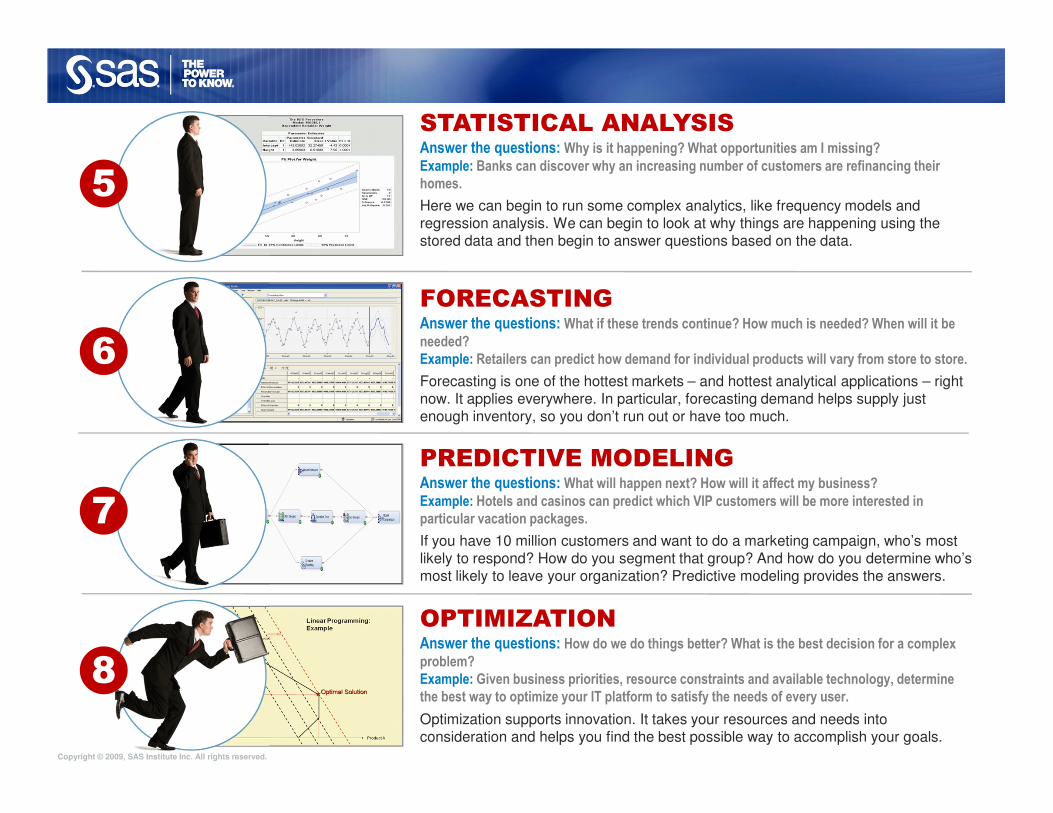
STATISTICAL ANALYSISAnswer the questions: Why is it happening? What opportunities am I missing?
Example: Banks can discover why an increasing number of customers are refinancing their
homes.
FORECASTINGAnswer the questions: What if these trends continue? How much is needed? When will it be
needed?
Example: Retailers can predict how demand for individual products will vary from store to store.
PREDICTIVE MODELINGAnswer the questions: What will happen next? How will it affect my business?
Example: Hotels and casinos can predict which VIP customers will be more interested in
particular vacation packages.
OPTIMIZATIONAnswer the questions: How do we do things better? What is the best decision for a complex
problem?
Example: Given business priorities, resource constraints and available technology, determine
the best way to optimize your IT platform to satisfy the needs of every user.
Here we can begin to run some complex analytics, like frequency models and regression analysis. We can begin to look at why things are happening using the stored data and then begin to answer questions based on the data.
Forecasting is one of the hottest markets – and hottest analytical applications – right now. It applies everywhere. In particular, forecasting demand helps supply just enough inventory, so you don’t run out or have too much.
If you have 10 million customers and want to do a marketing campaign, who’s most likely to respond? How do you segment that group? And how do you determine who’s most likely to leave your organization? Predictive modeling provides the answers.
Optimization supports innovation. It takes your resources and needs into consideration and helps you find the best possible way to accomplish your goals.
5
6
7
8
Copyright © 2009, SAS Institute Inc. All rights reserved.
STANDARD REPORTSAnswer the questions: What happened? When did it happen?
Example: Monthly or quarterly financial reports.
AD HOC REPORTSAnswer the questions: How many? How often? Where?
Example: Custom reports that describe the number of hospital patients for every diagnosis
code for each day of the week.
QUERY DRILLDOWN (OR OLAP)Answer the questions: Where exactly is the problem? How do I find the answers?
Example: Sort and explore data about different types of cell phone users and their calling
behaviors.
We all know about these. They’re generated on a regular basis and describe just “what happened” in a particular area. They’re useful to some extent, but not for making long-term decisions.
At their best, ad hoc reports let you ask the questions and request a couple of custom reports to find the answers
Query drilldown allows for a little bit of discovery. OLAP lets you manipulate the data yourself to find out how many, what color and where.
1
2
3
Key Challenge(s)Data, Technology, Expertise, Culture
Copyright © 2009, SAS Institute Inc. All rights reserved.
ALERTSAnswer the questions: When should I react? What actions are needed now?
Example: Sales executives receive alerts when sales targets are falling behind.
With alerts, you can learn when you have a problem and be notified when something similar happens again in the future. Alerts can appear via e-mail, RSS feeds or as red dials on a scorecard or dashboard.
4
Key Challenge(s)Data, Technology
Copyright © 2009, SAS Institute Inc. All rights reserved.
BI = ?
Backwards Insight
� Extremely valuable…but REACTIVE
� The “now what” is heavily reliant on gut-feel, intuition, industry expertise…
…which just got a better job offer!
Copyright © 2009, SAS Institute Inc. All rights reserved.
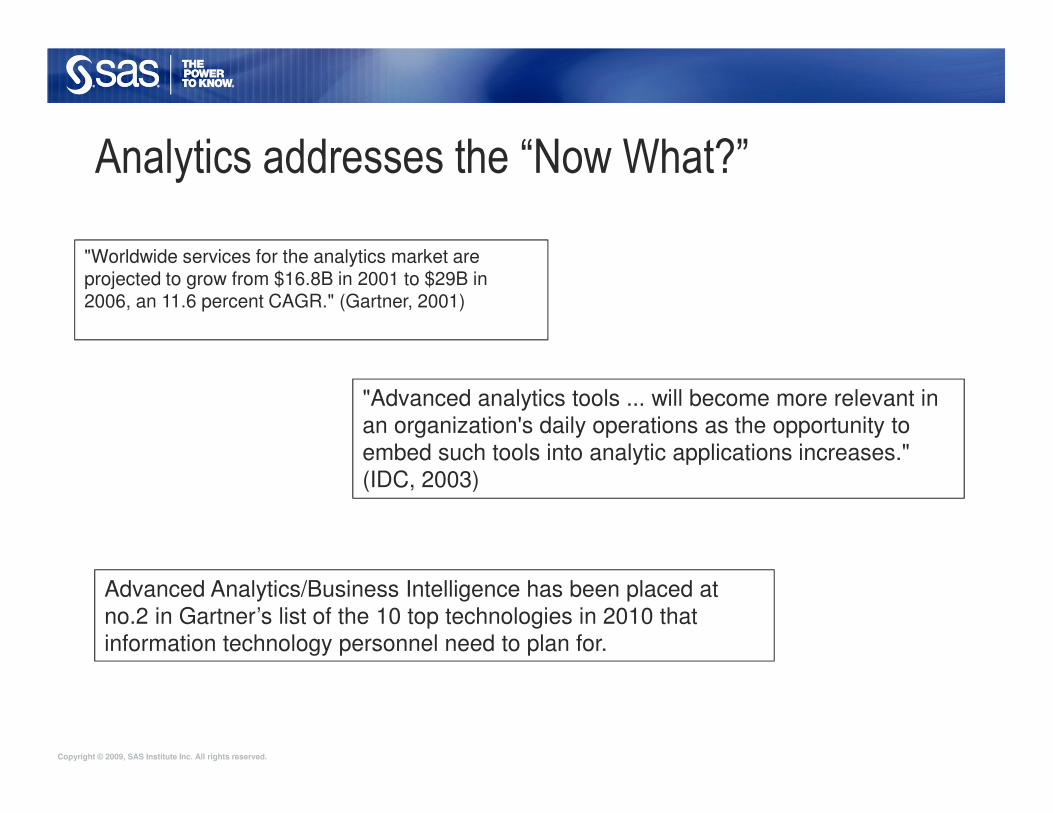
Analytics addresses the “Now What?”
"Advanced analytics tools ... will become more relevant in an organization's daily operations as the opportunity to embed such tools into analytic applications increases." (IDC, 2003)
"Worldwide services for the analytics market are projected to grow from $16.8B in 2001 to $29B in 2006, an 11.6 percent CAGR." (Gartner, 2001)
Advanced Analytics/Business Intelligence has been placed at no.2 in Gartner’s list of the 10 top technologies in 2010 that information technology personnel need to plan for.
Copyright © 2009, SAS Institute Inc. All rights reserved.
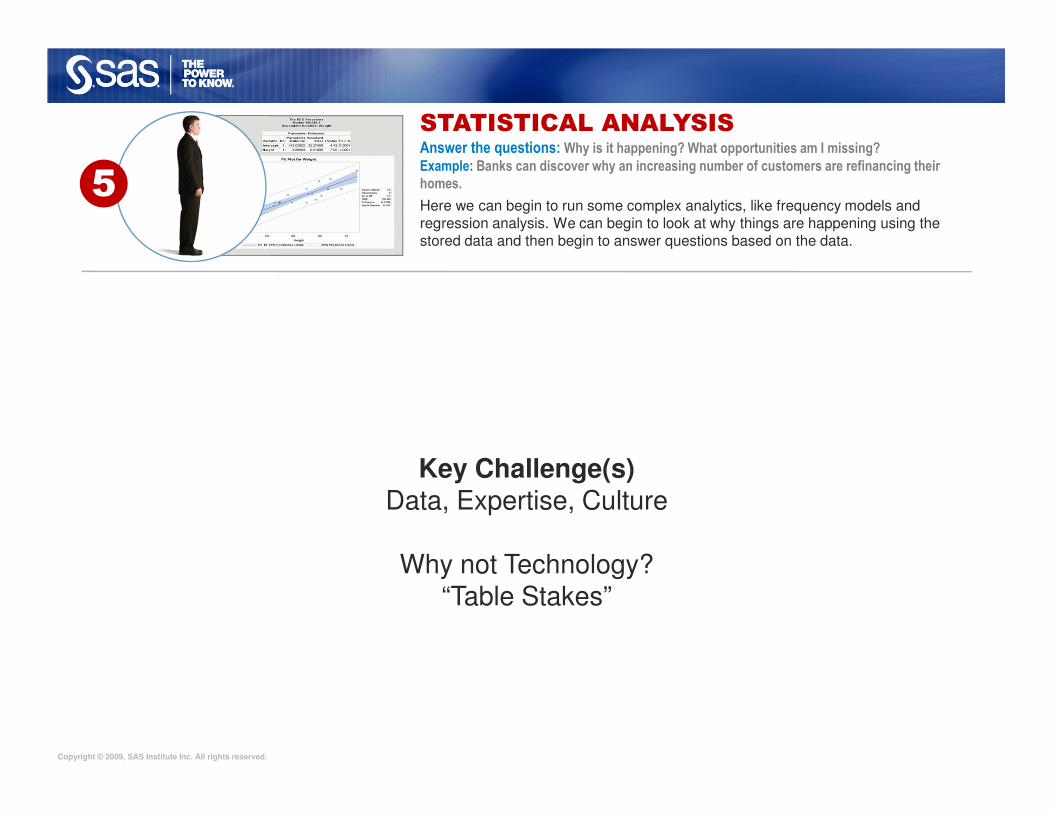
STATISTICAL ANALYSISAnswer the questions: Why is it happening? What opportunities am I missing?
Example: Banks can discover why an increasing number of customers are refinancing their
homes.
Here we can begin to run some complex analytics, like frequency models and regression analysis. We can begin to look at why things are happening using the stored data and then begin to answer questions based on the data.
5
Key Challenge(s)Data, Expertise, Culture
Why not Technology?“Table Stakes”
Copyright © 2009, SAS Institute Inc. All rights reserved.
Key Business QuestionDoes the price of gas have a direct impact the amount of consumption?
Copyright © 2009, SAS Institute Inc. All rights reserved.
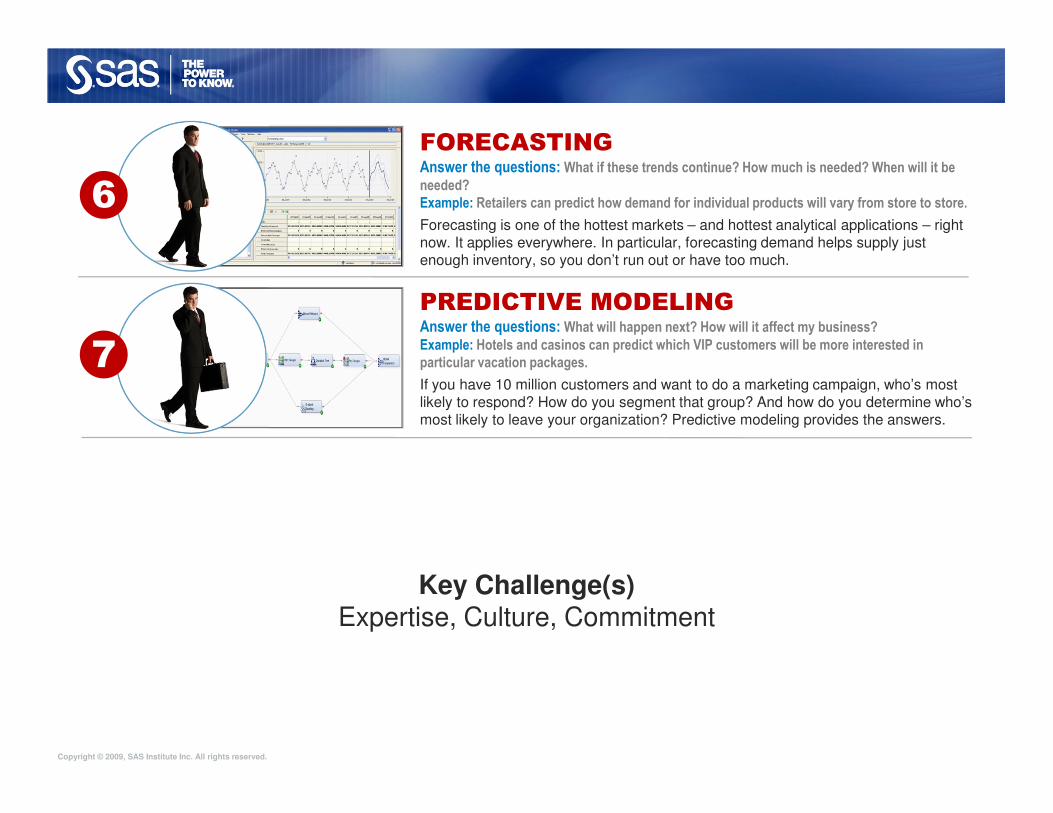
FORECASTINGAnswer the questions: What if these trends continue? How much is needed? When will it be
needed?
Example: Retailers can predict how demand for individual products will vary from store to store.
PREDICTIVE MODELINGAnswer the questions: What will happen next? How will it affect my business?
Example: Hotels and casinos can predict which VIP customers will be more interested in
particular vacation packages.
Forecasting is one of the hottest markets – and hottest analytical applications – right now. It applies everywhere. In particular, forecasting demand helps supply just enough inventory, so you don’t run out or have too much.
If you have 10 million customers and want to do a marketing campaign, who’s most likely to respond? How do you segment that group? And how do you determine who’s most likely to leave your organization? Predictive modeling provides the answers.
6
7
Key Challenge(s)Expertise, Culture, Commitment
Copyright © 2009, SAS Institute Inc. All rights reserved.
Two Analysts Walk Into a Bar…
“Two analysts were examining the output of the new computer in their department. After an hour or so of analyzing the data, one of them remarked: "Do you realize it would take 400 people at least 250 years to make a mistake this big ?”
Copyright © 2009, SAS Institute Inc. All rights reserved.
Cognitive Dissonance
Humans vs Rats
Balls (red and green) experiment rigged with a probability that green will show 75% of the time.
Rats quickly learned the pattern and always guessed green.
Knowing the pattern, humans applied “reasoning” to outperform (i.e. there have been 3 green, so I’ll predict red)
- see end slide for details of study
Copyright © 2009, SAS Institute Inc. All rights reserved.
Cognitive Dissonance
� Huge amount of scenarios
� Role of Analysts needs to evolve
� Intuition > Intervention > Validation
� New avenues can yield biggest benefits
Copyright © 2009, SAS Institute Inc. All rights reserved.
Commitment & Culture
� Rationale must be clear – both ways
� Culture of Innovation
� Commitment to implementation
A B C D E
Copyright © 2009, SAS Institute Inc. All rights reserved.
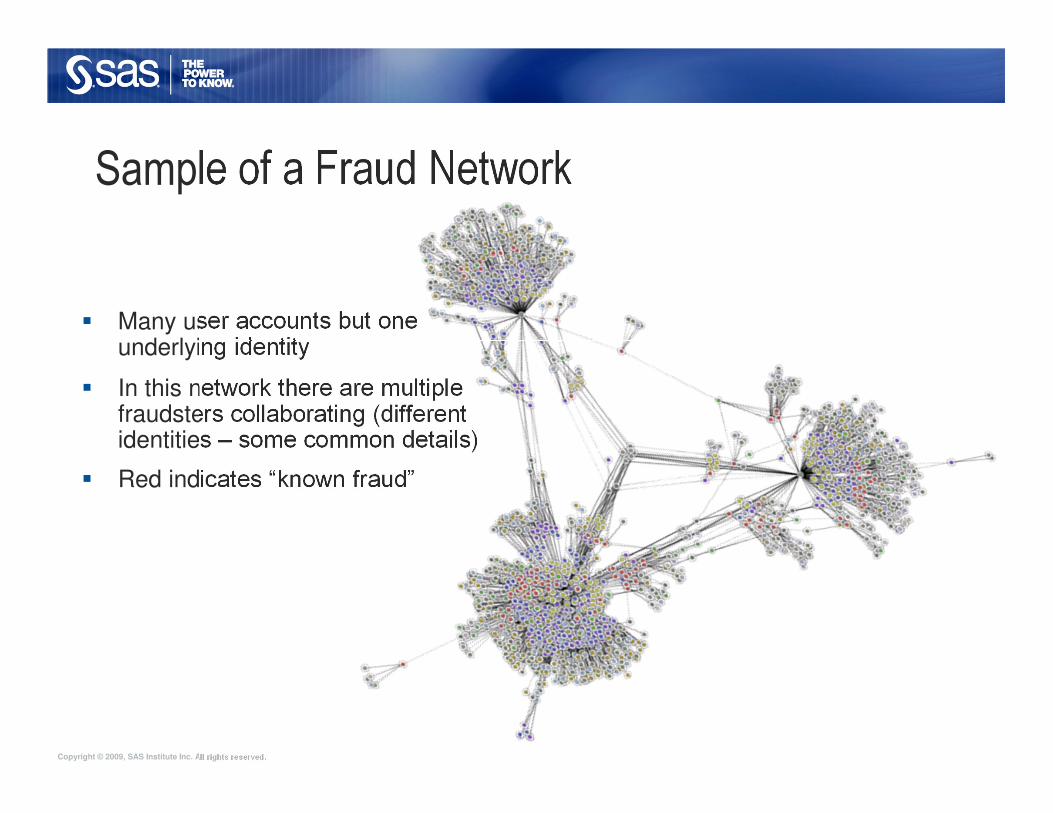
Sample of a Fraud Network
� Many user accounts but one underlying identity
� In this network there are multiple fraudsters collaborating (different identities – some common details)
� Red indicates “known fraud”
Copyright © 2009, SAS Institute Inc. All rights reserved.
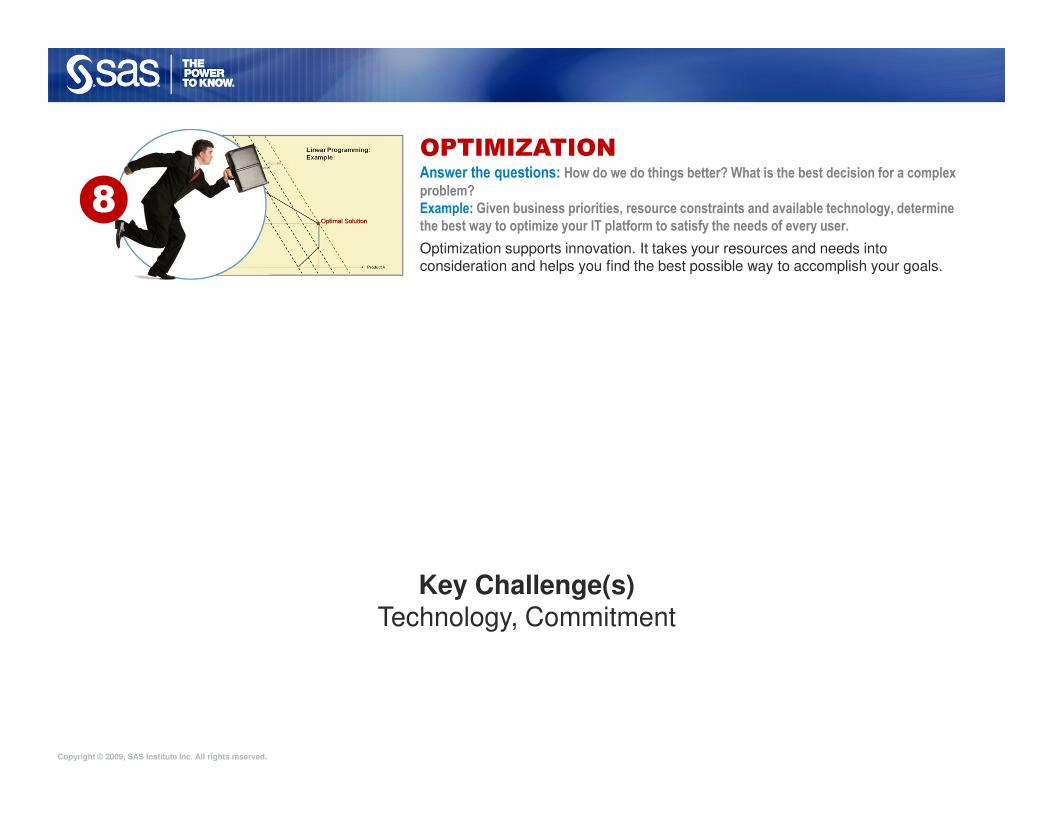
OPTIMIZATIONAnswer the questions: How do we do things better? What is the best decision for a complex
problem?
Example: Given business priorities, resource constraints and available technology, determine
the best way to optimize your IT platform to satisfy the needs of every user.
Optimization supports innovation. It takes your resources and needs into consideration and helps you find the best possible way to accomplish your goals.
8
Key Challenge(s)Technology, Commitment
Copyright © 2009, SAS Institute Inc. All rights reserved.
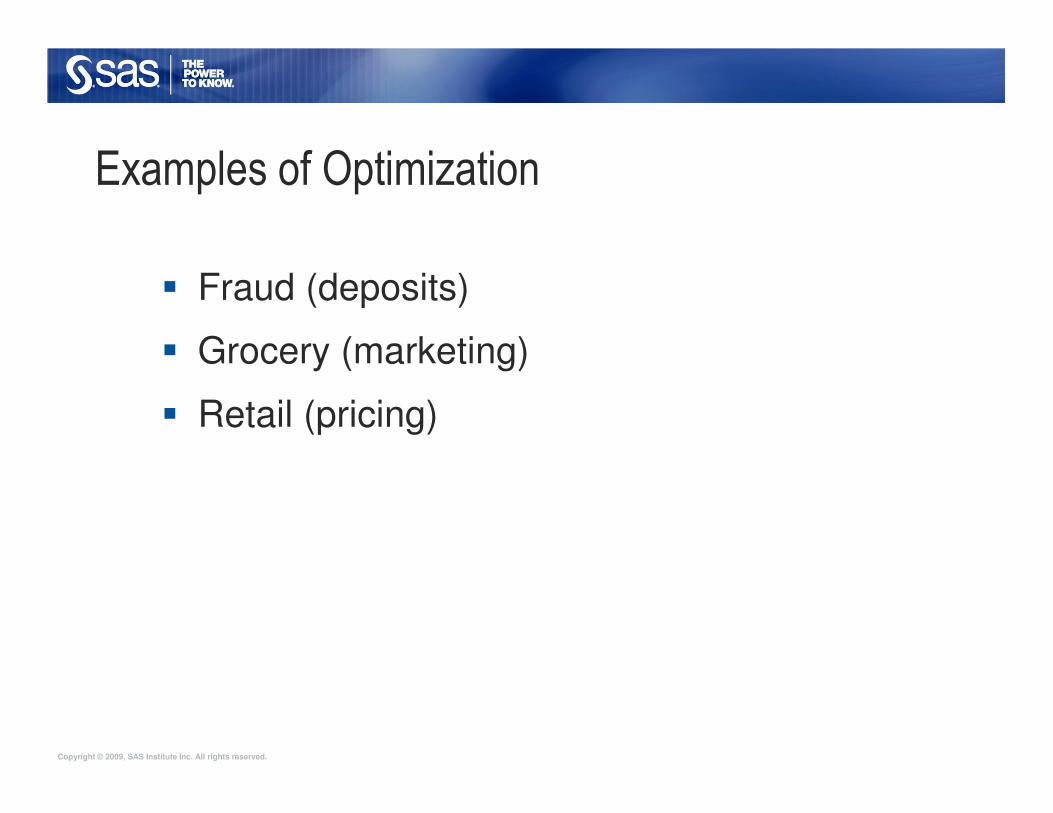
Examples of Optimization
� Fraud (deposits)
� Grocery (marketing)
� Retail (pricing)
Copyright © 2009, SAS Institute Inc. All rights reserved.
Definitions: Business Analytics
� StatisticalAnalysis
� Forecasting
� Predictive Modeling
� Mining
Data Integration Business Intelligence Analytics
Copyright © 2009, SAS Institute Inc. All rights reserved.
Business Analytics
…is a Process…not a Project
Copyright © 2009, SAS Institute Inc. All rights reserved.
Q & A
Copyright © 2009, SAS Institute Inc. All rights reserved.
At A2009 (http://www.sas.com/events/aconf/2009/) Paul shared a story about laboratory experiments showing that rats outperform humans in interpreting data. The story is actually described in a book by Leonard Mlodinow(http://www.amazon.com/Drunkards-Walk-Randomness-Rules-Lives/dp/0375424040). The experiment consists of drawing green and red balls at random, with the probabilities rigged so that greens occur 75 percent of the time. The subject is asked to watch for a while and then predict whether the next ball will be green or red. The rats followed the optimal strategy of always predicting green. But the human subjects did not always predict green, they usually want to do better and predict when red will come up too, engaging in reasoning like “after three straight greens, we are due for a red.” As Mlodinowsays, “humans usually try to guess the pattern, and in the process we allow ourselves to be outperformed by a rat.”
Humans vs Rats – details of study