
Analysts' Conference Call on Annual Results 2019€¦ · 11 Analysts' Conference Call on Annual...
41
Beyond risk sharing – we team up to create opportunities Analysts' Conference Call on Annual Results 2019 Hannover, 11 March 2020
Transcript of Analysts' Conference Call on Annual Results 2019€¦ · 11 Analysts' Conference Call on Annual...

Beyond risk sharing –
we team up
to create opportunities
Analysts' Conference Call on Annual Results 2019
Hannover, 11 March 2020

2 Analysts' Conference Call on Annual Results 2019
32Appendix 8
28Outlook 20207
26Target Matrix6
21Solvency II reporting as at 31 December 20195
18Investments4
15Life & Health reinsurance3
10Property & Casualty reinsurance2
2Group overview1
Agenda
3 Analysts' Conference Call on Annual Results 2019
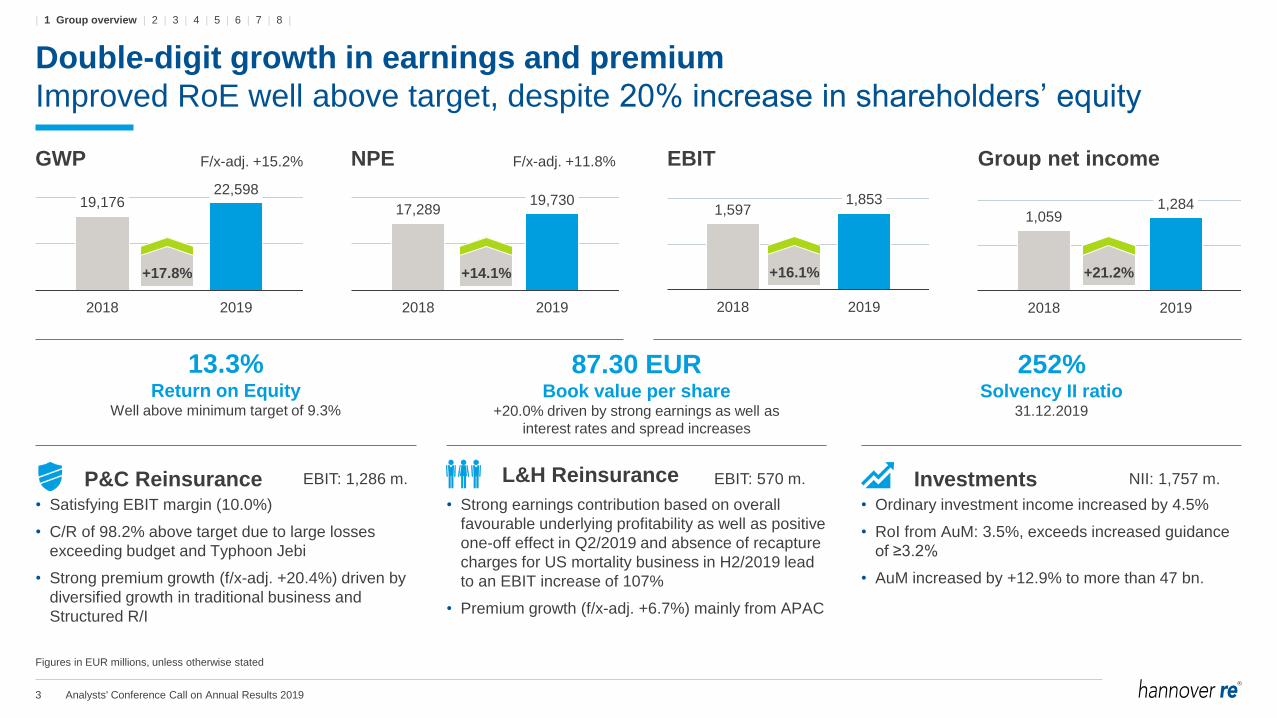
Double-digit growth in earnings and premium
Improved RoE well above target, despite 20% increase in shareholders’ equity
Figures in EUR millions, unless otherwise stated
GWP NPE EBIT Group net income F/x-adj. +15.2% F/x-adj. +11.8%
• Satisfying EBIT margin (10.0%)
• C/R of 98.2% above target due to large losses
exceeding budget and Typhoon Jebi
• Strong premium growth (f/x-adj. +20.4%) driven by
diversified growth in traditional business and
Structured R/I
• Strong earnings contribution based on overall
favourable underlying profitability as well as positive
one-off effect in Q2/2019 and absence of recapture
charges for US mortality business in H2/2019 lead
to an EBIT increase of 107%
• Premium growth (f/x-adj. +6.7%) mainly from APAC
• Ordinary investment income increased by 4.5%
• RoI from AuM: 3.5%, exceeds increased guidance
of ≥3.2%
• AuM increased by +12.9% to more than 47 bn.
P&C Reinsurance L&H Reinsurance Investments
13.3%Return on Equity
Well above minimum target of 9.3%
87.30 EURBook value per share
+20.0% driven by strong earnings as well as
interest rates and spread increases
252%Solvency II ratio
31.12.2019
NII: 1,757 m.EBIT: 570 m.EBIT: 1,286 m.
17,28919,730
2018 2019
1,5971,853
2018 2019
1,0591,284
2018 2019
19,17622,598
2018 2019
+17.8% +14.1% +16.1% +21.2%
| 1 Group overview | 2 | 3 | 4 | 5 | 6 | 7 | 8 |

4 Analysts' Conference Call on Annual Results 2019
6.21
5.02
7.04 7.438.17
9.54 9.71
7.958.79
10.65
2.30 2.10 2.60 3.00 3.00 3.25 3.50 3.50 3.75 4.000.40
1.251.50 1.50 1.50 1.50 1.50
37%
42%
37%
40%
37%34%
36%
44% 43% 38%
43%
40%
52%50% 51%
63%
60%
52%
2010 2011 2012 2013 2014 2015 2016 2017 2018 2019
Ordinary dividend per share Special dividend per share Payout ratio ordinary dividend per share Total payout ratio dividend per share
1)
5.00
Increased dividend reflects strong earnings power
Higher retention of profits enables us to fund future growth
Payout ratio ordinary dividend: 35 - 45%
Dividend per share in EUR
1) Dividend proposal; subject to consent of AGM
3.00
4.254.75 5.00 5.25
EPS
5.50
| 1 Group overview | 2 | 3 | 4 | 5 | 6 | 7 | 8 |

5 Analysts' Conference Call on Annual Results 2019
Strong operating cash flow fuels growth of AuM (+12.9%)
AuM growth supported by increase in valuation reserves and currency translation
39,347
41,79340,057
42,197
47,629
2015 2016 2017 2018 2019
Operating cash flow in m. EUR
689
284 389627 709
159
463519
390
821
952910 561
692
941
1,305
674
225
515
38
2015 2016 2017 2018 2019
Q1 Q2 Q3 Q4
3,105
2,331
1,694
2,225
2,509
Assets under own management (AuM) in m. EUR
| 1 Group overview | 2 | 3 | 4 | 5 | 6 | 7 | 8 |

6 Analysts' Conference Call on Annual Results 2019
Shareholders' equity up by 20.0%
Driven by net income and asset valuation
Policyholders' surplus in m. EUR
8,0688,997 8,528 8,777
10,528
709
743758 765
826
1,490
1,4911,492 1,493
2,234
2015 2016 2017 2018 2019
Shareholders' equity Non-controlling interests Hybrid
Change in shareholders' equity in m. EUR
10,26710,779
11,231 11,035
10,528
8,777
1,284
(633)
941 159
Shareholders'equity
31.12.2018
Netincome
Dividendpayment
Change inunrealised
gains/losses
Currencytranslationand other
Shareholders'equity
31.12.2019
13,589
| 1 Group overview | 2 | 3 | 4 | 5 | 6 | 7 | 8 |

7 Analysts' Conference Call on Annual Results 2019
Return on Equity significantly exceeds target
2019 is the 11th consecutive year with double-digit RoE
1) After tax; target: 900 bps above 5-year rolling average of 10-year German government bond rate ("risk free")
Return on Equity: yearly Return on Equity: average
14.7%13.7%
10.9%
12.2%13.3%
10.2% 9.9%
7,8108,533 8,763 8,653
9,652
2015 2016 2017 2018 2019
Actual Minimum target Average shareholders' equity
9.4%9.8%
9.3%
13.0%
14.1%13.5%
9.7%10.7%
11.4%
5-year Ø
2015 – 2019
10-year Ø
2010 – 2019
15-year Ø
2005 – 2019
4.5%3.8%
1.1%
Spread over minimum target
2.8%
1)
4.0%
| 1 Group overview | 2 | 3 | 4 | 5 | 6 | 7 | 8 |

8 Analysts' Conference Call on Annual Results 2019
Hannover Re is one of the most profitable reinsurers
No. 1 position in 2019 and on 5-year average RoE
List shows the Top 10 of the Global Reinsurance Index (GloRe)
Data based on company data, own calculation
2015 2016 2017 2018 2019
Company RoE Rank RoE Rank RoE Rank RoE Rank RoE Rank avg. RoE Rank
Hannover Re 14.7% 1 13.7% 1 10.9% 2 12.2% 1 13.3% 1 13.0% 1
Peer 3, US, Life & Health 7.6% 9 10.6% 4 21.9% 1 7.9% 3 8.7% 6 11.3% 2
Peer 6, Bermuda, Property & Casualty 13.0% 3 12.7% 2 5.7% 5 1.3% 9 11.9% 3 8.9% 3
Peer 9, China, Composite 12.2% 4 7.2% 9 7.2% 3 4.9% 5 not yet
reported- 7.9% 4
Peer 1, Germany, Composite 10.2% 6 8.3% 7 1.3% 7 8.5% 2 9.6% 5 7.6% 5
Peer 7, France, Composite 10.7% 5 9.3% 6 4.4% 6 5.4% 4 6.9% 7 7.3% 6
Peer 10, Korea, Composite 9.7% 7 7.8% 8 6.2% 4 4.7% 6 not yet
reported- 7.1% 7
Peer 8, Bermuda, Property & Casualty 9.5% 8 10.0% 5 -5.3% 10 4.2% 7 12.9% 2 6.3% 8
Peer 2, Switzerland, Composite 13.7% 2 10.6% 3 1.0% 9 1.4% 8 2.5% 8 5.8% 9
Peer 4, US, Property & Casualty 7.5% 10 5.9% 10 1.1% 8 0.5% 10 10.4% 4 5.1% 10
Average 10.9% 9.6% 5.4% 5.1% 9.5% 8.0%
2015 - 2019
| 1 Group overview | 2 | 3 | 4 | 5 | 6 | 7 | 8 |

9 Analysts' Conference Call on Annual Results 2019
Remarkable premium and earnings growth
Improved result from Life & Health and favourable investment income
Group figures in m. EUR Q4/2018 Q4/2019 Δ 2018 2019 Δ
Gross written premium 4,184 5,204 +24.4% 19,176 22,598 +17.8%
Net premium earned 4,515 5,338 +18.2% 17,289 19,730 +14.1%
Net underwriting result 52 (35) -166.7% (51) (216) -
- Incl. funds withheld 97 24 -75.6% 157 (10) -106.2%
Net investment income 375 425 +13.5% 1,530 1,757 +14.8%
- From assets under own mgmt. 330 366 +11.1% 1,322 1,551 +17.3%
- From funds withheld 45 59 +31.3% 208 206 -0.7%
Other income and expenses 12 68 - 118 312 +165.2%
Operating profit/loss (EBIT) 440 458 +4.2% 1,597 1,853 +16.1%
Financing costs (20) (23) +15.9% (78) (87) +11.3%
Net income before taxes 419 434 +3.6% 1,518 1,766 +16.3%
Taxes (63) (127) +102.8% (373) (393) +5.3%
Net income 357 307 -13.8% 1,146 1,373 +19.9%
- Non-controlling interests 23 26 +17.1% 86 89 +3.7%
Group net income 334 281 -15.9% 1,059 1,284 +21.2%
Retention 90.4% 88.5% 90.7% 90.0%
EBIT margin (EBIT/Net premium earned) 9.7% 8.6% 9.2% 9.4%
Tax ratio 14.9% 29.2% 24.6% 22.2%
Earnings per share (in EUR) 2.77 2.33 8.79 10.65
| 1 Group overview | 2 | 3 | 4 | 5 | 6 | 7 | 8 |

10 Analysts' Conference Call on Annual Results 2019
32Appendix 8
28Outlook 20207
26Target Matrix6
21Solvency II reporting as at 31 December 20195
18Investments4
15Life & Health reinsurance3
10Property & Casualty reinsurance2
2Group overview1
Agenda

11 Analysts' Conference Call on Annual Results 2019
Strong growth based on improving reinsurance market environment
Satisfactory results despite large losses exceeding budget
Property & Casualty R/I in m. EUR Q4/2018 Q4/2019 2018 2019
Gross written premium 2,318 3,128 11,976 14,781
Net premium earned 2,787 3,515 10,804 12,798
Net underwriting result
incl. funds withheld114 110 373 235
Combined ratio
incl. interest on funds withheld95.9% 96.9% 96.5% 98.2%
Net investment income from assets
under own management242 254 999 1,022
Other income and expenses (37) 3 (50) 29
Operating profit/loss (EBIT) 319 367 1,323 1,286
Tax ratio 12.6% 29.9% 23.4% 25.4%
Group net income 257 232 929 872
Earnings per share (in EUR) 2.13 1.92 7.70 7.23
YTD
• GWP f/x-adjusted +20.4%, growth from traditional reinsurance
(+21.6%) as well as Structured R/I (+15.7%)
• NPE f/x-adjusted +15.8%
• Major losses of EUR 956 m. (7.5% of NPE) above budget of
EUR 875 m.
• Negative development of typhoon Jebi impacted the combined ratio by
approx. EUR 80 m.
• Positive overall run-off result and (unchanged) conservative initial
reserving
• US casualty development and decision on Ogden rate change lead to
reduction in reserve redundancies
• Net investment income increased mainly driven by strong ordinary
investment income
• Other income and expenses benefitted from disposal of participation in
Q3/2019
• EBIT margin of 10.0% exactly in line with target
• Tax ratio at normalised level
| 1 | 2 Property & Casualty reinsurance | 3 | 4 | 5 | 6 | 7 | 8 |

12 Analysts' Conference Call on Annual Results 2019
High large loss experience leads to a Combined Ratio above target
1) All lines of Property & Casualty reinsurance except those stated separately
EBIT marginQ1-4/2019: Combined Ratio vs. Target Combined Ratio
6.9%
4.8%
18.7%
6.6%
14.6%
11.4%
3.5%
13.3%
38.7%
9.9%
10.0%
Target Combined RatioCombined Ratio
1)
1)
1)
1)
98.2%
105.0%
75.0%
93.8%
97.1%
98.3%
96.4%
97.2%
104.3%
88.8%
101.8%
105.8%
0% 20% 40% 60% 80% 100% 120%
Total
Catastrophe XL (Cat XL)
Aviation and Marine
Credit, Surety and Political Risks
Facultative Reinsurance and Direct Business
Structured Reinsurance and ILS
Asia, Australia and the Middle East
Continental Europe and Africa
UK, Ireland and London market
Germany, Switzerland, Austria and Italy
Latin America, Iberian Peninsula and Agricultural Risks
North America
1)
1)
13.1%
Regio
nal m
ark
ets
Glo
bal m
ark
ets
| 1 | 2 Property & Casualty reinsurance | 3 | 4 | 5 | 6 | 7 | 8 |

13 Analysts' Conference Call on Annual Results 2019
291
863
1,730
662724
559
714
846
1,7901,722
1,497
240
662
981
478
578
426573 627
1,127
850
956
2009 2010 2011 2012 2013 2014 2015 2016 2017 2018 2019
Gross
Net
Large loss budget (net)
Large losses exceed budget by EUR 81 million
Natural and man-made catastrophe losses1) in m. EUR
1) Up to 2011 claims over EUR 5 m. gross, from 2012 onwards claims over EUR 10 m. gross
Natural and man-made catastrophe losses in % of Property & Casualty premium
5% 5% 14% 12% 25% 16% 9% 7% 9% 8% 7% 6% 8% 7% 9% 8% 17% 12% 14% 8% 10% 7%
Large loss budget (net) in m. EUR
450 500 530 560 625 670 690 825 825 825 875
| 1 | 2 Property & Casualty reinsurance | 3 | 4 | 5 | 6 | 7 | 8 |

14 Analysts' Conference Call on Annual Results 2019
1) Natural catastrophes and other major losses in excess of EUR 10 m. gross
Large loss budget EUR 875 m. thereof EUR 175 m. Man-made and EUR 700 m. Nat Cat
Catastrophe losses1)
in m. EUR Date Gross Net
Flood, Australia 26 Jan - 7 Feb 37.1 27.5
Storm / flood, USA 12 - 13 Mar 20.2 17.6
Tornados, USA 25 - 29 May 40.8 38.7
Hailstorm "Jörn", Germany 10 Jun 23.9 14.9
Typhoon "Lekima", China 10 - 11 Aug 14.8 14.3
Hurricane "Dorian", Bahamas, USA 1 Sep 221.2 194.7
Typhoon "Faxai", Japan 8 Sep 187.8 83.8
Typhoon "Hagibis", Japan 12 - 13 Oct 447.1 183.8
Earthquake, Albania 26 Nov 15.3 14.9
Bushfire, Australia 1 - 31 Dec 54.9 46.3
10 Natural catastrophes 1,062.9 636.5
2 Marine claims 24.8 15.1
2 Aviation claims 127.9 33.2
6 Property claims 184.6 174.2
2 Credit claims 97.1 97.1
12 Man-made losses 434.4 319.6
22 Major losses 1,497.3 956.1
Large losses above budget due to frequency of man-made losses
Large losses from natural catastrophes in line with expectations
| 1 | 2 Property & Casualty reinsurance | 3 | 4 | 5 | 6 | 7 | 8 |

15 Analysts' Conference Call on Annual Results 2019
32Appendix 8
28Outlook 20207
26Target Matrix6
21Solvency II reporting as at 31 December 20195
18Investments4
15Life & Health reinsurance3
10Property & Casualty reinsurance2
2Group overview1
Agenda

16 Analysts' Conference Call on Annual Results 2019
Strong earnings contribution from Life & Health reinsurance
US mortality performance better than expected
Life & Health R/I in m. EUR Q4/2018 Q4/2019 2018 2019
Gross written premium 1,865 2,076 7,200 7,816
Net premium earned 1,728 1,823 6,485 6,932
Net underwriting result
incl. funds withheld(16) (86) (216) (245)
Net investment income from assets
under own management87 112 320 526
Other income and expenses 50 67 172 289
Operating profit/loss (EBIT) 121 92 276 570
EBIT margin 7.0% 5.1% 4.3% 8.2%
Tax ratio 22.6% 23.6% 32.0% 16.4%
Group net income 93 69 186 472
Earnings per share (in EUR) 0.77 0.57 1.54 3.91
YTD
• GWP f/x-adjusted +6.7%, mainly from APAC and UK Longevity
• NPE f/x-adjusted growth +5.1%
• US mortality improved significantly due to in-force management actions.
Technical result negatively impacted by Australian disability and UK
mortality in 1H/2019
• Extraordinary gain from restructuring of a participation in Q2/2019
(EUR 99.5 m.). Favourable ordinary investment income and change in
fair value of financial instruments
• Other income and expenses mainly the result of strong contribution from
deposit accounted treaties in Financial Solutions in the amount of EUR
287 m. (2018: EUR 198 m.)
• EBIT materially exceeds prior year
• Low tax ratio due to tax-reduced investment gains
| 1 | 2 | 3 Life & Health reinsurance | 4 | 5 | 6 | 7 | 8 |

17 Analysts' Conference Call on Annual Results 2019
309
448
543
893
364
290
663
2013 2014 2015 2016 2017 2018 2019
Value of New Business well above target
Driven by Financial Solutions and Longevity business
Value of New Business development in m. EUR
1) Based on MCEV principles and post-tax reporting (in 2015 cost of capital already increased from 4.5% to 6% in line with Solvency II)
2) Based on Solvency II principles and pre-tax reporting
Target
≥ EUR 220 m.
1) 1) 1) 2) 2) 2) 2)
| 1 | 2 | 3 Life & Health reinsurance | 4 | 5 | 6 | 7 | 8 |

18 Analysts' Conference Call on Annual Results 2019
32Appendix 8
28Outlook 20207
26Target Matrix6
21Solvency II reporting as at 31 December 20195
18Investments4
15Life & Health reinsurance3
10Property & Casualty reinsurance2
2Group overview1
Agenda

19 Analysts' Conference Call on Annual Results 2019
Very pleasing outperformance of RoI target
Realisations driven by successful real estate transactions and one-off in L&H
1) Incl. results from associated companies
in m. EUR Q4/2018 Q4/2019 2018 2019 RoI
Ordinary investment income1) 333 356 1,327 1,407 3.1%
Realised gains/losses 27 74 128 274 0.6%
Impairments/appreciations &
depreciations(12) (28) (49) (81) -0.2%
Change in fair value of financial
instruments (through P&L)11 -4 31 73 0.2%
Investment expenses (29) (33) (114) (122) -0.3%
NII from assets under own mgmt. 330 366 1,322 1,551 3.5%
NII from funds withheld 45 59 208 206
Total net investment income 375 425 1,530 1,757
31 Dec 18 31 Dec 19
On-balance sheet 500 1,789
thereof Fixed income AFS 91 1,356
Off-balance sheet 498 524
thereof Fixed income HTM, L&R 227 233
Total 998 2,314
Unrealised gains/losses of investments
YTD
• Rise in ordinary income from fixed-income securities and real estate as
well as strong results from private equity investments
• Realised gains driven by restructuring of participation in L&H and
disposals of two real estate objects as well as positive effects from fixed
income portfolios
• Positive development of fair value changes through P&L predominantly
due to reinsurance embedded derivatives
• Significant rise in valuation reserves due to lower EUR, USD and GBP
yields as well as lower credit spreads on corporates
| 1 | 2 | 3 | 4 Investments | 5 | 6 | 7 | 8 |
20 Analysts' Conference Call on Annual Results 2019
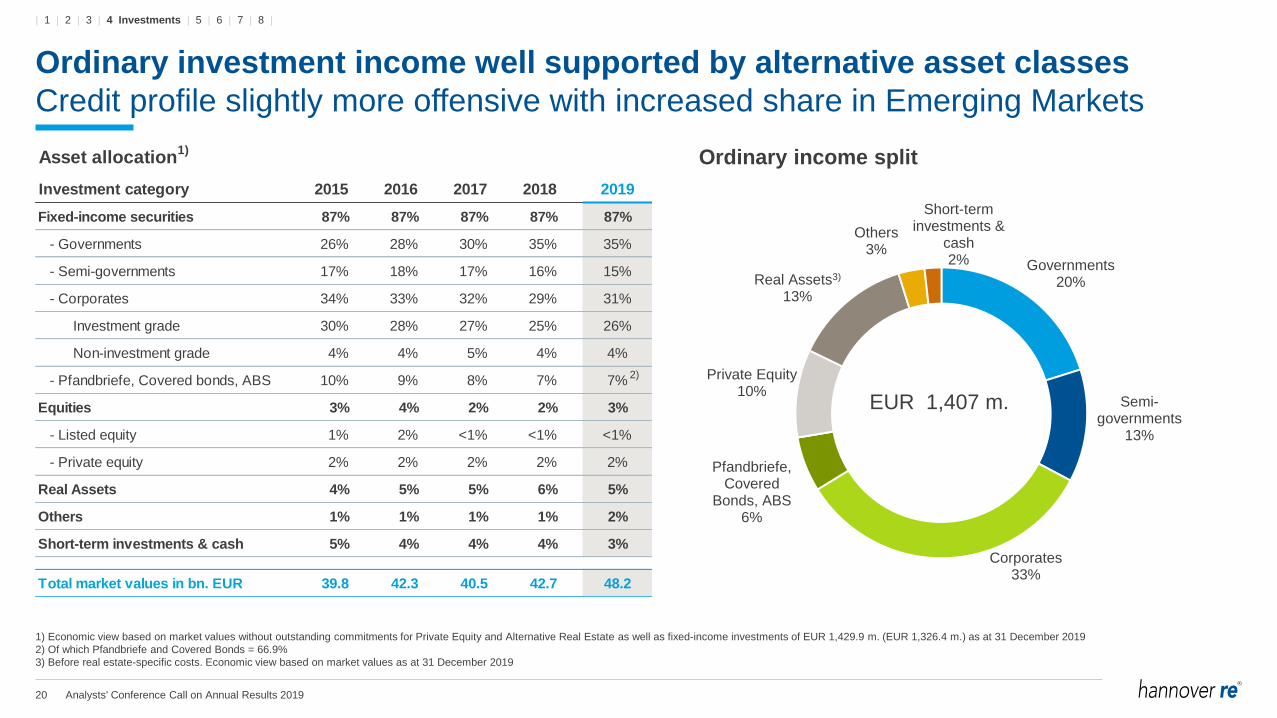
Governments20%
Semi-governments
13%
Corporates33%
Pfandbriefe, Covered
Bonds, ABS6%
Private Equity10%
Real Assets3)
13%
Others3%
Short-term investments &
cash2%
EUR 1,407 m.
Ordinary investment income well supported by alternative asset classes
Credit profile slightly more offensive with increased share in Emerging Markets
1) Economic view based on market values without outstanding commitments for Private Equity and Alternative Real Estate as well as fixed-income investments of EUR 1,429.9 m. (EUR 1,326.4 m.) as at 31 December 2019
2) Of which Pfandbriefe and Covered Bonds = 66.9%
3) Before real estate-specific costs. Economic view based on market values as at 31 December 2019
Ordinary income splitAsset allocation1)
Investment category 2015 2016 2017 2018 2019
Fixed-income securities 87% 87% 87% 87% 87%
- Governments 26% 28% 30% 35% 35%
- Semi-governments 17% 18% 17% 16% 15%
- Corporates 34% 33% 32% 29% 31%
Investment grade 30% 28% 27% 25% 26%
Non-investment grade 4% 4% 5% 4% 4%
- Pfandbriefe, Covered bonds, ABS 10% 9% 8% 7% 7%
Equities 3% 4% 2% 2% 3%
- Listed equity 1% 2% <1% <1% <1%
- Private equity 2% 2% 2% 2% 2%
Real Assets 4% 5% 5% 6% 5%
Others 1% 1% 1% 1% 2%
Short-term investments & cash 5% 4% 4% 4% 3%
Total market values in bn. EUR 39.8 42.3 40.5 42.7 48.2
2)
| 1 | 2 | 3 | 4 Investments | 5 | 6 | 7 | 8 |

21 Analysts' Conference Call on Annual Results 2019
32Appendix 8
28Outlook 20207
26Target Matrix6
21Solvency II reporting as at 31 December 20195
18Investments4
15Life & Health reinsurance3
10Property & Casualty reinsurance2
2Group overview1
Agenda

22 Analysts' Conference Call on Annual Results 2019
Group capital position remains comfortable
Growth in own funds exceeds SCR growth, driven also by hybrid bond issuance in Q4
1) Small deviations compared to annual report 2018 since the amounts are based on final Solvency II year-end reporting as presented in the Solvency and Financial Condition Report (SFCR).
2) Full internal model incl. the application of the dynamic volatility adjustment (subject to regulatory approval), own funds based on the Solvency II reporting as of 31 December 2019, audit opinions not issued yet
3) Including haircut (EUR 636 m.) for minority interests (mostly E+S Rückversicherung AG)
in m. EUR
Solvency II1)
31.12.2018
Solvency II2)
31.12.2019
Internal Metrics31.12.2019
Available Economic Capital /
Eligible Own Funds3) 12,635 14,399 15,035
Solvency Capital Requirements (SCR) 5,135 5,719 5,719
Excess Capital 7,499 8,680 9,316
Capital Adequacy Ratio 246% 252% 263%
Minimum Target Ratio (Limit / Threshold) 180% / 200%
| 1 | 2 | 3 | 4 | 5 Solvency II reporting as at 31 December 2019 | 6 | 7 | 8 |

23 Analysts' Conference Call on Annual Results 2019
7,917
5,719
14,399
4,432
2,736
4,163
423
533
4,370
2,198
Property & Casualty
Life & Health
Market
Counterparty default
Operational
Required capital before tax
Deferred taxes
Required capital after tax
Eligible own funds
Efficient capital deployment supported by significant diversification
Eligible own funds at record high
Solvency Capital Requirements in m. EUR
As at 31 December 2019
Solvency capital requirements based on the full internal model incl. the application of the dynamic volatility adjustment (subject to regulatory approval).
The capital allocation is based on TVaR which takes dependencies between risk categories into account.
37% 16% 43% 2% 3%
36% diversification
12,287
| 1 | 2 | 3 | 4 | 5 Solvency II reporting as at 31 December 2019 | 6 | 7 | 8 |

24 Analysts' Conference Call on Annual Results 2019
230%
260%246% 252%
Threshold
200%
Limit 180%
Improving capital adequacy ratio
Strong growth supported by excellent operating earnings
Development of the (regulatory) capital adequacy ratio
12,835 12,296 12,635
14,399
5,5864,729 5,135 5,719
Q4/2016 Q4/2017 Q4/2018 Q4/2019
Eligible Capital Solvency Capital Requirements (SCR)
• 2018: Decrease in solvency ratio mainly due to higher
capital requirements as a result of growing business and
widening of credit spreads, with offsetting effects from
first-time application of volatility adjustment in Q4/2018.
• 2019: Increase in solvency ratio due to the additional
hybrid bond issued in 2019. The increase in capital
requirements is a result of increasing business volumes,
partly offset by first-time application of the dynamic
volatility adjustment in Q4/2019.
1) Solvency Capital Requirements Q4/2019 include the application of the dynamic volatility adjustment (subject to regulatory approval).
1)
| 1 | 2 | 3 | 4 | 5 Solvency II reporting as at 31 December 2019 | 6 | 7 | 8 |

25 Analysts' Conference Call on Annual Results 2019
83%
11,354584
2,980 1,520
13,399 707636
547
0.3%
1,797
4%
12%
1,01714,399
Shareholders'equity incl.
minorities (IFRS)
Adjustments forassets under
ownmanagement
Adjustments fortechnicalprovisions
Adjustmentsdue to tax effects
and others
Excess of assetsover liabilities
Foreseeabledividends
Minorityhaircut
Hybridcapital
Basic own fundsafter deductions1)
High-quality capital base with 87% Tier 1
Unutilized Tier 2 provides additional flexibility
Reconciliation of IFRS Shareholders’ equity vs. Solvency II own funds in m. EUR
Unutilised Tier 2
capacity
Tier 3
capital
Tier 2
capital
Tier 1
hybrid capital
Tier 1
unrestricted capital
As at 31 December 2019, the related audits are at present not fully completed
1) Foreseeable dividends and distributions refer to Hannover Rück SE dividend including non-controlling interests
2) Net deferred tax assets
2)
| 1 | 2 | 3 | 4 | 5 Solvency II reporting as at 31 December 2019 | 6 | 7 | 8 |

26 Analysts' Conference Call on Annual Results 2019
32Appendix 8
28Outlook 20207
26Target Matrix6
21Solvency II reporting as at 31 December 20195
18Investments4
15Life & Health reinsurance3
10Property & Casualty reinsurance2
2Group overview1
Agenda
27 Analysts' Conference Call on Annual Results 2019
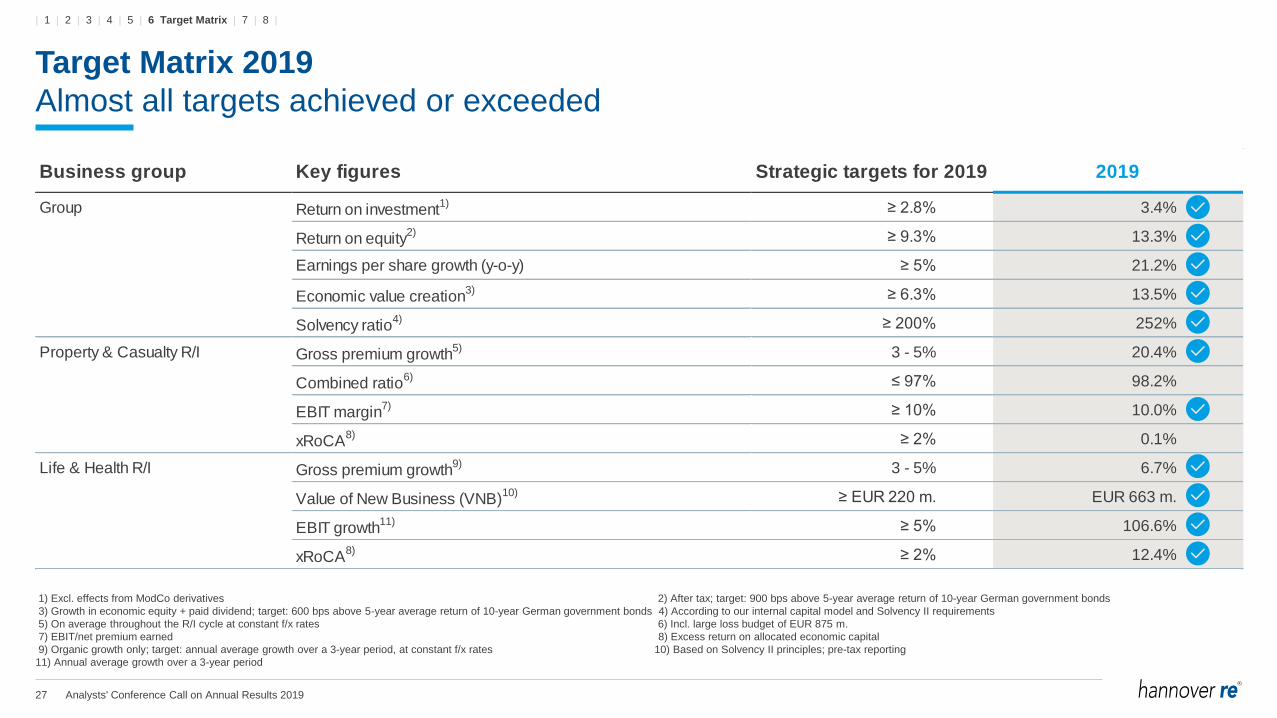
Target Matrix 2019
Almost all targets achieved or exceeded
1) Excl. effects from ModCo derivatives 2) After tax; target: 900 bps above 5-year average return of 10-year German government bonds
3) Growth in economic equity + paid dividend; target: 600 bps above 5-year average return of 10-year German government bonds 4) According to our internal capital model and Solvency II requirements
5) On average throughout the R/I cycle at constant f/x rates 6) Incl. large loss budget of EUR 875 m.
7) EBIT/net premium earned 8) Excess return on allocated economic capital
9) Organic growth only; target: annual average growth over a 3-year period, at constant f/x rates 10) Based on Solvency II principles; pre-tax reporting
11) Annual average growth over a 3-year period
Business group Key figures Strategic targets for 2019 2019
Group Return on investment1) ≥ 2.8% 3.4%
Return on equity2) ≥ 9.3% 13.3%
Earnings per share growth (y-o-y) ≥ 5% 21.2%
Economic value creation3) ≥ 6.3% 13.5%
Solvency ratio4) ≥ 200% 252%
Property & Casualty R/I Gross premium growth5) 3 - 5% 20.4%
Combined ratio6) ≤ 97% 98.2%
EBIT margin7) ≥ 10% 10.0%
xRoCA8) ≥ 2% 0.1%
Life & Health R/I Gross premium growth9) 3 - 5% 6.7%
Value of New Business (VNB)10) ≥ EUR 220 m. EUR 663 m.
EBIT growth11) ≥ 5% 106.6%
xRoCA8) ≥ 2% 12.4%
| 1 | 2 | 3 | 4 | 5 | 6 Target Matrix | 7 | 8 |

28 Analysts' Conference Call on Annual Results 2019
32Appendix 8
28Outlook 20207
26Target Matrix6
21Solvency II reporting as at 31 December 20195
18Investments4
15Life & Health reinsurance3
10Property & Casualty reinsurance2
2Group overview1
Agenda
29 Analysts' Conference Call on Annual Results 2019
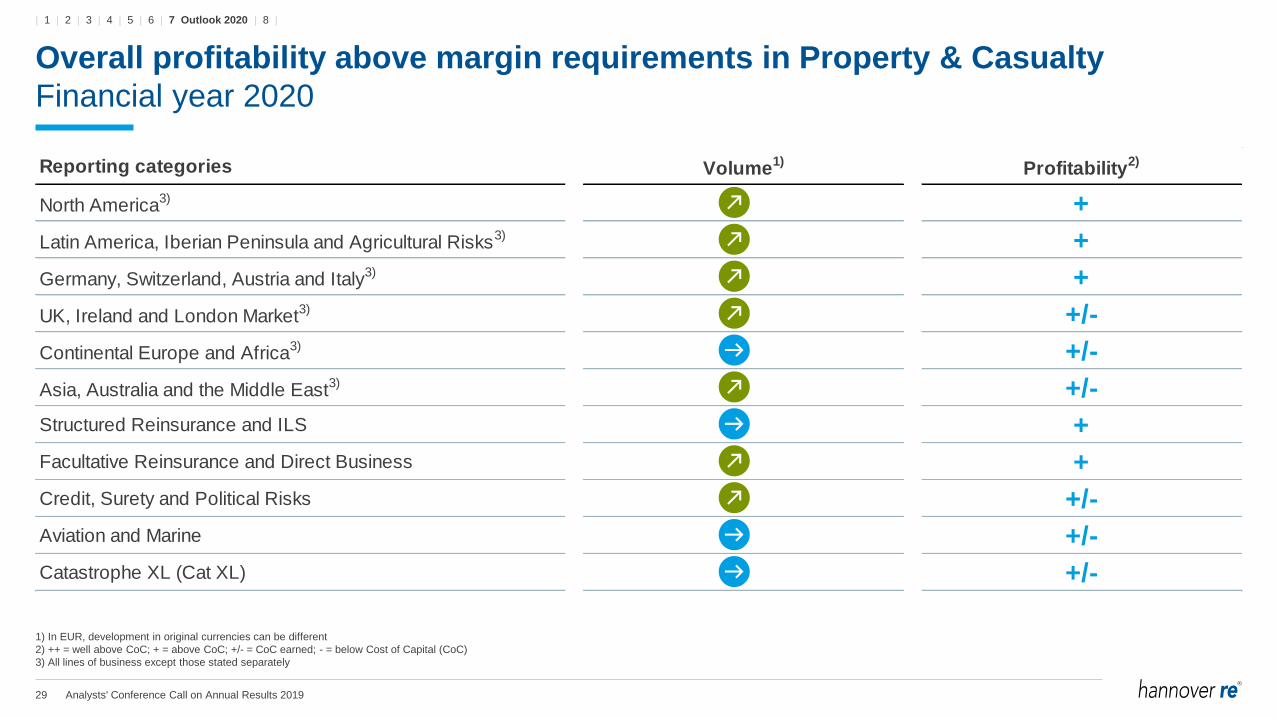
Reporting categories Volume1)
Profitability2)
North America3) +
Latin America, Iberian Peninsula and Agricultural Risks3) +
Germany, Switzerland, Austria and Italy3) +
UK, Ireland and London Market3) +/-
Continental Europe and Africa3) +/-
Asia, Australia and the Middle East3) +/-
Structured Reinsurance and ILS +
Facultative Reinsurance and Direct Business +
Credit, Surety and Political Risks +/-
Aviation and Marine +/-
Catastrophe XL (Cat XL) +/-
Overall profitability above margin requirements in Property & Casualty
Financial year 2020
1) In EUR, development in original currencies can be different
2) ++ = well above CoC; + = above CoC; +/- = CoC earned; - = below Cost of Capital (CoC)
3) All lines of business except those stated separately
| 1 | 2 | 3 | 4 | 5 | 6 | 7 Outlook 2020 | 8 |

30 Analysts' Conference Call on Annual Results 2019
Profitability at or above cost of capital in all reporting categories
Financial year 2020
1) In EUR, development in original currencies can be different
2) ++ = well above CoC; + = above CoC; +/- = CoC earned; - = below Cost of Capital (CoC)
Reporting categories Volume1)
Profitability2)
Financial solutions ++
Longevity +
Mortality +/-
Morbidity +/-
| 1 | 2 | 3 | 4 | 5 | 6 | 7 Outlook 2020 | 8 |

31 Analysts' Conference Call on Annual Results 2019
Guidance for 2020
Hannover Re Group
• Gross written premium1) ~ 5% growth
• Return on investment2) 3) ~ 2.7%
• Group net income2) ~ EUR 1.2 bn.
• Ordinary dividend payout ratio4) 35% - 45%
• Special dividend additional payout if profit target is reached and capitalisation remains comfortable
1) At unchanged f/x rates
2) Subject to no major distortions in capital markets and/or major losses in 2020 not exceeding the large loss budget of EUR 975 m.
3) Excluding effects from ModCo derivatives
4) Relative to group net income according to IFRS
| 1 | 2 | 3 | 4 | 5 | 6 | 7 Outlook 2020 | 8 |

32 Analysts' Conference Call on Annual Results 2019
32Appendix 8
28Outlook 20207
26Target Matrix6
21Solvency II reporting as at 31 December 20195
18Investments4
15Life & Health reinsurance3
10Property & Casualty reinsurance2
2Group overview1
Agenda

33 Analysts' Conference Call on Annual Results 2019
Our business groups at a glance
2019 vs. 2018
in m. EUR 2018 2019 Δ 2018 2019 Δ 2018 2019 Δ
Gross written premium 11,976 14,781 +23.4% 7,200 7,816 +8.6% 19,176 22,598 +17.8%
Net premium earned 10,804 12,798 +18.5% 6,485 6,932 +6.9% 17,289 19,730 +14.1%
Net underwriting result 337 188 -44.3% (388) (404) +4.0% (51) (216) -
Net underwriting result incl. funds withheld 373 235 -36.9% (216) (245) +13.4% 157 (10) -106.2%
Net investment income 1,035 1,069 +3.3% 492 684 +39.2% 1,530 1,757 +14.8%
From assets under own management 999 1,022 +2.3% 320 526 +64.5% 1,322 1,551 +17.3%
From funds withheld 36 48 +33.1% 172 159 -7.8% 208 206 -0.7%
Other income and expenses (50) 29 -157.7% 172 289 +68.0% 118 312 +165.2%
Operating profit/loss (EBIT) 1,323 1,286 -2.8% 276 570 +106.6% 1,597 1,853 +16.1%
Financing costs 0 (2) - 0 (2) - (78) (87) +11.3%
Net income before taxes 1,323 1,283 -3.0% 276 568 +106.0% 1,518 1,766 +16.3%
Taxes (309) (326) +5.4% (88) (93) +5.8% (373) (393) +5.3%
Net income 1,014 958 -5.5% 188 475 +153.2% 1,146 1,373 +19.9%
Non-controlling interest 84 86 +1.8% 2 3 +104.4% 86 89 +3.7%
Group net income 929 872 -6.2% 186 472 +153.7% 1,059 1,284 +21.2%
Retention 90.7% 90.3% 90.7% 89.5% 90.7% 90.0%
Combined ratio (incl. interest on funds withheld) 96.5% 98.2% - - - -
EBIT margin (EBIT / Net premium earned) 12.2% 10.0% 4.3% 8.2% 9.2% 9.4%
Tax ratio 23.4% 25.4% 32.0% 16.4% 24.6% 22.2%
Earnings per share (in EUR) 7.70 7.23 1.54 3.91 8.79 10.65
Property & Casualty R/I Life & Health R/I Total
| 1 | 2 | 3 | 4 | 5 | 6 | 7 | 8 Appendix |

34 Analysts' Conference Call on Annual Results 2019
Our business groups at a glance
Q4/2019 vs. Q4/2018
in m. EUR Q4/2018 Q4/2019 Δ Q4/2018 Q4/2019 Δ Q4/2018 Q4/2019 Δ
Gross written premium 2,318 3,128 +34.9% 1,865 2,076 +11.3% 4,184 5,204 +24.4%
Net premium earned 2,787 3,515 +26.1% 1,728 1,823 +5.5% 4,515 5,338 +18.2%
Net underwriting result 104 96 -7.9% (52) (131) +152.5% 52 (35) -166.7%
Net underwriting result incl. funds withheld 114 110 -3.3% (16) (86) - 97 24 -75.6%
Net investment income 251 268 +6.6% 123 157 +27.7% 375 425 +13.5%
From assets under own management 242 254 +5.0% 87 112 +28.1% 330 366 +11.1%
From funds withheld 9 14 +48.8% 36 45 +26.7% 45 59 +31.3%
Other income and expenses (37) 3 -107.7% 50 67 +33.6% 12 68 -
Operating profit/loss (EBIT) 319 367 +15.0% 121 92 -23.5% 440 458 +4.2%
Financing costs 0 (1) - 0 0 - (20) (23) +15.9%
Net income before taxes 319 366 +14.8% 121 92 -23.9% 419 434 +3.6%
Taxes (40) (110) +172.8% (27) (22) -20.7% (63) (127) +102.8%
Net income 279 257 -8.0% 93 70 -24.8% 357 307 -13.8%
Non-controlling interest 22 25 +13.0% 0 1 - 23 26 +17.1%
Group net income 257 232 -9.8% 93 69 -26.0% 334 281 -15.9%
Retention 90.0% 88.5% 91.0% 88.5% 90.4% 88.5%
Combined ratio (incl. interest on funds withheld) 95.9% 96.9% - - - -
EBIT margin (EBIT / Net premium earned) 11.4% 10.4% 7.0% 5.1% 9.7% 8.6%
Tax ratio 12.6% 29.9% 22.6% 23.6% 14.9% 29.2%
Earnings per share (in EUR) 2.13 1.92 0.77 0.57 2.77 2.33
Property & Casualty R/I Life & Health R/I Total
| 1 | 2 | 3 | 4 | 5 | 6 | 7 | 8 Appendix |

35 Analysts' Conference Call on Annual Results 2019
Well balanced international portfolio growth
Gross written premium in m. EUR
2010 2011 2012 2013 2014 2015 2016 2017 2018 2019
Africa
Australia
Latin America
Asia
Other European countries
Germany
United Kingdom
North America
29.5%
13,774
12,09611,429
13,963 14,362
17,06917,791
16,354
19,176
22,5982.5%
5.5%
4.7%
16.8%
16.0%
6.6%
13.4%
34.5%21.3%
10.2%
16.0%
4.1%4.3%
8.4%6.2%
| 1 | 2 | 3 | 4 | 5 | 6 | 7 | 8 Appendix |

36 Analysts' Conference Call on Annual Results 2019
Property & Casualty reinsurance: diversified growth
5-year CAGR: +13.3%
2015 2016 2017 2018 2019
Catastrophe XL (Cat XL)
Aviation and Marine
Credit, Surety and Political Risks
Facultative R/I and DirectBusiness
Structured R/I and ILS
Asia, Australia and the MiddleEast
Continental Europe and Africa
UK, Ireland and London Market
Germany, Switzerland, Austriaand Italy
Latin America, Iberian Peninsulaand Agricultural Risks
North America
1)
11,976
1)
1)
10,711
9,2059,338
1)
1)
1)
GWP split by line of business in m. EUR Gross written premium split by regions
NorthAmerica
38%
Rest ofEurope
19%
Asia15%
UnitedKingdom
10%
Germany9%
Australia3%
LatinAmerica
4%
Africa2%
39%
20%
13%
9%
8%
5%4% 2%
20192018
1) Unless stated in a separate line
16%
8%
11%
7%
14%
6%
9%
11%
7%7%4%
18%
8%
11%
7%
4%
6%
10%
14%
9%
7% 6%
16%
6%
9%
7%
4%5%6%
8%
24%
8%
6%
16%
6%
8%
7%
4%
6%
11%
24%
7%
6%
4%
17%
5%
8%
5%
4%
6%
11%
25%
10%
5%4%
14,781
| 1 | 2 | 3 | 4 | 5 | 6 | 7 | 8 Appendix |

37 Analysts' Conference Call on Annual Results 2019
Life & Health reinsurance: worldwide portfolio
5-year CAGR: +3.9%
GWP split by reporting categories in m. EUR Gross written premium split by regions
2015 2016 2017 2018 2019
Morbidity
Mortality
Longevity
Financialsolutions
18%
46%
19%
16%
7,149
21%
13%
7,080
43%
23% 24%
45%
18%
13%
7,731
7,200
27%
42%
13%
18%
NorthAmerica
27%
UnitedKingdom
19%Asia21%
Rest ofEurope
11%
Australia10%
LatinAmerica
6%
Germany3%
Africa3%
28%
20%17%
12%
10%
5%3%
3%
20192018
7,816
29%
42%
13%
16%
| 1 | 2 | 3 | 4 | 5 | 6 | 7 | 8 Appendix |

38 Analysts' Conference Call on Annual Results 2019
Stress tests on assets under own management
Focus on credit and real assets risks
As at 31 December 2019
Portfolio Scenario
Change in market
value
in m. EUR
Change in OCI before
tax
in m. EUR
-10% -121 -121
-20% -241 -241
+50 bps -1,202 -1,141
+100 bps -2,337 -2,218
Credit spreads +50% -757 -749
Real Assets -10% -262 -105
Equity (listed and private equity)
Fixed-income securities
| 1 | 2 | 3 | 4 | 5 | 6 | 7 | 8 Appendix |

39 Analysts' Conference Call on Annual Results 2019
High-quality fixed income book well balanced
Geographical allocation mainly in accordance with our broad business diversification
IFRS figures as at 31 December 2019
GovernmentsSemi-
governmentsCorporates
Pfandbriefe,
Covered bonds,
ABS
Short-term
investments,
cash
Total
AAA 73% 53% 1% 58% - 44%
AA 13% 26% 12% 22% - 16%
A 8% 7% 28% 12% - 15%
BBB 4% 1% 48% 7% - 19%
<BBB 2% 13% 11% 1% - 7%
Total 100% 100% 100% 100% - 100%
Germany 21% 34% 4% 20% 19% 17%
UK 8% 3% 7% 10% 15% 7%
France 1% 2% 8% 6% 0% 4%
GIIPS 1% 1% 4% 5% 0% 2%
Rest of Europe 3% 13% 16% 23% 2% 10%
USA 47% 10% 33% 14% 14% 33%
Australia 3% 10% 7% 10% 9% 7%
Asia 11% 14% 7% 1% 28% 10%
Rest of World 5% 15% 14% 10% 13% 10%
Total 100% 100% 100% 100% 100% 100%
Total b/s values in m. EUR 16,743 7,007 14,162 3,152 1,559 42,624
| 1 | 2 | 3 | 4 | 5 | 6 | 7 | 8 Appendix |

40 Analysts' Conference Call on Annual Results 2019
Currency allocation matches liability profile of balance sheet
Duration-neutral strategy continued with slightly longer neutral point
Currency split of investments
EUR30%
USD44%
GBP8%
AUD6%
CAD3%
Others10%
7.3
5.62.9
Modified
duration of
portfolio
5.0
7.6
5.4
• Modified duration of fixed-income mainly congruent with
liabilities and currencies
• Increase of modified duration against 2018 mainly due to
decreased interest rates and credit spreads as well as due
to new hybrid bond and changed liability modelling
• GBP’s higher modified duration predominantly due to life
business; EUR driven by hybrid bond issuance
2019 5.7
2018 4.8
2017 4.8
2016 5.0
2015 4.4
Modified duration
| 1 | 2 | 3 | 4 | 5 | 6 | 7 | 8 Appendix |
41 Analysts' Conference Call on Annual Results 2019
This presentation does not address the investment objectives or financial situation of any particular person or legal entity.
Investors should seek independent professional advice and perform their own analysis regarding the appropriateness of
investing in any of our securities.
While Hannover Re has endeavoured to include in this presentation information it believes to be reliable, complete and up-to-
date, the company does not make any representation or warranty, express or implied, as to the accuracy, completeness or
updated status of such information.
Some of the statements in this presentation may be forward-looking statements or statements of future expectations based on
currently available information. Such statements naturally are subject to risks and uncertainties. Factors such as the
development of general economic conditions, future market conditions, unusual catastrophic loss events, changes in the capital
markets and other circumstances may cause the actual events or results to be materially different from those anticipated by
such statements.
This presentation serves information purposes only and does not constitute or form part of an offer or solicitation to acquire,
subscribe to or dispose of, any of the securities of Hannover Re.
© Hannover Rück SE. All rights reserved.
Hannover Re is the registered service mark of Hannover Rück SE.
Disclaimer
| 1 | 2 | 3 | 4 | 5 | 6 | 7 | 8 Appendix |


![Transcript of Analysts Call [Company Update]](https://static.fdocuments.net/doc/165x107/577c7b131a28abe0549728de/transcript-of-analysts-call-company-update.jpg)


![Presentation for Analysts' call [Company Update]](https://static.fdocuments.net/doc/165x107/577c876d1a28abe054c45dd6/presentation-for-analysts-call-company-update.jpg)


![Presentations for Analysts Call [Company Update]](https://static.fdocuments.net/doc/165x107/577c7c061a28abe05498fc7a/presentations-for-analysts-call-company-update.jpg)