Analyst Presentation 25Aug.ppt - Oil India · This presentation contains certain forward looking...
35
August 25, 2011
Transcript of Analyst Presentation 25Aug.ppt - Oil India · This presentation contains certain forward looking...
August 25, 2011

This presentation contains certain forward looking statements concerning OIL India’s future business
prospects and business profitability, which are subject to a number of risks and uncertainties and the
actual results could materially differ from those in such forward looking statements. The risks and
Disclaimer
actual results could materially differ from those in such forward looking statements. The risks and
uncertainties relating to these statements include, but not limited to, risks and uncertainties, regarding
fluctuations in earnings, our ability to manage growth, competition (both domestic and
international), economic growth in India, ability to attract and retain highly skilled professionals, time and
cost over runs on projects, our ability to manage our international operations, government policies and
actions with respect to investments, fiscal deficits, regulations, etc., interest and other fiscal costs
generally prevailing in the economy. The company does not undertake to make any announcement in case
any of these forward looking statements become materially incorrect in future or update any forward
looking statements made from time to time by or on behalf of the company.

An Overview

Oil India: Brief Overview
� Independent India’s first commercial oil discoveries, with the first made in 1953Rich Heritage
India’s premier Oil & Gas “Navratna” company engaged in the exploration, development, production and
transportation of crude oil and natural gas in India
� Presence across Oil & Gas Value Chain (E&P, Transportation and Downstream)
� Infrastructure to support growth
Integrated O&G
Player
Strong
� Domestic acreage: 127,260 square kilometers;
� International acreage: 38,605 square kilometersLarge Acreage
� Total 2P reserves of over 944 mmboe; with RR ratio of over 142% in FY11 Strong
Reserve Base
� Revenue: 9,549 Cr (FY11), 2,669 Cr. Q1(FY12)
� PAT : 2,888 Cr (FY11), 850 Q1(FY12)
� Market cap : 31,523 Cr1
Strong
Financials
Note:1. As of Aug 19, 2011
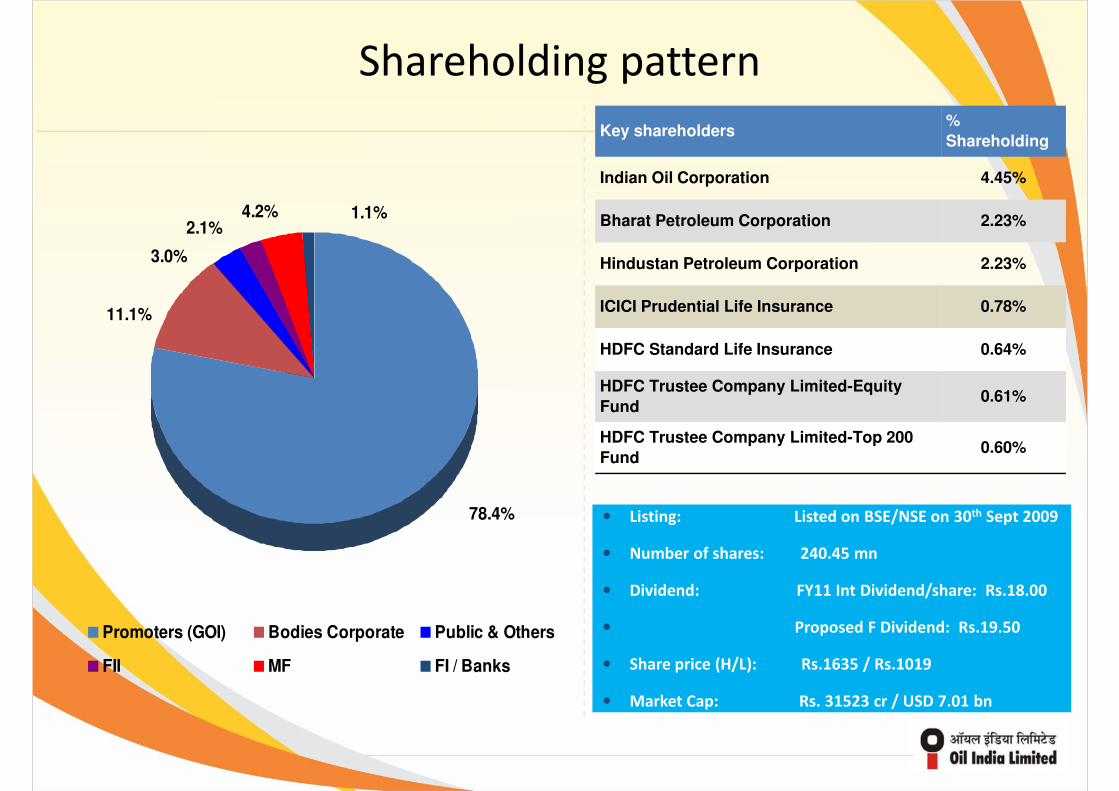
Shareholding pattern
4.2%2.1%
3.0%
1.1%
Key shareholders%
Shareholding
Indian Oil Corporation 4.45%
Bharat Petroleum Corporation 2.23%
Hindustan Petroleum Corporation 2.23%
78.4%
3.0%
11.1%
Hindustan Petroleum Corporation 2.23%
ICICI Prudential Life Insurance 0.78%
HDFC Standard Life Insurance 0.64%
HDFC Trustee Company Limited-Equity
Fund0.61%
HDFC Trustee Company Limited-Top 200
Fund0.60%
• Listing: Listed on BSE/NSE on 30th Sept 2009
Promoters (GOI) Bodies Corporate Public & Others
FII MF FI / Banks
• Number of shares: 240.45 mn
• Dividend: FY11 Int Dividend/share: Rs.18.00
• Proposed F Dividend: Rs.19.50
• Share price (H/L): Rs.1635 / Rs.1019
• Market Cap: Rs. 31523 cr / USD 7.01 bn

Performance of OIL India
1.4
1.5
1.6
0.9
1.0
1.1
1.2
1.3
0.8
0.9
S-0
9
N-0
9
J-1
0
M-1
0
M-1
0
J-1
0
S-1
0
N-1
0
J-1
1
M-1
1
M-1
1
J-1
1
OINL ONGC NIFTY SENSEX OIL & Gas Index
Our Vision
• Fastest growing Energy Company with highest profitability.
• Delight customers with quality products and services at competitive prices
"The fastest growing energy company with a global presence providing value to the
shareholder"
• Delight customers with quality products and services at competitive prices
• Learning Organization, nurturing initiatives, innovations and aspirations with best
practices
• Team, committed to honesty, integrity, transparency and mutual trust creating
employee pride
• Fully committed to safety, health and environment• Fully committed to safety, health and environment
• Responsible corporate citizen deeply committed to socio-economic development in
its areas of operations
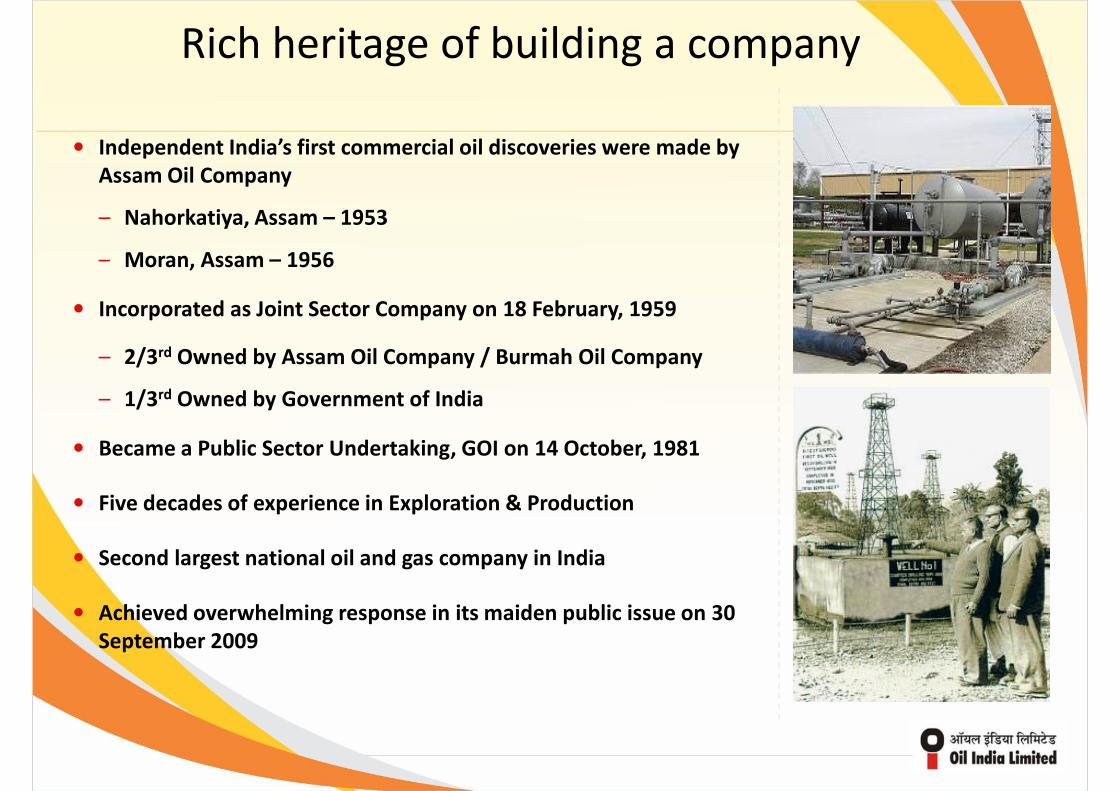
Rich heritage of building a company
• Independent India’s first commercial oil discoveries were made by
Assam Oil Company
– Nahorkatiya, Assam – 1953
– Moran, Assam – 1956 – Moran, Assam – 1956
• Incorporated as Joint Sector Company on 18 February, 1959
– 2/3rd Owned by Assam Oil Company / Burmah Oil Company
– 1/3rd Owned by Government of India
• Became a Public Sector Undertaking, GOI on 14 October, 1981
• Five decades of experience in Exploration & Production
• Second largest national oil and gas company in India
• Achieved overwhelming response in its maiden public issue on 30
September 2009

Integrated Oil & Gas Player
� Domestic: 30 E&P
blocks1
� Refining and marketing
petroleum products:
– 26% equity stake in
� 50 years of experience
� FY’ 11 Produced 25.71
mmbbl of Crude oil:
Exploration DownstreamProduction Transportation
� Crude Oil:
– 1,157 km pipeline ;
~6 MMT capacity� International: Egypt,
Gabon, Iran, Libya,
Nigeria, Timor Leste,
Venezuela and Yemen2
� Discoveries: 16 Small to
Medium3 size discoveries
during last three years
(FY’09 – FY’11)
– 26% equity stake in
NRL1
� Gas cracker project:
– 10% equity stake in
BCPL2
� City gas business –
– Signed MOU with
GAIL, HPCL, IOCL
and BPCL/ONGCL
mmbbl of Crude oil:
– 39 installations
– 1,544 km pipelines
� FY’ 11 Produced 2.35
bcm of Natural gas
– 26 installations
– 583 km pipelines
� Advanced Recovery
techniques to maximize
production
~6 MMT capacity
� Multi-Product:
– 660 km pipeline; 1.72
MMT capacity
� Overseas pipeline:
– 10% stake in 741 km
pipeline (Sudan)
� Natural Gas:
– 23% stake in 192 km
DNPL3 in NE
Note:
1. NRL – Numaligarh Refinery Limited
2. BCPL – Brahmaputra Cracker and Polymer Limited
3. DNPL – Duliajan-Numaligarh Pipeline Limited
Note:
1. 10 blocks have been awarded under NELP IX.
2. Participating interests in exploration and development blocks.
3. Small to Medium size discoveries: Estimated proved plus probable reserves size of less than 30 mn barrels of oil and oil equivalent gas
4. MMBOE – Million Barrels of Oil Equivalent
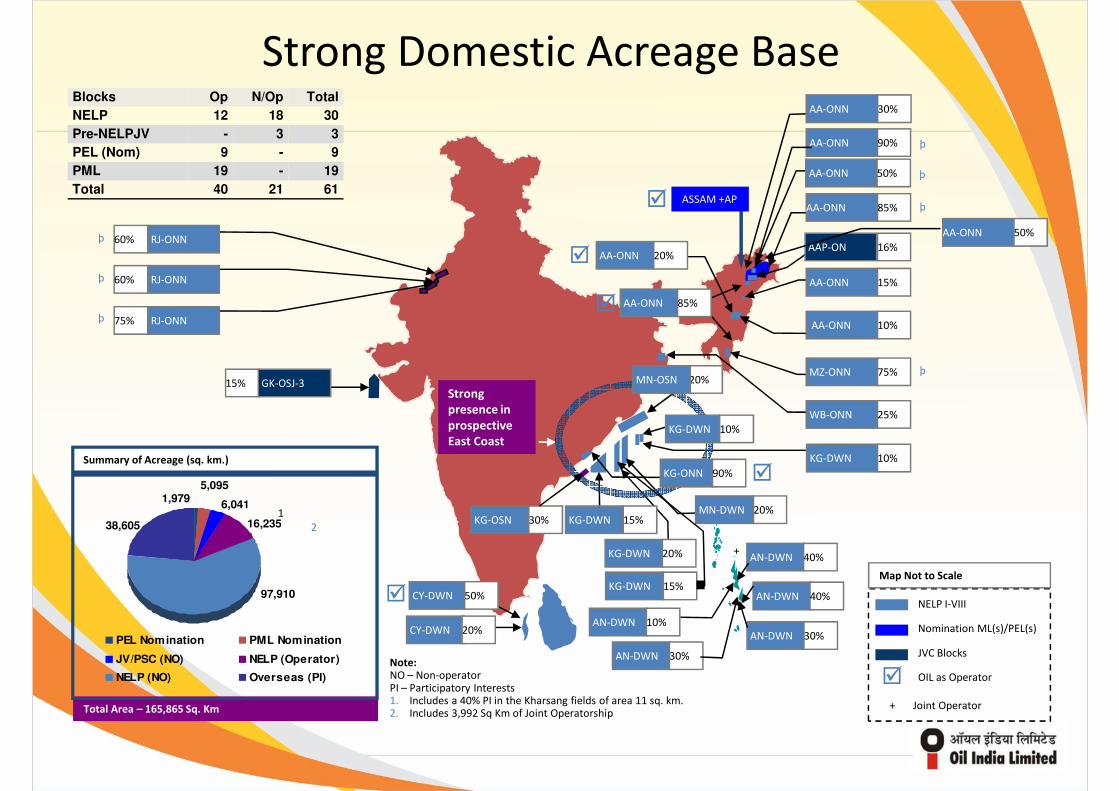
Strong Domestic Acreage BaseBlocks Op N/Op Total
NELP 12 18 30
Pre-NELPJV - 3 3
PEL (Nom) 9 - 9
PML 19 - 19
Total 40 21 61
RJ-ONN
AA-ONN
AA-ONN
AA-ONN
AAP-ONþ
þ
þ
AA-ONN
30%
90%
85%
16%60%
20%
ASSAM +AP
AA-ONN þ50%
AA-ONN 50%
�
�
KG-OSNMN-DWN
AA-ONN
AA-ONN
MZ-ONN
KG-DWN
þ
þ
þ
AA-ONN
WB-ONN
RJ-ONN
RJ-ONN
15%
10%
75%
25%
10%
75%
60%
30%20%
KG-DWN 10%
20%
85%
15%
KG-ONN 90%
GK-OSJ-3 MN-OSN
Summary of Acreage (sq. km.)
1
5,095
38,605
1,9796,041
16,235 KG-DWN 15%2
Strong
presence in
prospective
East Coast
�
�
�
Note:NO – Non-operatorPI – Participatory Interests1. Includes a 40% PI in the Kharsang fields of area 11 sq. km.2. Includes 3,992 Sq Km of Joint Operatorship
KG-DWN
AN-DWNCY-DWN
10%
20%
20%
Total Area – 165,865 Sq. Km
OIL as Operator
NELP I-VIII
Nomination ML(s)/PEL(s)
JVC Blocks
Map Not to Scale
38,605
97,910
16,235
PEL Nomination PML Nomination
JV/PSC (NO) NELP (Operator)
NELP (NO) Overseas (PI)
CY-DWN 50%KG-DWN 15%
AN-DWN 30%
AN-DWN 40%
AN-DWN 40%
AN-DWN 30%
+
+ Joint Operator
2
�
�
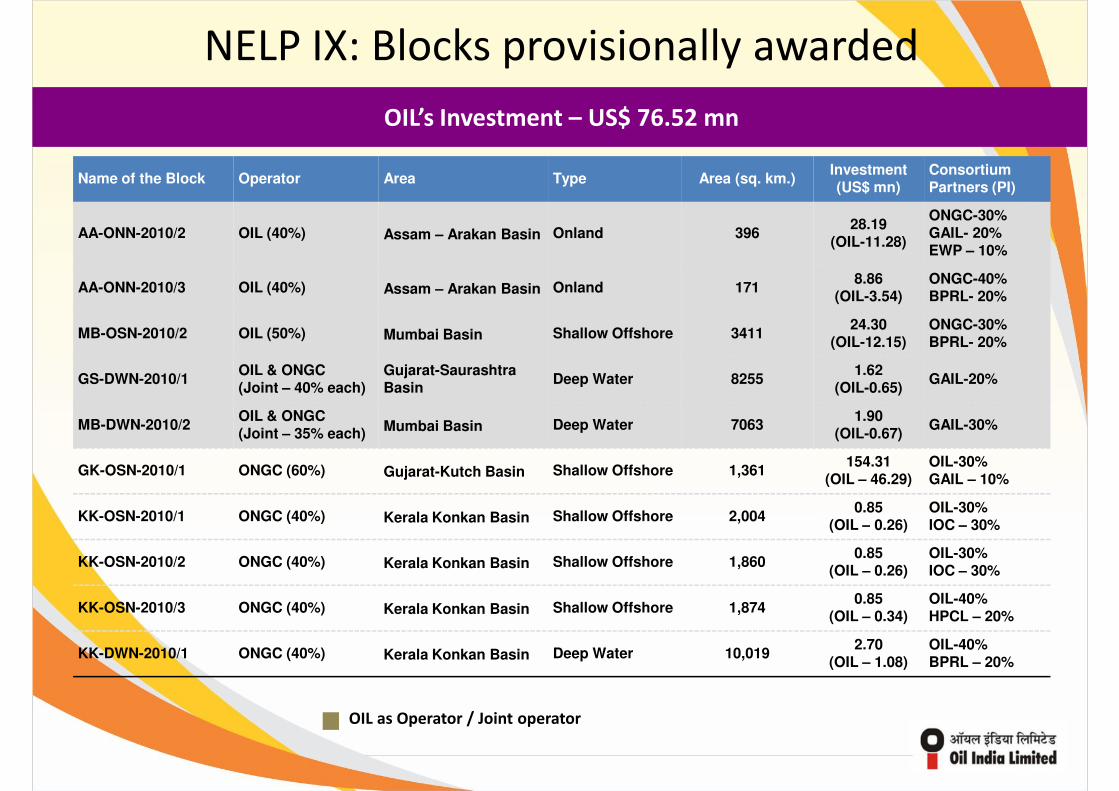
NELP IX: Blocks provisionally awarded
Name of the Block Operator Area Type Area (sq. km.)Investment (US$ mn)
Consortium Partners (PI)
AA-ONN-2010/2 OIL (40%) Assam – Arakan Basin Onland 39628.19
(OIL-11.28)
ONGC-30%GAIL- 20%EWP – 10%
OIL’s Investment – US$ 76.52 mn
AA-ONN-2010/3 OIL (40%) Assam – Arakan Basin Onland 1718.86
(OIL-3.54)ONGC-40%BPRL- 20%
MB-OSN-2010/2 OIL (50%) Mumbai Basin Shallow Offshore 341124.30
(OIL-12.15)ONGC-30%BPRL- 20%
GS-DWN-2010/1OIL & ONGC(Joint – 40% each)
Gujarat-Saurashtra Basin
Deep Water 82551.62
(OIL-0.65)GAIL-20%
MB-DWN-2010/2OIL & ONGC(Joint – 35% each)
Mumbai Basin Deep Water 70631.90
(OIL-0.67)GAIL-30%
GK-OSN-2010/1 ONGC (60%) Gujarat-Kutch Basin Shallow Offshore 1,361154.31
(OIL – 46.29)OIL-30%GAIL – 10%
KK-OSN-2010/1 ONGC (40%) Kerala Konkan Basin Shallow Offshore 2,0040.85
(OIL – 0.26)OIL-30%IOC – 30%(OIL – 0.26) IOC – 30%
KK-OSN-2010/2 ONGC (40%) Kerala Konkan Basin Shallow Offshore 1,8600.85
(OIL – 0.26)OIL-30%IOC – 30%
KK-OSN-2010/3 ONGC (40%) Kerala Konkan Basin Shallow Offshore 1,8740.85
(OIL – 0.34)OIL-40%HPCL – 20%
KK-DWN-2010/1 ONGC (40%) Kerala Konkan Basin Deep Water 10,0192.70
(OIL – 1.08)OIL-40%BPRL – 20%
OIL as Operator / Joint operator
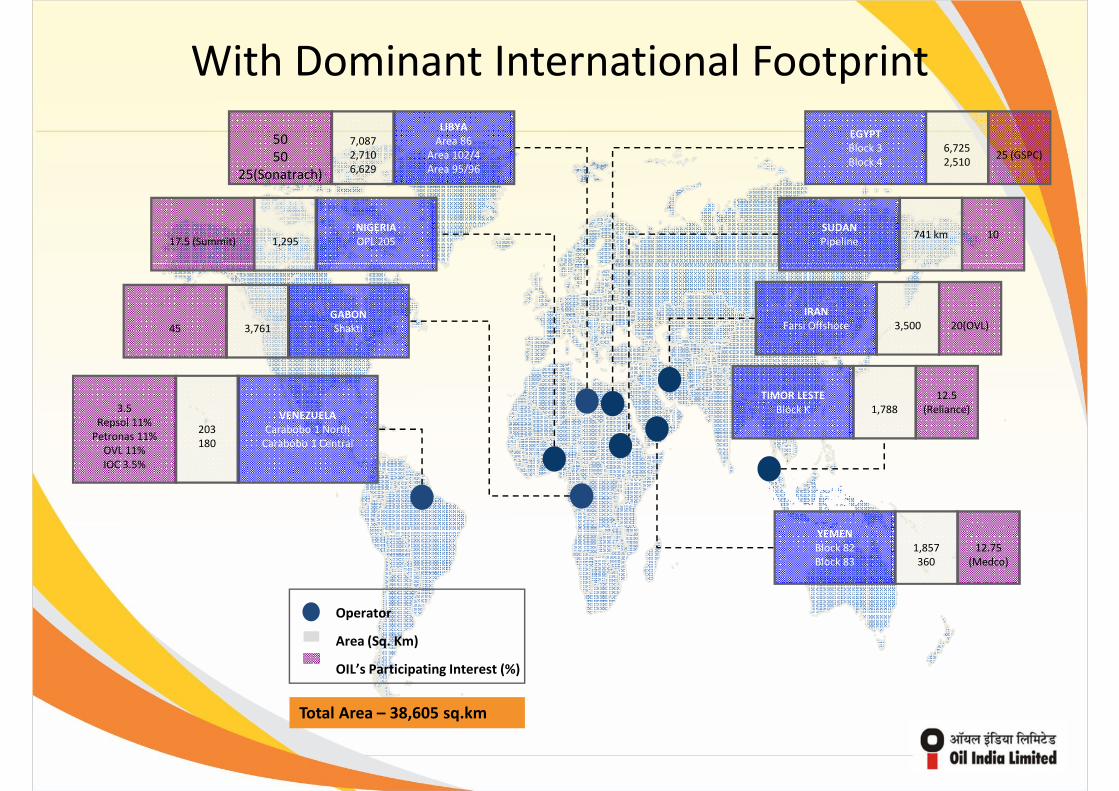
With Dominant International Footprint
6,725
2,51025 (GSPC)
EGYPT
Block 3
Block 4
7,087
2,710
6,629
50
50
25(Sonatrach)
LIBYA
Area 86
Area 102/4
Area 95/96
1,29517.5 (Summit)
NIGERIA
OPL 205741 km 10
SUDAN
Pipeline
3,500 20(OVL)
IRAN
Farsi Offshore3,76145
GABON
Shakti
203
180
3.5
Repsol 11%
Petronas 11%
OVL 11%
IOC 3.5%
VENEZUELA
Carabobo 1 North
Carabobo 1 Central
1,788
12.5
(Reliance)
TIMOR LESTE
Block K
YEMEN
Operator
Area (Sq. Km)
OIL’s Participating Interest (%)
Total Area – 38,605 sq.km
1,857
360
12.75
(Medco)
YEMEN
Block 82
Block 83
5051200
1400
1600
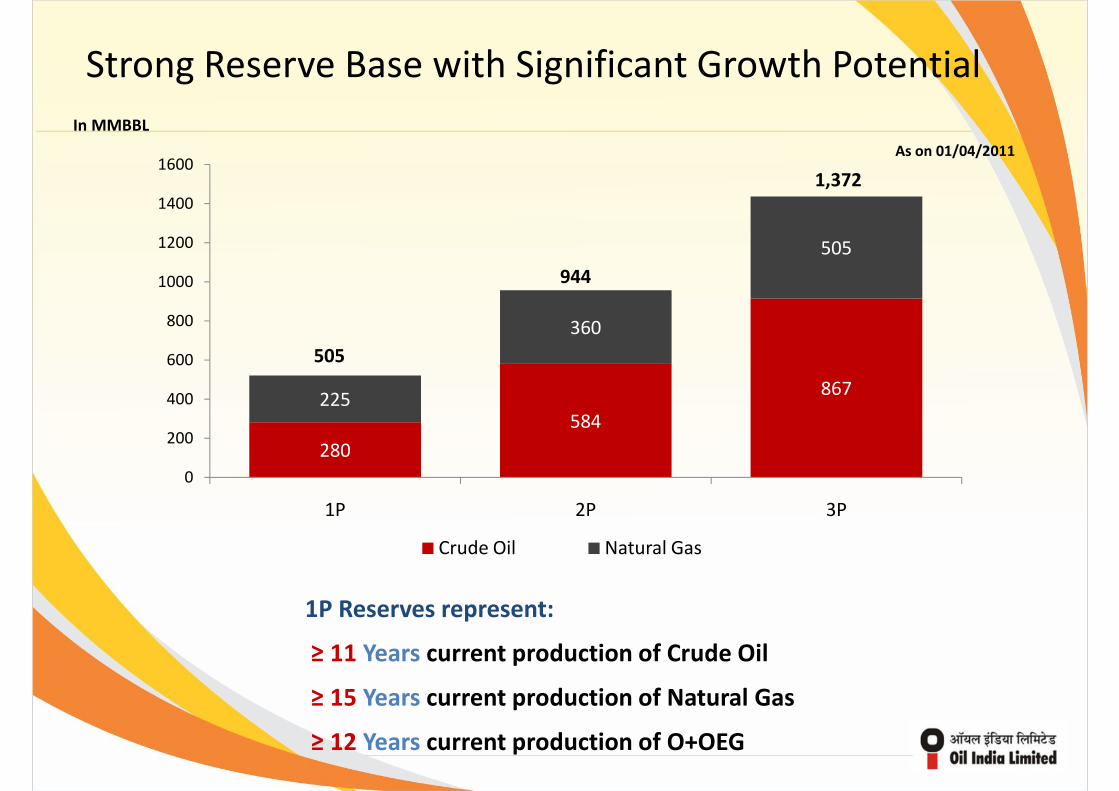
Strong Reserve Base with Significant Growth Potential
In MMBBL
As on 01/04/2011
944
1,372
280
584
867225
360
0
200
400
600
800
1000
1P 2P 3P
505
944
Crude Oil Natural Gas
1P Reserves represent:
≥ 11 Years current production of Crude Oil
≥ 15 Years current production of Natural Gas
≥ 12 Years current production of O+OEG

Healthy and Consistent Reserve Replacement Ratio
2.04 2.04 1.69 1.65
Reserve Replacement Ratio (x)
1.42
Crude Oil and Natural Gas (O+OEG) Production and Reserve Accretion (in MMTOE)
5.1 5.15.6 5.9 5.9
10.4 10.39.4 9.7
8.4
Crude Oil and Natural Gas (O+OEG) Production and Reserve Accretion (in MMTOE)
FY2007 FY2008 FY2009 FY2010 FY2011
Production (O + OEG) Accretion
Adequate reserve replenishment

Integrated In-house E&P Infrastructure To Support Growth
In house Expertise and Integration across Energy Infrastructure
Infrastructure to Support E&P Activities Production & Storage Facilities
Two 2D and One
3D Seismic Crew
Six Logging
Trucks
72 Production
Installations
14 W/over Rigs 11 Drilling Rigs
5,000 Km
O&G
Pipelines
~150k KL
Crude Storage

Strategy to Deliver Long Term Growth and Shareholder Value
Use Advanced Techniques to Improve
Existing Productivity
� Continue to induct world class
technology
1
Further Integrate Business
Portfolio and Diversify
across Geographies
Increase Reserves and
Production in Existing Acreage
� Accelerate exploration efforts
� Develop fields with potential
2
3Vertical Integration4
Explore Non-conventional
energy sources
� Explore alternate energy
opportunities in existing
acreage as well as inorganic
opportunities
5
Inorganic Growth
� Acquire blocks to augment
existing reserve base
� Acquisition of companies that
are value accretive
3Vertical Integration
� Diversify revenues through
downstream investments
� Improve profitability by
extending into higher margin
product value chain
� Providing Oilfield Services
4

Significant Investment Lined Up
M&AOverseas
Significant focus on Exploration and Development of existing acreage potential
2011-2012: 31,803 mn
M&A
1%
Domestic
Assets
9%
Overseas
Projects
11%
Development
27%Exploration &
Appraisal
52%

Planned Activities in FY12
3D Seismic Surveys Exploratory Drilling Development Drilling
Substantial Increase in 3D Surveys, Exploratory and Development Drilling Planned.
16
34
FY11 FY12
25
34
FY11 FY12
672
1,767
FY11 FY12 FY11 FY12 FY11 FY12FY11 FY12

Recent Developments

� Achieved the highest daily rate of crude oil production of 3.93 MTPA (> 27.96 mmbbls/Year)
� Achieved the highest daily rate of natural gas production of 6.67 MMSCMD in North East and
potential of 0.93 MMSCMD in Rajasthan
� Performance up to 31 March 2011:
Select Highlights
* A total loss of 0.127 MMT due to NRL shut-down. However, Highest ever quarterly production of 0.951 MMT achieved in Q2, 2010 .
** Low upliftment by customers of NE & Rajasthan,
� Hydrocarbon discoveries in Assam - 06 Nos. in FY’11
Parameter Unit 2009-10 2010-11
Crude Oil Production MMT 3.572 3.612*
Natural Gas Production BCM 2415 2349**
� Entry in Offshore as Operator and Deep Water Block as Joint Operator
� Entry in CBM Block (Assam)
� Examining Shale Gas potential of Assam-Arakan Basin
� OIL & GAIL( India) Ltd are jointly evaluating US shale gas assets buys

Select Highlights (Contd.)
• Successful commissioning of Duliajan-Numaligarh Pipeline (DNP) w.e.f 28-02-2011
• Completed Preliminary Activities in order to Develop CNG Network in Assam.
• MOUs with BPCL, IOCL & ONGCL executed for CGD. Submitted bids for two cities.
• Received Greentech HR Excellence Gold Award 2010.
• Received Golden Peacock Award & Greentech Gold Award for Environment Management.
• Received Environmental Excellence Award from Indian Chamber of Commerce
• "OIL's Assam Asset won OISD Award in the Oil & Gas Assets (onshore) for the year 2009-10
• Employees Relations Department Accredited with ISO Certification
• Identified Business opportunity in Bangladesh (Pipeline)• Identified Business opportunity in Bangladesh (Pipeline)
• HDD, Telecommunication work & AMC for IOCL’s Guwahati-Siliguri Pipeline
• Cathodic Protection work for DNPL Pipeline
• ODC Project for PDO, Oman
• Marketing of Telecommunication Services

Operating Performance

Crude Oil and Natural Gas Production
22.38
24.9525.7
25.712,341
2,2692,415
2,3490.93
Crude Oil Production (mm bbl) Natural Gas Production (mm scm)
22.38
5.686.81
553641
2007-08 2008-09 2009-10 2010-11 Q1 FY'11 Q1 FY'12 2007-08 2008-09 2009-10 2010-11 Q1 FY'11 Q1 FY'12
~20% increase over last year (QTQ) ~16% increase over last year (QTQ)

Production Cost
1.8 1.41.6
2.0
7.16.8
7.27.6
0.10.2
0.2 0.21.1
1.1
1.21.3
Crude Oil Production Cost (USD/ Barrel) Natural Gas Production Cost (USD/ MMBTU)
3.3
4.9 5.1 5.2 5.3
0.3
0.4 0.4 0.4 0.3
1.2
1.8 1.4
4.8
0.5
0.80.9 0.9 1.0
0.1
0.1
0.10.1 0.1
0.2
0.2
0.2
0.8
2006-07 2007-08 2008-09 2009-10 2010-11
Raising Cost Depreciation Depletion
2006-07 2007-08 2008-09 2009-10 2010-11
Raising Cost Depreciation Depletion

Low Finding & Development Costs
5.56.00
Finding and Development Costs (USD / bbl)
OIL has the Advantage of Low Finding & Development costs.
1.8 1.8
3.02.8
3.8
2.5
3.0
4.1 4.2
5.5
2.00
3.00
4.00
5.00
0.00
1.00
FY2007 FY2008 FY2009 FY2010 FY2011
Finding Costs F&D Costs

Financial Performance

Sharing of Subsidy by Upstream Companies
2007-08 2008-09 2009-10 2010-11 Q1 FY’11 Q1 FY’12
ONGC 22,001 28,226 11,554 24893 5516 12046
OIL 2,307 3,023 1,549 3293 730 1781
GAIL 1,401 1,694 1,326 2111 445 682
Rs. in Crores
Total 25,709 32,943 14,430 30,297 6,691 14,509
% SHARING
2007-08 2008-09 2009-10 2010-11 Q1 FY’11 Q1 FY’12
ONGC 86% 86% 80% 82% 82% 83%
OIL 9% 9% 11% 11% 11% 12%
GAIL 5% 5% 9% 7% 7% 5%
Total 100% 100% 100% 100% 100% 100%

Realized Price
116.3
(USD/barrel)
83.2 81.7
68.5
86.1
78.1
58.1 55.6 56.2 58.5
49.7
59.6
36.239.0 39.8 41.4
33.8
42.1
FY2008 FY2009 FY2010 FY2011 Q1 FY'11 Q1 FY'12
Gross Realized Price Realized Price after Subsidy/Discount Net Realized Price

8,178
8,860
9,549
8,000
9,000
10,000
Revenue and profitability
Revenue and profitability analysis (Rs Crore)
6,010
6,796
1,817
2,669
1640 17892162
26102888
2,000
3,000
4,000
5,000
6,000
7,000
8,000
501850
0
1,000
2,000
FY2007 FY2008 FY2009 FY2010 FY2011 Q1 FY'11 Q1 FY'12
Income PAT
Note: Exchange rate 1 USD = 48.52 INR used for figures upto FY2009; FY10 and FY11, actual exchange rates have been used.

800
900
1000
16,000
18,000
Networth and Book Value
Networth (Rs crores) and Book Value Analysis (Rs)
7,9339,331
13,745 15,602
14,251
16,451 371
436
572
649
593
684
200
300
400
500
600
700
800
4,000
6,000
8,000
10,000
12,000
14,000
0
100
0
2,000
FY2008 FY2009 FY2010 FY2011 Q1 FY'11 Q1 FY'12
Networth (LHS) Book Value (RHS)

Cash Flow and EBITDA Margin
4,380
4,805
49%
50%
52%
50%
60%
4000
4500
5000
2,548
100%
120%
2,500
3,000
Cash Flow (Rs Crores) EBITDA (Rs Crores) and EBITDA MARGIN (%)
2,841
3,568
841
1,387
43%
42%
49%
46%
10%
20%
30%
40%
1000
1500
2000
2500
3000
3500
4000
1,385
1,798
2,135
608
972
20%
40%
60%
80%
500
1,000
1,500
2,000
0%
10%
0
500
FY2008 FY2009 FY2010 FY2011 Q1 FY'11 Q1 FY'12
0%0
FY2008 FY2009 FY2010 FY2011 Q1 FY'11
Q1 FY'12
Consistent and Attractive Cash Flow
EBITDA EBITDA Margin

340
375
305
34
35
300
320
340
360
380
400
0.12x120
140
0.12
0.14
Dividends distribution and Earnings per share highlights
Dividends distribution Earnings per share and Debt-Equity ratio
33.633.9
32.9
30.2
31.3 31.2
275265 260
29
30
31
32
33
40
60
80
100
120
140
160
180
200
220
240
260
280
300
86
7283
104114
1200.07x
0.02x
0.06x
20
40
60
80
100
0.02
0.04
0.06
0.08
0.1
28
FY2006 FY2007 FY2008 FY2009 FY2010 FY2011
0
20
40
Dividend Payout (%) - LHS Dividends (%) - RHS
0.003x0.006x
0
FY2006 FY2007 FY2008 FY2009 FY2010 FY2011
0
Earnings per share (INR) Debt/Equity
The dividend per share has shown a
consistent uptrend
Steady increase in EPS and minimal debt
on the balance sheet

Guidance: FY’12
2009-10 2010-11 2011-12 (Target)
Crude oil production 3.57 mmt 3.61 MMT 3.76 MMT
Natural gas production 2,415 mmscm 2,349 mmscm 2,633 mmscm
� Increase in Exploratory and Development Drilling Meterage
� Increase in Work Overs
� Enhanced Water Injection
� Endeavour to Enhance LPG production through NGL Recycling
� Endeavour to Reduce Gas Flaring by Inducting LNG Technology

� Stable Operations, Looking for Growth
� Company with Good Operating Track Record
� Sound Financial Health
Conclusion
� Sound Financial Health
� Company with more than 5 Decades of E&P Expertise
� Large Prospective E&P Acreage
� Entry into Deepwater/Offshore Blocks as Operator
� Entry into discovered assets in Venezuela, Acquisition Thrust continues
� Spreading its Wings : NE ���� Pan India ���� Global
� Diversifying into New Areas

Thank You