
Analyst Call to Review - atmosenergy.com
29
Analyst Call to Review Fiscal 2021 Third Quarter Financial Results August 5, 2021 10:00 a.m. Eastern
Transcript of Analyst Call to Review - atmosenergy.com

Analyst Call to Review
Fiscal 2021 Third QuarterFinancial Results
August 5, 202110:00 a.m. Eastern

Financial Performance YTD Diluted EPS of $4.77 Capital spending of $1.4 billion; 87% allocated to safety and reliability
spending Reaffirmed Fiscal 2021 EPS guidance range of $4.90 - $5.10
Expected to be in the higher end of range 8.7% increase in fiscal 2021 indicated annual dividend to $2.50 per diluted share
37th consecutive year of rising dividends
Executed Our Regulatory Strategy Completed $185.7 million
$53.0 million in progress
Strong Balance Sheet Approximately $3.2 billion in liquidity $1.1 billion of financing to support operations $2.2 billion of long-term debt financing related to Winter Storm Uri Equity capitalization at 60% as of June 30, 2021, excluding storm-related financing
2
Fiscal 2021 YTD Highlights
As of August 4, 2021
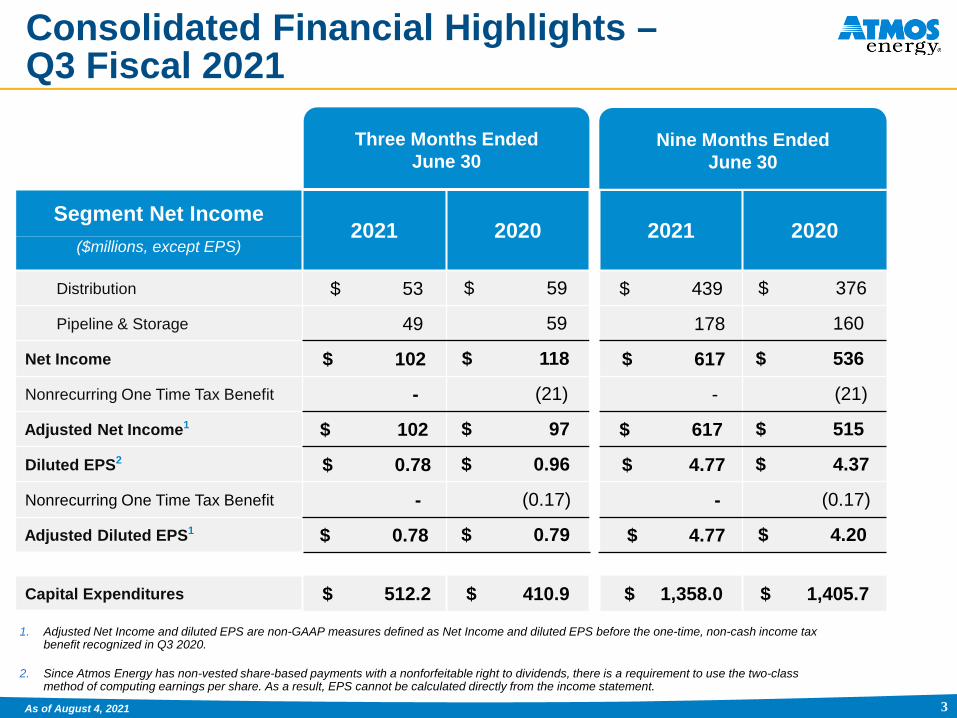
1. Adjusted Net Income and diluted EPS are non-GAAP measures defined as Net Income and diluted EPS before the one-time, non-cash income tax benefit recognized in Q3 2020.
2. Since Atmos Energy has non-vested share-based payments with a nonforfeitable right to dividends, there is a requirement to use the two-class method of computing earnings per share. As a result, EPS cannot be calculated directly from the income statement.
Consolidated Financial Highlights –Q3 Fiscal 2021
Segment Net Income2021 2020 2021 2020
($millions, except EPS)
Distribution $ 53 $ 59 $ 439 $ 376
Pipeline & Storage 49 59 178 160
Net Income $ 102 $ 118 $ 617 $ 536
Nonrecurring One Time Tax Benefit - (21) - (21)
Adjusted Net Income1 $ 102 $ 97 $ 617 $ 515
Diluted EPS2 $ 0.78 $ 0.96 $ 4.77 $ 4.37
Nonrecurring One Time Tax Benefit - (0.17) - (0.17)
Adjusted Diluted EPS1 $ 0.78 $ 0.79 $ 4.77 $ 4.20
Capital Expenditures $ 512.2 $ 410.9 $ 1,358.0 $ 1,405.7
3
Nine Months EndedJune 30
Three Months EndedJune 30
As of August 4, 2021

$25.4MM – Net increase due to rate case outcomes
$8.9MM – Increase due to weather & consumption
$22.9MM – Increase in O&M and bad debt expense
$9.3MM – Increase in D&A and property tax expense Increased capital investments
Three Months Ended June 30($millions)
2021 2020 Change
Distribution $ 68.1 $ 62.5 $ 5.6
Pipeline & Storage 65.3 76.5 (11.2)
Operating Income $ 133.4 $ 139.0 $ (5.6)
$14.4MM – Increase due to rate case outcomes
$1.7MM – Decrease in through system revenues
$10.0MM – Decrease due to EDIT refund
$8.4MM – Increase in system maintenance Hydro testing and in-line inspections
$3.4MM – Increase in D&A and property tax expense Increased capital investments
Distribution Key Drivers Pipeline & Storage Key Drivers
4
Segment Operating Income Results
As of August 4, 2021

$128.1MM – Net increase due to rate case outcomes
$15.0MM – Increase in customer growth
$8.6MM – Decrease in service order revenues
$25.5MM – Increase in O&M and bad debt expense, including: $4.9MM – Decrease in T&E spending $5.9MM – Increase in system maintenance
$31.3MM – Increase in D&A and property tax expense Increased capital investments
Nine Months Ended June 30($millions)
2021 2020 Change
Distribution $ 580.9 $ 496.3 $ 84.6
Pipeline & Storage 233.1 226.9 6.2
Operating Income $ 814.0 $ 723.2 $ 90.8
$41.9MM – Increase due to rate case outcomes
$6.5MM – Decrease in through system revenues
$16.6MM – Decrease due to EDIT refund
$14.9MM – Increase in D&A and property tax expense Increased capital investments
Distribution Key Drivers Pipeline & Storage Key Drivers
5
Segment Operating Income Results
As of August 4, 2021

Safety & Reliability Investments Support Infrastructure Modernization
87%12%
1%
Safety and Reliability
Customer Expansion
Other
$millions Fiscal 2021 YTD CapEx
$ 735 Repair and replace transmission and distribution pipelines
164 Service line replacement
116 Pipeline integrity management projects
98 Install & replace measurement & regulating equipment
43 Fortifications
32 Enhance storage and compression capabilities
$ 1,188 Total Safety and Reliability Spending
$ 1,358 Total Capital Spending
6
Capital Spending Mix
As of August 4, 2021

7
Fiscal 2021 YTD Financing Recap
$2.8 billion of long-term debt financing issued $2.2 billion 2-year senior notes issued in March 2021 to finance Winter Storm Uri costs
• $1.1 billion 0.625%
• $1.1 billion Libor + 0.38%
$600 million 1.50% 10-year senior notes issued in October 2020
Equity needs satisfied through our ATM program $338 million of equity priced YTD fiscal 2021
$461 million in settled equity forward arrangements
$213 million net proceeds available under forward agreements at June 30, 2021• Maturity: June 30, 2022
• Shares: 2,249,682
• Forward Share Price: $94.71
$1.0 billion available for issuance under June 2021 ATM program as of June 30, 2021
$5.0 billion shelf registration statement filed June 29, 2021 $4.0 billion available as of June 30, 2021
As of August 4, 2021

$2002.29%
$2,2000.56%**
$106.67%
$5003.0%
$1506.75%
$3002.625%
$6001.5%
$2005.95%
$4005.5%
$5004.15%
$7504.125% $600
4.3%
$9503.73%
$0
$500
$1,000
$1,500
$2,000
$2,500
Weighted Average Maturity ~13.2 Years*
($ m
illio
ns)
8
Strong Financial Foundation
As of August 4, 2021
* Excluding the $2.2 billion of incremental financing the weighted average maturity is 18 years.** Figure includes a Libor floating rate component that may change over time.

Improved Weighted Average Cost of Long-Term DebtCredit Metrics Remain Strong
8.50% 1
7 is
sues
, 3.0
0% -
6.75
%
9
Strong Financial Foundation
5.2 5.2
4.7
4.2
3.0*
0.0
0.5
1.0
1.5
2.0
2.5
3.0
3.5
4.0
4.5
5.0
5.5
$0
$500
$1,000
$1,500
$2,000
$2,500
$3,000
$3,500
$4,000
$4,500
$5,000
$5,500
$6,000
$6,500
$7,000
$7,500
FY2017 FY2018 FY2019 FY2020 FY2021E
Interest Rate %Net Long-Term Debt
Moody’s Standard & Poor’s
• Senior Unsecured A1 A-
• Commercial Paper P-1 A-2
• Ratings Outlook Negative Negative
Strong InvestmentGrade Credit Ratings
As of August 4, 2021
* Excluding the $2.2 billion of Winter Storm Uri financing, the weighted average cost is 4.0%.

Capitalization and Liquidity Profile
8.50% 1
7 is
sues
, 3.0
0% -
6.75
%
0%
25%
50%
75%
100%
Jun 30, 2021* Sep 30, 2020
52%60%
48%40%
Total Capitalization
Equity LT Debt ST Debt
$0
$500
$1,000
$1,500
$2,000
$2,500
$3,000
$3,500
Availability Outstanding
$1,500
$900
$100
$5.6
$525
$213
Liquidity Profile as of June 30, 2021
Five-year revolver Three-year revolver One-year facilitiesCash Equity Forwards
~ $3.2 billion Available
Liquidity at 6/30/21
10
Strong Financial Foundation Further Enhanced
As of August 4, 2021
* Excluding the $2.2 billion of Winter Storm Uri financing, the equity capitalization rate is 60.2%.

($millions, except EPS) FY 2020 FY 2021E1
Distribution $ 395 $ 430 - 445
Pipeline & Storage 206 205 - 220
Total Net Income $ 601 $ 635 - 665
Average Diluted Shares 122.9 129.0 - 131.5
Adjusted Diluted EPS2 $ 4.723 $ 4.90 - $ 5.10
1. Changes in events or other circumstances that the Company cannot currently anticipate could materially impact earnings and could result in earnings for fiscal 2021 significantly above or below this outlook.
2. Since Atmos Energy has non-vested share-based payments with a non-forfeitable right to dividends, there is a requirement to use the two-class method of computing earnings per share. As a result, EPS cannot be calculated directly from the income statement.
3. Adjusted diluted EPS is a non-GAAP measure defined as diluted EPS before a one-time, non-cash income tax benefit recognized in Q3 2020.
Capital Spending $ 1,936 $ 2,000 - $ 2,200
11
Fiscal 2021E Guidance
As of August 4, 2021

Selected Expenses($millions)
FY 2020 FY 2021E1
O&M $ 630 $ 695 - 705
D&A $ 430 $ 475 - 485
Interest $ 84 $ 75 - 85
Adjusted Income Tax $ 1662 $ 150 - 160
Adjusted Effective Tax Rate 22.2%3 18% - 20%4
12
Fiscal 2021E Guidance
1. Changes in events or other circumstances that the Company cannot currently anticipate could materially impact earnings and could result in earnings for fiscal 2021 significantly above or below this outlook.
2. Adjusted Income Tax is a Non-GAAP measure defined as Income Taxes of $145 million before a $21 million one-time, non-cash income tax benefit recognized in Q3 2020.
3. Adjusted Effective Tax Rate is a Non-GAAP measure calculated using Income before Income Taxes and Adjusted Income Tax, which excludes the $21 million one-time, non-cash income tax benefit recognized in Q3 2020.
4. Excluding the amortization of excess deferred tax liabilities, the effective rate is expected to be 23% - 25%.
As of August 4, 2021

8.50% 1
$0
$50
$100
$150
$200
$250
FY2020 FY2021
$160.2 $185.7
$53.0
$millions $185.7MM Completed
$ 82.6MM – Mid-Tex RRM $ 43.9MM – APT GRIP $ 11.1MM – Mid-Tex ATM GRIP1
$ 10.6MM – Mississippi SIR $ 10.3MM – Tennessee ARM $ 5.9MM – Mississippi SRF $ 5.6MM – West TX RRM $ 5.1MM – West TX ALDC SOI $ 4.6MM – Mid-Tex Environs GRIP1
$ 2.4MM – Colorado SSIR $ 1.7MM – Kansas GSRS $ 1.7MM – West TX GRIPs1
$ 1.7MM – Mid-Tex DARR1
$ 1.6MM – Kentucky PRP $ (2.4)MM – Louisiana RSC
$53.0MM In Progress $ 29.7MM – Mid-Tex RRM $ 14.4MM – Kentucky Rate Case & PRP $ 8.4MM – Mississippi SIR $ 0.9MM – West TX RRM
13
FY2021 Regulatory Accomplishments
Key Rate ActivityThrough August 4, 2021
Approved Annualized Operating Income Increases
As of August 4, 2021
1. Rate filings have been approved but will not be implemented until September 1, 2021.

Regulatory Mechanisms To Support Recovery
Jurisdiction Annual Rate Stabilization Infrastructure
Pension and Retirement
Cost TrackersWNA Bad Debt in
GCA
Recovery of Certain
COVID-19 Costs
Colorado
Kansas
Kentucky
Tennessee
Virginia
Louisiana
Mississippi
Mid-Tex
West Texas
APT
Annual Revenue and Lag Mechanisms
Revenue Stability and Lag Mechanisms Other
14As of August 4, 2021

Q1October December
Q2January March
Q3April June
Q4 July September
Mid-Tex and WTX Cities –Implemented RRM filing of $88.2 million
Colorado – Implemented SSIR filing of $2.4 million
Mid-Tex and WTX Cities – Filed Rate Review Mechanism (RRM) in April 2021; new rates anticipated Q1 fiscal 2022
Louisiana – Implemented RSC filing of ($2.4) million
Mississippi – Implemented SRF and SIR filings of $16.5 million
Kansas – Implemented GSRS filing of $1.7 million
Virginia – Filed SAVE in June 2021; new rates anticipated in Q1 fiscal 2022
Mid-Tex Environs – Approved GRIP filing of $4.6 million; implemented in Q4 fiscal 2021
Kentucky – Implemented PRP filing of $1.6 million
Mississippi – Filed System Integrity Rider (SIR) in March 2021; new rates anticipated Q1 fiscal 2022
Kentucky – Filed General Rate Case in June 2021; new rates anticipated Q1 fiscal 2022
Mississippi – Filed Stable Rate Filing (SRF) in July 2021; new rates anticipated Q1 fiscal 2022
Virginia – Implemented SAVE filing of $0.3 million
Atmos Pipeline Texas (APT) –Implemented GRIP filing of $43.9 million
Kentucky – Filed PRP in August 2021; new rates anticipated Q1 fiscal 2022
WTX ALDC – Implemented SOI filing of $5.1 million
Tennessee – Implemented ARM filing of $10.3 million
WTX Triangle and Environs –Approved GRIP filings of $1.7 million; implemented in Q4 fiscal 2021
Mid-Tex (Dallas) – Approved DARR filing of $1.7 million; implemented in Q4 fiscal 2021
Mid-Tex ATM– Approved GRIP filing of $11.1 million; implemented in Q4 fiscal 2021
15
Key Regulatory Filings – Fiscal 2021ERate Filing Planned Timing
As of August 4, 2021
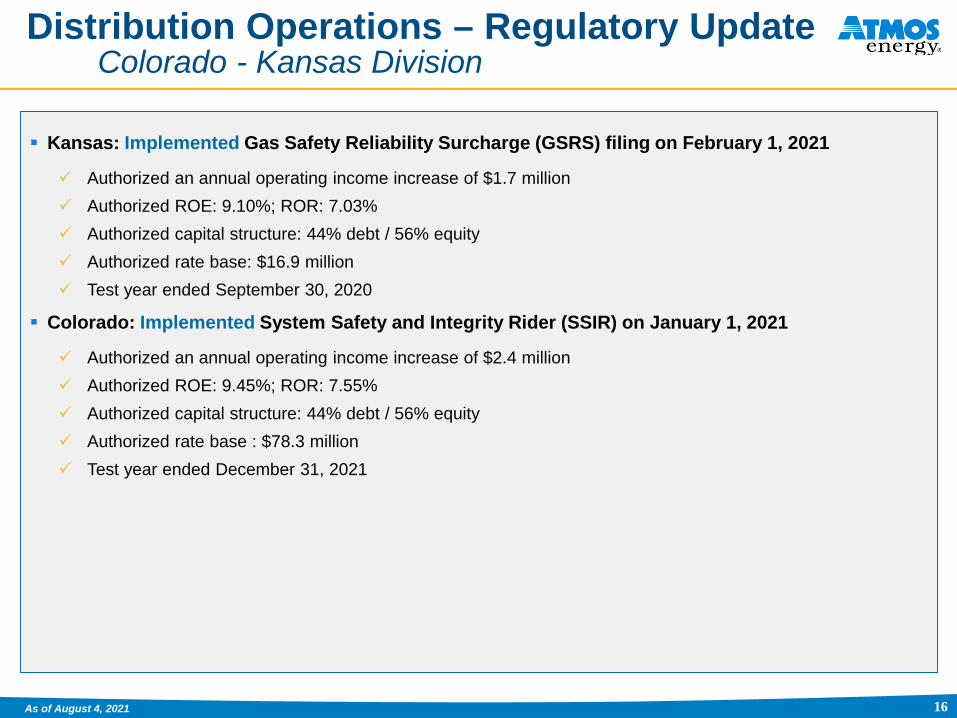
Kansas: Implemented Gas Safety Reliability Surcharge (GSRS) filing on February 1, 2021
Authorized an annual operating income increase of $1.7 million Authorized ROE: 9.10%; ROR: 7.03% Authorized capital structure: 44% debt / 56% equity Authorized rate base: $16.9 million Test year ended September 30, 2020
Colorado: Implemented System Safety and Integrity Rider (SSIR) on January 1, 2021
Authorized an annual operating income increase of $2.4 million Authorized ROE: 9.45%; ROR: 7.55% Authorized capital structure: 44% debt / 56% equity Authorized rate base : $78.3 million Test year ended December 31, 2021
16
Distribution Operations – Regulatory UpdateColorado - Kansas Division
As of August 4, 2021

Kentucky: Filed Annual Pipe Replacement Program (PRP) on July 30, 2021 Requested an annual operating income increase of $3.5 million Requested ROE: 10.35%; ROR: 7.66% Requested capital structure: 43% debt / 57% equity Requested rate base: $67.9 million
Kentucky: Filed General Rate Case on June 30, 2021 Requested an annual operating income increase of $14.4 million* Requested ROE: 10.35%; ROR: 7.66% Requested capital structure: 43% debt / 57% equity Requested rate base: $596.1 million
Virginia: Filed SAVE Infrastructure Program on June 1, 2021 Requested an annual operating income increase of $0.4 million Requested ROE: 9.20%; ROR: 7.43% Requested capital structure: 42% debt / 58% equity Requested rate base: $7.4 million
17
Distribution Operations – Regulatory UpdateKentucky/Mid-States Division
As of August 4, 2021
* This amount includes $3.5 million from the Kentucky annual pipe replacement program filing.

Tennessee: Implemented Annual Review Mechanism (ARM) on June 1, 2021
Authorized an increase in annual operating income of $10.3 million Authorized ROE of 9.80%; ROR of 7.62% Authorized capital structure of 40% debt / 60% equity Authorized system-wide rate base of $421.2 million Test year ended September 30, 2020
Kentucky: Implemented Annual Pipe Replacement Program (PRP) on October 1, 2020
Authorized an annual operating income increase of $1.6 million Authorized ROE of 9.65%; ROR of 7.49% Authorized capital structure: 42% debt / 58% equity Authorized rate base: $39.4 million Forward-looking test year ending September 2021
Virginia: Implemented SAVE Infrastructure Program on October 1, 2020 Authorized an annual operating income increase of $0.3 million Authorized ROE: 9.20%; ROR: 7.43% Authorized capital structure: 42% debt / 58% equity Authorized rate base: $3.5 million
18
Distribution Operations – Regulatory UpdateKentucky/Mid-States Division
As of August 4, 2021

Louisiana: Implemented Annual Rate Stabilization Clause (RSC) on July 1, 2021
Combined filing for Trans-La and LGS Authorized a decrease in annual operating income of $2.4 million Authorized ROR of 7.30% Authorized system-wide rate base of $837.3 million Test year ended December 31, 2020
19
Distribution Operations – Regulatory UpdateLouisiana Division
As of August 4, 2021

Mid-Tex Cities: Filed 2020 Annual Rate Review Mechanism (RRM) on April 1, 2021 Requested an increase in annual operating income of $29.7 million Requested ROE of 9.80%; ROR of 7.36% Requested capital structure of 42% debt / 58% equity Requested system-wide rate base of $4.4 billion Test year ended December 31, 2020
Mid-Tex Environs: Approved GRIP on August 3, 2021; Rates to be Implemented on September 1, 2021 Authorized an increase in annual operating income of $4.6 million Authorized ROE of 9.80%; ROR of 7.97% Authorized capital structure of 40% debt / 60% equity Authorized system-wide rate base of $4.3 billion Test year ended December 31, 2020
Mid-Tex ATM Cities: Approved GRIP on June 11, 2021; Rates to be Implemented on September 1, 2021 Authorized an increase in annual operating income of $11.1 million Authorized ROE of 9.80%; ROR of 7.97% Authorized capital structure of 40% debt / 60% equity Authorized system-wide rate base of $4.3 billion Test year ended December 31, 2020
20
Distribution Operations – Regulatory UpdateMid-Tex Division
As of August 4, 2021

Mid-Tex City of Dallas: Approved Dallas Annual Rate Review (DARR) on June 9, 2021; Rates to be Implemented on September 1, 2021
Authorized an increase in annual operating income of $1.7 million Authorized ROE of 9.80%; ROR of 7.57% Authorized capital structure of 41% debt / 59% equity Authorized system-wide rate base of $4.3 billion Test year ended September 30, 2020
Mid-Tex Cities: Implemented 2019 Annual Rate Review Mechanism (RRM) on December 1, 2020 Authorized an increase in annual operating income of $82.6 million Authorized ROE of 9.80%; ROR of 7.53% Authorized capital structure of 42% debt / 58% equity Authorized system-wide rate base of $3.7 billion Test year ended December 31, 2019
21
Distribution Operations – Regulatory UpdateMid-Tex Division
As of August 4, 2021

22
Mississippi: Filed Annual Stable Rate Filing (SRF) on July 1, 2021 Requested an annual operating income decrease of $0.7 million Requested ROR: 7.81% Requested rate base: $507.1 million Forward-looking components - PP&E, accumulated depreciation, accumulated deferred income taxes,
depreciation and ad valorem taxes from November 2021 - October 2022
Mississippi: Filed Annual System Integrity Rider (SIR) on July 1, 2021 Requested an annual operating income increase of $8.4 million Requested ROR: 7.81% Requested rate base: $323.7 million Forward-looking components - PP&E, accumulated depreciation, accumulated deferred income taxes,
depreciation and ad valorem taxes from November 2021 - October 2022
Mississippi: Implemented Annual Stable Rate Filing (SRF) on November 1, 2020
Authorized an annual operating income increase of $5.9 million Authorized ROR: 7.81% Authorized rate base: $474.2 million Forward-looking components - PP&E, accumulated depreciation, accumulated deferred income taxes,
depreciation and ad valorem taxes from November 2020 - October 2021
Distribution Operations – Regulatory UpdateMississippi Division
As of August 4, 2021

23
Mississippi: Implemented Annual System Integrity Rider (SIR) on November 1, 2020 Authorized an annual operating income increase of $10.6 million Authorized ROR: 7.81% Authorized rate base: $247.4 million Forward-looking components - PP&E, accumulated depreciation, accumulated deferred income taxes,
depreciation and ad valorem taxes from November 2020 - October 2021
Distribution Operations – Regulatory UpdateMississippi Division
As of August 4, 2021

West Texas Cities: Filed 2020 Annual Rate Review Mechanism (RRM) on April 1, 2021 Requested an annual operating income increase of $0.9 million Requested ROE: 9.80%; ROR: 7.36% Requested capital structure: 42% debt / 58% equity Requested rate base: $759.9 million Test year ending December 31, 2020
West Texas Environs: Approved 2020 GRIP on June 11, 2021; Rates to be Implemented on September 1, 2021 Authorized an annual operating income increase of $1.3 million Authorized ROE: 9.80%; ROR: 7.97% Authorized capital structure: 40% debt / 60% equity Authorized rate base: $765.1 million Test year ending December 31, 2020
West Texas Triangle: Approved 2020 GRIP on June 11, 2021; Rates to be Implemented on September 1, 2021 Authorized an annual operating income increase of $0.4 million Authorized ROE: 9.80%; ROR: 7.71% Authorized capital structure: 40% debt / 60% equity Authorized rate base: $40.0 million Test year ending December 31, 2020
24
Distribution Operations – Regulatory UpdateWest Texas Division
As of August 4, 2021
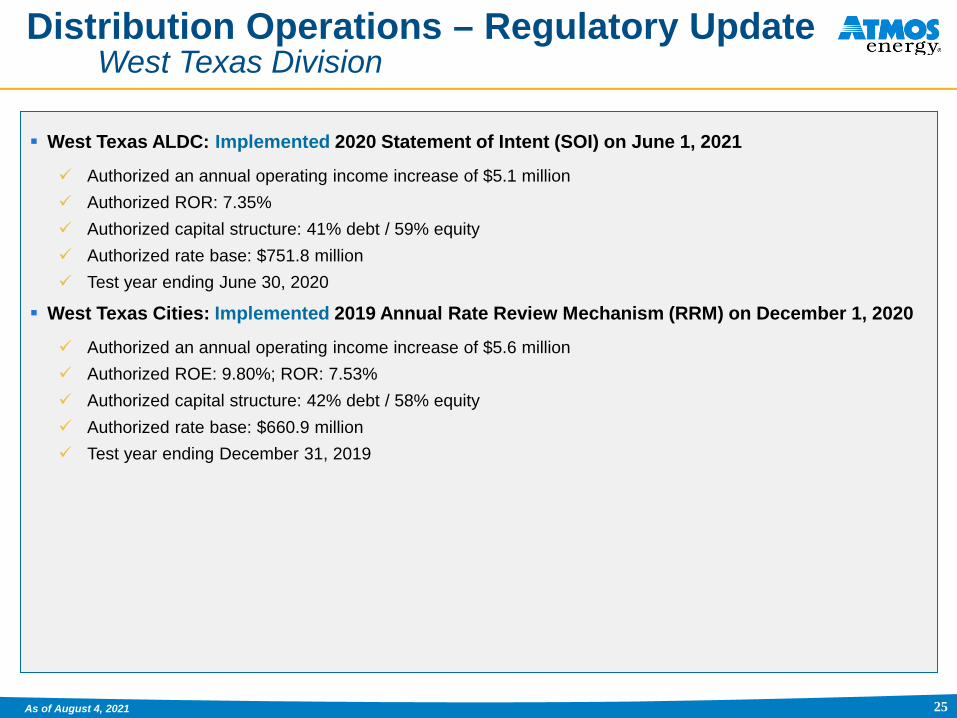
West Texas ALDC: Implemented 2020 Statement of Intent (SOI) on June 1, 2021
Authorized an annual operating income increase of $5.1 million Authorized ROR: 7.35% Authorized capital structure: 41% debt / 59% equity Authorized rate base: $751.8 million Test year ending June 30, 2020
West Texas Cities: Implemented 2019 Annual Rate Review Mechanism (RRM) on December 1, 2020
Authorized an annual operating income increase of $5.6 million Authorized ROE: 9.80%; ROR: 7.53% Authorized capital structure: 42% debt / 58% equity Authorized rate base: $660.9 million Test year ending December 31, 2019
25
Distribution Operations – Regulatory UpdateWest Texas Division
As of August 4, 2021
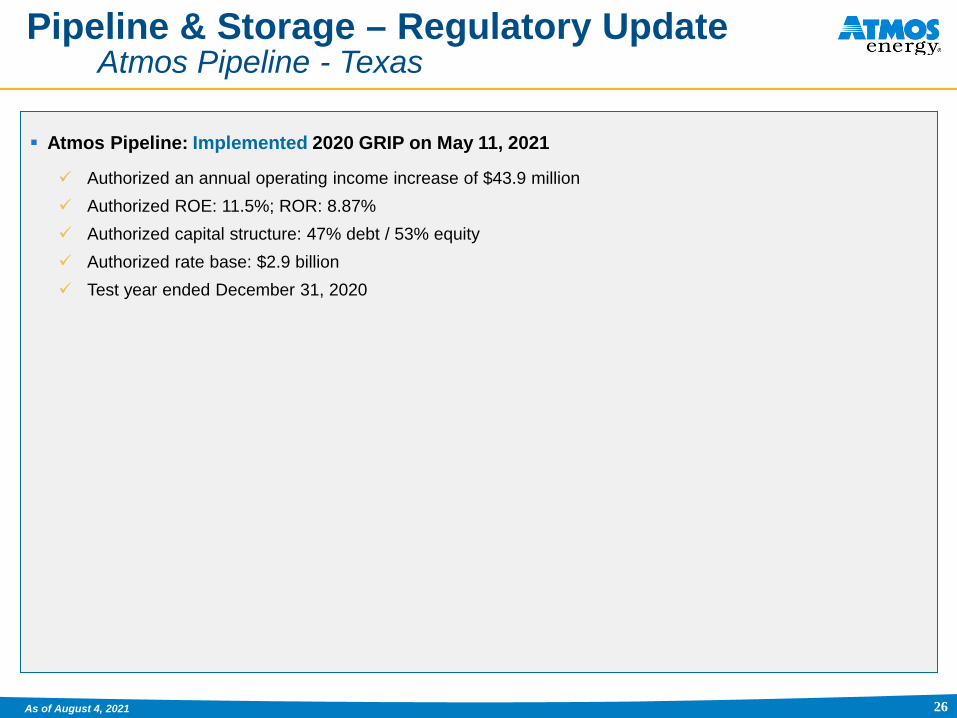
Atmos Pipeline: Implemented 2020 GRIP on May 11, 2021
Authorized an annual operating income increase of $43.9 million Authorized ROE: 11.5%; ROR: 8.87% Authorized capital structure: 47% debt / 53% equity Authorized rate base: $2.9 billion Test year ended December 31, 2020
26
Pipeline & Storage – Regulatory UpdateAtmos Pipeline - Texas
As of August 4, 2021

(See Next Page for Footnote Explanations)
27
Jurisdictions
Effective Date of
Last Rate Action
Date of Last Rate
Filing (Pending)
Authorized Operating
Income $millions
RequestedOperating
Income $millions
Rate Base $millions(1)
RequestedRate Base $millions
Authorized Rate of
Return (1)
RequestedRate of Return
Authorized Return on Equity (1)
Requested Return on
Equity
Authorized Debt/ Equity Ratio
RequestedDebt/Equity
Ratio
Meters at 6/30/21
Atmos Pipeline-TX (GUD 10580) 8/1/17 $13.0 $1,767 8.87% 11.50% 47/53 NA
Atmos Pipeline-TXGRIP 3 5/11/21 $43.9 $2,925 8.87% 11.50% 47/53 NA
Mid-Tex - City of Dallas DARR 5 6/9/21 $1.7 $4,293 7.57% 9.80% 41/59 234,666
Mid-Tex CitiesRRM 12/1/20 4/1/21 $82.6 $29.7 $3,733 $4,399 7.53% 7.36% 9.80% 9.80% 42/58 42/58 1,286,813
Mid-Tex ATM Cities
SOI/GRIP(GUD 10779)
3,5 6/11/21 $11.1 $4,307 7.97% 9.80% 40/60 182.681
Mid-Tex Environs SOI/GRIP
(GUD 10944)3,5 8/3/21 $4.6 $4,307 7.97% 9.80% 40/60 80,675
WTX Cities RRM 12/1/20 4/1/21 $5.6 $0.9 $661 $760 7.53% 7.36% 9.80% 9.80% 42/58 42/58 148,861
WTX ALDC SOI 4 6/1/21 $5.1 $752 7.35% 2 2 152,039
WTX ALDC GRIP 3,4 9/1/20 $5.9 $672 8.57% 10.50% 48/52 NA
WTX Environs SOI/GRIP
(GUD 10945)3,5 6/11/21 $1.3 $765 7.97% 9.80% 40/60 24,235
WTX Triangle (GUD 10900) 5 6/11/21 $0.4 $40 7.71% 9.80% 40/60 NA
Louisiana RSC(U-35525) 7/1/21 ($2.4) $837 7.30% 2 2 372,640
Mississippi SRF(2005-UN-0503) 11/1/20 7/1/21 $5.9 ($0.7) $474 $507 7.81% 7.81% 2 2 2 2 273,201
Mississippi SIR(2015-UN-049) 11/1/20 7/1/21 $10.6 $8.4 $247 $324 7.81% 7.81% 2 2 2 2 NA
Regulatory Summary

28
Regulatory Summary (continued)
Jurisdictions
Effective Date of
Last Rate Action
Date of Last Rate
Filing (Pending)
Authorized Operating
Income $millions
RequestedOperating
Income $millions
Rate Base $millions(1)
RequestedRate Base $millions
Authorized Rate of
Return (1)
RequestedRate of Return
Authorized Return on Equity (1)
Requested Return on
Equity
Authorized Debt/ Equity Ratio
RequestedDebt/Equity
Ratio
Meters at 6/30/21
Kentucky PRP(2019-00253) 10/1/20 7/30/21 $1.6 $3.5 $39 $68 7.49% 7.66% 9.65% 10.35% 42/58 43/57 NA
Kentucky (2018-00281) 6 5/7/19 6/30/21 $3.4 $14.4 $425 $596 7.49% 7.66% 9.65% 10.35% 42/58 43/57 183,803
Tennessee ARM (19-00067) 6/1/21 $10.3 $421 7.62% 9.80% 40/60 158,759
Kansas (19-ATMG-525-
RTS)4/1/20 ($0.2) $242 7.03% 9.10% 44/56 139,458
Kansas GSRS 2/1/21 $ 1.7 $17 7.03% 9.10% 44/56 NA
Colorado(17AL-0429G) 5/3/18 ($0.2) $135 7.55% 9.45% 44/56 124,887
Colorado SSIR(20AL-0471G) 1/1/21 $2.4 $78 7.55% 9.45% 44/56 NA
Colorado GIS(18A-0765G) 4/1/19 $0.1 $1 7.55% 9.45% 44/56 NA
Virginia(PUR-2018-
00014)4/1/19 ($0.4) $48 7.43% 9.20% 42/58 24,733
Virginia SAVE(PUR-2020-
00107)10/1/20 6/1/21 $0.3 $0.4 $4 $7 7.43% 7.43% 9.20% 9.20% 42/58 42/58 NA
1. Rate base, authorized rate of return and authorized return on equity presented in this table are those from the last base rate case for each jurisdiction. These rate bases, rates of return and returns on equity are not necessarily indicative of current or future rate bases, rates of return or returns on equity.
2. A rate base, rate of return, return on equity or debt/equity ratio was not included in the final decision.
3. GRIP filings are based on existing returns and the change in net utility plant investment.
4. Includes the cities of Amarillo, Lubbock, Dalhart and Channing.
5. Rate filings have been approved but will not be implemented until September 1, 2021.
6. This amount includes $3.5 million from the Kentucky annual pipe replacement program filing.

The matters discussed or incorporated by reference in this presentation may contain “forward-looking statements” within the meaning of Section 27A of the Securities Act of 1933 and Section 21E of the Securities Exchange Act of 1934. All statements other than statements of historical fact included in this presentation are forward-looking statements made in good faith by the company and are intended to qualify for the safe harbor from liability established by the Private Securities Litigation Reform Act of 1995. When used in this presentation, or any of the company’s other documents or oral presentations, the words “anticipate”, “believe”, “estimate”, “expect”, “forecast”, “goal”, “intend”, “objective”, “plan”, “projection”, “seek”, “strategy” or similar words are intended to identify forward-looking statements. Such forward-looking statements are subject to risks and uncertainties that could cause actual results to differ materially from those discussed in this presentation, including the risks relating to regulatory trends and decisions, our ability to continue to access the credit and capital markets, and the other factors discussed in our reports filed with the Securities and Exchange Commission. These risks and uncertainties include the following: federal, state and local regulatory and political trends and decisions, including the impact of rate proceedings before various state regulatory commissions; increased federal regulatory oversight and potential penalties; possible increased federal, state and local regulation of the safety of our operations; the impact of greenhouse gas emissions or other legislation or regulations intended to address climate change; possible significant costs and liabilities resulting from pipeline integrity and other similar programs and related repairs; the inherent hazards and risks involved in distributing, transporting and storing natural gas; the availability and accessibility of contracted gas supplies, interstate pipeline and/or storage services; increased competition from energy suppliers and alternative forms of energy; adverse weather conditions; the impact of climate change; the inability to continue to hire, train and retain operational, technical and managerial personnel; increased dependence on technology that may hinder the Company's business if such technologies fail; the threat of cyber-attacks or acts of cyber-terrorism that could disrupt our business operations and information technology systems or result in the loss or exposure of confidential or sensitive customer, employee or Company information; natural disasters, terrorist activities or other events and other risks and uncertainties discussed herein, all of which are difficult to predict and many of which are beyond our control; the capital-intensive nature of our business; our ability to continue to access the credit and capital markets to execute our business strategy; market risks beyond our control affecting our risk management activities, including commodity price volatility, counterparty performance or creditworthiness and interest rate risk; the concentration of our operations in Texas; the impact of adverse economic conditions on our customers; changes in the availability and price of natural gas; increased costs of providing health care benefits, along with pension and postretirement health care benefits and increased funding requirements; and the outbreak of COVID-19 and its impact on business and economic conditions. Accordingly, while we believe these forward-looking statements to be reasonable, there can be no assurance that they will approximate actual experience or that the expectations derived from them will be realized. Further, we undertake no obligation to update or revise any of our forward-looking statements whether as a result of new information, future events or otherwise.
Further, we will only update our annual earnings guidance through our quarterly and annual earnings releases. All estimated financial metrics for fiscal year 2021 and beyond that appear in this presentation are current as of August 4, 2021.
29
Forward Looking Statements
As of August 4, 2021


![Transcript of Analyst Call [Company Update]](https://static.fdocuments.net/doc/165x107/577c7ba71a28abe0549824c9/transcript-of-analyst-call-company-update.jpg)


![Analyst & Conference Call [Company Update]](https://static.fdocuments.net/doc/165x107/577c98461a28ab163a8b4fee/analyst-conference-call-company-update.jpg)
