Food Waste Recycling Update. Why food waste? 23% of black bin is food.
Upload
trinhthienCategory
view
222download
2
BSR | Food Waste Study—Tier 2 Assessment January 2013
1
Analysis of U.S. Food Waste Among Food Manufacturers, Retailers, and Wholesalers
Prepared for the Food Waste Reduction Alliance
April 2013
www.bsr.org

BSR | Analysis of U.S. Food Waste Among Food Manufacturers, Retailers, & Wholesalers 2
About This Report
The Food Waste Reduction Alliance (FWRA) sought BSR’s support to analyze food waste data gathered from food manufacturers, grocery retailers, and wholesalers. This data was collected through a survey developed by the FWRA and sent to companies by the Grocery Manufacturers Association (GMA) and the Food Marketing Institute (FMI). Related assumptions and extrapolations are detailed in Appendix A. Please direct comments or questions to Corinna Kester at [email protected]. DISCLAIMER BSR publishes occasional papers as a contribution to the understanding of the role of business in society and the trends related to corporate social responsibility and responsible business practices. BSR maintains a policy of not acting as a representative of its membership, nor does it endorse specific policies or standards. The views expressed in this publication are those of its authors and do not reflect those of BSR members. ABOUT BSR BSR works with its global network of nearly 300 member companies to build a just and sustainable world. From its offices in Asia, Europe, and North and South America, BSR develops sustainable business strategies and solutions through consulting, research, and cross-sector collaboration. Visit www.bsr.org for more information about BSR’s more than 20 years of leadership in sustainability. © COPYRIGHT 2013 Grocery Manufacturers Association and Food Marketing Institute. Reproduction of the Analysis of U.S. Food Waste Among Food Manufacturers, Retailers, and Wholesalers in any form is prohibited except with prior written permission of the Grocery Manufacturers Association (GMA) and Food Marketing Institute (FMI). GMA and FMI do not guarantee the accuracy, adequacy, completeness, or availability of any information and are not responsible for any errors or omissions or for the results obtained from the use of such information. GMA AND FMI GIVE NO EXPRESS OR IMPLIED WARRANTIES, INCLUDING, BUT NOT LIMITED TO, ANY WARRANTIES OF MERCHANTABILITY OR FITNESS FOR A PARTICULAR PURPOSE OR USE. In no event shall GMA or FMI be liable for any ingredient, special, or consequential damages in connection with any use of the Analysis of U.S. Food Waste Among Food Manufacturers, Retailers, and Wholesalers.
BSR | Analysis of U.S. Food Waste Among Food Manufacturers, Retailers, & Wholesalers 3
Contents
4 Introduction
7 Executive Summary
9 Detailed Survey Findings
15 Comparison with Secondary Data from the Tier 1 Analysis
17 Barriers to Food Waste Diversion
20 Next Steps
21 Appendix A: Additional Details about the Analysis
22 Appendix B: GMA and FMI Survey

BSR | Analysis of U.S. Food Waste Among Food Manufacturers, Retailers, & Wholesalers 4
Introduction
The Food Waste Reduction Alliance (FWRA) is an industry-wide effort launched in 2010 and focused on addressing food waste, in particular within the section of the supply chain from the food manufacturer to retail grocery and restaurant. It is led by the Grocery Manufacturers Association (GMA), Food Marketing Institute (FMI), and National Restaurant Association (NRA), with active leadership and participation by its members. The Alliance seeks to reduce food waste throughout the supply chain. The goals of the FWRA are three-fold:
1. To avoid and reduce food waste wherever possible within members’ operations and supply chains.
2. To increase the donation of safe and healthy foods that would have gone to waste and to send food to food banks to help address hunger issues.
3. To divert unavoidable food waste away from landfills toward higher value uses, such as animal feed, composting, and waste-to-energy.
The companies and organizations involved in this effort have undertaken a comprehensive assessment of the sources of food waste. The first assessment (Tier 1) was based on publicly available data. The second assessment (Tier 2), which is the focus of this report, is based on primary data collected directly from companies. This primary data allows for a more accurate estimate of food waste in the U.S. food manufacturing, retail, and wholesale sectors than what other sources have collected to date. This first industry assessment will allow FWRA members to benchmark the current state of food waste diversion, improve the measurement and management of food waste, and track progress over time. In addition to this assessment, the FWRA also focuses on identifying issues, new technologies, and industry practices that support its goals.
Survey Methodology
To gain a better understanding of how much food waste is generated by food manufacturers, wholesalers, and grocery retailers in the U.S., GMA and FMI sent a paper-based survey to a targeted group of members in 2012. (A copy of the survey is included in Appendix B.) The survey’s objective was to collect primary data on:
» Donations of unsaleable food for human consumption
» Food waste reuse and recycling

BSR | Analysis of U.S. Food Waste Among Food Manufacturers, Retailers, & Wholesalers 5
» Food waste disposal
» Barriers to higher rates of donation, reuse, and recycling
All participating companies submitted data for their U.S. operations for the 2011 calendar year. The data presented in this report has been extrapolated to the entire U.S. food manufacturing sector and the U.S. grocery retail/wholesale sector, based on revenue.1 Profile of Respondents
Thirteen GMA and thirteen FMI members responded to the survey, as shown below. Table 1. Manufacturing Survey Respondents
ManufacturingNumber of respondents
13
Annual sales $122 billion
Number of employees 260,000
Percentage of the U.S. industry represented, by revenue1
17%
Table 2. Retail and Wholesale Survey Respondents
Retail and WholesaleNumber of respondents
13 (10 retail and 3 wholesale)
Annual sales $245 billion
Number of employees 980,000
Percentage of the U.S. industry represented, by revenue1
30%
The FWRA intends to undertake a similar assessment in 2013 and is currently exploring avenues for more comprehensive data collection, including data from the restaurant sector. Definitions
These key terms are used throughout this report:
» Food waste: Any solid or liquid food substance, raw or cooked, which is discarded, or intended or required to be discarded. Food waste includes the organic residues (such as carrot or potato peels) generated by the processing, handling, storage, sale, preparation, cooking, and serving of foods.
1 The data uses 2010 U.S. revenue numbers of $738 billion for the manufacturing sector and $805
billion for the retail and wholesale sectors. Revenue data was gathered from the Census Bureau’s “Annual Survey of Manufactures,” Progressive Grocer’s “79th Annual Report of the Grocery Industry,” and IBISWorld’s “Grocery Wholesaling in the U.S.” The retail sector includes supermarkets, supercenters, club stores, and smaller grocery stores, but it excludes convenience stores.
BSR | Analysis of U.S. Food Waste Among Food Manufacturers, Retailers, & Wholesalers 6
» Food waste diversion: Pertains to all food that is not sold or consumed, which could be diverted to a higher value use than landfill or incineration. This includes:
- Unsaleable food donation (to food banks and other organizations that serve people in need) and
- Food waste reuse/recycling (e.g. composting, conversion to animal feed, reuse of waste oils to produce fuel, etc.).
» Food waste disposal: Food or food scraps that are transported to traditional disposal facilities such as landfills, municipal waste incinerators, and wastewater treatment plants.
» Food waste generation: The sum of food waste diversion and food waste disposal.
» Unsaleable food: Consumer products that are removed from the primary channel of distribution for any reason and that may or may not be processed through product reclamation centers. Unsaleable food may be generated throughout the manufacturing and retail value chain, as described in the following examples. Mistakes during production may result in food that is perfectly safe and edible, but unable to be sold because of quality, over production, or labeling issues. Product ingredients and semi-finished products that are unsuitable for retail but are safe for human consumption may also be donated. The outer packaging of grocery items may become damaged during distribution and retail operations, thus making them unsuitable for sale but still perfectly safe to eat. Fresh food such as day-old bread, produce with blemishes, prepared foods, and other perishable items that are near sell-by dates may also be unsuitable for sale, but safe for consumption.
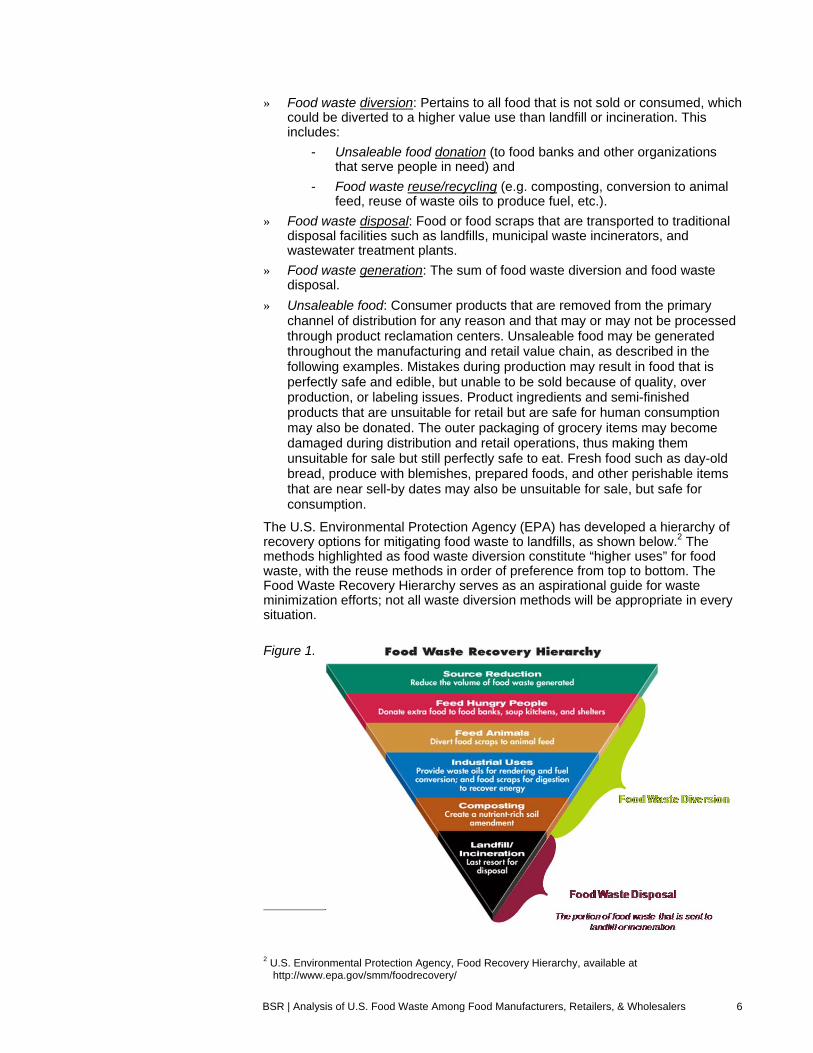
The U.S. Environmental Protection Agency (EPA) has developed a hierarchy of recovery options for mitigating food waste to landfills, as shown below.2 The methods highlighted as food waste diversion constitute “higher uses” for food waste, with the reuse methods in order of preference from top to bottom. The Food Waste Recovery Hierarchy serves as an aspirational guide for waste minimization efforts; not all waste diversion methods will be appropriate in every situation.
Figure 1.
2 U.S. Environmental Protection Agency, Food Recovery Hierarchy, available at
http://www.epa.gov/smm/foodrecovery/

BSR | Analysis of U.S. Food Waste Among Food Manufacturers, Retailers, & Wholesalers 7
Executive Summary
The following highlights summarize the data provided by respondents for 2011 as well as BSR’s extrapolation of the data to the entire U.S. food manufacturing sector and grocery retail/wholesale sector. 1. The food waste profiles of the food manufacturing sector and the
grocery retail/wholesale sector differ significantly, which reflects their different operating environments. Extrapolated to the entire United States, in 2011:
» The manufacturing sector generated a larger volume of food waste (44.3 billion pounds), but the large majority (94.6 percent) was diverted from landfills to higher uses, such as donation and recycling.
» The retail and wholesale sectors generated less food waste (3.8 billion pounds), but they diverted a smaller proportion (55.6 percent) to higher uses.
2. Despite significant differences in the total amount of food waste the sectors
generate, they donated and disposed of similar amounts in 2011:
» Amount of food waste disposed:
Manufacturing: 2.4 billion pounds
Retail and wholesale: 1.7 billion pounds
» Amount of food donated:
Manufacturing: 700 million pounds
Retail and wholesale: 670 million pounds
3. In total, 4.1 billion pounds of food waste was disposed in 2011 in landfills
or incinerators. This represents only 8.5 percent of the 48.1 billion pounds of food waste generated collectively across the food manufacturing, retail, and wholesale sectors.
4. The destination of food waste diverted from landfill differed
significantly between the sectors:
» Nearly three-quarters (73 percent) of food diverted from manufacturers went to animal feed.
» Food donation and composting were retailers’ and wholesalers’ primary diversion methods (representing 32 percent and 43 percent of diverted food, respectively).
5. Based on the survey results, companies have opportunities to continue
to reduce the amount of food waste they generate within the supply chain, as well as to identify options for directing it toward higher uses, as outlined in the EPA’s Food Waste Recovery Hierarchy.
» Food manufacturers have an opportunity to continue to reduce the amount of food waste they generate and to move up the food waste hierarchy to increase the percentage they donate.
» Food retailers and wholesalers have an opportunity to divert more waste from landfills to higher uses, while continuing to focus on reducing the amount of food waste they generate.

BSR | Analysis of U.S. Food Waste Among Food Manufacturers, Retailers, & Wholesalers 8
6. Efforts to reduce and divert food waste will need to address barriers,
several of which respondents highlighted. Transportation constraints and liability concerns were the most commonly cited barriers to food donation, while the most frequently cited obstacle to food recycling was an insufficient number of recycling options. The FWRA’s efforts to help companies share best practices will be useful in overcoming some of these barriers.

BSR | Analysis of U.S. Food Waste Among Food Manufacturers, Retailers, & Wholesalers 9
Detailed Survey Findings
Manufacturing Sector
The vast majority (94.6%) of food waste generated by the manufacturing sector in 2011 was diverted from landfill, as shown in Figure 2. When the survey data is extrapolated to represent the entire U.S. manufacturing sector, the total amount of food waste generated in 2011 was 44.3 billion pounds, 2.4 billion pounds of which was disposed of in landfills or incinerators. Figure 2. Amount of Food Waste Generated in the Manufacturing Sector, by Destination (in millions of pounds) It should be noted, however, that food waste diversion and disposal rates vary significantly across individual companies and may not align with the average industry diversion rate shown in Figure 2. Table 3 provides the average, lowest, and highest responses among survey participants, for each food waste destination. The variability in responses highlights the importance of collaboration and sharing best practices throughout the industry. Table 3. Variability in the Percentage of Food Waste Donated, Recycled, and Disposed Among Manufacturing Sector Respondents
Minimum Average Maximum
Percentage Donated 0.1% 2% 45%
Percentage Recycled 0% 93% 99.8%
Percentage Disposed 0% 5% 55%
Figure 3 below provides additional details about the methods the manufacturing sector uses to divert food waste to higher uses. Animal feed was the main method for diverting food waste, with 73 percent of all diverted food being converted into animal feed. Land application was the second most common diversion method, with 20% of diverted food waste reused in this manner. (Please note that the totals may not add up to 100 percent because they were rounded for inclusion in the figure.)
0
10,000
20,000
30,000
40,000
50,000
Donated, 1.6% (700 million lbs)
Recycled, 93.0% (41.2 billion lbs)
Disposed, 5.4% (2.4 billon lbs)

BSR | Analysis of U.S. Food Waste Among Food Manufacturers, Retailers, & Wholesalers 10
Figure 3. Destination of Diverted Food Waste, Manufacturing Sector (as a percentage of the amount of food waste diverted) The food waste profile of the manufacturing sector reflects the industry’s unique operating conditions. Manufacturers have large volumes of food and ingredients and a relatively limited number of manufacturing locations. Higher food waste volumes per location allows for greater economies of scale when recycling food products. In addition, manufacturers have a significant amount of semi-finished products, such as ingredients or sauces, and unavoidable waste, such as trimmings and peels. For example, if a company changes the vegetables in a frozen entrée or discontinues a particular variety of yogurt, a manufacturing facility can find itself with tens of thousands of pounds of unneeded vegetables, fruit, or similar ingredients, which may be challenging to donate. Similarly, since vegetable and fruit trimmings and peels cannot be donated, adding them to animal feed may be the best use of that organic material. Retail and Wholesale Sectors
When the survey data is extrapolated to represent the entire U.S. retail and wholesale sectors, the total amount of food waste generated in 2011 was 3.8 billion pounds. More than half (2.1 billion pounds or 55.6%) was donated or recycled, with 1.7 billion pounds disposed in landfills or incinerators, as shown in Figure 4. Figure 4. Amount of Food Waste Generated in the Retail and Wholesale Sectors, by Destination (in millions of pounds)
0
500
1,000
1,500
2,000
2,500
3,000
3,500
4,000
Donated, 17.9% (670 million lbs)
Recycled, 37.7% (1.4 billion lbs)
Disposed, 44.4% (1.7 billion lbs)
0%
10%
20%
30%
40%
50%
60%
70%
80%
90%
100%
Donated, 2%
Animal Feed, 73%
Land Application, 20%
Composting, 2%
Other, 4%

BSR | Analysis of U.S. Food Waste Among Food Manufacturers, Retailers, & Wholesalers 11
It should be noted, however, that food waste diversion and disposal rates vary significantly across individual companies and may not align with the average industry diversion rate shown in Figure 4. Table 4 provides the average, lowest, and highest responses among survey participants, for each food waste destination. As with the manufacturing sector, the variability in responses highlights the importance of sharing best practices throughout the industry. Table 4. Variability in the Percentage of Food Waste Donated, Recycled, and Disposed Among Retail and Wholesale Sector Respondents
Minimum Average Maximum
Percentage Donated 9% 18% 66%
Percentage Recycled 0% 38% 69%
Percentage Disposed 13% 44% 83%
Figure 5 below provides additional details about the methods the retail and wholesale sectors use to divert food waste to higher uses. In 2011, composting was the most common diversion method, representing 43 percent of food waste diversion, followed by donation at 32 percent. (Please note that the totals may not add up to 100 percent because they were rounded for inclusion in the figure.) Figure 5. Destination of Diverted Food Waste, Retail and Wholesale Sectors (as a percentage of the amount of food waste diverted) The food waste profile of the retail and wholesale sectors reflects the industry’s unique operating conditions. Retailers, for example, have numerous locations and a very diverse range of products. As a result, food waste diversion is a significant management and logistical challenge. In addition, each department within a store has its own food diversion requirements, adding further complexity. In addition, retailers primarily handle finished food products, which are often packaged. Packaged products are more suitable for donation and are harder to recycle because most recyclers require that the packaging be removed. The predominance of finished food products is one of the factors contributing to retailers’ and wholesalers’ high donation rate (17.9% of food waste generated, as shown in Figure 4). The case-studies box below highlights actions by three retailers to divert food waste.
0%
10%
20%
30%
40%
50%
60%
70%
80%
90%
100%
Donated, 32%
Animal Feed, 11%
Composting, 43%
Other, 14%

BSR | Analysis of U.S. Food Waste Among Food Manufacturers, Retailers, & Wholesalers 12
Food Waste Disposal
Based on our extrapolation of data from survey respondents, food manufacturers, wholesalers, and retailers together disposed of a total of 4.1 billion pounds of food waste in the United States in 2011 (2.4 billion pounds in the manufacturing sector and 1.7 billion pounds in the retail and wholesale sectors). Certainly not all of this food was suitable for human consumption, and both sectors already donate significant amounts to food banks (700 million pounds in the manufacturing sector and 670 million pounds in the retail and wholesale sectors, for a total of nearly 1.4 billion pounds in 2011). On average, in 2011, approximately 20 percent of the municipal waste produced by the manufacturing sector was food waste, and approximately 33 percent of the municipal waste produced by the retail and wholesale sectors was food
Case Studies: Reducing Food Waste in the Grocery Retail Sector
The Kroger Co.: Converting Organics to Renewable Energy Kroger’s West Coast banner, Ralphs/Food for Less, will soon be powering their Compton, California, distribution center with electricity generated from unsold organics, such as inedible food and food waste. This innovative resource-recovery system is expected to convert more than 55,000 tons of unsold organics into renewable energy.
Ralphs/Food for Less stores backhaul organics that are unsuitable for sale or donation to the distribution center. They are then combined with wastewater from the on-site food-manufacturing plant and introduced into the 2-million-gallon on-site anaerobic digestion tank, which converts the carbon in the material to biogas. This renewable energy is then converted into electricity, offsetting a portion of the distribution center’s energy demand. By recycling unsold organics in this manner, Kroger is able to reduce costs, generate clean energy on-site, recycle valuable nutrients for use on local farmlands, avoid sending organic materials to the landfills, and cut the number of miles they haul waste. SUPERVALU: Promoting and Tracking Food Donations The SUPERVALU Fresh Rescue food-donation program has expanded throughout the company’s entire store network, including a pilot program at Save-a-Lot stores. Donating food to those in need and collecting data about the SUPERVALU waste stream are the primary drivers for this expansion. Stores are encouraged to partner with agencies affiliated with Feeding America to enable proper data collection and to ensure that agencies adhere to food safety and ethical requirements.
By quantifying how much food is being donated and diverted, the program has even helped SUPERVALU’s internal teams better understand shrink. As SUPERVALU staff measure the waste stream and participate in programs like the EPA Food Recovery Challenge, the company can better understand opportunities to reduce waste-hauling expenses through recycling and to change purchases so that any waste can be recycled, reused, or eliminated altogether. Wegmans: Utilizing Compost in Organic Farming Wegmans operates their own small organic farm, which supplies vegetables to several of their nearby stores. The farm produces compost, which is applied seasonally to the crops as a soil enhancement. Stores in the region send food waste to a local biofuel processor, who is able to convert organic waste into ethanol. Residuals from this process are then sent to Wegmans’ farm and are added to the compost, closing the loop.

BSR | Analysis of U.S. Food Waste Among Food Manufacturers, Retailers, & Wholesalers 13
waste. However, the percentage of municipal waste that is food waste varied widely from company to company, as shown in Tables 5 and 6. It is important to note that many companies have significantly reduced their waste volumes over time by diverting aluminum, cardboard, and other recyclables. These companies, perhaps counter intuitively, then see increases in the relative percentage of food in the waste stream because they have reduced their total waste volume. A high percentage of food in a company’s waste stream may represent an opportunity for greater food waste diversion, but it may also result from their significant diversion of recyclable materials. Table 5. Percentage of Total Municipal Waste that is Food Waste, Manufacturing Respondents
Percentage of Municipal Waste that is Food Waste
Minimum 0%
Average 23%
Maximum 60%
Table 6. Percentage of Total Municipal Waste that is Food Waste, Retail and Wholesale Respondents
Percentage of Municipal Waste that is Food Waste
Minimum 14%
Average 34%
Maximum 83%
Sending food waste to landfills is not only a significant cost, but it also represents a lost opportunity to recover economic and ecological value. Tables 7 and 8 include rough estimates of disposal costs; this estimate is for illustrative purposes only because it is restricted to landfill tipping fees and does not consider the costs of collecting, storing, and hauling food waste. In addition, landfill tipping fees vary significantly from region to region within the United States. Moreover, when food is buried in a landfill, the resources that went into producing that food (for example, the water and energy used to grow, cultivate, and harvest it) are lost too. Adding these costs to the cost of sending food waste to landfills makes the economic equation even more lopsided. Table 7. Extrapolated Disposal Weight and Costs, Manufacturing Sector
Manufacturing Sector
Estimated Amount Disposed in the U.S., 2011 2.4 billion pounds
Estimated Nationwide Tipping Cost* $59 million
Average Cost per Survey Respondent* $750,000

BSR | Analysis of U.S. Food Waste Among Food Manufacturers, Retailers, & Wholesalers 14
Table 8. Extrapolated Disposal Weight and Costs, Retail and Wholesale Sectors
Retail and Wholesale Sectors
Estimated Amount Disposed in the U.S., 2011 1.7 billion pounds
Estimated Nationwide Tipping Cost* $42 million
Average Cost per Survey Respondent* $960,000
* The cost used to derive this estimate is based on a 2012 national average tipping cost for the largest public and private landfills of $49.27 per ton (4.9 cents per pound), from Waste and Recycling News.

BSR | Analysis of U.S. Food Waste Among Food Manufacturers, Retailers, & Wholesalers 15
Comparison with Secondary Data from the Tier 1 Analysis
The Tier 1 analysis undertaken by BSR was a comparative assessment of the secondary data available about the sources of food waste in the United States, from postagriculture to fork. It was based on existing data and required a number of assumptions and extrapolations to estimate food waste. The survey data that GMA and FMI members provided has allowed us to update several key portions of the Tier 1 assessment with more accurate and more recent information, as described below. Tier 1 and the primary (Tier 2) data should be compared with caution. Differences in the data are not representative of changes in disposal amounts. Rather, they represent significant improvements in data collection—but only for the grocery store and industrial sectors (the latter encompasses manufacturing). The Tier 1 analysis was based primarily on extrapolations from a cross section of national, international, and state-level estimates, while this subsequent analysis is based on waste volumes that companies operating in the United States reported. Of course, opportunities remain for continued improvement in data collection; please see “Considerations for Enhancing Data Collection” for additional discussion of this topic. It is important to note that only the grocery store and industrial (i.e. food manufacturing) data sets in the figures below are updated with numbers from the survey. All others remain the same. However, the restaurant sector totals will be updated upon collection of primary survey data, which the FWRA anticipates collecting as part of their 2013 food waste survey. Food Waste Disposed
For food waste sent to landfills and incinerators, the Tier 1 data is shown in Figure 6, and the updated data is shown in Figure 7. Figure 6.
Industrial1,320 2%
Grocery stores8,684 11%
Full-service restaurants
15,851 20%
Quick-service restaurants
10,780 13%
Institutional8,000 10%
Residential34,740 44%
Tier 1 estimate of food waste disposed in the U.S. (million pounds)

BSR | Analysis of U.S. Food Waste Among Food Manufacturers, Retailers, & Wholesalers 16
Figure 7.
Comparing the two data sets, the estimates of food waste disposal from the manufacturing sector (called “industrial” in Tier 1) are relatively similar across analyses (1.3 billion pounds in Tier 1 vs. 2.4 billion pounds in Tier 2). However, the estimates for the retail and wholesale sectors (called “grocery stores” in Tier 1) differ significantly (8.6 billion pounds in Tier 1 vs. 1.6 billion pounds in Tier 2). A key factor in this difference is the set of assumptions that had to be made to calculate Tier 1 food waste disposal for the grocery and restaurant sectors. Because little information about food waste disposal exists for these sectors, the only data available for extrapolation was one study of several urban sites in California.3 In addition, the analysis required assumptions about the relative amounts of commercial and residential waste sent to municipal landfills. These limitations contributed to the substantial differences between Tier 1 and Tier 2, and the same will likely be the case for the restaurant food waste data when we update it in future years. Future FWRA surveys will continue to provide accurate data on food waste in the manufacturing, retail and wholesale, and restaurant sectors, improving each sector’s ability to track its progress over time.
3 “Targeted Statewide Waste Characterization Study: Waste Disposal and Diversion Findings for
Selected Industry Groups,” California Integrated Waste Management Board, 2006, www.calrecycle.ca.gov/wastechar/wastestudies.htm#2006Industry.
Industrial2,411 3%
Grocery stores1,664 2%
Full-service restaurants
15,851 22%
Quick-service restaurants
10,780 15%Institutional
8,000 11%
Residential34,740 47%
Tier 1 estimate of food waste disposed in the U.S., updated with Tier 2 data for the "Industrial" and
"Grocery Stores" segments (million pounds)

BSR | Analysis of U.S. Food Waste Among Food Manufacturers, Retailers, & Wholesalers 17
Barriers to Food Waste Diversion
As noted previously, companies have several opportunities to continue to reduce the amount of food waste they generate and to direct more food waste to higher uses, as outlined in the EPA’s Food Waste Recovery Hierarchy. In the manufacturing sector, companies have opportunities to reduce the amount of food waste they generate and increase the percentage they donate. In the retail and wholesale sectors, companies have an opportunity to divert more waste from landfills. However, a number of barriers prevent the diversion of additional food waste. The survey included questions about barriers to food waste diversion, and participants’ responses are summarized below. Addressing these barriers will require many different approaches; some, for example, are infrastructure- or policy-related barriers that require collective action. In other cases, more straightforward approaches like sharing best practices or improving education will be sufficient.
Barriers to Donating Food
More than three-quarters (77 percent) of respondents indicated that there are barriers, either internal or external, that prevent their company from donating more unsaleable food. Table 9 outlines the specific types of barriers that companies face. The most common barrier highlighted by each sector is bolded.
Table 9. Barriers to Donating Food
Manufacturing Retail and Wholesale
Transportation constraints 63% 42%
Liability concerns 50% 67%
Insufficient storage and refrigeration at food banks
50% 50%
Regulatory constraints 50% 17%
Insufficient on-site storage and refrigeration
38% 33%
Some of the specific barriers cited by respondents are highlighted below, grouped into categories in order to best reflect the breadth of barriers:
» Storage and transportation:
- Insufficient space and refrigeration at food banks - Lack of refrigerated trucks and drivers - Justifying cost of transportation and/or on-site holding areas
» Liability and food safety:
- Ability to donate misformulated and semi-finished products - Chain of custody in case of recall - Concerns despite Good Samaritan protection

BSR | Analysis of U.S. Food Waste Among Food Manufacturers, Retailers, & Wholesalers 18
» Regulatory and external policy:
- Good food past saleable date - Limitations on what food banks will accept - Inability to donate private-label items without customer approval
» Financial:
- Decisions to limit write-off expenses at fiscal year-end - Justification of fair market value for unconventional donations - Tax-deduction risks
» Behavioral and internal policy:
- Company policies - Employee education - Internal resistance to change
Barriers to Recycling Food Waste
Twenty-three of 26 respondents (88 percent) indicated that there are barriers, either internal or external, that prevent their company from reusing and recycling more food waste. Table 10 outlines the specific types of barriers that companies face.
Table 10. Barriers to Recycling Food Waste
Manufacturing Retail and Wholesale
Insufficient recycling options 91% 83%
Transportation constraints 73% 75%
Liability concerns 55% 50%
Concerns about collection and storage related to food safety
36% 50%
Some of the specific barriers cited by respondents include:
» Storage and transportation:
- Lack of on-site storage space - Lack of nearby recycling options - Limited number and availability of food waste haulers
» Liability:
- Risks from downstream misuse of food waste - Concerns about chain of custody of materials - Partner and customer-safety policies taking precedence
» Food safety assurance:
- Employee work conditions and their overall health - Safety of reworking products for human consumption - Safety of food for animal consumption

BSR | Analysis of U.S. Food Waste Among Food Manufacturers, Retailers, & Wholesalers 19
» Financial:
- Justifying cost of transportation and/or on-site holding areas - High price of machines to separate food waste from packaging - Tipping fees not offset by the costs of diversion
» Behavioral and internal policy:
- Company policies - Employee education

BSR | Analysis of U.S. Food Waste Among Food Manufacturers, Retailers, & Wholesalers 20
Next Steps
The survey data submitted by GMA and FMI members is the first set of industry-wide, corporate-level food waste data gathered directly from U.S. food manufacturers, retailers, and wholesalers. As the FWRA evaluates these results and collects more data, there will be opportunities for taking action as well as enhancing data collection. Opportunities for Taking Action
As noted earlier, one of the FWRA’s goals is to identify opportunities to share best practices and collaborate to advance solutions that keep food waste out of landfills and ensures that edible food is donated. The following are some ways companies can take action:
» The survey highlighted significant differences in food donation and recycling rates from company to company. Companies can use the data in this report to benchmark themselves against their peers; determine if their diversion, donation, and disposal rates are comparatively high or low; and share targeted success stories and lessons they have learned.
» Survey participants identified many different barriers, and a myriad of collaborative opportunities could follow. For instance, a group of companies could focus on logistical solutions, such as opening a composting facility near a cluster of food manufacturing facilities. Policy change may also be achieved collaboratively; for example, changing tax policies to encourage additional food donation. In addition, shared educational platforms may help companies overcome internal barriers to change.
Considerations for Enhancing Data Collection
This assessment significantly increases the amount of food waste data available for the U.S. manufacturing sector and retail/wholesale sectors. There are several aspects, however, to consider when collecting data again in future years:
» Number of participants: Increasing the number of GMA, FMI, and NRA members who participate in the survey will enable the FWRA to estimate the amount and destination of food waste more accurately. In addition, for the restaurant sector, involving more participants will allow the FWRA to report the data publicly.
» Additional baselines: This year’s survey allowed the FWRA to assess food waste in relation to company revenue and number of employees. Additional factors may help companies understand their food waste profile and compare it with that of their peers, using baselines such as the number of stores (for retailers) or the total amount of food produced (for manufacturers).
» Separating wholesale and retail: Because of limitations in the number of wholesale respondents and concerns about data confidentiality, we combined the wholesale and retail sectors for this assessment. In future years, these sectors should be separated for individual analysis.
BSR | Analysis of U.S. Food Waste Among Food Manufacturers, Retailers, & Wholesalers 21
Appendix A: Additional Details about the Analysis
Below are several key assumptions and other factors which may impact the results presented in this document:
» Accuracy of reported survey data: Participants reported varying levels of confidence in the data they provided. As part of the survey, they were asked to self-report the accuracy of their responses on a scale of 1 to 10, where 10 is most confident. On average they responded 7.5 for their food donation data and 7.7 for their food recycling data, but lower for food waste disposal data, averaging 5.0. In addition, as in any survey, misinterpretations of the survey questions and inadvertent errors are possible.
» Composition of respondents: For the purposes of this analysis, we assumed that the survey respondents were sufficiently representative of the U.S. industry as a whole, meaning that their responses can reasonably be extrapolated to the entire industry. As noted previously, respondents represent 17 percent of the U.S. manufacturing sector and 30 percent of the retail and wholesale sectors.
» Reported revenue: The extrapolation of participants’ responses to the broader U.S. food manufacturing sector and retail/wholesale sectors is based on the annual U.S. corporate revenue they reported. Because of confidentiality limitations, we were unable to confirm any adjustments the reported revenue may have needed (for example, to correct for the inclusion of non-U.S. revenue or revenue from nonfood businesses). Moreover, respondents provided revenue data for 2011, while the extrapolation was based on 2010 industry-wide revenue data.4 In addition, the type of retailers included in the public data differs somewhat from the set of respondents. For the purposes of this analysis, the retail sector includes supermarkets, supercenters, club stores, and smaller grocery stores, but it excludes convenience stores.
» Inconsistent sample size per question: Not all survey participants answered every question. We therefore calculated a mean response to each question as a surrogate for missing data, which allowed us to make relative comparisons across the data set.
4 Revenue data was gathered from the Census Bureau’s “Annual Survey of Manufactures,”
Progressive Grocer’s “79th Annual Report of the Grocery Industry,” and IBISWorld’s “Grocery Wholesaling in the U.S.”

BSR | Analysis of U.S. Food Waste Among Food Manufacturers, Retailers, & Wholesalers 22
Appendix B: GMA and FMI Survey
2012 Food Manufacturer and Retailer Food Donation & Food Waste Survey
Every year Americans dispose of approximately 80 billion pounds of food waste and very little of that waste is recovered. This means that for the 312.7 million people in the U.S., over 250 pounds of food per person is thrown out every year. Food sent to a landfill represents lost opportunities to improve management efficiencies, to reduce operating costs, to feed the hungry, to recover valuable resources, and to realize other benefits. The Grocery Manufacturers Association (GMA) and Food Marketing Institute (FMI) are partnering with the National Restaurant Association (NRA) and other stakeholders in order to address this important issue. The GMA/FMI Food Waste Opportunities and Challenges Initiative has two goals, which are to reduce the amount of food waste sent to landfills and increase the amount of unsaleable food donated to food banks. The purpose of this survey is to better understand how much food is being donated, how much food waste is being recycled or recovered, and how much is sent to landfills and other waste disposal facilities in the United States. 1. General Information: General information regarding the size of your company is needed in order to analyze
the data, and to make industry-wide assumptions after the data is aggregated. Please provide a point of contact so that we may follow up with you, if needed. All information will be kept confidential using our third party attorney and consulting firm. a) Company name ________________________. b) Annual U.S. sales (US$) ________________ Fiscal Year __________. c) Number of U.S. employees (rounded to the nearest thousand) ___________________. d) Is your company (please check the right answer):
___ A food manufacturer only ___ A food retailer only ___ Primarily a food manufacturer, but also a food retailer ___ Primarily a food retailer, but also a food manufacturer ___ Both a food manufacturer and a food retailer, to the same extent
e) Point of contact information (name) __________________________________ Point of contact (phone number and email): ______________________________
2. Unsaleable Food Donations for Human Consumption: Unsaleable food may be generated throughout the
manufacturing and retail value chain. For instance, mistakes during production may result in food that is perfectly safe and delicious, but not saleable due to quality, over production or labeling issues. Product ingredients and semi-finished products that are not suitable for retail but are safe for human consumption may also be donated. The outer packaging of grocery items may become damaged during distribution and retail operations, thus making them unsuitable for sale but still perfectly safe to eat. Fresh food items such as day old bread, produce with blemishes, prepared foods and other perishable items that are near sell-by dates such as milk, juices and fresh meats may also be unsuitable for sale, but safe for consumption. Please only include unsaleable food in your answer below. Do not include food that is produced expressly for donation, purchased food provided by customers or employees expressly for donation, or any food that is donated to organizations if it is still suitable for retail sale.
a) What is the total weight in pounds of unsaleable food donated for human consumption by all of your
company’s U.S. operations during calendar year 2011? If you do not know the exact amount, please provide as accurate an estimate as possible. Donations in pounds:_________________________ lbs
b) Please use the following scale to indicate the accuracy of your answer to Question 2(a).
Number one on the scale indicates that your answer is a best guess based on experience, not measured data. Number five indicates that your answer is based on some measured data

BSR | Analysis of U.S. Food Waste Among Food Manufacturers, Retailers, & Wholesalers 23
used to extrapolate a somewhat accurate answer. Number ten means that your answer is based on actual measures that are believed to be very accurate. Please circle one number: 1 – 2 – 3 – 4 – 5 – 6 – 7 – 8 – 9 – 10
c) Are there barriers, either internal or external, that prevent your company from donating more unsaleable food? For example: liability concerns, regulatory constraints, food bank limitations (i.e. insufficient refrigeration, transportation, etc.). Yes____No____
If yes, please check all that apply and explain in the space below or by attaching a separate page. Liability concerns Yes____No____ Regulatory constraints Yes____No____ Insufficient refrigeration and/or storage onsite Yes____No____ Insufficient refrigeration and/or storage at Food Bank Yes____No____ Transportation constraints (distance, cost, fleet, etc.) Yes____No____ Other barriers (please list) Yes____No____ Please explain here or attach a separate page:
3. Food Waste Reuse and Recycling: For purposes of completing this survey, food waste has been defined
as: any solid or liquid food substance, raw or cooked, which is discarded, or intended or required to be discarded. Food wastes are the organic residues generated by the processing, handling, storage, sale, preparation, cooking, and serving of foods.
a) What is the total weight in pounds of food waste reused or recycled by all of your company’s
U.S. operations during calendar year 2011? If you do not know exact amounts, please provide as accurate an estimate as possible. Please provide a total weight and breakdown by category, if possible:
Animal Feed __________ lbs. Aerobic/Anaerobic Digestion __________ lbs. Composting __________ lbs. Land Application __________ lbs. Onsite Energy Recovery (such as fuel for a boiler that produces process steam) __________ lbs. All Other (describe:______) __________ lbs. Total __________ lbs.
b) Please use the following scale to indicate the accuracy of your answers to Question 3(a). Number one on the scale indicates that overall your answers are best guesses based on experience, not measured data. Number five indicates that your answers are based on some measured data used to extrapolate somewhat accurate answers. Number ten means that your answers are based on actual measures that are believed to be very accurate Please circle one number: 1 – 2 – 3 – 4 – 5 – 6 – 7 – 8 – 9 – 10
c) Are there barriers, either internal or external, that prevent your company from reusing and
recycling more food waste? For example: liability concerns, limited access to organics recyclers, food safety concerns, etc. Yes____ No_____
If yes, please check all that apply and explain in the space below or by attaching a separate page. Liability concerns Yes____No____ Food safety concerns regarding collection and storage Yes____No____ Insufficient recycling options Yes____No____

BSR | Analysis of U.S. Food Waste Among Food Manufacturers, Retailers, & Wholesalers 24
Transportation constraints (distance, cost, fleet, etc.) Yes____No____ Please explain here or attach a separate page:
4. Food Waste Disposal: This includes all food wastes, as defined above, that are transported to traditional disposal facilities such as landfills, municipal waste incinerators and wastewater treatment plants. Include finished products that are disposed due to recall. Do not include food waste listed in the question above as reused or recycled. Also, do not include organic waste disposed through on-site sanitary sewers due to routine processes such as cleaning and sanitation; however, do include finished food products that are disposed by pouring down the sanitary sewer drain. If you do not know the exact amount of food waste disposed, please provide as accurate an estimate as possible. a) What is the total weight in pounds of food waste transported to disposal facilities such as
landfills, municipal waste incinerators and wastewater treatment plants by all of your company’s U.S. operations during calendar year 2011? Food waste disposal in pounds:_________________________ lbs
b) Please use the following scale to indicate the accuracy of your answer to Question 4(a). Number
one on the scale indicates that your answer is a best guess based on experience, not measured data. Number five indicates that your answer is based on some measured data used to extrapolate a somewhat accurate answer. Number ten means that your answer is based on actual measures that are believed to be very accurate. Please circle one number: 1 – 2 – 3 – 4 – 5 – 6 – 7 – 8 – 9 – 10
c) What is the total weight in pounds of all municipal waste (i.e. all garbage, including food waste, but not including RCRA regulated materials such as hazardous wastes) transported to disposal facilities such as landfills, municipal waste incinerators and wastewater treatment plants by all of your company’s U.S. operations during calendar year 2011? Total waste disposal in pounds:_________________________ lbs