
Analysis of the Situational Judgement Test for Selection ... · Analysis of the Situational...
53
FP 2015 SJT Technical Report May 2015 © 2015 Work Psychology Group 1 Analysis of the Situational Judgement Test for Selection to the Foundation Programme 2015 Technical Report Prof Fiona Patterson Amy Aitkenhead Helena Edwards (née Murray) Charlotte Flaxman Rachael Shaw Anna Rosselli June 2015
Transcript of Analysis of the Situational Judgement Test for Selection ... · Analysis of the Situational...
FP 2015 SJT Technical Report May 2015 © 2015 Work Psychology Group 1
Analysis of the Situational Judgement Test for Selection to the Foundation Programme 2015 Technical Report
Prof Fiona Patterson
Amy Aitkenhead
Helena Edwards (née Murray)
Charlotte Flaxman
Rachael Shaw
Anna Rosselli
June 2015
FP 2015 SJT Technical Report May 2015 © 2015 Work Psychology Group 2
Table of Contents
1. Introduction ....................................................................................................................... 4
1.1 Purpose and structure of report ............................................................................................. 4
1.2 Background ............................................................................................................................. 4
Part One: Item development ...................................................................................................... 6
2. Development of trial items ............................................................................................................ 6
2.1 Process overview ..................................................................................................................... 6
2.2 Item development interviews ................................................................................................. 6
2.3 Item review ............................................................................................................................. 9
2.4 Review workshops .................................................................................................................10
2.5 Concordance panels ..............................................................................................................11
Part Two: Scoring, Analysis and Evaluation ............................................................................... 14
3. Operational test structure and construction ………………………………………………………………………….14
3.1 Test construction overview ….………………………………………………………………………………………….14
3.2 Spread of items across papers………………………………………………………………………………….………14
3.3 Equality and diversity review……………………………………………………………………………………….…..16
3.4 Current status of items within operational item bank……………………………………………………...18
4. Scoring and test equating ............................................................................................................19
5. Analysis ........................................................................................................................................20
5.1 Purpose..................................................................................................................................20
5.2 Evaluation Overview..............................................................................................................20
5.3 Sample ...................................................................................................................................20
5.4 Test completion analysis ......................................................................................................23
5.5 Operational test level analysis ............................................................................................ 24
5.6 Operational item level analysis .............................................................................................27
5.7 Group differences ..................................................................................................................31
5.8 Differential-item functioning.................................................................................................36
5.9 Correlations with EPM ...........................................................................................................38
FP 2015 SJT Technical Report May 2015 © 2015 Work Psychology Group 3
5.10 Item level analysis – trial items ...........................................................................................38
5.11 Applicant reactions ..............................................................................................................45
Part Three: Summary and Recommendations ............................................................................ 47
6. Summary ......................................................................................................................................47
7. Alternative approach to scoring .................................................................................................48
8. SME involvement .........................................................................................................................49
9. Item writing methodology ...........................................................................................................49
10. Scoring and scaling ....................................................................................................................50
11. Perceptions of Scoring and scaling…………………………….………………………………………………………….50
Appendix 1…………………………………………………………………………………………………………………………………51 12. Modelling of alternative scoring……………………………………………………………………..…………………….51
FP 2015 SJT Technical Report May 2015 © 2015 Work Psychology Group 4
1 Introduction
1.1 Purpose and Structure of the Report
1.1.1 The Foundation Programme (FP) Situational Judgement Test (SJT) was delivered for entry to FP
2015 between December 2014 and January 2015, over three administration sessions. The SJT, in
combination with the Educational Performance Measure (EPM)1, was used to rank applicants
applying for Foundation Year One (F1) training and allocate them to foundation schools. This is
the third year during which the SJT has been used operationally.
1.1.2 The SJT must be developed and validated in accordance with accepted best practice, so that it
provides an effective, rigorous and legally defensible method of selection. This technical report
therefore provides an overview of the results from the operational delivery of the FP 2015 SJT.
The report is divided into three main parts:
Part One describes the development process of items that were trialled alongside the
operational SJT.
Part Two describes the results and analysis of the operational SJT, as well as initial analysis of
the trial items.
Part Three provides a summary and recommendations.
1.2 Background
1.2.1 The FP is a two-year generic training programme, which forms the bridge between medical
school and specialist/general practice training. In 2008 'The Next Stage Review: A High Quality
Workforce’2 advised the development of more reliable and valid selection tools for selection to
FP training. In response, the Medical Schools Council (MSC) was commissioned by the
Department of Health to lead a cross-stakeholder steering group to undertake an Option
Appraisal3 of the approaches available to select applicants to the UK FP. This extensive Options
Appraisal showed an SJT in combination with the EPM to be the most effective and efficient way
to select applicants.
1.2.2 Throughout 2010-2011 the SJT and EPM were defined, developed and piloted, with the results
analysed and evaluated. A full-scale pilot of the SJT for selection to the FP, titled the ‘Parallel
Recruitment Exercise’4, concluded that the SJT was an appropriate methodology to be used
within this context. A report produced in August 2011 on the design, analysis and evaluation of
an SJT for selection to the FP included the specification of the domains to be targeted in the SJT5.
1 The EPM is a measure of the clinical and non-clinical skills, performance and knowledge of applicants up to the
point of their application. It takes into account medical school performance, additional degrees and publications. 2 A high quality workforce: NHS Next Stage review (2008). Department of Health.
3 See http://www.isfp.org.uk/ISFPDocuments/Pages/OptionAppraisal.aspx for Options Appraisal report.
4 See http://www.isfp.org.uk/ISFPDocuments/Pages/PREReport.aspx for Parallel Recruitment Exercise report.
5 See F1 Job Analysis report 2011 for full details of how domains were derived and what comprises each domain
(http://www.isfp.org.uk/ISFPDocuments/Pages/FinalreportofPilots.aspx).
FP 2015 SJT Technical Report May 2015 © 2015 Work Psychology Group 5
1.2.3 The SJT was initially introduced to the FP selection process for entry to FP 2013, and following
each operational use of the SJT, technical reports are produced6 to enable ongoing monitoring of
the test’s suitability to be used in this context.
6 See Patterson, F., Ashworth, V., Murray, H., Empey, L., & Aitkenhead, A. (2013). Analysis of the Situational
Judgement Test for Selection to the Foundation Programme 2013: Technical Report. See Patterson, F. Murray, H., Baron, H., Aitkenhead, A., & Flaxman, C. (2014). Analysis of the Situational Judgement Test for Selection to the Foundation Programme 2014: Technical Report.
FP 2015 SJT Technical Report May 2015 © 2015 Work Psychology Group 6
Part One: Item Development
2 Development of Trial Items
2.1 Process Overview
2.1.1 To ensure that there is a sufficient number of items within the item bank to support operational
delivery, and to continually refresh and replenish the bank with a wide range of relevant and
current scenarios, trialling of new items takes place alongside the operational SJT each year.
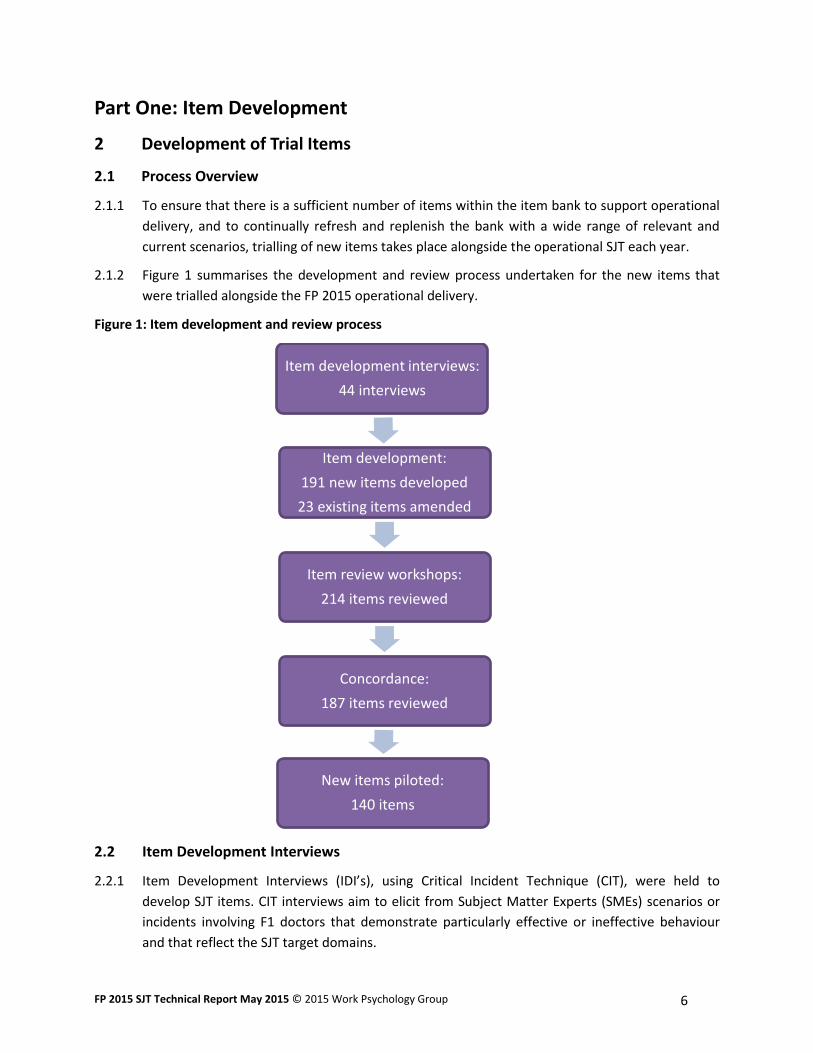
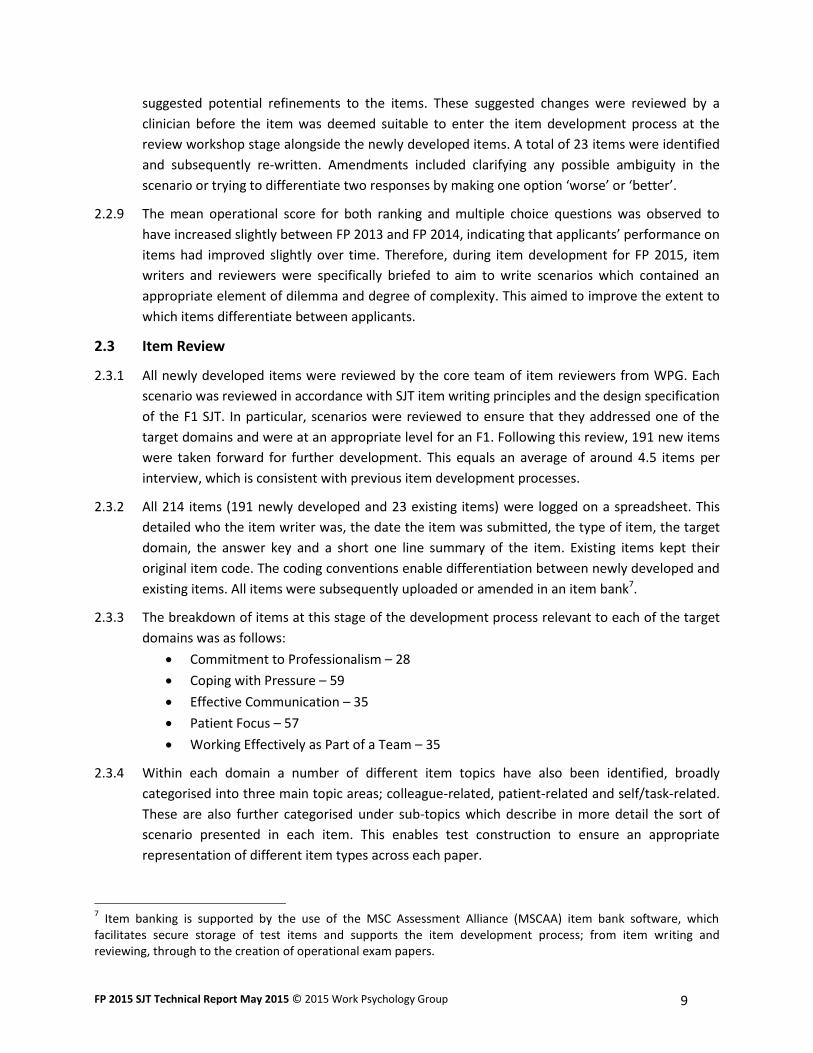
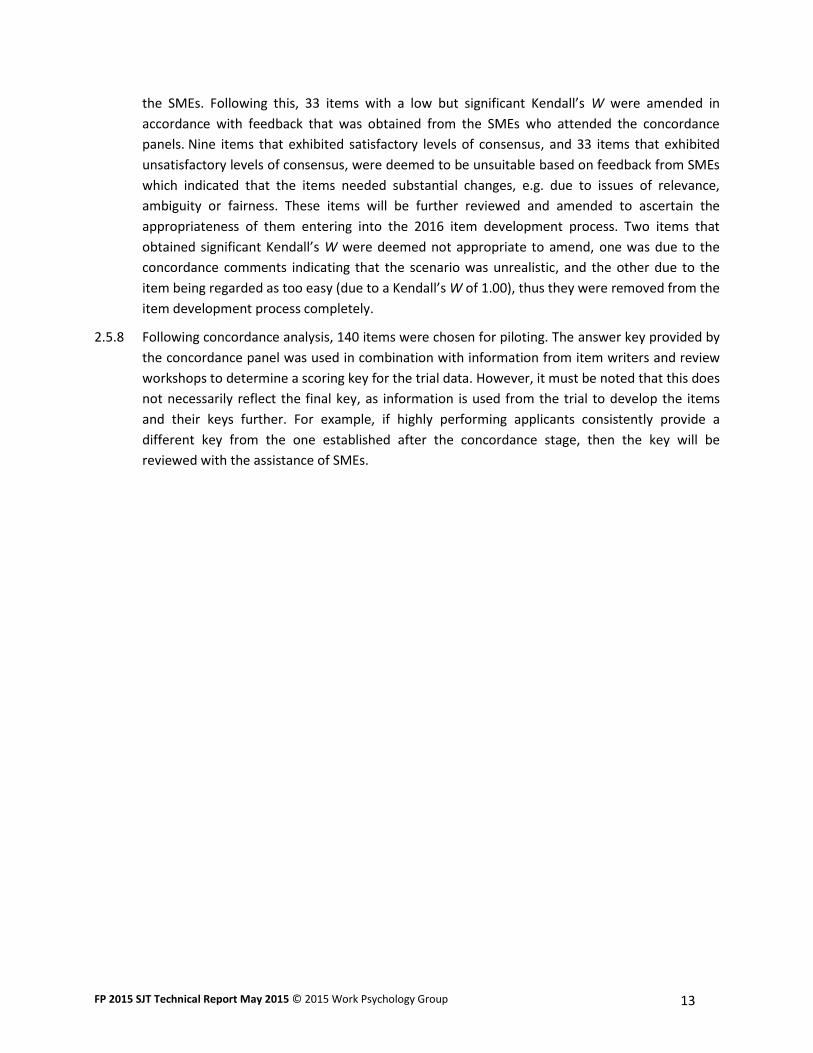
2.1.2 Figure 1 summarises the development and review process undertaken for the new items that
were trialled alongside the FP 2015 operational delivery.
Figure 1: Item development and review process
2.2 Item Development Interviews
2.2.1 Item Development Interviews (IDI’s), using Critical Incident Technique (CIT), were held to
develop SJT items. CIT interviews aim to elicit from Subject Matter Experts (SMEs) scenarios or
incidents involving F1 doctors that demonstrate particularly effective or ineffective behaviour
and that reflect the SJT target domains.
Item development interviews:
44 interviews
Item development:
191 new items developed
23 existing items amended
Item review workshops:
214 items reviewed
Concordance:
187 items reviewed
New items piloted:
140 items
FP 2015 SJT Technical Report May 2015 © 2015 Work Psychology Group 7
2.2.2 Using interviews such as these has a number of benefits, including involvement of a broad range
of individuals in the design process from across the country, without the need for a significant
commitment in terms of time and effort.
2.2.3 Prior to the interviews taking place, a review of the current operational bank (n=214), containing
items that were established through the previous trials (between 2010 and 2014), was carried
out. This included a review of the spread of target domains and topic areas. The aim of this
review was to focus item writing on under-represented domains or topic areas and to identify
topic areas to be avoided, due to over-representation.
2.2.4 A new method of recruiting volunteers was implemented in 2014, which involved asking leads
within the Foundation Schools to each nominate five SMEs to participate in the item
development process. This resulted in an increase in interest from clinicians at all stages of the
item development process in comparison to previous years. Individuals who had previously been
involved, or had expressed an interest in being involved in the process were also invited to take
part in the interviews.
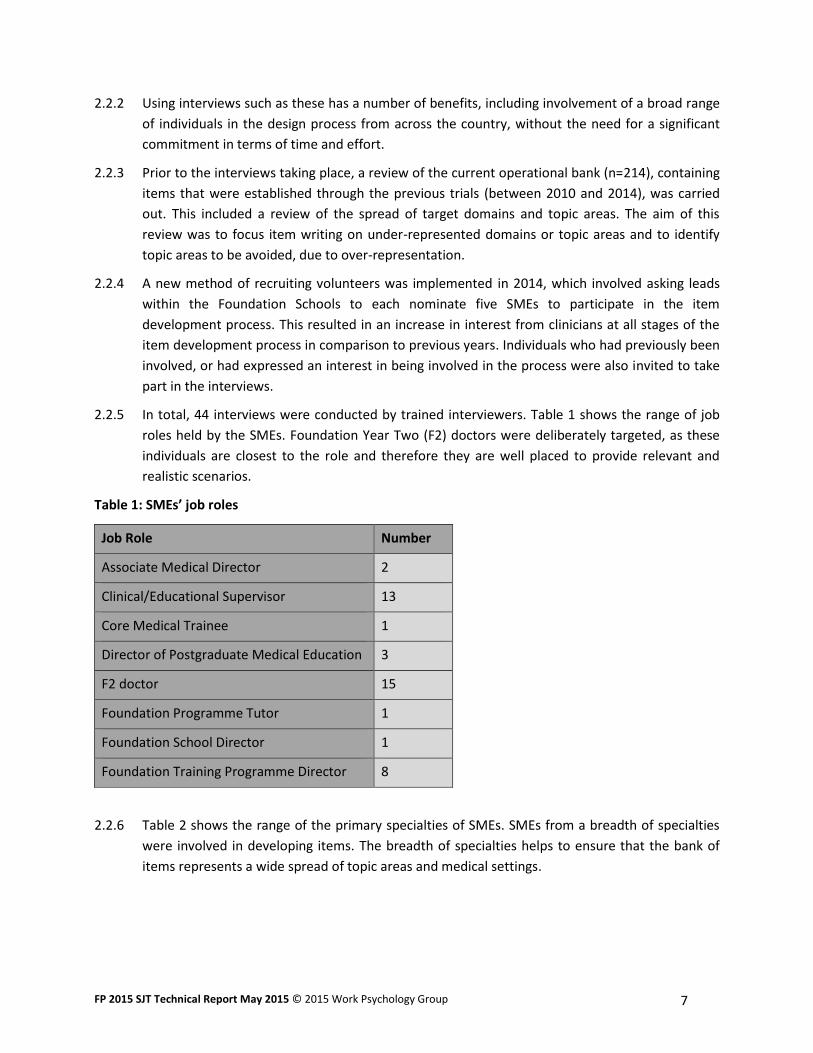
2.2.5 In total, 44 interviews were conducted by trained interviewers. Table 1 shows the range of job
roles held by the SMEs. Foundation Year Two (F2) doctors were deliberately targeted, as these
individuals are closest to the role and therefore they are well placed to provide relevant and
realistic scenarios.
Table 1: SMEs’ job roles
Job Role Number
Associate Medical Director 2
Clinical/Educational Supervisor 13
Core Medical Trainee 1
Director of Postgraduate Medical Education 3
F2 doctor 15
Foundation Programme Tutor 1
Foundation School Director 1
Foundation Training Programme Director 8
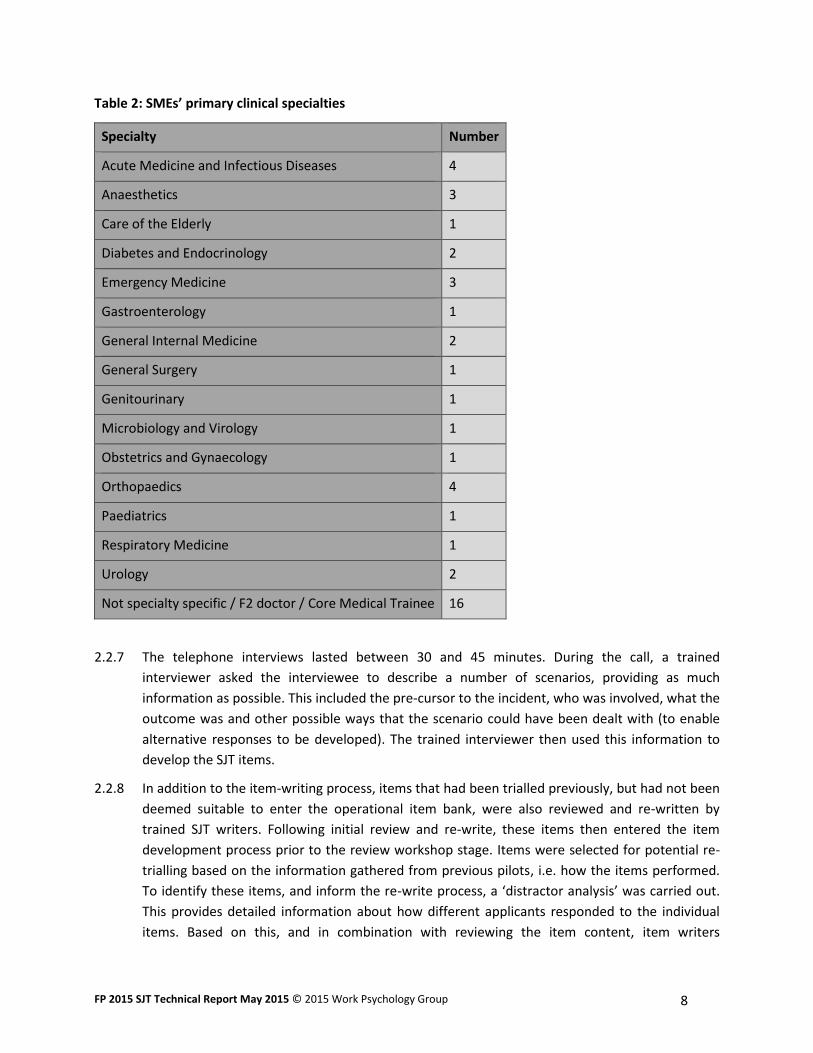
2.2.6 Table 2 shows the range of the primary specialties of SMEs. SMEs from a breadth of specialties
were involved in developing items. The breadth of specialties helps to ensure that the bank of
items represents a wide spread of topic areas and medical settings.
FP 2015 SJT Technical Report May 2015 © 2015 Work Psychology Group 8
Table 2: SMEs’ primary clinical specialties
Specialty Number
Acute Medicine and Infectious Diseases 4
Anaesthetics 3
Care of the Elderly 1
Diabetes and Endocrinology 2
Emergency Medicine 3
Gastroenterology 1
General Internal Medicine 2
General Surgery 1
Genitourinary 1
Microbiology and Virology 1
Obstetrics and Gynaecology 1
Orthopaedics 4
Paediatrics 1
Respiratory Medicine 1
Urology 2
Not specialty specific / F2 doctor / Core Medical Trainee 16
2.2.7 The telephone interviews lasted between 30 and 45 minutes. During the call, a trained
interviewer asked the interviewee to describe a number of scenarios, providing as much
information as possible. This included the pre-cursor to the incident, who was involved, what the
outcome was and other possible ways that the scenario could have been dealt with (to enable
alternative responses to be developed). The trained interviewer then used this information to
develop the SJT items.
2.2.8 In addition to the item-writing process, items that had been trialled previously, but had not been
deemed suitable to enter the operational item bank, were also reviewed and re-written by
trained SJT writers. Following initial review and re-write, these items then entered the item
development process prior to the review workshop stage. Items were selected for potential re-
trialling based on the information gathered from previous pilots, i.e. how the items performed.
To identify these items, and inform the re-write process, a ‘distractor analysis’ was carried out.
This provides detailed information about how different applicants responded to the individual
items. Based on this, and in combination with reviewing the item content, item writers
FP 2015 SJT Technical Report May 2015 © 2015 Work Psychology Group 9
suggested potential refinements to the items. These suggested changes were reviewed by a
clinician before the item was deemed suitable to enter the item development process at the
review workshop stage alongside the newly developed items. A total of 23 items were identified
and subsequently re-written. Amendments included clarifying any possible ambiguity in the
scenario or trying to differentiate two responses by making one option ‘worse’ or ‘better’.
2.2.9 The mean operational score for both ranking and multiple choice questions was observed to
have increased slightly between FP 2013 and FP 2014, indicating that applicants’ performance on
items had improved slightly over time. Therefore, during item development for FP 2015, item
writers and reviewers were specifically briefed to aim to write scenarios which contained an
appropriate element of dilemma and degree of complexity. This aimed to improve the extent to
which items differentiate between applicants.
2.3 Item Review
2.3.1 All newly developed items were reviewed by the core team of item reviewers from WPG. Each
scenario was reviewed in accordance with SJT item writing principles and the design specification
of the F1 SJT. In particular, scenarios were reviewed to ensure that they addressed one of the
target domains and were at an appropriate level for an F1. Following this review, 191 new items
were taken forward for further development. This equals an average of around 4.5 items per
interview, which is consistent with previous item development processes.
2.3.2 All 214 items (191 newly developed and 23 existing items) were logged on a spreadsheet. This
detailed who the item writer was, the date the item was submitted, the type of item, the target
domain, the answer key and a short one line summary of the item. Existing items kept their
original item code. The coding conventions enable differentiation between newly developed and
existing items. All items were subsequently uploaded or amended in an item bank7.
2.3.3 The breakdown of items at this stage of the development process relevant to each of the target
domains was as follows:
Commitment to Professionalism – 28
Coping with Pressure – 59
Effective Communication – 35
Patient Focus – 57
Working Effectively as Part of a Team – 35
2.3.4 Within each domain a number of different item topics have also been identified, broadly
categorised into three main topic areas; colleague-related, patient-related and self/task-related.
These are also further categorised under sub-topics which describe in more detail the sort of
scenario presented in each item. This enables test construction to ensure an appropriate
representation of different item types across each paper.
7 Item banking is supported by the use of the MSC Assessment Alliance (MSCAA) item bank software, which
facilitates secure storage of test items and supports the item development process; from item writing and reviewing, through to the creation of operational exam papers.
FP 2015 SJT Technical Report May 2015 © 2015 Work Psychology Group 10
2.3.5 The split of the lead-in instruction formats was designed to roughly reflect the construction of
the operational test (two thirds ranking items, one third multiple choice). The breakdown of
lead-in format was as follows:
Ranking – 152
Multiple Choice – 62
2.3.6 A range of different lead-in instructions for ranking item types (all with five responses to be
ranked) was developed. SJTs are a measurement methodology, and as such there is a variety of
different lead-in instruction formats that can be used. Within ranking lead-in formats, there are a
number of options for ranking the response options. Prior to FP 2014, these had always focused
on ranking of appropriateness, but it was identified that there was scope for this to be expanded
to cover a broader specification. Therefore a range of different ranking lead-in formats have
been developed, and this has helped to increase the breadth of the scenarios within the item
bank and to avoid duplication of similar item content. For FP 2014 and FP 2015, the four
different ranking lead-in formats used are:
Rank Actions: ‘Rank in order the appropriateness of the following actions in response to
this situation (1= Most appropriate; 5= Least appropriate)’
Rank Agreement: ‘Rank in order the extent to which you agree with the following
statements in this situation (1= Most agree with; 5= Least agree with)’
Rank Considerations: ‘Rank in order the importance of the following considerations in
the management of this situation (1= Most important; 5= Least important)’
Rank Order: ‘Rank the order in which the following tasks should be undertaken (1= Do
first; 5= Do last)’
2.3.7 The number of items developed for trialling in FP 2015 using each of these lead-ins was as
follows:
Rank Actions – 96
Rank Agreement – 5
Rank Considerations – 34
Rank Order – 17
2.4 Review Workshops
2.4.1 The aim of the review workshops was for SMEs to review SJT items for relevance, fairness and
face validity, and to gain agreement on the scoring key. A small number of F2 doctors attended
the workshops (one per group) to provide additional input in terms of the items’ relevance and
realism to the F1 role.
2.4.2 An added benefit is that the review workshops serve as an opportunity to build awareness of
SJTs amongst the medical community and improve expertise in SJT design principles. All those
who attended the review workshops were awarded six CPD points.
2.4.3 Seven review workshops took place across three days in June 2014. Three workshops were held
in Birmingham, two in Newcastle and two in Manchester. A total of 28 individuals took part in
the workshops, including seven F2 doctors. One attendee refused to sign the confidentiality
FP 2015 SJT Technical Report May 2015 © 2015 Work Psychology Group 11
agreement and therefore did not take part in the session. A further three individuals were
registered to attend but cancelled immediately prior to, or on the day of, the event.
2.4.4 Ideally a minimum of four SMEs, including an F2, would participate in each workshop. Whilst this
was the case for most of the workshops, for two of the workshops (held in Newcastle) there
were only enough attendees to have three individuals in each group, including an F2 in each.
Whilst at this stage in development any SME input is valuable, groups of fewer than four are less
likely to provide a balanced view of the items. Whilst in this instance the group discussions were
not deemed to have been negatively affected by the smaller group size, it is however
recommended that a minimum of four individuals take part in each review workshop group in
future.
2.4.5 All participants who volunteered to take part were sent briefing material that outlined the
purpose of the review workshop and their role on the day. All participants also signed a
confidentiality and code of conduct agreement.
2.4.6 Each of the seven groups, with the aid of a facilitator, reviewed approximately 25-30 items.
Attendees were asked to consider the scenario content and the responses, without sight of the
answer key initially proposed following the IDI. They were also asked to discuss a possible
answer key, which was compared with the original answer key. Their comments and suggestions
were recorded by the facilitator and updates were made to items. In a small number of cases,
items which generated a large amount of debate were reviewed by a second group before a
decision was made. All items were reviewed without the group having access to the original
answer key. Items were only progressed to the next stage if the group agreed with a key
following discussions around the correct answer.
2.4.7 A total of 214 items were reviewed during the review workshops. During the course of the
review workshops, it was agreed that 27 items should not be taken forward due to issues with
either relevance or fairness. Of these, four items will be reviewed to determine any changes
which would then enable them to re-enter the development process next year.
2.5 Concordance Panels
2.5.1 Concordance panels were held following the review workshop stage. Concordance panels
involve SMEs, in this case senior clinicians working closely with F1s, completing a paper
consisting of trial SJT items. Following best practice in SJT design, the aim of a concordance stage
is to identify a high level of consensus between experts on the item keys. Generally, those items
that exhibit high levels of consensus go forward to be trialled. Items exhibiting low levels of
consensus are subject to further review, with changes made if necessary. Concordance panels
also provide the opportunity for additional feedback to be received about the items, regarding
fairness and relevance.
2.5.2 The criteria for SME involvement in the concordance panel were that the clinicians worked
closely with F1 doctors and were very familiar with the responsibilities and tasks, as well as the
necessary skills and abilities required for the role. Unlike the earlier item development stages,
FY2s were not invited to take part in Concordance Panels.
FP 2015 SJT Technical Report May 2015 © 2015 Work Psychology Group 12
2.5.3 Two concordance panels were held, each in two sessions, with one paper reviewed at each
panel. Paper One consisted of 94 items and Paper Two of 93 items; therefore, a total of 187
items were answered by the clinicians who attended the concordance sessions At this stage, the
papers were not constructed as final tests, i.e. less consideration was given to the spread of item
topics or domains in comparison to operational paper construction, as the aim of the
concordance panels was to analyse individual items. This was made clear to those attending the
panels.
2.5.4 A total of 19 individuals attended the concordance stage, with four having withdrawn their
attendance at late notice. Panel One consisted of 10 individuals and Panel Two consisted of nine
individuals. A minimum of 10 individuals is required for robust concordance analysis, with ideally
12 or more undertaking each paper. Despite less than the ideal numbers taking part in one
concordance panel, useful information can still be gathered from this. However, the results from
Paper Two in particular were interpreted with caution.
2.5.5 After completing a confidentiality form and a short calibration session to ensure individuals had
understood the instructions, the panel was asked to complete the SJT items without discussing
them. A separate feedback sheet was provided for comments about individual items. There was
no set time limit, although the panels were told that the test should take no more than two
hours and 30 minutes to complete. Some SMEs completed the test well within that time – others
took around four hours to do so.
2.5.6 The concordance panel was also invited to leave written feedback on each of the items and a
short individual discussion was facilitated at the end of the testing session to allow the attendees
to provide their comments about the test more generally.
2.5.7 Following the concordance panels, concordance analysis was undertaken to investigate the
experts’ level of agreement over the keyed response for each trial item. Items were deemed to
either have satisfactory levels of concordance (118, 63.1% of all items) or unsatisfactory levels of
concordance (69, 36.9% of all items). This is slightly lower than in 2014, where 127 items (78.4%)
exhibited satisfactory levels of concordance and 35 items (21.6%) unsatisfactory levels of
concordance. The increase in items deemed to be unsatisfactory could be explained by a variety
of factors, including the intentional increase in the complexity of items following the operational
items in 2014 demonstrating higher facilities and lower partials (see 2.2.9), and the larger
number of items each concordance panel attendee was asked to complete. The main criterion
for selecting an item for use was a significant Kendall’s W8, therefore, following best practice
processes, any item that produced a low and non-significant Kendall’s W was removed from the
test for further review. However, there is a ‘tolerance’ around this figure and it was important to
look at the raw statistics in combination with the qualitative comments that were provided by
8 Kendall's W (also known as Kendall's coefficient of concordance) is a non-parametric statistic. If the test statistic
W is 1, then all the survey respondents have been unanimous, and each respondent has assigned the same order to the list of concerns. If W is 0, then there is no overall trend of agreement among the respondents, and their responses may be regarded as essentially random. Intermediate values of W indicate a greater or lesser degree of unanimity among the various responses. In this context, a Kendall’s W of 0.60 or above indicates good levels of concordance, although anything above 0.50 can be described as having satisfactory levels of concordance.
FP 2015 SJT Technical Report May 2015 © 2015 Work Psychology Group 13
the SMEs. Following this, 33 items with a low but significant Kendall’s W were amended in
accordance with feedback that was obtained from the SMEs who attended the concordance
panels. Nine items that exhibited satisfactory levels of consensus, and 33 items that exhibited
unsatisfactory levels of consensus, were deemed to be unsuitable based on feedback from SMEs
which indicated that the items needed substantial changes, e.g. due to issues of relevance,
ambiguity or fairness. These items will be further reviewed and amended to ascertain the
appropriateness of them entering into the 2016 item development process. Two items that
obtained significant Kendall’s W were deemed not appropriate to amend, one was due to the
concordance comments indicating that the scenario was unrealistic, and the other due to the
item being regarded as too easy (due to a Kendall’s W of 1.00), thus they were removed from the
item development process completely.
2.5.8 Following concordance analysis, 140 items were chosen for piloting. The answer key provided by
the concordance panel was used in combination with information from item writers and review
workshops to determine a scoring key for the trial data. However, it must be noted that this does
not necessarily reflect the final key, as information is used from the trial to develop the items
and their keys further. For example, if highly performing applicants consistently provide a
different key from the one established after the concordance stage, then the key will be
reviewed with the assistance of SMEs.
FP 2015 SJT Technical Report May 2015 © 2015 Work Psychology Group 14
Part Two: Scoring, Analysis and Evaluation
3 Operational Test Structure and Construction
3.1 Test Construction Overview
3.1.1 All SJT items used operationally have been part of an item bank that has been developed
between 2010 and 2014 (n=214). Every item within the operational item bank has been deemed
to have sufficient psychometric properties to be used operationally.
3.1.2 Three administrations of the SJT were undertaken, requiring the production of three versions of
the test paper, which were subsequently equated. Version three was included as a ‘mop up’
paper, and comprised items from both version one and version two.
3.1.3 In line with previous years, for each version, 70 items were administered. Of these, 60 were
operational items and 10 were trial items. There were 40 ranking operational items and 20
multiple choice operational items for each paper, plus trial items. The test versions were
designed with specific overlaps (‘anchor’ questions), which can be used to compare populations
and link the different versions.
3.2 Spread of Items across Papers
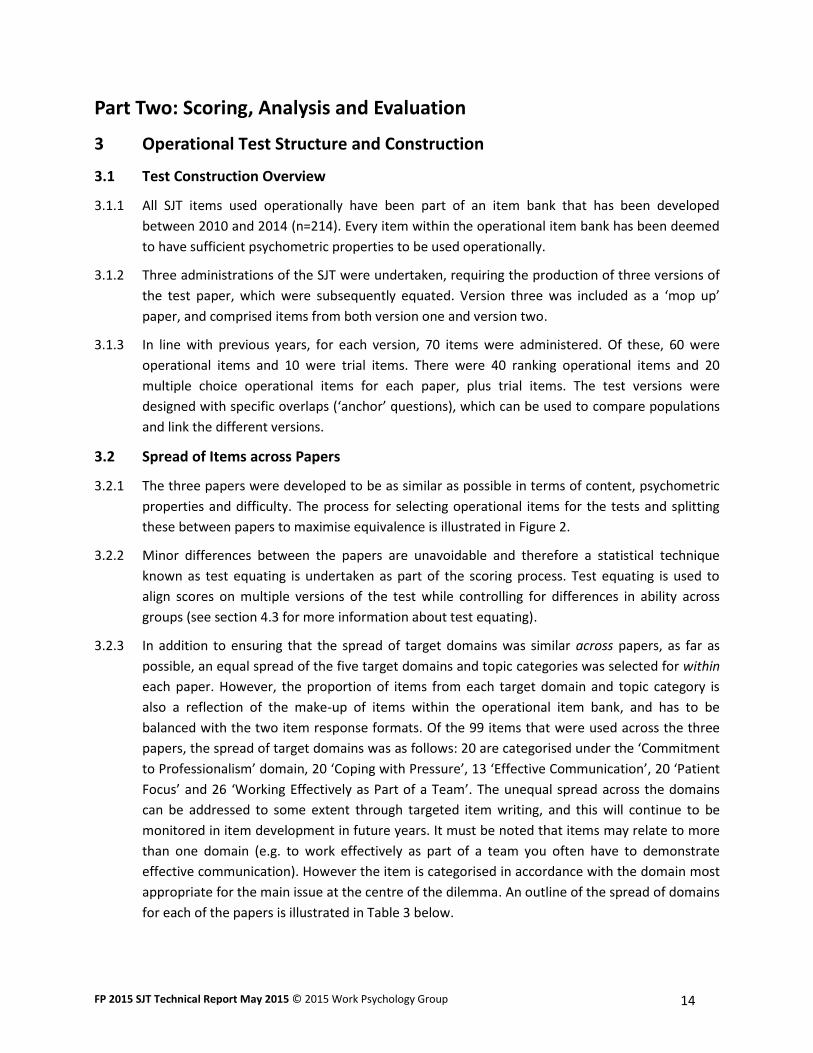
3.2.1 The three papers were developed to be as similar as possible in terms of content, psychometric
properties and difficulty. The process for selecting operational items for the tests and splitting
these between papers to maximise equivalence is illustrated in Figure 2.
3.2.2 Minor differences between the papers are unavoidable and therefore a statistical technique
known as test equating is undertaken as part of the scoring process. Test equating is used to
align scores on multiple versions of the test while controlling for differences in ability across
groups (see section 4.3 for more information about test equating).
3.2.3 In addition to ensuring that the spread of target domains was similar across papers, as far as
possible, an equal spread of the five target domains and topic categories was selected for within
each paper. However, the proportion of items from each target domain and topic category is
also a reflection of the make-up of items within the operational item bank, and has to be
balanced with the two item response formats. Of the 99 items that were used across the three
papers, the spread of target domains was as follows: 20 are categorised under the ‘Commitment
to Professionalism’ domain, 20 ‘Coping with Pressure’, 13 ‘Effective Communication’, 20 ‘Patient
Focus’ and 26 ‘Working Effectively as Part of a Team’. The unequal spread across the domains
can be addressed to some extent through targeted item writing, and this will continue to be
monitored in item development in future years. It must be noted that items may relate to more
than one domain (e.g. to work effectively as part of a team you often have to demonstrate
effective communication). However the item is categorised in accordance with the domain most
appropriate for the main issue at the centre of the dilemma. An outline of the spread of domains
for each of the papers is illustrated in Table 3 below.
FP 2015 SJT Technical Report May 2015 © 2015 Work Psychology Group 15
Figure 2: Operational test construction process
Table 3: Spread of target domains within each paper
Paper Commitment to
Professionalism
Coping with
Pressure
Effective
Communication Patient Focus
Working
Effectively as
Part of a Team
1 11 13 10 13 13
2 11 13 9 13 14
3 11 13 9 13 14
3.2.4 As previously mentioned, as well as selecting items based on their domains and topics, attention
was also paid to ensuring that the range and mean item facility and difficulty were broadly
FP 2015 SJT Technical Report May 2015 © 2015 Work Psychology Group 16
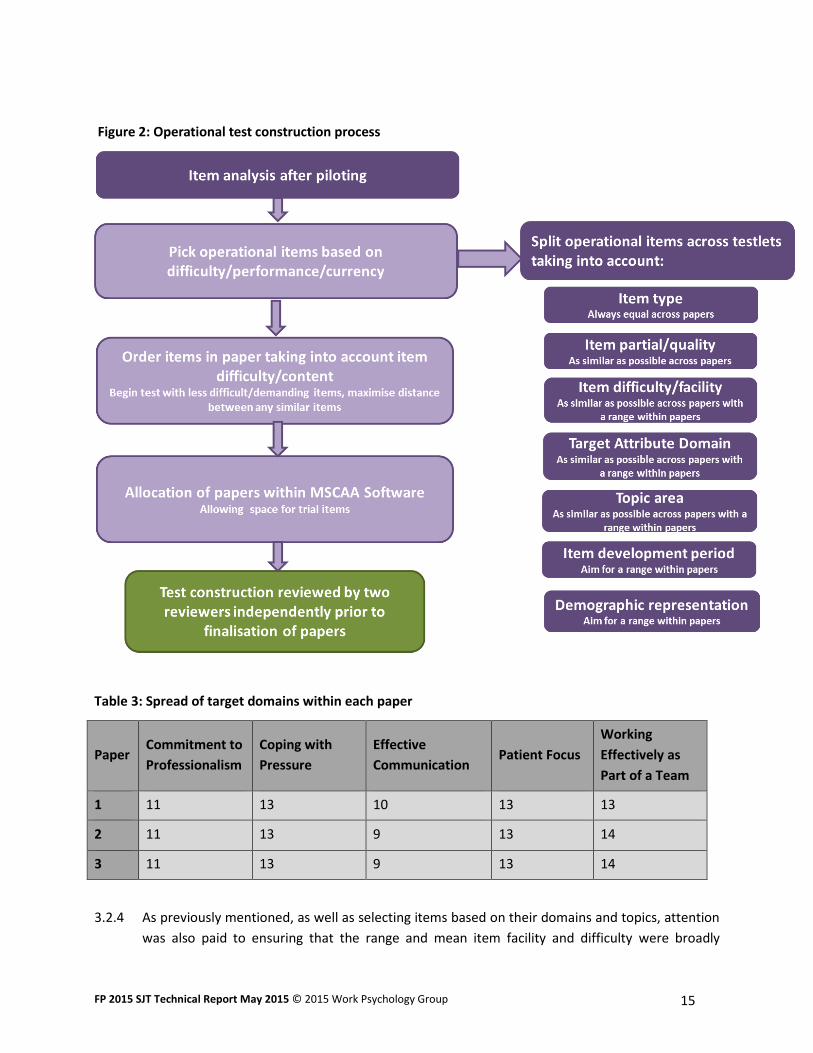
similar across the three papers. Table 4 shows the mean item facility for ranking items and
multiple choice items, as well as the mean item partials for all three papers. This demonstrates
that all three papers were broadly equivalent, based on known psychometric properties.
Table 4: Spread of item facility and item quality within each paper
Paper
Item Facility (Ranking
items)
Item Facility (Multiple
Choice Questions) Item Partial
Min Max Mean Min Max Mean Min Max Mean
1 14.24 18.83 17.11 8.26 10.70 9.57 .149 .412 .218
2 14.24 18.96 17.18 7.60 11.21 9.26 .157 .412 .213
3 14.24 18.83 17.11 7.60 11.21 9.26 .149 .412 .217
3.2.5 In addition to maximising equivalence across the different versions of the test, test construction
also involves the process of determining the position within the test where each item should be
placed. The content of the first few items in each operational paper was reviewed to ensure that
they would not be viewed as particularly distressing. This is to avoid placing undue anxiety on
the applicants as they commence the test. As far as possible, the distance between items with
any perceived similarity in content was also maximised (e.g. two items with different topic codes
and target attributes, yet both involving the treatment of a young child, would be positioned so
as to not be close to each other).
3.2.6 Following initial test construction, the papers were reviewed for overlap and spread. This
process was undertaken by two individuals who were not part of the initial test construction
process. Where any overlap was identified (e.g. there appeared to be two items in a paper that
address a similar topic), or there were potential issues with the spread of domains (e.g. there
appeared to be a ‘grouping’ of items that could be viewed as similar), these were flagged and
adjustments were made to the placing of items where possible, whilst still taking into account
the other required parameters.
3.2.7 Trial items were assigned to operational papers across 14 ‘testlets’, each containing ten trial
items (seven ranking, three multiple choice). At this stage, another review was undertaken to
identify any overlap (e.g. two items in a paper that address a similar topic) across trial and
operational items. These were flagged and adjustments made to the placing of the trial items
where possible.
3.3 Equality and Diversity Review
3.3.1 Following a recommendation from the independent equality and diversity review that took place
during FP 2014 item development, a process was undertaken in which all items (operational and
trial) were tagged according to the broad demographic characteristics of the individuals
portrayed in the scenario. Gender and ethnicity characteristics were assigned based on the given
names and allocated to relevant ‘tags’. Whether the item portrayed the individual(s) concerned
FP 2015 SJT Technical Report May 2015 © 2015 Work Psychology Group 17
in a negative way was also recorded. This is to help ensure that the tests did not unintentionally
present certain groups favourably or unfavourably and to monitor the way in which gender is
linked to job roles portrayed in the items. This tagging process also allowed for the spread of
demographic characteristics present in the operational item bank to be assessed. The tagging
information was used to inform the item development process for FP 2015 and item writers
were briefed to prioritise/de-prioritise certain demographic characteristics to help in ensuring
appropriate representation within the item bank as a whole. All items developed for FP 2015
were also tagged in accordance with the process described above at the point of item writing,
and this will continue for future item development.
3.3.2 The tagging process allowed for the spread of demographic characteristics to be reviewed for
each operational paper, and for this to be taken into consideration during test construction.
Whilst the psychometric properties of the item and target domain were prioritised in terms of
selecting items for each paper, a check was also undertaken to ensure that, where possible, each
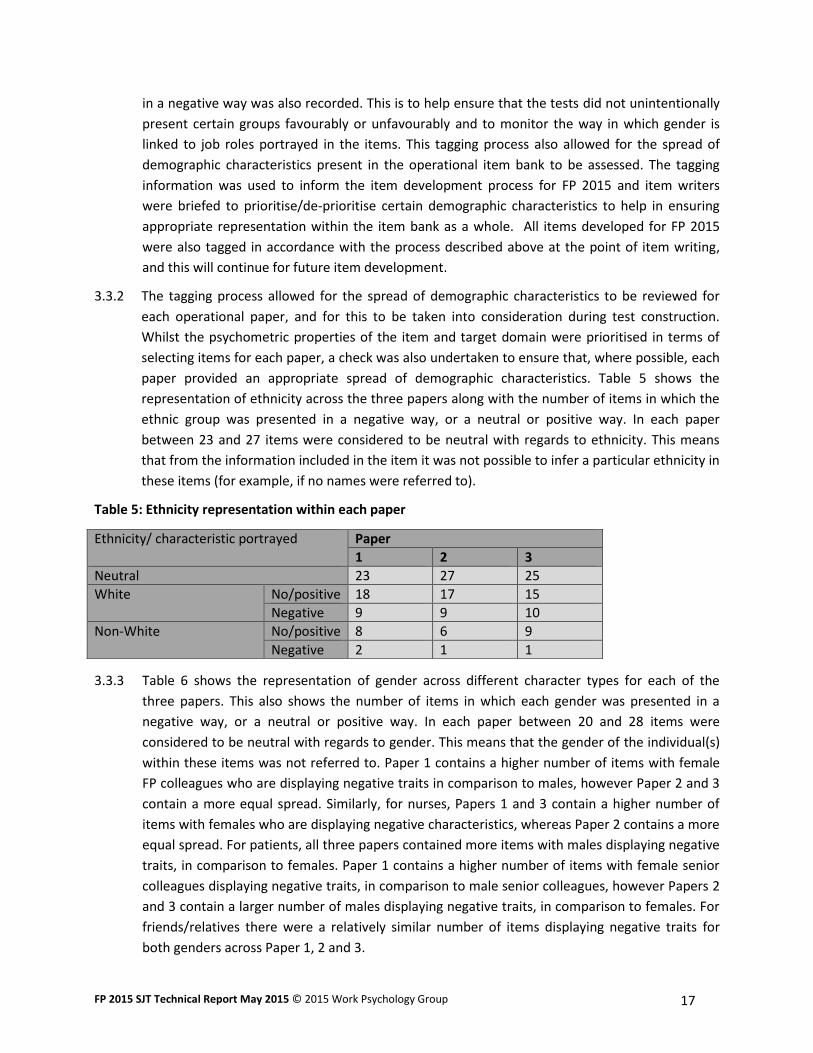
paper provided an appropriate spread of demographic characteristics. Table 5 shows the
representation of ethnicity across the three papers along with the number of items in which the
ethnic group was presented in a negative way, or a neutral or positive way. In each paper
between 23 and 27 items were considered to be neutral with regards to ethnicity. This means
that from the information included in the item it was not possible to infer a particular ethnicity in
these items (for example, if no names were referred to).
Table 5: Ethnicity representation within each paper
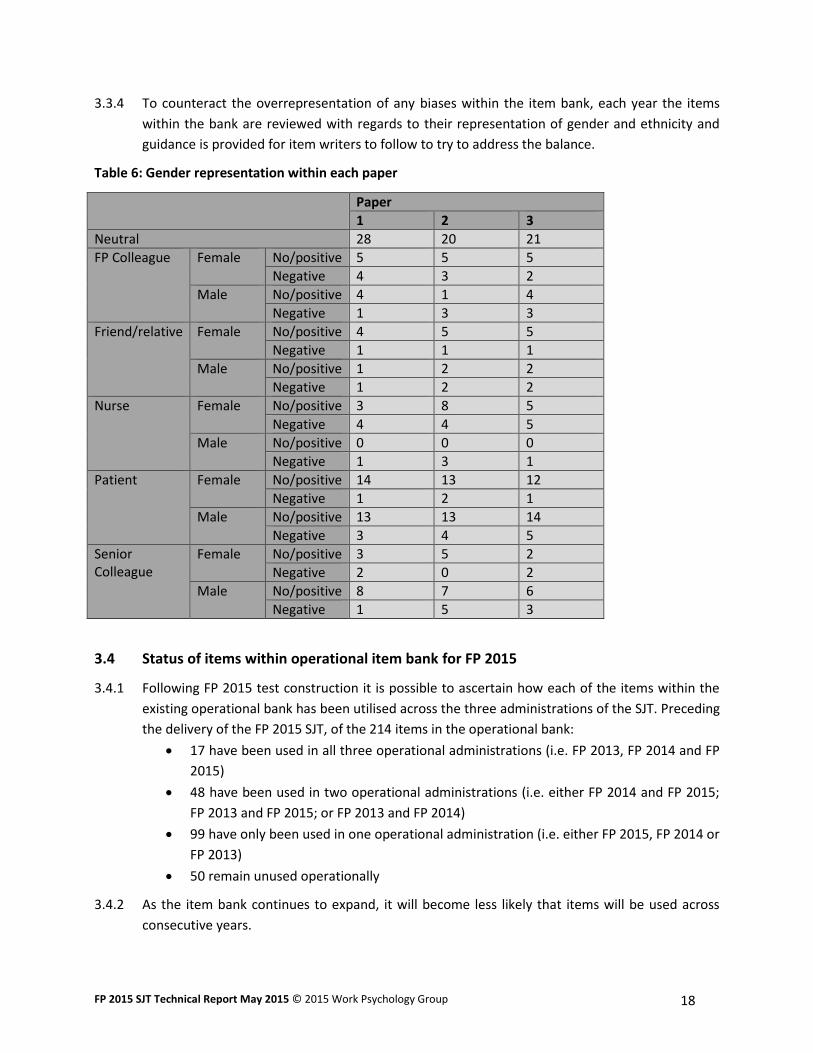
3.3.3 Table 6 shows the representation of gender across different character types for each of the
three papers. This also shows the number of items in which each gender was presented in a
negative way, or a neutral or positive way. In each paper between 20 and 28 items were
considered to be neutral with regards to gender. This means that the gender of the individual(s)
within these items was not referred to. Paper 1 contains a higher number of items with female
FP colleagues who are displaying negative traits in comparison to males, however Paper 2 and 3
contain a more equal spread. Similarly, for nurses, Papers 1 and 3 contain a higher number of
items with females who are displaying negative characteristics, whereas Paper 2 contains a more
equal spread. For patients, all three papers contained more items with males displaying negative
traits, in comparison to females. Paper 1 contains a higher number of items with female senior
colleagues displaying negative traits, in comparison to male senior colleagues, however Papers 2
and 3 contain a larger number of males displaying negative traits, in comparison to females. For
friends/relatives there were a relatively similar number of items displaying negative traits for
both genders across Paper 1, 2 and 3.
Ethnicity/ characteristic portrayed Paper
1 2 3
Neutral 23 27 25
White No/positive 18 17 15
Negative 9 9 10
Non-White No/positive 8 6 9
Negative 2 1 1
FP 2015 SJT Technical Report May 2015 © 2015 Work Psychology Group 18
3.3.4 To counteract the overrepresentation of any biases within the item bank, each year the items
within the bank are reviewed with regards to their representation of gender and ethnicity and
guidance is provided for item writers to follow to try to address the balance.
Table 6: Gender representation within each paper
3.4 Status of items within operational item bank for FP 2015
3.4.1 Following FP 2015 test construction it is possible to ascertain how each of the items within the
existing operational bank has been utilised across the three administrations of the SJT. Preceding
the delivery of the FP 2015 SJT, of the 214 items in the operational bank:
17 have been used in all three operational administrations (i.e. FP 2013, FP 2014 and FP
2015)
48 have been used in two operational administrations (i.e. either FP 2014 and FP 2015;
FP 2013 and FP 2015; or FP 2013 and FP 2014)
99 have only been used in one operational administration (i.e. either FP 2015, FP 2014 or
FP 2013)
50 remain unused operationally
3.4.2 As the item bank continues to expand, it will become less likely that items will be used across
consecutive years.
Paper
1 2 3
Neutral 28 20 21
FP Colleague Female No/positive 5 5 5
Negative 4 3 2
Male No/positive 4 1 4
Negative 1 3 3
Friend/relative Female No/positive 4 5 5
Negative 1 1 1
Male No/positive 1 2 2
Negative 1 2 2
Nurse Female No/positive 3 8 5
Negative 4 4 5
Male No/positive 0 0 0
Negative 1 3 1
Patient Female No/positive 14 13 12
Negative 1 2 1
Male No/positive 13 13 14
Negative 3 4 5
Senior Colleague
Female No/positive 3 5 2
Negative 2 0 2
Male No/positive 8 7 6
Negative 1 5 3
FP 2015 SJT Technical Report May 2015 © 2015 Work Psychology Group 19
4 Scoring and Test Equating
4.1 Following the scanning of all responses and a series of quality checks9 undertaken by MSC
Assessment to ensure that the data had been received from all applicants, the raw responses
were received by WPG for scoring.
4.2 The scoring quality assurance procedure follows the process summarised below: Scoring syntax quality assurance (QA): this includes a check for typographical/SPSS
errors, item type, key, number of options and tied scores. At this stage, dummy data are
also run to check the syntax is working correctly.
Data cleaning (Excel): this includes a check for unexpected characters as well as the
checking of variable names and number of cases.
Data cleaning (SPSS): this includes ensuring that data have converted to the correct
format from Excel, the running of frequencies to identify potential errors and impossible
data scores and ensuring that all applicants have a reasonable number of responses.
Scoring QA: this includes initial analysis to ensure that the mean, reliability and test
statistics are in the expected range, and the running of frequencies of scored data to
ensure they are in the expected range and that there are no anomalies.
4.3 Whilst the papers are developed to be as equivalent as possible, test equating also takes place so
that the results from each of the different papers are comparable and fair to all applicants. This
equating process also ensures equivalence across the papers. Statistical equating procedures
place all scores from different papers on the same scale. Without this, it is not possible to
determine whether small differences in scores between papers relate to real differences in
ability in the populations assigned to a paper, or differences in the difficulty of the papers
themselves. In reality, observed differences will be a function of both sample and test
differences. A minor statistical adjustment is used to ensure that the scores are fully equivalent.
4.4 There are a number of approaches to equating. For this SJT, the most suitable approach is a
chained linear equating process. The test papers were designed with specific overlaps (‘anchor’
items), which could be used to compare populations and link the different papers.
4.5 The raw equated SJT scores were transformed onto a scale that was similar to the EPM score
scale, while preserving the original distribution. The scale was set to be from 1.15 to 50.00 with a
mean and standard deviation (SD) that was as similar as possible to the EPM mean and SD, and
scores rounded to two decimal places. This is a linear transformation so it has no impact on the
relative position of any applicant. The maximum number of applicants with a single score was
149. This is marginally higher than for FP 2014 when the maximum number of applicants with a
single score was 144, and for FP 2013 when the maximum number was 147 (when scores were
rounded to one decimal place). Increasing the decimal places from one to two only affects scores
on Paper Two and it makes it much less likely that a score from Paper Two will fall on a number
which could be a Paper One score. However, Paper One represents the largest proportion of
9 See http://www.foundationprogramme.nhs.uk/download.asp?file=FP_2014_SJT_scanning_FINAL.pdf for further
details on the quality checks undertaken by MSC-AA following scanning.
FP 2015 SJT Technical Report May 2015 © 2015 Work Psychology Group 20
applicants, and it is not possible to separate applicants who have an identical score on Paper
One, which is the largest source of ties. Whilst scores were rounded to two decimal places during
standardisation, the differences in scores in the second decimal place are not meaningful and
applicants that only differ to this degree should be considered to have the same level of
performance. However, as the process requires the ordering of applicants with equivalent
scores, then using the second decimal place is as appropriate as any random method for
selecting who will be given preference from equal applicants.
5 Analysis
5.1 Purpose
5.1.1 Following any operational delivery of an SJT, it is important that the test is evaluated with
regards to reliability, group differences and the ability for the test to discriminate between
applicants. Item level analysis of operational items also takes place. This is because, although
previous trials have demonstrated that the items had sufficient psychometric properties to be
used operationally, items can perform differently over time. It is therefore important to
continually monitor all operational items.
5.1.2 Evaluation of trial items is also undertaken to analyse whether they exhibit sufficient
psychometric properties to enter the operational item bank for use in future years.
5.2 Evaluation overview
5.2.1 This section outlines the psychometric analysis for the SJT. Any high stakes, high profile test
needs to meet exacting psychometric standards in terms of the quality of individual items and of
the test as a whole, including reliability, validity and fairness. The main analysis and evaluation
activities reported here include:
Test level statistics, including reliability and scoring distributions
Item level statistics, including item facility and effectiveness
Analysis of group differences at a test and item level to explore fairness
Relationships between the EPM and the SJT
Modelling of alternative scoring
Evaluation of applicant reactions
5.3 Sample
5.3.1 There were a total of 8,088 applicants who took the FP 2015 SJT. They were final year medical
students, including students who had been pre-allocated to a Defence Deanery FP, UK students
who had taken time out post-graduation and international medical students/graduates applying
through the Eligibility Office.
5.3.2 A breakdown of the number of applicants who sat each of the three papers can be seen in Table
7. One version of a paper was undertaken at each school for logistical reasons, and to minimise
security risk to the items.
FP 2015 SJT Technical Report May 2015 © 2015 Work Psychology Group 21
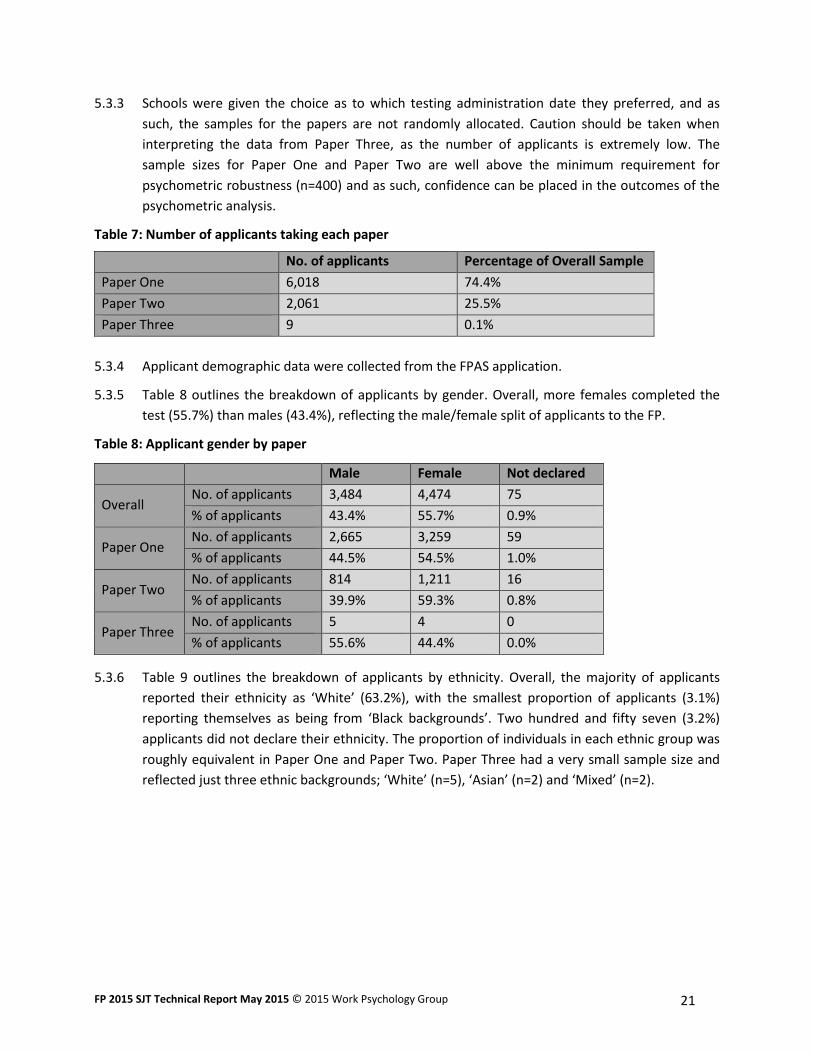
5.3.3 Schools were given the choice as to which testing administration date they preferred, and as
such, the samples for the papers are not randomly allocated. Caution should be taken when
interpreting the data from Paper Three, as the number of applicants is extremely low. The
sample sizes for Paper One and Paper Two are well above the minimum requirement for
psychometric robustness (n=400) and as such, confidence can be placed in the outcomes of the
psychometric analysis.
Table 7: Number of applicants taking each paper
No. of applicants Percentage of Overall Sample
Paper One 6,018 74.4%
Paper Two 2,061 25.5%
Paper Three 9 0.1%
5.3.4 Applicant demographic data were collected from the FPAS application.
5.3.5 Table 8 outlines the breakdown of applicants by gender. Overall, more females completed the
test (55.7%) than males (43.4%), reflecting the male/female split of applicants to the FP.
Table 8: Applicant gender by paper
Male Female Not declared
Overall No. of applicants 3,484 4,474 75
% of applicants 43.4% 55.7% 0.9%
Paper One No. of applicants 2,665 3,259 59
% of applicants 44.5% 54.5% 1.0%
Paper Two No. of applicants 814 1,211 16
% of applicants 39.9% 59.3% 0.8%
Paper Three No. of applicants 5 4 0
% of applicants 55.6% 44.4% 0.0%
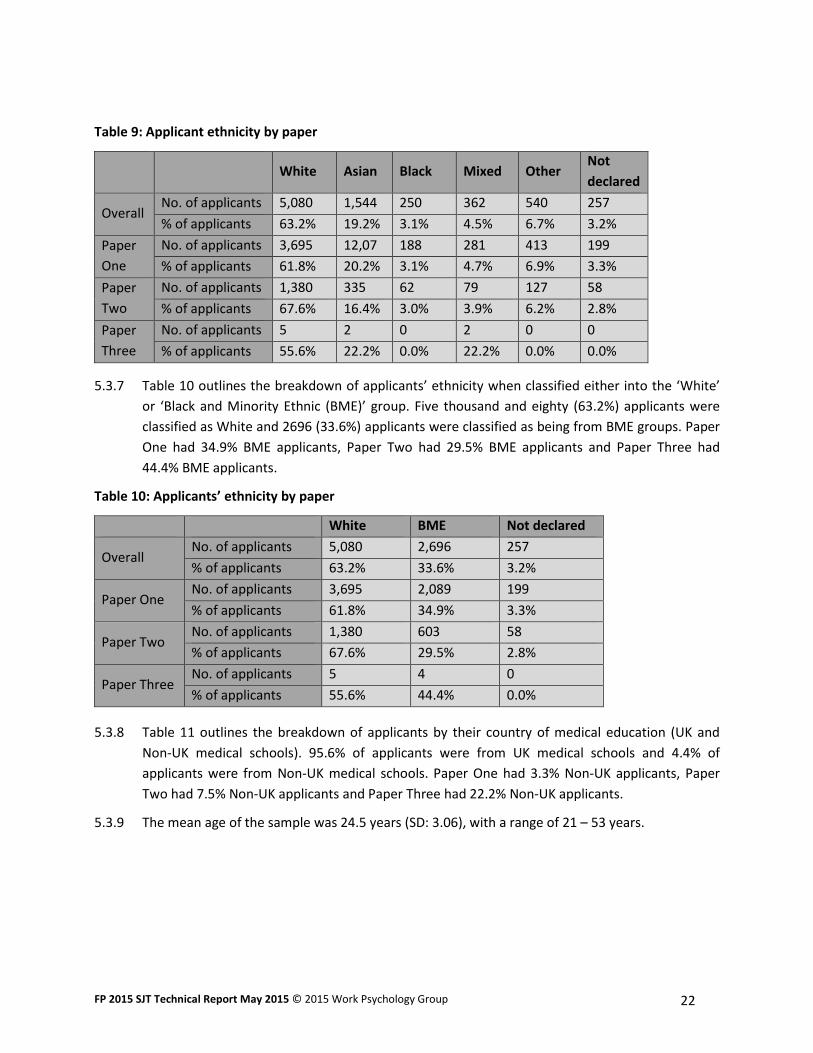
5.3.6 Table 9 outlines the breakdown of applicants by ethnicity. Overall, the majority of applicants
reported their ethnicity as ‘White’ (63.2%), with the smallest proportion of applicants (3.1%)
reporting themselves as being from ‘Black backgrounds’. Two hundred and fifty seven (3.2%)
applicants did not declare their ethnicity. The proportion of individuals in each ethnic group was
roughly equivalent in Paper One and Paper Two. Paper Three had a very small sample size and
reflected just three ethnic backgrounds; ‘White’ (n=5), ‘Asian’ (n=2) and ‘Mixed’ (n=2).
FP 2015 SJT Technical Report May 2015 © 2015 Work Psychology Group 22
Table 9: Applicant ethnicity by paper
White Asian Black Mixed Other
Not
declared
Overall No. of applicants 5,080 1,544 250 362 540 257
% of applicants 63.2% 19.2% 3.1% 4.5% 6.7% 3.2%
Paper
One
No. of applicants 3,695 12,07 188 281 413 199
% of applicants 61.8% 20.2% 3.1% 4.7% 6.9% 3.3%
Paper
Two
No. of applicants 1,380 335 62 79 127 58
% of applicants 67.6% 16.4% 3.0% 3.9% 6.2% 2.8%
Paper
Three
No. of applicants 5 2 0 2 0 0
% of applicants 55.6% 22.2% 0.0% 22.2% 0.0% 0.0%
5.3.7 Table 10 outlines the breakdown of applicants’ ethnicity when classified either into the ‘White’
or ‘Black and Minority Ethnic (BME)’ group. Five thousand and eighty (63.2%) applicants were
classified as White and 2696 (33.6%) applicants were classified as being from BME groups. Paper
One had 34.9% BME applicants, Paper Two had 29.5% BME applicants and Paper Three had
44.4% BME applicants.
Table 10: Applicants’ ethnicity by paper
White BME Not declared
Overall No. of applicants 5,080 2,696 257
% of applicants 63.2% 33.6% 3.2%
Paper One No. of applicants 3,695 2,089 199
% of applicants 61.8% 34.9% 3.3%
Paper Two No. of applicants 1,380 603 58
% of applicants 67.6% 29.5% 2.8%
Paper Three No. of applicants 5 4 0
% of applicants 55.6% 44.4% 0.0%
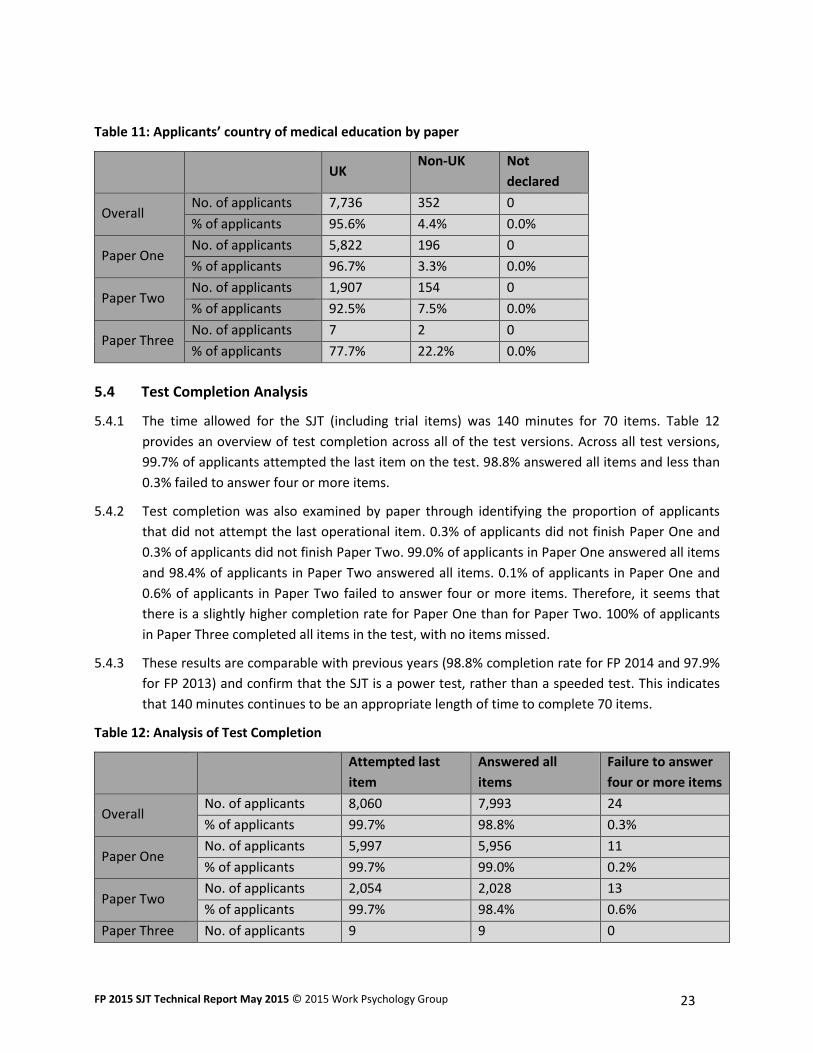
5.3.8 Table 11 outlines the breakdown of applicants by their country of medical education (UK and
Non-UK medical schools). 95.6% of applicants were from UK medical schools and 4.4% of
applicants were from Non-UK medical schools. Paper One had 3.3% Non-UK applicants, Paper
Two had 7.5% Non-UK applicants and Paper Three had 22.2% Non-UK applicants.
5.3.9 The mean age of the sample was 24.5 years (SD: 3.06), with a range of 21 – 53 years.
FP 2015 SJT Technical Report May 2015 © 2015 Work Psychology Group 23
Table 11: Applicants’ country of medical education by paper
UK
Non-UK Not
declared
Overall No. of applicants 7,736 352 0
% of applicants 95.6% 4.4% 0.0%
Paper One No. of applicants 5,822 196 0
% of applicants 96.7% 3.3% 0.0%
Paper Two No. of applicants 1,907 154 0
% of applicants 92.5% 7.5% 0.0%
Paper Three No. of applicants 7 2 0
% of applicants 77.7% 22.2% 0.0%
5.4 Test Completion Analysis
5.4.1 The time allowed for the SJT (including trial items) was 140 minutes for 70 items. Table 12
provides an overview of test completion across all of the test versions. Across all test versions,
99.7% of applicants attempted the last item on the test. 98.8% answered all items and less than
0.3% failed to answer four or more items.
5.4.2 Test completion was also examined by paper through identifying the proportion of applicants
that did not attempt the last operational item. 0.3% of applicants did not finish Paper One and
0.3% of applicants did not finish Paper Two. 99.0% of applicants in Paper One answered all items
and 98.4% of applicants in Paper Two answered all items. 0.1% of applicants in Paper One and
0.6% of applicants in Paper Two failed to answer four or more items. Therefore, it seems that
there is a slightly higher completion rate for Paper One than for Paper Two. 100% of applicants
in Paper Three completed all items in the test, with no items missed.
5.4.3 These results are comparable with previous years (98.8% completion rate for FP 2014 and 97.9%
for FP 2013) and confirm that the SJT is a power test, rather than a speeded test. This indicates
that 140 minutes continues to be an appropriate length of time to complete 70 items.
Table 12: Analysis of Test Completion
Attempted last
item
Answered all
items
Failure to answer
four or more items
Overall No. of applicants 8,060 7,993 24
% of applicants 99.7% 98.8% 0.3%
Paper One No. of applicants 5,997 5,956 11
% of applicants 99.7% 99.0% 0.2%
Paper Two No. of applicants 2,054 2,028 13
% of applicants 99.7% 98.4% 0.6%
Paper Three No. of applicants 9 9 0
FP 2015 SJT Technical Report May 2015 © 2015 Work Psychology Group 24
% of applicants 100.0% 100.0% 0.0%
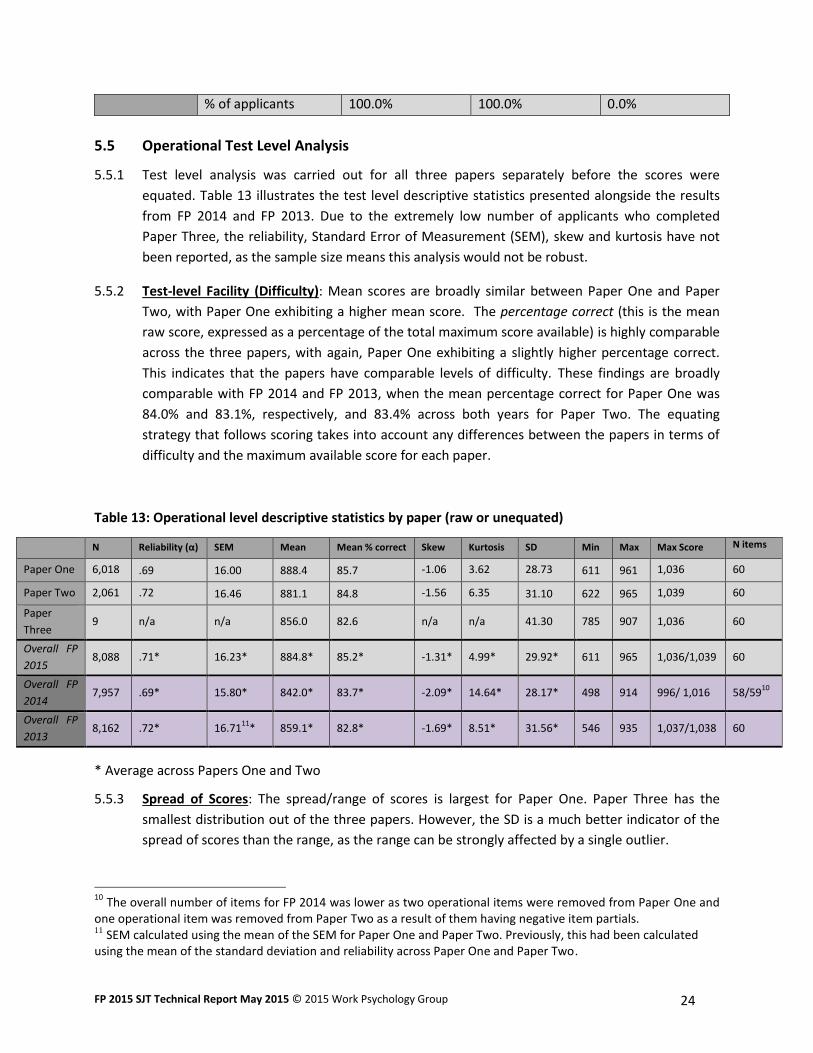
5.5 Operational Test Level Analysis
5.5.1 Test level analysis was carried out for all three papers separately before the scores were
equated. Table 13 illustrates the test level descriptive statistics presented alongside the results
from FP 2014 and FP 2013. Due to the extremely low number of applicants who completed
Paper Three, the reliability, Standard Error of Measurement (SEM), skew and kurtosis have not
been reported, as the sample size means this analysis would not be robust.
5.5.2 Test-level Facility (Difficulty): Mean scores are broadly similar between Paper One and Paper
Two, with Paper One exhibiting a higher mean score. The percentage correct (this is the mean
raw score, expressed as a percentage of the total maximum score available) is highly comparable
across the three papers, with again, Paper One exhibiting a slightly higher percentage correct.
This indicates that the papers have comparable levels of difficulty. These findings are broadly
comparable with FP 2014 and FP 2013, when the mean percentage correct for Paper One was
84.0% and 83.1%, respectively, and 83.4% across both years for Paper Two. The equating
strategy that follows scoring takes into account any differences between the papers in terms of
difficulty and the maximum available score for each paper.
Table 13: Operational level descriptive statistics by paper (raw or unequated)
N Reliability (α) SEM Mean Mean % correct Skew Kurtosis SD Min Max Max Score N items
Paper One 6,018 .69 16.00 888.4 85.7 -1.06 3.62 28.73 611 961 1,036 60
Paper Two 2,061 .72 16.46 881.1 84.8 -1.56 6.35 31.10 622 965 1,039 60
Paper
Three 9 n/a n/a 856.0 82.6 n/a n/a 41.30 785 907 1,036 60
Overall FP
2015 8,088 .71* 16.23* 884.8* 85.2* -1.31* 4.99* 29.92* 611 965 1,036/1,039 60
Overall FP
2014 7,957 .69* 15.80* 842.0* 83.7* -2.09* 14.64* 28.17* 498 914 996/ 1,016 58/59
10
Overall FP
2013 8,162 .72* 16.71
11* 859.1* 82.8* -1.69* 8.51* 31.56* 546 935 1,037/1,038 60
* Average across Papers One and Two
5.5.3 Spread of Scores: The spread/range of scores is largest for Paper One. Paper Three has the
smallest distribution out of the three papers. However, the SD is a much better indicator of the
spread of scores than the range, as the range can be strongly affected by a single outlier.
10
The overall number of items for FP 2014 was lower as two operational items were removed from Paper One and one operational item was removed from Paper Two as a result of them having negative item partials. 11
SEM calculated using the mean of the SEM for Paper One and Paper Two. Previously, this had been calculated using the mean of the standard deviation and reliability across Paper One and Paper Two.
FP 2015 SJT Technical Report May 2015 © 2015 Work Psychology Group 25
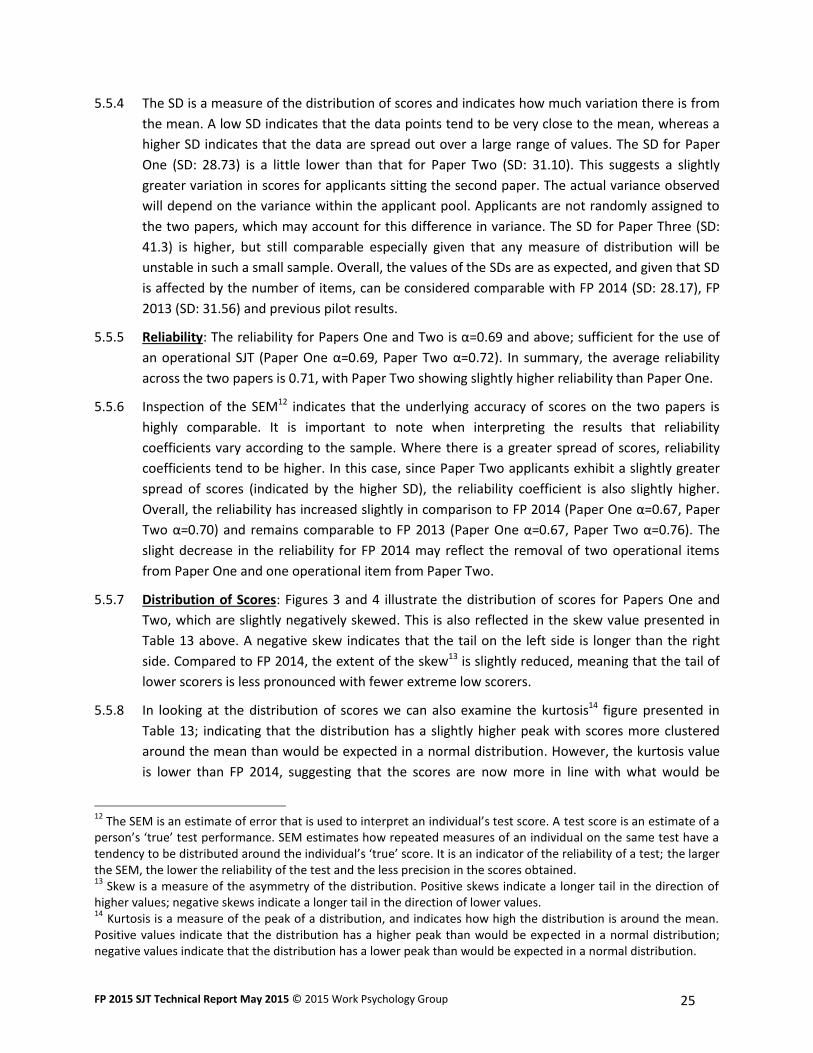
5.5.4 The SD is a measure of the distribution of scores and indicates how much variation there is from
the mean. A low SD indicates that the data points tend to be very close to the mean, whereas a
higher SD indicates that the data are spread out over a large range of values. The SD for Paper
One (SD: 28.73) is a little lower than that for Paper Two (SD: 31.10). This suggests a slightly
greater variation in scores for applicants sitting the second paper. The actual variance observed
will depend on the variance within the applicant pool. Applicants are not randomly assigned to
the two papers, which may account for this difference in variance. The SD for Paper Three (SD:
41.3) is higher, but still comparable especially given that any measure of distribution will be
unstable in such a small sample. Overall, the values of the SDs are as expected, and given that SD
is affected by the number of items, can be considered comparable with FP 2014 (SD: 28.17), FP
2013 (SD: 31.56) and previous pilot results.
5.5.5 Reliability: The reliability for Papers One and Two is α=0.69 and above; sufficient for the use of
an operational SJT (Paper One α=0.69, Paper Two α=0.72). In summary, the average reliability
across the two papers is 0.71, with Paper Two showing slightly higher reliability than Paper One.
5.5.6 Inspection of the SEM12 indicates that the underlying accuracy of scores on the two papers is
highly comparable. It is important to note when interpreting the results that reliability
coefficients vary according to the sample. Where there is a greater spread of scores, reliability
coefficients tend to be higher. In this case, since Paper Two applicants exhibit a slightly greater
spread of scores (indicated by the higher SD), the reliability coefficient is also slightly higher.
Overall, the reliability has increased slightly in comparison to FP 2014 (Paper One α=0.67, Paper
Two α=0.70) and remains comparable to FP 2013 (Paper One α=0.67, Paper Two α=0.76). The
slight decrease in the reliability for FP 2014 may reflect the removal of two operational items
from Paper One and one operational item from Paper Two.
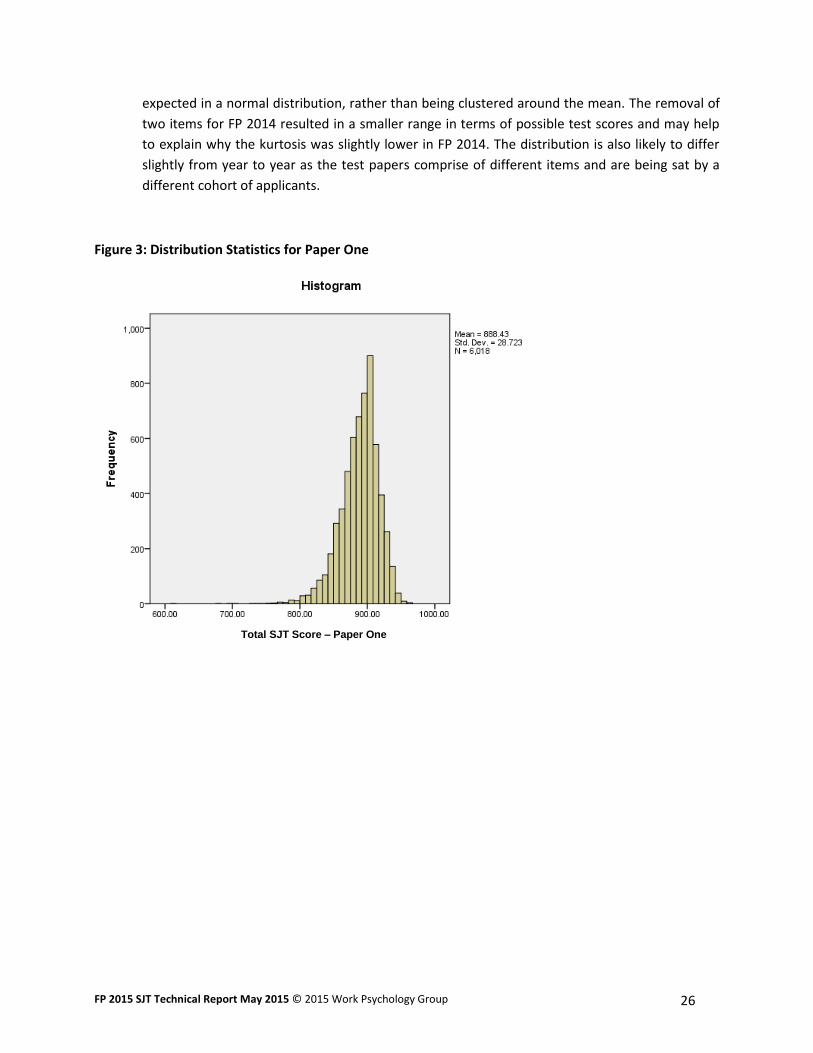
5.5.7 Distribution of Scores: Figures 3 and 4 illustrate the distribution of scores for Papers One and
Two, which are slightly negatively skewed. This is also reflected in the skew value presented in
Table 13 above. A negative skew indicates that the tail on the left side is longer than the right
side. Compared to FP 2014, the extent of the skew13 is slightly reduced, meaning that the tail of
lower scorers is less pronounced with fewer extreme low scorers.
5.5.8 In looking at the distribution of scores we can also examine the kurtosis14 figure presented in
Table 13; indicating that the distribution has a slightly higher peak with scores more clustered
around the mean than would be expected in a normal distribution. However, the kurtosis value
is lower than FP 2014, suggesting that the scores are now more in line with what would be
12
The SEM is an estimate of error that is used to interpret an individual’s test score. A test score is an estimate of a person’s ‘true’ test performance. SEM estimates how repeated measures of an individual on the same test have a tendency to be distributed around the individual’s ‘true’ score. It is an indicator of the reliability of a test; the larger the SEM, the lower the reliability of the test and the less precision in the scores obtained. 13
Skew is a measure of the asymmetry of the distribution. Positive skews indicate a longer tail in the direction of higher values; negative skews indicate a longer tail in the direction of lower values. 14
Kurtosis is a measure of the peak of a distribution, and indicates how high the distribution is around the mean. Positive values indicate that the distribution has a higher peak than would be expected in a normal distribution; negative values indicate that the distribution has a lower peak than would be expected in a normal distribution.
FP 2015 SJT Technical Report May 2015 © 2015 Work Psychology Group 26
expected in a normal distribution, rather than being clustered around the mean. The removal of
two items for FP 2014 resulted in a smaller range in terms of possible test scores and may help
to explain why the kurtosis was slightly lower in FP 2014. The distribution is also likely to differ
slightly from year to year as the test papers comprise of different items and are being sat by a
different cohort of applicants.
Figure 3: Distribution Statistics for Paper One
Total SJT Score – Paper One
FP 2015 SJT Technical Report May 2015 © 2015 Work Psychology Group 27
Figure 4: Distribution Statistics for Paper Two
5.6 Operational Item Level Analysis
5.6.1 Item analysis was used to look at the difficulty and quality of individual SJT items within the
operational test. Although the psychometric properties of the operational items are known
beforehand, it is important that these continue to be monitored. As the sample size for
completed items increases, the potential for error in the item partial decreases, therefore, it is
possible that in comparison to earlier pilots (when sample sizes were smaller) the psychometric
properties of some items will change. This may result in a need to remove poorly performing
items from the operational bank.
5.6.2 Item Facility and Spread of Scores: Item facility (difficulty) is shown by the mean score for each
item (out of a maximum of 20 for ranking items and 12 for multiple response items). If the
facility value is very low, then the item may be too difficult and may not yield useful information.
If the facility value is very high, then the item may be too easy and may not provide useful
information or differentiate between applicants. A range of item facilities is sought for an
operational test, ranging from very easy (characterised by a mean score of greater than 90% of
the total available score) to very difficult (characterised by a mean score of less than 30% of the
total available score) items. Prior psychometric analysis of the items indicated that the
operational items fell within these parameters; however, these have been reviewed again as
part of the item level analysis.
Total SJT Score – Paper Two
FP 2015 SJT Technical Report May 2015 © 2015 Work Psychology Group 28
5.6.3 The SD of an item should also be considered. If an item’s SD is very small, it is likely to not be
differentiating between applicants. The SD for an item should be at least 1.0 and no more than
3.0. If the SD is very large, it may mean that the item is potentially ambiguous and there is not a
clear ‘correct’ answer, especially if this is coupled with a relatively low mean. Again, prior to
operational delivery, all operational items fell within these parameters, based on their
psychometric properties from the piloting stages.
5.6.4 Table 14 outlines the item level statistics for Papers One and Two, once outliers have been
excluded15. As a comparison, the overall item level statistics for FP 2014 and FP 2013 are also
provided. Paper Three has not been included, as the small sample size can skew the overall
results.
5.6.5 The mean item facility for ranking items is 17.3 and the mean item facility for multiple choice
items is 9.7. The facility ranges and SDs for both ranking and multiple choice items are in line
with expectations. In general though, the facility value has continuously increased with
operational use (for FP 2014 the mean facility values were 17.1 for ranking and 9.2 for multiple
choice; FP 2013 the mean facility values were 16.9 for ranking and 9.1 for multiple choice). This
increase in mean facility value could be due, in part, to the sample population. As the population
becomes more familiar with the test format, it is expected that performance on items may
improve, thereby resulting in higher facility values for some items.
5.6.6 Items that can be categorised as ‘easy’ (more than 90% of the total available score) for both
ranking and multiple choice questions are reviewed to ensure that they are sufficiently
differentiating between applicants (and are therefore providing useful information). If this is not
the case, then they are removed from the operational bank. Additionally, items with low SDs are
also reviewed and removed if deemed no longer appropriate.
Table 14: Item level statistics: Facility values
Ranking Multiple Choice
N Mean Facility Range SD Range Mean Facility Range SD Range
Paper One 6,009 17.3 15.4-19.0 1.39-3.25 9.9 8.3-11.1 1.76-2.72
Paper Two 2,055 17.3 15.25-18.95 1.37-3.28 9.5 7.5-11.3 1.66-2.72
Overall FP 2015 8,064 17.3 15.3-19.0 1.37-3.26 9.7 7.5-11.3 1.66-2.72
Overall FP 2014 7,957 17.1 14.4-19.1 1.41-2.73 9.2 5.2-11.2 1.69-2.67
Overall FP 2013 8,146 16.9 14.5-19.0 1.48-2.78 9.1 5.8-11.3 1.67-2.67
5.6.7 Item Quality: Item quality (or discrimination) is determined by the correlation of the item with
the overall operational SJT score, not including the item itself (item partial)16. This analysis
15
For the purposes of item-level analysis and in line with best practice, nine outliers were excluded from Paper One and six outliers were excluded from Paper Two. 16
With regards to acceptable levels of correlations for item partials, guidelines suggest in general .2 or .3 as identifying a good item (Everitt, B.S., 2002 The Cambridge Dictionary of Statistics, 2nd Edition, CUP). In this process we have used heuristics based on these guidelines and based on identifying items with sufficient level of correlation to be contributing to the reliability of the test.
FP 2015 SJT Technical Report May 2015 © 2015 Work Psychology Group 29
compares how the cohort performs on a given item with how they perform on the test overall,
and is a good indication of whether an item discriminates between good and poor applicants.
One would expect that high scoring applicants overall would select the correct answer for an
item more often than low scoring applicants; this would show a good to moderate
correlation/partial. A poor correlation would indicate that performance on the individual item
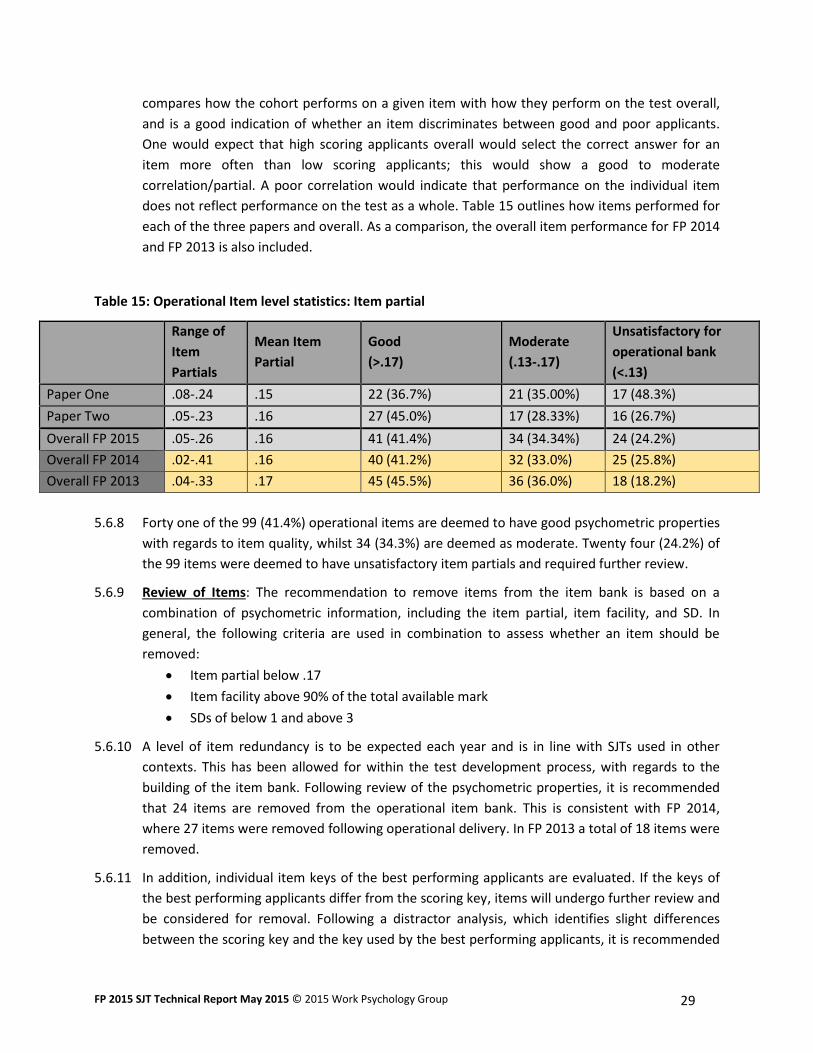
does not reflect performance on the test as a whole. Table 15 outlines how items performed for
each of the three papers and overall. As a comparison, the overall item performance for FP 2014
and FP 2013 is also included.
Table 15: Operational Item level statistics: Item partial
Range of
Item
Partials
Mean Item
Partial
Good
(>.17)
Moderate
(.13-.17)
Unsatisfactory for
operational bank
(<.13)
Paper One .08-.24 .15 22 (36.7%) 21 (35.00%) 17 (48.3%)
Paper Two .05-.23 .16 27 (45.0%) 17 (28.33%) 16 (26.7%)
Overall FP 2015 .05-.26 .16 41 (41.4%) 34 (34.34%) 24 (24.2%)
Overall FP 2014 .02-.41 .16 40 (41.2%) 32 (33.0%) 25 (25.8%)
Overall FP 2013 .04-.33 .17 45 (45.5%) 36 (36.0%) 18 (18.2%)
5.6.8 Forty one of the 99 (41.4%) operational items are deemed to have good psychometric properties
with regards to item quality, whilst 34 (34.3%) are deemed as moderate. Twenty four (24.2%) of
the 99 items were deemed to have unsatisfactory item partials and required further review.
5.6.9 Review of Items: The recommendation to remove items from the item bank is based on a
combination of psychometric information, including the item partial, item facility, and SD. In
general, the following criteria are used in combination to assess whether an item should be
removed:
Item partial below .17
Item facility above 90% of the total available mark
SDs of below 1 and above 3
5.6.10 A level of item redundancy is to be expected each year and is in line with SJTs used in other
contexts. This has been allowed for within the test development process, with regards to the
building of the item bank. Following review of the psychometric properties, it is recommended
that 24 items are removed from the operational item bank. This is consistent with FP 2014,
where 27 items were removed following operational delivery. In FP 2013 a total of 18 items were
removed.
5.6.11 In addition, individual item keys of the best performing applicants are evaluated. If the keys of
the best performing applicants differ from the scoring key, items will undergo further review and
be considered for removal. Following a distractor analysis, which identifies slight differences
between the scoring key and the key used by the best performing applicants, it is recommended
FP 2015 SJT Technical Report May 2015 © 2015 Work Psychology Group 30
that a further 16 items, which had sufficient psychometric properties, undergo a review before
being used again operationally. The opinion of a clinician will be employed to identify whether
there is any justification for amending the answer key. If there is a justification for altering the
key, the impact of doing so, in terms of the item’s psychometric performance, will also be
assessed.
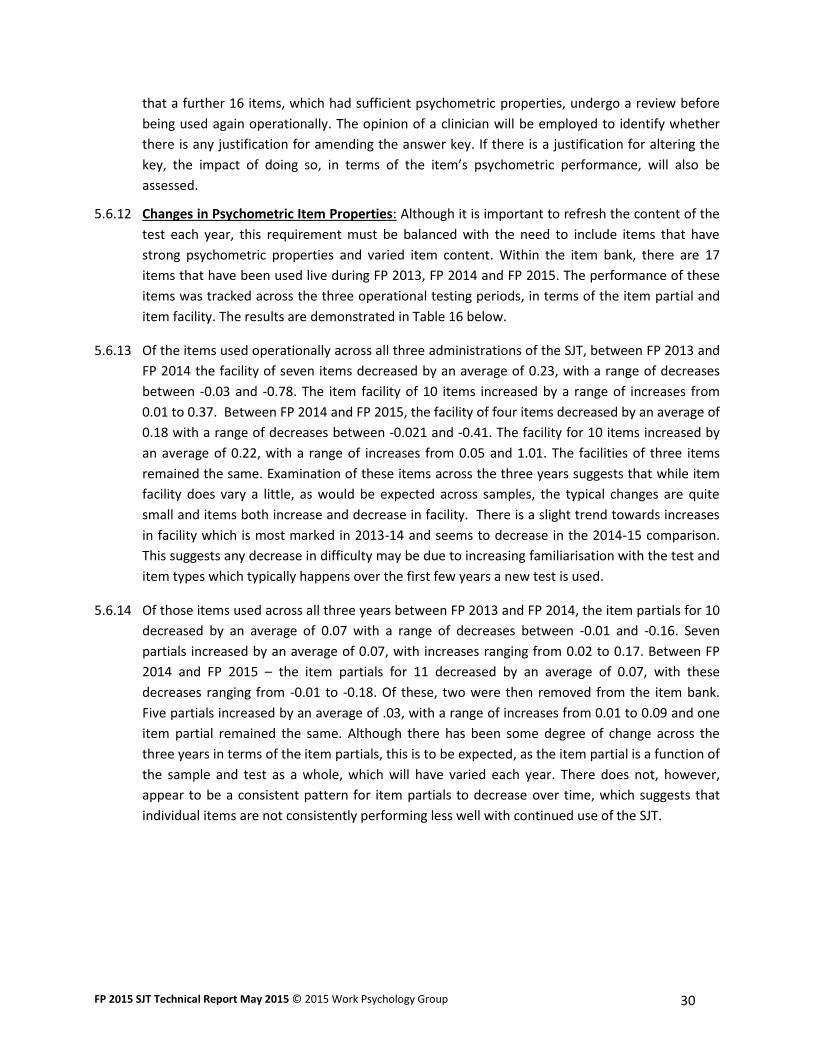
5.6.12 Changes in Psychometric Item Properties: Although it is important to refresh the content of the
test each year, this requirement must be balanced with the need to include items that have
strong psychometric properties and varied item content. Within the item bank, there are 17
items that have been used live during FP 2013, FP 2014 and FP 2015. The performance of these
items was tracked across the three operational testing periods, in terms of the item partial and
item facility. The results are demonstrated in Table 16 below.
5.6.13 Of the items used operationally across all three administrations of the SJT, between FP 2013 and
FP 2014 the facility of seven items decreased by an average of 0.23, with a range of decreases
between -0.03 and -0.78. The item facility of 10 items increased by a range of increases from
0.01 to 0.37. Between FP 2014 and FP 2015, the facility of four items decreased by an average of
0.18 with a range of decreases between -0.021 and -0.41. The facility for 10 items increased by
an average of 0.22, with a range of increases from 0.05 and 1.01. The facilities of three items
remained the same. Examination of these items across the three years suggests that while item
facility does vary a little, as would be expected across samples, the typical changes are quite
small and items both increase and decrease in facility. There is a slight trend towards increases
in facility which is most marked in 2013-14 and seems to decrease in the 2014-15 comparison.
This suggests any decrease in difficulty may be due to increasing familiarisation with the test and
item types which typically happens over the first few years a new test is used.
5.6.14 Of those items used across all three years between FP 2013 and FP 2014, the item partials for 10
decreased by an average of 0.07 with a range of decreases between -0.01 and -0.16. Seven
partials increased by an average of 0.07, with increases ranging from 0.02 to 0.17. Between FP
2014 and FP 2015 – the item partials for 11 decreased by an average of 0.07, with these
decreases ranging from -0.01 to -0.18. Of these, two were then removed from the item bank.
Five partials increased by an average of .03, with a range of increases from 0.01 to 0.09 and one
item partial remained the same. Although there has been some degree of change across the
three years in terms of the item partials, this is to be expected, as the item partial is a function of
the sample and test as a whole, which will have varied each year. There does not, however,
appear to be a consistent pattern for item partials to decrease over time, which suggests that
individual items are not consistently performing less well with continued use of the SJT.
FP 2015 SJT Technical Report May 2015 © 2015 Work Psychology Group 31
Table 16: Psychometric properties of operational items used in FP 2013-2015
Items used Item type Facility SD Partial
2013* 2014* 2015* 2013 2014 2015 2013 2014 2015
Item 1 Ranking 17.6 17.4 17.5 1.91 1.74 1.70 0.28 0.19 0.12
Item 2 Ranking 17.9 18.1 18.1 2.18 2.08 2.00 0.21 0.24 0.19
Item 3 Ranking 16.6 16.8 16.7 2.12 1.93 1.93 0.22 0.19 0.20
Item 4 Ranking 16.9 17.0 17.2 1.95 2.02 1.94 0.16 0.18 0.17
Item 5 Ranking 18.9 18.8 18.9 1.52 1.73 1.39 0.24 0.41 0.24
Item 6 Ranking 16.5 16.7 16.7 1.99 1.81 1.76 0.30 0.17 0.16
Item 7 Ranking 17.1 17.4 17.3 2.50 2.13 2.21 0.33 0.17 0.20
Item 8 Ranking 16.8 16.9 17.0 2.15 2.08 2.13 0.16 0.18 0.17
Item 9 Ranking 16.2 16.2 16.2 2.30 2.36 2.31 0.24 0.20 0.21
Item 10 Ranking 18.0 17.9 17.5 1.96 1.88 2.13 0.27 0.18 0.26
Item 11 Ranking 17.0 17.2 17.4 1.80 2.00 2.17 0.16 0.31 0.22
Item 12 Multiple Response 8.6 7.8 8.8 2.40 2.36 2.17 0.25 0.22 0.10
Item 13 Multiple Response 10.8 10.6 10.7 1.98 2.04 2.05 0.18 0.26 0.17
Item 14 Multiple Response 10.0 10.3 10.5 2.33 2.2 2.19 0.24 0.24 0.20
Item 15 Multiple Response 9.5 9.5 9.5 2.22 2.2 2.16 0.20 0.23 0.14
Item 16 Multiple Response 8.6 8.2 8.5 2.45 2.56 2.56 0.26 0.17 0.16
Item 17 Multiple Response 11.3 11.2 11.3 1.67 1.69 1.66 0.25 0.20 0.23
*FP 2013 n=8162; FP 2014 n=7957; FP 2015 n=8088.
5.7 Group Differences
5.7.1 In order to examine fairness issues regarding the use of an SJT for selection into the FP, group
differences in performance at a test level (equated scores) were analysed on the basis of age,
gender, ethnicity, and country of medical education.
5.7.2 Age: In terms of age, there is a negative correlation between age and the SJT scores (r = –.06, p
< .001), with younger applicants scoring significantly higher on the SJT than older applicants.
However, this correlation represents a negligible association (Davis, 197117). This finding is in line
with previous findings from FP 2014 (r = -.11, p < .001) and FP 2013 (r = -.075, p < .001), and
therefore the effects of age on SJT performance should continue to be monitored.
17
Davis, J. A. (1971). Elementary survey analysis. Englewood Cliffs, NJ: Prentice–Hall.
FP 2015 SJT Technical Report May 2015 © 2015 Work Psychology Group 32
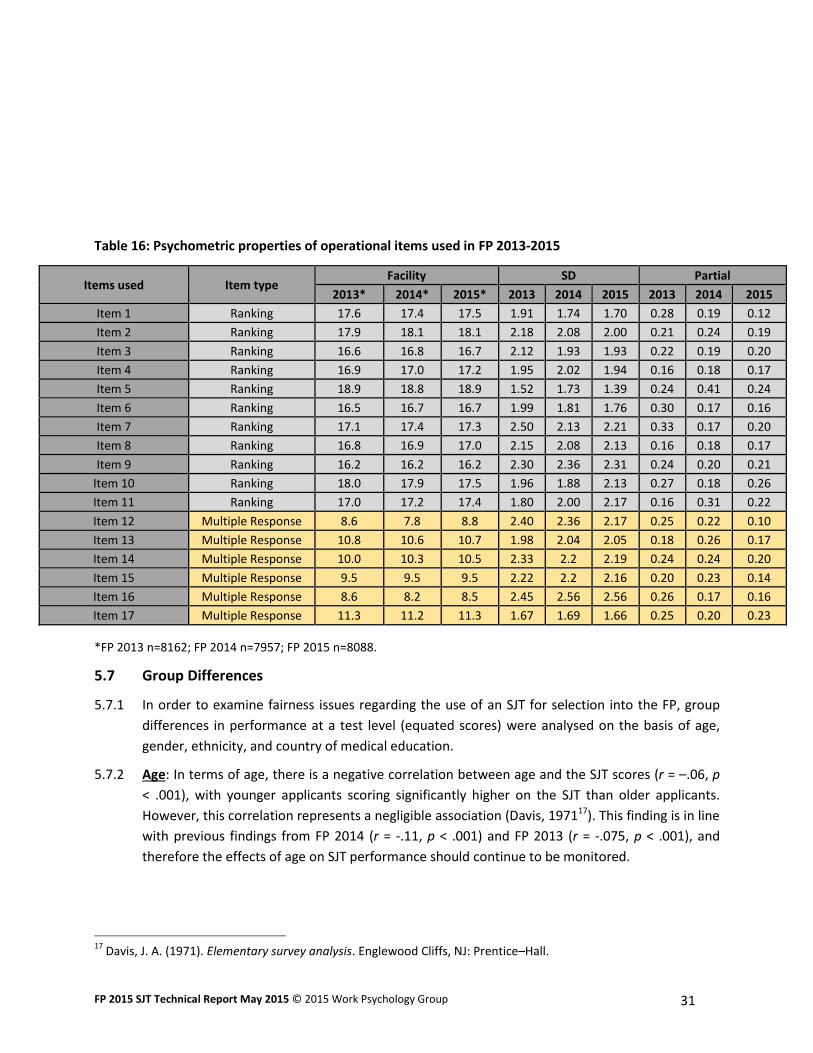
5.7.3 Gender: Table 17 shows group differences in performance on the SJT based on gender. Overall,
female applicants score significantly higher than male applicants by 0.27 SDs. A t-test18 revealed
that the difference is statistically significant (p < .001, t = -11.44, d = 0.26). Cohen’s d19, which
quantifies the magnitude of the difference in the mean SJT scores for males and females, can be
classified as a small effect size. The difference is consistent with that found during FP 2014 (p <
.001, d = 0.22).In FP 2013 the observed difference between males and females was non-
significant.
Table 17: SJT group differences by gender
Gender N Mean SD T-test Sig. Cohen’s d
Equated SJT
score
Male 3484 883.3 30.63 p < .001 0.26
Female 4474 891.0 28.77
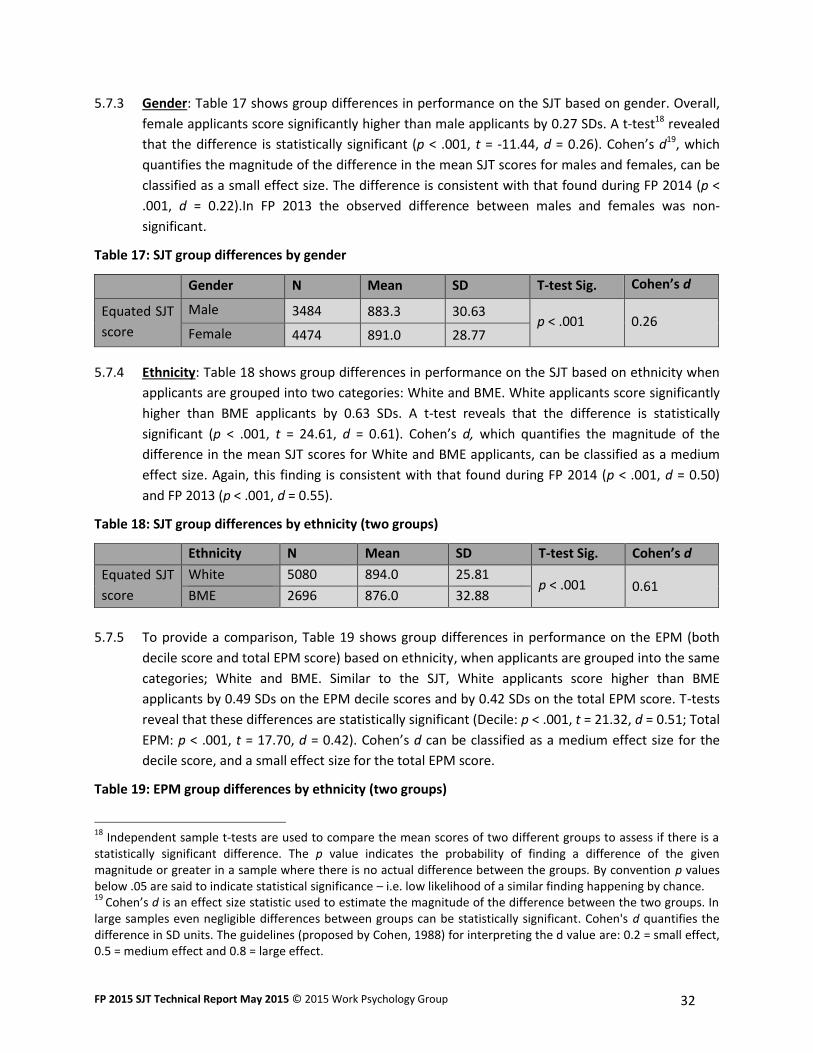
5.7.4 Ethnicity: Table 18 shows group differences in performance on the SJT based on ethnicity when
applicants are grouped into two categories: White and BME. White applicants score significantly
higher than BME applicants by 0.63 SDs. A t-test reveals that the difference is statistically
significant (p < .001, t = 24.61, d = 0.61). Cohen’s d, which quantifies the magnitude of the
difference in the mean SJT scores for White and BME applicants, can be classified as a medium
effect size. Again, this finding is consistent with that found during FP 2014 (p < .001, d = 0.50)
and FP 2013 (p < .001, d = 0.55).
Table 18: SJT group differences by ethnicity (two groups)
Ethnicity N Mean SD T-test Sig. Cohen’s d
Equated SJT
score
White 5080 894.0 25.81 p < .001 0.61
BME 2696 876.0 32.88
5.7.5 To provide a comparison, Table 19 shows group differences in performance on the EPM (both
decile score and total EPM score) based on ethnicity, when applicants are grouped into the same
categories; White and BME. Similar to the SJT, White applicants score higher than BME
applicants by 0.49 SDs on the EPM decile scores and by 0.42 SDs on the total EPM score. T-tests
reveal that these differences are statistically significant (Decile: p < .001, t = 21.32, d = 0.51; Total
EPM: p < .001, t = 17.70, d = 0.42). Cohen’s d can be classified as a medium effect size for the
decile score, and a small effect size for the total EPM score.
Table 19: EPM group differences by ethnicity (two groups)
18
Independent sample t-tests are used to compare the mean scores of two different groups to assess if there is a statistically significant difference. The p value indicates the probability of finding a difference of the given magnitude or greater in a sample where there is no actual difference between the groups. By convention p values below .05 are said to indicate statistical significance – i.e. low likelihood of a similar finding happening by chance. 19
Cohen’s d is an effect size statistic used to estimate the magnitude of the difference between the two groups. In large samples even negligible differences between groups can be statistically significant. Cohen's d quantifies the difference in SD units. The guidelines (proposed by Cohen, 1988) for interpreting the d value are: 0.2 = small effect, 0.5 = medium effect and 0.8 = large effect.
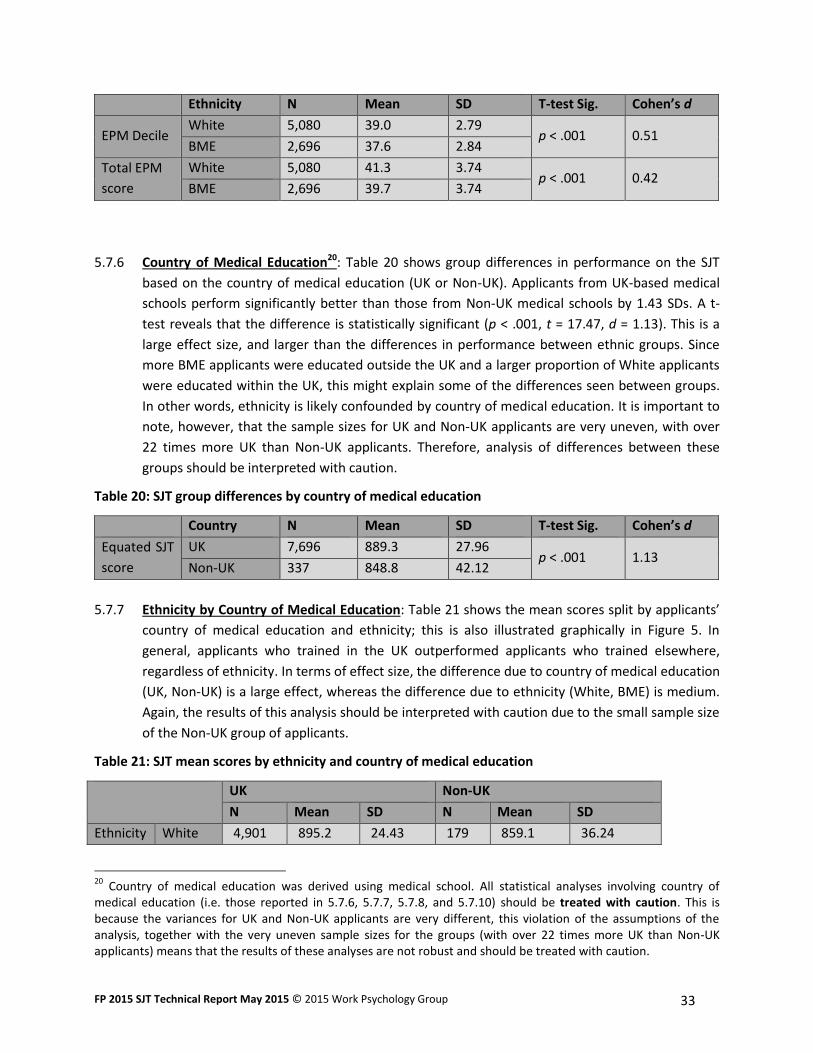
FP 2015 SJT Technical Report May 2015 © 2015 Work Psychology Group 33
Ethnicity N Mean SD T-test Sig. Cohen’s d
EPM Decile White 5,080 39.0 2.79
p < .001 0.51 BME 2,696 37.6 2.84
Total EPM
score
White 5,080 41.3 3.74 p < .001 0.42
BME 2,696 39.7 3.74
5.7.6 Country of Medical Education20: Table 20 shows group differences in performance on the SJT
based on the country of medical education (UK or Non-UK). Applicants from UK-based medical
schools perform significantly better than those from Non-UK medical schools by 1.43 SDs. A t-
test reveals that the difference is statistically significant (p < .001, t = 17.47, d = 1.13). This is a
large effect size, and larger than the differences in performance between ethnic groups. Since
more BME applicants were educated outside the UK and a larger proportion of White applicants
were educated within the UK, this might explain some of the differences seen between groups.
In other words, ethnicity is likely confounded by country of medical education. It is important to
note, however, that the sample sizes for UK and Non-UK applicants are very uneven, with over
22 times more UK than Non-UK applicants. Therefore, analysis of differences between these
groups should be interpreted with caution.
Table 20: SJT group differences by country of medical education
Country N Mean SD T-test Sig. Cohen’s d
Equated SJT
score
UK 7,696 889.3 27.96 p < .001 1.13
Non-UK 337 848.8 42.12
5.7.7 Ethnicity by Country of Medical Education: Table 21 shows the mean scores split by applicants’
country of medical education and ethnicity; this is also illustrated graphically in Figure 5. In
general, applicants who trained in the UK outperformed applicants who trained elsewhere,
regardless of ethnicity. In terms of effect size, the difference due to country of medical education
(UK, Non-UK) is a large effect, whereas the difference due to ethnicity (White, BME) is medium.
Again, the results of this analysis should be interpreted with caution due to the small sample size
of the Non-UK group of applicants.
Table 21: SJT mean scores by ethnicity and country of medical education
UK Non-UK
N Mean SD N Mean SD
Ethnicity White 4,901 895.2 24.43 179 859.1 36.24
20
Country of medical education was derived using medical school. All statistical analyses involving country of medical education (i.e. those reported in 5.7.6, 5.7.7, 5.7.8, and 5.7.10) should be treated with caution. This is because the variances for UK and Non-UK applicants are very different, this violation of the assumptions of the analysis, together with the very uneven sample sizes for the groups (with over 22 times more UK than Non-UK applicants) means that the results of these analyses are not robust and should be treated with caution.
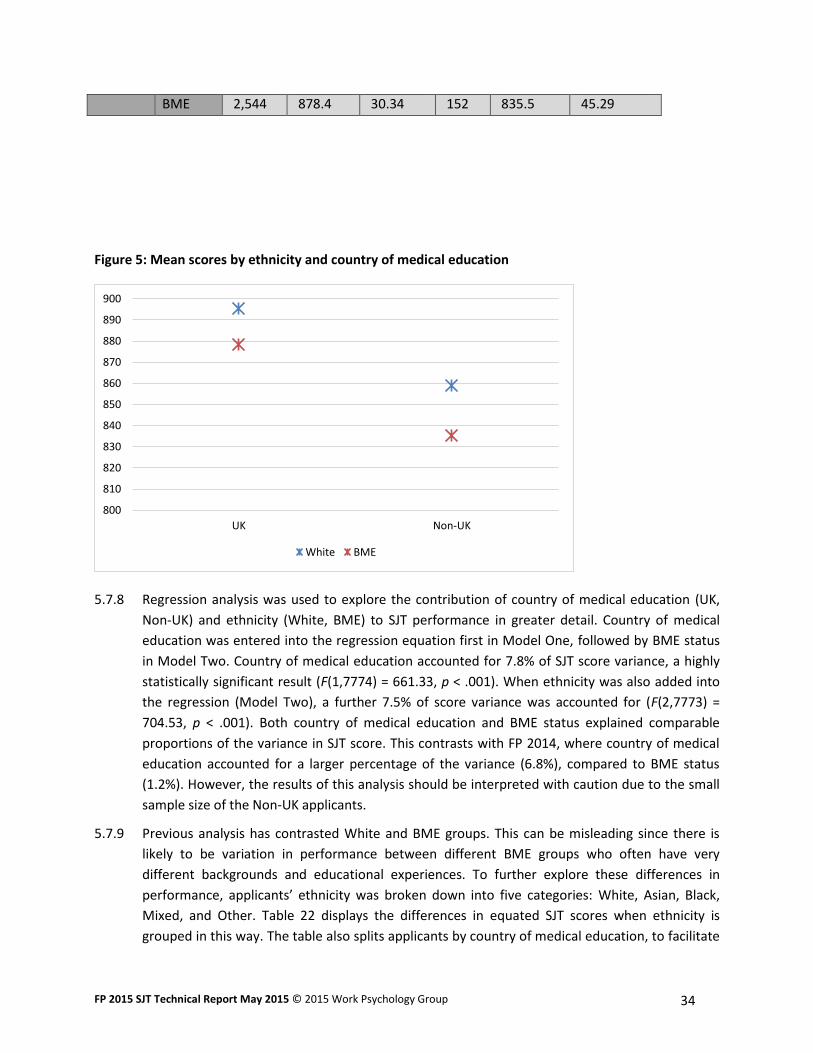
FP 2015 SJT Technical Report May 2015 © 2015 Work Psychology Group 34
BME 2,544 878.4 30.34 152 835.5 45.29
Figure 5: Mean scores by ethnicity and country of medical education
5.7.8 Regression analysis was used to explore the contribution of country of medical education (UK,
Non-UK) and ethnicity (White, BME) to SJT performance in greater detail. Country of medical
education was entered into the regression equation first in Model One, followed by BME status
in Model Two. Country of medical education accounted for 7.8% of SJT score variance, a highly
statistically significant result (F(1,7774) = 661.33, p < .001). When ethnicity was also added into
the regression (Model Two), a further 7.5% of score variance was accounted for (F(2,7773) =
704.53, p < .001). Both country of medical education and BME status explained comparable
proportions of the variance in SJT score. This contrasts with FP 2014, where country of medical
education accounted for a larger percentage of the variance (6.8%), compared to BME status
(1.2%). However, the results of this analysis should be interpreted with caution due to the small
sample size of the Non-UK applicants.
5.7.9 Previous analysis has contrasted White and BME groups. This can be misleading since there is
likely to be variation in performance between different BME groups who often have very
different backgrounds and educational experiences. To further explore these differences in
performance, applicants’ ethnicity was broken down into five categories: White, Asian, Black,
Mixed, and Other. Table 22 displays the differences in equated SJT scores when ethnicity is
grouped in this way. The table also splits applicants by country of medical education, to facilitate
800
810
820
830
840
850
860
870
880
890
900
UK Non-UK
White BME
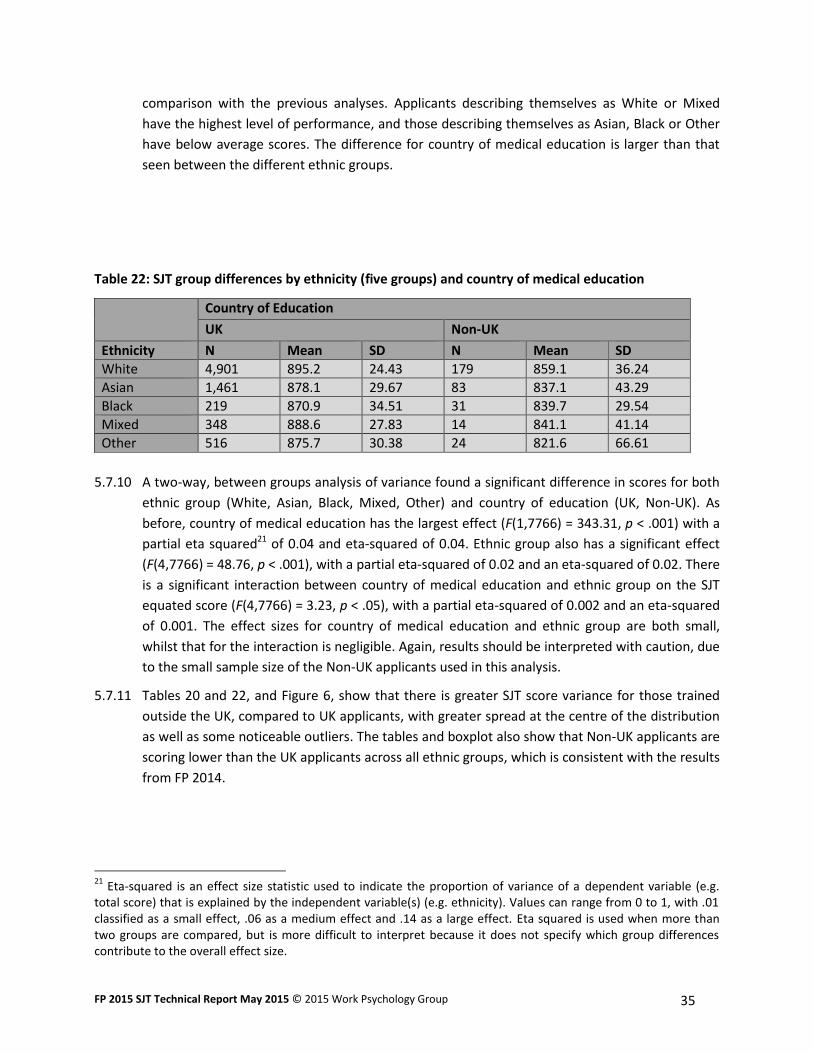
FP 2015 SJT Technical Report May 2015 © 2015 Work Psychology Group 35
comparison with the previous analyses. Applicants describing themselves as White or Mixed
have the highest level of performance, and those describing themselves as Asian, Black or Other
have below average scores. The difference for country of medical education is larger than that
seen between the different ethnic groups.
Table 22: SJT group differences by ethnicity (five groups) and country of medical education
Country of Education
UK Non-UK
Ethnicity N Mean SD N Mean SD
White 4,901 895.2 24.43 179 859.1 36.24
Asian 1,461 878.1 29.67 83 837.1 43.29
Black 219 870.9 34.51 31 839.7 29.54
Mixed 348 888.6 27.83 14 841.1 41.14
Other 516 875.7 30.38 24 821.6 66.61
5.7.10 A two-way, between groups analysis of variance found a significant difference in scores for both
ethnic group (White, Asian, Black, Mixed, Other) and country of education (UK, Non-UK). As
before, country of medical education has the largest effect (F(1,7766) = 343.31, p < .001) with a
partial eta squared21 of 0.04 and eta-squared of 0.04. Ethnic group also has a significant effect
(F(4,7766) = 48.76, p < .001), with a partial eta-squared of 0.02 and an eta-squared of 0.02. There
is a significant interaction between country of medical education and ethnic group on the SJT
equated score (F(4,7766) = 3.23, p < .05), with a partial eta-squared of 0.002 and an eta-squared
of 0.001. The effect sizes for country of medical education and ethnic group are both small,
whilst that for the interaction is negligible. Again, results should be interpreted with caution, due
to the small sample size of the Non-UK applicants used in this analysis.
5.7.11 Tables 20 and 22, and Figure 6, show that there is greater SJT score variance for those trained
outside the UK, compared to UK applicants, with greater spread at the centre of the distribution
as well as some noticeable outliers. The tables and boxplot also show that Non-UK applicants are
scoring lower than the UK applicants across all ethnic groups, which is consistent with the results
from FP 2014.
21
Eta-squared is an effect size statistic used to indicate the proportion of variance of a dependent variable (e.g. total score) that is explained by the independent variable(s) (e.g. ethnicity). Values can range from 0 to 1, with .01 classified as a small effect, .06 as a medium effect and .14 as a large effect. Eta squared is used when more than two groups are compared, but is more difficult to interpret because it does not specify which group differences contribute to the overall effect size.
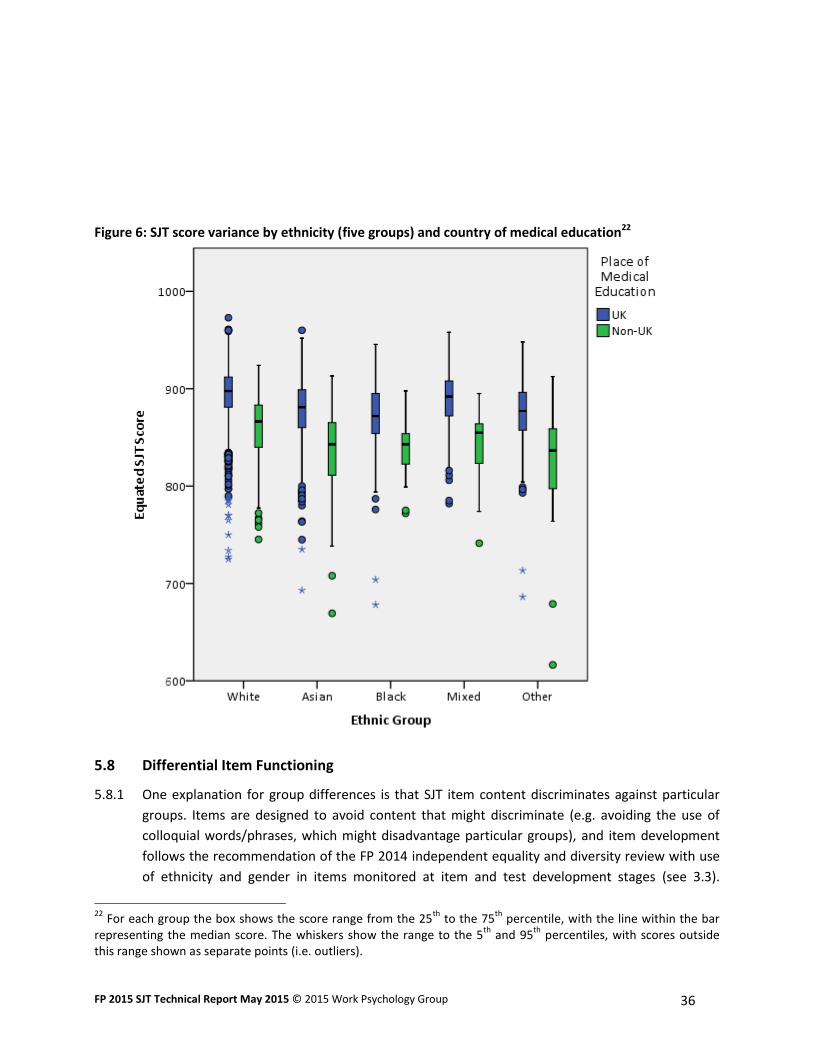
FP 2015 SJT Technical Report May 2015 © 2015 Work Psychology Group 36
Figure 6: SJT score variance by ethnicity (five groups) and country of medical education22
5.8 Differential Item Functioning
5.8.1 One explanation for group differences is that SJT item content discriminates against particular
groups. Items are designed to avoid content that might discriminate (e.g. avoiding the use of
colloquial words/phrases, which might disadvantage particular groups), and item development
follows the recommendation of the FP 2014 independent equality and diversity review with use
of ethnicity and gender in items monitored at item and test development stages (see 3.3).
22
For each group the box shows the score range from the 25th
to the 75th
percentile, with the line within the bar representing the median score. The whiskers show the range to the 5
th and 95
th percentiles, with scores outside
this range shown as separate points (i.e. outliers).
FP 2015 SJT Technical Report May 2015 © 2015 Work Psychology Group 37
Another explanation for group differences in performance is that there exist real differences
between groups of applicants, which can be due to differences in experience, attitudes or
differential self-selection.
5.8.2 Differential Item Functioning (DIF) analysis was performed to identify whether individual items
are differentially difficult for members of different groups (i.e. based on gender and ethnicity).
DIF analysis considers whether the prediction of an item’s score is improved by including the
background grouping variable in a regression equation after total score has been entered. A
positive result suggests that people with similar overall scores from different groups have
different success rates on the item. However, because of the number of statistical tests involved,
there is a danger that random differences may reach statistical significance (type 1 error). For
this reason, positive results are treated as ‘flags’ for further investigation of items, rather than
confirmation of difference or bias.
5.8.3 Gender DIF: 28 (28.3%) items were flagged for gender differences (males were favoured on 15
items, and females on 13). This is similar to FP 2014 when 27 items were flagged for gender
differences (31 in FP 2013). None of the differences reached the small effect size level, therefore
indicating that the differences between males and females on these items are negligible. Of the
items flagged for gender differences, 10 had previously been flagged as exhibiting the same
gender differences when previously piloted or used operationally.
5.8.4 Ethnicity DIF: 33 (33.3%) items were flagged for ethnicity differences (White applicants were
favoured on 16 items, and BME on 17). This is an increase from FP 2014, when nine items were
flagged for ethnicity differences (22 in FP 2013). However, none of the differences reached the
small effect size level, therefore indicating that the differences between White and BME
applicants on these items are negligible. Of the items flagged for ethnicity differences, 10 had
previously been flagged as exhibiting the same ethnicity differences when previously piloted or
used operationally.
5.8.5 Given the majority of items were not flagged for ethnicity or gender differences, and those that
were demonstrated negligible effects23, these results suggest that group differences at a test
level are not likely the result of the test being more difficult for some groups. Therefore,
explanations of group difference must be sought in other factors.
5.8.6 Content Review: All items flagged for gender and ethnicity differences were reviewed to identify
whether there appears to be any bias in the item content. From this review, two items were
identified as potentially demonstrating bias due to their content (one relates to treating a
patient of the opposite gender who has requested same-sex care, and the other concerns a
patient who is frequently requesting for you personally to attend them). It is recommended that
both of these items are subject to further review by a clinical expert, to identify if it is possible to
adjust the wording and reduce the likelihood of bias. Another two items have been identified as
having demonstrated the same DIF across the three years. From an initial review, no issues have
23
The R2
values in the DIF analysis for both gender and ethnicity ranged from .001 to .013. Therefore, even the largest value did not reach the small effect size level of .0196 (Cohen. J. (1988). Statistical power analysis for the behavioral sciences (2nd ed.). Hillsdale, NJ: Lawrence Erlbaum.).
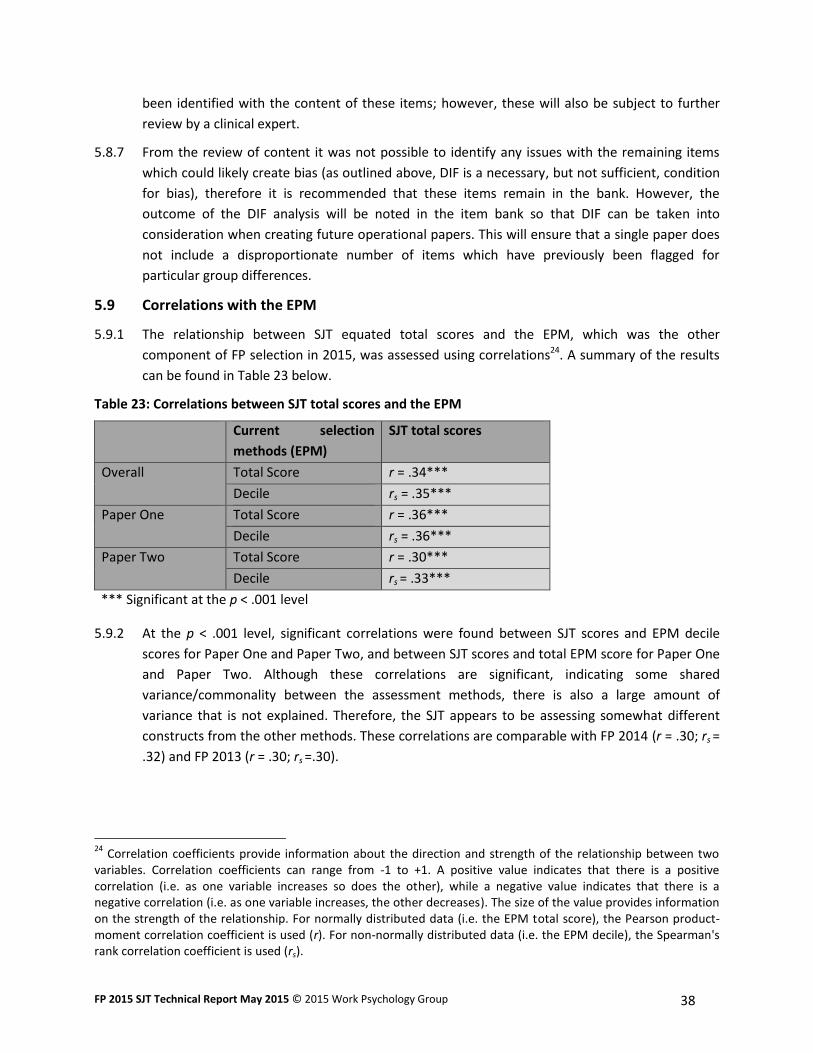
FP 2015 SJT Technical Report May 2015 © 2015 Work Psychology Group 38
been identified with the content of these items; however, these will also be subject to further
review by a clinical expert.
5.8.7 From the review of content it was not possible to identify any issues with the remaining items
which could likely create bias (as outlined above, DIF is a necessary, but not sufficient, condition
for bias), therefore it is recommended that these items remain in the bank. However, the
outcome of the DIF analysis will be noted in the item bank so that DIF can be taken into
consideration when creating future operational papers. This will ensure that a single paper does
not include a disproportionate number of items which have previously been flagged for
particular group differences.
5.9 Correlations with the EPM
5.9.1 The relationship between SJT equated total scores and the EPM, which was the other
component of FP selection in 2015, was assessed using correlations24. A summary of the results
can be found in Table 23 below.
Table 23: Correlations between SJT total scores and the EPM
Current selection
methods (EPM)
SJT total scores
Overall Total Score r = .34***
Decile rs = .35***
Paper One Total Score r = .36***
Decile rs = .36***
Paper Two Total Score r = .30***
Decile rs = .33***
*** Significant at the p < .001 level
5.9.2 At the p < .001 level, significant correlations were found between SJT scores and EPM decile
scores for Paper One and Paper Two, and between SJT scores and total EPM score for Paper One
and Paper Two. Although these correlations are significant, indicating some shared
variance/commonality between the assessment methods, there is also a large amount of
variance that is not explained. Therefore, the SJT appears to be assessing somewhat different
constructs from the other methods. These correlations are comparable with FP 2014 (r = .30; rs =
.32) and FP 2013 (r = .30; rs =.30).
24
Correlation coefficients provide information about the direction and strength of the relationship between two variables. Correlation coefficients can range from -1 to +1. A positive value indicates that there is a positive correlation (i.e. as one variable increases so does the other), while a negative value indicates that there is a negative correlation (i.e. as one variable increases, the other decreases). The size of the value provides information on the strength of the relationship. For normally distributed data (i.e. the EPM total score), the Pearson product-moment correlation coefficient is used (r). For non-normally distributed data (i.e. the EPM decile), the Spearman's rank correlation coefficient is used (rs).
FP 2015 SJT Technical Report May 2015 © 2015 Work Psychology Group 39
5.10 Item Level Analysis – Trial Items
5.10.1 Fourteen sets of items were trialled in the FP 2015 SJT, with each set consisting of seven ranking
and three multiple choice items. Eleven sets were trialled alongside operational Paper One, and
three alongside Paper Two. One set from Paper One was also trialled alongside Paper Three. The
number of applicants completing each trial set ranged from 519 to 689 providing an appropriate
sample size to enable robust analysis to take place. Trial sets were allocated across different
schools and therefore the samples are not randomly allocated, meaning there is a risk that
differences between papers could be affected by differences in performance across the different
sample populations.
5.10.2 Item analysis was used to look at the difficulty (item facility) and quality (item partial) of trial SJT
items. Together these can help to identify how well the items differentiate between applicants
and the results are used to identify which items can enter the operational item bank and which
items may need further refinement. The same criteria are applied as per the operational item
level analysis. A distractor analysis was also undertaken to identify the answer key selected by
the best performing applicants, which is reviewed alongside the content of each item before
determining the final key, to ensure that the correct answer key is considering the appropriate
level of the applicants.
5.10.3 Item Facility: Table 27 outlines the item level statistics for all 14 sets of trial items. For the
ranking items, the mean facility value was broadly similar across papers, with Paper 14 displaying
a slightly lower mean facility (15.6), and Paper 7 and 8 demonstrating slightly higher mean
facilities (17.6 and 17.6, respectively). For the multiple choice items, the mean facility was
broadly similar across papers, with Paper 14 having the lowest mean facility value (8.1), and
Papers 6 and 7 having the highest mean facility values (10.1 and 10.3, respectively). For both the
multiple choice and ranking questions, the mean scores are moderately lower than for FP 2014,
which may be reflective of the effort to increase the level of complexity of the scenarios for
trialling in FP 2015.
5.10.4 The range of facility values for ranking items differed across papers. Papers 2, 4, 7 and 11 had a
smaller range (15.8-17.6, 15.8-18.2, 16.5-19.2 and 15.7-18.1, respectively), indicating that these
sets of trial items did not contain any particularly ‘difficult’ ranking items. Papers 8, 10 and 14
had somewhat larger ranges (13.7-19.0, 11.9-18.4 and 9.5-18.5, respectively), indicating a wider
range of ranking item difficulty. The SD range for ranking items is broadly similar across papers.
5.10.5 The range of facility values for multiple choice items differed across the different papers. Papers
1 and 13 had a smaller range (8.0-9.2 and 9.7-11.1, respectively), indicating that these sets of
trial items did not contain any particularly ‘difficult’ multiple choice items. Papers 2, 10 and 12
had somewhat larger ranges (5.4-10.7, 7.2-10.7 and 7.1-11.2), again indicating a wider range of
multiple choice question difficulty. The SD range for multiple choice items is also broadly similar
across papers.

FP 2015 SJT Technical Report May 2015 © 2015 Work Psychology Group 40
5.10.6 Items that are at the ‘easier’ end of the scale are reviewed alongside other psychometric
evidence (i.e. SD and partial) in relation to their inclusion in the item bank. This is to ensure that
the operational item bank does not contain too many ‘easy’ items.
Table 24: Trial Item level statistics: Facility values
Ranking Multiple Choice
N Mean Facility
Range SD Range Mean
Facility
Range SD Range
Paper 1 576 17.2 15.0-18.9 1.45-2.67 8.4 8.0-9.1 2.15-2.47
Paper 2 557 16.8 15.8-17.6 1.68-3.11 8.5 5.4-10.7 2.06-3.05
Paper 3 546 17.4 15.7-18.2 1.59-2.45 8.6 7.4-9.7 2.49-2.64
Paper 4 568 17.2 15.8-18.2 1.70-2.30 9.9 9.1-10.7 2.10-2.53
Paper 5 547 16.6 13.7-18.1 1.55-2.57 8.8 8.3-9.8 2.27-2.81
Paper 6 582 17.3 14.5-18.9 1.62-3.28 10.1 8.7-11.6 1.18-2.56
Paper 7 523 17.6 16.5-19.2 1.68-2.32 10.3 9.8-11.3 1.49-2.65
Paper 8 529 17.6 13.7-19.0 1.44-2.00 9.6 8.6-11.0 1.75-2.49
Paper 9 519 17.2 15.3-18.9 1.50-2.27 9.4 8.6-10.7 2.35-2.74
Paper 10 526 16.2 11.9-18.4 1.65-2.81 8.4 7.2-10.7 1.74-2.28
Paper 11 531 16.6 15.7-18.1 1.73-2.46 8.5 7.5-9.5 2.00-2.40
Paper 12 689 16.7 14.8-18.6 1.60-2.62 9.0 7.1-11.2 1.89-2.76
Paper 13 682 17.1 15.5-18.7 1.73-2.46 9.5 9.7-11.1 1.72-2.28
Paper 14 670 15.6 9.5-18.5 1.40-2.45 8.1 7.1-9.2 2.19-2.57
Overall (FP 2015) 8,045 16.9 9.5-19.2 1.40-3.28 9.1 5.4-11.6 1.18-3.05
Overall (FP 2014) 7,925 17.2 13.1-19.3 1.21-3.21 9.3 4.0-11.0 1.78-2.91
Overall (FP 2013) 8,156 16.68 13.56-19.1 1.36-3.30 8.74 6.61-10.67 2.11-3.05
5.10.7 Item Quality: Item quality is determined by the correlation of the trial item with the total score
on the operational items of the test. This analysis compares how individuals perform on a given
trial item with how they performed on the operational items of the test overall. Although the
item partial provides vital information in terms of how well an item is performing and helps to
decide whether to enter it into the operational item bank, this needs to be taken into
consideration with a number of other statistics (i.e. item facility and SD), as well as how the best
performing applicants performed (i.e. if the best performing applicants have a very different key
from that of the SMEs then it suggests that there may be problems with the item).
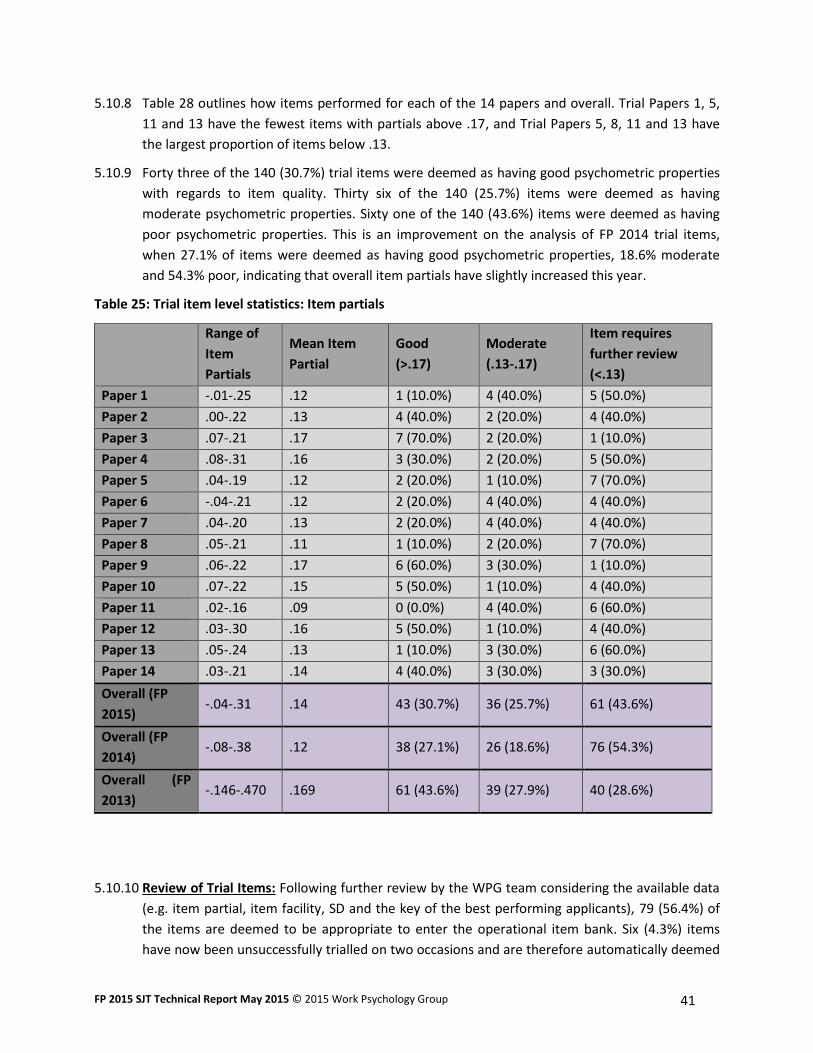
FP 2015 SJT Technical Report May 2015 © 2015 Work Psychology Group 41
5.10.8 Table 28 outlines how items performed for each of the 14 papers and overall. Trial Papers 1, 5,
11 and 13 have the fewest items with partials above .17, and Trial Papers 5, 8, 11 and 13 have
the largest proportion of items below .13.
5.10.9 Forty three of the 140 (30.7%) trial items were deemed as having good psychometric properties
with regards to item quality. Thirty six of the 140 (25.7%) items were deemed as having
moderate psychometric properties. Sixty one of the 140 (43.6%) items were deemed as having
poor psychometric properties. This is an improvement on the analysis of FP 2014 trial items,
when 27.1% of items were deemed as having good psychometric properties, 18.6% moderate
and 54.3% poor, indicating that overall item partials have slightly increased this year.
Table 25: Trial item level statistics: Item partials
Range of
Item
Partials
Mean Item
Partial
Good
(>.17)
Moderate
(.13-.17)
Item requires
further review
(<.13)
Paper 1 -.01-.25 .12 1 (10.0%) 4 (40.0%) 5 (50.0%)
Paper 2 .00-.22 .13 4 (40.0%) 2 (20.0%) 4 (40.0%)
Paper 3 .07-.21 .17 7 (70.0%) 2 (20.0%) 1 (10.0%)
Paper 4 .08-.31 .16 3 (30.0%) 2 (20.0%) 5 (50.0%)
Paper 5 .04-.19 .12 2 (20.0%) 1 (10.0%) 7 (70.0%)
Paper 6 -.04-.21 .12 2 (20.0%) 4 (40.0%) 4 (40.0%)
Paper 7 .04-.20 .13 2 (20.0%) 4 (40.0%) 4 (40.0%)
Paper 8 .05-.21 .11 1 (10.0%) 2 (20.0%) 7 (70.0%)
Paper 9 .06-.22 .17 6 (60.0%) 3 (30.0%) 1 (10.0%)
Paper 10 .07-.22 .15 5 (50.0%) 1 (10.0%) 4 (40.0%)
Paper 11 .02-.16 .09 0 (0.0%) 4 (40.0%) 6 (60.0%)
Paper 12 .03-.30 .16 5 (50.0%) 1 (10.0%) 4 (40.0%)
Paper 13 .05-.24 .13 1 (10.0%) 3 (30.0%) 6 (60.0%)
Paper 14 .03-.21 .14 4 (40.0%) 3 (30.0%) 3 (30.0%)
Overall (FP
2015) -.04-.31 .14 43 (30.7%) 36 (25.7%) 61 (43.6%)
Overall (FP
2014) -.08-.38 .12 38 (27.1%) 26 (18.6%) 76 (54.3%)
Overall (FP
2013) -.146-.470 .169 61 (43.6%) 39 (27.9%) 40 (28.6%)
5.10.10 Review of Trial Items: Following further review by the WPG team considering the available data
(e.g. item partial, item facility, SD and the key of the best performing applicants), 79 (56.4%) of
the items are deemed to be appropriate to enter the operational item bank. Six (4.3%) items
have now been unsuccessfully trialled on two occasions and are therefore automatically deemed
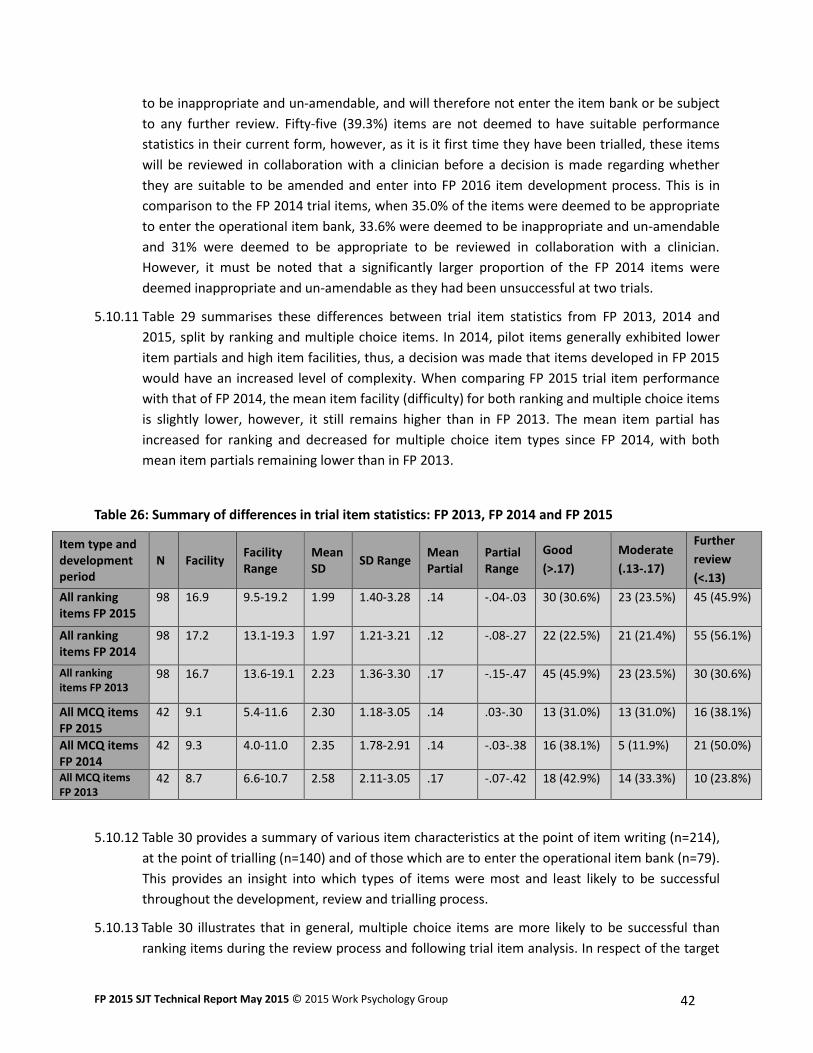
FP 2015 SJT Technical Report May 2015 © 2015 Work Psychology Group 42
to be inappropriate and un-amendable, and will therefore not enter the item bank or be subject
to any further review. Fifty-five (39.3%) items are not deemed to have suitable performance
statistics in their current form, however, as it is it first time they have been trialled, these items
will be reviewed in collaboration with a clinician before a decision is made regarding whether
they are suitable to be amended and enter into FP 2016 item development process. This is in
comparison to the FP 2014 trial items, when 35.0% of the items were deemed to be appropriate
to enter the operational item bank, 33.6% were deemed to be inappropriate and un-amendable
and 31% were deemed to be appropriate to be reviewed in collaboration with a clinician.
However, it must be noted that a significantly larger proportion of the FP 2014 items were
deemed inappropriate and un-amendable as they had been unsuccessful at two trials.
5.10.11 Table 29 summarises these differences between trial item statistics from FP 2013, 2014 and
2015, split by ranking and multiple choice items. In 2014, pilot items generally exhibited lower
item partials and high item facilities, thus, a decision was made that items developed in FP 2015
would have an increased level of complexity. When comparing FP 2015 trial item performance
with that of FP 2014, the mean item facility (difficulty) for both ranking and multiple choice items
is slightly lower, however, it still remains higher than in FP 2013. The mean item partial has
increased for ranking and decreased for multiple choice item types since FP 2014, with both
mean item partials remaining lower than in FP 2013.
Table 26: Summary of differences in trial item statistics: FP 2013, FP 2014 and FP 2015
Item type and development period
N Facility Facility Range
Mean SD
SD Range Mean Partial
Partial Range
Good
(>.17)
Moderate
(.13-.17)
Further
review
(<.13)
All ranking items FP 2015
98 16.9 9.5-19.2 1.99 1.40-3.28 .14 -.04-.03 30 (30.6%) 23 (23.5%) 45 (45.9%)
All ranking items FP 2014
98 17.2 13.1-19.3 1.97 1.21-3.21 .12 -.08-.27 22 (22.5%) 21 (21.4%) 55 (56.1%)
All ranking items FP 2013
98 16.7 13.6-19.1 2.23 1.36-3.30 .17 -.15-.47 45 (45.9%) 23 (23.5%) 30 (30.6%)
All MCQ items FP 2015
42 9.1 5.4-11.6 2.30 1.18-3.05 .14 .03-.30 13 (31.0%) 13 (31.0%) 16 (38.1%)
All MCQ items FP 2014
42 9.3 4.0-11.0 2.35 1.78-2.91 .14 -.03-.38 16 (38.1%) 5 (11.9%) 21 (50.0%)
All MCQ items FP 2013
42 8.7 6.6-10.7 2.58 2.11-3.05 .17 -.07-.42 18 (42.9%) 14 (33.3%) 10 (23.8%)
5.10.12 Table 30 provides a summary of various item characteristics at the point of item writing (n=214),
at the point of trialling (n=140) and of those which are to enter the operational item bank (n=79).
This provides an insight into which types of items were most and least likely to be successful
throughout the development, review and trialling process.
5.10.13 Table 30 illustrates that in general, multiple choice items are more likely to be successful than
ranking items during the review process and following trial item analysis. In respect of the target

FP 2015 SJT Technical Report May 2015 © 2015 Work Psychology Group 43
domains, those written under the ‘Commitment to Professionalism’ domain are most likely to be
successful during the review process, but these items are less likely to be successful following
trial item analysis. Those items written under the ‘Patient Focus’ and ‘Working Effectively as Part
of a Team’ domains are most likely to be successful following the trial item analysis.
5.10.14 Items which have previously been piloted are less likely to be successful during the review
process than those which are newly developed. Newly developed items are more likely to be
successful following the trial item analysis. However, this is because items which have already
been through more than one development cycle (i.e. ‘Previous Pilot’ items) are only taken
forward if they are deemed suitable to enter the operational item bank immediately. Those
‘Previous Pilot’ items which would have required further review will not be taken forward as they
have already been through at least one previous review and refinement process.
5.10.15 With regards to the different lead-in type (see 2.3.6) used for ranking items, those with the
‘Considerations’ and ‘Agreement’ lead-ins are least likely to be successful during the review
process. Items written using the ‘Order’ lead-in are most likely to be successful during the review
process, even more so than the traditional ‘Action’ lead-in types.
5.10.16 This year, items which ask applicants to rank responses in the order in which they should be
undertaken (‘Order’ items), performed best with 61.5% of the items trialled ready to enter the
operational item bank immediately. This is closely followed by the more traditional item format,
which asks about the appropriateness of different responses (‘Action’ items). These items have
performed consistently well, with 58% of the items trialled ready to enter the operational item
bank immediately. Once again, there is only a very small number of items asking applicants to
rank the extent to which they agreed with difference statements (‘Agreement’) items, therefore it
is still not possible to draw any particular conclusions about this item type. Consequently, this
item type will continue to be developed until more data is available to establish its overall
performance.
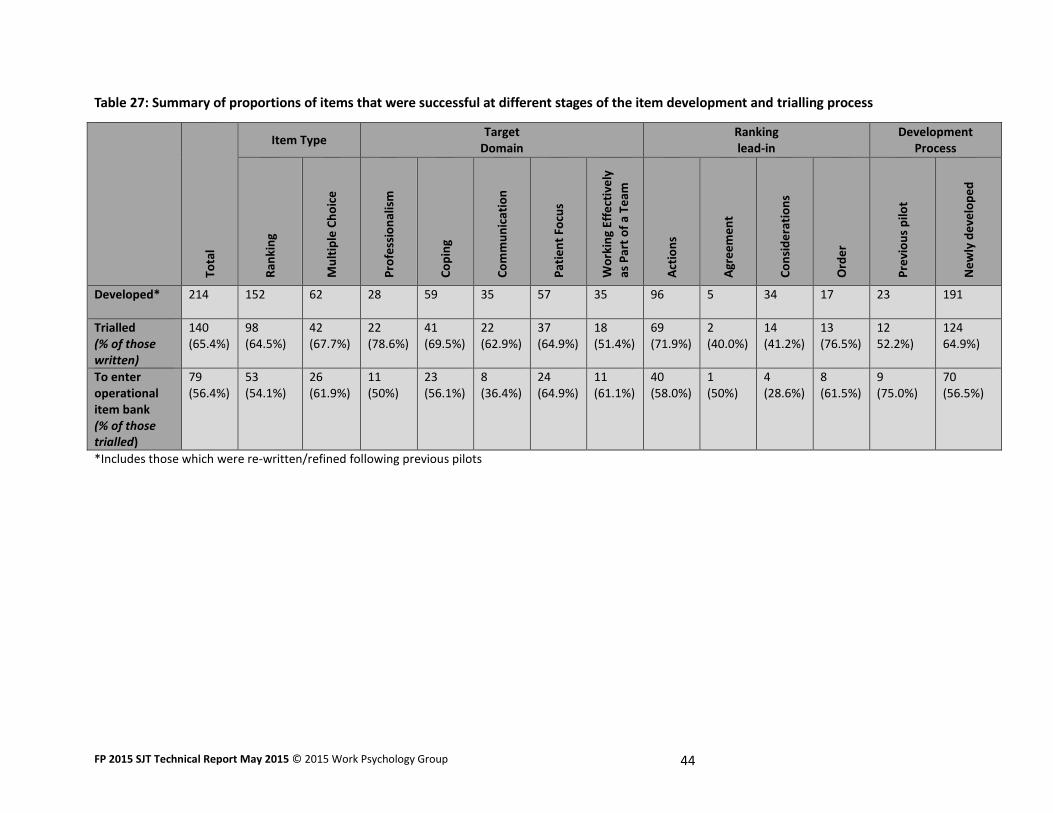
FP 2015 SJT Technical Report May 2015 © 2015 Work Psychology Group 44
Table 27: Summary of proportions of items that were successful at different stages of the item development and trialling process
Tota
l
Item Type Target
Domain Ranking lead-in
Development Process
Ran
kin
g
Mu
ltip
le C
ho
ice
Pro
fess
ion
alis
m
Co
pin
g
Co
mm
un
icat
ion
Pat
ien
t Fo
cus
Wo
rkin
g Ef
fect
ive
ly
as P
art
of
a Te
am
Act
ion
s
Agr
ee
me
nt
Co
nsi
de
rati
on
s
Ord
er
Pre
vio
us
pilo
t
Ne
wly
de
velo
pe
d
Developed*
214 152 62 28 59 35 57 35 96 5 34 17 23 191
Trialled (% of those written)
140 (65.4%)
98 (64.5%)
42 (67.7%)
22 (78.6%)
41 (69.5%)
22 (62.9%)
37 (64.9%)
18 (51.4%)
69 (71.9%)
2 (40.0%)
14 (41.2%)
13 (76.5%)
12 52.2%)
124 64.9%)
To enter operational item bank (% of those trialled)
79 (56.4%)
53 (54.1%)
26 (61.9%)
11 (50%)
23 (56.1%)
8 (36.4%)
24 (64.9%)
11 (61.1%)
40 (58.0%)
1 (50%)
4 (28.6%)
8 (61.5%)
9 (75.0%)
70 (56.5%)
*Includes those which were re-written/refined following previous pilots
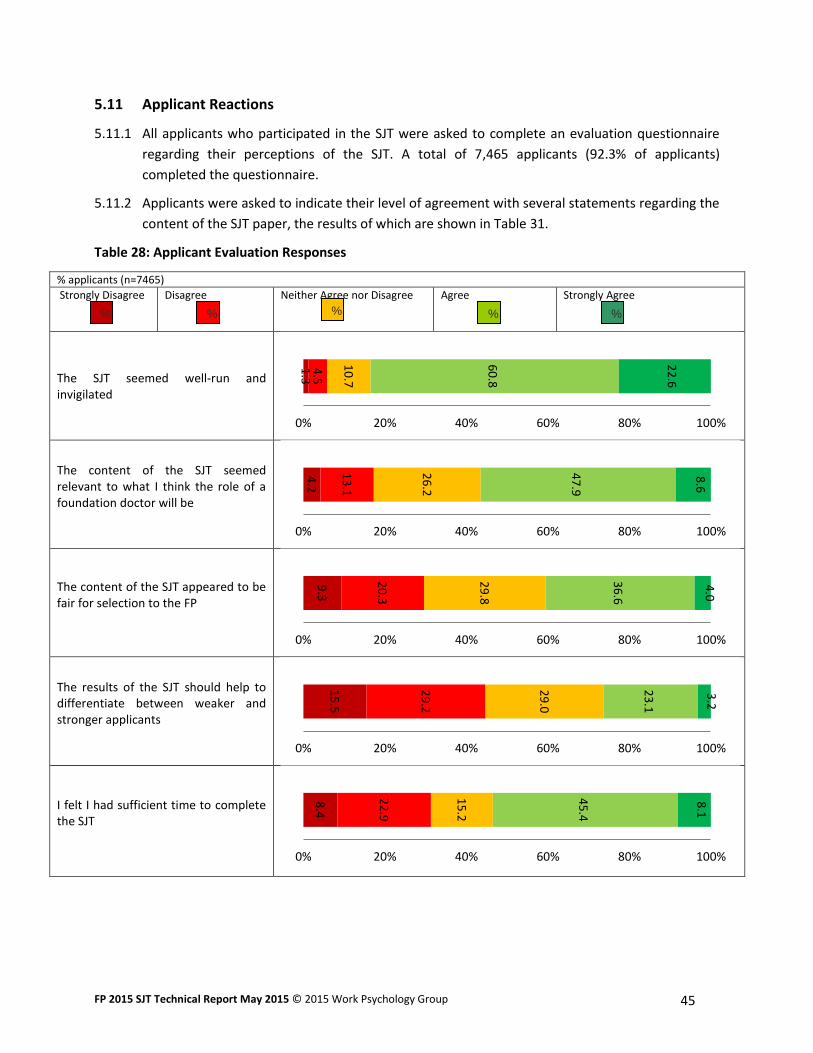
FP 2015 SJT Technical Report May 2015 © 2015 Work Psychology Group 45
5.11 Applicant Reactions
5.11.1 All applicants who participated in the SJT were asked to complete an evaluation questionnaire
regarding their perceptions of the SJT. A total of 7,465 applicants (92.3% of applicants)
completed the questionnaire.
5.11.2 Applicants were asked to indicate their level of agreement with several statements regarding the
content of the SJT paper, the results of which are shown in Table 31.
Table 28: Applicant Evaluation Responses
% applicants (n=7465)
Strongly Disagree
Disagree
Neither Agree nor Disagree
Agree
Strongly Agree
The SJT seemed well-run and invigilated
The content of the SJT seemed relevant to what I think the role of a foundation doctor will be
The content of the SJT appeared to be fair for selection to the FP
The results of the SJT should help to differentiate between weaker and stronger applicants
I felt I had sufficient time to complete the SJT
1.3
4
.5
10
.7
60
.8
22
.6
0% 20% 40% 60% 80% 100%
4.2
13
.1
26
.2
47
.9
8.6
0% 20% 40% 60% 80% 100%
9.3
20
.3
29
.8
36
.6
4.0
0% 20% 40% 60% 80% 100%
15
.5
29
.2
29
.0
23
.1
3.2
0% 20% 40% 60% 80% 100%
8.4
22
.9
15
.2
45
.4
8.1
0% 20% 40% 60% 80% 100%
% %
%
%
%
FP 2015 SJT Technical Report May 2015 © 2015 Work Psychology Group 46
5.11.3 83.4% of applicants agreed or strongly agreed that the SJT seemed to have been well run and
invigilated and 56.5% thought that the content seemed relevant to what they thought the role of
a foundation doctor would be. These results have decreased slightly when compared with the
applicant evaluation of FP 2014 when the percentages of applicants agreeing or strongly
agreeing with the same statements were 84.4% and 57.1% respectively. 53.5% of applicants
agreed or strongly agreed that they were given a sufficient amount of time to complete the SJT.
Again, this is a slightly lower percentage compared to FP 2014 when 56.8% of applicants agreed
or strongly agreed with the same statement.
5.11.4 40.6% of applicants agreed or strongly agreed that the content of the SJT appeared to be fair for
selection to the FP, however 29.8% of applicants neither agreed nor disagreed with this
statement. Only 26.3% of applicants agreed or strongly agreed that the results of the SJT should
help selectors to differentiate between weaker and stronger applicants, although 29.0% neither
agreed nor disagreed with this statement. These results mark a slight improvement from FP 2014
when the percentage of applicants agreeing or strongly agreeing with these statements was
40.4% and 26.1% respectively however there is further room to improve candidates’ perceptions
of the fairness of the SJT.
5.11.5 78.5% of applicants thought that the SJT was of an appropriate level of difficulty, with 1.2%
indicating that they believed the test was too easy, and 20.3% indicating that they thought the
test was too difficult. This again has seen a slight decrease since FP 2014 when 79.5% of
applicants thought that the SJT was of an appropriate level of difficulty.
5.11.6 Overall, the results of the applicant evaluation suggest that applicants’ perceptions of the way
the test was run, the relevance of the test and the level of test difficulty have decreased slightly
from FP 2014; however, they are still more positive than in FP 2013. Perceptions of the fairness
of test content as well as its ability to differentiate between applicants have improved very
slightly since FP 2014 and remain more positive than FP 2013, although overall percentage
agreement relating to these aspects is still quite low. These results suggest that there is room for
applicants’ perceptions to improve across all areas, especially regarding the way the test is run,
test relevance and level of difficulty as these areas have decreased since FP 2014.
FP 2015 SJT Technical Report May 2015 © 2015 Work Psychology Group 47
Part Three: Summary & Recommendations
6 Summary
6.1 This report details the operational use of the SJT for selection to FP 2015 as well as the
development of new items which were trialled alongside FP 2015.
6.2 Test completion analysis revealed that the majority of applicants (98.8%) answered all items
within the test, indicating that the time limit of 140 minutes is an appropriate length of time to
complete 70 items.
6.3 The psychometric analysis presented in this report supports all preceding evidence that the SJT is
a reliable tool that is able to differentiate sufficiently between applicants (with a mean reliability
of 0.71). Test-level analysis demonstrates that the three different versions of the test were
broadly similar, however test equating techniques are undertaken to ensure equivalence in
scores across the different versions.
6.4 Operational item level analysis revealed that the majority (75.8%) of the 99 operational items
used during FP 2015 can be classified as good or moderate in terms of their psychometric
properties. A more in-depth review of these items, including analysis of facility values suggests
that 24.2% of the items are recommended for removal from the item bank. A further 4.0% of
items flagged for gender and ethnicity differences will be subject to expert clinician review, prior
to further operational use.
6.5 Comparisons with the operational analysis of the FP 2014 SJT demonstrate that generally the
way in which applicants to FP 2015 responded to items was more likely to result in increased
item facilities, but similar partials. One explanation could be that that following the first two
operational uses of the SJT for FP 2013 and FP 2014, there has been an increase in guidance
available to applicants which has accounted for a difference in how the items are answered,
leading to an increased likelihood of scoring highly on operational items. This supports the
undertaking of operational test and item level analysis each year and highlights the importance
of continually developing new item content to avoid the over-exposure of individual SJT items.
The mean item facility for FP 2015 trial items is slightly lower than for those developed and
trialled in FP 2014, and the partials are slightly higher. Thus it is recommended that item content
is developed with an increased level of complexity again in FP 2016.
6.6 Group differences analysis reveals significant differences between performance in the test based
on ethnicity, country of medical training, age and gender. Female applicants outperformed male
applicants; White applicants outperformed BME applicants; UK trained applicants outperformed
Non-UK trained applicants; and younger applicants outperformed older applicants. For gender
and age, these effects were small and negligible, respectively. The effects for White and BME
applicants were medium, and those for UK and Non-UK applicants were large. Further analysis
reveals that country of medical education has a slightly larger effect on SJT score than ethnicity
(White, BME), but the effects were comparable. The result of DIF analysis reveals that group
differences at an item level have slightly increased since FP 2014, but the effects were negligible
FP 2015 SJT Technical Report May 2015 © 2015 Work Psychology Group 48
and do not provide support for the hypothesis that group differences are the result of items
which are more difficult for some groups. Therefore, explanations of group difference should be
sought in other factors.
6.7 Although applicant reactions to completing the SJT have decreased slightly since 2014, they still
remain generally favourable and demonstrate an overall improvement when compared to FP
2013. The proportion of applicants agreeing that the SJT was well run, contained relevant
content, was fair for selection to the FP and should differentiate between weaker and stronger
applicants were overall, largely positive. However, these results suggest that there is room for
applicants’ perceptions to improve across all areas for FP 2016.
6.8 Significant correlations were found between SJT scores and EPM decile scores, and between SJT
scores and total EPM scores. Whilst these correlations are significant, indicating a degree of
shared variance/commonality between the assessment methods, there is also a large amount of
the variance that is not explained, indicating that the SJT appears to be assessing somewhat
different constructs from the EPM.
6.9 One hundred and forty items were trialled alongside the operational items during FP 2015,
56.4% of these items are deemed to be appropriate to enter the operational item bank and
39.3% are deemed to appropriate to review in collaboration with an expert clinician potentially
to re-enter the trial item development process for FP 2015. The remaining 4.3% of items were
deemed to be inappropriate and un-amendable and therefore will not enter the item bank or be
subject to further review, as they have now been through the trial process twice and have not
been successful.
7 Alternative Approach to Scoring
7.1 An updated approach to scoring ranking items was modelled using the FP 2015 data (outlined in
Appendix 1), which assigns a minimum of eight points to each question. This alternative
approach would add to the scores of those who skip individual responses, whole questions and
also those who tie many responses for the ranking questions, and consequently ensures that
applicants who miss a question or tie responses are not penalised more than those who get the
question completely incorrect or who are guessing random responses.
7.2 In modelling this new approach, there was a very small change to the mean score and a small
number of individuals whose scores changed (135; 1.7%), which suggests that the alternative
approach to scoring had little or no impact for most applicants. The majority of these score
changes (80.7%) had little to no impact, with most scores increasing from between 0.5 and 10
points. However, a few out of range low scores increased substantially to look more like part of
the main distribution. These score changes resulted in a closer to normal distribution of scores
in comparison to the distribution of scores linked to the original scoring.
7.3 Following rescoring, both the skew and kurtosis reduced, indicating the rescoring is closer to a
normal distribution than the original scoring, although there remains a small negative skew and
positive kurtosis. The SD also reduced slightly in both papers following rescoring, indicating a
FP 2015 SJT Technical Report May 2015 © 2015 Work Psychology Group 49
small reduction in the spread of scores. The reliability remained the same for Paper One, and
reduced only slightly for Paper Two (from α=.72 to α=.71).
7.4 This alternative approach to scoring has little impact upon the majority of scores, yet removes
the anti-intuitive penalty for skipping responses, and also reduces very low outlier scores which
can distort the psychometric analysis, it is recommended that this alternative approach to
scoring is considered. However, it should be acknowledged that this approach only affects
ranking items and therefore it is recommended that this is considered alongside other potential
alternative scoring methods (which include multiple choice items) for FP 2016.
8 SME Involvement
8.1 The item development process should continue as for previous years, ensuring the involvement
of a diverse range of individuals, from a range of specialities, including the involvement of F2s. It
has been noted that F2s have provided particularly valuable input into the item development
process at both interview and review workshop stages, perhaps because they are closer to the
role than some senior clinicians. Following particularly good feedback obtained from F2s during
the review workshops in FP 2015, it is recommended that up to two F2s are recruited to take
part in each of the workshop groups, instead of just one individual.
8.2 For FP 2015, the method of volunteer recruitment involved asking leads within the Foundation
Schools to nominate five SMEs. This method of recruitment increased the number of volunteers
obtained for IDIs and review workshops. On this basis, it is recommended that the new
volunteers are requested each year to keep adding to the list of volunteers that exists.
9 Item Writing Methodology
9.1 In general, different item types should continue to be used as employing a range helps to keep
the item content fresh and varied, and also helps to avoid the potential impact of coaching
techniques. However, it is recommended that these items continue to be monitored to ensure
that they are performing well psychometrically.
9.2 Following the increase in item facility observed in FP 2014, new item content was developed
with added complexity for FP 2015, which may have contributed to the improved trial item
performance observed. Therefore, it is recommended that item writers continue to be briefed to
develop items with an appropriate element of dilemma and degree of complexity. Efforts should
also continue to monitor the availability of coaching guides, and ensure that those involved in
the item development process commit to maintaining the confidentiality of test items.
9.3 The findings from item level analysis should continue to be used to inform ongoing item
development. For example, existing items should be reviewed to determine if there are
particular characteristics of the content of poorly performing items which can be avoided in
future test development. Additionally, items flagged for either gender or ethnicity differences
should continue to be examined to identify if there are particular characteristics of the content
of these items which can be avoided in future test development.
FP 2015 SJT Technical Report May 2015 © 2015 Work Psychology Group 50
10 Scoring and Scaling
10.1 For FP 2015, each applicant’s total score was created by summing the total EPM score and the
scaled SJT score. The transformation was based on the distribution of the EPM scores which
helps to ensure that each exerts an equal weight on the overall score. As proposed in previous
years, an alternative approach would be to standardise both the SJT and EPM scores to a new
scale. This option revises both the SJT and EPM score scales to another scale with a
predetermined mean and SD. These can be set so that the scores will sit within the desired
range.
10.2 Using the above approach, rather than basing the scale on the distribution of the EPM each year,
has the benefit of ensuring that the scale will be the same from year to year even if there are
differences in the EPM scores.
10.3 The benefits of changing the scale need to be weighed against the potential for confusion if
those who use the scores are very familiar with the existing scale.
11 Perceptions of Fairness
11.1 There is still an issue around candidate perceptions of the fairness of the SJT and work should be
undertaken to improve upon this. The wording of the questions contained within the candidate
evaluation survey should also be revisited to ensure that the context of the SJT is clear.
11.2 Possible explanations for the group differences in SJT and EPM scores should continue to be
investigated and monitored.
11.3 The tagging of items for gender and ethnicity should continue to be undertaken to ensure that
there is appropriate representation of different demographic groups within the item bank and
test papers.
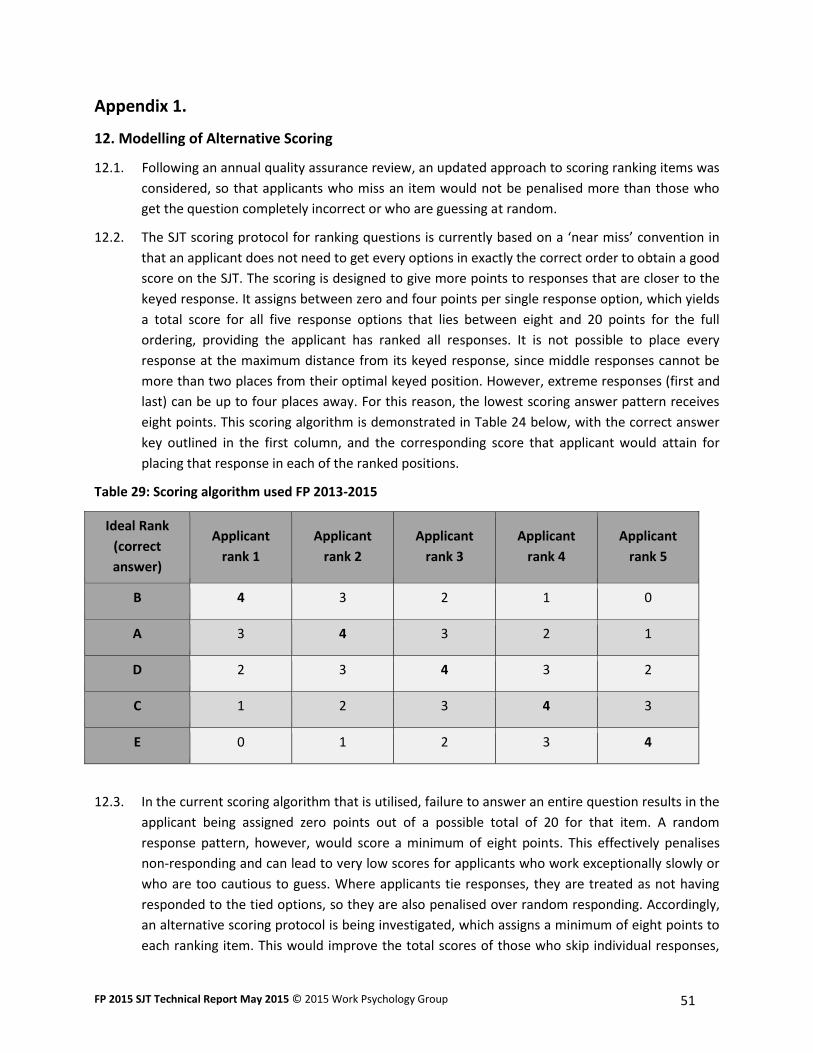
FP 2015 SJT Technical Report May 2015 © 2015 Work Psychology Group 51
Appendix 1.
12. Modelling of Alternative Scoring
12.1. Following an annual quality assurance review, an updated approach to scoring ranking items was
considered, so that applicants who miss an item would not be penalised more than those who
get the question completely incorrect or who are guessing at random.
12.2. The SJT scoring protocol for ranking questions is currently based on a ‘near miss’ convention in
that an applicant does not need to get every options in exactly the correct order to obtain a good
score on the SJT. The scoring is designed to give more points to responses that are closer to the
keyed response. It assigns between zero and four points per single response option, which yields
a total score for all five response options that lies between eight and 20 points for the full
ordering, providing the applicant has ranked all responses. It is not possible to place every
response at the maximum distance from its keyed response, since middle responses cannot be
more than two places from their optimal keyed position. However, extreme responses (first and
last) can be up to four places away. For this reason, the lowest scoring answer pattern receives
eight points. This scoring algorithm is demonstrated in Table 24 below, with the correct answer
key outlined in the first column, and the corresponding score that applicant would attain for
placing that response in each of the ranked positions.
Table 29: Scoring algorithm used FP 2013-2015
Ideal Rank
(correct
answer)
Applicant
rank 1
Applicant
rank 2
Applicant
rank 3
Applicant
rank 4
Applicant
rank 5
B 4 3 2 1 0
A 3 4 3 2 1
D 2 3 4 3 2
C 1 2 3 4 3
E 0 1 2 3 4
12.3. In the current scoring algorithm that is utilised, failure to answer an entire question results in the
applicant being assigned zero points out of a possible total of 20 for that item. A random
response pattern, however, would score a minimum of eight points. This effectively penalises
non-responding and can lead to very low scores for applicants who work exceptionally slowly or
who are too cautious to guess. Where applicants tie responses, they are treated as not having
responded to the tied options, so they are also penalised over random responding. Accordingly,
an alternative scoring protocol is being investigated, which assigns a minimum of eight points to
each ranking item. This would improve the total scores of those who skip individual responses,
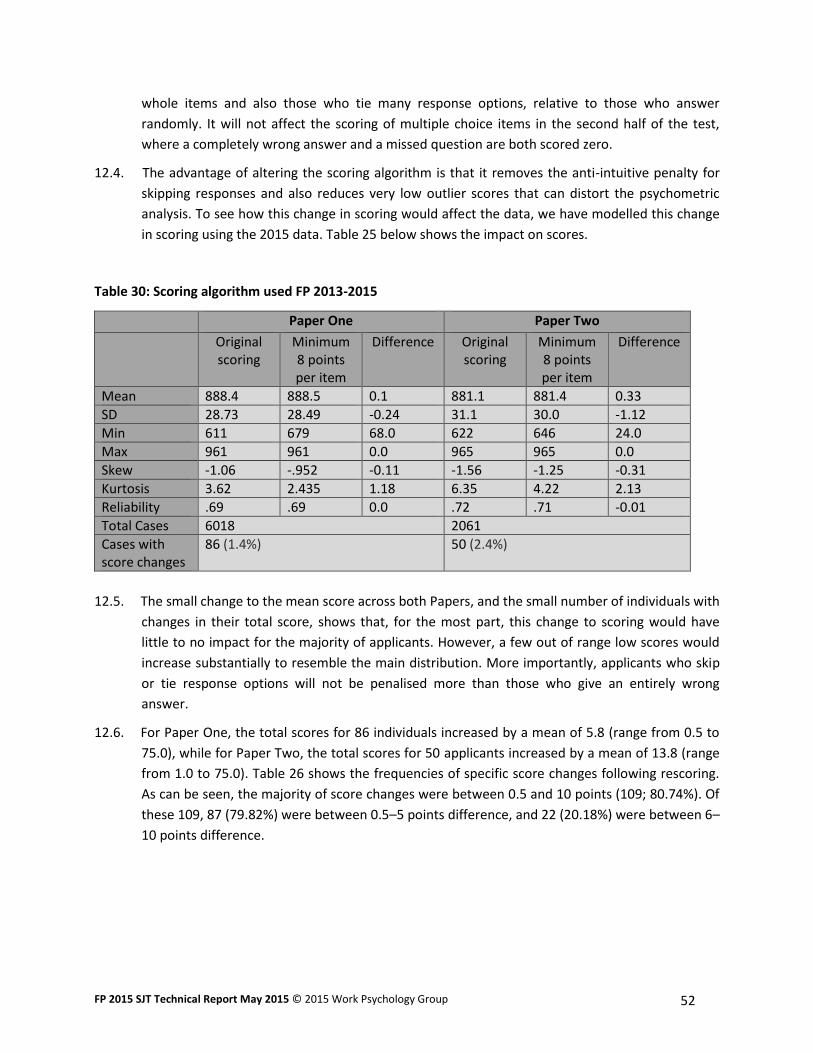
FP 2015 SJT Technical Report May 2015 © 2015 Work Psychology Group 52
whole items and also those who tie many response options, relative to those who answer
randomly. It will not affect the scoring of multiple choice items in the second half of the test,
where a completely wrong answer and a missed question are both scored zero.
12.4. The advantage of altering the scoring algorithm is that it removes the anti-intuitive penalty for
skipping responses and also reduces very low outlier scores that can distort the psychometric
analysis. To see how this change in scoring would affect the data, we have modelled this change
in scoring using the 2015 data. Table 25 below shows the impact on scores.
Table 30: Scoring algorithm used FP 2013-2015
Paper One Paper Two
Original scoring
Minimum 8 points per item
Difference Original scoring
Minimum 8 points per item
Difference
Mean 888.4 888.5 0.1 881.1 881.4 0.33
SD 28.73 28.49 -0.24 31.1 30.0 -1.12
Min 611 679 68.0 622 646 24.0
Max 961 961 0.0 965 965 0.0
Skew -1.06 -.952 -0.11 -1.56 -1.25 -0.31
Kurtosis 3.62 2.435 1.18 6.35 4.22 2.13
Reliability .69 .69 0.0 .72 .71 -0.01
Total Cases 6018 2061
Cases with score changes
86 (1.4%) 50 (2.4%)
12.5. The small change to the mean score across both Papers, and the small number of individuals with
changes in their total score, shows that, for the most part, this change to scoring would have
little to no impact for the majority of applicants. However, a few out of range low scores would
increase substantially to resemble the main distribution. More importantly, applicants who skip
or tie response options will not be penalised more than those who give an entirely wrong
answer.
12.6. For Paper One, the total scores for 86 individuals increased by a mean of 5.8 (range from 0.5 to
75.0), while for Paper Two, the total scores for 50 applicants increased by a mean of 13.8 (range
from 1.0 to 75.0). Table 26 shows the frequencies of specific score changes following rescoring.
As can be seen, the majority of score changes were between 0.5 and 10 points (109; 80.74%). Of
these 109, 87 (79.82%) were between 0.5–5 points difference, and 22 (20.18%) were between 6–
10 points difference.
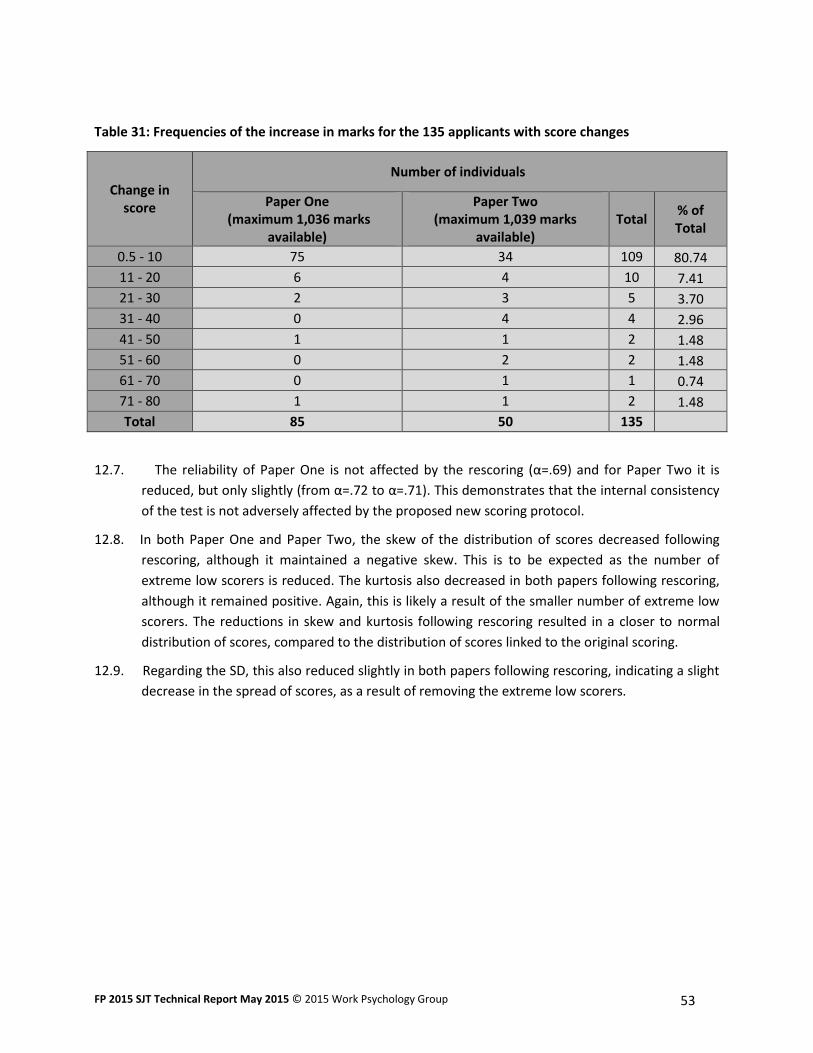
FP 2015 SJT Technical Report May 2015 © 2015 Work Psychology Group 53
Table 31: Frequencies of the increase in marks for the 135 applicants with score changes
Change in score
Number of individuals
Paper One (maximum 1,036 marks
available)
Paper Two (maximum 1,039 marks
available) Total
% of Total
0.5 - 10 75 34 109 80.74
11 - 20 6 4 10 7.41
21 - 30 2 3 5 3.70
31 - 40 0 4 4 2.96
41 - 50 1 1 2 1.48
51 - 60 0 2 2 1.48
61 - 70 0 1 1 0.74
71 - 80 1 1 2 1.48
Total 85 50 135
12.7. The reliability of Paper One is not affected by the rescoring (α=.69) and for Paper Two it is
reduced, but only slightly (from α=.72 to α=.71). This demonstrates that the internal consistency
of the test is not adversely affected by the proposed new scoring protocol.
12.8. In both Paper One and Paper Two, the skew of the distribution of scores decreased following
rescoring, although it maintained a negative skew. This is to be expected as the number of
extreme low scorers is reduced. The kurtosis also decreased in both papers following rescoring,
although it remained positive. Again, this is likely a result of the smaller number of extreme low
scorers. The reductions in skew and kurtosis following rescoring resulted in a closer to normal
distribution of scores, compared to the distribution of scores linked to the original scoring.
12.9. Regarding the SD, this also reduced slightly in both papers following rescoring, indicating a slight
decrease in the spread of scores, as a result of removing the extreme low scorers.