Analysis of the Impacts of South Korea's Political ...
131
e University of Maine DigitalCommons@UMaine Electronic eses and Dissertations Fogler Library Spring 5-11-2018 Analysis of the Impacts of South Korea's Political Relations on its Bilateral Trade: Focus on South Korea's Political and Trade Relations with China, Japan, Russia, and North Korea Mingu Lee [email protected] Follow this and additional works at: hps://digitalcommons.library.umaine.edu/etd Part of the International Relations Commons is Open-Access esis is brought to you for free and open access by DigitalCommons@UMaine. It has been accepted for inclusion in Electronic eses and Dissertations by an authorized administrator of DigitalCommons@UMaine. For more information, please contact [email protected]. Recommended Citation Lee, Mingu, "Analysis of the Impacts of South Korea's Political Relations on its Bilateral Trade: Focus on South Korea's Political and Trade Relations with China, Japan, Russia, and North Korea" (2018). Electronic eses and Dissertations. 2862. hps://digitalcommons.library.umaine.edu/etd/2862
Transcript of Analysis of the Impacts of South Korea's Political ...
The University of MaineDigitalCommons@UMaine
Electronic Theses and Dissertations Fogler Library
Spring 5-11-2018
Analysis of the Impacts of South Korea's PoliticalRelations on its Bilateral Trade: Focus on SouthKorea's Political and Trade Relations with China,Japan, Russia, and North KoreaMingu [email protected]
Follow this and additional works at: https://digitalcommons.library.umaine.edu/etd
Part of the International Relations Commons
This Open-Access Thesis is brought to you for free and open access by DigitalCommons@UMaine. It has been accepted for inclusion in ElectronicTheses and Dissertations by an authorized administrator of DigitalCommons@UMaine. For more information, please [email protected].
Recommended CitationLee, Mingu, "Analysis of the Impacts of South Korea's Political Relations on its Bilateral Trade: Focus on South Korea's Political andTrade Relations with China, Japan, Russia, and North Korea" (2018). Electronic Theses and Dissertations. 2862.https://digitalcommons.library.umaine.edu/etd/2862

ANALYSIS OF THE IMPACTS OF SOUTH KOREA’S POLITICAL RELATIONS
ON ITS BILATERAL TRADE
By
Mingu Lee
B.A. Inha University, 2016
A THESIS
Submitted in Partial Fulfillment of the
Requirements for the Degree of
Master of Arts
(in Global Policy )
The Graduate School
The University of Maine
May 2018
Advisory Committee:
Kristin Vekasi, Assistant Professor of Political Science and School of Policy and
International Affairs, Advisor
Seth Singleton, Adjunct Professor of Political Science and Libra Professor of
International Relations
Muhammad Asif Nawaz, Lecturer of Political Science and International Affairs
ii
© Copyright by Mingu Lee, 2018
All Rights Reserved

ANALYSIS OF THE IMPACTS OF SOUTH KOREA’S POLITICAL RELATIONS
ON ITS BILATERAL TRADE
By Mingu Lee
Advisor: Professor Kristin Vekasi
An Abstract of the Thesis Presented
in Partial Fulfillment of the Requirement for the
Degree of Master of Arts
(in Global Policy)
May 2018
Through all chapters, this thesis is finding answers to the following questions: Why
are political relations and trade important to South Korea? What are current problems that
South Korea confronts in political relations and trade? How are political relations of South
Korea with the trading partners and North Korea? Does South Korea’s political relations with
the four countries have impacts on South Korea’s bilateral trade with the countries? If it does,
how does it affect South Korea’s trade? In answering these questions, this thesis
demonstrates how South Korea’s political relations influence South Korea’s bilateral trade as
well as presents trade relationship between countries still follows political flags.
To find an academic basis of this topic and make discussion in depth, this thesis refers
to previous research on this topic. This study introduces two bodies of literature that are
closely relevant to this topic: (1) the argument that trade affects political relations; (2) the
argument that political relations affect trade. In addition, this thesis seeks how previous
research measures political relations between countries. Through an extensive literature
review, this chapter finds that there is a lack of cases on the topic of South Korea, despite its
political and economic significance, and previous measures for political relations are not
sophisticated enough to reflect flows of political relations between countries by relying on
annual data and only certain types of political events. Thus, this study focuses on
demonstrating the impacts of South Korea’s political relations on its bilateral trade and
measures political relations monthly, mirroring diverse political events between countries.
To show the impacts of political relations between countries on bilateral trade, this
thesis selects four cases: South Korea – China, Japan, Russia, and North Korea. In selecting
cases, this thesis chiefly approaches with two perspectives, economic and political
perspectives. More specifically, this study considers how significantly a country affects
South Korea both politically and economically as well as how the political and economic
relations between South Korea and the country has altered. In revealing the importance and
changes in political and economic relations between South Korea and a case country, trade
and political events between them are considered. Although the U.S. is one of the most
important economic and political partner to South Korea, the U.S. is excluded in this
research. This is because the U.S. has always been the major market to South Korea since
South Korea joined the world market as well as there are little variations in the political
relationship between two countries, which makes hard to demonstrate that South Korea- US
political relations can affect trade flows between the two countries.
As an empirical analysis, this research builds on two models, a vector auto-regression
(VAR) model and a gravity model. The VAR model is a decent method to find the degree of
the impact at different time periods, which meets one of the purposes of this study. As the
most common and popular way to estimate relations between politics and trade, the gravity
model assumes that the bilateral trade is proportional to the size of economy, personal

income and economic activity in both countries and, in reverse, it decreases with resistance
such as physical distance between countries (Herge, Oneal and Russett, 2010; Du et al.,
2017). Through this analysis, this study finds that South Korea’s political relationship with
China barely affects its bilateral trade with China. On the other hand, South Korea’s political
relations with Japan, Russia, and North Korea have certain impacts on its bilateral trade with
the countries.
As a result, South Korea’s political relations with China, Japan, Russia, and North
Korea do affect South Korea’s trade with these countries. However, the results are mixed,
and it is difficult to make absolute statements about how political relations affect trade. The
significance of political impacts on trade depends on the trading partner, and there are also
differing results for imports and exports. In addition, the results reveal that the magnitude and
duration of the impacts are also differentiated by trading partner. Consequently, South
Korea’s political relations with the four countries are reflected in South Korea’s trade
relations partially or entirely by trading partners, which means there could be other factors to
affect South Korea’s trade with the countries. Other potential factors include the importance
of the foreign market in South Korea’s exports and imports or specific features of South
Korean industry. These variables could be important potential covariates along with political
relations.

iii
DEDICATION
This thesis is dedicated to my family and Seulki Ma.

iv
ACKNOWLEDGEMENTS
First and foremost, I would like to express the deepest appreciation to my advisor
Professor Kristin Vekasi, who guided this thesis with her brilliant knowledge on IPE and
outstanding research skills as well as continually encouraged me not to give up in the middle
of the long journey for this thesis. Without her constant support and help, this thesis would
not be able to come out to the world. I will remember all your contributions to this thesis and
enthusiasm for your work and teaching students forever. Thank you so much.
I also would like to thank my amazing committee members, Professor Seth Singleton
who helped me to think about the topic of this thesis in depth with diverse perspectives, and
Professor Muhammad Asif Nawaz who provided one of the core ideas to measure political
relations. I learned deeply how to look at the world with diverse angles in political science
and it was meaningful enough for me to broaden my perspective as well as insight to see the
world.
In addition, a thank you to Professor Youngmi Choi who led me to study abroad for
my master’s degree and motivated me to study IPE. The IPE class was her first teaching class
as a professor as well as it was my first class in political science. Also, I send my thank you
to Professor Won-Jae Lee and Professor Mansoo Ko who taught me the mind of cooperation
with people by their actual attitudes. All of their lessons and supports became a wonderful
prescription to overcome difficulties while I was studying here.
With expressing my thankfulness to my professors, I also would like to send a thank
you to Peter Fandel who always welcomed me into his office and made my studying in SPIA
possible, and a beautiful M&M couple, Mandy Barrington and Matthew Barrington who

v
saved my life thousands of times and always supported my work and decision. They helped
me with their true worries and supports when I was in difficult situations. I was happy to
know them here in Maine and hope to see them again someday in future.
While I am studying in SPIA, the only and most effective way that I could get off my
stress from the study was to play soccer, and I truly enjoyed playing soccer with one of the
best teams in my lifetime, Desert Wolves and Starks. In every season and every time, I was
waiting for the game day and I was happy to see them on the filed regardless of results of the
games. The four hypothetical online golden trophies would disappear in future, but the time I
had with them will be forever in my memory.
On top of that, I especially thank one person, my lovely girlfriend Seulki Ma, who has
been waiting for me for two years and has always believed in me. Without her perseverance
and trust in me, this long distance relationship would not work. Whenever I was discouraged
and frustrated, she was the one who made me smile again and sent me ceaseless
encouragement with her love. There are many things that we missed while I studied here. I
want to spend my time with her as much as I can when I return to South Korea and become a
person whom she can rely on and continue to trust in her life. Thank you again for being the
most precious person and I love you.
Last but not least, I thank my family and friends for their support and encouragement
throughout this endeavor. Especially, I send my thankfulness to my parents and younger
brother for their constant and unconditional support. Any words would not be enough to
explain their devotion to me. I sincerely thank you for understanding me and always having
trust in me.
vi
TABLE OF CONTENTS
DEDICATION ......................................................................................................................... iii
ACKNOWLEDGEMENTS ..................................................................................................... iv
LIST OF TABLES ................................................................................................................... ix
LIST OF FIGURES ................................................................................................................. xi
LIST OF ABBREVIATIONS ................................................................................................. xii
Chapter
1. INTRODUCTION .................................................................................................................1
1.1. Political Relations and Trade of South Korea ...............................................................2
1.2. Dilemma of South Korea ..............................................................................................3
1.2.1. Security Dilemma between North Korea and the U.S. .......................................3
1.2.2. Economic Retaliation from China ......................................................................4
1.3. Trade overview of South Korea ....................................................................................5
1.4. South Korea’s Political and Trade relations: China, Japan, the U.S. and
North Korea .........................................................................................................................7
1.4.1. South Korea - China Relations ...........................................................................8
1.4.2. South Korea - Japan Relations .........................................................................12
1.4.3. South Korea – US Relations .............................................................................15
1.4.4. South Korea – North Korea Relations ..............................................................16
1.5. Outline of the Thesis ...................................................................................................20
2. PREVIOUS LITERATURE: POLITICAL RELATIONS AND TRADE AND
HOW TO MEASURE POLITICAL RELATIONS .................................................................22
2.1. Political relations and Trade .......................................................................................23
2.2. How to Measure Political Relations ...........................................................................26
vii
3. RESEARCH DESIGN AND EMPIRICAL RESULTS: IMPACTS OF
POLITICAL RELATIONS OF SOUTH KOREA ON ITS BILATERAL TRADE ...............30
3.1. Research Design..........................................................................................................30
3.1.1. Case selection ...................................................................................................30
3.1.1.1. South Korea – China ...........................................................................31
3.1.1.2. South Korea – Japan ...........................................................................32
3.1.1.3. South Korea – Russia ..........................................................................33
3.1.1.4. South Korea – North Korea ................................................................34
3.1.1.5. Why the United States is Excluded .....................................................35
3.1.2. Dependent Variables ........................................................................................37
3.1.3. Measuring Political Relations ..........................................................................37
3.1.4. Control Variables .............................................................................................40
3.2. Empirical Analysis ......................................................................................................46
3.2.1. Empirical Strategy ............................................................................................46
3.2.1.1. Vector Autoregression Model .............................................................46
3.2.1.2. Gravity Trade Equation Model ...........................................................52
3.2.2. Empirical Results .............................................................................................54
3.2.2.1. The VAR model ..................................................................................54
3.2.2.2. The Gravity model ..............................................................................59
4. DISCUSSION: EXPLAINING VARIATIONS IN SOUTH KOREA’S
POLITICAL AND TRADE RELATIONSHIP .......................................................................64
4.1. Overall interpretation ..................................................................................................64
4.2 Interpretation by each case ...........................................................................................66
4.2.1. South Korea – China ........................................................................................66
4.2.2. South Korea – Japan .........................................................................................69
4.2.3. South Korea – Russia .......................................................................................71

viii
4.2.4. South Korea – North Korea ..............................................................................73
5. CONCLUSION ....................................................................................................................75
5.1. Overview of the thesis ................................................................................................75
5.2. Contribution to existing research and South Korea’s Foreign and Trade Policy .......77
5.3. Questions unresolved ..................................................................................................79
REFERENCES ........................................................................................................................82
APPENDICES .........................................................................................................................87
Appendix A. Tables of South Korea’s Political Relations Score (PRS) ............................87
Appendix B. Results of the Vector Auto-Regression (VAR) Analysis .............................95
BIOGRAPHY OF THE AUTHOR ........................................................................................111
ix
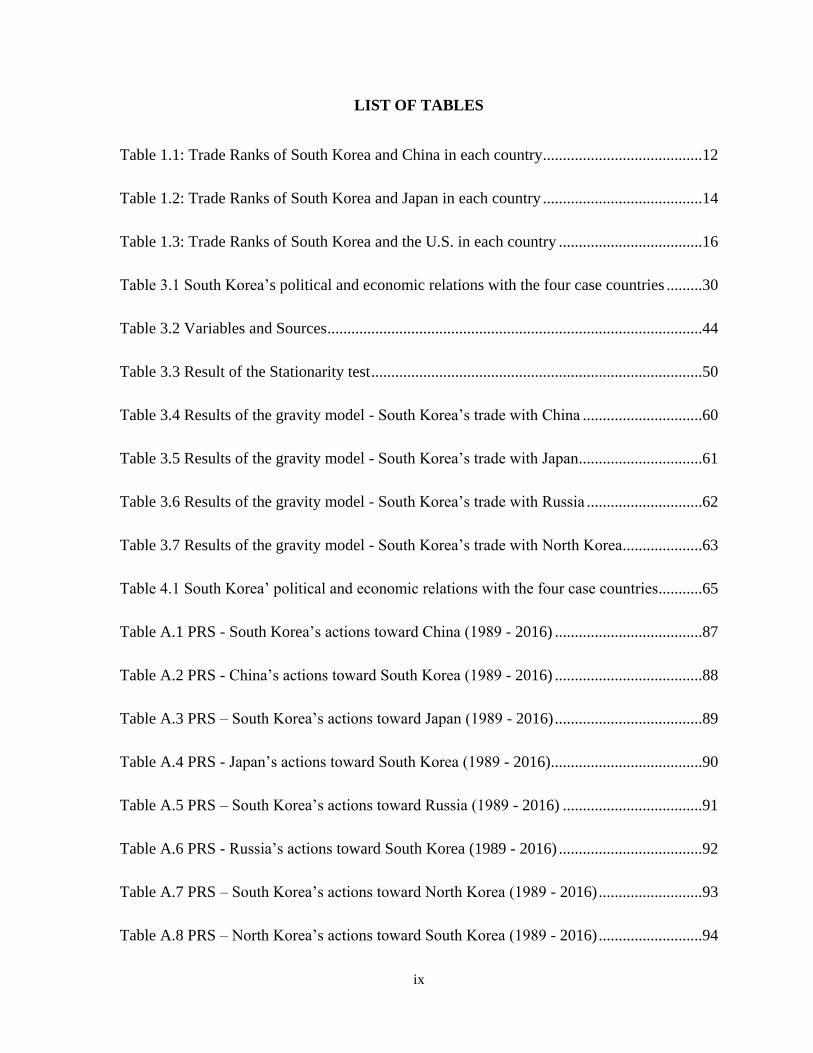
LIST OF TABLES
Table 1.1: Trade Ranks of South Korea and China in each country ........................................12
Table 1.2: Trade Ranks of South Korea and Japan in each country ........................................14
Table 1.3: Trade Ranks of South Korea and the U.S. in each country ....................................16
Table 3.1 South Korea’s political and economic relations with the four case countries .........30
Table 3.2 Variables and Sources ..............................................................................................44
Table 3.3 Result of the Stationarity test ...................................................................................50
Table 3.4 Results of the gravity model - South Korea’s trade with China ..............................60
Table 3.5 Results of the gravity model - South Korea’s trade with Japan ...............................61
Table 3.6 Results of the gravity model - South Korea’s trade with Russia .............................62
Table 3.7 Results of the gravity model - South Korea’s trade with North Korea ....................63
Table 4.1 South Korea’ political and economic relations with the four case countries ...........65
Table A.1 PRS - South Korea’s actions toward China (1989 - 2016) .....................................87
Table A.2 PRS - China’s actions toward South Korea (1989 - 2016) .....................................88
Table A.3 PRS – South Korea’s actions toward Japan (1989 - 2016) .....................................89
Table A.4 PRS - Japan’s actions toward South Korea (1989 - 2016) ......................................90
Table A.5 PRS – South Korea’s actions toward Russia (1989 - 2016) ...................................91
Table A.6 PRS - Russia’s actions toward South Korea (1989 - 2016) ....................................92
Table A.7 PRS – South Korea’s actions toward North Korea (1989 - 2016) ..........................93
Table A.8 PRS – North Korea’s actions toward South Korea (1989 - 2016) ..........................94

x
Table B.1 Results of the VAR model - South Korea’s trade with China ................................95
Table B.2 Results of the VAR model - South Korea’s trade with Japan .................................99
Table B.3 Results of the VAR model - South Korea’s trade with Russia .............................103
Table B.4 Results of the VAR model - South Korea’s trade with North Korea ....................107
xi
LIST OF FIGURES
Figure 1. GDP Ranking of South Korea in the world ................................................................6
Figure 2. Percentage of trade in South Korea’s total GDP from 1960 to 2016 .........................6
Figure 3. South Korea’s top 5 export and import goods ............................................................7
Figure 4. Top 5 export and import partners of South Korea ......................................................8
Figure 5. South Korea’s Trade with China ..............................................................................10
Figure 6. Investment of South Korean companies in China from 1988 to 2016 .....................10
Figure 7. Trade Volume of South Korea with Japan ...............................................................13
Figure 8. Trade Volume of South Korea with North Korea by Administrations ....................19
Figure 9. South Korea’s Trade with Russia (1992-2017) ........................................................34
Figure 10. Actions of each Government and the ideal point distance between
South Korea and the four case countries ..................................................................................36
Figure 11. Impulse Response Function (IRF) of South Korea’s political relations on its
imports from China, Japan, Russia, and North Korea .............................................................57
Figure 12. Impulse Response Function (IRF) of South Korea’s political relations on its
exports to China, Japan, Russia, and North Korea ..................................................................58
Figure 13. South Korea’s Political Economy Relations Map ..................................................66

xii
LIST OF ABBREVIATION
ADF Augmented Dicky-Fuller
AIC Akaike’s information criterion
COPDAB Conflict and Peace data bank
COW Correlates of War
FDI Foreign Direct Investment
GDELT Global Data on Events, Location and Tones
GDP Gross Domestic Product
IRF Impulse Response Function
KITA Korea International Trade Association
Korea Eximbank Export-Import Bank of Korea
PRI Political Relations Index
PRS Political Relations Score
THADD Terminal High Altitude Air Defense
UN United Nations
UNGA United Nations General Assembly
VAR Vector Auto-Regression
WITS World Integrated Trade Solution
WTO World Trade Organization

1
CHAPTER 1
INTRODUCTION
In consideration of the importance of trade to South Korea, this thesis examines
impacts of South Korea’s political relations with China, Japan, Russia, and North Korea on
its trade with these countries. Through all chapters, this thesis is finding answers to the
following questions: Why are political relations and trade important to South Korea? What
are current problems that South Korea confronts in political relations and trade? How are
political relations of South Korea with the trading partners and North Korea? Does South
Korea’s political relations with the four countries have impacts on South Korea’s bilateral
trade with the countries? If it does, how does it affect South Korea’s trade? In answering
these questions, this thesis demonstrates how South Korea’s political relations influence
South Korea’s bilateral trade as well as presents trade relationship between countries still
follows political flags.
To show the impacts of political relations between countries on bilateral trade, this
thesis selects four cases: South Korea – China, Japan, Russia, and North Korea. In selecting
cases, this thesis chiefly approaches with two perspectives, economic and political
perspectives. More specifically, this study considers how significantly a country affects
South Korea both politically and economically as well as how the political and economic
relations between South Korea and the country has altered. In revealing the importance and
changes in political and economic relations between South Korea and a case country, trade
and political events between them are considered. Although the U.S. is one of the most
important economic and political partner to South Korea, the U.S. is excluded in this

2
research. This is because the U.S. has always been the major market to South Korea since
South Korea joined the world market as well as there are little variations in the political
relationship between two countries, which makes hard to demonstrate that South Korea- US
political relations can affect trade flows between the two countries. This Chapter begins with
the dilemma of South Korea between political situations and trade and provides general
information about South Korea’s trade and its political relations with the major trading
partners and North Korea. Finally, it provides an overview of this thesis as well.
1.1. Political Relations and Trade of South Korea
Trade was a core strategy for South Korea’s dramatically successful economic
growth. After the Korean War in 1953, South Korea lost most of its basic infrastructure and
industrial bases. During the first four month of the war, 70% of textile and chemical
industries, 40% of agriculture industry, and 10% of rubber industry were destroyed as well as
around 80% of power plants were damaged (Lee, 2001). The destruction in the industry and
infrastructure brought about critical damage to the overall Korean economy in 1950s and
early 1960s. South Korea’s GDP per capita in the 1950s was under $1000 and its income per
capita in the early 1960 was lower than those of Haiti, Ethiopia, and Yemen (Kim, 1991).
Considering the devastated social condition and economy of South Korea, nobody expected
that South Korea could be rebuilt socially and economically. However, South Korean turned
over all the negative anticipation about its future through political leadership, the citizen’s
collective efforts, and diverse aid from international communities (Frieden, 2006). Above all
things, South Korea’s economic policy based on trade was the engine for the rapid economic
growth after the war.

3
1.2. Dilemma of South Korea
1.2.1. Security Dilemma between North Korea and the U.S.
Despite long time passed after the Korean War, the political tension between South
Korea and North Korea has been continued and the security issue is still crucial not only to
the two Koreas, but also to all of the players involved with the Korean peninsula issue. To
make the situations worse, since Kim Jong-Un became the supreme leader of North Korea in
2011, his regime has continued to threaten the security of South Korea and its allies by
conducting the forceful missile and nuclear tests. Nevertheless, the new South Korean
administration has not provided an effective diplomatic strategies to deal with North Korea’s
forceful actions. The South Korean government has presented a dialogue with North Korea
as the prioritized foreign policy toward North Korea, but it has not made any substantial
diplomatic outcomes as North Korea has not shown any amicable reactions to the suggestion.
To protect and reinforce the national security from North Korea’s forceful threats, it
is a necessary choice that South Korea sustains the military alliance with the U.S. Even if the
current South Korean administration emphasizes a communication with North Korea, rather
than a military actions, sustaining the military alliance with the U.S. is an unavoidable
choice, considering that North Korea has not given up their missile and nuclear programs.
The problems is that North Korea has regarded South Korea’s choice as threats against their
national security. North Korea’s stance is that they cannot abandon the missile and nuclear
program as the U.S. is threatening the national security of North Korea. The more North
Korea makes forceful provocations, the more South Korea needs to consolidate the military
alliance with the U.S., but when South Korea needs to establish closer military relationship
with the U.S., North Korea raises more threats against the both countries.

4
1.2.2. Economic Retaliation from China
South Korea’s reinforcing military alliance with the U.S. occurring disputes with
China as well. Deploying the Terminal High Altitude Air Defense (THAAD) system on
South Korea to prevent North Korea’s missile attacks has brought about a strong dispute
from the Chinese government. In the current circumstance that North Korea constantly treats
the national security of South Korea and its allies, the decision to set up the THADD system
could be a reasonable strategy to South Korea and even to the U.S. in order to protect each
land from North Korea’s missile attack. However, China heavily opposed South Korea to
deploy the THAAD system. This is because the THAAD system is deployed by the U.S.,
therefore, Beijing claims that deploying the THAAD system “would be against China’s
security interests” by allowing the U.S. to monitor the main land of China through the radar
of the missile system (Klingner, 2015).1 As a result, China has used its economic stick to
retaliate against South Korea after the decision to deploy THAAD. Even if the economic
retaliation of China has been boycotting against South Korean companies in China and the
Chinese government has not directly regulated bilateral trade with South Korea, the
economic pressure has damaged South Korea’s overall economy as well as must be a concern
of South Korean government that has to care both enhancing the national security with the
U.S. and promoting the economic ties with China.
1 Klinger said that in spite of the incapability of THAAD intercepting the Chinese ballistic missile,
the Chinese government opposes THAAD deployment in South Korea and even it has not fully
“articulated” the reason of complaint.
5
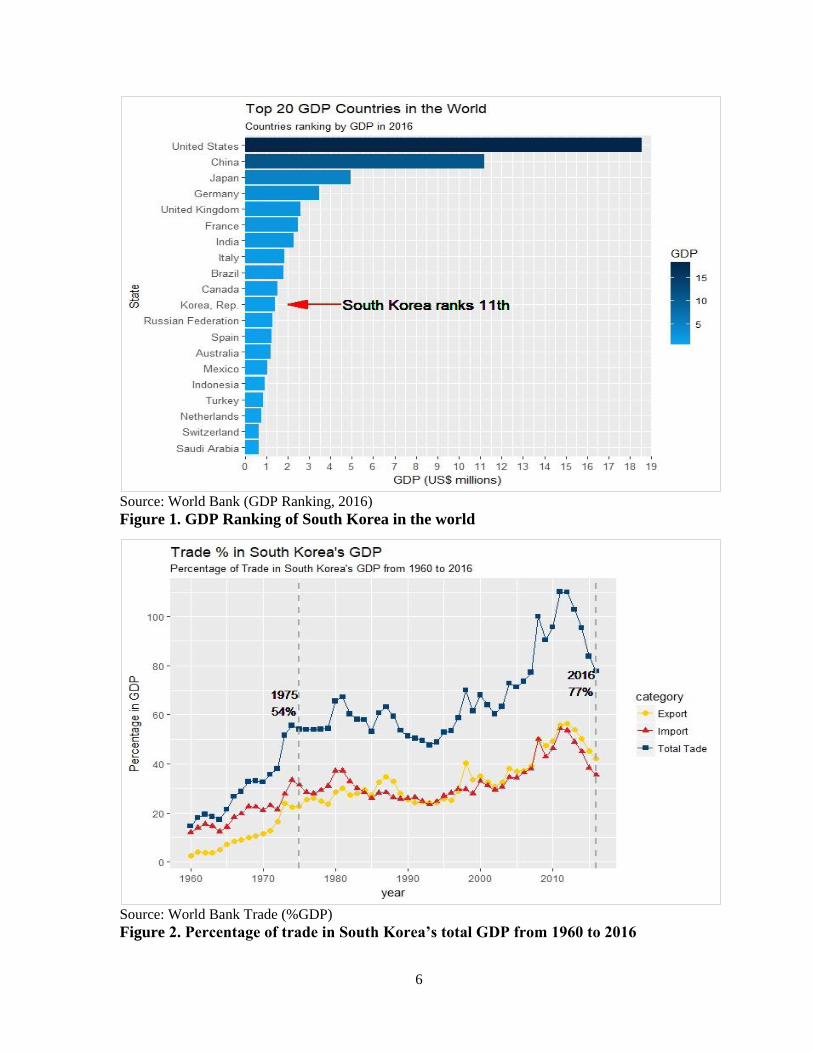
1.3. Trade overview of South Korea
As stated earlier, trade was a necessary strategy in the South Korea’s economic
growth and it is still playing an important role in the South Korea’s sustainable economic
growth today. As Figure 1 indicates, South Korea’s GDP is over US$ 1.4 million and it ranks
the eleventh largest economy in the world.2 Since South Korea joined the world economy,
South Korea has had a high dependence on the world economy, which means a substantial
share of South Korea’s GDP has consisted of trade. As Figure 2 shows, trade was already
54% of South Korea’s GDP in the middle of 1970s, and now, 77% of South Korea’s GDP is
comprised of trade.3 South Korea recorded 901.6 US$ billions in 2016, and it made South
Korea the seventh largest exporter and the eighth largest importer in the world.4 As Figure 3
demonstrates, South Korea’s top five exports are electrical machinery, motor vehicles &
parts, industrial machinery, ships & boats, and oil & mineral fuels and its top five imports are
oil & mineral fuels, electrical machinery, industrial machinery, precision instrument, and iron
& steel in 2016.5
2 Data for World Bank’s GDP Rank is available at https://data.worldbank.org/data-catalog/GDP-
ranking-table 3 Trade (% GDP). The World Bank, available at
https://data.worldbank.org/indicator/NE.TRD.GNFS.ZS?locations=KR 4 2016 Export and import of South Korea. Korea International Trader Association, available at
http://stat.kita.net/stat/kts/sum/SumImpExpTotalList.screen; Export of goods and services. The World
Bank, available at https://data.worldbank.org/indicator/NE.EXP.GNFS.CD; Import of good and
services. The World Bank, available at https://data.worldbank.org/indicator/NE.IMP.GNFS.CD. 5 South Korea: Trade Statistics. Global Edge, available at https://globaledge.msu.edu/countries/south-
korea/tradestats
6
Source: World Bank (GDP Ranking, 2016)
Figure 1. GDP Ranking of South Korea in the world
Source: World Bank Trade (%GDP)
Figure 2. Percentage of trade in South Korea’s total GDP from 1960 to 2016

7
Source: Global EDGE (Trade statistics, South Korea)
Figure 3. South Korea’s top 5 export and import goods
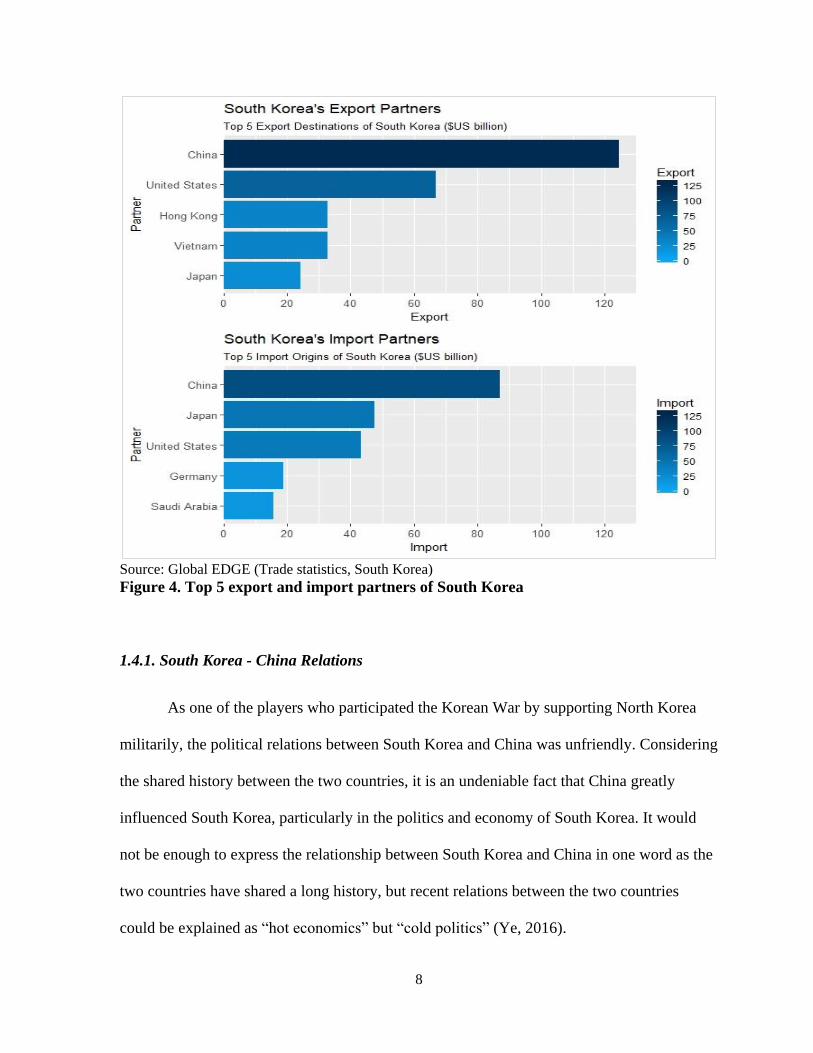
1.4. South Korea’s Political and Trade relations: China, Japan, the U.S. and North
Korea
From the time South Korea joined the world economy until now, the importance of
political relations in trade is still evident. In South Korea’s trade history, the political
relations between South Korea and other countries have been taking a dominant role to
encourage South Korea’s bilateral trade with the countries. As Figure 4 presents, China,
Japan and the U.S. are the top five trading partner of South Korea and considering that South
Korea has had a deep and sophisticated historical background with the countries, South
Korea’s trade with the three countries would not be a discrete activity not associated with
political relations with the countries.
8
Source: Global EDGE (Trade statistics, South Korea)
Figure 4. Top 5 export and import partners of South Korea
1.4.1. South Korea - China Relations
As one of the players who participated the Korean War by supporting North Korea
militarily, the political relations between South Korea and China was unfriendly. Considering
the shared history between the two countries, it is an undeniable fact that China greatly
influenced South Korea, particularly in the politics and economy of South Korea. It would
not be enough to express the relationship between South Korea and China in one word as the
two countries have shared a long history, but recent relations between the two countries
could be explained as “hot economics” but “cold politics” (Ye, 2016).
9
The frozen political relations between China and South Korea, which was worsened
by China’s intervention in the Korean War and during the Cold War, turned into cooperative
in the early 1990s. It was not a dramatic incident, but from the early 1970s South Korea
attempted to recover its relations with China. With the voice in South Korea that “any
potential threat that China could pose” was declining in the 1980s (Chung, 2009), South
Korea and China, along with the end of Cold War in the early of 1990s, agreed the
diplomatic normalization in 1992.
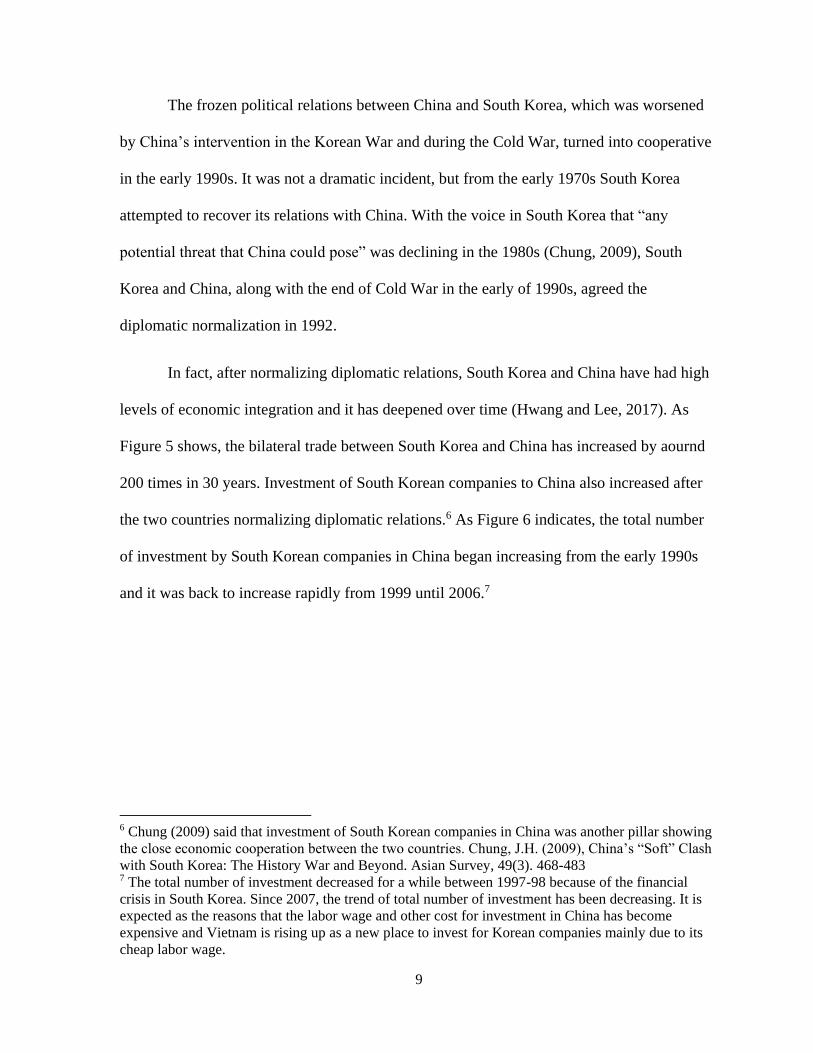
In fact, after normalizing diplomatic relations, South Korea and China have had high
levels of economic integration and it has deepened over time (Hwang and Lee, 2017). As
Figure 5 shows, the bilateral trade between South Korea and China has increased by aournd
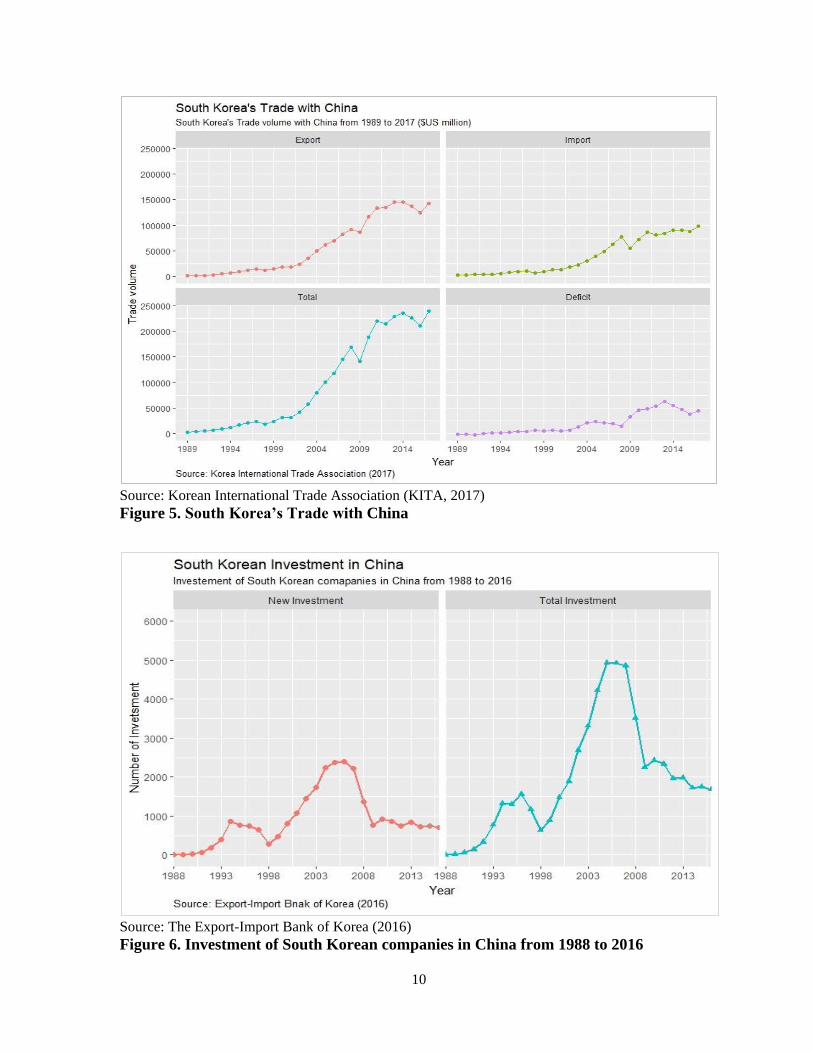
200 times in 30 years. Investment of South Korean companies to China also increased after
the two countries normalizing diplomatic relations.6 As Figure 6 indicates, the total number
of investment by South Korean companies in China began increasing from the early 1990s
and it was back to increase rapidly from 1999 until 2006.7
6 Chung (2009) said that investment of South Korean companies in China was another pillar showing
the close economic cooperation between the two countries. Chung, J.H. (2009), China’s “Soft” Clash
with South Korea: The History War and Beyond. Asian Survey, 49(3). 468-483 7 The total number of investment decreased for a while between 1997-98 because of the financial
crisis in South Korea. Since 2007, the trend of total number of investment has been decreasing. It is
expected as the reasons that the labor wage and other cost for investment in China has become
expensive and Vietnam is rising up as a new place to invest for Korean companies mainly due to its
cheap labor wage.
10
Source: Korean International Trade Association (KITA, 2017)
Figure 5. South Korea’s Trade with China
Source: The Export-Import Bank of Korea (2016)
Figure 6. Investment of South Korean companies in China from 1988 to 2016

11
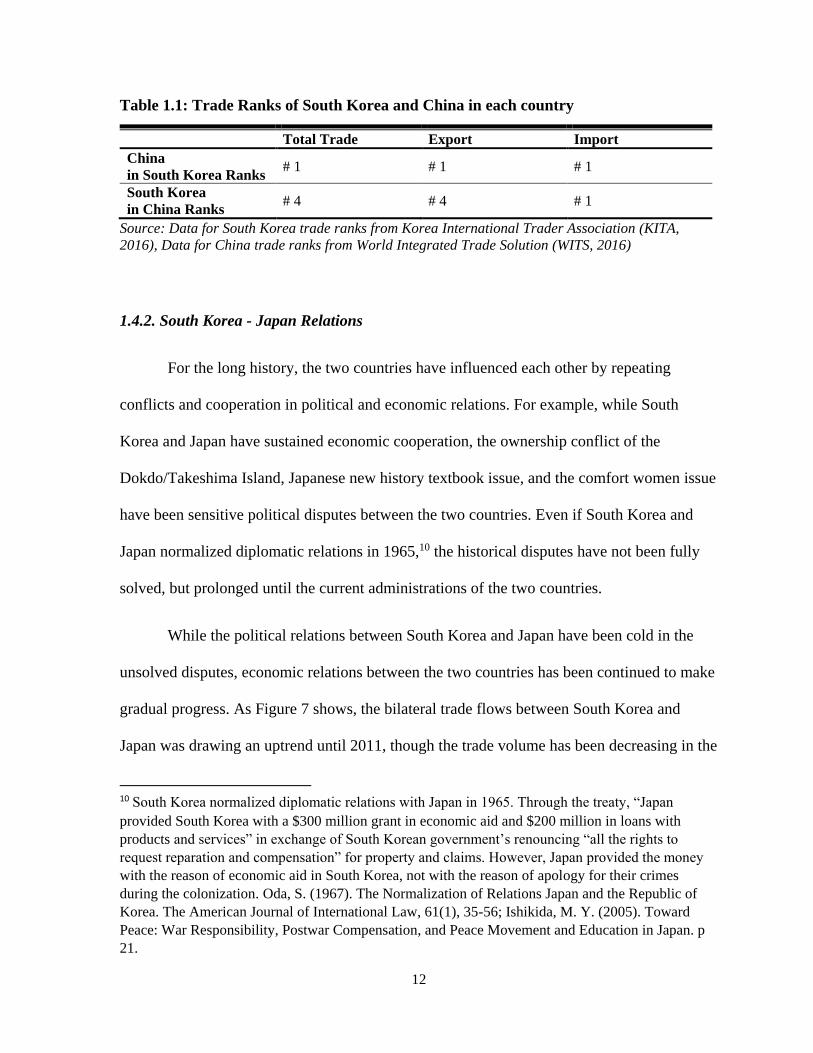
Above all things, trade explicitly reflects the changed relations between South Korea
and China. In 1993, right one year after the two countries’ diplomatic normalization, China
became the third-largest trading partner of South Korea,8 and in 2004, China replaced the
U.S. as the top trading partner of South Korea (Chung, 2009). As Table 1.1 indicates, China
still has been the top trading partner of South Korea and South Korea also has been recording
high ranks in the China’s trade rank.
However, the current political relations between the two countries are not as
favorable as the economic relations are. In particular, South Korea and China recently have
been revealing different stances in handling the issue with North Korea’s missile and nuclear
tests and the South Korean government’s decision for THAAD deployment in the territory
has caused an economic retaliation from the Chinese government against South Korean
companies in China.9 Although, as stated earlier, the economic retaliation of China has not
directly touch upon the bilateral trade with South Korea, it seems apparent that two countries
tend to use economic relations as a tool to influence political relations.
8 Data is from the Korea International Trade Association (KITA). Available at
http://stat.kita.net/stat/kts/ctr/CtrTotalImpExpList.screen 9 The Chinese economic retaliation was clearly revealed in the boycott against the Lotte company,
which is the fifth-largest chaebol in South Korea. Lotte Group agreed to provide land to deploy
THAAD system in February and the Chinese government began to put pressure on Lotte’s business in
China accordingly. “South Korea’s Lotte Group offers golf course for THAAD missile deployment”
April 22, 2017, South China Morning Post, retrieved from http://www.scmp.com/news/asia/east-
asia/article/2074395/south-koreas-lotte-group-offers-golf-course-thaad-missile
12
Table 1.1: Trade Ranks of South Korea and China in each country
Total Trade Export Import
China
in South Korea Ranks # 1 # 1 # 1
South Korea
in China Ranks # 4 # 4 # 1
Source: Data for South Korea trade ranks from Korea International Trader Association (KITA,
2016), Data for China trade ranks from World Integrated Trade Solution (WITS, 2016)
1.4.2. South Korea - Japan Relations
For the long history, the two countries have influenced each other by repeating
conflicts and cooperation in political and economic relations. For example, while South
Korea and Japan have sustained economic cooperation, the ownership conflict of the
Dokdo/Takeshima Island, Japanese new history textbook issue, and the comfort women issue
have been sensitive political disputes between the two countries. Even if South Korea and
Japan normalized diplomatic relations in 1965,10 the historical disputes have not been fully
solved, but prolonged until the current administrations of the two countries.
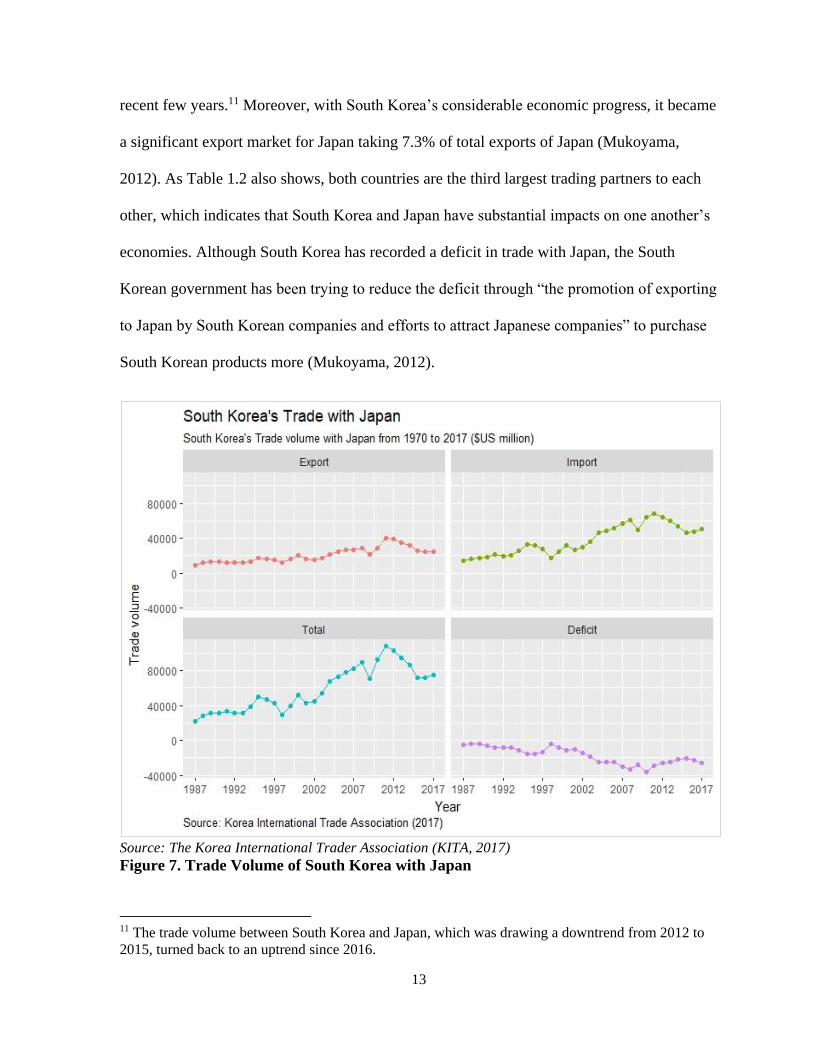
While the political relations between South Korea and Japan have been cold in the
unsolved disputes, economic relations between the two countries has been continued to make
gradual progress. As Figure 7 shows, the bilateral trade flows between South Korea and
Japan was drawing an uptrend until 2011, though the trade volume has been decreasing in the
10 South Korea normalized diplomatic relations with Japan in 1965. Through the treaty, “Japan
provided South Korea with a $300 million grant in economic aid and $200 million in loans with
products and services” in exchange of South Korean government’s renouncing “all the rights to
request reparation and compensation” for property and claims. However, Japan provided the money
with the reason of economic aid in South Korea, not with the reason of apology for their crimes
during the colonization. Oda, S. (1967). The Normalization of Relations Japan and the Republic of
Korea. The American Journal of International Law, 61(1), 35-56; Ishikida, M. Y. (2005). Toward
Peace: War Responsibility, Postwar Compensation, and Peace Movement and Education in Japan. p
21.
13
recent few years.11 Moreover, with South Korea’s considerable economic progress, it became
a significant export market for Japan taking 7.3% of total exports of Japan (Mukoyama,
2012). As Table 1.2 also shows, both countries are the third largest trading partners to each
other, which indicates that South Korea and Japan have substantial impacts on one another’s
economies. Although South Korea has recorded a deficit in trade with Japan, the South
Korean government has been trying to reduce the deficit through “the promotion of exporting
to Japan by South Korean companies and efforts to attract Japanese companies” to purchase
South Korean products more (Mukoyama, 2012).
Source: The Korea International Trader Association (KITA, 2017)
Figure 7. Trade Volume of South Korea with Japan
11 The trade volume between South Korea and Japan, which was drawing a downtrend from 2012 to
2015, turned back to an uptrend since 2016.

14
While the former Park Geun-hye administration “refused to hold a bilateral summit
with Prime Minister Shinzo Abe until the third year in the office,” requiring “Abe’s attitude
change toward history” (Kang and Park, 2017), trade volume between the two countries for
the three years decreased from US$ 94,691 million to US$ 71,431 million.12 On the other
hand, although the current Moon Jae-in administration keeps the critical stance on the
historical and political issues, it is emphasizing “diplomatic, economic, and security
cooperation” with Japan simultaneously (Kang and Park, 2017). With that policy stream,
trade volume between South Korean and Japan has also turned back to an uptrend from the
early 2017. It seems that South Korean government’s foreign policy toward Japan
substantially affect South Korea’s bilateral trade with Japan. However, considering the
impacts of Japan’s economy on South Korea’s market and industry, the impacts of political
relations on trade in South Korea – Japan relations would be offset.
Table 1.2: Trade Ranks of South Korea and Japan in each country
Total Trade Export Import
Japan
in South Korea Ranks # 3 # 5 # 2
South Korea
in Japan Ranks # 3 # 3 # 4
Source: Data for South Korea trade ranks from Korea International Trader Association (KITA,
2016), Data for Japan trade ranks from World Integrated Trade Solution (WITS, 2016)
12 Trade data between South Korea and Japan is available at
http://stat.kita.net/stat/kts/ctr/CtrTotalImpExpList.screen

15
1.4.3. South Korea – US Relations13
Since the Korean War, South Korea and the U.S. have sustained strong and reliable
relations through the military and economic cooperation. South Korea signed the Mutual
Defense Treaty with the U.S. in 1953 right after the Korean War so that US military could
reside in South Korea, protecting the land from North Korea’s additional invasion (Manyin et
al., 2017). The treaty seemed one-sided advantages to South Korea, but the U.S. could obtain
geopolitical advantages on the Korean peninsula by establishing a military alliance with
South Korea as well.
Strengthening national security was the most essential and prioritized task to South
Korea after the Korean War. Facing communist countries directly, South Korea had to
enhance its national security as well as protect its ideology. It was also the U.S. that shared
these concerns. Considering that it could severely damage U.S. power in Northeast Asia if
South Korea became communist, South Korea was an important ally to provide geopolitical
advantages and power in that region (Krieckhaus, 2017). As a result, the two countries chose
the win-win game. The presence of US military in the South Korean territory gave the U.S.
considerable geopolitical benefits in Northeast Asia politically and militarily, and in
exchange for allowing the U.S. to have the geopolitical advantage, South Korea could
consolidate the national security and be guaranteed a pathway to join the world market. The
strategic relations between South Korea and the U.S. are still consolidated. Twenty-eight
thousand, five hundred US military troops are residing in South Korea to defend its national
13 Even if the South Korea - U.S. relations take a part in chapter1, the U.S. is not one of the cases in
the empirical analysis of this study. The reasons is explained in chapter3.
16
security (Manyin et al., 2016), and it is functioning to protect the national security of the U.S.
from North Korea’s unpredicted attack.
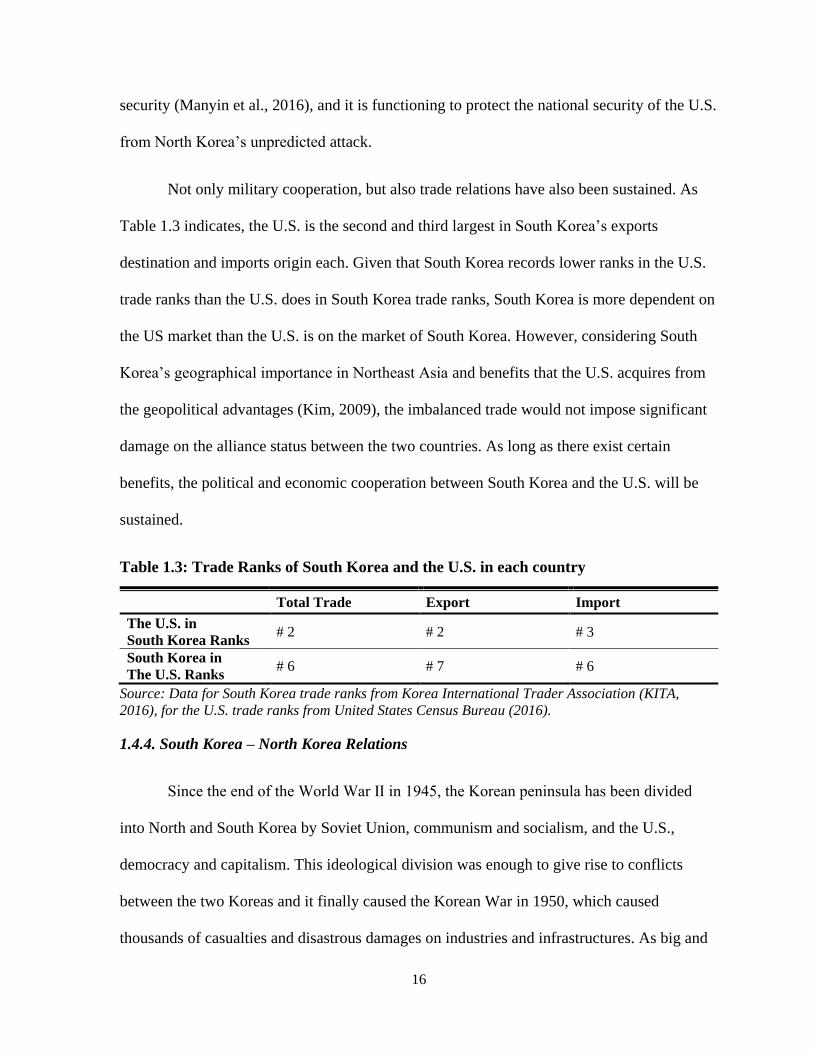
Not only military cooperation, but also trade relations have also been sustained. As
Table 1.3 indicates, the U.S. is the second and third largest in South Korea’s exports
destination and imports origin each. Given that South Korea records lower ranks in the U.S.
trade ranks than the U.S. does in South Korea trade ranks, South Korea is more dependent on
the US market than the U.S. is on the market of South Korea. However, considering South
Korea’s geographical importance in Northeast Asia and benefits that the U.S. acquires from
the geopolitical advantages (Kim, 2009), the imbalanced trade would not impose significant
damage on the alliance status between the two countries. As long as there exist certain
benefits, the political and economic cooperation between South Korea and the U.S. will be
sustained.
Table 1.3: Trade Ranks of South Korea and the U.S. in each country
Total Trade Export Import
The U.S. in
South Korea Ranks # 2 # 2 # 3
South Korea in
The U.S. Ranks # 6 # 7 # 6
Source: Data for South Korea trade ranks from Korea International Trader Association (KITA,
2016), for the U.S. trade ranks from United States Census Bureau (2016).
1.4.4. South Korea – North Korea Relations
Since the end of the World War Ⅱ in 1945, the Korean peninsula has been divided
into North and South Korea by Soviet Union, communism and socialism, and the U.S.,
democracy and capitalism. This ideological division was enough to give rise to conflicts
between the two Koreas and it finally caused the Korean War in 1950, which caused
thousands of casualties and disastrous damages on industries and infrastructures. As big and
17
deep as the sore of the war between the two Koreas was, the Korean War solidified the
division of the Korean peninsula. (Kim, 2009).
Conflicts and distrust between the two Koreas have continued after the Korean War
until the recent era. For example, “31-man unit of heavily armed commandos” from North
Korea, in 1968, intruded South Korea to assassinate South Korean president Park Chung-hee
(Yoon, 2000). In 1996, a North Korean navy force submarine infiltrated on the east coast of
South Korea to spy on naval installation in that area (Dies Jr, 2004) and in 2002, the Second
Battle of Yeonpyeong island occurred on the west sea of South Korea, causing 24 casualties
in South Korean navy force (Ryoo, 2009). In 2010, North Korea attacked again the
Yeonpyeong island directly by firing “dozens of artillery shells” and it caused 36 casualties
including 5 citizens residing on the island.14 Recently, North Korea has developed mass-
destructive missiles and nuclear weapons in the Kim Jong-Un regime, threatening the
national security of the U.S. and its allies.
Nevertheless, South Korea has made constant efforts and engagements to improve the
relations with North Korea for more than 40 years. Since the June 23 Declaration of Park
Chung-hee administration in 197315, all the former administrations had foreign policies that
14 “After North Korean Strike, South Korean leader threatens ‘retaliation,’” November 24, 2010,
CNN, retrieved from
http://www.cnn.com/2010/WORLD/asiapcf/11/23/nkorea.skorea.military.fire/index.html?hpt=T1&ire
f=BN1; “N.K. artillery strikes S. Korean island,” November 23, 2010, retrieved from
http://www.koreaherald.com/view.php?ud=20101123001048 15 On June 23 in 1973, Park Chung-hee announced the “Foreign Policy Statement for Peace and
Unification” consisting of seven provisions. It underlines that the peaceful unification of Korean
peninsula is a cooperative task of Korean people and both Koreas should continue to put efforts to
achieve the unification of Korea. Also, it emphasizes that South Korea does not oppose North Korea
to be a member of the United Nations. Tongilbu. (1999). Tongilbu 30 Yeonsa, 52-53, Available at
http://contents.archives.go.kr/next/search/showDetailPopup.do?rc_code=1310377&rc_rfile_no=2000
41003491&rc_ritem_no=000000000001#viewer

18
underscore “peaceful coexistence, reconciliation, and cooperation” with North Korea (Bae,
2010).16 The constant efforts of the South Korean government could lead an actual
improvement in the South – North relations in the Kim Dae-jung administration. Two leaders
of each Korea finally could hold the first bilateral summit in 2000, and the Roh Moo-hyun
administration also visited North Korea to have the second bilateral summit in 2007.
Unfortunately, the improved relations between South and North Korea was rapidly
frozen right after the conservative party took the office in the Blue House from 2008 and
2015. During the Lee Myung-bak and Park Geun-hye administrations, the fundamental pillar
of the foreign policy toward North Korea was not much switched from the policy of the
former progressive administrations;17 however, the major foreign policy of the conservative
administrations, which emphasize the military alliance with the U.S., was making the South
and North relations deteriorated. In addition, the death of Kim Jong-il in 2011 brought about
a regime change in North Korea from Kim Jong-il regime to Kim Jong-un regime and it
increased an uncertainty in the South – North relations. In fact, since Kim Jong-un was
inaugurated as the supreme leader of North Korea, the relations and the national security of
South Korea have been aggravated much more than before by his reckless military
provocation.
As South and North Korea have experienced the upheavals, the two Koreas’
economic relations also have repeated the same pattern back and forth. Furthermore, South
Korea’s trade with North Korea seems apparently follows political flags. As Figure 8 shows,
16 The Korean National Community Unification Formula of Roh Tae-woo and Kim Young-sam
administrations, Kim Dae-jung administration’s Sunshine policy, and Roh Moo-hyun
administration’s Peace and Prosperity Policy are included in the case. 17 “Mutual Benefits and Common Prosperity Policy” of Lee Myung-bak, see Bae 2010; “Trustpolitik”
which emphasizes the process of trust-building on the Korean peninsula, see Moon & Boo 2015.

19
it has different flows by the political flags of the South Korean administrations. This political
impacts on trade between the two Korea reveal drastically in the case of Kaesong Industrial
Complex. It was established in 2004 for the purpose of economic cooperation between the
two Koreas, but it has not been functioning for its purpose, being easily affected by political
tensions arising between the South and North.18 Currently, two Korea’s economic exchanges
have been stopped since April 2016 with the close of Kaesong Industrial Complex, in
response to the nuclear and ballistic missile tests of North Korea in January and February
2016.19 It seems that the political tension and economic disharmony between two Koreas
have not been relieved, rather it has been aggravated.
Source: The Korea International Trader Association (KITA, 2017)
Figure 8. Trade Volume of South Korea with North Korea by Administrations
18 After North Korea conducted a nuclear test in February 2013, the Kaesong industry was closed for
6 months, and Since March 2016, the industrial zone has been shut down in response for North
Korea’s nuclear and ballistic missile test in January and February 2016. 19 “Trade with N. Korea Falls to Near-Zero” May 13, 2016, Chousnilbo, retrieved from
http://english.chosun.com/site/data/html_dir/2016/05/13/2016051301098.html

20
1.5. Outline of the Thesis
Throughout the chapter, this thesis examines the impacts of South Korea’s political
relations with China, Japan, Russia, and North Korea on its bilateral trade with the four
countries and addresses that trade still follows political flags. The second chapter finds
academic backgrounds of this topic from the previous research. Even though much research
has contributed to finding relationship between politics and trade, there still remains debates
among scholars on this field between whether trade affects political relations or political
relations have more significant impacts on trade (Kastner, 2007; Lee and Pyun, 2016). Thus,
this chapter introduces relevant bodies of literature that deals with relationship between
politics and trade and finds how these literatures approach the issue. Also, this study looks at
how previous research measures political relations between countries as political relations are
one of the most crucial variables in this empirical study.
The third chapter establishes the hypothesis of this thesis and tests them by using
certain statistical models. This chapter notes that how political relations are measured in this
study and what variables are considered to estimate the effects of political relations on trade.
With providing reason for choosing variables and models, this chapter finds that South
Korea’s political relations with China, Japan, Russia, and North Korea have effects on South
Korea’s bilateral trade with the countries.
Following the empirical analysis in the third chapter, the fourth chapter interprets the
results of the analysis. Specifically, this chapter states that what the empirical results imply in
South Korea’s political relations and trade with the four countries and why the results are
reasonable to reflect the reality of political and trade situations of South Korea. This chapter
considers both the political perspective and economic perspective in interpreting the results,

21
and explains how these two perspectives affect each other in South Korea’s political
economy.
Finally, the last chapter concludes with contribution of this thesis to existing research
on this field as well as South Korea’s foreign and trade policy toward the four countries. This
thesis shows that South Korea’s political relations affect bilateral trade with the countries, but
it does not mean the effects are absolute. In other words, the significance of political relations
on bilateral trade appear differently by countries and the magnitude and duration of the
impacts also are not identical case by case. This chapter also provides some questions
unresolved and shortcomings of this study and suggests future tasks.

22
CHAPTER 2
PREVIOUS LITERATURE: POLITICAL RELATIONS AND TRADE
AND HOW TO MEASURE POLITICAL RELATIONS
The relationship between political relations and trade has been dealt with in many
studies. Despite robust research, there is still a debate among scholars between whether trade
affects political relations or political relations have more significant impacts on trade
(Kastner, 2007; Lee and Pyun, 2016). Thus, this chapter introduces two bodies of literature
that are closely relevant to this topic: (1) the argument that trade affects political relations;
(2) the argument that political relations affect trade. Through an extensive literature review,
this chapter finds that there is a lack of cases on the topic of South Korea, despite its political
and economic significance. Therefore, this study focuses on demonstrating the impacts of
South Korea’s political relations on its trade with China, Japan, Russia, and North Korea.
While trade data is objective and easily quantifiable, measuring political relations
between countries is not as simple (Davis, Fuchs and Johnson, 2017; Du et al., 2017).
Despite how difficult it is, a lot of research has contributed to measuring political relations.
This chapter shows three approaches to measuring political relations based on (1) negative
aspects between countries, such as military conflicts or diplomatic disputes; (2) the United
Nations General Assembly (UNGA) voting data; (3) political events data. Referring to the
method of previous research, this study attempts to measure South Korea’s political relations
with four countries by using the political event data and the UNGA voting data. In addition,
this study uses both yearly and monthly-based data in measuring South Korea’s political
relations.

23
2.1. Political relations and Trade
There have been numerous research studies dealing with the relationship between
political relations and trade. While there has yet to be a consensus on the links between
politics and trade, many scholars have contributed an extensive amount of literature on the
topic. This chapter introduces two bodies of literature which are closely relevant to this topic:
(1) the argument that trade has impacts on political relations; (2) the argument that political
relations affect trade. Despite robust research, there is still a debate among scholars on which
factor has prior and significant impacts between political relations and trade (Kastner, 2007;
Lee and Pyun, 2016). Prior to conducting an empirical analysis, looking at relevant previous
research on this field ishelpful to progress this study further by providing meaningful context.
The first body of work on this topic that is important to consider is about the
influence of trade on political relations. In particular, this school argues that trade between
countries contributes to peace between them (Polachek, 1980; Gasiorowski and Polachek,
1982; Hegre, Oneal and Russett, 2010; Lee and Pyun, 2016). In earlier studies, Arad and
Hirsch (1981) provide theoretical foundation that economic cooperation through trade can
force an imporvement in political relations between “belligerent” countries and derive
economic advantages. Polachek (1980), in his empirical research, also notes that “the more
essential and strategic the trade, the greater the deterrent effect of trade on conflict” and finds
“a doubling of trade between two countries” brings about “20% of diminution of hostility”
between them. Oneal and Russet (1999) and Herge, Oneal, and Russet (2010) demonstrate
that economic interdependence has a clear impact on reducing conflicts among countries.
Additionally, Lee and Pyun (2016) find that trade openness, “bilateral trade

24
interdependence,” and “global trade integration” significantly diminish “the probability of
conflict” between countries.
It is clear that these findings become fundamental and substantial academic ground to
support the perspective that trade affects political relations, but there exists research
countering this perspective as well. For example, Barbieri (1996a) and Barbieri and Peter
(2003) examine various measures of liberal perspective that trade contributes to peace. They
directly criticize the measure of the liberal perspective20 and find that there is little empirical
evidence to support the liberal perspective that “trade provides a path to interstate peace.”
Rather, they argue that “extensive economic interdependence” causes more possibility that
“dyads engage in military disputes.”21 Morrow (1999) notes that trade flows are “ex ante
observable” and have “indeterminate effect on the initiation and escalation of international
conflicts.” In contrast to Lee and Pyun (2016), Martin et al. (2008) shows that “higher trade
flows may not lead to more peaceful relations,” and international trade openness increases
the likelihood of conflict and war between countries.22
The second body of work that is important to consider is research supporting the idea
that political relations affect on trade. Scholars in this school argue that trade follows
political flags, and it could be used as “carrot and stick” in a state’s foreign policy (Pollins,
1989a, 1989b; Keshk, Reuveny and Pollins 2004; Davis, Fuchs and Johnson, 2017). In earlier
20 In particular, she directly criticizes the measurement method used by Gartzke and Li (2003), saying
that the analysis conducted by Gartzke and Li is not “truly dyadic,” in spite of their presenting their
work as dyadic analysis. 21 She mentions the higher economic extensive increases the military disputes between countries, but
it has little impact on “the incidence of war.” 22 Martin et al. (2008) say that bilateral trade could deter bilateral war because it increases “the
opportunity cost of bilateral war,” but since “multilateral trade openness” diminishes the opportunity
cost of bilateral war, global trade openness does not lead to peace between countries.

25
studies, Pollins (1989a, 1989b) investigates the influence of “general diplomatic
cooperativeness or hostility” on bilateral trade flows. In particular, he contends that import
decisions of countries are influenced by “purposive attempts by the importer,” “the general
foreign policy,” and “the recent status of relations.” Consequently, he finds that state-to-state
political relations, such as conflicts and cooperation between countries, fairly affect levels of
bilateral trade. Reuveny and Kang (1996) also note that when “the bilateral net conflict goes
up to be more cooperative, in general, the level of bilateral trade increases.”23 Dixon and
Moon (1993) in their empirical research using the United Nations voting agreements in
measuring political relations note that political relations have “a substantial and predictable
impact” on international trade and Morrow, Siverson and Tabares (1999) demonstrate that
moving from negative relations to positive relations brings about 75.2% increase in trade.
More recent studies, including Keshk, Reuveny and Pollins (2004), research what
they call the “conflict equation”. Formed by Oneal and Russett (1997), it is based on the the
“trade equation” built off of the “gravity” model (Tinberger, 1962). The gravity model
demonstrates that political relations still affect “flows of commerce between countries,”
directly disputing the claim that trade brings peace. Berger et al. (2013) also finds that
interventions of the US government in certain countries raises “the share of total imports” of
the intervened countries from the U.S.24 Davis, Fuchs, and Johnson (2017) insist that
governments tend to use “economic tools to influence international politics” by showing the
impacts of negative political events on trade of state-owned companies and private
23 Their research focuses on the causality between trade and political conflicts/cooperation. They
conclude that the causal relationship between trade and political relations depends on dyad and the
two aspects are substantially “reciprocal.” 24 It is an interesting finding of this research that there is no change in the export volume to the U.S.
from the countries intervened.

26
companies in China and India. Du et al. (2017) demonstrate that “political shocks” between
China and its major powers have impacts on exports to China from the major power
countries, by employing Yan’s political relations index (Yan et al., 2010). Of course, there
are arguments that trade does not follow political flags anymore. For example, Carnegie
(2014) argues that the existence of global trade institutions, such as WTO, contributes to
solving “political hold-up problems” by allowing states to trade for economic benefits, rather
than political reason. However, even if joining the WTO could prevent states from exploiting
trade as a political , it could not explain the impacts of positive political relations on trade
increases, which should be regarded as another aspect of political impacts on trade.25
Overall, all of the literatures mentioned above are meaningfully helpful for
progressing this study. However, any single piece of research on this field does not entirely
satisfy the purpose of this study. In particular, most of the research on this topic deals with
cases of European countries, the U.S., China, and Japan, but it hardly finds the case of South
Korea, even if South Korea’s trade could have a substantial connection to political relations.
Thus, this study focuses on demonstrating the impacts of South Korea’s political relations on
its trade with China, Japan, Russia, and North Korea.
2.2. How to Measure Political Relations
While trade data is objective and easily quantifiable, measuring political relations
between countries is not a simple task (Davis, Fuchs and Johnson, 2017; Du et al., 2017).
Despite how difficult it is, a lot of research focuses on measuring political relations.
25 There is research that shows that positive political relations promote trade. For example, Gowa and
Mansfield (2004) argue that alliances between countries help to “achieve an efficient level of trade.”
Najafi and Askari (2012) find that improvements in political relations with the U.S. lead to trade and
economic activities increasing with the U.S.

27
Although there would be numerous ways to estimate political relations, the most common
method to measure political relations, is looking at negative aspects between countries, such
as military disputes or diplomatic conflicts. For example, Oneal and Russett (1999) and
Herge, Oneal and Russett (2010), they argue that trade has impacts on political relations.
They do this by using the data from the Correlates of War (COW) project to find “militarized
disputes” and “potential military capabilities” as measurement for political relations. Morrow
(1999) in his research analyzes how trade could “alter both sides’ willingness to initiate
disputes”, as well as aggravate the disputes also uses the disputes data from COW. Kessh,
Pollins and Reuveny (2004) used Militarized Interstate Dispute (MID) data to show political
relations between countries.
Another way to measure political relations is to use the United Nations General
Assembly (UNGA) voting data in measuring political relations (Signorino and Ritter, 1999;
Bailey, Strezhnev, and Voeten, 2017). Based on countries’ voting choices, it shows the
affinity between countries by analyzing the voting similarities and preferences of countries
(Bailey, Strezhnev, and Voeten, 2017). Dixon and Moon (1993) use the UNGA voting
agreements data between exporters and importers in measuring political relations and
Carnegie (2014) checks “political similarity” between countries by using the UNGA voting
behavior similarity. Davis, Fuchs and Johnson (2017) measures “the distance in foreign
policy orientation” as one of the measures for political relations by using the ideal point
(Bailey, Strezhnev, and Voeten, 2017) based voting alignment in UNGA.
Some scholars use events data to measure political relations. Polachek (1980)
employs daily and yearly-based events data sourced from 47 different newspapers in the
Conflict and Peace data bank (COPDAB) in measuring “political interaction.” Pollins

28
(1989a, 1989b) also uses events data from the COPDAB to demonstrate how the “diplomatic
relationship” between importers and exporters affects trade flows. When it comes to using
events data, even if there are numerous ways to weigh each event, the “Goldstein scale”
(Goldstein, 1992) seems the most common and popular standard to weigh types of events in
current studies. The Goldstein scale weighs each type of political events by its severity
between -10, the most negative, and 10, the most positive.26 Davis and Meunier (2011) use
the “King-Lowe events data” (King and Lowe, 2003) based on the Goldstein scale in
weighing each event, and Davis, Fuch and Johnson (2017) employ the Global Data on
Events, Location and Tones (GDELT) events data (Leetaru and Schrodt, 2013) including the
Goldstein score in the dataset. Similar to the Goldstein scale, Yan et al. (2010) provides the
“Political Relations Index (PRI)” of China based on the political events from Chinese
newspaper, Renmin Ribao (People’s Daily), as well as information from the Ministry of
Foreign Affairs of the People’s Republic of China, Du et al. (2017) use the Yan’s PRI (Yan
et al., 2010) as a measure for political relations of China and find the effects of political
relations on trade.
It is evident that a lot of research demonstrates substantial ways to measure political
relations, but there are still some shrotcomings. For example, considering political relations
not only have negative aspects, but also positive aspects, the method of applying negative
political relations could show only one-sided impacts of political relations on trade. In
addition, the voting behavior similarities and the ideal point based on the UNGA voting data
could reflect general political interactions between each country, but it might not show the
26 For example, the Goldstein scale weighs a military attack, clash, and assault in -10 and “refuse,
oppose” or “turn down proposal, reject protest” in -4. As positive events, it weighs events such as
“ask for policy assistance” in 3.4 and “extend military assistance” in 8.3 (Goldstein, 1992).
29
actual and direct bilateral political relations between countries (Polachek, 1980).27 On top of
that, most research provides yearly-based political relations data, which hardly covers up the
flows of political relations in detail (Reueny and Kang, 1996; Du et al., 2017). Considering
that political relations could fluctuate in diverse aspects within a year or a month, the yearly
based political relations data might not show precise political relations between countries. As
a result, because yearly based political relations data cannot reflect the naunces of political
relations, it is most likely limitedin explaining the influence of political relations on trade.
Thus, this study uses events data primarily to measure South Korea’s political
relations, which mirrors both positive and negative political aspects between countries, as
well as usign yearly and monthly based data together.28 The following chapter begins with
the research design, including case selection, variables, measurement and methodology. The
results of this empirical analysis shows how South Korea’s political relations with China,
Japan, Russia, and North Korea affect trade with these countries.
27 For example, South Korea and Japan have a strong similarity in the UNGA voting. However, in
terms of two countries’ having heavy political disputes such as the Japanese history textbook issue
and the comfort women problem, two countries’ actual political relations could be not as close as the
voting similarity shows. 28 This part will be more explained in the next chapter.
30
CHAPTER 3
RESEARCH DESIGN AND EMPIRICAL RESULTS: IMPACTS OF POLITICAL
RELATIONS OF SOUTH KOREA ON ITS BILATERAL TRADE
3.1. Research Design
3.1.1. Case selection
In selecting cases, this thesis chiefly approaches with two perspectives, economic and
political perspectives. More specifically, this study considers how significantly a country
affects South Korea both politically and economically as well as how the political and
economic relations between South Korea and the country has altered. To show the
importance and changes in political and economic relations between South Korea and a case
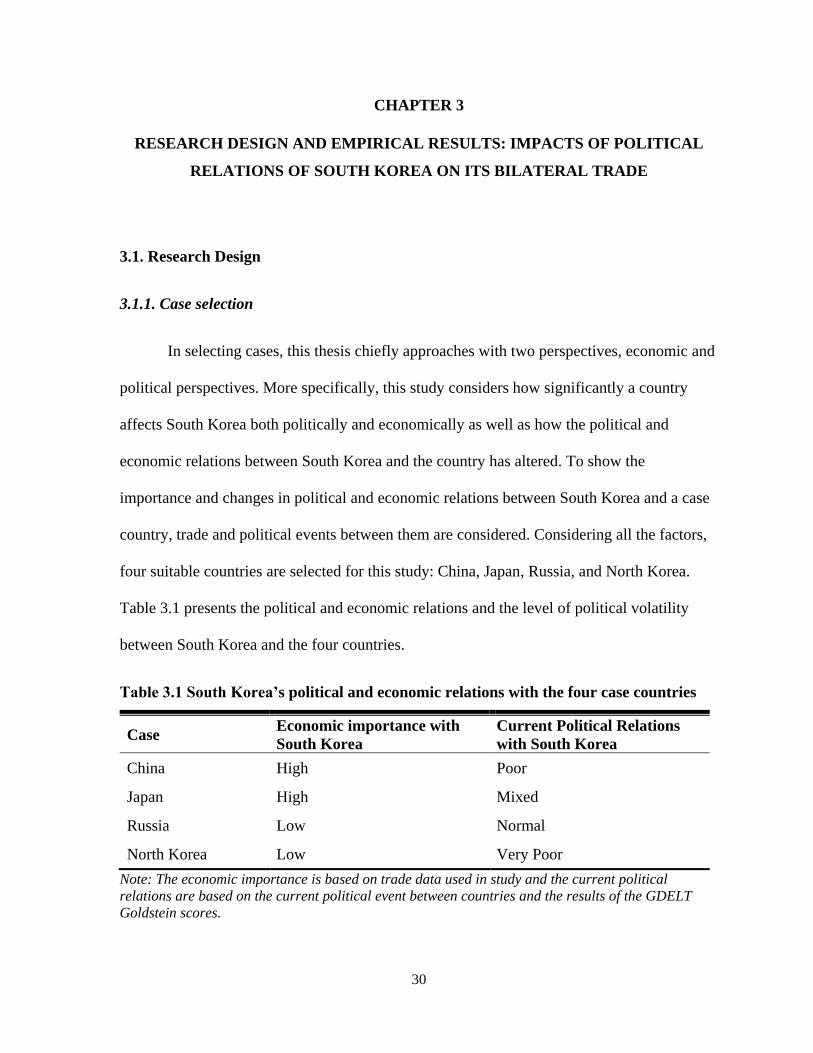
country, trade and political events between them are considered. Considering all the factors,
four suitable countries are selected for this study: China, Japan, Russia, and North Korea.
Table 3.1 presents the political and economic relations and the level of political volatility
between South Korea and the four countries.
Table 3.1 South Korea’s political and economic relations with the four case countries
Case Economic importance with
South Korea
Current Political Relations
with South Korea
China High Poor
Japan High Mixed
Russia Low Normal
North Korea Low Very Poor
Note: The economic importance is based on trade data used in study and the current political
relations are based on the current political event between countries and the results of the GDELT
Goldstein scores.
31
3.1.1.1. South Korea – China
As stated in the previous chapter, South Korea has had close political and economic
relations with China in its long history. As the two countries have experienced political
upheavals influencing each other in their modern history, the economic relations between the
two countries have been changing corresponding to the political relations. For example, when
political relations between the two was gradually being restored in 1970s and 1980s (Chung,
2009), the economic relations which was cut off after the Korean War also began resumed
slowly. In addition, after two countries’ normalizing diplomatic relations in 1992, the
economic cooperation between South Korea and China was rapidly rising up. The current
THAAD deployment issue that has negatively affected the economic relations between the
two countries is also one of cases to show that political relations between South Korea and
China have impacts on their economic relations. As Figure 10 indicates, the trend of political
relations between South Korea and China has not kept the even line, but had variations
moving up and down as time has passed by. Thus, this thesis attempts to seek the change in
trade flows between South Korea and China according to the political relations change
between the two countries and sets the first hypothesis like below.
H1: Positive (negative) political relations between South Korea and China increase
(decrease) South Korea’s import and export in trade with China.

32
3.1.1.2. South Korea – Japan
Japan is another country that has affected South Korea’s politics and economy, as
sharing a long and complicated history with South Korea.29 Even after South Korea
normalized diplomatic relations with Japan in 1965 (Oda, 1967), sensitive political and
historical issues including the comfort women issue, Japanese history textbook, and visits to
Yasukuni Shrine have negatively affected South Korea- Japan relations (Hidehiko, 2014). In
addition, even as South Korea and Japan’s economic relations have persisted, currently the
South Korea’s trade to Japan has been trending down. This is because South Korea has
reduced “reliance on Japan for production goods” to decrease the trade deficit in trade with
Japan as well as South Korean government has shifted its focus of foreign policy more on
China (Hidehiko, 2014).30 However, although Japan’s importance to South Korea’s trade is
currently declining and the two countries still have been struggling for the political issues,
the economic relations between South Korea and Japan will not simply cease. Considering
that Japan is still one of the top markets to South Korea’s exports and Japan’s high level
technologies and machinery products imported from Japan are still taking an important role
in the South Korean industry, the economic relations between the two countries will be
sustained. Therefore, this thesis sets the second hypothesis like below.
H2: Positive (negative) political relations between South Korea and Japan weakly increase
(decrease) South Korea’s import and export in trade with Japan.
29 Refer to Chapter 1 to see more explanation of the historical backgrounds between South Korea and
Japan. 30 Hidehiko (2014) notes that “Japan’s waning importance to South Korea is apparent from the
decline in its reliance on trade with Japan. This decline in Japan’s importance has also weakened the
motivation on repair the relationship.”
33
3.1.1.3. South Korea – Russia
In South Korea’s trade and political relations with Russia, it is likely to say, may not
be a country that has significant impacts on South Korea’s politics and economy. Russia is
not a major country political or economic partner to South Korea, but it is evident that there
are variations in political relations between South Korea and Russia as Figure 10 shows and
hence provides an important source of variation. It is true that political exchanges between
South Korea and Russia have been growing. While Russia concentrated on solving domestic
problems in 1990s, since 2000 when Vladimir Putin took the office in Kremlin, Russia has
focused on restoring foreign relations, extending its international influence. As it is reflected
in South Korea – Russia relations, diplomatic exchanges between the two countries have
been increasing since 2000.31 With the improved political relations between South Korea and
Russia, bilateral trade between the two countries was being activated as well. As Figure 9
indicates, South Korea’s trade with Russia has been on uptrend since 2000 and Russia was
one of the top 10 destinations of South Korea’s export from 2007 until 2013.32
As political exchanges and trade activities between South Korea and Russia have
been growing, it could uphold the idea of the impacts of South Korea’s political relations on
its trade. Nevertheless, the South Korea – Russia case would not fully present the point of
31 The diplomatic relations between South Korea and Russia was established on September, 1990, and
two countries’ presidents had the first bilateral meeting on September, 2013 during the G20 summit
in St. Petersburg. Most recently, Sergey Lavrov, the Foreign Minister of Russia, and Song Yong-gil,
the head of South Korea’s Norther Economic Cooperation Committee, shared the opinion to develop
cooperative relations between South Korea and Russia. “Russian – South Korea Relations” July 7,
2017, Sputnic International, retrieved from https://sputniknews.com/world/201707071055333192-
russian-south-korean-relations/; “Russia relations with South Korea on the rise, Lavrov says” October
13, 2017, Tass, retrieved from http://tass.com/politics/970539 32 South Korea’s trade volume with Russia decreased from 2014 to 2016, but it turned back into an
uptrend again in 2017. Data is from the Korea International Trade Association (KITA). Available at
http://stat.kita.net/stat/kts/ctr/CtrTotalImpExpList.screen
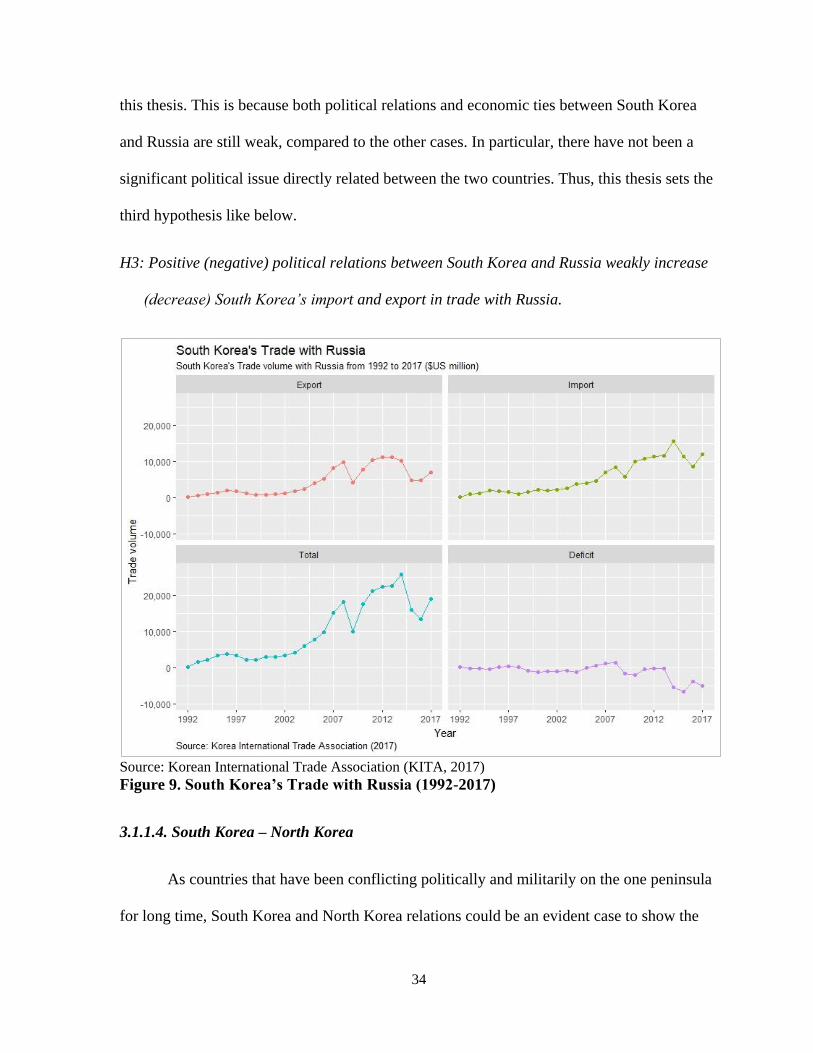
34
this thesis. This is because both political relations and economic ties between South Korea
and Russia are still weak, compared to the other cases. In particular, there have not been a
significant political issue directly related between the two countries. Thus, this thesis sets the
third hypothesis like below.
H3: Positive (negative) political relations between South Korea and Russia weakly increase
(decrease) South Korea’s import and export in trade with Russia.
Source: Korean International Trade Association (KITA, 2017)
Figure 9. South Korea’s Trade with Russia (1992-2017)
3.1.1.4. South Korea – North Korea
As countries that have been conflicting politically and militarily on the one peninsula
for long time, South Korea and North Korea relations could be an evident case to show the

35
impacts of political relations on economic relations. South and North Korea had certain
economic exchanges,33 but the economic relations between the two Koreas could not be
constant, repeating being stopped and resumed by fluctuating political situations between the
two Koreas as Figure 10 shows. In particular, it is to meet their needs that North Korea has
frequently used the economic tool with military provocations. South Korea’s foreign policy
including economic and political strategies toward North Korea also has been constantly
switched depending on political flags of the South Korean administrations in the office.34 As
a result, this study tries to find the impacts of switching political relations between South and
North Korea on trade relations between the two Koreas. The last hypothesis of this thesis is
like below.
H4: Positive (negative) political relations between South Korea and North Korea increase
(decrease) South Korea’s import and export in trade with North Korea.
3.1.1.5. Why the United States is Excluded
Rather, as explained in Chapter 1, the U.S. is one of the major countries that
remarkably affects South Korea politically and economically. However, if the U.S. is
selected as one of the cases for this study, the case could not fully explain the impacts of
South Korea’s political relations on its trade. This is because the U.S. has always been the
33 South Korea had economic relations through trade, investment, such as establishing Kaesong
industry in North Korea. In addition, the South Korean government has sent North Korea an
economic aid for the humanitarian purpose when North Korea suffered from severe droughts and
natural disasters in the past. Manyin, M. E. (2005). Foreign Assistance to North Korea. CRS Report
for Congress, RL31785. 34 As it is shown in chapter 1, South Korea’s trade flows with North Korea are differenced by political
flags of South Korean administrations and the case of the Kaesong Industrial Complex can be a
decent example that North Korea exploits economic relations as a tool fulfill their political goal.

36
major market to South Korea since South Korea joined the world market35 as well as there
are little variations in the political relationship between two countries. In other words,
negative events, such as a war, a military clash or diplomatic conflicts are hardly found in the
political relationship between the two countries,36 thus, it is hard to demonstrate that South
Korea- US political relations can affect trade flows between the two countries.
Figure 10. Actions of each Government and the ideal point distance between South
Korea and the four case countries
35 The fact that the U.S. has always been the top 3 countries in the South Korea’s imports and exports
ranks shows that South Korea and the U.S. has maintained the economic relations evenly without a
big fluctuation. Data is from the Korea International Trade Association (KITA). Available at
http://stat.kita.net/stat/kts/ctr/CtrTotalImpExpList.screen 36 The last military conflicts between Korea and the U.S. was the Korean Expedition, the
Shinmiyangyo, in 1871.

37
3.1.2. Dependent Variables
To test the hypotheses of this study, this thesis employ both yearly and monthly-based
data on South Korea’s imports from China, Japan, Russia and North Korea, and exports to
the same countries provided by the Korea International Trade Association (KITA) as the
dependent variable. The data begins on January in 1989 for China, Japan and North Korea,
the first month and year that the KITA contains South Korea’s trade data with North Korea,
and on January in 1992 for Russia, which is the first year of data on South Korea’s trade with
Russia sourced by the KITA. All data extends through December, 2016.
3.1.3. Measuring Political Relations
This study uses both yearly and monthly-based events data in measuring political
relations and focuses on government and military actions between South Korea and each of
the four countries- China, Japan, Russia, and North Korea. As monthly data, it sources the
events data from the Global Data on Events, Location and Tones (GDELT) data (Leetaru and
Schrodt, 2013). The GDELT dataset is based on a “machine coding system to classify daily
reports of event” (Davis, Fuchs, and Johnson, 2017), covering up the world’s printed,
broadcast, and web based news media in over 100 languages, from January 1, 1979 through
the present.37 The dataset provides daily events from the global news media with the
information of actors involved in the events and each event is weighted between -10 to 10
that shows the severity of each event based on the “Goldstein scale” (Goldstein, 1992). For
37 The GDELT introduces its database in their website saying that it is “the largest, most
comprehensive, and highest resolution open database of human society ever created. Creating a
platform that monitors the world’s news media from every corner of every country in print, broadcast,
and web formats, in over 100 languages, every moment of every day and that stretches back to
January 1, 1979 through present day.” More information about the GDELT is available at
https://www.gdeltproject.org/
38
instance, use of military force would be weighed in -10 and it is more negatively regarded
than a verbal condemnation of another country’s actions, which would be weighed in -3.4
(Davis, Fuchs and Johnson, 2017). As an alternative measure of political relations, this study
also employs United Nations General Assembly (UNGA) voting data, which is coded
annually (Signorino and Ritter, 1999; Bailey, Strezhnev, and Voeten, 2017).38
The first political relations variable measures overall flows of political relations
between South Korea and the four countries: China, Japan, Russia, and North Korea. In order
to make a single monthly observation, this study makes a weighted average on the Goldstein
scores – political relations score (PRS) - contained in the GDELT events data. Each
Goldstein score in the dataset are multiplied by the number of source documents that mention
each of events and divided by the total number of source documents in a month. This weight
represents the relative importance or level of attention each event gets in a country. For
example, if an event is only mentioned once in the press, it will receive a lower weight than
in it is mentioned 10 or 100 times. Each month has a weighted average score to represent
political relations between South Korea and each of the four countries. Plus, considering that
the Goldstein scores on each event are different by an actor that takes an action to the other
actor (see Goldstein, 1992), this study separates each case by the actor (actor1), which is the
subject of an action, toward the other actor (actor2), which is the object of the action from
actor1. For example, the weighted average Goldstein score on July, 2010, is -2.6 when South
Korea is the actor1 and China is the actor2, but the score is -0.7 when China is the actor1 and
South Korea is the actor2. Thus, the PRS in this study shows South Korea’s perspective on
38 The more explanation about the UNGA voting data is stated in the last political relations variable
section below.
39
political relations toward each of the four countries, in reverse, each of the four countries’
perspective on political relations toward South Korea separately.39
The second political relations variable quantifies tensions and conflicts between
South Korea and the four countries. To measure tensions and conflicts, this study uses the
Goldstein scores in the GDELT events data again, but employs another way in using the
scores. Instead of averaging the scores weighted by the number of source that mentions the
events, this measures tensions and conflicts between countries by summing the number of
negative events by months based on the Goldstein scale (Goldstein, 1992).40 The events
below 0 score are considered “negative events”. Because the Goldstein scores on each event,
as noted earlier, are differenced by the subject of an action, the number of negative events are
also differenced according to the subjects. Thus, this measure also constructs two different
cases by the subject of actions.
The last political relations variable measures the gap in preferences of foreign policy
between South Korea and the four countries. Based on UNGA votes, scholars have measured
“foreign policy preference virtually” since the international institution was established
(Bailey, Strezhnev, and Voeten, 2017). The most used of UNGA voting data is the “S score”
constructed by Signorino and Ritter (1999). The S score reflects the affinity between two
countries by capturing similarities in the vote choices of two countries in the UN. However,
Bailey, Strezhnev and Voeten (2017) point out that the S score has a crucial weakness.
39 In this study, the weighted average score does not mean that the event corresponding the Goldstein
score occurs in that month. Rather, the score are regarded as an indicator to show bilateral political
relations in that month. 40 Even if Davis, Fuchs and Johnson (2017) do not measure positive political relations through using
GDELT events data, they measure negative political relations by summing the number of negative
events based on the Goldstein scores (Goldstein, 1992) contained in the GDELT events data.
40
Basically, the S score assumes “a straightforward relationship” between the frequency that
two countries vote together and voting similarity. Therefore, “voting coincidence” relied on
“what resolutions that states vote on,” which means if a state does not participate voting on a
certain resolution that the other state takes part, it lowers the voting similarity
unintentionally.
In that sense, Bailey, Strezhnev and Voeten (2017), based on the UNGA votes of
each country on a given resolution, construct the yearly-based “state ideal points” in a single
dimension that reflects state’s stance and preference toward the “US-led liberal order.” Their
estimate is measured by using resolutions which were constant over time and it enables
researchers to pull apart “shifts in the preference from changes in UN agenda,” making better
comparisons of state preference available (Davis, Fuchs and Johnson, 2017; Bailey,
Strezhnev and Voeten, 2017). Thus, the distance in the ideal points between two countries
reflects the difference in preference of the foreign policy between the two. This study uses
the gap in ideal points (Bailey, Strezhnev and Voeten, 2017) between South Korea and the
four each country. The data extends from 1991 to 2014 and Figure 10 presents how the
distance in the ideal points between South Korea and each country has been altered.
3.1.4. Control Variables
In order to find the impacts of South Korea’s political relations on its trade, this study
includes several control variables that could affect trade flows in general with the primary
variable, political relations. The first control variable is the gross domestic product of the five
countries: South Korea, China, Japan, Russia and North Korea. Motivated by the standard
gravity model, much research associated with trade and political relations employ GDP data
as one of variables to show the general size of country’s economy (Keshk, Pollins and

41
Reuveny, 2004). Therefore, this study sources data from the World Bank for GDP of China,
Japan and Russia, and data from the Statistics Korea for GDP of North Korea. Each GDP
data is calculated in the current year US$ million and all of GDP data are logged.
Following the standard gravity model, much empirical research on this field employs
population data as an indicator to reveal the size of a country’s internal market and market
potential (Keshk, Pollins and Reuveny, 2004; Davis, Fuchs and Johnson, 2017). This study
also uses data on populations of countries in each of the cases. Keshk, Pollins and Reuveny
(2004) anticipate that population has negative relations with trade as it indicates the size of a
“nation’s internal market,” but this study tries to see the effect of populations in a different
sight. As populations indicates the size of market and market potential, this study regards that
a country tends to have a higher trade relation with a country having a high population than
with a country having a low population. All of population data on each country are provided
by the World Bank.
The third control variable of this analysis is the Foreign Direct Investment (FDI)
volume between each of countries, which is closely related to political relations and trade
between two countries (Anderson and van Wincoop, 2003; Dvais and Meunier, 2011).
Compared to GDP and populations data, finding data on FDI flows between South Korea and
each country from 1989 to 2016 is not available through other research and the data bank of
international organizations, such as the World Bank and the International Monetary Fund.
Thus, FDI data in this study are based on South Korean government data. Data on South
Korea’s outward FDI for each of the countries is sourced from the Export-Import Bank of
Korea (Korea Eximbank) and data on other countries’ FDI toward South Korea is provided
42
by the Ministry of Trade, Industry and Energy. All of the FDI data are calculated in the
current year US$ million.
The fourth control of this analysis is lagged imports and exports data. In the sense
that trade relations between countries contain “inertia” that tends to sustain the former trade
aspects, much trade-related research in political science employ lagged trade data to see its
effects on the present trade (Keshk, Pollins and Reuveny, 2004; Hegre, Oneal and Russett,
2010; Du et al., 2017). Trade inertia could be driven by various factors, such as the time that
a market clears and the time tastes of consumers change (Keshk, Pollins and Reuveny, 2004).
For this reason, this study also regards lagged imports and exports data as one factor to affect
the current trade and set these as one of the control variables.
With the four control variables stated above, two more control variables are added in
the analysis to use the annual UNGA voting data as the primary independent variable. The
first additional control variable is the democracy score. Trade relations depend on regime
type of each country and it has been found that democracy countries tend to trade more with
other countries than autocracy countries (Dixon and Moon, 1993; Gartezke and Li, 2003;
Davis, Fuchs and Johnson, 2017). To measure the degree of democracy, this analysis
employs the polity2 score from the Polity Ⅳ Project (Marshall, Gurr, Davenport and Jaggers,
2002). The score extends from negative 10 (the most autocratic) to positive 10 (the most
democratic).
The second additional control variable is a dummy variable to indicate the year when
both countries are member of the WTO. Following the idea of the research conducted by
Davis, Fuchs and Johnson (2017), this study attempts to see how joining multilateral trade
association influence bilateral trade relations. Based on the information of member countries
43
from WTO website, the years that both countries are the member of the WTO take a value 1,
and if either one of two countries does not join the WTO in that year, it takes a value 0. Table
3.2 organizes all variables, their definitions, and their original sources.

44
Table 3.2 Variables and Sources
Variables Description Source
Dependent variables
Imports (monthly)
Monthly imports volume of South Korea (US$ million) /
(log) Annual imports volume of South Korea
(US$ million)
KITA (stat.kita.net)
Exports (monthly)
Monthly exports volume of South Korea (US$ million) /
(log) Annual exports volume of South Korea
(US$ million)
KITA (stat.kita.net)
Primary independent variables
Political relations scoreS.Korea Weighted-average of Goldstein scores /
Actions of South Korea toward trading partners, lag GDELT (Leetaru and Schrodt, 2013)
Political relations scorePartner Weighted-average of Goldstein scores /
Actions of trading partners toward South Korea, lag GDELT (Leetaru and Schrodt, 2013)
Negative eventsS.Korea Sum of the negative events based on Goldstein scores
Actions of South Korea toward trading partners, lag GDELT (Leetaru and Schrodt, 2013)
Negative eventsPartner Sum of the negative events based on Goldstein scores
Actions of trading partners toward South Korea, lag GDELT (Leetaru and Schrodt, 2013)
Ideal point distance (annual) Distance between two states in foreign policy preferences
based on UNGA voting, lag
Bailey, Strezhnev and Voeten
(2017)

45
Table 3.2 Continued
Control variables
GDP (log) GDP of countries (US$ million), lag
The World Bank Open Data
(https://data.worldbank.org/) /
The Statistics Korea
(http://kostat.go.kr)
Population The number of population, lag The World Bank Open Data
(https://data.worldbank.org/)
FDI The amount of foreign direct investment (US$ million)
the Export-Import Bank of Korea
(https://www.koreaexim.go.kr) /
the Ministry of Trade, Industry and
Energy (http://www.motie.go.kr)
(lag) Imports Imports volume of South Korea (monthly and annual,
US$ million), lag KITA (stat.kita.net)
(lag) Exports Exports volume of South Korea (monthly and annual,
US$ million), lag KITA (stat.kita.net)
Polity Polity Ⅳ score from – 10, most autocracy, to +10, most
democracy, lag Marshall, Gurr and Jaggers (2016)
Both WTO 1 if both countries are WTO members in the same year.
Otherwise, 0. WTO(https://www.wto.org/)

46
3.2. Empirical Analysis
3.2.1. Empirical Strategy
To demonstrate the effect of political relations between South Korea and each of the
four countries on South Korea’s bilateral trade with the countries, this empirical analysis
builds on two models, a vector autoregression (VAR) model and a gravity model. The VAR
model is a decent method to find the degree of the impact at different time periods, which
meets one of the purposes of this study. As the most common and popular way to estimate
relations between politics and trade, the gravity model assumes that the bilateral trade is
proportional to the size of economy, personal income and economic activity in both countries
and, in reverse, it decreases with resistance such as physical distance between countries
(Herge, Oneal and Russett, 2010; Du et al., 2017). Through the two models, this study
attempts to test the four hypotheses and seeks how South Korea’s political relations with the
four countries influence its bilateral trade with the countries.
3.2.1.1. Vector Autoregression Model
To test the hypotheses and find the degree to which political shocks have substantial
impacts on trade over time, this study uses a vector auto-regression (VAR) model. Du et al.
(2017) notes that the VAR model is designed to measure the degree of the impact at different
time periods and allows “the symmetric treatment of all covariates” to be “endogenous
variables” systematically. Easily to explain, the model tests at which point in time an event
takes substantial effects on dependent variable as well as enables to estimate relations among
all of variables, allowing each of variables in the model to be a dependent variable.
47
One prior and important condition for a significant analysis with the VAR model is
that the time series data should be stable. This means that the time series data analyzed by the
VAR model should have constant means and variances over time and do not draw a trend
line.41 Therefore, before estimating the VAR model, this study conducts diagnostic tests to
check for stationarity in the time series. To investigate the stationarity of the time series data,
the Augmented Dicky-Fuller (ADF) unit root test is implemented. Table 3.3 shows the result
of the ADF test and the results reveal that some of data are not stationary in levels, but all of
data are stationary in the first differences at lag 1. For this reason, the non-stationary
variables either in the constant type or trend type are differenced once at lag 1 to have every
variable analyzed in the identical condition showing stationarity.
Formally, this study estimates the following equations:
𝛥𝐼𝑚𝑝𝑜𝑟𝑡𝑠𝑠𝑝,𝑡 = 𝛽𝑜 + 𝛴𝑚=1𝑘 𝑎𝑚𝛥𝑃𝑅𝑠𝑝,𝑡−𝑚 + 𝛴𝑚=1
𝑘 𝑏𝑚𝛥𝐺𝐷𝑃𝑠𝑝,𝑡−𝑚 +
𝛴𝑚=1𝑘 𝑐𝑚𝛥𝑃𝑂𝑃𝑠,𝑡−𝑚 + 𝛴𝑚=1
𝑘 𝑑𝑚𝛥𝐹𝐷𝐼𝑝,𝑡−𝑚 +
𝛴𝑚=1𝑘 𝑒𝑚𝛥𝐼𝑚𝑝𝑜𝑟𝑡𝑠𝑠𝑝,𝑡−𝑚 + 𝑣𝑡
𝛥𝐼𝑚𝑝𝑜𝑟𝑡𝑠 (1)
𝛥𝐸𝑥𝑝𝑜𝑟𝑡𝑠𝑠𝑝,𝑡 = �̃�0 + 𝛴𝑚=1𝑘 �̃�𝑚𝛥𝑃𝑅𝑝𝑠,𝑡−𝑚 + 𝛴𝑚=1
𝑘 �̃�𝑚𝛥𝐺𝐷𝑃𝑠𝑝,𝑡−𝑚 +
𝛴𝑚=1𝑘 �̃�𝑚𝛥𝑃𝑂𝑃𝑝,𝑡−𝑚 + 𝛴𝑚=1
𝑘 �̃�𝑚𝛥𝐹𝐷𝐼𝑠,𝑡−𝑚 +
𝛴𝑚=1𝑘 �̃�𝑚𝛥𝐸𝑥𝑝𝑜𝑟𝑡𝑠𝑠𝑝,𝑡−𝑚 + �̃�𝑡
𝛥𝐸𝑥𝑝𝑜𝑟𝑡𝑠 (2)
41 When a research estimate a model with non-stationary data, it leads to unsuitable test statistics.
Retrieved from https://econometricswithr.wordpress.com/time-series/an-introduction-to-vector-
autoregression-var/

48
𝛥𝐼𝑚𝑝𝑜𝑟𝑡𝑠𝑠𝑝,𝑡 and 𝛥𝐸𝑥𝑝𝑜𝑟𝑡𝑠𝑠𝑝,𝑡 represent the changes of imports and exports volume
of country s (South Korea) from its trading partner p (China, Japan, Russia and North Korea)
each during a month t. 𝛥𝑃𝑅 represents the changes of the first and second measure of
political relations, the weighted-average of the Goldstein score and the number of negative
events, between South Korea and its trading partners. To be specific, 𝛥𝑃𝑅𝑠𝑝 indicates actions
of South Korea toward its trading partners, in reverse, 𝛥𝑃𝑅𝑝𝑠 represents the opposite
direction. This analysis expects that the weighted-average Goldstein score should have a
positive relationship with trade, on the other hand, there should be a negative relationship
between the number of negative events and trade.
𝛥𝐺𝐷𝑃𝑠𝑝 represents the changes of the logged GDP of both countries in US$ million.
𝛥𝑃𝑂𝑃𝑠 and 𝛥𝑃𝑂𝑃𝑝 simply indicate the changes in populations of country s and p. As
populations reveal the size of market and market potential, a country could tend to have a
trade relation with a country having a high population. Therefore, this study matches 𝛥𝑃𝑂𝑃𝑠
with imports of South Korea, which can be shown as exports of trading partners to South
Korea, and 𝛥𝑃𝑂𝑃𝑝 with exports of South Korea to trading partners. 𝛥𝐹𝐷𝐼𝑠 and 𝛥𝐹𝐷𝐼𝑝 denote
the changes in Foreign Direct Investment volume of country s and p toward each other.
Likely to the population variable, this study sees 𝛥𝐹𝐷𝐼𝑠 is related to exports of South Korea,
in reverse, 𝛥𝐹𝐷𝐼𝑝 is associated with imports of South Korea.
𝛥𝐼𝑚𝑝𝑜𝑟𝑡𝑠𝑠𝑝,𝑡−𝑚𝑎𝑛𝑑 𝛥𝐸𝑥𝑝𝑜𝑟𝑡𝑠𝑠𝑝,𝑡−𝑚 represent the changes in 𝛥𝐼𝑚𝑝𝑜𝑟𝑡𝑠𝑗𝑖,𝑡 and
𝛥𝐸𝑥𝑝𝑜𝑟𝑡𝑠𝑗𝑖,𝑡 lagged month m and 𝑣𝑡𝛥𝐼𝑚𝑝𝑜𝑟𝑡𝑠
is the trend of the VAR model. In case of GDP,
it has a negative relationship with imports, on the other hand, it shows a positive

49
relationships with exports. The other control variables are expected to have positive relations
with trade in this study.
In this analysis, all variables are differenced once at lag1 in order to have the
stationarity, and the primary independent variable and all of the control variables are lagged
at month m from time t. To specify the certain number of lags and support it statistically, the
Akaike’s information criterion (AIC) test is used to determine the lag length. The AIC
compares each set of statistical models to find the best fit and the lower AIC value indicates
that the variable is more suitable to explain the model.42 As the results of the AIC test reveal
that lag 12 is the most significant to explain the model, this analysis sets lagged month m in
12, which tests when the effects of political relations on trade appear within 12 months.
42 Even if AIC does not provide absolute suggestion to choose a certain variable, it is one of general
ways to be used as a hypothesis test. See for more explanations
http://www.statisticshowto.com/akaikes-information-criterion/

50
Table 3.3 Results of the Stationarity test
Augmented Dickey-Fuller (ADF) Test
South Korea – China
Variable
Constant Trend
Level First
difference Lags Level
First
difference Lags
PRS_SK -9.106*** -21.764*** l(1) -10.534*** -21.743*** l(1)
PRS_CH -11.055*** -20.250*** l(1) -11.029*** -20.221*** l(1)
NoNeg_SK -8.434*** -19.873*** l(1) -10.462*** -19.848*** l(1)
NoNeg_CH -10.161*** -20.521*** l(1) -11.332*** -20.490*** l(1)
Imports_SK -0.385 -17.426*** l(1) -2.945** -17.432*** l(1)
Exports_SK -0.368 -16.399*** l(1) -2.865** -16.402*** l(1)
ln(GDP_SK) -0.288 -13.204*** l(1) -2.470** -13.192*** l(1)
ln(GDP_CH) 2.074* -13.680*** l(1) -1.096 -14.170*** l(1)
Population_SK -1.422 -14.587*** l(1) -2.514* -14.652*** l(1)
Population_CH -1.988* -14.541*** l(1) -2.106* -14.711*** l(1)
FDI_SK -4.601*** -12.849*** l(1) -7.216*** -12.829*** l(1)
FDI_CH -5.438*** -12.848*** l(1) -6.951*** -12.830*** l(1)
South Korea – Japan
PRS_SK -11.830*** -21.583*** l(1) -11.990*** -21.547*** l(1)
PRS_JP -10.435*** -20.173*** l(1) -10.562*** -20.141*** l(1)
NoNeg_SK -8.613*** -21.974*** l(1) -11.198*** -21.941*** l(1)
NoNeg_JP -10.360*** -21.519*** l(1) -12.830*** -21.486*** l(1)
Imports_SK -1.834 -20.589*** l(1) -3.099** -20.554*** l(1)
Exports_SK -1.908 -17.790*** l(1) -3.108** -17.764*** l(1)
ln(GDP_SK) -0.288 -13.204*** l(1) -2.470* -13.192*** l(1)
ln(GDP_JP) -2.339* -12.884*** l(1) -2.205* -12.924*** l(1)
Population_SK -1.422 -14.587*** l(1) -2.514* -14.652*** l(1)
Population_JP -3.560*** -13.352*** l(1) -0.088 -14.452*** l(1)
FDI_SK -7.606*** -12.845*** l(1) -9.747*** -12.826*** l(1)
FDI_JP -5.666*** -12.846*** l(1) -7.367*** -12.827*** l(1)

51
Table 3.3 Continued
South Korea – Russia
PRS_SK -10.936*** -18.328*** l(1) -11.019*** -18.287*** l(1)
PRS_RS -10.003*** -18.446*** l(1) -10.256*** -18.413*** l(1)
NoNeg_SK -11.514*** -20.080*** l(1) -11.684*** -20.046*** l(1)
NoNeg_RS -10.475*** -19.914*** l(1) -11.320*** -19.880*** l(1)
Imports_SK -1.836 -15.425*** l(1) -4.163*** -15.398*** l(1)
Exports_SK -2.411* -16.841*** l(1) -3.396*** -16.821*** l(1)
ln(GDP_SK) -0.372 -12.443*** l(1) -2.416** -12.428*** l(1)
ln(GDP_RS) -0.971 -12.152*** l(1) -1.459 -12.134*** l(1)
Population_SK -2.923** -13.199*** l(1) -6.328*** -13.452*** l(1)
Population_RS -1.460 -12.516*** l(1) 0.626 -12.726*** l(1)
FDI_SK -4.412*** -12.125*** l(1) -4.786*** -12.105*** l(1)
FDI_RS -8.428*** -12.124*** l(1) -8.651*** -12.104*** l(1)
South Korea – North Korea
PRS_SK -9.739*** -20.682*** l(1) -11.126*** -20.650*** l(1)
PRS_NK -10.375*** -24.692*** l(1) -11.894*** -24.654*** l(1)
NoNeg_SK -6.344*** -17.743*** l(1) -7.789*** -17.716*** l(1)
NoNeg_NK -9.786*** -22.844*** l(1) -11.887*** -22.810*** l(1)
Imports_SK -2.894** -14.346*** l(1) -3.657*** -14.347*** l(1)
Exports_SK -3.971*** -17.871*** l(1) -5.715*** -18.860*** l(1)
ln(GDP_SK) -0.288 -13.204*** l(1) -2.470** -13.192*** l(1)
ln(GDP_NK) -2.514* -11.464*** l(1) -1.914 -11.619*** l(1)
Population_SK -1.422 -14.587*** l(1) -2.514* -14.652*** l(1)
Population_NK -2.073* -14.516*** l(1) -1.914 -14.712*** l(1)
FDI_SK - - l(1) - - l(1)
FDI_NK - - l(1) - - l(1)
Note: This table presents the results of the Augmented Dickey-Fuller (ADF) test to check stationarity
of data, and numbers in each cell represent values of t-statistics. In the variable column, ‘PRS’ means
the Goldstein score according to actions of South Korean government and military and each of four
countries’ governments and military and ’NoNeg’ mean the number of negative actions of South
Korean government and military and the same actors of each of four countries. ‘Imports’ represents
imports of South Korea from the four countries given and ‘Exports’ represents exports of South
Korea to the same countries. ‘ln(GDP)_country’ indicate the logged gross domestic product and
‘Population_country’ represents population of each country. ‘FDI_SK’ represents the foreign direct
investment from South Korea to the four countries, in reverse, ‘FDI_CH,JP,RS,NK’ represent the
foreign direct investment from each of four countries to South Korea. *** significant 1%;
** significant 5%; * significant 10%

52
3.2.1.2. Gravity Trade Equation Model
Much of the research that investigates the impacts of political relations on trade
employs the gravity model (e.g. Anderson and van Wincoop, 2003). The gravity model
assumes that the bilateral trade is proportional to the size of economy, personal income and
economic activity in both countries and, in reverse, it decreases with resistance such as
physical distance between countries (Herge, Oneal and Russett, 2010; Du et al., 2017). As
many of studies follow the gravity model with adding other variables, such as population or
exchange rates, this study also builds on the gravity model of trade.
Specifically, this study estimates the second set of following equations:
𝐼𝑚𝑝𝑜𝑟𝑡𝑠𝑠𝑝,𝑡 = 𝛽𝑜 + 𝛽1 𝑃𝑅𝑠𝑝,𝑡−1 + 𝛽2 𝐺𝐷𝑃𝑠𝑝,𝑡−1 + 𝛽3 𝑃𝑂𝑃𝑠,𝑡−1 + 𝛽4 𝐹𝐷𝐼𝑝,𝑡−1 +
𝛽5 𝑃𝑜𝑙𝑠𝑝,𝑡−1 + 𝛽6 𝐼𝑚𝑝𝑜𝑟𝑡𝑠𝑠𝑝,𝑡−1 + 𝑊𝑇𝑂𝑡 + ε𝑠𝑝𝑡 (3)
𝐸𝑥𝑝𝑜𝑟𝑡𝑠𝑠𝑝,𝑡 = �̃�𝑜 + �̃�1 𝑃𝑅𝑠𝑝,𝑡−1 + �̃�2 𝐺𝐷𝑃𝑠,𝑡−1 + �̃�3 𝑃𝑂𝑃𝑝,𝑡−1 + �̃�4 𝐹𝐷𝐼𝑠,𝑡−1 +
�̃�5 𝑃𝑜𝑙𝑠𝑝,𝑡−1 + �̃�6 𝐸𝑥𝑝𝑜𝑟𝑡𝑠𝑠𝑝,𝑡−1 + 𝑊𝑇�̃�𝑡 + ε̃𝑠𝑝𝑡 (4)
Most of variables used here are identical with the variables applied to the VAR
model. However, this model uses annual data on each variable instead of employing monthly
data. Plus, in this analysis, the ideal point distance based on the UNGA voting data (Bailey,
Strezhnev, and Voeten, 2017) is added to measure political relations. Thus, PR represents
political relations measured in the weighted average of the Goldstein score, the number of
negative events and the ideal point distance, and all of them are measured yearly. This
analysis anticipates that the annual Goldstein score should have a positive relations with
trade, on the other hand, the number of negative events and the ideal point distance should
show negative relations with trade.
53
GDP, POP, FDI and lagged trade denote the same stated in the VAR model, but
measured yearly in this analysis. As noted earlier, two more control variables are added in
the gravity model – democracy score and country’s joining WTO (dummy). 𝑃𝑜𝑙𝑠𝑝 denotes
the democracy scores both of country s (South Korea) and country p (China, Japan, Russia
and North Korea) measured by the Polity Ⅳ. 𝑊𝑇𝑂𝑡 represents the year when both of country
s and p participated in the WTO and is measured in a dummy variable that takes a value of 1
if both countries become a member of the WTO. In terms of relations between the dependent
variable and control variables, this analysis follows the identical anticipation with that of the
VAR model. ε𝑠𝑝𝑡 is the error term.
Except for political relations, the democracy score, and WTO dummy variable, all of
the variable are logged and lagged one year. The analysis begins in 1991 for China, Japan
and North Korea, the first year for which North Korea’s ideal point distance appear and
begins in 1992 for Russia, the first year for which the KITA provides South Korea’s trade
data with Russia. Both estimations extend through 2014, the last year that the ideal point
distance exists for all the countries. Even if the purpose of this research is to find the impacts
of political relations on trade, it anticipates that the yearly-based gravity model in this
analysis would not fully explain the effects on trade because yearly-based political relations
data would not be able to reflect the flows of direct political relations between two
countries.43
43 For more explanations, refer to Chapter 2
54
3.2.2. Empirical Results
3.2.2.1. The VAR model
To show the impacts of South Korea’s political relations with China, Japan, Russia
and North Korea on its trade with these countries effectively, this study uses the Impulse
Response Function (IRF) instead of showing the results in a table with numbers. Following
the approach of Du et al. (2017), this study also shows the impulse responses that are
significant at 90% or higher to ease understanding and clarify the visualization of the results.
Figure 11 displays the impacts of political relations on South Korea’s imports from the four
countries, China, Japan, Russia, and North Korea, and Figure 12 depicts the effects on South
Korea’s exports to the same four countries.
As Figure 11 shows, South Korea’s political relations do have certain impacts on its
imports. However, the effects are short-lived, not constantly extending to the following
month,44 and it reveals irregular patterns showing the different magnitude and duration of the
impacts depending on countries. The political relations score (PRS) only takes effects in
South Korea’s imports with China and North Korea, and one standard deviation change in
PRS leads to around 3.8 percent increase in South Korea’s imports from China and North
Korea in a month when the PRS has an impact. On the other hand, negative political events
do not affect South Korea’s imports from China, Japan, and Russia, but only shows effects
on South Korea’s imports from North Korea. One standard deviation change in the negative
44 As noted above, the effects are short-lived, but the impacts appear again after a few months later
depending on countries. Refer to figure 11 to make better understanding.
55
political events between South Korea and North Korea, on average, brings about 9.4 percent
decrease in South Korea’s imports in the month when it takes effects.
More specifically, the effects of the PRS on South Korea’s imports peaks in month 1
for China. The effects dissipate in the following month, but these appear in month 10. The
PRS impacts on South Korea’s imports from North Korea appear in month 3, but ends right
after the month. As noted earlier, Japan and Russia do not show the statistical significance in
the PRS. Negative political events only take effects on South Korea’s imports from North
Korea and the effects appear more frequent and irregular results than those in the PRS case.
As the bottom graph of Figure 11 shows, the effects repeat resuming and disappearing from
month 1 to 6 by every another month, and it peaks again in month 8 and dissipates from
month 9.
As the Figure 12 indicates, South Korea’s political relations also have certain effects
on its exports as well. As the impacts on South Korea’s imports, the influences on South
Korea’s exports are mostly short-lived, not beyond 2 months, expect for the case with North
Korea in the impacts of negative political events. Also, it reveals irregular patterns, showing
the different magnitude and duration of the impacts depending on countries. The PRS takes
effects in South Korea’s imports with Japan, Russia, and North Korea, and one standard
deviation change in the PRS, on average, causes around 5 percent change in South Korea’s
exports to the three countries. Negative political events have effects on the cases with Russia
and North Korea, and one standard deviation change in the negative political events leads to
18.2 percent decrease in South Korea’s exports to the two countries.
In looking at the results specifically by countries, the impacts of the PRS on South
Korea’s exports peaks in month 5 for Japan. The effects last to month 6 and disappear in

56
month 7. The PRS impacts lead to 2.5 percent increase in South Korea’s exports to Japan in
the months. In case of Russia, the effects begin later than those of Japan. The effects peak in
month 10 and last until month 11. In addition, interestingly, the direction of effects is
opposite from that of the other countries. It reveals a negative relationship, causing around
6.2 percent decrease on average in South Korea’s exports to Russia in the months. The PRS
effects on exports to North Korea peak in month 1 and dissipate in month 2. It brings about
7.9 percent increase in South Korea’s exports to North Korea in month 1. Negative political
events have impacts on South Korea’s exports to Russia and North Korea. The impacts of
negative political events on export to Russia start in month 2 and last month 3, leading to
around 7.8 percent decrease in South Korea’s exports to Russia. North Korea shows the
strongest impacts of the negative political events on South Korea’s exports to the country.
The effects appear in month 1. The impacts continue to be significant until month 6 and
cause 21.7 percent decrease in South Korea’s exports to North Korea on average in the
months. To sum up, the results of the VAR model do not support the hypothesis that South
Korea’s political relations affect its trade with China, but the results support the other
hypotheses related to South Korea’s political and trade relations with Japan, Russia, and
North Korea. These results tell us South Korea’s political relations have certain impact on its
bilateral trade, but the effects appear in different magnitudes and aspects by trading partners.

57
Figure 11. Impulse Response Function (IRF) of South Korea’s political relations on its
imports from China, Japan, Russia, and North Korea Note: For visual clarity, the display shows only statistically significant results over the 90% level.

58
Figure 12. Impulse Response Function (IRF) of South Korea’s political relations on its
exports to China, Japan, Russia, and North Korea Note: For visual clarity, the display shows only statistically significant results over the 90% level.
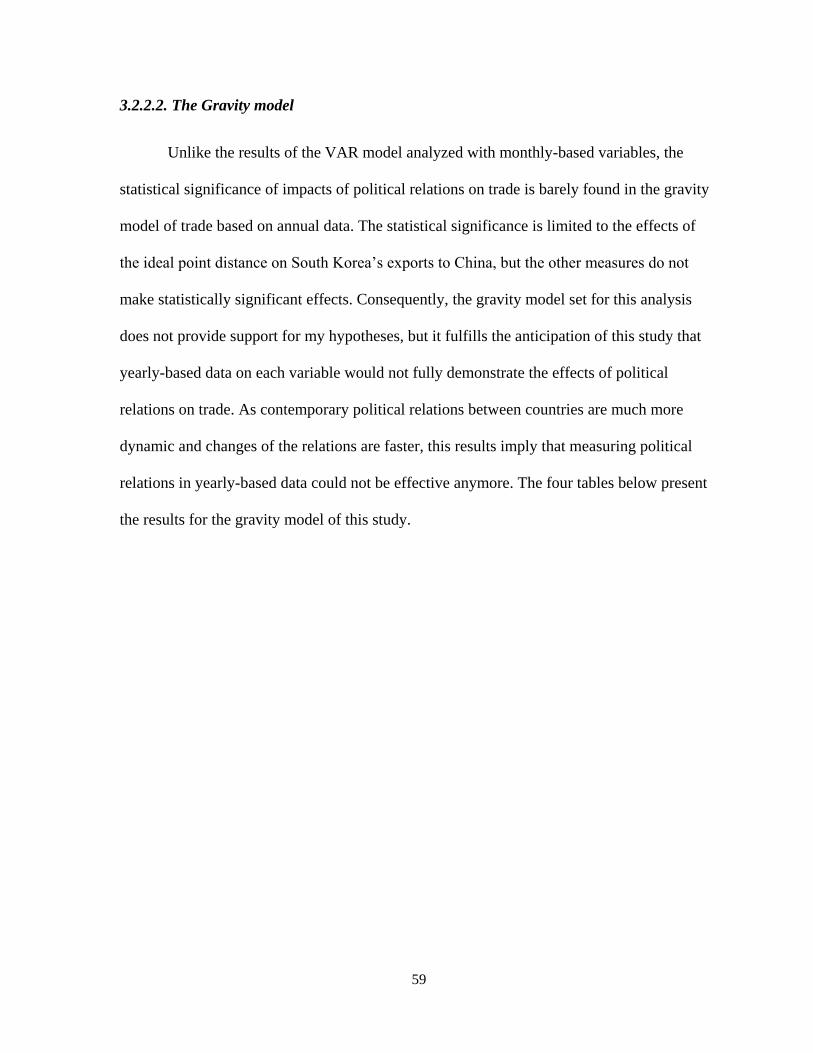
59
3.2.2.2. The Gravity model
Unlike the results of the VAR model analyzed with monthly-based variables, the
statistical significance of impacts of political relations on trade is barely found in the gravity
model of trade based on annual data. The statistical significance is limited to the effects of
the ideal point distance on South Korea’s exports to China, but the other measures do not
make statistically significant effects. Consequently, the gravity model set for this analysis
does not provide support for my hypotheses, but it fulfills the anticipation of this study that
yearly-based data on each variable would not fully demonstrate the effects of political
relations on trade. As contemporary political relations between countries are much more
dynamic and changes of the relations are faster, this results imply that measuring political
relations in yearly-based data could not be effective anymore. The four tables below present
the results for the gravity model of this study.
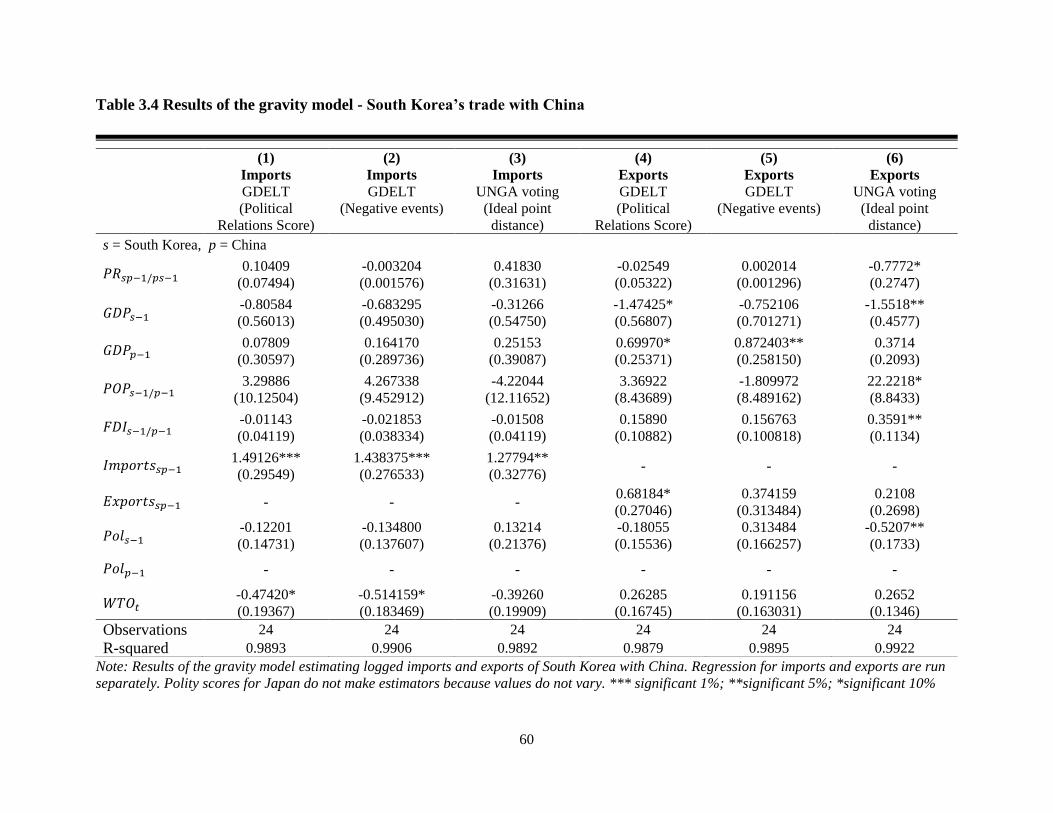
60
Table 3.4 Results of the gravity model - South Korea’s trade with China
Note: Results of the gravity model estimating logged imports and exports of South Korea with China. Regression for imports and exports are run
separately. Polity scores for Japan do not make estimators because values do not vary. *** significant 1%; **significant 5%; *significant 10%
(1)
Imports
GDELT
(Political
Relations Score)
(2)
Imports
GDELT
(Negative events)
(3)
Imports
UNGA voting
(Ideal point
distance)
(4)
Exports
GDELT
(Political
Relations Score)
(5)
Exports
GDELT
(Negative events)
(6)
Exports
UNGA voting
(Ideal point
distance)
s = South Korea, p = China
𝑃𝑅𝑠𝑝−1/𝑝𝑠−1 0.10409
(0.07494)
-0.003204
(0.001576)
0.41830
(0.31631)
-0.02549
(0.05322)
0.002014
(0.001296)
-0.7772*
(0.2747)
𝐺𝐷𝑃𝑠−1 -0.80584
(0.56013)
-0.683295
(0.495030)
-0.31266
(0.54750)
-1.47425*
(0.56807)
-0.752106
(0.701271)
-1.5518**
(0.4577)
𝐺𝐷𝑃𝑝−1 0.07809
(0.30597)
0.164170
(0.289736)
0.25153
(0.39087)
0.69970*
(0.25371)
0.872403**
(0.258150)
0.3714
(0.2093)
𝑃𝑂𝑃𝑠−1/𝑝−1 3.29886
(10.12504)
4.267338
(9.452912)
-4.22044
(12.11652)
3.36922
(8.43689)
-1.809972
(8.489162)
22.2218*
(8.8433)
𝐹𝐷𝐼𝑠−1/𝑝−1 -0.01143
(0.04119)
-0.021853
(0.038334)
-0.01508
(0.04119)
0.15890
(0.10882)
0.156763
(0.100818)
0.3591**
(0.1134)
𝐼𝑚𝑝𝑜𝑟𝑡𝑠𝑠𝑝−1 1.49126***
(0.29549)
1.438375***
(0.276533)
1.27794**
(0.32776) - - -
𝐸𝑥𝑝𝑜𝑟𝑡𝑠𝑠𝑝−1 - - - 0.68184*
(0.27046)
0.374159
(0.313484)
0.2108
(0.2698)
𝑃𝑜𝑙𝑠−1 -0.12201
(0.14731)
-0.134800
(0.137607)
0.13214
(0.21376)
-0.18055
(0.15536)
0.313484
(0.166257)
-0.5207**
(0.1733)
𝑃𝑜𝑙𝑝−1 - - - - - -
𝑊𝑇𝑂𝑡 -0.47420*
(0.19367)
-0.514159*
(0.183469)
-0.39260
(0.19909)
0.26285
(0.16745)
0.191156
(0.163031)
0.2652
(0.1346)
Observations 24 24 24 24 24 24
R-squared 0.9893 0.9906 0.9892 0.9879 0.9895 0.9922

61
Table 3.5 Results of the gravity model - South Korea’s trade with Japan
Note: Results of the gravity model estimating logged imports and exports of South Korea with Japan. Regression for imports and exports are run
separately. Polity scores for Japan do not make estimators because values do not vary.*** significant 1%; **significant 5%; *significant 10%
(1)
Imports
GDELT
(Political
Relations Score)
(2)
Imports
GDELT
(Negative events)
(3)
Imports
UNGA voting
(Ideal point
distance)
(4)
Exports
GDELT
(Political
Relations Score)
(5)
Exports
GDELT
(Negative events)
(6)
Exports
UNGA voting
(Ideal point
distance)
s = South Korea p = Japan
𝑃𝑅𝑠𝑝−1/𝑝𝑠−1 -0.05861
(0.06452)
0.00044
(0.00137)
-0.89153
(0.64823)
-0.10497
(0.0510)
0.00284
(0.00154)
-0.9412
(0.53323)
𝐺𝐷𝑃𝑠−1 -0.64207
(0.84528)
-0.3223
(0.7889)
0.31569
(0.79143)
0.52191
(0.33411)
0.35655
(0.37247)
0.81073
(0.34934)
𝐺𝐷𝑃𝑝−1 -0.5780
(0.79353)
-0.2940
(0.7377)
-0.0836
(0.69706)
-0.05691
(0.52510)
-0.47931
(0.56231)
-0.15004
(0.53963)
𝑃𝑂𝑃𝑠−1/𝑝−1 13.22587
(7.16492)
9.668
(6.864)
6.34447
(6.82131)
-16.0296
(14.4912)
-7.88686
(16.8005)
-30.5985
(14.7873)
𝐹𝐷𝐼𝑠−1/𝑝−1 -0.05282
(0.10912)
-0.00701
(0.1101)
-0.05234
(0.10407)
0.04254
(0.05644)
0.06204
(0.058042)
0.00963
(0.06239)
𝐼𝑚𝑝𝑜𝑟𝑡𝑠𝑠𝑝−1 0.79952
(0.55184)
0.6722
(0.5993)
0.15545
(0.56013) - - -
𝐸𝑥𝑝𝑜𝑟𝑡𝑠𝑠𝑝−1 - - - 0.22613
(0.42723)
0.29833
(0.43854)
0.12764
(0.44509)
𝑃𝑜𝑙𝑠−1 -0.25543
(0.19940)
-0.1663
(0.1779)
-0.20036
(0.1694)
0.13156
(0.10793)
0.01872
(0.12275)
0.06177
(0.11576)
𝑃𝑜𝑙𝑝−1 - - - - - -
𝑊𝑇𝑂𝑡 0.06958
(0.17631)
0.05645
(0.1915)
0.06412
(0.16723)
0.08664
(0.17709)
0.12652
(0.17519)
0.28133
(0.16387)
Observations 24 24 24 24 24 24
R-squared 0.9001 0.895 0.9068 0.9107 0.9065 0.9048

62
Table 3.6 Results of the gravity model - South Korea’s trade with Russia
Note: Results of the gravity model estimating logged imports and exports of South Korea with Russia. Regression for imports and exports are run
separately. *** significant 1%; **significant 5%; *significant 10%
(1)
Imports
GDELT
(Political
Relations Score)
(2)
Imports
GDELT
(Negative events)
(3)
Imports
UNGA voting
(Ideal point
distance)
(4)
Exports
GDELT
(Political
Relations Score)
(5)
Exports
GDELT
(Negative events)
(6)
Exports
UNGA voting
(Ideal point
distance)
s = South Korea, p = Russia
𝑃𝑅𝑠𝑝−1/𝑝𝑠−1 -0.19795
(0.15598)
0.03215
(0.02893)
-1.65216
(1.51614)
-0.1041
(0.1101)
-0.0047
(0.0073)
-1.28702
(0.73442)
𝐺𝐷𝑃𝑠−1 1.52498
(1.80749)
1.6764
(1.8488)
0.79495
(1.90916)
1.4536
(1.2624)
1.540
(1.283)
1.40262
(1.16702)
𝐺𝐷𝑃𝑝−1 -0.57487
(0.60134)
-0.5955
(0.6113)
-0.87772
(0.58572)
-1.0823
(0.6534)
-1.015
(0.6670)
-0.6614
(0.64238)
𝑃𝑂𝑃𝑠−1/𝑝−1 43.7615*
(19.2915)
35.0897
(18.6103)
21.6979
(22.8458)
2.6795
(44.1158)
4.622
(45.10)
25.0406
(42.7896)
𝐹𝐷𝐼𝑠−1/𝑝−1 -0.06996
(0.16085)
-0.0299
(0.15434)
0.1012
(0.17218)
0.2590
(0.1233)
0.2674
(0.1275)
0.2514
(0.11395)
𝐼𝑚𝑝𝑜𝑟𝑡𝑠𝑠𝑝−1 -0.5505
(1.0274)
-0.31655
(0.99006)
0.31145
(1.01046) - - -
𝐸𝑥𝑝𝑜𝑟𝑡𝑠𝑠𝑝−1 - - - 0.8785
(0.5116)
0.8223
(0.5203)
0.6625
(0.48206)
𝑃𝑜𝑙𝑠−1 -0.47105
(0.46191)
-0.37767
(0.46906)
-0.58229
(0.48937)
0.4632
(0.3330)
0.5559
(0.3485)
0.33596
(0.31991)
𝑃𝑜𝑙𝑝−1 -0.1149
(0.15704)
-0.08948
(0.16181)
-0.16093
(0.16341)
-0.2921
(0.1034)
-0.3534**
(0.0979)
-0.36561
(0.08707)
𝑊𝑇𝑂𝑡 -0.58188
(0.49923)
-0.42534
(0.49962)
0.07166
(0.70337)
0.2035
(0.4982)
0.2734
(0.5172)
0.26601
(0.46184)
Observations 24 24 24 24 24 24
R-squared 0.8809 0.8776 0.8771 0.9566 0.9549 0.9629

63
Table 3.7 Results of the gravity model - South Korea’s trade with North Korea
Note: Results of the gravity model estimating logged imports and exports of South Korea with North Korea. There are not available data on FDI
between South and North Korea. North Korea has not joined WTO, thus the variable has a singularity problem. Regression for imports and
exports are run separately. *** significant 1%; **significant 5%; *significant
(1)
Imports
GDELT
(Political
Relations Score)
(2)
Imports
GDELT
(Negative events)
(3)
Imports
UNGA voting
(Ideal point
distance)
(4)
Exports
GDELT
(Political
Relations Score)
(5)
Exports
GDELT
(Negative events)
(6)
Exports
UNGA voting
(Ideal point
distance)
s = South Korea, p = North Korea
𝑃𝑅𝑠𝑝−1/𝑝𝑠−1 0.03099
(0.07615)
0.0001
(0.0002)
-0.1516
(0.6684)
-0.02969
(0.0565)
0.0005
(0.0013)
0.4651
(0.5350)
𝐺𝐷𝑃𝑠−1 -0.92587
(0.69029)
-0.7646
(0.7247)
-0.7727
(0.8017)
-0.40909
(0.90091)
-0.1742
(1.106)
-0.7446
(0.9674)
𝐺𝐷𝑃𝑝−1 2.37194
(1.39707)
2.176
(1.373)
2.0896
(1.53)
-4.07784*
(1.57781)
-4.240*
(1.653)
-3.9314*
(1.5612)
𝑃𝑂𝑃𝑠−1/𝑝−1 -0.01777
(14.1664)
-1.120
(14.14)
-1.7889
(15.027)
59.0819**
(17.927)
58.67**
(18.34)
64.8751**
(18.3518)
𝐹𝐷𝐼𝑠−1/𝑝−1 - - - - - -
𝐼𝑚𝑝𝑜𝑟𝑡𝑠𝑠𝑝−1 0.43354
(0.27078)
0.4162
(0.2798)
0.4965
(0.3447) - - -
𝐸𝑥𝑝𝑜𝑟𝑡𝑠𝑠𝑝−1 - - - 0.25346
(0.29258)
0.204
(0.2911)
0.1369
(0.2979)
𝑃𝑜𝑙𝑠−1 -0.3716
(0.2132)
-0.3167
(0.1939)
-0.2748
(0.3169)
-0.05097
(0.29457)
0.0194
(0.3653)
-0.1638
(0.3132)
𝑃𝑜𝑙𝑝−1 -0.4707
(0.42457)
-0.4590
(0.4269)
-0.4422
(0.4545)
1.04062*
(0.45814)
1.016
(0.4563)
0.8070
(0.5022)
𝑊𝑇𝑂𝑡 - - - - - -
Observations 24 24 24 24 24 24
R-squared 0.9087 0.9087 0.908 0.9761 0.9759 0.9768

64
CHAPTER 4
DISCUSSION: EXPLAINING VARIATIONS IN SOUTH KOREA’S
POLITICAL AND TRADE RELATIONSHIP
4.1. Overall interpretation
As the empirical results show in the previous chapter, South Korea’s political
relations with China, Japan, Russia, and North Korea do affect South Korea’s trade with
these countries. However, the results are mixed, and it is difficult to make absolute
statements about how political relations affect trade. The significance of political impacts on
trade depends on the trading partner, and there are also differing results for imports and
exports. In addition, the results reveal that the magnitude and duration of the impacts are also
differentiated by trading partner. Consequently, South Korea’s political relations with the
four countries are reflected in South Korea’s trade relations partially or entirely by trading
partners, which means there could be other factors to affect South Korea’s trade with the
countries. Other potential factors include the importance of the foreign market in South
Korea’s exports and imports or specific features of South Korean industry. These variables
could be important potential covariates along with political relations.
Plus, while this study can argue that South Korea’s trade is affected by its political
relations, the findings do not directly address whether the South Korean government or the
four countries’ governments control or intervene in trade directly. There could be a
possibility that each government tends to impose certain pressure on trade or enterprises
reflect the political relations in their business activities regardless of the influence of the
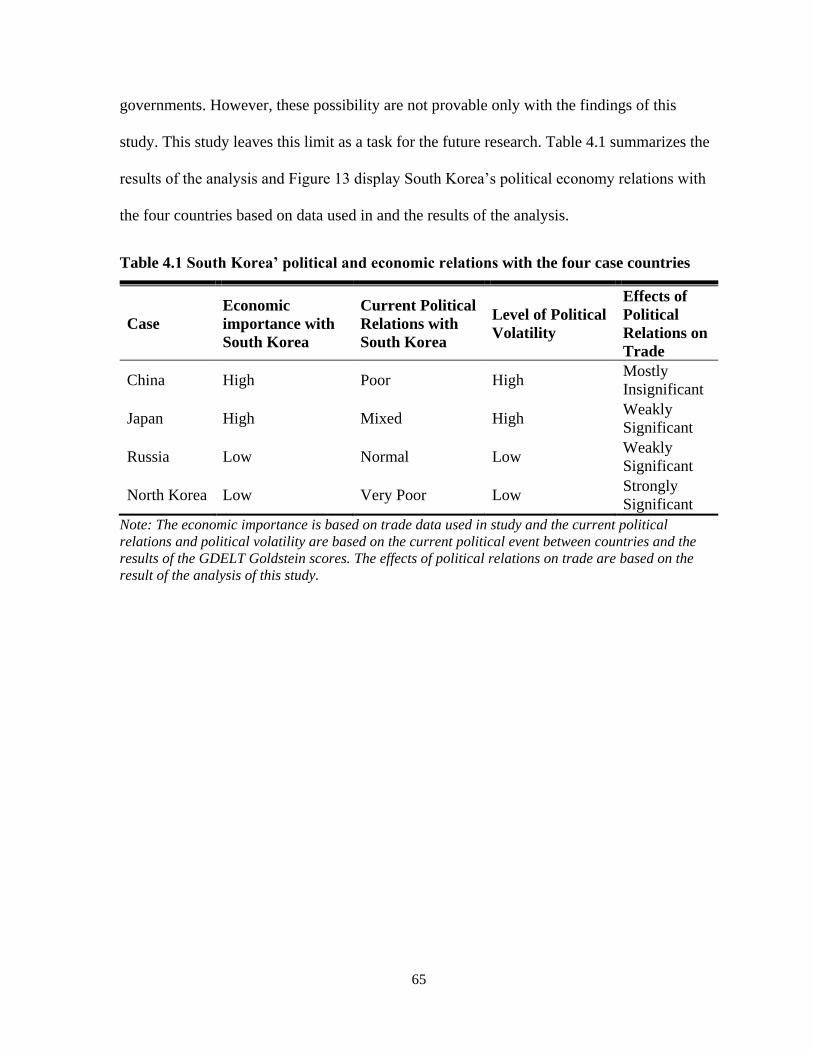
65
governments. However, these possibility are not provable only with the findings of this
study. This study leaves this limit as a task for the future research. Table 4.1 summarizes the
results of the analysis and Figure 13 display South Korea’s political economy relations with
the four countries based on data used in and the results of the analysis.
Table 4.1 South Korea’ political and economic relations with the four case countries
Case
Economic
importance with
South Korea
Current Political
Relations with
South Korea
Level of Political
Volatility
Effects of
Political
Relations on
Trade
China High Poor High Mostly
Insignificant
Japan High Mixed High Weakly
Significant
Russia Low Normal Low Weakly
Significant
North Korea Low Very Poor Low Strongly
Significant
Note: The economic importance is based on trade data used in study and the current political
relations and political volatility are based on the current political event between countries and the
results of the GDELT Goldstein scores. The effects of political relations on trade are based on the
result of the analysis of this study.
66
Figure 13. South Korea’s Political Economy Relations Map
Note: The economic importance is based on trade data used in study and the current political
relations and political volatility are based on the current political event between countries and the
results of the GDELT Goldstein scores.
4.2 Interpretation by each case
4.2.1. South Korea – China
The empirical results show that South Korea’s imports from China are affected by
political relations, but the effects are only restricted in the estimation with the PRS. On the
other hand, South Korea’s political relations with China do not have certain impacts on South
Korea’s exports to China. Even if the estimation measured with the ideal point distance
makes a statistically significant result in South Korea’s exports to China, this study doubts
whether the ideal point gap could reflect direct relations between South Korea and China

67
because it is based on UNGA voting. This means that the voting results would not
necessarily mirror the specific actions of a country toward another country.45 Therefore, this
study provides two interpretations on the results of the South Korea – China case: (1) China
is an important market both in South Korea’s trade, so is South Korea in China’s trade. Thus,
political relations between South Korea and China would have restricted impacts on trade
between them; (2) It seems evident that the Chinese government uses economic relations
with South Korea as a tool of foreign policy toward South Korea, but the Chinese
government as well as the South Korean government have not directly touched trade
relations between each other.
Considering the importance of China in South Korea’s trade, it would be said that
South Korea’s economic benefits from trade with China dominate the impact of political
relationship between the two countries. As noted in Chapter 1, China is South Korea’s
biggest trading partner for both exports and imports. 77% of South Korea’s GDP is
comprised of trade and 26% of South Korea’s exports go to China. This indicates that around
20% of South Korea’s GDP relies on Chinese market,46 which means both South Korea’s
overall economy and South Korean enterprises could be damaged if exports with China
deteriorated. As the Chinese market is important to South Korea’s trade, South Korea is an
important trade partner to China as well. South Korea is fourth largest exports destination of
China following the U.S., Hong Kong, and Japan. South Korea is also a crucial market for
Chinese imports. Regarding that 77% of China’s imports from South Korea are intermediate
45 As noted earlier chapters, the fact that the ideal point distance is annual data could be pointed as a
drawback in measuring political relations with the data. 46 Data is based on the World Bank and the Observatory of Economic Complexity (OEC). The World
Bank data is available at https://data.worldbank.org/; OEC data is available at
https://atlas.media.mit.edu/en/

68
materials (Korea Trade-Investment Promotion Agency, 2017), South Korea is an important
supplying market to the Chinese industry. Consequently, unless South Korea and China
threat the national security against each other or lose the market value, both countries have
very strong economic incentives to sustain trade relations. The level of political conflict has
arguably not risen to the threshold needed to overcome these economic incentives.
The most recent political issue, THAAD deployment in South Korea, have resulted in
economic retaliation from China against South Korean service industries and companies in
China. It seems evident that the economic retaliation caused by a political issue led to
economic losses in South Korea. In particular, South Korean tourism industry and companies
in China were mainly targeted by the economic retaliation,47 and total trade between two
countries was also decreasing during the time. However, while there existed explicit
restrictions on the South Korean tourism industry and boycott against South Korean
companies led by the Chinese government, there were no direct regulations from the Chinese
government on trade with South Korea for the time. In short, this case shows that the Chinese
government could exploit economic tools as carrot and stick for political purpose, but the
actions could not easily lead to a direct regulation on trade with South Korea. As a result, the
political relationship between South Korea and China could affect economic activities of
South Korea as well as China, but in the situation that the economic ties through trade are as
47 For example, the Korean airline was refused increasing the number of flights to China by Chinese
authorities, and the Chinese government ordered Chinese travel agency to stop touring to South
Korea. The South Korean Lotte company suffered from cyber-attacks since the land approval for the
THAAD system, and some of its stores in China were fined or closed by Chinese authorities. Specific
stories are available at http://www.reuters.com/article/us-southkorea-china-lotte-idUSKBN16G1FR
and http://www.reuters.com/article/us-southkorea-china-lotte-idUSKBN16G1FR
69
important as the political relationship between the two countries, the impacts of political
relations on trade could be offset by economic preferences.
4.2.2. South Korea – Japan
While South Korea political relations have restricted impacts on South Korea’s
imports, the empirical results show that South Korea’s political relations with Japan have
restricted impacts only on export of South Korea. As the results on South Korean imports
from China, this case also shows short-term effects of political relations on trade and does
not have statistically significant impacts estimated by negative political events. Based on the
results, this study provides two interpretations on the impacts of political relations between
South Korea and Japan on South Korea’s trade: (1) South Korea’s Imports from Japan take
significant role in South Korea’s industry comparing to the influence of South Korea’s
exports on Japanese industry; (2) South Korea’s political relationship with Japan has not
been altered as much as it affects South Korea’s trade with Japan.
Unlike trade with China, South Korea has been recording a deficit in trade with
Japan. It could be seen as an aspect that the Japanese market would be not as beneficial as the
Chinese market is, or Japanese companies and citizens less purchase Korean products than
Koreans companies and citizens prefer Japanese products. However, in another perspective,
Japanese imports could have an important role that influence South Korea’s economy. In
fact, based on research from the Korea Small Business Institute (2010), South Korean
industry has had a strong dependency on intermediate materials imported from Japan. While
the intermediate material supply from the South Korean domestic market has been declining,
it has continued to increase importing intermediate materials from the Japanese market,

70
especially in electronics, machines, and chemical products. In contrast, the Japanese industry
has reduced its dependency on the intermediate materials imported from South Korea. This
means that the production of Japanese industry has caused the production of South Korean
industry more than South Korean industry does. Consequently, considering that South
Korean industry comprises 39% of the GDP of South Korea and Japan is the largest and the
second biggest origins of South Korea’s imports in chemical products and machines each,
South Korea’s imports from Japan could offset the impacts of political relations due to the
economic preference.
In general, South Korea and Japan have shown a sensitive political relations with
several political and historical-related issues such as the Dokdo/Takeshima ownership
dispute, Japanese history textbook issue, and South Korean comfort women issue. It seems
obvious that these issues bring about altering the two countries’ political relations, but based
on the findings, the magnitude of the change is modest. Even if negative political events have
driven the flows of political relations in a negative direction, political scores between the two
states have been over 1.5 score on average, which indicates positive relations, and it has not
made abrupt and dominating changes as much as it affects trade between the two countries
significantly. As a result, the mild changes in South Korea – Japan political relationship, with
the influence of industry’s dependency, lead to partial impacts on South Korea’s exports, but
it could not be said that the political relations between the two countries have dominating
impacts on their trade relations.

71
4.2.3. South Korea – Russia
Similarly to the results of South Korea – Japan case, the empirical results show that
South Korea’s political relations with Russia have restricted impacts only on export of South
Korea as well as have short-term effects. However, the South Korea – Russia case reveals
that negative political events between South Korea and Russia have certain impacts on South
Korea’s exports to Russia. In addition, the PRS between the two states, interestingly, is
negatively associated with South Koreas exports to Russia. Based on the results, this study
finds two features in trade relations between the two countries, which could attribute to these
results: (1) South Korea’s Imports from Russia have been biased toward natural resources
imports; (2) The Russian government has imposed restrictions on imports from other
countries.
In general, the economic relationship between South Korea and Russia has improved
in positive way (Lee et al., 2015). Since 1990, the year when South Korea and Russia formed
diplomatic relations, trade between two countries has increased more than 130 times.
However, it is apparent that there are several challenges in trade between the two countries,
such as two countries’ strong dependency on certain products in exports and imports,
complicated customs procedure in Russia, and high trade tariffs of Russia. Such challenges
has become obstacles that prevent the economic relationship from being progressed, and
these challenges could be related to the results of the impacts of South Korea – Russia
political relations on trade between them.
South Korea’s imports from Russia have steadily increased without certain rapid
changes. As the trade relationship between the two countries was built in 1990s, the increase

72
in South Korea’s imports from Russia would be considered as natural effects. However, the
constant increase in South Korea’s imports from Russia is based on a fact: South Korea has a
severe scarcity in natural resources. Based on the report from Koreas Institute for
International Economic Policy (Lee et al., 2015), mineral and energy products, such as crude
petroleum and petroleum gas, comprise 82% of the South Korea’s imports from Russia.
Considering the importance of natural resource to South Korea and South Korea’s policy to
find various routes to import natural resources, Russia is one of valuable natural resource
provider to South Korea. Consequently, the scarcity on and need for natural resources could
have made South Korea’s constant imports from Russia regardless of the impacts of political
relations.
In contrast, South Korea’s exports to Russia are unstable comparing to South Korea’s
imports to Russia, and political relations between the two countries affect South Korea’s
exports to Russia. This could be closely associated with the trade policy of Russia.
Comparing to the customs procedure in South Korea, the process in Russia is more
complicated, and the time to import in Russia from other countries is 2.8 times longer than
that of South Korea (Lee et al., 2015). Above all things, the Russian government’s
restrictions on their imports, such as imposing tariffs and safeguards, are higher and occur
more frequently than the South Korean government does. For example, the Russian
government, on July 2014, imposed a ban on importing certain type of machine products
manufactured abroad, and South Korean products were included in the ban (Lee et al.,
2015).48 As a result, based on the fact that the Russian government frequently intervenes and
48 Lee et al. say that the Russian government’s regulation is one of the reasons that South Korea has
recorded trade deficits constantly in trade with Russia

73
changes trade policy, South Korea’s exports to Russia, highly possibly, could be affected by
its political relations with Russia.
4.2.4. South Korea – North Korea
Unlike the other three cases, the empirical results show that South Korea’s political
relations with North Korea clearly affect both South Korea’s exports and imports with North
Korea. While the PRS shows short-term effects, negative political events reveal long and
strong effects on trade. In addition, in the sense that the impacts of political relation on trade
occur at least in two months, the results indicate that trade between two Koreas react to
political relations sensitively. Based on the results, this study provides two interpretations on
South – North Korea trade aspects according to political relations between the two Koreas:
(1) South and North Korea political relations dominate trade relations between the two
Koreas; (2) South and North Korea use the trade bridge not for economic preferences, but for
political leverage strategically.
While other cases in this study have partial impacts of political relations trade, South
and North Korea case shows a dominant effects of political relations on trade. In reality, it is
apparent that trade between South and North Korea has followed political flags. Aggravated
or relived political relations between the two Koreas have led to certain changes in South –
North Korea trade negatively or positively. As stated in the previous chapter, depending on
political flags of the South Korean administration, whether progressive or conservative,
political atmosphere between the two Koreas was altered and it was mirrored in trade aspects
between the two Koreas. Moreover, whenever North Korea conducted military provocations,
such as ballistic missile tests and nuclear bomb tests, economic regulations were considered

74
as punitive actions against North Korea. As a result, South – North Korea case demonstrates
that political conditions are antecedent to forming trade relations.
In case of South Korea, trade with North Korea could not bring a lot of economic
benefits. North Korea does not take any important role in South Korea’s economy and could
not damage South Korea’s economy even if trade with North Korea is cut off. The same is
true for North Korea. Considering North Korea’s largest economic partner is China, from
which 83% of North Korea’s exports and 85% of North Korea’s imports happen, South
Korea’s economic influence through trade on North Korea’s economy is not significant. This
means that two Koreas choose and use the trade option not for economic preferences, but for
political purpose strategically. Even if economic cooperation with North Korea would not
guarantee peace in the Korean peninsula, the South Korean government would attempt to use
and keep the trade relationship with North Korea as a link to talk. North Korea also would
use the trade relationship to have better political leverage in the relationship, constantly
repeating stop and resuming trade with South Korea. Consequently, South and North Korea
exploit the trade relationship strategically as a tool for political purpose, not for economic
purpose.

75
CHAPTER 5
CONCLUSION
5.1. Overview of the thesis
The first chapter of this thesis looks at challenges that South Korea faces in the
current political situation and trade, and provides general information on political and
bilateral trade relations of South Korea with its major trading partners and also North Korea.
In general, South Korea’s trade relations with the major trading partners, the U.S., Japan, and
China, were developed as political relations with the countries improved. South Korea’s trade
with North Korea. The current situations on the Korean peninsula reflect this fact, China’s
economic retaliation against South Korea when it deployed the THAAD system to prevent
North Korea’s missile attacks, reveals that South Korea’s economic relations with other
countries are still closely related to political relations.
Following the real case of South Korea introduced in the first chapter, the second
chapter looks through previous academic literature relevant to this topic: (1) the argument
that trade affects political relations; (2) the argument that political relations affect trade.
Looking through the argument of each school, this thesis also finds how previous research
measures political relations. This is one of the core variables in this empirical research.
Considerable research has used negative events, such as military and diplomatic disputes
between countries, in measuring political relations, but the UNGA voting data and events
data based on news articles are also commonly used to measure political relations. However,
the fact that most of research has used yearly-based data on political relations could make
76
shortcomings not to mirror frequent changes in political relations between countries within a
year. Therefore, this study measures political relations both yearly and monthly by using the
GDELT events data (Leetaru and Schrodt, 2013) and the UNGA voting data (Bailey,
Strezhnev, and Voeten, 2017).
Considering South Korea’s features in political and trade relations and based on
academic grounds from previous research, this study examines the impacts of South Korea’s
political relations on South Korea’s bilateral trade with these countries. This study considers
how significantly a country affects South Korea both politically and economically as well as
how the political and economic relations between South Korea and the country has altered,
thus, selects four cases: South Korea – China, Japan, Russia, and North Korea. As an
empirical analysis, this study builds on both the VAR model and the gravity model to test the
hypothesis by each case. The findings show that South Korea’s political relations with China,
Japan, Russia, and North Korea do affect South Korea’s trade with these countries, however,
the results are mixed, and the impacts of South Korea’s political relations on its bilateral
trade with the four countries have different magnitude and duration by each of the trading
partners. South Korea’s political relations with the four countries are partially or entirely
reflected in South Korea’s trade relations by trading partners and it means there could be
other factors to affect South Korea’s trade with the countries, such as the importance of the
foreign market in South Korea’s exports and imports or specific features of South Korean
industry.
From the findings, the fourth chapter finds the reasons that different results appear
depending on the country. This study addresses that each of the countries in this case have
different importance in South Korea’s trade. According to the market potential and role of
77
exported and imported goods in the industry of each country, South Korea has different trade
relations with the four countries. This study finds that the fact that South Korea has different
political relations by country, functions one of the reasons for the different results by
countries. As a result, the findings imply that political relations between two countries have
certain impacts on the bilateral trade and the impacts could occur in different aspects by a
country’s political and economic relations with another country.
5.2. Contribution to existing research and South Korea’s Foreign and Trade Policy
Whether trade is prior to politics or politics is prior to trade has been of considerable
interest amongst scholars and this discussion is still underway. In that sense, this thesis
contributes to supporting the argument that politics has impacts on trade. Not only derived
from the empirical results of this study the argument, but also the fact that South Korea
formed or normalized diplomatic relations before establishing trade relationship shows that
political relations are to trade.49 Even if this research is estimating the impacts of political
relations on trade with restricted cases, it is evident that the cases in this research support the
argument with empirical evidences.
Another contribution of this thesis is that the empirical findings show different
impacts of political relations on trade dependent on the country. As mentioned earlier, the
former research found general impacts of political relations on trade by using the large
number of sample countries. In particular, the results of formal studies, in many cases, do not
demonstrate how a country’s political relations affect trade with a certain specific country
49 South Korea normalized diplomatic relations with Japan and China in 1965 and 1992 each. After
the diplomatic normalization, South Korea’s trade and overall economic cooperation accelerated.
South Korea’s beginning trade with Russia was also a following result of normalizing diplomatic
relations between South Korea and Russia in 1990.

78
although there exist an extensive possibility that a county has different political and trade
relations with each of different countries, thus effects of political relations on trade could
appear different on a case by case basis. Consequently, this study shows that analyzing the
effects of political relations on trade case by case could be more precise than seeing the
general effects This could help to suggest a particular direction in establishing foreign and
trade policy with a country.
To take the micro-approach that analyzes the impacts of political relations on trade
between specific countries, measuring detailed political relations between the two countries
should be possible. However, most of previous research does not suggest a meticulous
method to measure political relations, but provides a simple dimension not to reflect how
political relations between two countries change as time passes by. In that sense, this study
implies that estimating detailed political relations and trade flows between countries will be
available more and more as the use of machine learning technology and big data analysis
becomes more developed and commonplace. For example, the GDELT data used in this
study is one of big data source based on the machine learning system. As a machine operates
by translating each language of news articles from all around the world in English and
analyzes the source, locations, sorts of events, and other information of the articles
automatically; it enables to get what political events occur between certain actors, such as
countries, businesses or NGOs. Therefore, this study expects that the more big data
technology is developed and becomes common in political science, the more detailed
analysis on political relations between specific countries will be possible, and it will lead to
progress in this topic to make more accurate data and analysis enabled.

79
Lastly, this thesis contributes to South Korea’s foreign policy toward the four
countries mentioned above. Forming and sustaining political relations with these four
countries becomes a fundamental condition so that South Korea keeps and develops trade
relations with the partners. This is especially important when regarding that the empirical
results firmly show the prior impacts of political relations on trade with North Korea,
focusing on and preparing for a political approach in solving the issue with North Korea is
needed to be prior to an economic approach. Trade with North Korea could be a catalyst to
improve political relations, but it should not be a major policy lead to achieving peace on the
Korean peninsula unless the political relations between the two Koreas is resolved or North
Korea’s economy relies upon South Korea’s economy enormously.
5.3. Questions unresolved
Despite the contribution of this thesis to addressing the effects of political relation on
trade, this research cannot find a specific threshold from which political relations begin
influencing trade flows between countries. However, finding an explicit line empirically
would be impossible with data and models in this study. It is apparent that that work requires
more specified and a longer span of data on political relations, trade, as well as other relevant
factors. In addition, the effective level found empirically in future research will provide more
substantial policy advice with precise effects and anticipated results of political relations on
trade.
As noted earlier, whether governments control trade according to political relations or
business sectors reflect political relations in their trade activities is not measurable through
the findings. This remains another task in future research. In other words, there would need

80
another test to see whether negative or positive political relations between countries cause
either regulating or supporting trade toward each other. As stated in an example, the Russian
government frequently controlled trade with other countries by imposing tariffs and
safeguards, but it is unclear, through this study, that these regulations from the government
are led by political collisions with other countries. Consequently, this thesis can address the
effects of political relations on trade, but more evidences and empirical tests are required to
find whether political relations bring about government’s certain actions on trade or not.
Measuring political relations and choosing a proper model is the most important and
challenge in conducting the empirical analysis of this this thesis. Through extensive research,
this thesis determines to use the GDELT events data measure South Korea’s political
relations with the four countries, but it is short of employing the GDELT events data more
sophisticatedly in measuring political relations. Specifically, political relations would be
measured more accurately if actors were specified in detail and events that could not be seen
as political actions were filtered out. In addition, this study leaves a question on the model
used in the analysis. It is likely to say that the VAR model employed for the analysis does not
reveal particular problems in testing the hypothesis. All of the data in this thesis has
stationarity when they are once and that makes them meet the condition for using the VAR
model in the analysis. However, in the stationarity test, while some of data should be
differenced once to have the stationarity, it turns out that some of them are stationary at the
current level. This means that another model, such as the autoregressive distributed lag
(ARDL) model that can test variables having the stationarity at different levels, could be a
suitable model employed for this study as well. To sum up, this study contributes to existing
academic research and trade policies, but all the questions and shortcomings pointed here

81
have to be examined in the future research so as to estimate more exact effects of political
relations on trade.

82
REFERENCES
Aitken, N. D. (1973). The Effect of the EEC and EFTA on European Trade: A Temporal
Cross- Section Analysis. The American Economic Review, 63(5), 881-892.
Anderson, J. E., & van Wincoop, E. (2003). Gravity with Gravities: A Solution to the Border
Puzzle. The American Economic Review, 93(1), 170-192.
Arad, R. W., & Hirsch, S. (1981). Peacemaking and Vested Interests: International Economic
Transactions. International Studies Quarterly, 25(3), 439-468.
Bae, J. Y. (2010). South Korean Strategic Thinking toward North Korea: The Evolution of
Engagement Policy and Its Impact upon U.S.-ROK Relations. Asian Survey, 50(2),
336-344.
Bailey, M. A., Strezhnev, A., & Voeten, E. (2017). Estimating Dynamic State Preferences
from United Nations Voting Data. Journal of Conflict Resolution, 61(2), 430-456.
Barbieri, K. (1996). Economic Interdependence: A Path to Peace of a Source of Interstate
Conflicts? Journal of Peace Research, 33(1), 29-49.
Barbieri, K., & Peters Ⅱ, R. A. (2003). Measure for Mis-measure: A Response to Gartzke &
Li. Journal of Peace Research, 40(6), 713-719.
Berger, D., Easterley, W., Nunn, N., & Satyanath, S. (2013). Commercial Imperialism?
Political Influence and Trade During the Cold War. The American Economic Review,
103(2), 863-896.
Carnegie, A. (2014). States Held Hostage: Political Hold-Up Problems and the Effects of
International Institutions. The American Political Science Review, 108(1), 54-70.
Chua, S. Y., & Sharma, S. C. (2000). ASEAN: economic integration and intra-regional trade.
Applied Economic Letters, 7(3), 165-169.
Chung, J. H. (2009). China’s “Soft”Clash wish South Korea: The History War and Beyond.
Asian Survey, 49(3), 468-483.
Davis, C. L., & Meunier, S. (2011). Business as Usual? Economic Responses to Political
Tensions. American Journal of Political Science, 55(3), 628-646.
Davis, C. L., Fuchs, A., & Johnson, K. (2017). State Control and the Effects of Foreign
Relations on Bilateral Trade. Journal of Conflict Resolution, 1-34.
83
Dies Jr, H. P. (2004). North Korea Special Operations Forces: 1996 Kangnung Submarine
infiltration. Military Intelligence, 30(4), 29-34.
Dixon, W., & Moon, B. E. (1993). Political Similarity and American Foreign Trade Pattern.
Political Research Quarterly, 46(1), 5-25.
Du, Y., Ju, J., Ramirez, C. D., & Yao X. (2017). Bilateral trade and shocks in political
relations: Evidence from China and some of its major trading partners, 1990-2013.
Journal of International Economics, 108(2017), 211-225.
Frieden, J. A. (2006). Global Capitalism: Its Fall and Rise in the Twentieth Century. New
York, NY: W.W. Norton & Company.
Gartzke, E., & Li, Q. (2003). Measure for Measure: Concept Operationalization and the
Trade Interdependence – Conflict Debate. Journal of Peace Research, 40(5), 553-
571.
Gasiorowski, M., & Polachek, S. W. (1982). Conflict and Interdependence. Journal of
Conflict Resolution, 26(4), 709-729.
Goldstein, J. S. (1992). A Conflict-Cooperation Scale for WEIS Events Data. Journal of
Conflict Resolution, 36(2), 369-385.
Gowa, J., & Mansfield, E. D. (2004). Alliance, Imperfect Markets, and Major-Power Trade.
International Organization, 58(4), 775-805.
Herge, A., Oneal, J. R., & Russett, B. (2010). Trade does promote peace: New simultaneous
estimates of the reciprocal effects of trade and conflict. Journal of Peace Research,
47(6), 763-774
Hwang, L., & Lee, J. (2017). Economic Integration and Political Cooperation Between South
Korea and China: Implications for Korea – US Relations. Asian Perspective 41
(2017), 99-120.
Ishikida, M. Y. (2005). Toward Peace: War Responsibility, Postwar Compensation, and
Peace Movement and Education in Japan. p 21.
Jeong, H. W. (2017). 2016년 대중 수출평가와 2017년 전망. Korea Trade-Investment
Promotion Agency, 17-001.
Kang, D. & Park, K. (2017). On Board For a Dual Track Approach. Comparative
Connection, 19(1), 105-112.
Kastner, S. L. (2007). When Do Conflicting Political Relations Affect International Trade?
Journal of Conflict Resolution, 51(4), 664-688.

84
Kastner, S. L. (2007). When Do Conflicting Political Relations Affect International Trade?
Journal of Conflict Resolution, 51(4), 664-688.
Keshk, O. M. G., Pollins, B. M., & Reuveny, R. (2004). Trade Still Follows the Flag: The
Primary of Politics in a Simultaneous Model of Interdependence and Armed
Conflict. The Journal of Politics, 66(4), 1155-1179.
Kim, S. K. (1991). The Korean Miracle (1962-1980) Revisited: Myths and Realities in
Strategy and Development. Kellogg Institute, Working paper #166.
Kim, Y. (2009). The Geopolitics of the Two Koreas and the United States: Seen through the
North Korea Nuclear Issue. APSA 2009 Toronto Meeting Paper.
King, G., & Lowe W. (2003). An Automated Information Extraction Tool for International
Conflict Data with Performance as Good as Human Coders: A Rare Events
Evaluations Design. International Organization 57, Summer 2003, 617-642.
Klinger, B. (2015). South Korea Needs THAAD Missile Defense. The Heritage Foundation,
Report Paper, No 3024.
Krieckhaus, J. (2017). Geopolitics and South Korea’s Economic Success. Asian Perspective,
41(1), 43-69.
Lee, J. W. (2001). The Impact of the Korean War on the Korean Economy, International
Journal of Korean Studies, 5(1), 97-118.
Lee, J. W., & Pyun, J. H. (2016). Does Trade Integration Contribute to Peace? Review of
Development Economics, 20(1), 327-344.
Lee, J. Y., Kwak, S. I., Lee, C. W., Min, J. Y., Jeh, S. H., Kadochnikov, P., Gherman, E.,
Rogatnykh, E., Knobel, A., Aliev, T., & Sokolyanskaya, A. (2015). Evaluation of
Korea- Russia Economic Cooperation and its mid-to long-term Vision. Korea
Institute for International Economic Policy.
Leetaru, K., & Schrodt, P. A. (2013). GDELT: Global Data on Events, Locations and Tone.
Paper presented at the International Studies Association meetings, San Francisco, CA.
Manyin, M. E, Chanlett-Avery, E., Nikitin, M. D., Williams, B. R., & Carrado, J.R. (2016).
U.S.-South Korea Relations. Congressional Research Service.
Manyin, M. E, Chanlett-Avery, E., Nikitin, M. D., Williams, B. R., & Carrado, J.R. (2017).
U.S.-South Korea Relations. Congressional Research Service.
Marshall, M.G., Gurr, T. R., Davenport, C., & Jaggers, K. (2002). Policy Ⅳ, 1800-1999.
Comparative Political Studies, 35(1), 40-45.

85
Martin, P., Mayer, T., & Thoenig, M. (2008). Make Trade Not War? Review of Economic
Studies, 75. 865-900.
Moon, C. I. & Boo, S. C. (2015). Korean Foreign Policy: Park Geun-hye Looks at China and
North Korea. In: Inoguchi, T. Japanese and Korean Politics. Asia Today, 221-248.
Morrow, J. D. (1999). How Could Trade Affect Conflict? Journal of Peace Research, 36(4),
481-489.
Morrow, J. D., Siverson, R. M., & Tabares, T. E. (1998). The Political Determinants of
International Trade: The Major Powers, 1907-90. The American Political Science
Review, 92(3), 649-661.
Morrow, J. D., Siverson, R. M., & Tabares, T. E. (1999). Correction to “The Political
Determinants of International Trade” The American Political Science Review, 93(4),
931-933.
Mukoyama, H. (2012). Japan-South Korea Economic Relations Grow Stronger in a
Globalized Environment. Pacific Business and Industries, 7(43), 2-24.
Mukoyama, H. (2014). The Impact of Shaky Japan-South Korea Relationship on Economic
Relations – What should Japan and South Korea Do Now? Pacific Business and
Industries, 14(51).
Oda, S. (1967). The Normalization of Relations Japan and the Republic of Korea. The
American Journal of International Law, 61(1), 35-56
Oneal, J. R., & Russett, B. (1997). The Classical Liberals Were Right: Democracy
Interdependence, and Conflict, 1950-1985. International Studies Quarterly, 41(2),
267-293.
Oneal, J. R., & Russett, B. (1999). Assessing the Liberal Peace with Alternative
Specifications: Trade Still Reduces Conflict. Journal of Peace Research, 36(4), 423-
442.
Polachek, S. W. (1980). Conflict and Trade. Journal of Conflict Resolution, 24(1), 55-78.
Pollins, B. M. (1989a). Does Trade Still Follow the Flag? The American Political Science
Review, 83(2), 465-480.
Pollins, B. M. (1989b). Conflict, Cooperation, and Commerce: The Effect of International
Political Interactions on Bilateral Trade Flows. American Journal of Political Science,
33(3), 737-761.
Reuveny, R., & Kang, H. J. (1996). International Trade, Political Conflict/Cooperation, and
Granger Causality. American Journal of Political Science, 40(3), 943-970.

86
Ryoo, M. B. (2009). The Korean Armistice And The Islands. Strategy Research Project,
Carlisle, PA: U.S. Army War College.
Signorino, C. S., & Ritter, J. M. (1999). Tau-b or Not Tau-b: Measuring the Similarity of
Foreign Policy Positions. International Studies Quarterly, 43(1), 115-144.
Snyder & Byun. (2015). China-Korea Relations: South Korea’s Diplomatic Triangle.
Comparative Connections, 18(1), 91-99.
Tinbergen, J. (1962). Shaping the World Economy: Suggesting for an International Economy
Policy. New York, NY: Twenty Century Fund.
Ye, M. (2016). Understanding the Economics-Politics Nexus in South Korea-China
Relations. Journal of Asian and African Studies, 51(1), 97-99.
Yoon, O. D., Sim, W. I., Lee, J. H., Nam, N. K., Lee, H. B., & Lee, H. G. (2010). 한국의
대일본 무역역조 원인과 전망. Korea Small Business Institute. Project Report.
Yoon, T. (2000). The Blue House Raid and the Pueblo Incident of 1968: From a Perspective
of South Korea’s Crisis Management under the South Korea- U.S. Alliance. KNDU
review, 5(1), 51-52.

87
APPENDICES
Appendix A. Tables of South Korea’s Political Relations Score (PRS)
Table A.1 PRS - South Korea’s actions toward China (1989-2016)
1989-2016 South Korea - China relations
Jan Feb Mar Apr May June July Aug Sep Oct Nov Dec
1989 - - - - - - 2.8 2.8 2.8 2 3.4 3.4
1990 - - - - - -0.5 5.2 - 0.8 3.5 - -
1991 - - 1 - - 4 3.5 - - 1 4.6 4
1992 2.3 - - 2.8 - 1 - 3.8 1.9 1.9 - -
1993 - 0 3.1 6 0 - - 1.9 1 2.9 2.5 -
1994 2.6 4.5 2.7 - 1.3 3.1 - - 4 3.5 1.5 -
1995 - - 4 3.9 -0.2 - 0.5 3.5 2.5 - 4 -
1996 -1.4 5.5 2.4 5.8 - 1.9 4.3 1.4 3.6 3.5 3.5 0.1
1997 4.1 2.6 3.6 3.6 3.7 2.6 4 3.2 4.8 - 2.2 3
1998 - 3.6 2.1 3.6 4 2.5 3.1 6 3.5 2.1 2.5 3.2
1999 2 3.2 1.9 0.3 1.3 6.2 1.4 2.8 2.1 - 1.9 4
2000 -0.8 - 3.3 3.2 -2.6 4 1.9 2.8 1 1.2 -0.4 2
2001 1.4 2.8 3.7 2.2 2.7 2.4 4 0.2 3.3 2.3 0.5 1.9
2002 4 2.4 2.8 2 1.1 0.6 4 1 1 4 2.7 3.4
2003 3.4 2.7 2.1 2.7 2.4 2.4 2.9 0.5 1.4 3.4 3.8 4
2004 3.3 0.9 2.6 1.9 4.9 1.5 -3.7 2.1 -0.1 -1.2 3.8 2.4
2005 0.5 3.4 0.9 2.7 2 3.3 1.9 2.8 2.2 1.3 4.6 -
2006 2.2 -0.3 2.7 2.1 1 2.8 3.9 3 3.1 3.7 2.9 2.4
2007 3 2.4 4.1 3.9 3.1 1.1 2.7 1.9 3.2 -0.9 3 3.1
2008 -1.9 2.4 3.1 1.5 3.3 3.4 2.3 3.6 -4.9 3.4 - 1.6
2009 -1.7 4.3 0.1 -0.6 1.4 2.6 -0.8 4.2 3.5 3.2 -3.4 6.4
2010 2.6 1.3 -0.1 2.8 1.6 2.2 -2.6 0.9 1 4.2 2.4 -1.1
2011 2.9 3.3 1.7 3.7 -0.5 2.1 3.5 2.2 -0.8 -0.9 -2.5 -2.9
2012 2.4 1 -0.2 0.8 0.4 2.4 2 -3 3.2 -3.1 4.4 0.2
2013 2.7 2.9 0.9 0.1 2.7 3.4 2.8 0.4 1.6 -3.6 0.6 -2
2014 2.6 2.3 2.8 3.2 2.4 4.8 3.1 5.8 1.7 -3.4 3.5 2
2015 2.7 -0.4 3.1 1.1 3.5 -1.5 0.4 2.4 3 1.8 4.1 -1.6
2016 2.8 2 1.9 -0.5 1 1.2 2.1 2 -6.1 -1.2 -8.3 -1.4

88
Table A.2 PRS - China’s actions toward South Korea (1989-2016)
1989-2016 China - South Korea relations
Jan Feb Mar Apr May June July Aug Sep Oct Nov Dec
1989 - - - - - - - 0 -1.3 - - 1.9
1990 - - 1.7 1.9 - - - - 2.8 6 - -
1991 -0.8 - 4 1 -1.7 - - 1.3 -0.4 1 3.6 1.9
1992 1.9 - - 3.4 - - - 2 2.5 - - -
1993 - - - - 2.2 - 4.5 - 1.9 4 2.8 2.7
1994 3.4 - 3.7 - 1.9 4.8 4 - 3.6 3 3.6 -
1995 -1.6 - 5 3 2.1 -5 - 2.7 0.5 3.1 2.5 1
1996 2.5 3.4 5.6 2 2.9 1 2.9 - 1.8 -3.4 1.9 2.6
1997 0.5 1.4 2.9 2.6 -0.3 2.8 1.8 1.7 4 3.4 2.1 3.2
1998 - -1 0.6 4 - 1.9 1 1.7 2.7 3.5 2.8 4
1999 3 3.1 3.1 - 2.7 0.1 1.4 0.7 3 2.7 3.1 2.4
2000 2.1 4 4.2 4.5 1 3.4 3.5 3.9 3.4 2.8 2.1 2.4
2001 3 0.3 4 3.5 3.9 2.4 2 2.7 2 1.4 -2.8 4.5
2002 0.9 3.8 0.3 2.7 3.4 1.5 2.1 2.4 2.3 7 3.3 0.6
2003 2.8 2.1 4.1 1.1 6.5 4.2 3.4 4 2.8 3 2.6 -0.1
2004 4.6 4.1 3.5 2.8 3.4 1.7 2.5 1.7 -1.9 3 3.7 2.2
2005 2.6 3 2.6 2.9 1 3.9 4 1.6 3.8 2.3 2.5 -0.6
2006 -0.4 1 5.9 2.8 1.9 4.2 4.2 5.4 0.8 3 3.3 2.8
2007 2 5.3 4 2.4 3.7 3.9 2.6 5.7 2.6 1.1 3.3 5
2008 2.9 1.1 3 1.2 4.2 1.3 0.7 2.2 4.8 0 1.9 2.6
2009 4.7 2.4 2.9 4.5 1.9 -0.3 3.8 1.3 4 2 4.8 1
2010 2.4 2.9 2.2 3.3 3.8 0.5 -0.7 0.6 2.3 4.6 0.8 1.5
2011 3.4 2.8 2.1 2.3 1.5 3.4 2.8 -0.5 -4.4 3.4 4.1 2.5
2012 2.8 4.1 2.5 2.8 2.8 1.7 3.6 0.5 2.2 1.8 3.2 1
2013 2.4 1.6 3.1 1.5 2.4 3.1 4.2 4.5 4.1 3.4 2.8 -0.3
2014 4.5 2.3 2.4 3.3 3 2.7 2.2 3.1 2.8 -1.2 1.7 -4.1
2015 1.2 -0.3 2.6 2.1 2.8 1.1 2.5 4.9 2.2 3.9 3.8 3.6
2016 5.1 0.1 1.4 4.7 1.9 3.1 3 1.7 -2.5 0.3 1.4 0.7

89
Table A.3 PRS - South Korea’s actions toward Japan (1989-2016)
1989-2016 South Korea - Japan relations
Jan Feb Mar Apr May June July Aug Sep Oct Nov Dec
1989 2.2 0.6 2.6 3.1 2.8 0.1 5.1 1.9 0.8 3.3 6.8 3.1
1990 1.9 - - 2.8 2.8 2.5 -2 - 0.1 0 3.1 2.8
1991 - - - 4.1 1.9 - 2.4 -4.8 - 7 3 1
1992 2.3 - 7 1.9 - - - - 1.9 3.7 - -
1993 2.4 - 1.4 - 2.8 2.3 2.8 -0.9 -1.6 1.7 3.9 3.4
1994 4 2.8 2.6 2 -6.5 - 4.5 3.6 - 3.4 3 1.9
1995 - 2.9 -2 3.2 1.7 -0.7 1.9 2 - -6.5 0.5 0
1996 1.9 2.6 -0.9 2.7 - 2.2 0.7 2.6 3.9 3.3 3.9 2.9
1997 3.2 3.6 3.2 3.5 1.8 7 1.6 4.6 2 - -0.2 4.8
1998 -1.1 3.4 3.4 1.9 2 0.4 2.4 2.1 3 2.8 3.1 -1.8
1999 2.9 3.8 1.9 1.7 3.5 2.8 0.3 2.1 3.2 2.1 2 0.5
2000 3.3 -3.4 3.5 4.2 3.3 3.5 3.3 3.6 3 5.6 3.3 2.9
2001 2.7 3.3 0.4 0.1 0.6 1.4 -0.2 -0.8 -1.2 1.6 -1.6 7
2002 4.7 4.3 1 7 0 - 3.2 - 2 2.4 4.9 2.9
2003 1.3 3.6 1.1 2 3.6 2.7 3.9 1.2 3.1 2.8 4.5 3.4
2004 -0.2 3.4 0.6 - 2.8 4.6 4.7 -0.8 1.7 2.3 2.8 1.5
2005 2.8 2.8 -0.2 0.6 1.1 1.4 0 1.8 2.3 1.6 2 1.3
2006 2.4 2.8 -0.2 -0.1 1.2 2.1 0.6 0.5 2.3 4.5 2.9 3
2007 1.3 3.3 2.4 1.5 3.1 0.9 -9 - 4.6 -0.6 -0.4 3.7
2008 5.7 1 -0.4 2.1 5.9 3 -0.1 -0.9 1.2 1.7 3.3 3.1
2009 5.5 2.6 -4.6 1.4 2.1 2.6 3 2.6 3.4 2.5 2.7 1.8
2010 1.6 3.2 -0.7 0.6 2.3 2.8 -0.1 1.6 1.9 2.3 2.9 2
2011 0.9 2.2 1.8 3.8 1.7 3.9 0.6 -0.7 3.2 3.8 1.2 2.1
2012 0.4 3.1 2.1 3.5 4.4 1.7 1.5 2.2 1.7 1 3.8 2.8
2013 2.2 2.2 2.2 -1.3 0 -0.5 3.1 1.5 -0.3 -0.3 1.7 -0.3
2014 0.6 -0.5 -0.2 1.8 1.4 -0.1 4.5 1.5 4.9 0 3.5 0.6
2015 1.5 1.7 3.6 0.7 3.8 2.7 0.4 2.5 1.7 1 2.1 2.3
2016 3.2 1.2 -1 -3.4 3.3 -2.4 4 1.1 1.8 2.6 4.4 0.1
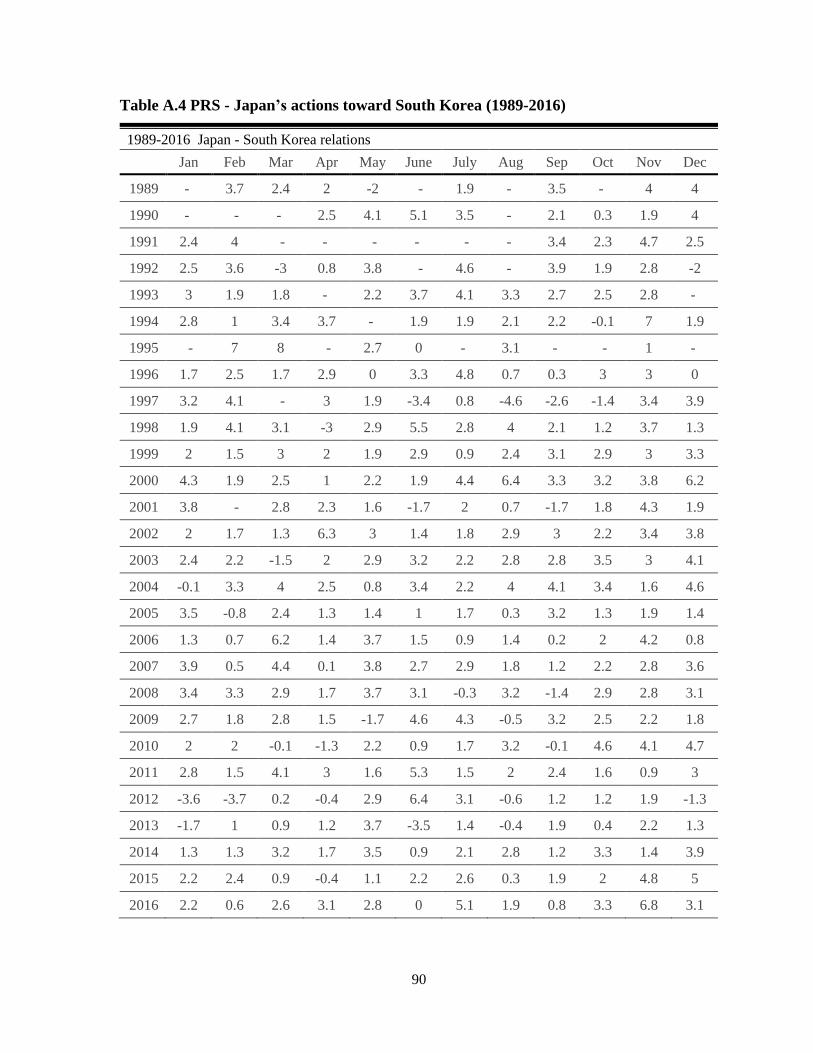
90
Table A.4 PRS - Japan’s actions toward South Korea (1989-2016)
1989-2016 Japan - South Korea relations
Jan Feb Mar Apr May June July Aug Sep Oct Nov Dec
1989 - 3.7 2.4 2 -2 - 1.9 - 3.5 - 4 4
1990 - - - 2.5 4.1 5.1 3.5 - 2.1 0.3 1.9 4
1991 2.4 4 - - - - - - 3.4 2.3 4.7 2.5
1992 2.5 3.6 -3 0.8 3.8 - 4.6 - 3.9 1.9 2.8 -2
1993 3 1.9 1.8 - 2.2 3.7 4.1 3.3 2.7 2.5 2.8 -
1994 2.8 1 3.4 3.7 - 1.9 1.9 2.1 2.2 -0.1 7 1.9
1995 - 7 8 - 2.7 0 - 3.1 - - 1 -
1996 1.7 2.5 1.7 2.9 0 3.3 4.8 0.7 0.3 3 3 0
1997 3.2 4.1 - 3 1.9 -3.4 0.8 -4.6 -2.6 -1.4 3.4 3.9
1998 1.9 4.1 3.1 -3 2.9 5.5 2.8 4 2.1 1.2 3.7 1.3
1999 2 1.5 3 2 1.9 2.9 0.9 2.4 3.1 2.9 3 3.3
2000 4.3 1.9 2.5 1 2.2 1.9 4.4 6.4 3.3 3.2 3.8 6.2
2001 3.8 - 2.8 2.3 1.6 -1.7 2 0.7 -1.7 1.8 4.3 1.9
2002 2 1.7 1.3 6.3 3 1.4 1.8 2.9 3 2.2 3.4 3.8
2003 2.4 2.2 -1.5 2 2.9 3.2 2.2 2.8 2.8 3.5 3 4.1
2004 -0.1 3.3 4 2.5 0.8 3.4 2.2 4 4.1 3.4 1.6 4.6
2005 3.5 -0.8 2.4 1.3 1.4 1 1.7 0.3 3.2 1.3 1.9 1.4
2006 1.3 0.7 6.2 1.4 3.7 1.5 0.9 1.4 0.2 2 4.2 0.8
2007 3.9 0.5 4.4 0.1 3.8 2.7 2.9 1.8 1.2 2.2 2.8 3.6
2008 3.4 3.3 2.9 1.7 3.7 3.1 -0.3 3.2 -1.4 2.9 2.8 3.1
2009 2.7 1.8 2.8 1.5 -1.7 4.6 4.3 -0.5 3.2 2.5 2.2 1.8
2010 2 2 -0.1 -1.3 2.2 0.9 1.7 3.2 -0.1 4.6 4.1 4.7
2011 2.8 1.5 4.1 3 1.6 5.3 1.5 2 2.4 1.6 0.9 3
2012 -3.6 -3.7 0.2 -0.4 2.9 6.4 3.1 -0.6 1.2 1.2 1.9 -1.3
2013 -1.7 1 0.9 1.2 3.7 -3.5 1.4 -0.4 1.9 0.4 2.2 1.3
2014 1.3 1.3 3.2 1.7 3.5 0.9 2.1 2.8 1.2 3.3 1.4 3.9
2015 2.2 2.4 0.9 -0.4 1.1 2.2 2.6 0.3 1.9 2 4.8 5
2016 2.2 0.6 2.6 3.1 2.8 0 5.1 1.9 0.8 3.3 6.8 3.1
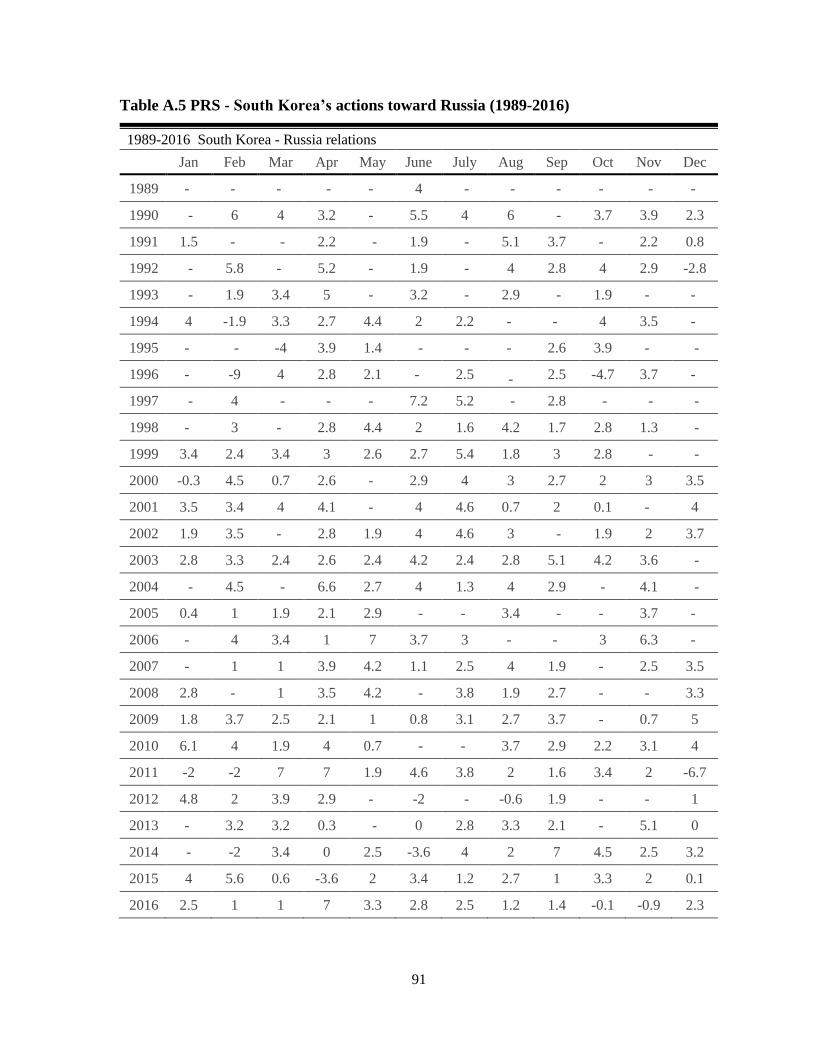
91
Table A.5 PRS - South Korea’s actions toward Russia (1989-2016)
1989-2016 South Korea - Russia relations
Jan Feb Mar Apr May June July Aug Sep Oct Nov Dec
1989 - - - - - 4 - - - - - -
1990 - 6 4 3.2 - 5.5 4 6 - 3.7 3.9 2.3
1991 1.5 - - 2.2 - 1.9 - 5.1 3.7 - 2.2 0.8
1992 - 5.8 - 5.2 - 1.9 - 4 2.8 4 2.9 -2.8
1993 - 1.9 3.4 5 - 3.2 - 2.9 - 1.9 - -
1994 4 -1.9 3.3 2.7 4.4 2 2.2 - - 4 3.5 -
1995 - - -4 3.9 1.4 - - - 2.6 3.9 - -
1996 - -9 4 2.8 2.1 - 2.5 - 2.5 -4.7 3.7 -
1997 - 4 - - - 7.2 5.2 - 2.8 - - -
1998 - 3 - 2.8 4.4 2 1.6 4.2 1.7 2.8 1.3 -
1999 3.4 2.4 3.4 3 2.6 2.7 5.4 1.8 3 2.8 - -
2000 -0.3 4.5 0.7 2.6 - 2.9 4 3 2.7 2 3 3.5
2001 3.5 3.4 4 4.1 - 4 4.6 0.7 2 0.1 - 4
2002 1.9 3.5 - 2.8 1.9 4 4.6 3 - 1.9 2 3.7
2003 2.8 3.3 2.4 2.6 2.4 4.2 2.4 2.8 5.1 4.2 3.6 -
2004 - 4.5 - 6.6 2.7 4 1.3 4 2.9 - 4.1 -
2005 0.4 1 1.9 2.1 2.9 - - 3.4 - - 3.7 -
2006 - 4 3.4 1 7 3.7 3 - - 3 6.3 -
2007 - 1 1 3.9 4.2 1.1 2.5 4 1.9 - 2.5 3.5
2008 2.8 - 1 3.5 4.2 - 3.8 1.9 2.7 - - 3.3
2009 1.8 3.7 2.5 2.1 1 0.8 3.1 2.7 3.7 - 0.7 5
2010 6.1 4 1.9 4 0.7 - - 3.7 2.9 2.2 3.1 4
2011 -2 -2 7 7 1.9 4.6 3.8 2 1.6 3.4 2 -6.7
2012 4.8 2 3.9 2.9 - -2 - -0.6 1.9 - - 1
2013 - 3.2 3.2 0.3 - 0 2.8 3.3 2.1 - 5.1 0
2014 - -2 3.4 0 2.5 -3.6 4 2 7 4.5 2.5 3.2
2015 4 5.6 0.6 -3.6 2 3.4 1.2 2.7 1 3.3 2 0.1
2016 2.5 1 1 7 3.3 2.8 2.5 1.2 1.4 -0.1 -0.9 2.3
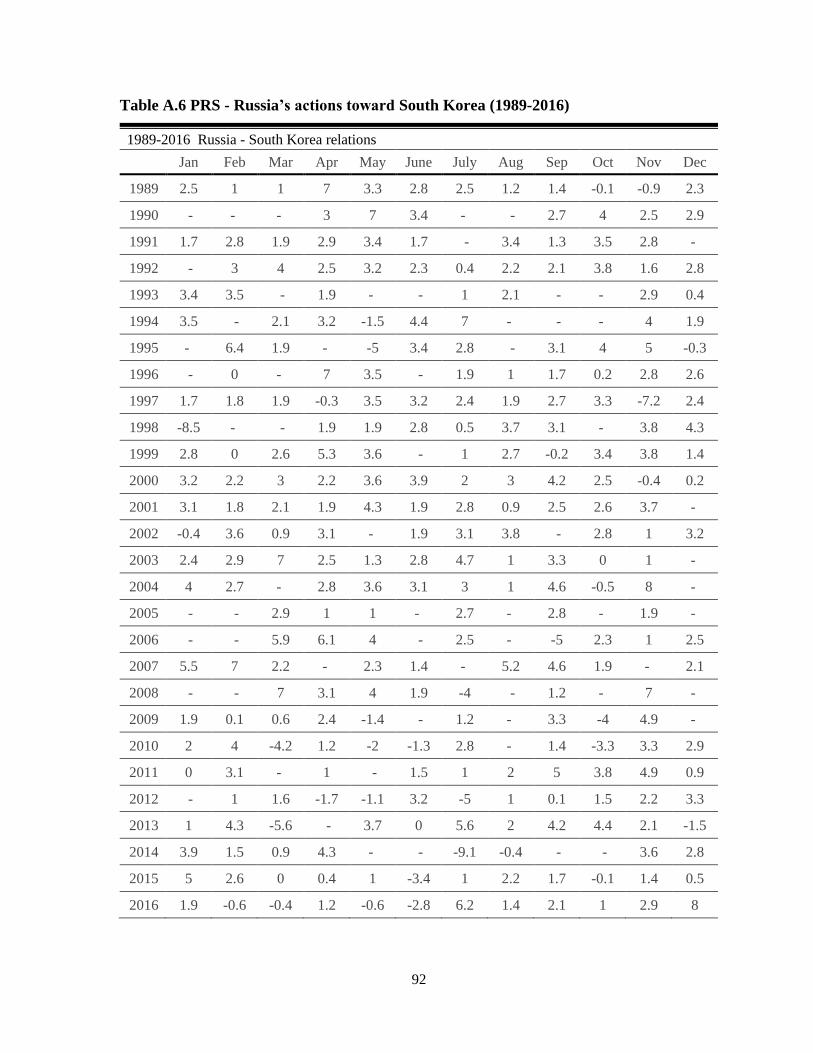
92
Table A.6 PRS - Russia’s actions toward South Korea (1989-2016)
1989-2016 Russia - South Korea relations
Jan Feb Mar Apr May June July Aug Sep Oct Nov Dec
1989 2.5 1 1 7 3.3 2.8 2.5 1.2 1.4 -0.1 -0.9 2.3
1990 - - - 3 7 3.4 - - 2.7 4 2.5 2.9
1991 1.7 2.8 1.9 2.9 3.4 1.7 - 3.4 1.3 3.5 2.8 -
1992 - 3 4 2.5 3.2 2.3 0.4 2.2 2.1 3.8 1.6 2.8
1993 3.4 3.5 - 1.9 - - 1 2.1 - - 2.9 0.4
1994 3.5 - 2.1 3.2 -1.5 4.4 7 - - - 4 1.9
1995 - 6.4 1.9 - -5 3.4 2.8 - 3.1 4 5 -0.3
1996 - 0 - 7 3.5 - 1.9 1 1.7 0.2 2.8 2.6
1997 1.7 1.8 1.9 -0.3 3.5 3.2 2.4 1.9 2.7 3.3 -7.2 2.4
1998 -8.5 - - 1.9 1.9 2.8 0.5 3.7 3.1 - 3.8 4.3
1999 2.8 0 2.6 5.3 3.6 - 1 2.7 -0.2 3.4 3.8 1.4
2000 3.2 2.2 3 2.2 3.6 3.9 2 3 4.2 2.5 -0.4 0.2
2001 3.1 1.8 2.1 1.9 4.3 1.9 2.8 0.9 2.5 2.6 3.7 -
2002 -0.4 3.6 0.9 3.1 - 1.9 3.1 3.8 - 2.8 1 3.2
2003 2.4 2.9 7 2.5 1.3 2.8 4.7 1 3.3 0 1 -
2004 4 2.7 - 2.8 3.6 3.1 3 1 4.6 -0.5 8 -
2005 - - 2.9 1 1 - 2.7 - 2.8 - 1.9 -
2006 - - 5.9 6.1 4 - 2.5 - -5 2.3 1 2.5
2007 5.5 7 2.2 - 2.3 1.4 - 5.2 4.6 1.9 - 2.1
2008 - - 7 3.1 4 1.9 -4 - 1.2 - 7 -
2009 1.9 0.1 0.6 2.4 -1.4 - 1.2 - 3.3 -4 4.9 -
2010 2 4 -4.2 1.2 -2 -1.3 2.8 - 1.4 -3.3 3.3 2.9
2011 0 3.1 - 1 - 1.5 1 2 5 3.8 4.9 0.9
2012 - 1 1.6 -1.7 -1.1 3.2 -5 1 0.1 1.5 2.2 3.3
2013 1 4.3 -5.6 - 3.7 0 5.6 2 4.2 4.4 2.1 -1.5
2014 3.9 1.5 0.9 4.3 - - -9.1 -0.4 - - 3.6 2.8
2015 5 2.6 0 0.4 1 -3.4 1 2.2 1.7 -0.1 1.4 0.5
2016 1.9 -0.6 -0.4 1.2 -0.6 -2.8 6.2 1.4 2.1 1 2.9 8

93
Table A.7 PRS - South Korea’s actions toward North Korea (1989-2016)
1989-2016 South Korea – North Korea relations
Jan Feb Mar Apr May June July Aug Sep Oct Nov Dec
1989 0.5 4.5 2.4 2.9 7 - 2.5 -2 2.9 4.6 3.5 1
1990 - 0.7 -3.4 5 3.8 1.3 2.9 1.7 -0.1 4.4 3.2 1.8
1991 3.5 -2.1 1.3 - 2.1 1.3 2 1.7 2.4 1.7 -2.2 0.5
1992 4 1.4 - 3.8 3.5 - -3.5 - 3.8 -1.1 -2 -2
1993 - 1.9 2.5 0.2 2.2 -0.4 5.9 2.6 1.6 0 -5.3 -0.7
1994 -0.1 2.7 0.7 1.2 -0.1 3.1 1.7 0.5 2.8 3.7 2.3 1.9
1995 - 1.4 -1.2 -0.4 0.7 0.1 2.4 1.7 -4 -7.6 7 0
1996 -3.5 2.1 2.2 2.3 2.9 -0.3 2.3 3.3 -0.4 0 0.3 1.4
1997 4.6 -0.3 1.8 1.2 3.1 1.3 3.1 -0.7 -3.8 -1.4 3.2 3.7
1998 4.5 2.1 4 2.7 -0.2 1.7 -0.9 0.8 0.8 4.9 1 -1.7
1999 0.8 3.1 0.9 1.1 1.9 0.2 -1.5 0.7 0.4 0.4 2.6 1.9
2000 2.6 3.3 3.4 3.5 3.8 3.3 4.1 0.6 2.6 2.5 1.7 2.1
2001 2.8 2.8 2.3 2.6 3.1 -1.2 2 1.1 1 0.7 1.2 1.6
2002 2.9 1.8 2 2.4 4.4 -0.9 -0.3 3.9 2.9 1.9 -1.8 1.4
2003 2.2 1.4 -0.7 1.4 0.5 -2.8 0.9 -2.1 0.8 -2 1.5 1.7
2004 3.4 1 2.6 2.6 0.9 1.3 -2 0.2 -0.7 2.9 -3 0.4
2005 1 1.2 -1.3 1.2 2.2 2.6 0.5 0.9 3.2 1.5 1.1 1.4
2006 0.4 3.1 -2 4 3 0.9 1.7 -3.3 0.4 -0.5 -0.3 3.3
2007 -0.7 1.8 3.6 1.5 1 0.8 2.5 2.9 1.4 3.4 3.8 3.9
2008 2.1 -3.2 1.6 3 3.7 3.3 1.7 2.6 2.5 1.2 2.5 1.1
2009 2.3 -1.1 -0.3 2 2.6 -0.6 -0.2 2.7 0.7 2 -3.2 3
2010 -0.3 0.7 -1.2 -2.6 -2.1 -0.6 -1 -0.6 -1.6 -2 -4.9 -2.5
2011 0.8 0.6 0.8 2.6 0.5 -0.5 2 -4.3 -1.1 -2.4 3.6 1.6
2012 0 -3.9 0 -2.3 -2.2 -2.8 -3 -2.7 -3.4 -2.7 -1.9 -0.1
2013 0.2 -1 -4.1 1.5 -2.1 2 0.7 1.5 1.7 -1.5 -1.8 -0.6
2014 -0.9 2.7 -2 -0.3 -6 -0.1 1.7 2 0.7 -0.9 -2 -1.7
2015 3.6 2.1 -1.2 -2.7 -0.9 2.4 0.3 -4.8 -1.1 -5.1 -1.5 1.2
2016 0.9 -2 -0.4 -0.8 -2.7 -3.4 -2.2 -3.7 -2.8 -0.7 0.4 -0.5

94
Table A.8 PRS – North Korea’s actions toward South Korea (1989-2016)
1989-2016 North Korea – South Korea relations
Jan Feb Mar Apr May June July Aug Sep Oct Nov Dec
1989 3.6 1.7 5 3.7 7 1.3 1.1 -1.1 -1.5 - -6.8 1.5
1990 3.7 4 7 4.2 2.8 0.8 4.4 3.3 1.2 -0.1 - 3
1991 0.9 -4 7 3.2 - -0.2 1.6 3.4 -1.7 0.8 0.4 2.1
1992 3.8 1.4 1 3.7 2.9 1.1 4 6 2.8 -2.8 - 5.3
1993 -2.3 1 3.1 - -0.2 0.5 -2.9 4.3 -2 -5 2.9 -0.2
1994 0.5 3.6 0.3 5.6 3 3 -2 2 0.7 0.9 1.3 -2
1995 0.9 1 0.6 -3.8 -3.6 -0.5 -0.3 2 4 -0.9 -1 -1.7
1996 0.9 -1.2 -2 -0.1 -1.9 1.2 2.8 0.4 0.3 0.6 0.7 -0.5
1997 1.2 0.5 1 1.7 1.4 1.6 -1.1 -0.1 3 2.5 0.9 1.1
1998 -0.8 -2.5 -0.9 -1 -0.1 2.5 -2.5 -0.2 0.2 1.6 4.4 1.6
1999 1.4 2.1 -0.6 3.7 0.9 -2.8 -7.4 -0.4 -3.8 1.1 -0.2 0.4
2000 0.5 1.7 2.1 3.4 2.6 3.2 2.7 0.9 3.2 1.2 3.5 1.5
2001 2.4 2.9 2.7 1.1 0.7 2.4 2.1 2.8 3.8 2.4 2.7 2.6
2002 -3.7 -2 -1.6 1.7 5.4 -8.1 -1.8 3.2 -0.3 3.1 3.4 3.1
2003 3 -2.2 -1.3 1.8 2.4 -2.2 1.4 2.5 3.5 2 0.8 1.9
2004 -1 4.3 0.9 2.6 -1.6 -1 -0.6 2.1 -4.4 1.9 3.4 2.3
2005 -1.4 0.9 2.3 6.1 1 1.2 3 0.7 3.6 3 -0.9 0.9
2006 2.2 2.8 0.5 1.9 -1.3 -2.7 2.5 7 1.9 -3.3 3.1 -0.7
2007 -6.3 1.5 2.1 -0.8 2.6 -1.9 -4.9 2.2 1.7 2.3 3.7 4.5
2008 1.8 0.8 -4.8 -2.9 -1.2 -4.2 -7 -3.2 -4.5 -3.2 -0.5 -0.1
2009 -1.1 1.3 2.5 -1.8 0.2 -2.7 -1 0.6 0.1 3.4 -0.8 2
2010 0.9 1.2 -3.1 -2.2 -6.7 0.2 -0.2 -7.4 0.6 1 -0.1 -1.8
2011 1.2 2.9 -4.7 3.2 -1 -6.6 6 -0.5 3.2 2.1 -3.3 1.3
2012 3.1 2 -3.5 -1.8 2.8 -7.1 -7.2 1.6 -2 -8 -0.3 -5
2013 2.6 -1.4 -6.1 -3.1 -5.3 1.4 -1.4 -9 1.4 0.8 -6.7 -3.4
2014 -1.3 -0.3 -1.7 -0.3 -0.9 -2 -1.4 0.9 0.2 -0.1 0.8 0.6
2015 -1.5 -2 -4.4 0.1 -1.7 -0.6 0.3 -0.3 -0.7 -0.7 -4.6 3.1
2016 1.7 -5.1 -2.5 -2.7 2.2 -1 -3.7 -2.8 -2.9 -0.2 -1.5 -3.4

95
Appendix B. Results of the Vector Auto-Regression (VAR) Analysis
Table B.1 Results of the VAR model - South Korea’s trade with China
(1)
Imports
GDELT
(Political
Relations Score)
(2)
Imports
GDELT
(Negative events)
(3)
Exports
GDELT
(Political
Relations Score)
(4)
Exports
GDELT
(Negative events)
s = South Korea, p = China
Month 1
𝑃𝑅𝑠𝑝−1/𝑝𝑠−1 22.44*
(10.27)
-0.2876
(2.929)
3.444
(17.38)
2.296
(3.512)
𝐺𝐷𝑃𝑠−1 711.7
(724.1)
178.7
(478.2)
-830.4
(1207)
-529.8
(640.7)
𝐺𝐷𝑃𝑝−1 -320.1
(110.5)
-2216**
(830.3)
-1998
(1466)
-2554**
(969.2)
𝑃𝑂𝑃𝑠−1/𝑝−1 -0.00172**
(0.00056)
-0.0004
(0.0004)
-1310
(35620)
-0.00004
(0.00003)
𝐹𝐷𝐼𝑠−1/𝑝−1 0.2138
(0.2234)
0.0086
(0.2413)
0.1569
(0.1373)
0.2069
(0.1141)
𝐼𝑚𝑝𝑜𝑟𝑡𝑠𝑠𝑝−1 -0.4898***
(0.07227)
-0.3292***
(0.06297) - -
𝐸𝑥𝑝𝑜𝑟𝑡𝑠𝑠𝑝−1 - - -0.1545*
(0.075)
-0.1578*
(0.0613)
Month 2
𝑃𝑅𝑠𝑝−2/𝑝𝑠−2 19.76
(13.39)
-5.124
(3.362)
14.71
(20.06)
1.144
(4.550)
𝐺𝐷𝑃𝑠−2 -480.5
(726.1)
-170.2
(476.9)
-850.9
(1171)
-232.1
(633)
𝐺𝐷𝑃𝑝−2 4055***
(1051)
2883***
(838.2)
4498**
(1475)
3640***
(999.9)
𝑃𝑂𝑃𝑠−2/𝑝−2 -0.0006
(0.0005)
-0.0008*
(0.0004)
-14330
(35270)
-0.0001**
(0.00003)
𝐹𝐷𝐼𝑠−2/𝑝−2 0.2614
(0.2236)
-0.094
(0.2402)
-0.1771
(0.1366)
-0.2127
(0.113)
𝐼𝑚𝑝𝑜𝑟𝑡𝑠𝑠𝑝−2 -0.2689***
(0.07925)
-0.0403
(0.0651) - -
𝐸𝑥𝑝𝑜𝑟𝑡𝑠𝑠𝑝−2 - - -0.0908
(0.0773)
-0.1343*
(0.062)
Month 3
𝑃𝑅𝑠𝑝−3/𝑝𝑠−3 -3.201
(14.60)
2.706
(3.873)
-9.438
(2.053)
10.11
(5.563)
𝐺𝐷𝑃𝑠−3 267.5
(722.4)
-152.0
(477.2)
508.4
(1156)
20.51
(626.9)
𝐺𝐷𝑃𝑝−3 3029**
(1081)
2397**
(840.9)
487.3
(1413)
-30.30
(1006)

96
Table B.1 continued
𝑃𝑂𝑃𝑠−3/𝑝−3 -0.0008
(0.0005)
-86400*
(41210)
-16660
(31500)
-0.0001*
(0.00003)
𝐹𝐷𝐼𝑠−3/𝑝−3 0.3643
(0.2259)
0.4738
(0.2489)
0.0552
(0.1384)
0.1298
(0.1134)
𝐼𝑚𝑝𝑜𝑟𝑡𝑠𝑠𝑝−3 -0.1576
(0.0799)
0.0043
(0.0637) - -
𝐸𝑥𝑝𝑜𝑟𝑡𝑠𝑠𝑝−3 - - -0.0083
(0.0752)
0.0878
(0.0618)
Month 4
𝑃𝑅𝑠𝑝−4/𝑝𝑠−4 0.3742
(15.62)
3.896
(4.389)
-17.26
(21.19)
1.114
(6.594)
𝐺𝐷𝑃𝑠−4 254.0
(722.1)
181.1
(477.2)
74.76
(1167)
96.79
(626.1)
𝐺𝐷𝑃𝑝−4 1898
(1104)
589.9
(854.3)
1143
(1433)
738.4
(1008)
𝑃𝑂𝑃𝑠−4/𝑝−4 -0.001
(0.0005)
-0.0006
(0.0004)
-26290
(32010)
-0.0001*
(0.00003)
𝐹𝐷𝐼𝑠−4/𝑝−4 0.3839
(0.2405)
0.188
(0.2743)
0.0476
(0.1663)
0.1051
(0.1392)
𝐼𝑚𝑝𝑜𝑟𝑡𝑠𝑠𝑝−4 -0.1702*
(0.08085)
-0.1013
(0.0637) - -
𝐸𝑥𝑝𝑜𝑟𝑡𝑠𝑠𝑝−4 - - -0.1428
(0.0743)
-0.140*
(0.0619)
Month 5
𝑃𝑅𝑠𝑝−5/𝑝𝑠−5 -14.16
(15.64)
4.756
(4.799)
1.283
(21.41)
5.302
(7.165)
𝐺𝐷𝑃𝑠−5 -326.1
(726.8)
-10.90
(476.9)
-733.9
(1167)
-186.3
(626.4)
𝐺𝐷𝑃𝑝−5 -778.7
(1114)
-1473
(858.8)
239.0
(1426)
-753.8
(1010)
𝑃𝑂𝑃𝑠−5/𝑝−5 -0.0002
(0.0005)
-0.0003
(0.0004)
-17300
(32000)
-0.0001
(0.00003)
𝐹𝐷𝐼𝑠−5/𝑝−5 -0.2107
(0.2403)
-0.144
(0.2726)
0.0437
(0.1636)
-0.0204
(0.1416)
𝐼𝑚𝑝𝑜𝑟𝑡𝑠𝑠𝑝−5 -0.0489
(0.0814)
-0.0297
(0.0632) - -
𝐸𝑥𝑝𝑜𝑟𝑡𝑠𝑠𝑝−5 - - -0.0387
(0.0726)
-0.0584
(0.0609)
Month 6
𝑃𝑅𝑠𝑝−6/𝑝𝑠−6 0.0744
(14.86)
4.549
(4.914)
-15.04
(21.24)
5.187
(7.480)
𝐺𝐷𝑃𝑠−6 -1244
(728.1)
-252.9
(477.2)
387.9
(1162)
497.7
(626.6)
𝐺𝐷𝑃𝑝−6 1222
(1117)
304.8
(866.1)
1051
(1448)
1076
(1013)
𝑃𝑂𝑃𝑠−6/𝑝−6 -0.0001
(0.0005)
-0.0004
(0.0004)
-2425
(31700)
-0.0001*
(0.00002)

97
Table B.1 continued
𝐹𝐷𝐼𝑠−6/𝑝−6 0.1647
(0.2435)
0.1708
(0.2684)
-0.2401
(0.1663)
-0.1065
(0.1452)
𝐼𝑚𝑝𝑜𝑟𝑡𝑠𝑠𝑝−6 0.2215**
(0.0821)
0.1821**
(0.0636) - -
𝐸𝑥𝑝𝑜𝑟𝑡𝑠𝑠𝑝−6 - - -0.0101
(0.0728)
-0.0212
(0.0615)
Month 7
𝑃𝑅𝑠𝑝−7/𝑝𝑠−7 19.29
(13.32)
-2.449
(5.014)
-1.797
(21.16)
-0.123
(7.563)
𝐺𝐷𝑃𝑠−7 -390.2
(716.1)
-184.1
(473.7)
1480
(1124)
259.4
(616.4)
𝐺𝐷𝑃𝑝−7 1037
(1127)
773.7
(867.4)
544.1
(1450)
-827.6
(1010)
𝑃𝑂𝑃𝑠−7/𝑝−7 -0.0002
(0.0005)
-0.0005
(0.0004)
-41820
(31660)
-0.0001*
(0.00003)
𝐹𝐷𝐼𝑠−7/𝑝−7 -0.2156
(0.243)
-0.3818
(0.2538)
0.0167
(0.1673)
-0.0225
(0.1427)
𝐼𝑚𝑝𝑜𝑟𝑡𝑠𝑠𝑝−7 0.09056
(0.0854)
-0.0465
(0.0648) - -
𝐸𝑥𝑝𝑜𝑟𝑡𝑠𝑠𝑝−7 - - -0.0811
(0.0736)
-0.0795
(0.0615)
Month 8
𝑃𝑅𝑠𝑝−8/𝑝𝑠−8 9.725
(12.63)
0.3127
(4.961)
12.31
(21.08)
1.439
(7.444)
𝐺𝐷𝑃𝑠−8 -285.2
(711.3)
-13.84
(472.6)
-545.7
(1129)
-105.3
(616.9)
𝐺𝐷𝑃𝑝−8 -1565
(1117)
-596.4
(862.9)
-1018
(1442)
-1226
(1015)
𝑃𝑂𝑃𝑠−8/𝑝−8 0.0004
(0.0005)
-0.0003
(0.0004)
17330
(31460)
-0.00004
(0.00003)
𝐹𝐷𝐼𝑠−8/𝑝−8 0.2321
(0.2419)
0.4902
(0.256)
0.1933
(0.1667)
0.2061
(0.1472)
𝐼𝑚𝑝𝑜𝑟𝑡𝑠𝑠𝑝−8 0.0162
(0.0854)
-0.0582
(0.0648) - -
𝐸𝑥𝑝𝑜𝑟𝑡𝑠𝑠𝑝−8 - - -0.1174
(0.0739)
-0.1668**
(0.0618)
Month 9
𝑃𝑅𝑠𝑝−9/𝑝𝑠−9 8.846
(12.54)
-5.191
(4.766)
6.419
(21.10)
6.800
(7.193)
𝐺𝐷𝑃𝑠−9 1461*
(704.4)
956.5*
(471.9)
1546
(1135)
696.4
(616.2)
𝐺𝐷𝑃𝑝−3 -886.7
(1129)
-125.6
(864.7)
50.92
(1449)
155.8
(1026)
𝑃𝑂𝑃𝑠−9/𝑝−9 -0.0001
(0.0005)
-0.0005
(0.0004)
-4444
(31670)
-0.0001*
(0.00003)
𝐹𝐷𝐼𝑠−9/𝑝−9 0.0549
(0.2448)
0.1843
(0.26)
-0.3151
(0.1708)
-0.1979
(0.1492)

98
Table B.1 continued
𝐼𝑚𝑝𝑜𝑟𝑡𝑠𝑠𝑝−9 -0.0988
(0.084)
-0.0833
(0.0641) - -
𝐸𝑥𝑝𝑜𝑟𝑡𝑠𝑠𝑝−9 -
- 0.0095
(0.0734)
0.0116
(0.0621)
Month 10
𝑃𝑅𝑠𝑝−10/𝑝𝑠−10 25.32*
(12.42)
-4.320
(4.611)
-18.17
(21.02)
7.704
(6.891)
𝐺𝐷𝑃𝑠−10 1.677*
(704.3)
1057*
(472.3)
2026
(1149)
876.5
(623.2)
𝐺𝐷𝑃𝑝−10 -322.3
(1147)
-945.4
(885.2)
-2096
(1484)
-1502
(1033)
𝑃𝑂𝑃𝑠−10/𝑝−10 -0.0006
(0.0005)
-0.0004
(0.0004)
-6668
(31740)
-0.0001
(0.00002)
𝐹𝐷𝐼𝑠−10/𝑝−10 -0.0352
(0.2473)
-0.4513
(0.2586)
0.0909
(0.1354)
0.0611
(0.1147)
𝐼𝑚𝑝𝑜𝑟𝑡𝑠𝑠𝑝−10 -0.1384
(0.0815)
-0.1464*
(0.0648) - -
𝐸𝑥𝑝𝑜𝑟𝑡𝑠𝑠𝑝−10 - - -0.2129**
(0.0763)
-0.2024**
(0.6308)
Month 11
𝑃𝑅𝑠𝑝−11/𝑝𝑠−11 19.30
(12.08) -2.142
(4.221)
8.484
(20.56)
1.961
(6.430)
𝐺𝐷𝑃𝑠−11 1118
(752.1) 547.8
(476.0)
800.8
(1146)
141.5
(624.6)
𝐺𝐷𝑃𝑝−11 -2639*
(1214) -1222
(881.5)
-2909
(1510)
-2228*
(1036)
𝑃𝑂𝑃𝑠−11/𝑝−11 0.0009
(0.0005) -0.0004
(0.0004)
26700
(31990)
-0.00003
(0.00003)
𝐹𝐷𝐼𝑠−11/𝑝−11 0.3592
(0.2451) 0.3364
(0.2602)
-0.0192
(0.1363)
0.0275
(0.1152)
𝐼𝑚𝑝𝑜𝑟𝑡𝑠𝑠𝑝−11 -0.2181**
(0.0749) -0.159*
(0.0662) - -
𝐸𝑥𝑝𝑜𝑟𝑡𝑠𝑠𝑝−11 -
- 0.0639
(0.075)
0.1002
(0.0631)
Month 12
𝑃𝑅𝑠𝑝−12/𝑝𝑠−12 7.509
(9.877) 3.970
(3.460)
6.898
(17.69)
4.950
(5.390)
𝐺𝐷𝑃𝑠−12 1312
(753.0) 759.7
(475.4)
-843.5
(1145)
-128.6
(623.6)
𝐺𝐷𝑃𝑝−12 2623*
(1259) 150.5
(893.6)
-1298
(1611)
-699.8
(1047)
𝑃𝑂𝑃𝑠−12/𝑝−12 -0.0017**
(0.0005) -0.0008
(0.0004)
7936
(33410)
-0.0001*
(0.00002)
𝐹𝐷𝐼𝑠−12/𝑝−12 -0.0689
(0.2421) 0.0251
(0.2582)
-0.042
(0.1393)
0.0025
(0.1173)
𝐼𝑚𝑝𝑜𝑟𝑡𝑠𝑠𝑝−12 0.0528
(0.0661) 0.1322*
(0.0632) - -
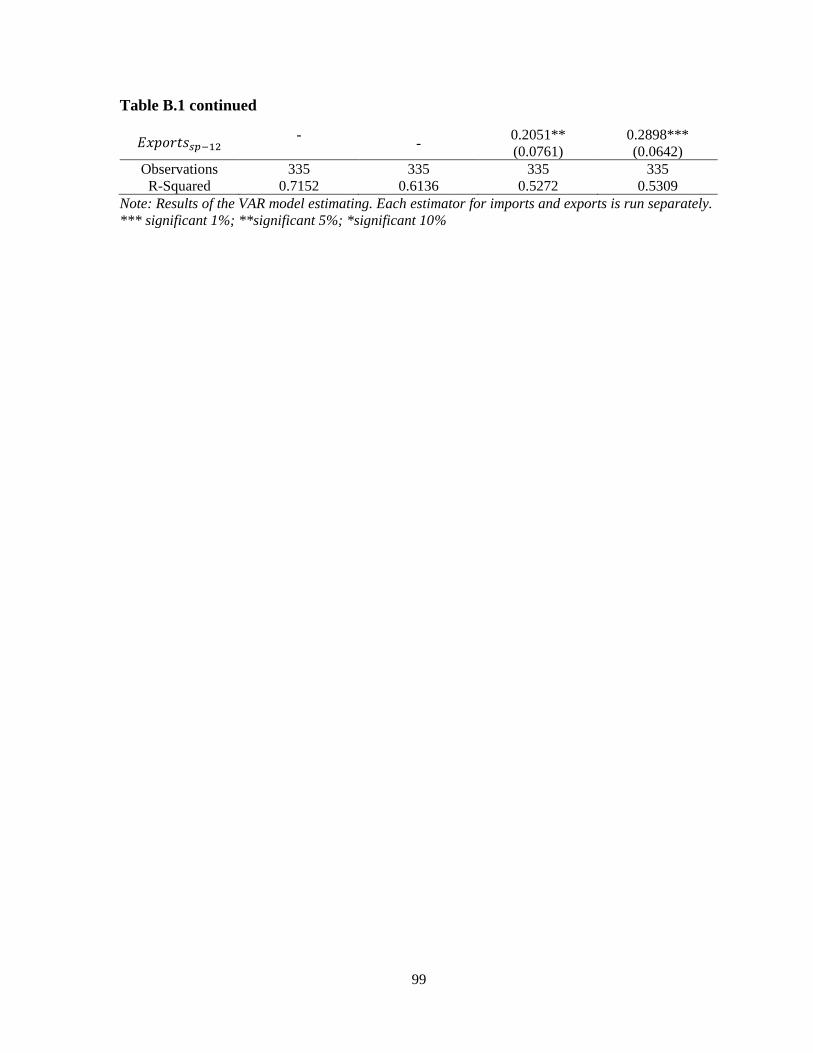
99
Table B.1 continued
𝐸𝑥𝑝𝑜𝑟𝑡𝑠𝑠𝑝−12 -
- 0.2051**
(0.0761)
0.2898***
(0.0642)
Observations 335 335 335 335
R-Squared 0.7152 0.6136 0.5272 0.5309
Note: Results of the VAR model estimating. Each estimator for imports and exports is run separately.
*** significant 1%; **significant 5%; *significant 10%
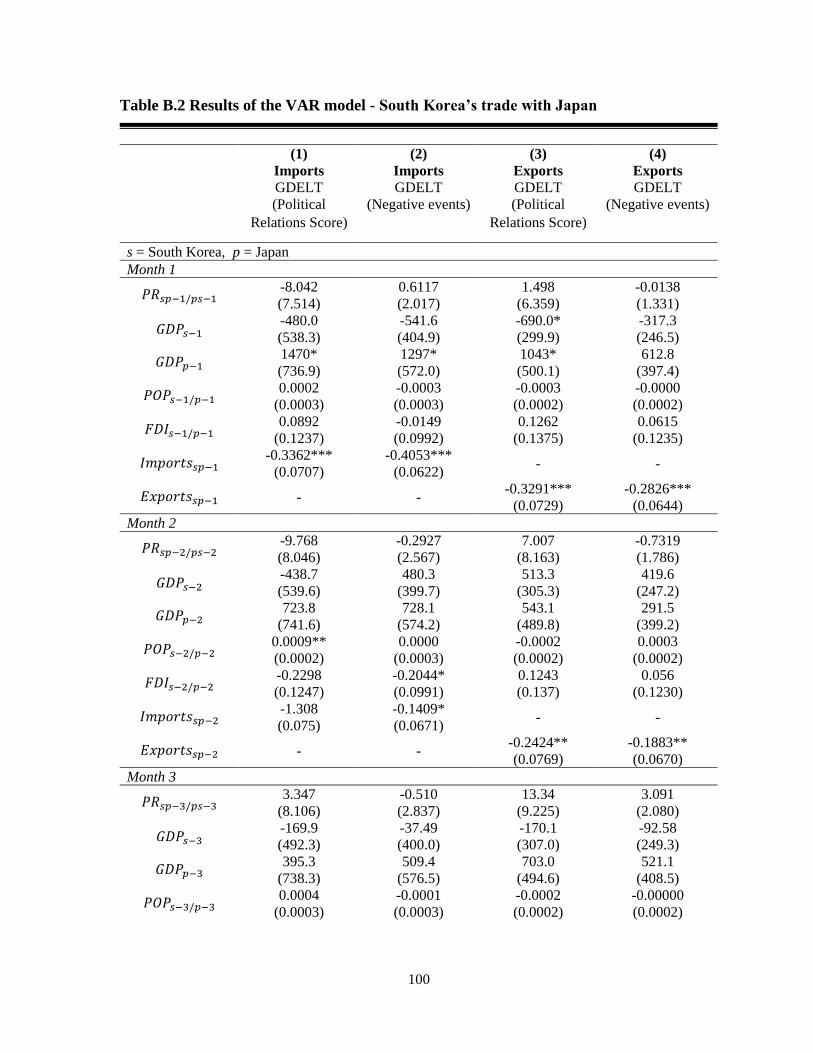
100
Table B.2 Results of the VAR model - South Korea’s trade with Japan
(1)
Imports
GDELT
(Political
Relations Score)
(2)
Imports
GDELT
(Negative events)
(3)
Exports
GDELT
(Political
Relations Score)
(4)
Exports
GDELT
(Negative events)
s = South Korea, p = Japan
Month 1
𝑃𝑅𝑠𝑝−1/𝑝𝑠−1 -8.042
(7.514)
0.6117
(2.017)
1.498
(6.359)
-0.0138
(1.331)
𝐺𝐷𝑃𝑠−1 -480.0
(538.3)
-541.6
(404.9)
-690.0*
(299.9)
-317.3
(246.5)
𝐺𝐷𝑃𝑝−1 1470*
(736.9)
1297*
(572.0)
1043*
(500.1)
612.8
(397.4)
𝑃𝑂𝑃𝑠−1/𝑝−1 0.0002
(0.0003)
-0.0003
(0.0003)
-0.0003
(0.0002)
-0.0000
(0.0002)
𝐹𝐷𝐼𝑠−1/𝑝−1 0.0892
(0.1237)
-0.0149
(0.0992)
0.1262
(0.1375)
0.0615
(0.1235)
𝐼𝑚𝑝𝑜𝑟𝑡𝑠𝑠𝑝−1 -0.3362***
(0.0707)
-0.4053***
(0.0622) - -
𝐸𝑥𝑝𝑜𝑟𝑡𝑠𝑠𝑝−1 - - -0.3291***
(0.0729)
-0.2826***
(0.0644)
Month 2
𝑃𝑅𝑠𝑝−2/𝑝𝑠−2 -9.768
(8.046)
-0.2927
(2.567)
7.007
(8.163)
-0.7319
(1.786)
𝐺𝐷𝑃𝑠−2 -438.7
(539.6)
480.3
(399.7)
513.3
(305.3)
419.6
(247.2)
𝐺𝐷𝑃𝑝−2 723.8
(741.6)
728.1
(574.2)
543.1
(489.8)
291.5
(399.2)
𝑃𝑂𝑃𝑠−2/𝑝−2 0.0009**
(0.0002)
0.0000
(0.0003)
-0.0002
(0.0002)
0.0003
(0.0002)
𝐹𝐷𝐼𝑠−2/𝑝−2 -0.2298
(0.1247)
-0.2044*
(0.0991)
0.1243
(0.137)
0.056
(0.1230)
𝐼𝑚𝑝𝑜𝑟𝑡𝑠𝑠𝑝−2 -1.308
(0.075)
-0.1409*
(0.0671) - -
𝐸𝑥𝑝𝑜𝑟𝑡𝑠𝑠𝑝−2 - - -0.2424**
(0.0769)
-0.1883**
(0.0670)
Month 3
𝑃𝑅𝑠𝑝−3/𝑝𝑠−3 3.347
(8.106)
-0.510
(2.837)
13.34
(9.225)
3.091
(2.080)
𝐺𝐷𝑃𝑠−3 -169.9
(492.3)
-37.49
(400.0)
-170.1
(307.0)
-92.58
(249.3)
𝐺𝐷𝑃𝑝−3 395.3
(738.3)
509.4
(576.5)
703.0
(494.6)
521.1
(408.5)
𝑃𝑂𝑃𝑠−3/𝑝−3 0.0004
(0.0003)
-0.0001
(0.0003)
-0.0002
(0.0002)
-0.00000
(0.0002)
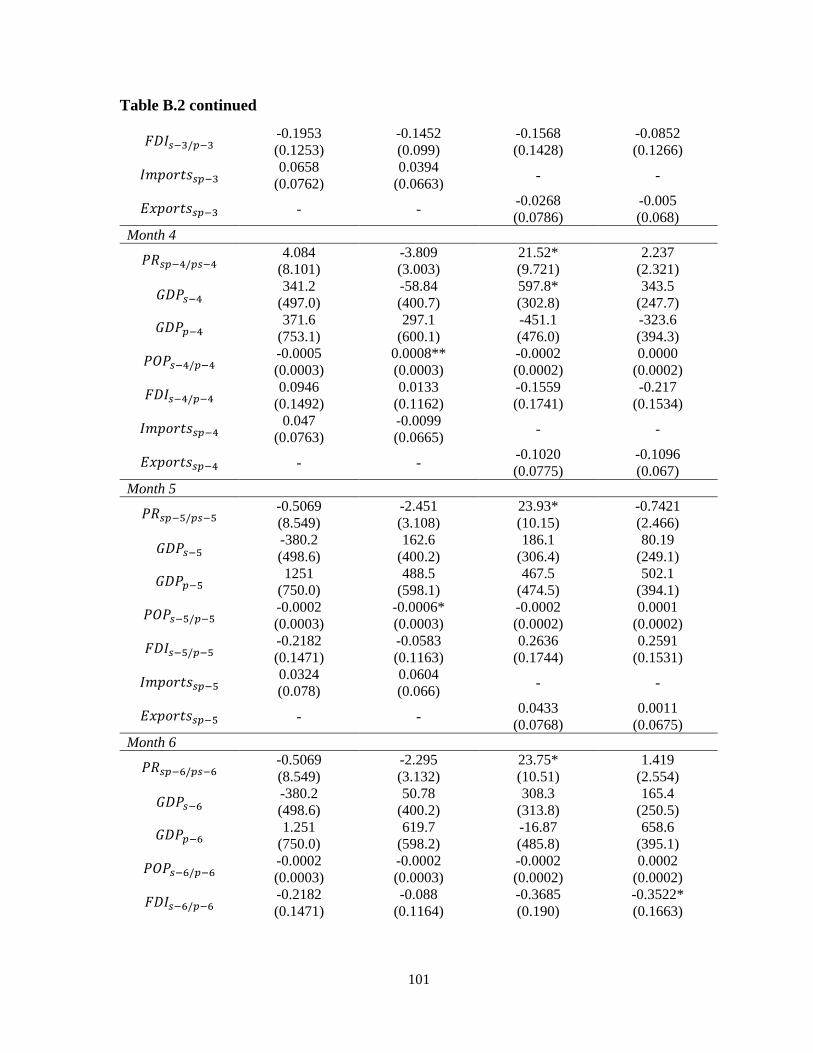
101
Table B.2 continued
𝐹𝐷𝐼𝑠−3/𝑝−3 -0.1953
(0.1253)
-0.1452
(0.099)
-0.1568
(0.1428)
-0.0852
(0.1266)
𝐼𝑚𝑝𝑜𝑟𝑡𝑠𝑠𝑝−3 0.0658
(0.0762)
0.0394
(0.0663) - -
𝐸𝑥𝑝𝑜𝑟𝑡𝑠𝑠𝑝−3 - - -0.0268
(0.0786)
-0.005
(0.068)
Month 4
𝑃𝑅𝑠𝑝−4/𝑝𝑠−4 4.084
(8.101)
-3.809
(3.003)
21.52*
(9.721)
2.237
(2.321)
𝐺𝐷𝑃𝑠−4 341.2
(497.0)
-58.84
(400.7)
597.8*
(302.8)
343.5
(247.7)
𝐺𝐷𝑃𝑝−4 371.6
(753.1)
297.1
(600.1)
-451.1
(476.0)
-323.6
(394.3)
𝑃𝑂𝑃𝑠−4/𝑝−4 -0.0005
(0.0003)
0.0008**
(0.0003)
-0.0002
(0.0002)
0.0000
(0.0002)
𝐹𝐷𝐼𝑠−4/𝑝−4 0.0946
(0.1492)
0.0133
(0.1162)
-0.1559
(0.1741)
-0.217
(0.1534)
𝐼𝑚𝑝𝑜𝑟𝑡𝑠𝑠𝑝−4 0.047
(0.0763)
-0.0099
(0.0665) - -
𝐸𝑥𝑝𝑜𝑟𝑡𝑠𝑠𝑝−4 - - -0.1020
(0.0775)
-0.1096
(0.067)
Month 5
𝑃𝑅𝑠𝑝−5/𝑝𝑠−5 -0.5069
(8.549)
-2.451
(3.108)
23.93*
(10.15)
-0.7421
(2.466)
𝐺𝐷𝑃𝑠−5 -380.2
(498.6)
162.6
(400.2)
186.1
(306.4)
80.19
(249.1)
𝐺𝐷𝑃𝑝−5 1251
(750.0)
488.5
(598.1)
467.5
(474.5)
502.1
(394.1)
𝑃𝑂𝑃𝑠−5/𝑝−5 -0.0002
(0.0003)
-0.0006*
(0.0003)
-0.0002
(0.0002)
0.0001
(0.0002)
𝐹𝐷𝐼𝑠−5/𝑝−5 -0.2182
(0.1471)
-0.0583
(0.1163)
0.2636
(0.1744)
0.2591
(0.1531)
𝐼𝑚𝑝𝑜𝑟𝑡𝑠𝑠𝑝−5 0.0324
(0.078)
0.0604
(0.066) - -
𝐸𝑥𝑝𝑜𝑟𝑡𝑠𝑠𝑝−5 - - 0.0433
(0.0768)
0.0011
(0.0675)
Month 6
𝑃𝑅𝑠𝑝−6/𝑝𝑠−6 -0.5069
(8.549)
-2.295
(3.132)
23.75*
(10.51)
1.419
(2.554)
𝐺𝐷𝑃𝑠−6 -380.2
(498.6)
50.78
(400.2)
308.3
(313.8)
165.4
(250.5)
𝐺𝐷𝑃𝑝−6 1.251
(750.0)
619.7
(598.2)
-16.87
(485.8)
658.6
(395.1)
𝑃𝑂𝑃𝑠−6/𝑝−6 -0.0002
(0.0003)
-0.0002
(0.0003)
-0.0002
(0.0002)
0.0002
(0.0002)
𝐹𝐷𝐼𝑠−6/𝑝−6 -0.2182
(0.1471)
-0.088
(0.1164)
-0.3685
(0.190)
-0.3522*
(0.1663)

102
Table B.2 continued
𝐼𝑚𝑝𝑜𝑟𝑡𝑠𝑠𝑝−6 0.0324
(0.078)
0.114
(0..0665) - -
𝐸𝑥𝑝𝑜𝑟𝑡𝑠𝑠𝑝−6 - - 0.1328
(0.0758)
0.1597*
(0.6732)
Month 7
𝑃𝑅𝑠𝑝−7/𝑝𝑠−7 -2.208
(8.408)
-3.929
(3.137)
17.64
(10.73)
-0.4471
(2.611)
𝐺𝐷𝑃𝑠−7 390.6
(502.6)
50.72
(406.7)
108.7
(310.6)
150.8
(247.9)
𝐺𝐷𝑃𝑝−7 627.8
(746.3)
371.2
(593.7)
-429.3
(485.2)
-133.5
(392.9)
𝑃𝑂𝑃𝑠−7/𝑝−7 -0.0004
(0.0003)
-0.0009**
(0.0003)
-0.0002
(0.0002)
-0.0002
(0.0002)
𝐹𝐷𝐼𝑠−7/𝑝−7 0.0132
(0.1447)
-0.003
(0.1122)
0.0342
(0.1850)
0.14
(0.1623)
𝐼𝑚𝑝𝑜𝑟𝑡𝑠𝑠𝑝−7 -0.1532
(0.0779)
-0.0608
(0.0675) - -
𝐸𝑥𝑝𝑜𝑟𝑡𝑠𝑠𝑝−7 - - -1.176
(0.0756)
-0.1703*
(0.0675)
Month 8
𝑃𝑅𝑠𝑝−8/𝑝𝑠−8 10.56
(8.50)
0.0831
(3.104)
20.51
(10.62)
0.1355
(2.599)
𝐺𝐷𝑃𝑠−8 -132.8
(503.3)
-117.0
(403.3)
-46.58
(311.9)
-20.25
(244.2)
𝐺𝐷𝑃𝑝−8 561.7
(745.8)
174.9
(591.1)
-22.82
(484.2)
310.4
(383.6)
𝑃𝑂𝑃𝑠−8/𝑝−8 -0.0001
(0.0002)
-0.0007**
(0.0003)
-0.0001
(0.0002)
0.0001
(0.0002)
𝐹𝐷𝐼𝑠−8/𝑝−8 -0.0499
(0.1443)
0.0649
(0.1123)
0.0643
(0.1847)
0.1669
(0.1615)
𝐼𝑚𝑝𝑜𝑟𝑡𝑠𝑠𝑝−8 -0.0675
(0.0797)
-0.0815
(0.0679) -
𝐸𝑥𝑝𝑜𝑟𝑡𝑠𝑠𝑝−8 - - 0.0230
(0.0775)
0.0137
(0.069)
Month 9
𝑃𝑅𝑠𝑝−9/𝑝𝑠−9 6.109
(8.429)
-1.873
(2.959)
7.910
(10.17)
-4.290
(2.531)
𝐺𝐷𝑃𝑠−9 723.3
(490.3)
909.1*
(399.5)
363.4
(305.0)
317.2
(243.1)
𝐺𝐷𝑃𝑝−3 321.8
(727.0)
-715.8
(583.0)
-188.3
(493.1)
-16.71
(384.1)
𝑃𝑂𝑃𝑠−9/𝑝−9 0.0001
(0.0003)
-0.0002
(0.0003)
0.0002
(0.0002)
0.0003*
(0.0002)
𝐹𝐷𝐼𝑠−9/𝑝−9 -0.1166
(0.1432)
-0.0645
(0.112)
-0.099
(0.2169)
-0.2202
(0.1887)
𝐼𝑚𝑝𝑜𝑟𝑡𝑠𝑠𝑝−9 -0.0005
(0.078)
-0.1024
(0.0682) - -

103
Table B.2 continued
𝐸𝑥𝑝𝑜𝑟𝑡𝑠𝑠𝑝−9 - - -0.1401
(0.0773)
-0.1549*
(0.0682)
Month 10
𝑃𝑅𝑠𝑝−10/𝑝𝑠−10 14.55
(8.414)
-3.696
(2.788)
-5.166
(9.587)
-2.223
(2.370)
𝐺𝐷𝑃𝑠−10 627.7
(500.1)
704.2
(412.3)
376.5
(310.8)
357.6
(247.4)
𝐺𝐷𝑃𝑝−10 244.6
(722.9)
-123.8
(588.7)
424.0
(516.1)
-36.51
(393.8)
𝑃𝑂𝑃𝑠−10/𝑝−10 -0.0009**
(0.0003)
-0.0007*
(0.0003)
-0.00004
(0.0002)
0.0001
(0.0002)
𝐹𝐷𝐼𝑠−10/𝑝−10 0.0165
(0.120)
0.1099
(0.0959)
0.0933
(0.1453)
0.1936
(0.1275)
𝐼𝑚𝑝𝑜𝑟𝑡𝑠𝑠𝑝−10 -0.2137**
(0.07847)
-0.2304***
(0.0683) - -
𝐸𝑥𝑝𝑜𝑟𝑡𝑠𝑠𝑝−10 - - -0.0666
(0.079)
-0.0621
(0.0693)
Month 11
𝑃𝑅𝑠𝑝−11/𝑝𝑠−11 11.22
(8.450)
-1.739
(2.456)
-2.655
(8.448)
-0.849
(2.078)
𝐺𝐷𝑃𝑠−11 89.02
(498.8)
352.0
(406.4)
22.71
(307.3)
54.85
(247.0)
𝐺𝐷𝑃𝑝−11 634.2
(754.0)
855.3
(588.2)
329.6
(528.5)
462.7
(393.0)
𝑃𝑂𝑃𝑠−11/𝑝−11 -0.0003
(0.0003)
-0.0005*
(0.0003)
0.0001
(0.0002)
0.0002
(0.0002)
𝐹𝐷𝐼𝑠−11/𝑝−11 -0.0213
(0.1215)
0.0817
(0.0976)
-0.0877
(0.1463)
-0.0221
(0.1287)
𝐼𝑚𝑝𝑜𝑟𝑡𝑠𝑠𝑝−11 -0.1631*
(0.0741)
-0.1573*
(0.0686) - -
𝐸𝑥𝑝𝑜𝑟𝑡𝑠𝑠𝑝−11 - - 0.0657
(0.0757)
0.0749
(0.0641)
Month 12
𝑃𝑅𝑠𝑝−12/𝑝𝑠−12 -15.75
(8.055)
2.30
(1.911)
3.142
(6.452)
-0.0023
(1.518)
𝐺𝐷𝑃𝑠−12 395.3
(494.8)
21.67
(407.2)
43.13
(304.9)
18.95
(244.1)
𝐺𝐷𝑃𝑝−12 790.3
(798.2)
1057
(611.5)
-28.13
(529.2)
-46.80
(390.8)
𝑃𝑂𝑃𝑠−12/𝑝−12 -0.001
(0.0003)
-0.0013***
(0.0003)
0.0001
(0.0002)
-0.0003*
(0.0002)
𝐹𝐷𝐼𝑠−12/𝑝−12 -0.0466
(0.1224)
-0.2084*
(0.0982)
0.1516
(0.2101)
-0.026
(0.1831)
𝐼𝑚𝑝𝑜𝑟𝑡𝑠𝑠𝑝−12 0.1527*
(0.0718)
0.1463*
(0.0642) - -
𝐸𝑥𝑝𝑜𝑟𝑡𝑠𝑠𝑝−12 - - 0.1271
(0.0723)
0.140*
(0.0616)

104
Table B.2 continued
Observations 335 335 335 335
R-Squared 0.5408 0.6349 0.4068 0.4914
Note: Results of the VAR model estimating. Each estimator for imports and exports is run separately.
*** significant 1%; **significant 5%; *significant 10%

105
Table B.3 Results of the VAR model - South Korea’s trade with Russia
(1)
Imports
GDELT
(Political
Relations Score)
(2)
Imports
GDELT
(Negative events)
(3)
Exports
GDELT
(Political
Relations Score)
(4)
Exports
GDELT
(Negative events)
s = South Korea, p = Russia
Month 1
𝑃𝑅𝑠𝑝−1/𝑝𝑠−1 -1.663
(4.479)
-4.875
(4.367)
-1.559
(3.045)
-4.720
(2.586)
𝐺𝐷𝑃𝑠−1 -801.3
(526.1)
323.5
(188.8)
-249.1
(261.2)
8.619
(198.1)
𝐺𝐷𝑃𝑝−1 535.1*
(247.5)
-91.94
(117.7)
15.36
(203.8)
69.11
(167.3)
𝑃𝑂𝑃𝑠−1/𝑝−1 -0.0004*
(0.0002)
-0.0002*
(0.0001)
-0.0001
(0.0001)
0.0000
(0.0001)
𝐹𝐷𝐼𝑠−1/𝑝−1 -0.8515
(1.693)
2.506*
(1.127)
-0.0265
(0.4206)
0.6276
(0.3423)
𝐼𝑚𝑝𝑜𝑟𝑡𝑠𝑠𝑝−1 -0.2572*
(0.1083)
-0.5121***
(0.0693) - -
𝐸𝑥𝑝𝑜𝑟𝑡𝑠𝑠𝑝−1 - - -0.3580***
(0.0923)
-0.5044***
(0.0686)
Month 2
𝑃𝑅𝑠𝑝−2/𝑝𝑠−2 0.5542
(4.858)
-2.080
(5.549)
-5.782
(3.363)
7.057*
(3.446)
𝐺𝐷𝑃𝑠−2 580.2
(520.3)
94.33
(188.9)
150.6
(248.9)
-54.13
(198.6)
𝐺𝐷𝑃𝑝−2 22.80
(251.5)
152.8
(116.8)
267.9
(198.0)
300.6
(167.1)
𝑃𝑂𝑃𝑠−2/𝑝−2 0.0000
(0.0002)
0.0001
(0.0001)
-0.0001
(0.0001)
0.0001
(0.0001)
𝐹𝐷𝐼𝑠−2/𝑝−2 0.8033
(1.677)
-1.299
(1.139)
-0.1942
(0.4278)
-0.6617
(0.3448)
𝐼𝑚𝑝𝑜𝑟𝑡𝑠𝑠𝑝−2 -0.1719
(0.1099)
-0.1662*
(0.0771) - -
𝐸𝑥𝑝𝑜𝑟𝑡𝑠𝑠𝑝−2 - - -0.1779
(0.0997)
-0.2737***
(0.0783)
Month 3
𝑃𝑅𝑠𝑝−3/𝑝𝑠−3 4.769
(4.829)
8.319
(6.451)
1.744
(3.486)
-9.445*
(4.145)
𝐺𝐷𝑃𝑠−3 -716.1
(480.9)
-127.7
(188.6)
-204.1
(247.6)
2.560
(198.6)
𝐺𝐷𝑃𝑝−3 275.9
(251.5)
90.97
(117.3)
-168.7
(199.5)
108.7
(168.1)
𝑃𝑂𝑃𝑠−3/𝑝−3 -0.0001
(0.0002)
0.0000
(0.0001)
-0.0001
(0.0001)
0.0000
(0.0001)

106
Table B.3 continued
𝐹𝐷𝐼𝑠−3/𝑝−3 1.267
(1.577)
-1.115
(1.144)
0.9023*
(0.4090)
-0.2581
(0.3508)
𝐼𝑚𝑝𝑜𝑟𝑡𝑠𝑠𝑝−3 -0.3321**
(0.1131)
-0.1676*
(0.0792) - -
𝐸𝑥𝑝𝑜𝑟𝑡𝑠𝑠𝑝−3 - - -0.0799
(0.1030)
-0.1339
(0.0846)
Month 4
𝑃𝑅𝑠𝑝−4/𝑝𝑠−4 -1.685
(4.848)
13.81
(7.076)
-4.059
(3.588)
-7.718
(4.680)
𝐺𝐷𝑃𝑠−4 338.7
(488.9)
190.1
(188.8)
12.31
(248.9)
242.3
(197.9)
𝐺𝐷𝑃𝑝−4 377.8
(250.8)
69.19
(118.1)
270.9
(199.2)
376.4
(164.3)
𝑃𝑂𝑃𝑠−4/𝑝−4 0.0001
(0.0002)
0.0001
(0.0001)
0.0000
(0.0001)
0.0001
(0.0001)
𝐹𝐷𝐼𝑠−4/𝑝−4 1.470
(1.508)
3.944**
(1.381)
0.1591
(0.4232)
0.5297
(0.3512)
𝐼𝑚𝑝𝑜𝑟𝑡𝑠𝑠𝑝−4 -0.0222
(0.1172)
-0.0911
(0.0796) - -
𝐸𝑥𝑝𝑜𝑟𝑡𝑠𝑠𝑝−4 - - -0.0607
(0.1036)
-0.1393
(0.0853)
Month 5
𝑃𝑅𝑠𝑝−5/𝑝𝑠−5 3.711
(4.877)
8.259
(7.981)
-0.7753
(3.578)
-6.055
(4.920)
𝐺𝐷𝑃𝑠−5 -546.2
(478.0)
172.3
(189.2)
337.0
(253.8)
28.09
(198.5)
𝐺𝐷𝑃𝑝−5 97.37
(242.6)
-37.90
(118.1)
-178.5
(198.7)
29.10
(166.1)
𝑃𝑂𝑃𝑠−5/𝑝−5 0.0000
(0.0002)
-0.0001
(0.0001)
-0.0000
(0.0001)
-0.0001
(0.0001)
𝐹𝐷𝐼𝑠−5/𝑝−5 3.020*
(1.50)
2.921*
(1.407)
1.451**
(0.4297)
-0.0872
(0.3517)
𝐼𝑚𝑝𝑜𝑟𝑡𝑠𝑠𝑝−5 -0.0687
(0.1168)
-0.0936
(0.0796) - -
𝐸𝑥𝑝𝑜𝑟𝑡𝑠𝑠𝑝−5 - - 0.0579
(0.1025)
0.1042
(0.0856)
Month 6
𝑃𝑅𝑠𝑝−6/𝑝𝑠−6 -3.253
(4.809)
7.654
(8.292)
0.1561
(3.615)
-0.7810
(4.995)
𝐺𝐷𝑃𝑠−6 287.6
(537.3)
-18.01
(189.4)
-77.68
(199.9)
-72.28
(198.4)
𝐺𝐷𝑃𝑝−6 -379.1
(253.6)
-28.21
(116.2)
56.0
(152.9)
37.48
(166.3)
𝑃𝑂𝑃𝑠−6/𝑝−6 0.0002
(0.0002)
0.0001
(0.0001)
-0.0001
(0.0001)
0.0001
(0.0001)

107
Table B.3 continued
𝐹𝐷𝐼𝑠−6/𝑝−6 1.219
(1.547)
0.9201
(1.427)
1.075*
(0.4578)
0.1717
(0.3476)
𝐼𝑚𝑝𝑜𝑟𝑡𝑠𝑠𝑝−6 0.2143
(0.118)
-0.0103
(0.079) - -
𝐸𝑥𝑝𝑜𝑟𝑡𝑠𝑠𝑝−6 - - -0.1359
(0.1019)
-0.059
(0.0862)
Month 7
𝑃𝑅𝑠𝑝−7/𝑝𝑠−7 -2.869
(4.847)
5.238
(8.413)
-3.090
(3.603)
-2.014
(5.023)
𝐺𝐷𝑃𝑠−7 632.3
(527.0)
-300.3
(193.5)
199.5
(202.5)
-97.80
(201.7)
𝐺𝐷𝑃𝑝−7 16.57
(240.6)
134.2
(114.7)
174.8
(153.2)
-50.40
(170.4)
𝑃𝑂𝑃𝑠−7/𝑝−7 0.0002
(0.0002)
0.0001
(0.0001)
0.0000
(0.0001)
-0.0000
(0.0001)
𝐹𝐷𝐼𝑠−7/𝑝−7 -1.476
(1.544)
1.895
(1.417)
0.7647
(0.4605)
0.0458
(0.3573)
𝐼𝑚𝑝𝑜𝑟𝑡𝑠𝑠𝑝−7 0.2352*
(0.1184)
-0.1124
(0.0794) - -
𝐸𝑥𝑝𝑜𝑟𝑡𝑠𝑠𝑝−7 - - -0.2038*
(0.1006)
-0.0890
(0.0865)
Month 8
𝑃𝑅𝑠𝑝−8/𝑝𝑠−8 0.1967
(4.929)
11.35
(8.188)
1.924
(3.570)
-0.7266
(4.941)
𝐺𝐷𝑃𝑠−8 -1203*
(515.7)
-111.9
(184.2)
-65.02
(245.6)
145.3
(195.5)
𝐺𝐷𝑃𝑝−8 -162.8
(229.3)
7.909
(113.5)
-49.51
(166.7)
31.55
(149.6)
𝑃𝑂𝑃𝑠−8/𝑝−8 -0.0001
(-0.0002)
0.0000
(0.0001)
0.0000
(0.0001)
-0.0000
(0.0001)
𝐹𝐷𝐼𝑠−8/𝑝−8 2.664
(1.587)
0.2083
(1.422)
-0.1395
(0.4425)
0.3383
(0.3570)
𝐼𝑚𝑝𝑜𝑟𝑡𝑠𝑠𝑝−8 -0.0793
(0.1214)
-0.0812
(0.0789) - -
𝐸𝑥𝑝𝑜𝑟𝑡𝑠𝑠𝑝−8 - - -0.2787**
(0.1001)
-0.2586
(0.0884)
Month 9
𝑃𝑅𝑠𝑝−9/𝑝𝑠−9 -1.920
(4.678)
8.999
(7.832)
-4.543
(3.731)
-0.9840
(4.698)
𝐺𝐷𝑃𝑠−9 -240.4
(527.0)
338.2
(183.7)
154.5
(244.2)
9.026
(195.0)
𝐺𝐷𝑃𝑝−3 -116.6
(229.8)
-32.0
(113.5)
15.46
(162.4)
-34.52
(148.8)
𝑃𝑂𝑃𝑠−9/𝑝−9 0.0005**
(0.0002)
-0.0000
(0.0001)
-0.0001
(0.0001)
-0.0000
(0.0001)
𝐹𝐷𝐼𝑠−9/𝑝−9 -2.167
(1.603)
0.8457
(1.421)
0.4924
(0.4492)
-0.2626
(0.3611)

108
Table B.3 continued
𝐼𝑚𝑝𝑜𝑟𝑡𝑠𝑠𝑝−9 0.0393
(0.1184)
0.0222
(0.0766) - -
𝐸𝑥𝑝𝑜𝑟𝑡𝑠𝑠𝑝−9 - - -0.1612
(0.1053)
-0.2210
(0.0867)
Month 10
𝑃𝑅𝑠𝑝−10/𝑝𝑠−10 8.910
(4.699)
-0.8959
(7.265)
-8.371*
(3.530)
-0.9887
(4.260)
𝐺𝐷𝑃𝑠−10 324.1
(528.1)
163.0
(184.6)
-61.29
(240.0)
144.9
(195.4)
𝐺𝐷𝑃𝑝−10 -58.0
(232.2)
74.92
(112.2)
146.0
(160.1)
-9.425
(146.6)
𝑃𝑂𝑃𝑠−10/𝑝−10 0.0000
(0.0002)
0.0000
(0.0001)
0.0000
(0.0001)
-0.0000
(0.0001)
𝐹𝐷𝐼𝑠−10/𝑝−10 3.107
(1.605)
-1.742
(1.209)
-0.297
(0.4377)
0.2453
(0.3609)
𝐼𝑚𝑝𝑜𝑟𝑡𝑠𝑠𝑝−10 0.1536
(0.1152)
-0.0866
(0.0755) - -
𝐸𝑥𝑝𝑜𝑟𝑡𝑠𝑠𝑝−10 - - -0.0676
(0.1050)
-0.1905
(0.0853)
Month 11
𝑃𝑅𝑠𝑝−11/𝑝𝑠−11 2.20
(4.722)
-0.9237
(6.181)
-9.091*
(3.567)
0.6394
(3.667)
𝐺𝐷𝑃𝑠−11 105.0
(531.3)
-88.31
(185.9)
-12.96
(243.9)
245.4
(195.7)
𝐺𝐷𝑃𝑝−11 -277.5
(244.0)
-162.3
(110.7)
-20.62
(163.4)
48.04
(143.8)
𝑃𝑂𝑃𝑠−11/𝑝−11 0.0002
(0.0002)
0.0000
(0.0001)
0.0000
(0.0001)
-0.0000
(0.0001)
𝐹𝐷𝐼𝑠−11/𝑝−11 -6.208***
(1.607)
1.999
(1.211)
0.0292
(0.4369)
-0.6885
(0.3615)
𝐼𝑚𝑝𝑜𝑟𝑡𝑠𝑠𝑝−11 -0.1321
(0.1272)
-0.0985
(0.0757) - -
𝐸𝑥𝑝𝑜𝑟𝑡𝑠𝑠𝑝−11 - - 0.0515
(0.1050)
-0.0021
(0.0803)
Month 12
𝑃𝑅𝑠𝑝−12/𝑝𝑠−12 -0.7913
(4.544)
-3.574
(4.896)
-0.9909
(3.287)
1.427
(2.880)
𝐺𝐷𝑃𝑠−12 -331.0
(530.5)
64.98
(184.6)
115.3
(247.3)
57.76
(197.2)
𝐺𝐷𝑃𝑝−12 307.5
(242.0)
91.35
(112.1)
302.0
(165.1)
116.1
(143.1)
𝑃𝑂𝑃𝑠−12/𝑝−12 -0.0002
(0.0002)
0.0000
(0.0001)
0.0001
(0.0001)
0.0000
(0.0001)
𝐹𝐷𝐼𝑠−12/𝑝−12 3.128
(1.707)
1.497
(1.226)
0.8445
(0.4456)
0.0968
(0.3664)
𝐼𝑚𝑝𝑜𝑟𝑡𝑠𝑠𝑝−12 -0.0096
(0.1252)
-0.0038
(0.0685) - -

109
Table B.3 continued
𝐸𝑥𝑝𝑜𝑟𝑡𝑠𝑠𝑝−12 - - 0.0096
(0.0963)
0.1261
(0.0707)
Observations 335 335 335 335
R-Squared 0.6344 0.5195 0.4675 0.4576
Note: Results of the VAR model estimating. Each estimator for imports and exports is run separately.
*** significant 1%; **significant 5%; *significant 10%

110
Table B.4 Results of the VAR model - South Korea’s trade with North Korea
(1)
Imports
GDELT
(Political
Relations Score)
(2)
Imports
GDELT
(Negative events)
(3)
Exports
GDELT
(Political
Relations Score)
(4)
Exports
GDELT
(Negative events)
s = South Korea, p = North Korea
Month 1
𝑃𝑅𝑠𝑝−1/𝑝𝑠−1 0.1667
(0.4138)
-0.0571*
(0.0247)
1.000*
(0.4920)
-0.2042*
(0.0904)
𝐺𝐷𝑃𝑠−1 19.01
(22.59)
15.48
(20.20)
7.207
(33.61)
15.70
(32.80)
𝐺𝐷𝑃𝑝−1 -77.06
(78.84)
-108.0
(71.42)
-223.6
(117.9)
-237.9*
(109.3)
𝑃𝑂𝑃𝑠−1/𝑝−1 -0.0000
(0.0000)
0.0000
(0.0000)
0.0000
(0.0000)
-0.0001
(0.0001)
𝐹𝐷𝐼𝑠−1/𝑝−1 - - - -
𝐼𝑚𝑝𝑜𝑟𝑡𝑠𝑠𝑝−1 -0.1904**
()
-0.1886**
(-0.0571) - -
𝐸𝑥𝑝𝑜𝑟𝑡𝑠𝑠𝑝−1 - - -0.5050***
(0.0647)
-0.5322***
(0.0636)
Month 2
𝑃𝑅𝑠𝑝−2/𝑝𝑠−2 0.3615
(0.5075)
-0.0351
(0.0266)
1.177
(0.610)
-0.3476*
(0.1347)
𝐺𝐷𝑃𝑠−2 7.920
(22.56)
2.533
(20.24)
0.7417
(33.73)
5.762
(32.88)
𝐺𝐷𝑃𝑝−2 25.13
(79.11)
27.50
(71.63)
-36.57
(118.9)
-103.8
(110.7)
𝑃𝑂𝑃𝑠−2/𝑝−2 0.0000
(0.0000)
0.0000
(0.0000)
-0.0000
(0.0000)
-0.0001
(0.0001)
𝐹𝐷𝐼𝑠−2/𝑝−2 - - - -
𝐼𝑚𝑝𝑜𝑟𝑡𝑠𝑠𝑝−2 -0.028
(0.0658)
-0.1114
(0.0681) - -
𝐸𝑥𝑝𝑜𝑟𝑡𝑠𝑠𝑝−2 - - -0.2778***
(0.0724)
-0.3785***
(0.073)
Month 3
𝑃𝑅𝑠𝑝−3/𝑝𝑠−3 1.301*
(0.5653)
-0.0638*
(0.0289)
-0.1191
(0.6902)
-0.4849**
(0.1759)
𝐺𝐷𝑃𝑠−3 -12.71
(22.48)
-9.318
(2.019)
23.00
(33.48)
27.78
(32.87)
𝐺𝐷𝑃𝑝−3 8.402
(77.59)
10.48
(71.49)
80.82
(110.0)
12.84
(110.5)
𝑃𝑂𝑃𝑠−3/𝑝−3 -0.0000
(0.0000)
-0.0000
(0.0000)
-0.0000
(0.0000)
-0.0001*
(0.0001)

111
Table B.4 continued
𝐹𝐷𝐼𝑠−3/𝑝−3 - - - -
𝐼𝑚𝑝𝑜𝑟𝑡𝑠𝑠𝑝−3 -0.1261
(0.066)
-0.1795**
(0.0683) - -
𝐸𝑥𝑝𝑜𝑟𝑡𝑠𝑠𝑝−3 - - -0.0658
(0.0751)
-0.1811*
(0.0778)
Month 4
𝑃𝑅𝑠𝑝−4/𝑝𝑠−4 0.1901
(0.6127)
0.0236
(0.0303)
-0.4782
(0.7023)
-0.5281*
(0.2096)
𝐺𝐷𝑃𝑠−4 -1.720
(22.47)
3.087
(20.20)
3.770
(33.64)
7.409
(32.91)
𝐺𝐷𝑃𝑝−4 81.81
(77.81)
13.58
(71.54)
163.3
(110.0)
99.70
(110.0)
𝑃𝑂𝑃𝑠−4/𝑝−4 -0.0000
(0.0000)
-0.0000
(0.0000)
-0.0001
(0.0000)
-0.0001
(0.0001)
𝐹𝐷𝐼𝑠−4/𝑝−4 - - - -
𝐼𝑚𝑝𝑜𝑟𝑡𝑠𝑠𝑝−4 -0.0006
(0.0665)
0.0334
(0.0693) - -
𝐸𝑥𝑝𝑜𝑟𝑡𝑠𝑠𝑝−4 - - -0.1726*
(0.0748)
-0.2696***
(0.0783)
Month 5
𝑃𝑅𝑠𝑝−5/𝑝𝑠−5 0.2535
(0.6313)
-0.0647*
(0.0309)
-0.0269
(0.7177)
-0.5939*
(0.2328)
𝐺𝐷𝑃𝑠−5 -0.0894
(22.46)
-7.371
(20.19)
38.74
(33.69)
38.35
(32.90)
𝐺𝐷𝑃𝑝−5 -55.55
(78.07)
-59.32
(71.70)
-78.56
(110.3)
-95.71
(110.2)
𝑃𝑂𝑃𝑠−5/𝑝−5 0.0000
(0.0000)
0.0000
(0.0000)
-0.0000
(0.0000)
-0.0001
(0.0001)
𝐹𝐷𝐼𝑠−5/𝑝−5 - - - -
𝐼𝑚𝑝𝑜𝑟𝑡𝑠𝑠𝑝−5 0.022
(0.0662)
-0.0074
(0.0693) - -
𝐸𝑥𝑝𝑜𝑟𝑡𝑠𝑠𝑝−5 - - -0.2638***
(0.0749)
-0.350***
(0.0792)
Month 6
𝑃𝑅𝑠𝑝−6/𝑝𝑠−6 0.6418
(0.6379)
-0.0377
(0.0326)
0.2999
(0.7140)
-0.5160*
(0.2454)
𝐺𝐷𝑃𝑠−6 -6.774
(22.44)
3.231
(20.19)
-0.6760
(33.85)
-5.279
(33.28)
𝐺𝐷𝑃𝑝−6 -27.62
(78.14)
0.5533
(71.49)
4.623
(112.2)
-77.03
(110.1)
𝑃𝑂𝑃𝑠−6/𝑝−6 0.0000
(0.0000)
0.0000
(0.0000)
-0.0000
(0.0000)
-0.0001
(0.0001)
𝐹𝐷𝐼𝑠−6/𝑝−6 - - - -
𝐼𝑚𝑝𝑜𝑟𝑡𝑠𝑠𝑝−6 -0.0998
(0.0662)
-0.1195
(0.0699) - -

112
Table B.4 continued
𝐸𝑥𝑝𝑜𝑟𝑡𝑠𝑠𝑝−6 - - -0.1757*
(0.0768)
-0.2594**
(0.0810)
Month 7
𝑃𝑅𝑠𝑝−7/𝑝𝑠−7 0.1313
(0.6436)
-0.0443
(0.0326)
0.3898
(0.7138)
-0.1435
(0.2468)
𝐺𝐷𝑃𝑠−7 -9.378
(22.47)
-6.717
(20.22)
20.61
(33.88)
35.74
(33.34)
𝐺𝐷𝑃𝑝−7 33.66
(78.19)
2.601
(71.47)
-29.77
(112.1)
-73.78
(110.0)
𝑃𝑂𝑃𝑠−7/𝑝−7 0.0000
(0.0000)
0.0000
(0.0000)
-0.0000
(0.0000)
-0.0001
(0.0001)
𝐹𝐷𝐼𝑠−7/𝑝−7 - - - -
𝐼𝑚𝑝𝑜𝑟𝑡𝑠𝑠𝑝−7 -0.0651
(0.0660)
-0.0627
(0.0696) - -
𝐸𝑥𝑝𝑜𝑟𝑡𝑠𝑠𝑝−7 - - -0.1442
(0.0769)
-0.2075*
(0.0819)
Month 8
𝑃𝑅𝑠𝑝−8/𝑝𝑠−8 0.0302
(0.6419)
-0.0772*
(0.0325)
0.3646
(0.7032)
-0.0528
(0.2421)
𝐺𝐷𝑃𝑠−8 0.5859
(22.36)
-8.549
(20.18)
2.823
(33.91)
34.75
(33.43)
𝐺𝐷𝑃𝑝−8 40.05
(78.14)
57.04
(71.42)
-183.5
(111.8)
-150.7
(110.8)
𝑃𝑂𝑃𝑠−8/𝑝−8 0.0000
(0.0000)
-0.0000
(0.0000)
0.0000
(0.0000)
-0.0000
(0.0000)
𝐹𝐷𝐼𝑠−8/𝑝−8 - - - -
𝐼𝑚𝑝𝑜𝑟𝑡𝑠𝑠𝑝−8 -0.0493
(0.066)
-0.0855
(0.0688) - -
𝐸𝑥𝑝𝑜𝑟𝑡𝑠𝑠𝑝−8 - - -0.1398
(0.0758)
-0.1951*
(0.0804)
Month 9
𝑃𝑅𝑠𝑝−9/𝑝𝑠−9 0.4296
(0.6232)
0.0248
(0.0331)
0.3414
(0.6791)
0.0695
(0.2377)
𝐺𝐷𝑃𝑠−9 16.27
(22.36)
12.08
(20.19)
-18.86
(33.70)
-5.880
(33.35)
𝐺𝐷𝑃𝑝−3 37.78
(77.60)
51.30
(71.23)
-2.211
(112.3)
-49.84
(110.5)
𝑃𝑂𝑃𝑠−9/𝑝−9 0.0000
(0.0000)
0.0000
(0.0000)
-0.0000
(0.0000)
-0.0001
(0.0001)
𝐹𝐷𝐼𝑠−9/𝑝−9 - - - -
𝐼𝑚𝑝𝑜𝑟𝑡𝑠𝑠𝑝−9 0.0288
(0.0661)
0.0305
(0.0696) - -
𝐸𝑥𝑝𝑜𝑟𝑡𝑠𝑠𝑝−9 - - -0.1008
(0.0759)
-0.1624*
(0.0801)

113
Table B.4 continued
Month 10
𝑃𝑅𝑠𝑝−10/𝑝𝑠−10 0.6439
(0.5855)
-0.0434
(0.033)
-0.0294
(0.6601)
-0.0954
(0.2270)
𝐺𝐷𝑃𝑠−10 10.14
(22.34)
8.433
(20.23)
0.0521
(33.71)
10.54
(33.38)
𝐺𝐷𝑃𝑝−10 24.47
(77.91)
31.10
(71.43)
0.7288
(112.6)
-56.98
(110.3)
𝑃𝑂𝑃𝑠−10/𝑝−10 -0.0000
(0.0000)
-0.0000
(0.0000)
-0.0000
(0.0000)
-0.0001
(0.0001)
𝐹𝐷𝐼𝑠−10/𝑝−10 - - - -
𝐼𝑚𝑝𝑜𝑟𝑡𝑠𝑠𝑝−10 -0.0285
(0.0656)
0.0232
(0.0682) - -
𝐸𝑥𝑝𝑜𝑟𝑡𝑠𝑠𝑝−10 - - -0.065
(0.0784)
-0.1263
(0.0812)
Month 11
𝑃𝑅𝑠𝑝−11/𝑝𝑠−11 0.5951
(0.5194)
-0.0181
(0.0313)
0.1354
(0.5842)
0.0074
(0.1945)
𝐺𝐷𝑃𝑠−11 -18.31
(22.15)
-13.42
(20.16)
-17.67
(33.65)
-19.34
(33.29)
𝐺𝐷𝑃𝑝−11 -91.40
(78.24)
-82.97
(71.41)
-56.18
(118.5)
-77.37
(110.5)
𝑃𝑂𝑃𝑠−11/𝑝−11 0.0000
(0.0000)
0.0000
(0.0000)
-0.0000
(0.0000)
-0.0001
(0.0001)
𝐹𝐷𝐼𝑠−11/𝑝−11 - - - -
𝐼𝑚𝑝𝑜𝑟𝑡𝑠𝑠𝑝−11 0.005
(0.066)
0.0166
(0.0673) - -
𝐸𝑥𝑝𝑜𝑟𝑡𝑠𝑠𝑝−11 - - -0.0783
(0.0795)
-0.1417
(0.0781)
Month 12
𝑃𝑅𝑠𝑝−12/𝑝𝑠−12 0.1474
(0.4186)
-0.0181
(0.0313)
0.1828
(0.4746)
-0.0872
(0.1462)
𝐺𝐷𝑃𝑠−12 20.02
(22.10)
-13.42
(20.16)
3.365
(33.68)
5.579
(33.26)
𝐺𝐷𝑃𝑝−12 126.2
(78.64)
-82.97
(71.41)
-158.8
(119.4)
-222.8*
(110.1)
𝑃𝑂𝑃𝑠−12/𝑝−12 -0.0000*
(0.0000)
-0.0000
(0.0000)
-0.0000
(0.0000)
-0.0001
(0.0001)
𝐹𝐷𝐼𝑠−12/𝑝−12 - - - -
𝐼𝑚𝑝𝑜𝑟𝑡𝑠𝑠𝑝−12 0.1268
(0.0824)
0.1216
(0.0782) - -
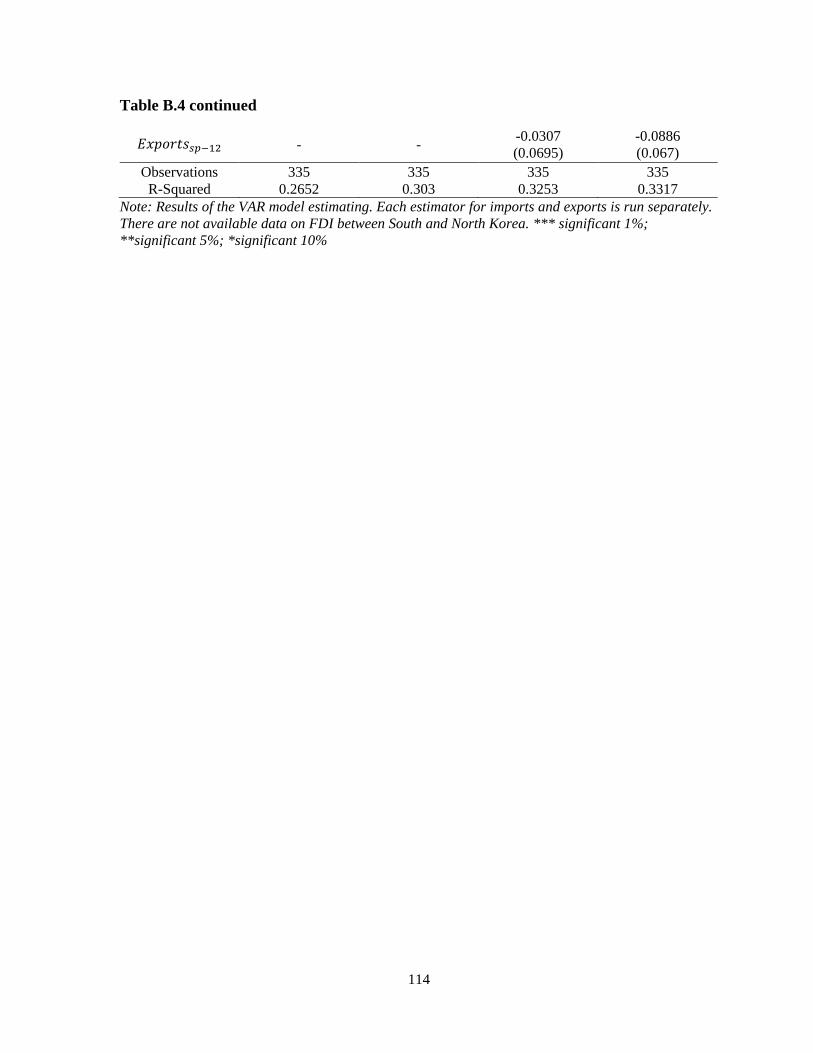
114
Table B.4 continued
𝐸𝑥𝑝𝑜𝑟𝑡𝑠𝑠𝑝−12 - - -0.0307
(0.0695)
-0.0886
(0.067)
Observations 335 335 335 335
R-Squared 0.2652 0.303 0.3253 0.3317
Note: Results of the VAR model estimating. Each estimator for imports and exports is run separately.
There are not available data on FDI between South and North Korea. *** significant 1%;
**significant 5%; *significant 10%

115
BIOGRAPHY OF THE AUTHOR
Mingu Lee was born and raised in South Korea. He graduated from INHA University
in South Korea with a Bachelor’s degree both in Communications and Political Science in
2015. Before joining the School of Global Policy and International Affairs (SPIA) at the
University of Maine, he worked at the International Organization for Migration Research and
Training Centre (IOM-MRTC) in South Korea as an intern. While he studied in SPIA, he
concentrated on studying for the international political economy and security in Northeast
Asia. During the summer in 2017, he was back to the IOM-MRTC as a research fellow, and
recently he is working at UNCDF headquarter in New York as an intern. Mingu is a
candidate for the Master of Arts degree in Global Policy from the University of Maine in
May 2018.