Analysis of the genetic effects of CAPN1 gene...
11
©FUNPEC-RP www.funpecrp.com.br Genetics and Molecular Research 14 (1): 1393-1403 (2015) Analysis of the genetic effects of CAPN1 gene polymorphisms on chicken meat tenderness J.T. Shu*, M. Zhang*, Y.J. Shan, W.J. Xu, K.W. Chen and H.F. Li Institute of Poultry Science, Chinese Academy of Agricultural Science, Yangzhou, Jiangsu, China *These authors contributed equally to this study. Corresponding author: H.F. Li E-mail: [email protected] / [email protected] Genet. Mol. Res. 14 (1): 1393-1403 (2015) Received January 2, 2014 Accepted March 20, 2014 Published February 13, 2015 DOI http://dx.doi.org/10.4238/2015.February.13.18 ABSTRACT. The micromolar calcium-activated neutral protease gene (CAPN1) is a physiological candidate gene for meat tenderness. Four previously identified single nucleotide polymorphism (SNP) markers located within the CAPN1 gene were evaluated for their associations with variation in the meat tenderness of a Chinese indigenous chicken breed, a higher meat quality breed (i.e., Qingyuan partridge chicken), and the commercial Recessive White chicken breed. Warner- Bratzler shear force measurements were used to determine tenderness phenotypes for all animals; intramuscular fat (IMF) content and rate of water loss in the breast muscles were also measured. Genotyping was performed by the polymerase chain reaction-ligase detection reaction method. Polymorphisms were identified for all markers, except CAPN1 2546. The frequency of allele T was zero, and allele C was fixed for CAPN1 2546 in the studied populations. The SNP CAPN1 3535 in the CAPN1 gene was significantly associated with tenderness and other meat quality traits, where animals inheriting the AA genotype had smaller shear force values, lower water loss rates, and higher IMF contents. Moreover, H1 (AAA) was the most advantageous haplotype for meat tenderness. The results of this study confirm some previously documented associations. Furthermore, novel associations have been
Transcript of Analysis of the genetic effects of CAPN1 gene...

©FUNPEC-RP www.funpecrp.com.brGenetics and Molecular Research 14 (1): 1393-1403 (2015)
Analysis of the genetic effects of CAPN1 gene polymorphisms on chicken meat tenderness
J.T. Shu*, M. Zhang*, Y.J. Shan, W.J. Xu, K.W. Chen and H.F. Li
Institute of Poultry Science, Chinese Academy of Agricultural Science, Yangzhou, Jiangsu, China
*These authors contributed equally to this study.Corresponding author: H.F. LiE-mail: [email protected] / [email protected]
Genet. Mol. Res. 14 (1): 1393-1403 (2015)Received January 2, 2014Accepted March 20, 2014Published February 13, 2015DOI http://dx.doi.org/10.4238/2015.February.13.18
ABSTRACT. The micromolar calcium-activated neutral protease gene (CAPN1) is a physiological candidate gene for meat tenderness. Four previously identified single nucleotide polymorphism (SNP) markers located within the CAPN1 gene were evaluated for their associations with variation in the meat tenderness of a Chinese indigenous chicken breed, a higher meat quality breed (i.e., Qingyuan partridge chicken), and the commercial Recessive White chicken breed. Warner-Bratzler shear force measurements were used to determine tenderness phenotypes for all animals; intramuscular fat (IMF) content and rate of water loss in the breast muscles were also measured. Genotyping was performed by the polymerase chain reaction-ligase detection reaction method. Polymorphisms were identified for all markers, except CAPN1 2546. The frequency of allele T was zero, and allele C was fixed for CAPN1 2546 in the studied populations. The SNP CAPN1 3535 in the CAPN1 gene was significantly associated with tenderness and other meat quality traits, where animals inheriting the AA genotype had smaller shear force values, lower water loss rates, and higher IMF contents. Moreover, H1 (AAA) was the most advantageous haplotype for meat tenderness. The results of this study confirm some previously documented associations. Furthermore, novel associations have been

1394J.T. Shu et al.
©FUNPEC-RP www.funpecrp.com.brGenetics and Molecular Research 14 (1): 1393-1403 (2015)
identified that, following validation in other populations, could be incorporated into breeding programs to improve meat quality.
Key words: Calpain (CAPN1); Ligase detection reaction; Chicken; Polymorphism; Meat tenderness
INTRODUCTION
Meat quality is of great importance in the broiler industry because consumers are willing to pay more money for superior products (Shackelford et al., 2001). Variation in meat tenderness has significant effects on consumer satisfaction with regard to chicken meat, and there has been significant interest in genetic selection to minimize problems associated with variation in meat tenderness. However, tenderness is a complex trait for breeding programs; variability in meat tenderness has not diminished, in part because of the inability to accurately select for increased tenderness. Thus, molecular marker information can be of great use in the identification of animals with particular genetic traits associated with the desired tenderness, and the selection process can be conducted on young animals, even before birth.
Calpains [i.e., intracellular Ca2+-dependent cysteine proteases (EC 3.4.22.17)] involve-ment in muscle growth and development has been previously demonstrated. Furthermore, they are proenzymes that are regulated by Ca2+ binding and autoproteolytic modification (Goll et al., 2003). The calpains were discovered because the Z-disks in the muscle strips incubated in a Ca2+-containing solution disappeared in the absence of other ultrastructurally detectable changes (Dayton et al., 1981). Four calpain genes (i.e., μ-calpain gene, CAPN1; m-calpain gene, CAPN2; p94 gene, CAPN3; and μ/m-calpain, CAPN1.5) are expressed ubiquitously in chickens (Okumura et al., 2005). Among the calpain family members, CAPN1 degrades myo-fibrillar proteins under postmortem conditions and appears to be the primary enzyme in the postmortem tenderization process (Koohmaraie, 1992, 1994, 1996). Regulation of CAPN1 ac-tivity has been correlated with variation in meat tenderness; thus, CAPN1 is a good candidate gene for tenderness (Geesink and Koohmaraie, 1999).
Polymorphisms within the CAPN1 gene have been previously investigated in associa-tion studies for meat quality traits, mainly for tenderness and marbling (Page et al., 2002; Oku-mura et al., 2006; Zhang et al., 2007a,b, 2008; Ribeca et al., 2013). In chickens, 4 polymor-phisms, 3 synonymous single nucleotide polymorphisms (SNPs) (i.e., C2546T, G3535A, and C7198A), and one SNP within the 3ꞌ-UTR (G9950A) of the CAPN1 gene have been found to have significant effects on meat tenderness (Zhang et al., 2007a,b, 2008). However, a publicly available evaluation on the association of these SNPs in Qingyuan partridge (QY) chicken is not yet available. QY chicken is an important indigenous breed distributed in Qingyuan, China. It is a light-body-type breed with good meat quality that is famous for its 3 “yellow”, 2 “thin”, and one “partridge” morphological features (i.e., yellow beak, shanks, and skin; thin head and bone; and partridge feathers).
In the present study, we describe a new, sensitive assay for the detection of the CAPN1 gene based on polymerase chain reaction-ligase detection reaction (PCR-LDR). LDR was originally developed for discriminating single-base mutations or polymorphisms (Barany and Gelfand, 1991). It utilizes the ability of DNA ligase to preferentially seal adjacent oligonucle-otides hybridized to target DNA in which there is perfect complementation at the nick junc-tion. The objective of this study was to identify 4 reported polymorphisms in the CAPN1 gene

1395CAPN1 gene on chicken meat quality research
©FUNPEC-RP www.funpecrp.com.brGenetics and Molecular Research 14 (1): 1393-1403 (2015)
and assess the associations between the CAPN1 polymorphisms and meat quality variation in QY and Recessive White (RW) chickens.
MATERIAL AND METHODS
Experimental animals
All animal studies were conducted in accordance with an animal use protocol ap-proved by the animal use committee of the Chinese Ministry of Agriculture. RW chickens (Jiang-13 strain of white Plymouth Rock) and a preserved population of QY chickens were used in this study. All breeds were reared with the same energy (12.97 MJ/kg) and protein (17.01%) levels of diet under the same management system from the National Gene Pool for Indigenous Chicken Breeds (Yangzhou, China). All birds were kept in a stacked cage raising system, with one cage for each bird. Two hundred female chickens were randomly selected from each breed using a random-sampling method. Slaughter was conducted at the age of 16 weeks. All animals were measured and samples were collected. Meanwhile, 0.4 mL blood was collected from the ulnar vein of each individual, with heparin as an anticoagulant.
Phenotypic traits
After slaughter, 3 steaks of breast muscles on the same side of each carcass were sawed longitudinally in the middle; for the tenderometer, intramuscular fat (IMF) percentage, and water loss rate tests, samples were 2-3, 1-2, and 1 cm thick, respectively. For tenderometer testing, steaks were chilled for 24 h at 2° ± 1°C. Subsequently, they were placed in a water bath at 100°C until the center of the sample reached 82°C. Samples were left to cool to 7°C; then, tenderness was measured by Warner-Bratzler shear force, which determines the relative force required to pass a blunt blade through a section of meat. The measurements of IMF percentage and water loss rate were performed as described by Perry et al. (2001).
DNA extraction and genotyping
DNA was extracted from whole blood samples using the Puregene DNA Isolation Kit (Gentra Systems, Inc., Minneapolis, MI, USA). The PCR-LDR method was used to perform genotyping. Four pairs of specific primers for CAPN1 (i.e., C2546T, G3535A, C7198A, and G9950A) were designed according to the genomic sequence of the CAPN1 gene in the Gen-Bank database (accession No. NC_006090.1; Table 1). PCR was conducted on the ABI 9600 (Applied Biosystems, Foster City, CA, USA) in a system with a total volume of 20 µL, which contained 50 ng genomic DNA, 5 pM primer mixture, 20 mM of each dNTP, 100 mM Mg2+, 5X Q-Solution, and 5 U/μL Taq DNA polymerase. The amplification protocol was comprised of an initial denaturation and enzyme activation phase at 95°C for 15 min; followed by 35 cycles of denaturation at 94°C for 30 s, annealing at 53°C for 1 min, extension at 72°C for 1 min; and a final extension at 72°C for 7 min. PCR products were checked on a 3% agarose gel stained with ethidium bromide to verify the amount added in the LDR.
For each SNP, 3 probes were designed, including one common probe and 2 discrimi-nating probes for the 2 types (Table 2). The common probe anneals to the PCR-amplified tem-plate immediately downstream of the nucleotide in question. One allelic probe has at its 3ꞌ-end

1396J.T. Shu et al.
©FUNPEC-RP www.funpecrp.com.brGenetics and Molecular Research 14 (1): 1393-1403 (2015)
the nucleotide corresponding to the wild-type allele. The other has at its 3ꞌ-end the nucleotide corresponding to the variant allele. These 2 allelic probes compete to anneal to the template adjacent to the common probe. This generates a double-stranded region containing a nick (i.e., missing phosphodiester bond) at the nucleotide position to be tested. Only an allelic probe with perfect complementation to the template is ligated to the common probe via DNA ligase.
Primers Sequence of the primer Length of the product Tm (°C)
2546C/T-forward 5ꞌ-ACCTCACGTGCCTCTCTCAC-3ꞌ 214 562546C/T-reverse 5ꞌ-AGCGGAACACTTACGTCGAT-3ꞌ 3535G/A-forward 5ꞌ-TCACCTGAGGTTTGCATGTT-3ꞌ 190 563535G/A-reverse 5ꞌ-AGCCATCAAATGCAGGAAGT-3ꞌ 7198C/A-forward 5ꞌ-GGTTCAGCAGGTTGTGCTTT-3ꞌ 216 567198C/A-reverse 5ꞌ-AGAGAGCCGAGCCCTAGTTC-3ꞌ 9950G/A-forward 5ꞌ-CCCCTCTGTCCCACCATAG-3ꞌ 242 569950G/A-reverse 5ꞌ-GGGGGAAAGAGGAAAACAGA-3ꞌ
Tm = melting temperature.
Table 1. Sequences and PCR conditions for each pair of primers.
For each PCR product, the ligation reaction was performed in a final volume of 10 μL containing 1 μL buffer, 1 μL probe mix, 0.05 μL Taq DNA ligase (New England Biolabs, USA), 1 μL PCR product, and 6.95 μL deionized water. The LDR parameters were as follows: an initial heating at 94°C for 2 min, followed by 35 cycles of 30 s at 94°C and 2 min at 60°C. The LDR products were analyzed on the ABI 3100 DNA Sequencer (Applied Biosystems). To confirm the accuracy of the PCR-LDR genotyping method, direct DNA sequencing of randomly selected PCR products was performed. The proportion of the sequencing samples were ~5%. The results of the PCR-LDR genotyping showed 100% concordance to direct DNA sequencing of the randomly selected PCR products.
Statistical analyses
Haplotypes were inferred by the PHASE 2.0 program (Stephens et al., 2001). Associa-tion analyses of single polymorphisms or haplotypes with meat quality were determined by ANOVA using a general linear model (GLM) and type III sums of squares performed by the SAS 9.0 software. The model was calculated as follows:
Probe name Probe sequences (5ꞌ-3ꞌ)
2546C/T_modify 5ꞌ P-AGCGACTCGTAGCAGCCGTTCAGCCTTTTTTTTTTTTTTTTTTTTTTTTTT-FAM 3ꞌ2546C/T_C 5ꞌ TTTTTTTTTTTTTTTTTTTTTTTTTTAAAGCCCTCAGTGGTGCCCCCTGAG 3ꞌ2546C/T_T 5ꞌ TTTTTTTTTTTTTTTTTTTTTTTTTTTTAAAGCCCTCAGTGGTGCCCCCTGAA 3ꞌ3535G/A_modify 5ꞌ P-TTCACCAGCTTCTTGAAGGTCACTGTTTTTTTTTTTTTTTTTTTTTTTT-FAM 3ꞌ3535G/A_A 5ꞌ TTTTTTTTTTTTTTTTTTTTTTTTGAAGGCGGTGACAGAGGCATGGCCT 3ꞌ3535G/A_G 5ꞌ TTTTTTTTTTTTTTTTTTTTTTTTTTGAAGGCGGTGACAGAGGCATGGCCC 3ꞌ7198C/A_modify 5ꞌ P-CCATCCGTCTTCAGATCTTTGTCTGTTTTTTTTTTTTTTTTTT-FAM 3ꞌ7198C/A_C 5ꞌ TTTTTTTTTTTTTTTTTTGTTGCGGCAGGAGTCCAGACTGAAG 3ꞌ7198C/A_A 5ꞌ TTTTTTTTTTTTTTTTTTTTGTTGCGGCAGGAGTCCAGACTGAAT 3ꞌ9950G/A_modify 5ꞌ P-GTGCATAGGATGAGAGGAGCACGATTTTTTTTTTTTTTTTTTTTTTTTTTTTTTTTT-FAM 3ꞌ9950G/A_A 5ꞌ TTTTTTTTTTTTTTTTTTTTTTTTTTTTTTTTAAAGGGTGTAGTGGTACTGCTGTGT 3ꞌ9950G/A_G 5ꞌ TTTTTTTTTTTTTTTTTTTTTTTTTTTTTTTTTTAAAGGGTGTAGTGGTACTGCTGTGC 3ꞌ
Table 2. Probe sequences of LDR.

1397CAPN1 gene on chicken meat quality research
©FUNPEC-RP www.funpecrp.com.brGenetics and Molecular Research 14 (1): 1393-1403 (2015)
where Yij is an observation on the traits, μ is the overall population mean, Bi is the effect of breed, Gj is the effect of genotype or haplotype, and eij is the residual error. Multiple compari-sons were analyzed with the least square means (LSM), and for a given trait, if its effect had a P value >0.05 it will be excluded from the model. The minimum diplotype frequency was set at 2%. All values are reported as LSM ± SE.
RESULTS
Gene and genotype frequencies
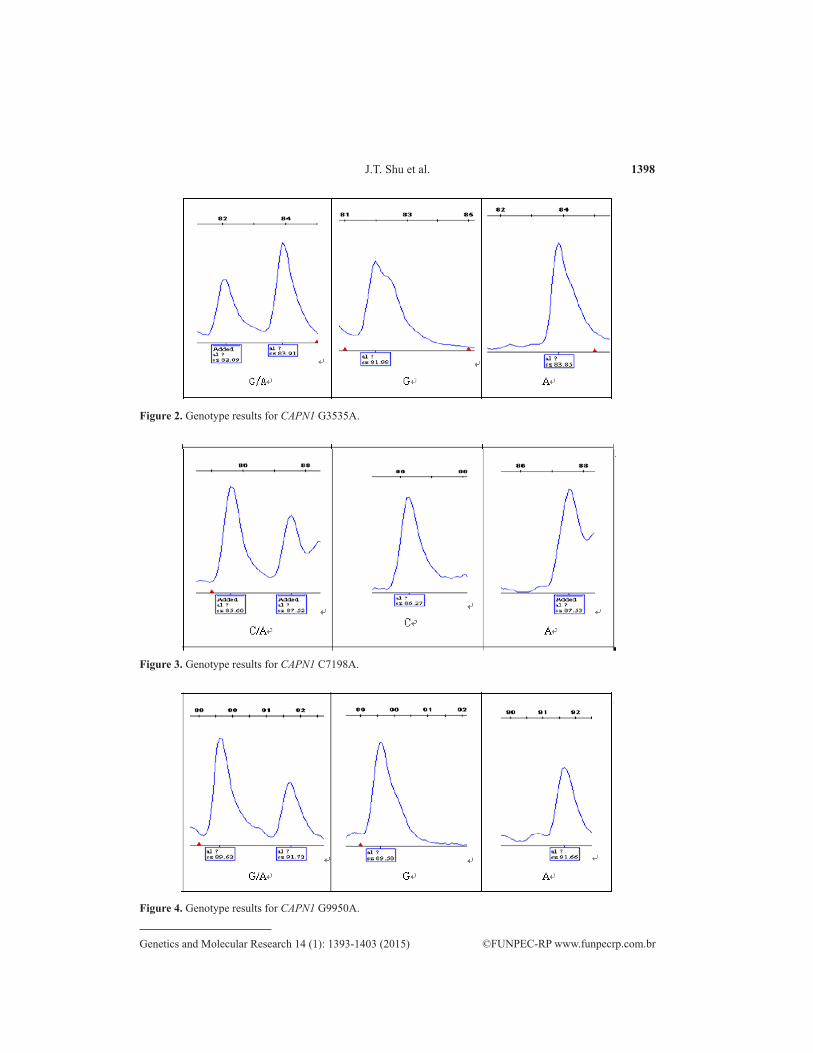
The first objective of this study was to test whether SNPs associated meat quality and carcass traits in other chicken populations are polymorphic in QY chickens. The results showed that the markers CAPN1 3535, CAPN1 7198, and CAPN1 9950 were polymorphic both in RW and QY chickens because fixed alleles were not observed and the allele frequencies for all markers were >1% (Table 3). However, for CAPN1 2546, animals that did and did not contain TT and CT, respectively, were observed; the frequencies of alleles T and C were zero and fixed, respectively (Table 3). The electrophoretic profile for the PCR-LDR analyses of the C2546T, G3535A, C7198A, and G9950A sites are shown in Figures 1-4. There were large breed differ-ences in allelic frequencies of 2 SNPs (i.e., G3535A, G9950A). At the G3535A and G9950A sites, the A allele was more frequent than the G allele in QY chickens, while the G allele was more frequent than the A allele in RW chickens. At the C7198A site, the allelic frequency distribution was in agreement among breeds; the A allele was more frequent than the C allele.
Breed (N) 2546 3535 7198 9950
C T G A C A G A
QY (200) 1.00 0.00 0.14 0.86 0.38 0.62 0.30 0.70RW (200) 1.00 0.00 0.72 0.28 0.31 0.69 0.61 0.39
RW and QY represent Qingyuan partridge chicken and Recessive White chicken breeds, respectively.
Table 3. Allelic frequencies of the 4 sites in the 2 chicken populations.
Figure 1. Genotype results for CAPN1 C2546T.
1398J.T. Shu et al.
©FUNPEC-RP www.funpecrp.com.brGenetics and Molecular Research 14 (1): 1393-1403 (2015)
Figure 2. Genotype results for CAPN1 G3535A.
Figure 3. Genotype results for CAPN1 C7198A.
Figure 4. Genotype results for CAPN1 G9950A.

1399CAPN1 gene on chicken meat quality research
©FUNPEC-RP www.funpecrp.com.brGenetics and Molecular Research 14 (1): 1393-1403 (2015)
Haplotypes and frequencies
Haplotypes constructed based on 3 SNPs and their frequencies in the 2 breeds are shown in Table 4. Seven haplotypes were identified in 400 chickens. We identified 2 major hap-lotypes, including H1 (AAA, 43%) and H7 (GCA, 41%); and 5 moderate haplotypes, including H2 (AAG, 28%), H3 (ACA, 23%), H4 (ACG, 21%), H5 (GAA, 30%), and H6 (GCG, 14%). H1 was a unique haplotype in QY chickens, while H7 was a unique haplotype in RW chickens.
Haplotype Site Breed
3535 7198 9950 QY RW
H1 A A A 0.43 -H2 A A G 0.12 0.16H3 A C A 0.18 0.05H4 A C G 0.15 0.06H5 G A A 0.08 0.22H6 G C G 0.04 0.10H7 G C A - 0.41
RW and QY represent Qingyuan partridge chicken and Recessive White chicken breeds, respectively.
Table 4. Haplotypes constructed with 3 single nucleotide polymorphisms (SNPs) and frequencies in the 2 populations.
Association of SNPs with chicken meat quality traits
Statistical analysis was applied to test the significance of differences in the breed ef-fect, genotype effect, and interaction between the genotype and breed effects among different genotypes of the 3 loci. The breed effect and interaction between the genotype and breed ef-fects were not significant. The only significant genotypic effect was identified in the G3535A polymorphic locus; therefore, we further analyzed the genotypic effect of the G3535A site us-ing a combination of the 2 breeds (Table 5). In summary, AA genotype individuals had signifi-cantly smaller shear force values, lower water loss rates, and higher IMF contents than those of the GG genotype individuals (P < 0.05). AA and GA genotype birds had significantly small-er shear force mean value than that of the GG genotype birds (-0.09 and -0.14, respectively), and there was no significant difference between the AA and GA genotypes. Similar results were obtained for the water loss rate trait; AA and GA genotype birds had significantly lower mean water loss rate than that of the GG genotype birds (-0.015 and -0.020, respectively), and there was no significant difference between the AA and GA genotypes. Individuals with the AA genotype had significantly higher mean IMF content than those of the GA (+0.077) and GG (+0.090) genotype individuals, and there was no significant difference between the GA and GG genotypes.
Association of CAPN1 haplotypes with chicken meat quality traits
With regard to the haplotypes, 9 diplotypes with frequencies >2% (i.e., 36 of H1H1, 24 of H1H2, 26 of H1H3, 26 of H1H4, 14 of H1H5, 16 of H1H6, 10 of H3H3, 10 of H3H4, and 10 of H3H5) were observed in QY chickens, and 8 diplotypes (i.e., 42 of H2H7, 12 of H3H5, 12 of H3H7, 14 of H4H7, 12 of H5H5, 46 of H5H7, 14 of H6H7, and 28 of H7H7)

1400J.T. Shu et al.
©FUNPEC-RP www.funpecrp.com.brGenetics and Molecular Research 14 (1): 1393-1403 (2015)
were observed in RW chickens; only H3H5 was a shared diplotype between the 2 chicken populations. Thus, a total of 352 individuals with 16 diplotypes (i.e., 36 of H1H1, 24 of H1H2, 26 of H1H3, 26 of H1H4, 14 of H1H5, 16 of H1H6, 10 of H3H3, 10 of H3H4, 22 of H3H5, 42 of H2H7, 12 of H3H7, 14 of H4H7, 12 of H5H5, 46 of H5H7, 14 of H6H7, and 28 of H7H7) were used in the association analyses, and a significant association (P < 0.05) between the haplotypes and meat quality was observed (Table 6). Among the 16 diplotypes, H1H1 had a significantly smaller (P < 0.05) mean value for shear force when compared to those of the H1H4, H2H7, H3H7, H5H5, H5H7, H6H7, and H7H7 diplotypes. H5H5 had a significantly higher (P < 0.05) mean value of water loss rate compared to those of the H1H5, H1H6 and H2H7 diplotypes. Moreover, the H1H1, H1H3, and H3H7 diplotypes had significantly higher (P < 0.05) mean values for IMF content when compared to those of the H1H2, H2H7, H3H3, H3H4, H3H5, H4H7, H5H5, H5H7, and H7H7 diplotypes.
a,bMeans with the different superscripts within the same row differ significantly (P < 0.05). IMF = intramuscular fat.
Traits GG GA AA
Shear force (kg) 2.463 ± 0.147a 2.323 ± 0.093b 2.373 ± 0.093b
Water loss rate (%) 0.317 ± 0.012a 0.297 ± 0.008b 0.302 ± 0.009b
IMF (%) 1.428 ± 0.141a 1.441 ± 0.090a 1.518 ± 0.092b
Table 5. Association of G3535A genotypes with meat quality traits in chicken breeds.
Trait Shear force (kg) Water loss rate (%) IMF (%)
H1H1 1.820 ± 0.264a 0.309 ± 0.010ab 2.076 ± 0.127a
H1H2 2.388 ± 0.153ab 0.316 ± 0.013ab 1.089 ± 0.147b
H1H3 2.280 ± 0.147ab 0.309 ± 0.012ab 2.053 ± 0.254a
H1H4 2.502 ± 0.147b 0.305 ± 0.012ab 1.708 ± 0.123ab
H1H5 2.460 ± 0.216ab 0.282 ± 0.018a 1.886 ± 0.228ab
H1H6 2.170 ± 0.200ab 0.286 ± 0.017a 1.815 ± 0.147ab
H2H7 2.488 ± 0.132b 0.301 ± 0.011a 1.092 ± 0.120b
H3H3 2.335 ± 0.264ab 0.325 ± 0.022ab 1.210 ± 0.254b
H3H4 2.228 ± 0.264ab 0.320 ± 0.022ab 0.955 ± 0.254b
H3H5 2.349 ± 0.187ab 0.329 ± 0.016ab 1.345 ± 0.180b
H3H7 2.845 ± 0.264b 0.308 ± 0.022ab 2.378 ± 0.254a
H4H7 2.185 ± 0.125ab 0.320 ± 0.022ab 1.325 ± 0.254b
H5H5 2.488 ± 0.264b 0.353 ± 0.022b 0.972 ± 0.141b
H5H7 2.486 ± 0.128b 0.324 ± 0.011ab 1.182 ± 0.141b
H6H7 2.686 ± 0.237b 0.314 ± 0.020ab 0.982 ± 0.208b
H7H7 2.662 ± 0.153b 0.321 ± 0.013ab 1.166 ± 0.192b
a,bMeans with the different superscripts within the same column differ significantly (P < 0.05). 1Only the haplotype combinations for which the observed number was no less than 4 are listed. IMF = intramuscular fat.
Table 6. Least squares means ± SE of myofiber types according to haplotype combinations1.
DISCUSSION
Understanding the genetic basis of protein metabolism in chickens will provide an opportunity for genetic improvement in muscle growth traits. The study of candidate genes, based on related results that have been well characterized in humans and mice, is one of the primary methods used to determine whether specific genes are associated with economic traits in farm animals. In the present study, we describe the development of a new mutation detection method based on PCR-LDR, which is highly sensitive and quantitative. A distinguishing feature

1401CAPN1 gene on chicken meat quality research
©FUNPEC-RP www.funpecrp.com.brGenetics and Molecular Research 14 (1): 1393-1403 (2015)
of PCR-LDR is that misligations do not undergo subsequent amplification, thereby reducing the chance of false-positive reactions. Any low-level polymerase errors remain unselected; thus, background noise is minimized. This method has been used in the detection of some viruses, oncogenes, and tumor-suppressor genes (Khanna et al., 1999; Rondini et al., 2008).
In poultry, Maeda et al. (1991) measured muscle protein turnover rate and calpain activity in the muscle of 2 quail lines divergently selected for body size. Zhang et al. (2007a,b) found that 3 variants in the CAPN1 gene were associated with breast muscle fiber density and some carcass traits in chickens. Thus, the primary objective of this study was to test previously identified associations between 4 SNPs from the CAPN1 gene and economically important meat quality traits in an important Chinese indigenous chicken breed, a better meat quality chicken breed (i.e., QY chickens), and a commercial breed (i.e., RW chickens). Among the 4 reported SNPs, 3 (i.e., CAPN1 3535, CAPN1 7198, CAPN1 9950) were polymorphic; for CAPN1 2546, the C allele was fixed in the studied populations. In 8 meat-type chicken popu-lations, including 5 purebred lines (developed from Chinese local breeds) and 3 crossbreeds, CAPN1 2546 was more polymorphic, as can be observed in Zhang et al. (2008). However, this observation may be contributed more to the genetic differences between breeds. Nevertheless, the genotyping results were in accordance with the direct DNA sequencing results, indicating the accuracy of the PCR-LDR method.
The allele frequencies in the 2 chicken breeds were different at the G3535A and G9950A sites; the A allele occurred more frequently than the G allele in QY chickens, and the G allele occurred more frequently than the A allele in RW chickens. Of all the markers on the CAPN1 gene studied herein, CAPN1 7198 showed the best segregation. All genotypic classes were observed, and the class with the fewest animals (CC in QY chickens and AA in RW chickens) represented 15.8 and 12.0% of the total samples, respectively.
A significant association was observed only for the G3535A genotypes of the CAPN1 gene and meat quality traits when further association studies were conducted for each poly-morphism. The AA and GA genotypes were associated with increased tenderness when com-pared to the GG genotype; thus, the A allele was advantageous for chicken meat quality. The results obtained for the QY and RW chickens confirm the results from previous studies that documented the effect of the SNP CAPN1 3535 on meat tenderness in 5 purebred and 3 cross-bred lines (Zhang et al., 2007a,b). Moreover, the breed and interaction effects between breeds and genotypes were not significant; therefore, CAPN1 3535 is an important SNP on the CAPN1 gene because it explains the functional variation for tenderness in many chicken populations.
Haplotype or haplotype block analysis provided a practical solution for resolving the innate problems of a single-marker analysis, such as noisy, unsatisfied, and obscured impor-tant localization information (Daly et al., 2001). Both haplotype diversity and the method of SNP selection based on maximum haplotype diversity have typically been preferred (Huang et al., 2003). In this study, haplotypes were constructed with 3 SNPs, and we analyzed the as-sociations between haplotype combinations and meat quality traits. The H1H1 diplotype was found to be associated with smaller shear force and higher IMF content, and H1 was a unique haplotype in QY chickens, indicating that the H1H1 diplotype may be the most advantageous haplotype for meat tenderness. However, only one of the SNPs from the CAPN1 gene had a significant effect on any of the traits in the SNP analyses, thus incorporating haplotype infor-mation would not improve the performance of marker-assisted selection, primarily for the populations in the current study.

1402J.T. Shu et al.
©FUNPEC-RP www.funpecrp.com.brGenetics and Molecular Research 14 (1): 1393-1403 (2015)
CONCLUSIONS
The results presented herein confirm some previously documented associations; for example, the association between the CAPN1 3535 genotype and tenderness, which is the most important qualitative trait for consumers. Furthermore, novel associations have been identified that, following validation in other populations, could be incorporated into breeding programs to improve meat quality. Finally, while some previously noted associations were not replicated in the current study, it is important to note that validation is dependent on the spe-cific nature of the population screened, and genetic background may influence the magnitude of the effect of a polymorphism. Validation failure may be due to a lack of true associations between the trait and markers but could also be caused by differences in SNP frequencies, marker-causative mutation linkage phases, genotype-by-environment interactions, or epistasis as well as sample size effects and measurement. Nevertheless, for those associations con-firmed in the current study, the additional validation instills confidence for the use of these markers in selection programs to improve meat quality.
ACKNOWLEDGMENTS
Research supported by the National Natural Science Foundation of China (#31301967), the Earmarked Fund for Modern Agro-Industry Technology Research System, National High Technology Research and Development Program “863” (#2011AA100301 and the Natural Science Foundation of Jiangsu Province (#BK2012268).
REFERENCES
Barany F and Gelfand DH (1991). Cloning, overexpression and nucleotide sequence of a thermostable DNA ligase-encoding gene. Gene 109: 1-11.
Daly MJ, Rioux JD, Schaffner SF, Hudson TJ, et al. (2001). High-resolution haplotype structure in the human genome. Nat. Genet. 29: 229-232.
Dayton WR, Schollmeyer JV, Lepley RA and Cortes LR (1981). A calcium-activated protease possibly involved in myofibrillar protein turnover. Isolation of a low-calcium-requiring form of the protease. Biochim. Biophys Acta 659: 48-61.
Geesink GH and Koohmaraie M (1999). Effect of calpastatin on degradation of myofibrillar proteins by mu-calpain under postmortem conditions. J. Anim. Sci. 77: 2685-2692.
Goll DE, Thompson VF, Li H, Wei W, et al. (2003). The calpain system. Physiol. Rev. 83: 731-801.Huang Q, Fu YX and Boerwinkle E (2003). Comparison of strategies for selecting single nucleotide polymorphisms for
case/control association studies. Hum. Genet. 113: 253-257.Khanna M, Park P, Zirvi M, Cao W, et al. (1999). Multiplex PCR/LDR for detection of K-ras mutations in primary colon
tumors. Oncogene 18: 27-38.Koohmaraie M (1992). The role of Ca2+-dependent proteases (calpains) in post mortem proteolysis and meat tenderness.
Biochimie 74: 239-245.Koohmaraie M (1994). Muscle proteinases and meat aging. Meat. Sci. 36: 93-104.Koohmaraie M (1996). Biochemical factors regulating the toughening and tenderization processes of meat. Meat. Sci.
43S1: 193-201.Maeda Y, Kawabe K, Okamoto S and Hashiguchi T (1991). Genetical studies on muscle protein turnover rate and calcium
activated neutral protease activity in the skeletal muscle of the Japanese quail, Coturnix coturnix japonica. Anim. Sci. Technol. 62: 813-821.
Okumura F, Shimogiri T, Shinbo Y and Yoshizawa K (2005). Linkage mapping of four chicken calpain genes. Anim. Sci. J. 76: 121-127.
Okumura F, Shimogiri T, Kawabe K and Okamoto S (2006). Gene constitution of South-East Asian native chickens, commercial chickens and jungle fowl using polymorphisms of four calpain genes. Anim. Sci. J. 77: 188-195.

1403CAPN1 gene on chicken meat quality research
©FUNPEC-RP www.funpecrp.com.brGenetics and Molecular Research 14 (1): 1393-1403 (2015)
Page BT, Casas E, Heaton MP, Cullen NG, et al. (2002). Evaluation of single-nucleotide polymorphisms in CAPN1 for association with meat tenderness in cattle. J. Anim. Sci. 80: 3077-3085.
Perry D, Shorthose WR, Ferguson DM and Thompson JM (2001). Methods used in the CRC program for the determination of carcass yield and beef quality. Aust. J. Exp. Agric. 41: 953-957.
Ribeca C, Bonfatti V, Cecchinato A, Albera A, et al. (2013). Association of polymorphisms in calpain 1, (mu/I) large subunit, calpastatin, and cathepsin D genes with meat quality traits in double-muscled Piemontese cattle. Anim. Genet. 44: 193-196.
Rondini S, Pingle MR, Das S, Tesh R, et al. (2008). Development of multiplex PCR-ligase detection reaction assay for detection of West Nile virus. J. Clin. Microbiol. 46: 2269-2279.
Shackelford SD, Wheeler TL, Meade MK, Reagan JO, et al. (2001). Consumer impressions of Tender Select beef. J. Anim. Sci. 79: 2605-2614.
Stephens M, Smith NJ and Donnelly P (2001). A new statistical method for haplotype reconstruction from population data. Am. J. Hum. Genet. 68: 978-989.
Zhang ZR, Zhu Q, Jiang XS and Du HR (2007a). Study on correlation between single nucleotide polymorphism of CAPN1 gene and muscle tenderness and carcass traits in chicken. Yi Chuan 29: 982-988.
Zhang ZR, Zhu Q and Liu YP (2007b). Correlation analysis on single nucleotide polymorphism of CAPN1 gene and meat quality and carcass traits in chickens. Agric. Sci. China 6: 749-754.
Zhang ZR, Liu YP, Jiang X, Du HR, et al. (2008). Study on association of single nucleotide polymorphism of CAPN1 gene with muscle fibre and carcass traits in quality chicken populations. J. Anim. Breed. Genet. 125: 258-264.