ANALYSIS OF SUCCESS FACTORS FOR SUPPLIER DEVELOPMENT … · vi ABSTRACT OF THE THESIS Analysis of...
102
ANALYSIS OF SUCCESS FACTORS FOR SUPPLIER DEVELOPMENT _______________ A Thesis Presented to the Faculty of San Diego State University _______________ In Partial Fulfillment of the Requirements for the Degree Master of Business Administration with a Concentration in Information Systems _______________ By Logeek Shrimali Fall 2010
Transcript of ANALYSIS OF SUCCESS FACTORS FOR SUPPLIER DEVELOPMENT … · vi ABSTRACT OF THE THESIS Analysis of...

ANALYSIS OF SUCCESS FACTORS FOR SUPPLIER DEVELOPMENT
_______________
A Thesis
Presented to the
Faculty of
San Diego State University
_______________
In Partial Fulfillment
of the Requirements for the Degree
Master of Business Administration
with a Concentration in
Information Systems
_______________
By
Logeek Shrimali
Fall 2010


iii
Copyright © 2010
by
Logeek Shrimali
All Rights Reserved

iv
DEDICATION
This thesis is dedicated to my wonderful parents, Mr. Rajendra Kumar Shrimali and
Mrs. Khuslata Shrimali, who have always supported me and sent me to the USA for a
Master’s degree. They always said to me, “Don’t be afraid to be different”, which motivated
me to work on a thesis rather than a company project which is usually chosen by MBA
graduates. I am grateful to my parents from the bottom of my heart. Their guidance and
support helped me to succeed and develop confidence so that today I feel capable of doing
anything that I can think of. Thank you for everything.

v
“The company in which you will improve most will be least expensive to you.”
-George Washington
vi
ABSTRACT OF THE THESIS
Analysis of Success Factors for Supplier Development by
Logeek Shrimali Master of Business Administration San Diego State University, 2009
Studies have shown that the declining competitiveness of US firms is related to lower investment than foreign rivals in intangible investments such as supplier development. Studies also showed that half of the companies fail in supplier development efforts. Since supplier development is not successful every time when undertaken, it is essential to examine supplier development factors which can impact the success of supplier development.
This thesis examines aspects associated with the success of supplier development strategies within a number of industrial sectors. The purpose of the study is to determine what factors are required to make the supplier development a success; furthermore it shows that some factors have more significant influence than others on supplier development.
Data from the population of buyers was collected to test the extent of the relationship between significant factors and success of the supplier development process. Agreement was noted between dependencies of success of supplier development process on several factors. Recommendations to supply managers and purchasing managers are provided regarding upper management involvement, enhanced communication with suppliers, recognition of the suppliers and development of strategic processing instead of reactive processing.
vii
TABLE OF CONTENTS
PAGE
ABSTRACT ............................................................................................................................. vi
LIST OF TABLES ................................................................................................................... xi
LIST OF FIGURES ................................................................................................................ xii
ACKNOWLEDGEMENTS ................................................................................................... xiii
CHAPTER
1 INTRODUCTION .........................................................................................................1
Background of Study ...............................................................................................1
The Problem Statement ............................................................................................2
Research Justification ..............................................................................................2
Overview of Methodology .......................................................................................4
Delimitation .............................................................................................................4
2 LITERATURE REVIEW ..............................................................................................5
Past Literature ..........................................................................................................5
7 Step Supplier Development Model .....................................................................11
1. Identify Critical Commodities .....................................................................12
2. Identify Critical Suppliers ............................................................................12
3. Form a Cross Functional Team ....................................................................12
4. Meet With Supplier Top Management ........................................................13
5. Identify Key Projects ...................................................................................13
6. Define Details of Agreement .......................................................................14
7. Monitor Status and Modify Strategies .........................................................14
Summary ................................................................................................................14
3 HYPOTHESIS DEVELOPMENT ...............................................................................17
Interviews ...............................................................................................................17
Research Variables .................................................................................................17
Hypothesized Model ..............................................................................................19
4 RESEARCH METHODOLOGY .................................................................................21
Survey Design ........................................................................................................21

viii
Literature Review.............................................................................................22
Survey Instrument ............................................................................................22
Reliability and Validity ....................................................................................23
Ethical Consideration .............................................................................................24
Population and Sampling Procedures ....................................................................24
5 SURVEY RESULTS ...................................................................................................26
Response Rate ........................................................................................................26
Descriptive Statistics ..............................................................................................26
Scale Purification ...................................................................................................27
Validity Test.....................................................................................................28
Reliability Test .................................................................................................32
6 HYPOTHESIS TESTING ...........................................................................................34
Overview ................................................................................................................34
Hypothesis One ................................................................................................35
Hypothesis Two, Four and Five .......................................................................35
Hypothesis Three .............................................................................................36
Hypothesis Six .................................................................................................36
Hypothesis Seven .............................................................................................37
Hypothesis Eight ..............................................................................................37
Hypothesis Nine ...............................................................................................38
Conclusion .............................................................................................................39
Overall Research Findings .....................................................................................42
Future Research .....................................................................................................43
REFERENCES ........................................................................................................................44
APPENDIX
A COVER LETTER FOR SURVEY ..............................................................................50
B SURVEY INSTRUMENT ...........................................................................................52
C FACTOR ANALYSIS .................................................................................................58
D CRONBACH’S ALPHA ANALYSIS .........................................................................67
E MULTIPLE REGRESSION ANALYSIS ...................................................................75
F RAW SURVEY RESULTS .........................................................................................83

ix
LIST OF TABLES
PAGE
Table 1. Summary of Prior Literature on the Supplier Development Programs .......................6
Table 2. Descriptive Statistics ..................................................................................................27
Table 3. KMO and Bartlett's Test Results ...............................................................................28
Table 4. Factor Analysis Results .............................................................................................29
Table 5. Loadings for Components in Rotated Matrix ............................................................31
Table 6. Total Variance ............................................................................................................32
Table 7. Cronbach’s Alpha Analysis Summary .......................................................................33
Table 8. Summary of Multiple Regression Tests .....................................................................35
Table 9. Summary of Results for Hypothesis Three ................................................................36
Table 10. Summary of Results for Hypothesis Six ..................................................................36
Table 11. Summary of Results for Hypothesis Seven (Independent) ......................................37
Table 12. Summary of Results for Hypothesis Eight ..............................................................38
Table 13. Summary of Results for Hypothesis Nine ...............................................................38
Table 14. Summary of Hypothesis Results ..............................................................................39
Table 15. Communalities for Six Independent Variables ........................................................59
Table 16. Total Variance with Six Variables ...........................................................................60
Table 17. Rotated Component Matrix .....................................................................................61
Table 18. Component Transformation Matrix .........................................................................62
Table 19. Communalities for Five Independent Variables ......................................................62
Table 20. Total Variance With 2nd Iteration ...........................................................................63
Table 21. Component Matrix with Five Factors ......................................................................64
Table 22. Rotated Component Matrix for Five Factors ...........................................................65
Table 23. Component Transformation Matrix .........................................................................66
Table 24. Case Processing Summary for Full Scale ...............................................................68
Table 25. Reliability Statistics for Full Scale ........................................................................68
Table 26. Item Total Statistics for Full Scale ..........................................................................69
Table 27. Scale Statistics for Full Scale ...................................................................................69
Table 28. Summary for Reliability of Program Success .........................................................70

x
Table 29. Cronbach's Alpha for Program Success (PS) ...........................................................70
Table 30. Item Total Statistics for PS ......................................................................................70
Table 31. Scale Statistics for PS ..............................................................................................70
Table 32. Summary for Reliability of Effective Communication (EC) ..................................71
Table 33. Reliability Statistics for Effective Communication .................................................71
Table 34. Item-Total Statistics for EC .....................................................................................71
Table 35. Scale Statistics for EC ..............................................................................................71
Table 36. Summary for Reliability of Supplier Commitment (SC) ........................................72
Table 37. Reliability Statistics for SC ......................................................................................72
Table 38. Item Total Statistics for SC ......................................................................................72
Table 39. Scale Statistics for SC ..............................................................................................72
Table 40. Case Processing Summary for Strategic Process (SP)............................................73
Table 41. Reliability Statistics for SP ......................................................................................73
Table 42. Item Total Statistics for SP ......................................................................................73
Table 43. Scale Statistics for SP ..............................................................................................73
Table 44. Case Processing Summary for Long Term Commitment (LTC) ............................74
Table 45. Reliability Statistics for LTC ...................................................................................74
Table 46. Item Total Statistics for LTC ...................................................................................74
Table 47. Scale Statistics for LTC ...........................................................................................74
Table 48. Variables Entered/ removed with Backward Method ..............................................76
Table 49. Model Summary with Backward Elimination Method ............................................76
Table 50. ANOVA Test Results ..............................................................................................77
Table 51. Excluded Variables from Regression ......................................................................78
Table 52. Variables Entered with Enter Method, Dependent-LTCAvg .................................78
Table 53. Model Summary for SPAvg with Enter Method .....................................................78
Table 54. ANOVA Test Results for SPAvg ............................................................................78
Table 55. Coefficient Table of SPAvg .....................................................................................79
Table 56. Variable Entered with Enter Method, Dependent-SCAvg......................................79
Table 57. Model Summary with LTCAvg ...............................................................................79
Table 58. ANOVA Test Results with LTCAvg .......................................................................79
Table 59. Coefficient Table for LTCAvg ................................................................................80
Table 60. Variables Entered with Enter Method, Dependent Variable-SCAvg .....................80
Table 61. Model Summary for SCAvg ....................................................................................80

xi
Table 62. ANOVA Test Results for SCAvg ............................................................................81
Table 63. Coefficient Table for SCAvg ...................................................................................81
Table 64. Variables Entered with Enter Method, Dependent Variable-PSAvg ......................81
Table 65. Model Summary for ECAvg ....................................................................................81
Table 66. ANOVA Test Results for ECAvg ............................................................................82
Table 67. Coefficient Table for ECAvg ...................................................................................82
xii
LIST OF FIGURES
PAGE
Figure 1. A hypothesized model. .............................................................................................20
Figure 2. Revised model. .........................................................................................................29
Figure 3. Scree plot. .................................................................................................................30
xiii
ACKNOWLEDGEMENTS
I would like to express my gratitude to the following persons for providing me the
help, direction and access to valuable data:
Dr. Feraidoon Raafat, San Diego State University
Dr. Robert Judge, San Diego State University
Dr. Kamal Haddad, San Diego State University
Dr. Bruce Reining, San Diego State University
Dr. Paula Peters, San Diego State University
Dr. James Beatty, San Diego State University

1
CHAPTER 1
INTRODUCTION
This thesis is a quantitative study of critical factors for supplier development
strategies. The study is based primarily upon a survey of supplier development managers and
professionals involved in this field. This first chapter of the thesis discusses the context of the
study, intention of the study and its importance, and presents the overview of the
methodology used in the thesis.
BACKGROUND OF STUDY
A global economy is emerging and resources are becoming concentrated on core
business activities rather than diversification, which is why there is a move toward
outsourcing. As a result, outsourcing increased from $91 billion to $416 billion in the last 20
years (Tunstall, 2002), and it is expected to increase further. In 2009 the value of outsourcing
deals alone in the logistics area were estimated to be $80 billion (Hyatt, 2009). Due to the
liberal use of suppliers, buying companies have to rely on their suppliers to deliver defect
free product in a timely and cost effective manner. Buyers must ensure that their supplier
capabilities match their expectations in order to compete in the competitive market (Krause
& Ellram, Success factors in supplier development, 1997). Now, if a supplier is incapable of
meeting the buying firm’s needs, the buying firm has three alternatives: (1) Bring
outsourcing to a close and produce it internally, (2) Resource with a more capable suppliers,
(3) Develop the supplier-help to improve the existing suppliers capabilities. All three
strategies can work. (Handfield, Krause, Scannel, & Monczka, 2000). For this study supplier
development is defined as:
“Any effort of a buying firm with its supplier to increase the performance and
capabilities of the supplier and meet the buying firms supply needs”. (Krause & Ellram,
1997)
If suppliers are innovative and supplying an exclusive product then the option of
supplier development needs to be given consideration. At Toyota and many other Japanese
firms all the suppliers are considered for supplier development activities irrespective of what

2
they supplied . Considering all the suppliers for supplier development activities consents to
develop a supplier partnership which is one of the important steps towards establishing TQM.
Though research on similar topics has been done in the past, this research is capable
of generating new facts due to several reasons. First, the sample population is different and
for a variety of reasons the participants had different opinions than those found in the
previous research. Moreover, there is a different type of variable interaction in this research
than the previous research. Thus the research framework will be totally different from the
previous researches.
THE PROBLEM STATEMENT
Supplier development requires both the supplier and buyer to commit to maximum
efforts to achieve the greatest results out of the program. Even though both sides agree that a
strong commitment is required, there is still no guarantee that the supplier development will
be successful. In the early 90’s companies started reducing the number of direct suppliers and
started to maintain more cooperative relationships with the remaining suppliers (Hartley &
Choi, 1996). Approximate one-third of the projects failed due to the supplier’s
underperformance. Thus the success in the supplier development is not a foregone
conclusion. Supplier development is considered a long term business strategy and there are
various factors which affects this strategy. These factors not only affect the end result of
supplier development process but also influence each other. This research establishes the
critical success factors for supplier development and their inter-relationships with each other.
Moreover, multiple regression models helped to identify the interrelationship among critical
success factors.
RESEARCH JUSTIFICATION
A large number of companies execute supplier development programs and yet they
fail at surprising rates. Not all supplier development initiatives are successful – in fact, as
many as 50% are not successful due to poor implementation and follow-up. (Handfield,
2002). This failure takes a toll that is not only financial but also psychological. Failure
demoralizes employees who have labored diligently to complete their share of the work in
the supplier development project. The supplier development project success depends on both
3
parties, so a dedicated study is required to find out what factors make the supplier
development process a success.
In 2000, according to reader’s poll of purchasing magazine, 53% of the companies
claimed that they were involved in a supplier development program, but it was found that
only 20% of the companies were providing financial support to the suppliers and only 14%
of the companies were putting their employees in the supplier’s facilities for the development
purpose. Eleven percent of the companies had given the suppliers an invitation to come to the
buyers place and learn. Only 11% of the companies had a formal program for supplier
development, others were doing it without any the formal program. (“Half work with
suppliers, half don't”, 2000). This shows that even though companies were involved in
supplier development program, they were not fully implementing them in an appropriate
way.
In General Motors, after implementation of supplier development program, supplier
productivity was improved 50%, lead time was reduced by 75%, and inventory was reduced
by 70% during the one week workshops (Pazirandeh & Mattsson, 2009). Honda of America's
Best Practices (BP) team reduced a supplier's costs by more than $200,000 per year by
changing the layout of a welding process. Furthermore, layout change increased the
efficiency of supplier and ultimately bestowed advantage to buying company (Hartley &
Choi, 1996). Also, one of the purchasing managers for a power tool producer indicated that
in three years of developing suppliers, his company had seen quality rejects fall from 38.4%
down to 0.5% while supplier on-time delivery had risen from 76% to 97.5%. Likewise,
another proponent of supplier development cites an average supplier quality metric of 98.5%
and on-time supplier delivery at 97%. They claim to have "improved quality, response time,
prices and cycle time improvements." The VP for a major California-based computer maker
discussed about how assistance from his firm allowed one subassembly supplier to "ramp up
the production in only six weeks." (“Half Work with Suppliers, Half Don't”, 2000).
Although ramping up the production and performance took only 6 weeks but usually
supplier development is very time consuming and long process which consumes plenty of
resources. Sometimes the output of supplier development program might not be worth the
resources being consumed and ordinary results are not acceptable by companies. Thus to
find out the success factors for supplier development was essential (Easton, 2000).
4
OVERVIEW OF METHODOLOGY
A structured survey questionnaire with a five-point Likert scale was developed. Web
and email were used to circulate and gather information regarding what supplier development
professionals think about supplier development activities. The survey was divided into six
small sections and each section had 3 questions. The questions were mailed to a random
sample of 300 supplier development professionals. The survey solicited information about a
single instance of supplier development performed by them. The survey was both face and
content validated. Of 300 surveys circulated, 81 usable responses were obtained. The
responding population represents a wide range of industry types. Also before e-mailing the
survey, a set of interviews with supplier development managers were conducted. The
interview was designed to narrow down the success factors which were collected after
reviewing existing literature and to help focus on those that appear to be reliable and
important success factors that might have a large effect on supplier development success.
DELIMITATION
The research study was conducted at San Diego State University during the end of the
fall semester 2009.
This research was limited to supplier development managers who updated their resume on Monster.com.
This research was limited to professionals in North America to reduce cultural differences within the population used in the study.
Multiple Regression model were used to determine the interdependency and significant relationship between critical factors.
This research was limited to 3 questions per factor to keep instrument short.

5
CHAPTER 2
LITERATURE REVIEW
This chapter reviews the past research that serves as the foundation for this thesis.
The research cited identifies critical factors associated with the success of supplier
development projects. Following will be the review of literature on strategic process, upper
management involvement, supplier recognition, effective and enhanced communication, and
commitment of suppliers. The chapter will conclude with a summary of literature. Examples
of the key words used in searching for scholarly papers are: supplier development, supplier
relationship, supplier evaluation, supplier management, supply chain management and buyer-
supplier relationship. Also, combinations of keywords were used to conduct the search of
literature. Search engines used were the SDSU library search engine and Google scholar
PAST LITERATURE
The first documented application of supplier development comes from Toyota in
1939. Toyota discussed the need of working together with suppliers to improve collective
performance. Thereafter, in 1963, Nissan implemented their first supplier development
project, Honda joined the club in 1973 (Monczka, Handfield, Glunipero, & Patterson, 2009).
It is essential to understand the significance of the various factors and the role they play in
supplier development process. Past research can be categorized as (a) Theoretical, (b)
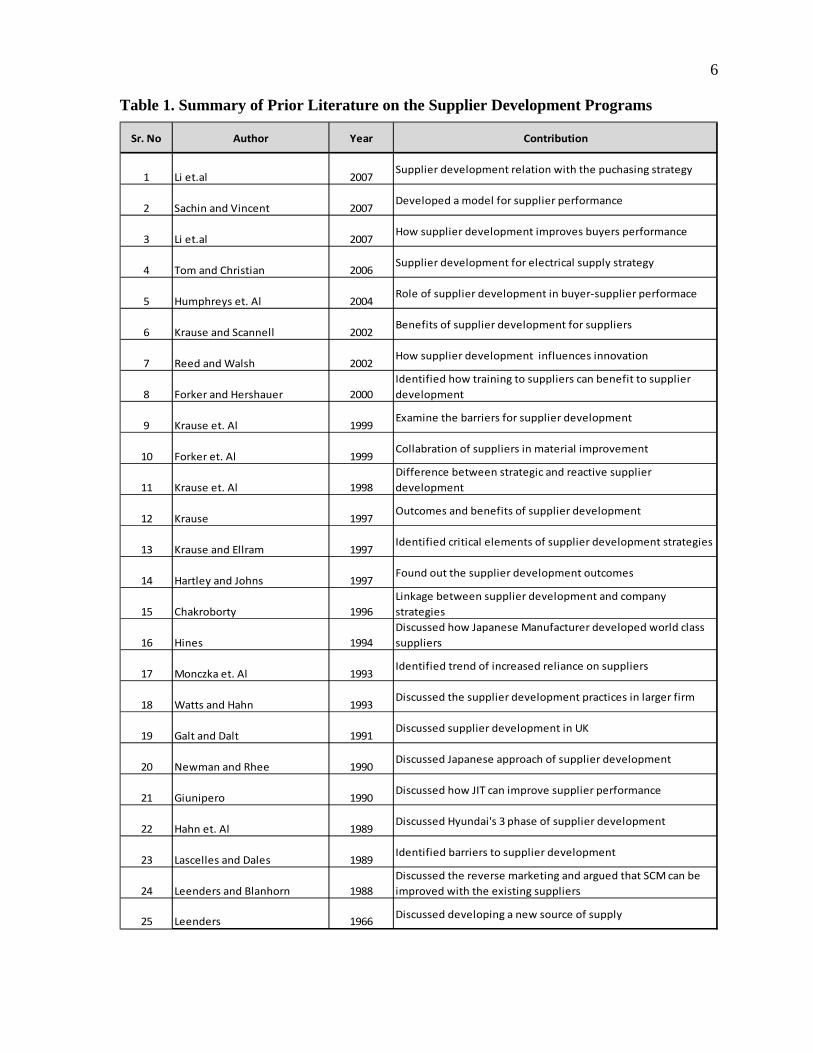
Conceptual, (c) Empirical, (d) Conceptual and Empirical. Table 1 presents a brief review of
the literature which was identified. Previous to mid-1990, the supplier development
literature consisted mainly of studies covering cases of several companies with the purpose
of identifying the barriers that impact supplier development. In the 1990's, the research
moved towards establishing a relationship between various supplier developments constructs
whereas in 2000 the research moved towards the influence of supplier development on
innovation and purchasing strategy (Easton, 2000).
6
Table 1. Summary of Prior Literature on the Supplier Development Programs
Sr. No Author Year Contribution
1 Li et.al 2007Supplier development relation with the puchasing strategy
2 Sachin and Vincent 2007Developed a model for supplier performance
3 Li et.al 2007How supplier development improves buyers performance
4 Tom and Christian 2006Supplier development for electrical supply strategy
5 Humphreys et. Al 2004Role of supplier development in buyer‐supplier performace
6 Krause and Scannell 2002Benefits of supplier development for suppliers
7 Reed and Walsh 2002How supplier development influences innovation
8 Forker and Hershauer 2000
Identified how training to suppliers can benefit to supplier
development
9 Krause et. Al 1999Examine the barriers for supplier development
10 Forker et. Al 1999Collabration of suppliers in material improvement
11 Krause et. Al 1998
Difference between strategic and reactive supplier
development
12 Krause 1997Outcomes and benefits of supplier development
13 Krause and Ellram 1997Identified critical elements of supplier development strategies
14 Hartley and Johns 1997Found out the supplier development outcomes
15 Chakroborty 1996
Linkage between supplier development and company
strategies
16 Hines 1994
Discussed how Japanese Manufacturer developed world class
suppliers
17 Monczka et. Al 1993Identified trend of increased reliance on suppliers
18 Watts and Hahn 1993Discussed the supplier development practices in larger firm
19 Galt and Dalt 1991Discussed supplier development in UK
20 Newman and Rhee 1990Discussed Japanese approach of supplier development
21 Giunipero 1990Discussed how JIT can improve supplier performance
22 Hahn et. Al 1989Discussed Hyundai's 3 phase of supplier development
23 Lascelles and Dales 1989Identified barriers to supplier development
24 Leenders and Blanhorn 1988
Discussed the reverse marketing and argued that SCM can be
improved with the existing suppliers
25 Leenders 1966Discussed developing a new source of supply

7
In today’s business, many buying firms pursue aggressive strategies such as
outsourcing in order to increase their future rate of capabilities improvement (Monnczka,
Trent, & Callahan, 1993). There are several reasons behind pursuing aggressive strategies.
First, manufacturers are focusing on their core competencies and areas of technical expertise.
Second, developing an effective supply base management strategy can help counter the
competitive pressures brought about by intense worldwide competition. Third, suppliers can
directly support a firm’s ability to innovate in the critical areas of product and process
technology. A study showed 95% of the business unit’s sampled indicated supplier
contributions were increasing in terms of importance. There was a 232% increase in people
from 1989-1990 who agreed with the statement that suppliers are extremely important to the
achievement of competitive market strategies. More and more organizations have started to
outsource and to rely on suppliers. Furthermore, for each sample period, respondents
projected an increasing dependency on suppliers for future product technology. More and
more companies have started to use a supplier development process, such as HP, Epson,
Apple Computer, 3M, and BMW. For long term commitment with suppliers, buyers look for
improvement during supplier development program. If improvements do not occur, firms
across many industries may lose market share to competitors who are able to maximize
supplier performance input. The trend is towards increasing reliance on supplier to help
achieve competitive market strategies. This reliance on suppliers and improving their
performance was initially documented from Toyota in 1939. Toyota discussed the need of
working together with suppliers to improve collective performance (Monczka et al., 2009).
Supplier development has been ubiquitous in Japan and Korea for a number of years,
but is less evident in US firms due to a perceived lack of instant return on investment.
Interestingly this practice was recognized early in the 1900's by the US automotive industry
when Ford required improved supplier capacity (Krause, Handfield, & Tyler, 2006). In 1970s
other Japanese automakers implemented the system and made their own modifications; for
example Honda developed a program called BP (Best practices). Review of case studies
(Sako, 2004), allowed examining differences between supplier development activity in
Toyota, Nissan and Honda. In 1939, Toyota purchasing rules stated that- Toyota suppliers
must be treated as a branch of Toyota and Toyota must continue to do business with these
suppliers without switching to others. The rule also encouraged the development of suppliers
8
if required. Toyota generated supplier development activities into TPS (Toyota Production
System) and TQC (Total Quality Control). Hyundai also realized that their small suppliers
could not recruit engineers thus they sent engineers from their own shops to improve
suppliers productivity. Hyundai do not financially support their suppliers but offer personnel
support (Handfield R. et al., 2000). Nissan also implemented supplier development program
which were significantly different from Toyota in the terms of number of point of contacts
for suppliers. Their approach encouraged sharing of ideas and a one-on-one training strategy
during the program. Honda and Nissan unified the TPS and TQC offering a single point of
contact (Sako, 2004). The common features of the supplier development programs at Honda,
Nissan and Toyota are multiple channels for supplier development to transfer both tacit and
explicit knowledge. Tacit knowledge is more difficult to accumulate as it needs closer
interactions especially face to face with suppliers and more time thus it is difficult to
replicate tacit knowledge (Clarke, 2007). In contrast to these companies in Japan, the
suppliers in the US and Europe did not have similar levels of trustworthiness, where the
buyer was perceived as a trusted well-wisher who could suggest to their suppliers how they
should invest their resources (Sako, 2004).
A study from Harvard University concluded that the primary reason for declining
USA competitiveness is that US companies invest less in supplier relations and development
(Monnczka et al., 1993). Supplier development activities were transferred to the USA as
foreign buying firms commissioned their own plants in the USA due to government
regulations and supply chain efficiencies. By 1996, General Motors had completed supplier
development projects with over 2000 suppliers and claimed productivity improvements over
50%, lead time reduction of up to 75% and inventory reduction of 70% (Clarke,2007; Hartley
& Choi, 1996). By 2001 John Deere was involved in 426 different projects with 92 different
supplier development engineers and delivering annual saving of $700,000 along with
improvements in quality, cost and delivery. By 1994, Allied-Signal saved $300,000 from
supplier development activities and increased its share price (Monnczka et al., 1993). At
Deere and Delphi, a $100,000 investment in supplier development yielded at least three to
ten times the original investment (Nelson, Moody, & Stegner, 2005). This illustrates that
large firms adopted supplier development and it became a strategic tool for them to improve
quality, reduce cost and improve the delivery. The basic development process started with
9
reduction in supplier base and then developing the remaining suppliers. Also this practice
was adopted in service based companies from product based companies. Service based
companies rely on the competitive pressure of market force instigated supplier performance
to a greater extent than product based firms. In UK most companies rationalized or optimized
their supply base to include fewer total suppliers (Matook, Lasch, & Tamaschke, 2009).
Countries and large firms started to realize the benefits of supplier development.
From the national perspective, benefits of supplier development were improvement in
domestic suppliers, reduction in off shoring and increase in GDP (Krause & Ellram, 1997).
From the corporate and large firm perspective, supplier development helped in improving
quality, reliability and manufacturability of new design. Besides that supplier development
also helped in knowledge sharing and improved collaboration. Furthermore responsiveness to
customer needs and market dynamics also increased with supplier development (Krause &
Ellram, 1997). The data gathered from 527 purchasing executives (Krause, 1997) revealed
that supplier development attributed to timely delivery, completed orders, reduction in
defects & scrap and reduced order cycle time. Research by (Blonska, Rozemeijer, & Wetzels,
2008) established that supplier development encourages preferential buyer status and supplier
adaptability. Supplier adaptation is perceived as a goal of supplier development aimed at
supplier performance improvement (Blonska et al., 2008). With the help of two in depth case
studies, (Reed & Walsh, 2002) established that supplier development activities enhance
technological capabilities in their suppliers. Also, some of the firms expected technological
improvement follows from improved business processes. Supplier development also helped
in developing mutual trust between buyers and suppliers (Reed & Walsh, 2002). BMW
strives to be 20% above industry average in quality performance. Management believed
supplier development made it possible to attain that quality standard and increase in revenue
(Rhodes, Warren, & Carter, 2006). Also, at Honda dramatic improvement was seen in
product quality since they began to develop suppliers in North America. In 1985 quality level
was 7000 defects per million; and in 1995 quality level was improved to only 100 defects per
million (Berlow, 1995). A team of purchasing professionals from Honda of America worked
with 12 stamping suppliers to reduce cost by $4 million in six months in 1995 through its
supplier development efforts (Berlow, 1995).

10
In the context of supplier development, suppliers and buyers state that they want to
practice more supplier development methods to enjoy its benefits but there are myriads of
barriers that hinder the effective supplier development strategies. Research by (Lascelles &
Dale, 1989) utilizing survey responses from UK based suppliers to 3 major customers in
automotive industry illustrated that poor communication and feedback, unstructured quality
improvement programs, credibility of buyers, misconceptions regarding purchasing power
and supplier satisfaction were the foremost barriers in the supplier development programs.
Also in an empirical study with 89 minority goods and service providers (Krause, Ragatz, &
Hughley, 1999) demonstrated that the main barriers towards minority owned supplier
development were poor communication, non-profit situation and racial biases. Results also
indicated that small minority owned suppliers were less positive about supplier development
activities as compared to large minority owned suppliers (Novak, 2008). Another survey
(Handfield R. et al., 2000) on supplier development strategies with 84 companies established
several other barriers apart from those already mentioned that deter supplier development
strategies. It included lack of supplier commitment, insufficient supplier resources, lack of
trust, and poor alignment of organizational cultures, unsupportive upper management and
insufficient inducement to suppliers. Research by (McDuffie & Helper, 1997) established
that supplier development might fail if suppliers do not have a strong identification or if
suppliers are not dependent on buyers. Another major barrier towards supplier development
is the difference between perceptions of buyer and suppliers about supplier development
practices. These differences in perception are due to a disparity in understanding the
preference, intention, and process of a supplier development program (Forker, Ruch, &
Hershauer, 1999). A supplier might agree initially but later fail to implement due to a
difference in understanding.
Researchers came up with number of conceptual models for building solutions to
overcome these barriers. A ten step process model was developed based on the examination
of in-depth responses to survey questions. Such a model was a step towards strategic supplier
development. It ranged from the identification of critical commodities for development to
systematically instituting ongoing continuous improvement. The model also suggested that
firms competing in markets characterized by high rates of technological changes and high
level of competition are more likely to be involved with this model (Krause, Handfield, &

11
Scannell, 1998). This model was subsequently slightly changed to a seven steps model
(Handfield R.et al., 2000). Also it was found that most organizations deployed the first three
steps but were less successful in deploying later stages. Similar to the previous model, a
process oriented four step supplier development model was proposed. This model was
designed to help suppliers sustain and continue the change process and effectively build the
capability for improvement within the organization (Hartley & Jones, 1997). This model also
increased the supplier’s capability to act on its own and the improvement effort to continue
once the buying firm finishes its activities (Wagner S. M., 2006). Also, supplier structure was
developed on the basis of specific vendor development strategy. A conceptual link was
generated between business unit strategies based on framework proposed by Porter and
supplier development strategies, in other words, linkage between supplier development
strategies and company strategies (Chakraborty & Philip, 1996). A case study of five firms
by (Dunn & Young, 2004) resulted in a process model that enables the buyers to pinpoint
specific areas where improvement is required. Highlighting these areas can impact long term
strategic supplier development initiatives.
A review of the research on supplier development resulted in the identification of
several elements that appear to be critical to the success of the supplier development
program. These comprise of effective and enhanced communication, supplier commitment,
top management involvement, strategic processing and “long term commitment and supplier
recognition/rewards” (Krause & Ellram, 1997).
7 STEP SUPPLIER DEVELOPMENT MODEL
“Big things happen when you do little things right” (Don, 2000). In this case, if small
steps for supplier development are deployed correctly, then it can contribute towards success
in supplier development. (Handfield R. et al., 2000) developed a seven step process map for
set up supplier development activities. These are: (1) Identify critical commodities (2)
Identify critical suppliers (3) Form a cross functional team (4) Meet with supplier top
management (5) Identify key project (6) Define details of agreement and (7) Monitor status
and monitor strategies. A discussion of each is as follows.

12
1. Identify Critical Commodities
Upper management involvement is vital to assess the relative importance of
commodities and services procured by a business unit. In many companies such as Shell,
Alcatel, Philips and Siemens, a corporate level executive committee analyzes the ‘Kraljic
purchasing portfolio’ developed during the strategic process. This analysis is extension of
company strategic planning (Handfield R. et al., 2000; Weele & Arjan, 2002). As a result of
this planning, critical commodities are identified and warranted for supplier development
activities. The steps adopted here are mainly observed in a strategic approach to supplier
development where in a reactive approach; respondents skip this step in the supplier
development process (Krause et al., 1998).
Hence, Upper management involvement has significant influence on the outcome of
identifying critical commodities.
2. Identify Critical Suppliers
Choosing which supplier to develop is a critical task because supplier development
involves resources such as money and time. Thus the decision should be strategic not
reactive (Gordon, 2008; Handfield R. et al., 2000). To decide which situation needs supplier
development is a judgment call. Companies have a formal supplier measurement system
which they use to assess a supplier’s performance. If any gap is found in measured and
expected results, these suppliers are identified for a development process, where in reactive
approach the company might skip this step in supplier development activities (Krause et al.,
1998). Also buying firms carefully evaluate suppliers quality, volume, delivery cost
performance, launch readiness and potential kaizen opportunities to identify a prospective
supplier development program (Novak, 2008).
Hence, Strategic processing and upper management involvement have significant
influence on the outcome of this first step of supplier development
3. Form a Cross Functional Team
Each firm must develop their suppliers according to their own requirements. For
example, some firms need managerial assistance and some need technical assistance. Thus it
is essential to evaluate each supplier individually to create a plan that benefits both supplier
and buyer (Daghfous, Campa, & Hamde, 2008). As a result, to face this complex challenge
13
of developing dissimilar suppliers, innovative ideas are required to break down the
knowledge barrier between buyers and suppliers, a cross functional team is necessary
(Blindenbacj-Driessen, 2009). Before approaching suppliers and asking for enhanced
performance, it is also important for the buyer needs to have established its own cross
functional processes and capabilities before expecting commitment from suppliers(i.e. to be
able to serve as a role model) (Monczka et al., 2009). In particular a commitment from the
buyer and establishment of a strategic approach is essential for the buildup of a cross
functional consensus. The establishment of its supply chain strategies and roles of
procurement will facilitate sound business objectives.
Hence, Supplier commitment and strategic process have a significant influence on the
outcome and creation of a cross functional team.
4. Meet With Supplier Top Management
Upper management involvement is again involved, but this time it is on supplier’s
side. The cross functional team must meet with the upper management of the supplier side
and establish strategies which will help to align the technology of the supplier and buyer.
Jointly the buyer and supplier will establish the means for measuring the capability of a
supplier’s side; as an example whether suppliers have infrastructure, resources, time and
potential to implement the suggestions provided by buyers.
Hence, upper management involvement has significant influence on the outcome of
this step of supplier development - meeting with supplier top management.
5. Identify Key Projects
Among all the projects identified after meeting with upper management, supplier
development managers must categorize the projects on the basis of return on investment. The
main idea is to find the importance and impact of the project in business. After evaluating
most important projects, goal is to decide whether they are achievable on not. Additional
criteria used to evaluate the key project include willingness of supplier to implement
changes. (Handfield R. et al., 2000).
14
6. Define Details of Agreement
After identifying the project, the parties need to agree on the specific metrics for
monitoring its success. Prior to setting up the supplier development program and investing in
supplier development activities, goals need to be established and decisions made on how to
achieve these goals (Wagner & Krause, 2009). The metrics may include the percent of cost
saving to be shared, the percent of quality improvement to be achieved or the percent of
delivery time reduction etc. The agreement also must specify milestones and deadlines for
improvement as well as the role of each party: who is responsible for the project success and
how and when to deploy the allocated resources. Upon reaching an agreement the project
should begin (Krause et al., 1998).
Hence, effective written communication has significant influence on the outcome of
this step of supplier development. For example, Hyundai motor company uses financial
incentives to motivate suppliers. They pay class 1 suppliers in cash, class 2 are paid net 30
days , class 3 are paid net 60 days and class 4 suppliers are paid net 60 days and receive no
new business. So suppliers know how Hyundai will pay them if they will be on different
class of suppliers, as a result suppliers take steps to ensure high performance (Rhodes et al.,
2006).
7. Monitor Status and Modify Strategies
To ensure continued success, management must actively monitor progress and revise
the strategies if business is warranted (Wisner, Tan, & Leong, 2009). Communication is the
key to success in this step as the exchange of information is required to drive the project
towards success. Unremitting communication is required with the supplier community via
supplier councils. The suppliers as a part of a supplier council provide feedback on the
buyer’s performance (Krause et al., 1998). Requirement within project changes after
attaining certain milestone so it is essential to change the strategies accordingly.
SUMMARY
This chapter consists primarily of literature that is significant to the issues related to
supplier development. In addition to the literature on supplier development, strategic
outsourcing, off shoring, purchasing, material management, and reverse marketing literature
were also reviewed. Particularly, this chapter set out to answer the questions such as: the

15
rationale behind increase in reliance on suppliers and reasons for supplier development
activities by firms. This chapter also discussed about the emergence of supplier development
in Japanese companies and how the benefits spread out and countries in the West and large
firms included supplier development as part of their strategic approach. Along with the
benefits of supplier development, there are also barriers. To overcome barriers, several
conceptual models by (Handfield R.et al., 2000; Krause et al., 1998; Modi & Mabert, 2009),
were identified and are discussed. The conceptual framework relates with strategic approach,
effective communication, supplier commitment, long term contracts/rewards and upper
management involvement. In this chapter the supplier development was defined as: “Any
type of action taken by the customer to improve one or more of the supplier’s process. This
can include material flow, manufacturing, and quality control processes. These changes
include the implementation of or improvement in production planning, capacity planning,
material requirement planning, just in time inventory systems, shop floor control procedures
and material handling” (Easton, 2000).
The research on supplier development has come to the forefront since 1980’s. It is
agreed that strategic process, upper management involvement, effective communication, long
term contract/rewards and supplier commitment are important factors for successful supplier
development projects.
In summary it is established that the supplier development is a crucial element of
supply chain management with potential reduction in lead time and inventory reduction. Due
to this reason supplier development activities received a strong justification based on
improved organizational results. Critical factors such as strategic process, supplier
commitment, effective communication, supplier recognition and upper management
involvement are important for success of supplier development. It is useful to study the
factors associated with the success of supplier development programs to improve a supply
chain. This research provides insight into the following question: Is there any significant
correlation between the critical factors and success of supplier development program. The
definition of success for this report is any improvement in supplier performance in the areas
of quality, delivery, cost or technology which in turn improves the ability of the buying firm
to compete in the market.

16
The next Chapter presents a hypothesis model that has been developed from the
integration of earlier literature discussed and interviews with several supplier development
professionals.
17
CHAPTER 3
HYPOTHESIS DEVELOPMENT
This chapter discusses the goals of this thesis and the hypothesis development
procedures. The primary aim of this research was to collect and analyze empirical data to
validate supplier development success factors. The data are based on survey questionnaire
and interviews of supplier development managers.
INTERVIEWS
Six supplier development professionals were interviewed. Interviews were conducted
to learn about the critical factors that lead to successful implementation of a supplier
development project. Interviewees were selected with utmost care so that he or she had at
least 3 years of experience in supplier development and had managed at least three supplier
development projects. All interviewees had strong, in-depth knowledge of supplier
development programs. Collectively, they had diverse experience with different supplier
firms.
Interview questions were direct and were concerned with the factors that supplier
development professionals could identify with supplier development programs. These
interviews were conducted on the phone. The critical factors for success obtained from
interviewing these professionals were almost identical. Interviewees were asked regarding
the supplier development projects they carried out followed by their opinion of the most
significant contributors to their success or failure (Tamir, 2008). Some questions were open-
ended questions and interviewees responded meticulously and carefully. At the end of
interviews, the list of factors were summarized which, according to interviewees, were the
main contributors for supplier development success or failure.
RESEARCH VARIABLES
Some of the buying firms were more content than others with the results of their
supplier development programs. Generally, every buying firm focused on several of the
factors while implementing its program. This section reviews the factors that play an

18
important role in the transformation during supplier development efforts. The main factors
which were found to be of extreme importance are: Strategic processing, Upper management
involvement, Long term commitment/Rewards, Supplier commitment and Effective
communication. The literature review validated all the success factors stated by interviewees.
The strategic process emphasizes strong supplier development efforts to improve
alignment in the suppliers (Handfield R. et al., 2000). Firms approaching strategic supplier
development focus on classifying critical commodities with the intent to create a world class
supply base. In contrast, firms taking a reactive approach are motivated by supplier non-
performance including defects, delays or poor services. (Krause et al., 1998). The strategic
process focuses on the whole supply base; whereas, in the reactive approach the focus is on
eliminating specific supplier deficiencies. Moreover strategic processing encourages
development of suppliers by closer collaboration between both the parties and upper
management involvement. Thus, with the support of interviews and literature review, the
following hypotheses were postulated:
H1: Strategic processing plays a positive role in the success of a supplier development project.
H2: Strategic processing plays a positive role in upper management involvement.
H3: Strategic processing plays a positive role in asupplier recognition in the form of long term contracts.
Many interviewed managers stated that suppliers were not willing to accept help in the form
of supplier development. The reason behind that is that suppliers do not see the value of the
development program (Handfield R. et al., 2000). The reason for this perception is lack of
communication which might be overcome by upper management involvement. Therefore,
upper management is responsible for remaining competitive in the marketplace (Krause &
Ellram, 1997), and to remain competitive upper management must initiate effective
communication within suppliers and buyers. And the effective communication is followed
by a successful supplier development program. Thus, the following hypotheses were
considered:
H4: Upper management involvement plays a positive role in enhancing communication
H5: Upper management involvement plays a positive role in the success of supplier development process.
19
In any supply chain network, the commitment of the buyer depends on the supplier’s
commitment (Anderson E. & Weitz, 1992).Thus, lack of commitment on the supplier side
leads to failure of the supplier development programs (Lascelles & Dale, 1989). In this study,
the supplier commitment is defined as the degree to which the supplier is obligated to
continue the supplier development program and make it successful. In early meetings with
the supplier’s top managers, a buyer’s team must clearly delineate potential rewards for the
supplier organization; otherwise, the supplier may not be fully committed to the effort
(Handfield R. et al., 2000).
Due to lack of commitment, buyers frequently switch suppliers. Some buyers
consider that the use of long-term contracts, of three to five years, effectively demonstrates
commitment. While long-term contracts may be evidence of a long-term perspective,
commitment may not be sustained without undertaking additional risks. Supplier
development involves risks for both the buying and the supplier firms, in that both must be
willing to invest resources and time in dedicated assets for pay-offs that may only occur over
a relatively long time period (Krause & Ellram, 1997). Therefore, the following hypotheses
are proposed:
H6: Supplier recognition plays a positive role in commitment of suppliers.
H7: Supplier recognition in the form of long term contracts plays a positive role in the success of supplier development.
H8: Commitment of suppliers plays a positive role in the success of the supplier development process.
Poor communication is a principal barrier in an effective supplier-buyer relationship (Krause
& Ellram, 1997; Lascelles & Dale, 1989). Formal communication established between the
buying firm and supplier positively influences the supplier development process (Prahinski &
Benton, 2004) and poor communication can defeat the supplier development process (Krause
& Ellram, 1997). Thus, the following hypothesis is proposed:
H9: Enhanced communication plays a positive role in the success of the supplier development process.
HYPOTHESIZED MODEL
With the help of the interviewees and the relevant literature, the relationships can be
illustrated as in Figure 1. This Figure summarizes how critical factors affect the outcome of
supplier development projects.

20
Figure 1. A hypothesized model.
In the next chapter research methodology is explained along with the approach taken
towards research, how the survey was designed, and how the data was collected and
validated.
21
CHAPTER 4
RESEARCH METHODOLOGY
This chapter discusses the research methodology used in this study. In order to prove
the hypotheses defined in the previous chapter, it was decided to use a survey instrument for
gathering data. The survey focused on the following factors: Strategic process, supplier
commitment, upper management involvement, communication, long term
commitment/rewards and the success of supplier development program. Once the
quantitative data were collected, statistical tests were performed to test the various
hypotheses and check for possible correlations among factors. The following sections
describe the approach of gathering data, survey design, population sampling, survey
instrument used and the instrument’s reliability and validity.
SURVEY DESIGN
The survey design consists of the following steps: literature survey for previous
studies, constructing the survey instrument, validating the instrument and pilot testing the
instrument. For surveys measuring customer satisfaction, it has been suggested to have only
10-20 questions (Janes, 1999). It will not be too brief and, therefore, will not make the
customer feel that their feedback is not important. Since the survey was not sponsored by any
company, and it was a cold call survey on a specific topic, it was kept to an optimum length
which can be finished in 10 minutes. Most respondents dislike answering long questionnaires
(Kitchenham & Pfleeger, 2002). By compelling the respondent to give answers to a long
survey, it might be possible to get inaccurate answers because respondents might be tempted
to fill out the first choice for all answers for a quicker questionnaire. Thus, with the longer
survey, the researchers usually get insignificant results. If the topic of the survey is important
to respondents then they will be willing to spend more time in taking the survey (Kitchenham
& Pfleeger, 2002). Also, many of the respondents felt that 10 minutes was the maximum time
they could spend on the survey. The minimum time they expected a survey to take was 4
minutes. So, a survey was created which could be finished in 6-10 minutes (Nilsson &

22
Soderstorm, 2005). Although covering all the factors is important, a tradeoff between
insignificant results and more coverage is unacceptable. The research consists of the
following sections: selection of research method, population and sampling, questionnaire
selection, data collection, data capturing and data statistical analysis.
Literature Review
In this thesis two methods of data collection were used: interview and literature
review. A brief interview was conducted to develop the list of critical success factors
followed by an in-depth literature review to corroborate a set of propositions and critical
factors related to the success of supplier development programs. Several interviews with
selected company professionals helped in identifying and narrowing the survey instrument
(Krause et al., 1998) factors related to the success of supplier development programs.
Several interviews with selected company professionals helped in identifying and narrowing
the survey instrument (Krause et al., 1998). Moreover, critical factors used in existing
empirical studies were also used in the preparation of the survey instrument. Most of the
previous surveys were sent via regular postal mail, and the response rates varied greatly. A
total of eight articles were found to have similar empirical study content but differing in the
objective, hypothesis, sample size and methodology. Though earlier surveys were reliable
and valid yet those surveys measured different factors because of different objectives. So, it
was decided that it would be beneficial to conduct a new survey.
Survey Instrument
The survey questionnaire was developed with the help of existing research
instruments as a way to achieve the content validity and reliability. To further aid in the
development of the instrument, manuals, articles, books and existing theses on marketing
research were consulted (Chidambaranathan, Muralidharan, & Deshmukh, 2009; Fink, 2003;
Krause & Ellram, 1997; Tamir, 2008).
The survey instrument consists of 19 questions, every question corresponding to one
of the six factors including the success of supplier development itself. To keep the survey
short and to get a higher response rate, a limited number of questions were kept in the survey
(Tamir, 2008). To examine each factor, three questions were designated and one question
was to find out whether buyers had ISO certification or not.

23
The survey instrument comprised qualitative questions on a 5-point Likert scale to
give respondents the option to be more expressive. Respondents were instructed in the
beginning of the questionnaire and in the cover letter (Appendix A) to mark the most suitable
answer. The scores range from 1-5 as follows (Jacoby & Matell, 1971; Nyengane, 2007;
Rensis, 1932):
1 - Strongly Disagree
2 - Disagree
3 - Neutral
4 - Agree
5 - Strongly Agree
The survey tool measures six factors. Each factor is linked to three questions. See
Appendix B. The questions dealing with our variable of interest-success of a supplier
development program were put in the beginning of the survey. This was done to make the
survey more logical to the respondents. Questions were formulated so that respondents could
answer them easily and accurately. The response format was standardized so that respondents
knew their choice of answers and would not need to waste time by reading the choices,
question by question. There were no open questions in the survey to avoid misinterpretation;
all the questions were closed as the questions were on an ordinal scale.
Reliability and Validity
Reliability is the statistical measure of how consistent the survey instrument data are
(Litwin, 1995). Reliability can be determined by three different ways: test-retest, alternate
forms, and internal consistency. Test-retest requires a great deal of time to check the
reliability; alternate forms were not given priority because of the technical nature of the
survey. The internal consistency method was selected to check the reliability of the
instrument. Internal consistency was measured by determining Cronbach’s alpha. It is a
statistic that reflects the homogeneity of scale (Litwin, 1995). Cronbach’s alpha was
preferred over the split half reliability coefficient because split half requires one test to be
treated as two tests. The resulting coefficient is the correlation between two subsets which
may differ depending on how the initial test is divided (Ekholm & Pashei, 2009). Ideally the
24
value of Cronbach’s alpha above 0.50 will be accepted if the number of questions is small
(Cockburn et al., 1991; Tamir, 2008),
Validity refers to the degree to which a survey instrument actually measures what it
purports to measure. There are four types of validity: Content, face, criterion and construct.
This questionnaire confirmed the face and content validity at the initial phase of the survey
instrument design. Face validity refers to whether the survey asks all the needed questions
and uses appropriate language to do so (Fink, 2003). To perform this face validity, the thesis
committee and supplier development professionals were consulted during and after
preparation of the questionnaire. They agreed on the appropriateness of the language for all
the questions in the survey. Content validation refers to the extent to which a question
appropriately assesses the characteristics it is intended to measure (Fink, 2003). To perform
this content validity, a pilot study was performed. In the exercise, questions and critical
factors to be measured were given to randomly selected panel of ten professionals. The panel
was asked to map each survey question to one of the factors measured. The purpose was to
make sure that the questions were understood in the context of the survey design. A
consistent mapping of a question to the wrong factor would have indicated a problem with
the question content or wording (Tamir, 2008). During the pilot study, several wording
modification suggestions were collected and incorporated in the final survey.
ETHICAL CONSIDERATION
In the cover letter of the survey instrument, ethical consideration of confidentiality
and privacy issues were addressed. To encourage a respondent’s candid response, a guarantee
was provided to respondents that their name would not be disclosed in the research report or
to their management.
POPULATION AND SAMPLING PROCEDURES
Population is the group of people which are the focus of the research, and the sample
refers to the people who are selected to be in a study. To increase reliability, the survey was
targeted mainly to supplier development professionals, procurement professionals, and buyer
and quality professionals that have personally witnessed or participated in supplier
development programs. All respondents in the survey were selected so that the sample could
be categorized as a subjective population. Out of several sampling methods, including simple
25
random sampling, stratified random sampling, systematic and cluster-based sampling, and
the simple random sampling procedure was followed. The random sampling procedure gets
tedious when sampling from an unusually large target population, but in this study the
population is rather small. The sample had an experience of at least three years in supplier
development activities in the U.S.A.
A web survey was used due to the fact it could gather many responses within a short
period. Also, there is practically no cost involved once the setup is completed. Along with the
survey instrument, a cover letter (see Appendix A) giving a short introduction of the research
was sent to all the respondents. A sample of 120 professionals was chosen but on the
recommendation of the thesis committee, this was increased to 305 professionals from a
population of approximately 500 professionals.
It is hoped with the help of this study that supplier development professionals can
make improved decisions. The next chapter will discuss the resultant analysis of this study.

26
CHAPTER 5
SURVEY RESULTS
This chapter presents and discusses the results of the data analysis from the
questionnaire. In this chapter, the first section discusses the survey responses and the second
section discusses the details on how the results were validated using factor analysis. In the
last major section, the results of the survey are discussed.
RESPONSE RATE
The survey was initially sent to 305 respondents. Out of the 123 returned responses,
81 were found to be complete and utilizable. Some people in the sample group were not
interested in participation due to various reasons. 81 usable responses resulted in a response
rate of 27%.
One hundred twenty-three responses were received out of 305 requests to supplier
development professionals. This is a response rate of 41%. Forty-two responses were
partially completed, therefore unusable. The sample size of 81 out of a population of 500
produced results with a statistical confidence level of 95% and a confidence interval of +/-
10%, utilizing the finite population (“Sample Size Formulas for our Sample Size Calculator”:
Novak, 2008).
DESCRIPTIVE STATISTICS
Descriptive statistics are used to illustrate the main features of a dataset in
quantitative terms. It aims to quantitatively summarize a data set, rather than being used to
support inferential statements about the population that the data are thought to represent.
(“Descriptive Statistics”, 2010).
All variables contain a sample size of 81 which verified consistency in capturing the
data. The statistical mean value for all the variables falls between 1.5 and 2.2 which shows a
fragment of divergence on this subject. The greatest standard deviation is 0.965 in the
success of the supplier development component. Again, these statistics verify that there was a
small amount of disparity on this issue and the supplier management practiced by the

27
organization is reactive in nature rather than strategic. Also, by the results it was
demonstrated that there is a significant amount of central tendency existing in the survey
results, and thus the survey results are reasonable to use in subsequent analysis (Nyengane,
2007). Table 2 shows descriptive statistics for six variables of the survey. Please refer
Appendix B for the questions associated with variables.
Table 2. Descriptive Statistics
Variable N Range Mean Std.
Deviation Kurtosis Skewness
Statistic Statistic Statistic Statistic Statistic Statistic Q.1: PS1 81 4 2.11 .962 1.478 1.415 Q.2: PS2 81 3 1.90 .700 0.692 0.586 Q.3: PS3 81 3 2.23 .965 -0.587 0.534 Q.4: MISC1 81 4 2.06 .940 0.345 0.801 Q.5: EC1 81 3 1.90 .752 1.229 0.889 Q.6: EC2 81 3 1.54 .633 1.498 1.044 Q.7: EC3 81 3 1.70 .798 1.991 1.348 Q.8: SC1 81 4 2.17 .946 0.976 1.066 Q.9: SC2 81 4 2.35 .964 0.267 0.796 Q.10: SC3 81 4 1.98 .774 2.417 1.037 Q.11: UMI1 81 4 2.01 .915 0.882 0.979 Q.12: UMI2 81 3 1.79 .754 1.703 1.089 Q.13: UMI3 81 3 1.98 .741 -0.029 0.417 Q.14: SP1 81 3 2.20 .872 -0.902 0.064 Q.15: SP2 81 3 1.94 .871 -0.422 0.587 Q.16: SP3 81 3 2.06 .796 -0.348 0.345 Q.17: LTC1 81 3 1.79 .720 -0.143 0.545 Q.18: LTC2 81 3 1.75 .799 0.169 1.233 Q.19: LTC3 81 4 2.20 .900 0.469 0.754 Valid N (listwise) 81
Kurtosis and skewness statistics and calculations demonstrate that the distribution is
normal because kurtosis and skewness are in between -2 and +2, thus data is normally
distributed and had reasonable variance to use in subsequent analysis (Mardia, 1974).
SCALE PURIFICATION
Reliability analysis is used to examine whether the survey provides consistent results,
and a validation test is used to examine whether the instrument is measuring what it is

28
intended to measure. Thus, to ensure the survey instrument is working correctly, the
measurement model was tested for validity and reliability.
Validity Test
Validity refers to the degree to which a survey instrument actually measures what it
purports to measure (Fink, 2003). In this validity test, content and criterion validity were
checked with the help of factor analysis through varimax rotation. Table 3 demonstrates that
the value of the KMO (Kaiser-Meyer-Olkin) measure is 0.766 which indicates that the factor
analysis is a good idea because it exceeds the minimum requirement of 0.50 for overall MSA
(Measure of Sampling Adequacy) (Child, 2006).
Table 3. KMO and Bartlett's Test Results
Kaiser-Meyer-Olkin Measure of Sampling Adequacy.
Bartlett's Test of Sphericity
Approx. Chi-Square df Sig.
.766 598.843 153 .000
The KMO Measure is an index for comparing the magnitude of the observed
correlation coefficients to the magnitude of the partial correlation coefficients. In Bartlett’s
test of sphericity, the value of observed significance level was found to be 0.000, which is
small enough and implies that we could reasonably proceed with factor analysis for this data
set (Child, 2006). Moreover, the probability associated with the Bartlett’s test is less than
0.001 which satisfies the requirement of having less than the significance level. Bartlett’s test
of sphericity is used to test the hypothesis that the variables in the population correlation
matrix are uncorrelated (Jim, 2008).
Factor analysis was performed to test the validity of the model. Factor analysis
attempts to identify underlying variables, or factors, that explain the pattern of correlations
within a set of observed variables. Factor analysis is often used in data reduction to identify a
small number of factors that explain most of the variance that is observed in a much larger
number of manifest variables (SPSS 17.0 Help). Thus, factor analysis was performed to
measure the validity of all the factors of the model, and the idea was to take out a factor, if
necessary, on the basis of low factor loading. Out of 18 variables related to independent and

29
dependent variables used in the survey, 4 variables were eliminated. During the first run,
variable SC3 with high cross loading of 0.801 across the factor was removed. Since there
didn’t seem to be convergence or divergence around the upper management involvement
factor in the survey, in the subsequent run it was decided to drop the UMI factor from the
analysis altogether because of poor theoretical relevance. Thereafter, only five factor models
were analyzed. Table 4 shows the factor analysis results.
Table 4. Factor Analysis Results
Factor Eigen Values Components
1 5.007 EC1,EC2,EC3
2 1.408 SP1,SP2,SP3
3 1.354 PS1,PS2,PS3
4 1.057 SC1,SC2
5 0.946 LTC1,LTC2,LTC3
While performing factor analysis due to removal of upper management involvement
construct, the hypothesized model was revised as shown in Figure 2. Revised Model. This
revised model was additionally tested to determine if strategic process affects enhancing
communication.
Figure 2. Revised model.
The principal component extraction method was used for factor analysis because it is
the simplest and most accurate method. To confirm the appropriateness of factor analysis, the

30
correlation matrix was analyzed, and it was found that there were several correlations greater
than 0.30 among the variables (Child, 2006).
During the third iteration of factor analysis, the five factors having the highest values
were chosen. The Cattell’s scree plot (Cattell & Vogelmann, 1977), which is illustrated in
Figure 3, shows how in later components the Eigen values drop. Cattell's scree test allows for
dropping all further components after the one starting from the elbow. In this plot, we
determined that only the first five factors were worth retaining.
Figure 3. Scree plot.
Before starting factor analysis, communalities need to be checked for meeting
minimum criteria. Communalities represent the proportion of the variance in the original
variables that is accounted for by the factor solution. The factor solution should explain at
least half of each original variable's variance, so the communality value for each variable
should be 0.50 or higher. Initial communality of the entire variables was greater than 0.5
which meets the minimum criteria (Child, 2006).
As discussed in an earlier chapter, the Varimax rotation method was chosen to check
the construct validity. Varimax rotation is an orthogonal rotation method that minimizes the
number of variables that have high loadings on each factor (SPSS 17.0 Help). This method
simplifies the interpretation of the factors and helps to identify which variables are loaded on
which component. In practice, interpretation of factors is difficult because they are correlated

31
with several variables at a time, but with redistribution of variables, factors become
interpretable. Rotation reduces the number of variables correlated with a given factor, but at
the same time maximizes the size of correlation with a given factor (Chakrapani, 2004).
Ideally, the research identifies the highest loading of each variable on a certain factor and
approximately zero on others. Thus, while looking at the resulting components, information
provided by variables can be represented by five variables. Component 1 includes variables
representing enhanced communication EC1, EC2 and EC3. Variables representing strategic
processing, SP1, SP2 and SP3 come under factor 2. Program success variables PS1, PS2 and
PS3 come under factor 3. Variables representing supplier commitment SC1 and SC2 come
under factor 4, and variables representing LTC1, LTC2 and LTC3 come under factor 5.
Table 5 shows the loading factors for components in a rotated component matrix. Please refer
Appendix B for association of research variables with their respective questions
Table 5. Loadings for Components in Rotated Matrix
Variables Factor 1 2 3 4 5
PS1 0.155 0.183 0.841 0.074 -0.027 PS2 0.444 -0.001 0.318 0.380 0.093 PS3 0.245 0.091 0.742 0.219 0.277 EC1 0.761 0.333 0.037 0.157 -0.097 EC2 0.648 0.153 0.279 0.032 0.215 EC3 0.777 0.001 0.225 -0.176 0.034 SC1 0.164 0.082 0.115 0.697 0.315 SC2 0.118 0.133 0.129 0.827 -0.187 SP1 0.099 0.867 0.213 0.065 0.170 SP2 0.155 0.904 0.034 0.103 0.111 SP3 0.446 0.549 0.224 0.147 0.293
LTC1 0.451 0.365 0.017 0.152 0.556 LTC2 0.496 0.334 -0.217 0.352 0.315 LTC3 0.007 0.175 0.152 0.006 0.849
Now after reviewing the table, the pattern is much clearer. As expected the first factor
is marked by high loadings on the enhanced communication (EC) items, the second factor is
marked by high loadings on strategic processing (SP) items, the third factor is marked by
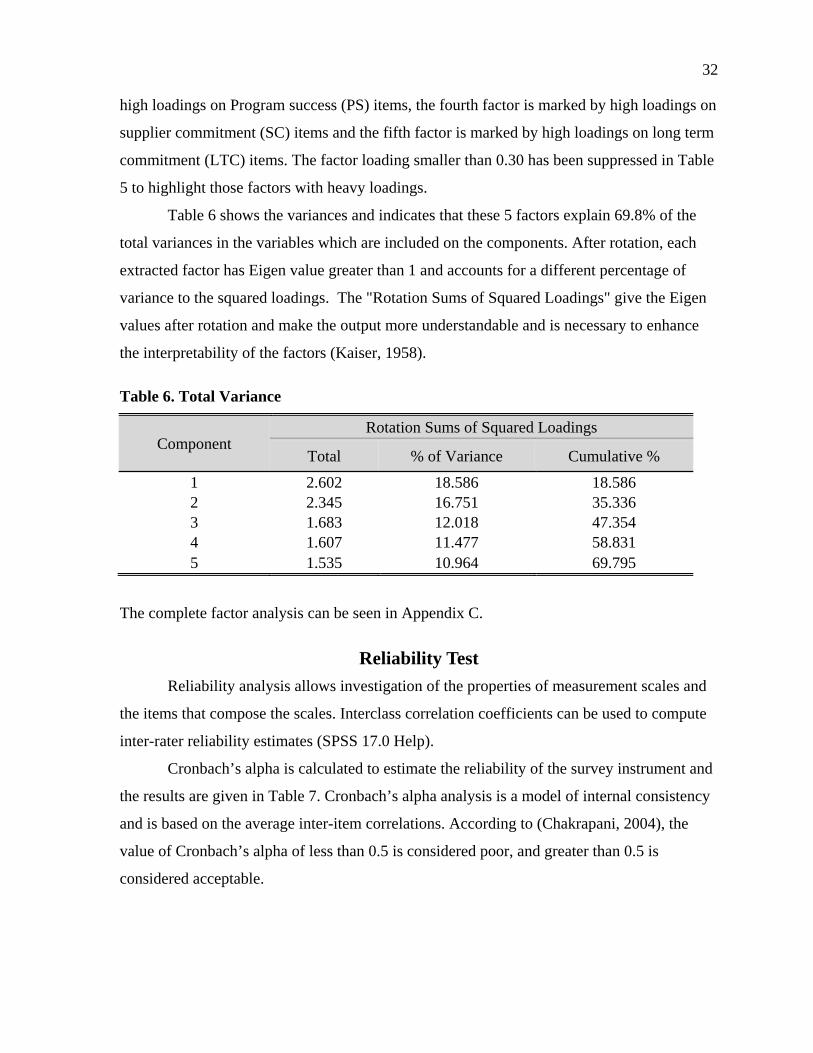
32
high loadings on Program success (PS) items, the fourth factor is marked by high loadings on
supplier commitment (SC) items and the fifth factor is marked by high loadings on long term
commitment (LTC) items. The factor loading smaller than 0.30 has been suppressed in Table
5 to highlight those factors with heavy loadings.
Table 6 shows the variances and indicates that these 5 factors explain 69.8% of the
total variances in the variables which are included on the components. After rotation, each
extracted factor has Eigen value greater than 1 and accounts for a different percentage of
variance to the squared loadings. The "Rotation Sums of Squared Loadings" give the Eigen
values after rotation and make the output more understandable and is necessary to enhance
the interpretability of the factors (Kaiser, 1958).
Table 6. Total Variance
Component Rotation Sums of Squared Loadings
Total % of Variance Cumulative %
1 2.602 18.586 18.586 2 2.345 16.751 35.336 3 1.683 12.018 47.354 4 1.607 11.477 58.831 5 1.535 10.964 69.795
The complete factor analysis can be seen in Appendix C.
Reliability Test
Reliability analysis allows investigation of the properties of measurement scales and
the items that compose the scales. Interclass correlation coefficients can be used to compute
inter-rater reliability estimates (SPSS 17.0 Help).
Cronbach’s alpha is calculated to estimate the reliability of the survey instrument and
the results are given in Table 7. Cronbach’s alpha analysis is a model of internal consistency
and is based on the average inter-item correlations. According to (Chakrapani, 2004), the
value of Cronbach’s alpha of less than 0.5 is considered poor, and greater than 0.5 is
considered acceptable.
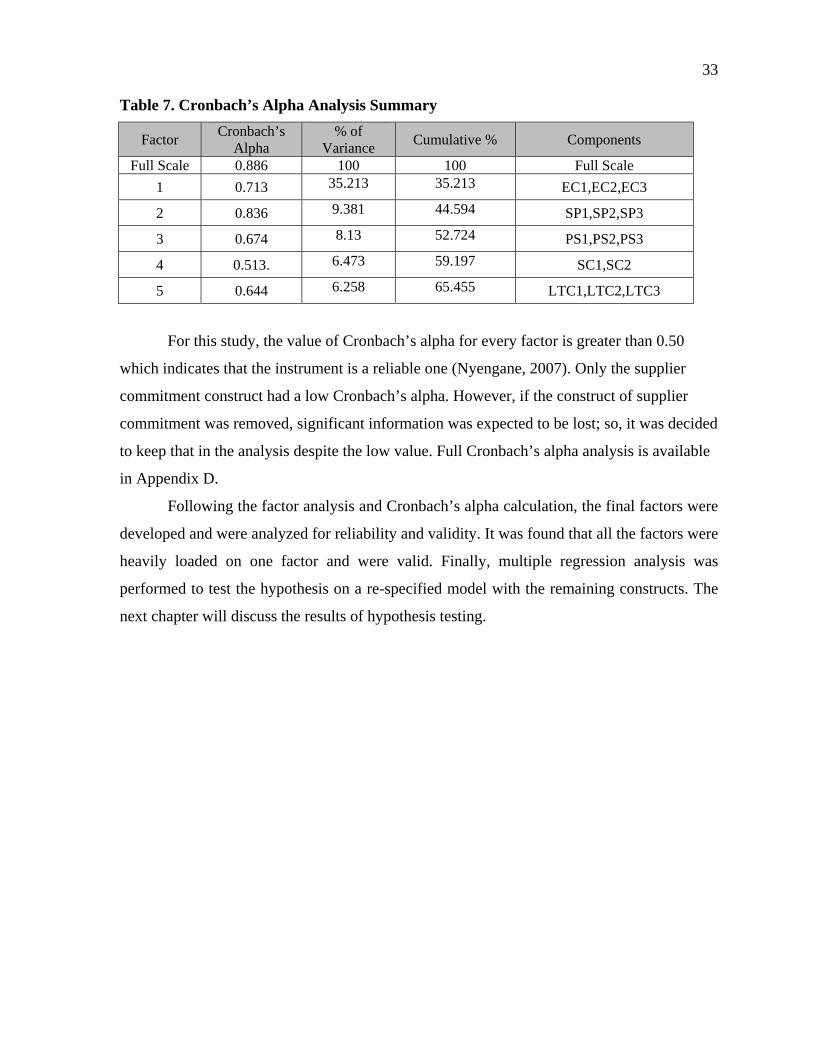
33
Table 7. Cronbach’s Alpha Analysis Summary
Factor Cronbach’s
Alpha % of
Variance Cumulative % Components
Full Scale 0.886 100 100 Full Scale
1 0.713 35.213 35.213 EC1,EC2,EC3
2 0.836 9.381 44.594 SP1,SP2,SP3
3 0.674 8.13 52.724 PS1,PS2,PS3
4 0.513. 6.473 59.197 SC1,SC2
5 0.644 6.258 65.455 LTC1,LTC2,LTC3
For this study, the value of Cronbach’s alpha for every factor is greater than 0.50
which indicates that the instrument is a reliable one (Nyengane, 2007). Only the supplier
commitment construct had a low Cronbach’s alpha. However, if the construct of supplier
commitment was removed, significant information was expected to be lost; so, it was decided
to keep that in the analysis despite the low value. Full Cronbach’s alpha analysis is available
in Appendix D.
Following the factor analysis and Cronbach’s alpha calculation, the final factors were
developed and were analyzed for reliability and validity. It was found that all the factors were
heavily loaded on one factor and were valid. Finally, multiple regression analysis was
performed to test the hypothesis on a re-specified model with the remaining constructs. The
next chapter will discuss the results of hypothesis testing.

34
CHAPTER 6
HYPOTHESIS TESTING
This chapter discusses the testing of hypotheses and provides a summary of the
research. It also discusses the limitations of the research and it concludes with suggestions
for future research.
OVERVIEW
Multiple regression method was used to test the hypotheses outlined in previous
chapters. The original intent of the study was to identify critical factors and their
interrelationships. Multiple regression analysis allows for determining the degree of strength
and the direction of the linear relationship among various variables. Multiple regression
analysis is available in Appendix E. The guidelines to assess the correlation coefficients for
the study are as follows: coefficients of less than 0.5 represent weak relationships,
coefficients greater than 0.5 but less than 0.8 are considered acceptable relationships, and
coefficients greater than 0.8 represent strong relationships (Nyengane, 2007). Originally it
was intended to use the structural equation modeling (SEM), but multiple regressions were
used instead because of a too small sample size and the small number of independent
variables in the survey instrument. Please refer Appendix F for raw survey results. The
backward elimination method was used, to simplify the detection of relevant variables
(Anderson D.R., Sweeney, & Williams, 2009). An advantage of the backward elimination
method is to have considerable joint predictive capability due to their joint nature because
variables do not predict well individually. Backward elimination starts with all of the
predictors in the model. The least significant variable is removed, and the model is refitted.
Each following step removes the least significant variable in the model until all remaining
variables have individual significant values smaller than a certain value, such as 0.05 or 0.10
(Dallal, 2008).

35
Hypothesis One
H1: Strategic processing plays a positive and significant role in the success of supplier
development.
From Table 8, it can be observed that there is a positive but very weak and
insignificant relationship between strategic processing (SP) and the success of supplier
development activities (PS) (r=0.139, sig>0.05). Thus, there is insufficient evidence to
support the hypothesis 1at a 5% level of significance, the relationship between strategic
processing and success of supplier development programs.
Table 8. Summary of Multiple Regression Tests
Model
Unstandardized coefficients
Standardized coefficients
T Sig. B
Std. Error
Beta
1 (Constant) .496 .275 1.803 .075
SPAvg .130 .114 .139 1.145 .256
Hypothesis Two, Four and Five
H2: Strategic processing plays a positive and significant role in upper management
involvement.
H4: Upper management involvement plays a positive and significant role in enhancing
communication.
H5: Upper management involvement plays a positive and significant role in the success of
the supplier development process.
These hypotheses were eliminated because the entire component to measure the
results for upper management involvement was removed, although the relationship was
positive between upper management involvement and the success of supplier development
(r=0.599, sig<0.001).
Because there was a great deal of divergence and convergence of factor loading in the
upper management construct, the upper management involvement components were removed
and the model restated. Because all the components related to the upper management
involvement were removed, these hypotheses were by design rejected and there was no
reason to support them.

36
Hypothesis Three
H3: Strategic processing plays a positive and significant role in supplier recognition in the
form of long term contracts.
From Table 9, it can be observed that there is relative intermediate strength, and a
significant and positive relationship between strategic processing (SP) and long term contract
(LTC) rewards (r=0.581, sig<0.0001).
Table 9. Summary of Results for Hypothesis Three
Model
Unstandardized Coefficients
Standardized Coefficients T Sig.
B Std. Error Beta
1 (Constant) .903 .169
5.348 .000
SPAvg .489 .077 .581 6.343 .000
Thus, there is sufficient evidence to support the hypothesis 3 at a 5% level of
significance, that there is a positive and significant relationship between strategic processing
and supplier recognition.
Hypothesis Six
H6: Supplier recognition in form of long term contracts (LTC) plays a positive and
significant role in the commitment of suppliers (SC).
From Table 10, it can be observed that there is a low strength yet significant and
positive relationship between supplier recognition (LTC) and the commitment of suppliers
(SC) (r=0.270, sig<0.05).
Table 10. Summary of Results for Hypothesis Six
Model
Unstandardized Coefficients
Standardized Coefficients
t Sig.
B Std.
Error Beta
1 (Constant) 1.604 .276
5.821 .000
LTCAvg .342 .137 .270 2.497 .015

37
Thus, there is sufficient evidence to support the hypothesis 6 at a 5% level of
significance, that there is a positive and significant relationship between supplier’s
recognition (LTC) and commitment of suppliers (SC).
Hypothesis Seven
H7: Supplier recognition in the form of long term contracts plays a positive and significant
role in the success of supplier development.
From Table 11. Summary of Results for Hypothesis Seven (Independent)
Model Unstandardized
Coefficients Standardized Coefficients t Sig.
B Std. Error Beta
1 (Constant) 1.296 .234 5.544 .000
LTCAvg .411 .116 .369 3.531 .061
, it can be observed that there is a positive but relatively low strength and insignificant
relationship between long term contracts (LTC) and success in supplier development (PS)
(r=0.369, sig>0.05).
Table 11. Summary of Results for Hypothesis Seven (Independent)
Model Unstandardized
Coefficients Standardized Coefficients t Sig.
B Std. Error Beta
1 (Constant) 1.296 .234 5.544 .000
LTCAvg .411 .116 .369 3.531 .061
Thus, there is insufficient evidence to support the relationship between long term
contracts and the success of supplier development programs at a 5% level of significance.
Hypothesis Eight
H8: Commitment of suppliers plays a positive and significant role in the success of the
supplier development process.

38
From Table 12, it can be observed that there is relatively medium strength but a
significant and positive relationship between commitment of suppliers (SC) and success of
supplier development process (PS) (r=0.233, sig<0.05).
Table 12. Summary of Results for Hypothesis Eight
Model Unstandardized Coefficients
Standardized Coefficients T Sig.
B Std. Error Beta
1 (Constant) .496 .275
1.803 .075
SCAvg .205 .087 .233 2.357 .021 Thus, there is sufficient evidence to support the hypothesis 8 at a 5% level of
significance, that there is a positive and significant relationship between the commitment of
suppliers and the success of supplier development programs.
Hypothesis Nine
H9: Enhanced communication plays a positive and significant role in the success of the
supplier development process.
From Table 13, it can be observed that there is relatively medium strength but a
significant and positive relationship between enhanced communication (EC) and the success
of supplier development (PS) (r=0.350, sig<0.05).
Table 13. Summary of Results for Hypothesis Nine
Model
Unstandardized Coefficients
Standardized Coefficients
T Sig.
B Std.
Error Beta
1 (Constant) .496 .275 1.803 .075
ECAvg .414 .129 .350 3.198 .002
Thus, there is sufficient evidence to support the hypothesis 9 at a 5% level of
significance, that there is a positive and significant relationship between enhanced
communication and the success of the supplier development process.

39
CONCLUSION
Based on the survey results and based on the analysis described previously and in
Appendix D, it was determined that of the nine hypotheses, support was found for four, and
two hypotheses were rejected due to insignificant statistics. It was concluded that supplier
commitment and enhanced communication are the critical factors responsible for the success
of supplier development activities. Moreover, the strategic process and supplier recognition
play indirect roles in the success of supplier development activities by enhancing
communication and rousing supplier commitment.
Table 14 shows that overall there is a positive and linear relationship between all the
factors and the supplier development activities. Also, it was established that the sample data
was normally distributed around the mean and median for all the variables. Summary of all
the hypothesis results and relationships are presented below:
Table 14. Summary of Hypothesis Results
Hypothesis Independent
variable Dependent variable Positive/Negative
Significant relationship with
5% Sig. level
1 Strategic process Success of SD Positive Insignificant
2,4,5 Upper Mgmt Involvement
Success of SD Removed Removed
3 Strategic process Supplier recognition Positive Significant
6 Supplier
recognition Supplier
commitment Positive Significant
7 Supplier
recognition Success of SD Positive Insignificant
8 Supplier
commitment Success of SD Positive Significant
9 Enhanced
communication Success of SD Positive Significant
Additional Strategic process Enhanced
communication Positive Significant
Therefore, Research findings emphasize the benefits of improving communication
between buyers and suppliers; also, research findings emphasize increasing the supplier
commitment toward the supplier development project in order to make the project successful.

40
The key reason for a positive and significant relation between supplier commitment and
success of the program might be that the supplier views the supplier development project as a
help and dedicated effort by the buyers, and thus the commitment reciprocates in the supplier
development projects. Also, it was established that if communication is done efficiently then
the supplier can actually implement the processes as per the buyer’s requirement, and
eventually the improvement or success is a foregone conclusion (Blindenbacj-Driessen,
2009). Moreover, the findings of the research extend the supplier development literature by
indicating the indirect importance of the strategic process across the different projects.
Though previous researches had focused on the factors, such as upper management
involvement and supplier commitment, none of them empirically tested for the relation
between strategic process and success in the supplier development program.
When implementing the supplier development projects, supplier development
professionals should keep proven success factors in mind. Supplier commitment, a verified
success factor from the research, is often difficult to improve. Sometimes suppliers lack the
engineering resources, equipment, information systems, skills or training required, and this
might lead to diminution of commitment, but to overcome this insufficiency, an organization
should adopt a certain methodology. To achieve supplier commitment, buyers must delineate
the potential rewards for the supplier organization or must promise certain improvements
after a fixed interval of time, or else suppliers might not be fully committed towards the
supplier development program. Suppliers might agree to initial proposals but will fail to
implement them due to insufficient dedication or lack of resources. To overcome these
difficulties, buyers could set small goals for suppliers and choose to work on simple projects
where the chances of success are possible in short duration of time to achieve supplier
commitment. Thereafter, spending some additional time and resources, further improvements
in big projects are possible. Also, evaluating suppliers and testing suppliers regarding their
standing after the supplier development program might be helpful to get suppliers committed
towards the program.
In addition, enhanced communication, another proven success factor, should be put
into practice in the supplier development program. Enhancing communication will lead
towards reduction in the dependence of supplier development teams on upper management
directions, and eventually project teams won’t waste time on directions and instructions.
41
Better communication can enhance the commitment of suppliers and eventually improve the
success of supplier development. For example, if every step is communicated appropriately
then every member in the whole chain will know what to do at what time, which eventually
will increase the efficiency and commitment of suppliers. Also, information learned from one
project can then be applied to other projects. Moreover, communication will allow the
creation of a permanent liaison of suppliers with the supplier development teams, which will
result in more successful projects.
Undeniably, the most significant finding is that the supply chain professional cannot
focus on a single factor to make the supplier development program successful. Since all of
the factors in the research had low to medium correlation with the success of supplier
development programs, every factor must be taken into consideration while implementing the
program at any of the supplier’s sites. As a result, only those suppliers will be successful who
have processes that give attention to all the factors collectively.
Supplier development programs must be incorporated with all the factors mentioned
in the literature review, such as strategic process, upper management involvement, enhanced
communication and supplier recognition, and supplier commitment. Buyers must ensure that
all these factors are incorporated in the supplier development programs to obtain positive
results. This can be made possible by a conference or a meeting with upper management
involvement to strategically plan and discuss how to enhance the communication between the
suppliers and buyers and other elements of the program. Also, meetings can provide ways to
identify possible techniques to recognize the suppliers and to improve supplier commitment
towards the supplier development program. For instance in the meeting, upper management
can motivate purchasing managers to achieve bigger milestones in critical areas of supplier
development processes. The whole purchase requirement becomes strategic because of its
impact on finished product quality, technology and total costs. Thus, management must align
supplier development activities within the purchasing strategic plan and for that it is highly
desirable to clearly quantify the past performance, measure the current status of supplier
development process, identify objectives and previous strategies to recognize the strength,
weaknesses, opportunities and threats. If the past performances are not sufficient then upper
management must consider changes in the supplier development strategies and approaches.
Moreover, upper management must endow with resources and the involvement at a level

42
which supports in achieving improvements through the implementation of aggressive
strategy approaches. Aggressive strategy can include frequent visits to suppliers to evaluate
their processes, founding of a system to reward and recognize supplier improvements,
providing training to suppliers, alliance with suppliers in improving existing and new
materials, and involving the supplier in the company’s new product development process. A
strong purchasing mission statement reflects and dives strategic emphasis and alignment.
Development of world class suppliers base can also help in attaining the strong purchasing
mission and strategic alignment
To check the progress and whether the factors are implemented properly can be done
by following up the meetings and confirming that the supplier development program is
equipped with all the resources and management strategies required. To conclude based on
this research, organizations that include all the critical factors mentioned in the thesis may be
more successful. Also, it is concluded that the implementation of strategically-oriented
supplier development activities allows improving the performance of the project.
OVERALL RESEARCH FINDINGS
There are several major points which can be drawn from the findings. The most
important is that the research was successful in finding the critical factors contributing
towards the success of the supplier development program. Moreover, the research adds
richness to the literature by empirically testing the relationships between critical factors and
the success of supplier development program. This research describes seven steps required to
implement supplier development and the critical factors required to make those seven steps
successful. Though several other researchers have attempted to discover factors essential for
the success of the supplier development project, none of them included strategic process and
enhanced communication and the interrelationship between them.
The findings of this research provide evidence that stresses the benefits of enhanced
communication and supplier commitment. However, strategic processes were not directly
related to supplier development projects. This might be due to the temporal nature of
relationships. In other words, sufficient time has not elapsed while implementing strategic
processes since the strategic process is a long process, and the results are not visible in the
43
short term. Thus, it is difficult to analyze the relationship between the strategic process and
the success of supplier development through survey.
FUTURE RESEARCH
Based on this research and literature review, it is still perceived that all the factors are
equivalently related to the success of supplier development. Since the current research was
limited to the sample collected from Monster.com and LinkedIn, there was a limited sample
available from the population. A larger sample and a more specific instrument might be
desirable and might validate the unproven hypotheses. Moreover, extending research directly
to the supplier development group might have changed the perception of the research. Apart
from extending the sample size, to strengthen the research the following recommendations
are suggested: First, this thesis could be applied to specific industry segments, such as
automotive, healthcare or manufacturing. Second, this thesis could be perceived from the
supplier’s point of view, and finally, another measurement technique, Structural Equation
Modeling, could have been used to increase the reliability of the results.
44
REFERENCES
Anderson, D. R., Sweeney, D. J., & Williams, T. A. (2009). Statistics for business and economics. Mason, OH: Cengage Learning.
Anderson, E., & Weitz, B. (1992). The use of pledges to build and sustain committment in distrubution channel. Journal of Marketing Research, 29, 18-34.
Half work with suppliers, half don't. (2000, June 15). Retrieved November 9, 2009, from Purchasing Magzine website: http://www.purchasing.com/article/CA138933.html.
Berlow, M. (1995). For superb supplier development. Purhasing Magzine, 119(4), 32-40.
Blindenbacj-Driessen, F. (2009). The effectiveness of cross-functional innovation teams. Academy of Management Proceedings, 4, 43-47.
Blonska, A., Rozemeijer, F., & Wetzels, M. (2008). The influence of supplier development on gaining a preferential buyer status, supplier adaptation and supplier relational embeddedness. Maastricht, Netherland: Universiteit Maastricht
Cattell, R. B., & Vogelmann, S. (1977). A comprehensive trial of the scree and KG criteria for determining the number of factors. The Journal of Multivariate Behavioural Research, 12, 289-385.
Chakraborty, S., & Philip, T. (1996). Vendor development strategies. Intenrational Journal of Operation and Prodution Management, 16(10), 54-66.
Chakrapani, C. (2004). Statistics in market research. London: Arnold Publisher.
Chidambaranathan, S., Muralidharan, C., & Deshmukh, S. G. (2009). Analyzing the critical factors of supplier development using interpretive structure modeling-an empirical study. Int J Adv Manuf Technol, 43, 1081-1093.
Child, D. (2006). The essentials of factor analysis. New York: Continuum International Publishing Group.
Clarke, A. (2007). An assessment of supplier development practices in a retail environment with particular reference to boots the chemist. Nottingham: Nottingham Publisher.
Cockburn, J., Hill, D., Irwig, L., Luise, T. L., Turnbull, D., & Scofield, P. (1991). Development and validation of an instrument to measure satisfaction of participants at breast screening programmes. European Journal of Cancer and Clinical Oncology, 27(7), 827-831.
Couper, M., Traugott, M., and Lamias, M. (2001). Web survey design and administration. Public Opinion Quaterly, 65(2), 230-253.
Daghfous, A., Campa, F., & Hamde, A. (2008). Customer development: A Knowledge management perspective and a case illustration. Paper presented at the European and Mediterranean Conference on Information Systems, Dubai. Retreived November 09, 2009, from
45
http://74.125.155.132/scholar?q=cache:5BosOOj3JmcJ:scholar.google.com/+"Customer+development:+A+Knowledge+management+perspective+and+a+case+illustration"&hl=en&as_sdt=2000
Dallal, G. E. (2008, July 16). Simplifying a multiple regression equation. Retrieved February 08, 2010, from The Little Handbook of Statistical Practice website: http://www.jerrydallal.com/LHSP/simplify.html
Descriptive statistics. (2010, February 07). Wikipedia. Retrieved February 07, 2010, from http://en.wikipedia.org/wiki/Descriptive_statistics.
Don, G. (2000). Big things happen when you do the little things right. New York: MJF Books.
Dunn, S., & Young, R. (2004). Supplier assistance within supplier development initiatives. The Journal of Supply Chain Management, 40(3), 19-29.
Easton, P. L. (2000). Antecedent conditions to supplier development success. Ann Arbor, MI: Bell and Howell Information and Learning Company.
Ekholm, A., & Pashei, S. (2009). Linking supplier development programmes with conformance quality. Unpublished masters thesis, Lulea University of Technology.
Failure Causes. (1998, August 10). Retrieved November 9, 2009, from IT Cortex website: http://www.it-cortex.com/Stat_Failure_Cause.html
Fink, A. (2003). The survey handbook. Thousand Oaks, CA: SAGE publications.
Forker, L., Ruch, W., & Hershauer, J. (1999). Examining supplier improvements efforts from both sides. Journal of Supply Chain Management, 35(3), 35-40.
Ghijsen, P. W., Semeijn, J., & Ernstson, S. (2006). Supplier satisfaction and commitment:The role of influence strategies and supplier development. Journal of Purchasing & Supply Management, 16(1), 17-26.
Giannakis, M. (2008). Facilitating learning and knowledge transfer through supplier development. Supply Chain Management: An International Journal, 13(1), 62-72.
Gordon, S. (2008). Supplier evaluation and performance excellence. Fort Lauderdale, FL: J.Ross Publishing.
Guinipero, L. C. (1990). Motivating and monitoring JIT supplier performance. Journal of Purchasing and Materials Management , 26(3), 26-56.
Hahn, C. K., Watts, C. A., & Kim, K. Y. (1990). The supplier development program: A conceptual model. Journal of Purchasing and Material Management , 26(2), 2-7.
Handfield, R. B., Krause, D. R., Scannel, T. V., & Monczka, R. M. (2000). Avoid the pitfalls in supplier development. Sloan Management Review, 41(2), 1-37.
Handfield, R. B. (2002, July 19). Supplier Development Strategies and Outcomes. Retrieved November 9, 2009, from The Supply Chain Management website: http://scm.ncsu.edu/public/hot/hot020912.html
Hartley, J., & Choi, T. V. (1996). Supplier development: Customers as a catalyst of process change. Business Horizons, 39(4), 37-44.
46
Hartley, J., & Jones, G. E. (1997). Process oriented supplier development: Building the capability for change. International Journal of Purchasing and Material Management, 33(3), 24-29.
Humphreysa, P. K., Li, W. L., & Chan, L. Y. (2004). The impact of supplier development on buyer supplier performance. The International Journal of Management Science, 32(2), 131-143.
Hyatt, J. (2009, October 1). New calculas of outsourcing. Retrieved November 09, 2009, from CFO website: http://www.cfo.com/article.cfm/14443115/c2984287/?f=archives.
Jacoby, J., & Matell, M. (1971). Three point likert scales are good enough. Journal of Marketing Research, 8(4), 495-500.
Janes, J. (1999). On research survey construction. Library Hi Tech, 17(3), 321-325.
Jim. (2008, Aug 27). Statistical Methods. Retrieved February 07, 2010, from Evolutionart Media website: http://evolutionarymedia.com/cgi-bin/wiki.cgi?StatisticalMethods,template.html
Kaiser, H. F. (1958). The varimax criterion for analytic rotation in factor analysis. Psychometrika, 23(3), 187-200.
Kitchenham, B., & Pfleeger, S. L. (2002). Principles of survey research, Part 3: Constructing survey instrument. Software Engineering Notes, 27(2), 343-456.
Krause, D. R. (2002). Supplier development practices: product- and service-based industry comparisons. Journal of Supply Chain Management, 40(5), 554-571.
Krause, D. R. (1997). Supplier development: Current practices and outcomes. International Journal of Purchasing and Materials Management, 33(2), 12-19.
Krause, D. R., & Ellram, L. L. (1997). Success factors in supplier development. International Journal of Physical and Distribution Logistic Management, 27(1), 39-52.
Krause, D. R., Handfield, R. B., & Scannell, T. V. (1998). An empirical investigation of supplier development: Reactive and strategic processes. Journal of Operation Management, 17(1) , 39-58.
Krause, D. R., Handfield, R. B., & Tyler, B. B. (2007). The relationships between supplier development, commitment, social and capital accumulation and performance improvement. Journal of Operations Management, 25(2), 528-545.
Krause, D. R., Ragatz, G. L., & Hughley, S. (1999). Supplier development from the minority supplier's perspective. Journal of Supply Chain Management, 35(4), 33-39.
Krause, D.R. (1997). Supplier development: current practices and outcomes. International Journal of Purchaing and Materials Management, 23(2), 12-19.
Krause, D.R., & Ellram, L. M. (1997). Critical elements of supplier development. European Journal of Purchsing and Supply Management, 3(1), 21-31.
Lascelles, D. M., & Dale, B. G. (1989). The buyer supplier relationships in total quality management. Journal of Purchasing and Material Management, 7(4), 253-264.

47
Li, L. W., Humphreys, P., Chan, L. Y., & Kumaraswamy, M. (2003). Predicting purchasing performance: The role of supplier development programs. Journal of Materials Processing Technology, 138(1), 243-249.
Lia, W. l., Humphreys, P. K., Yeung, A. C., & Cheng, T. E. (2007). The impact of specific supplier development efforts on buyer competitive advantage: An empirical model. Int. J. Production Economics, 106(1), 230-247.
Litwin, M. (1995). How to measure survey relaibility and validity. Thousand Oaks, CA: SAGE publications.
Mardia, K. V. (1974). Applications of some measures of multivariate skewness and Kurtosis in testing normality and robustness studies. The Indian Journal of Statistics, 36(2), 115-128.
Matook, S., Lasch, R., & Tamaschke, R. (2009). Supplier development with benchmarking as part of a comprehensive suppler risk management framework. International Journal of Operation and Production Management, 29(3), 241-267.
McDuffie, J. P., & Helper, S. (1997). Creating lean Suppliers: diffusing lean production through supply chain. California Management Review, 39(4), 118-151.
Modi, S., & Mabert, V. M. (2009). Supplier development: Improving supplier performance through knowledge transfer. Journal of Operations Management, 25(1), 42-64.
Monczka, R. M., Peterson, K. J., Handfield, R. B., & Ragatz, G. L. (1998). Success factors in strategic supplier alliances. Decision Science, 29(3), 553-577.
Monczka, R.M., Handfield, R., Glunipero, L., & Patterson, J. (2009). Purchasing and supply chain management. Mason, OH: South Western Cenage Learning.
Monnczka, R. M., Trent, R. J., & Callahan, T. J. (1993). Supply base strategies to maximize supplier performace. International Journal of Physical Distribution and Logistics Management, 23(4), 42-55.
Narasimhan, R., Talluri, S., & Mahapatra, S. (2008). Effective response to RFQs and supplier development: A suppliers percepective. Int. J. Production Economics, 115(2), 461-470.
Nelson, D., Moody, P., & Stegner, J. (2005). The incredible payback. New York City, NY: AMACOM.
Nilsson, F., & Soderstorm, C. (2005). The future of marketing research. Unpublished masters thesis, Lund Institute of Technology.
Novak, C. J. (2008). Correlation study of organization factors that influence supplier development: A buyer firm's percepective . Ann Arbor, MI: ProQuest LLC.
Nyengane, M. H. (2007). The relationship between leadership style and employee committment: an exploratory study in an electricity utility of South Africa. Unpublished masters thesis, Rhodes University.
Pazirandeh, A., & Mattsson, S. (2009). Supply chain development within volvo penta chain. Unpublished masters thesis, University College of Borås.
48
Prahinski, C., & Benton, W. C. (2004). Supplier evaluations: communication strategies to improve supplier performance. Journal of Operations Management, 22(1), 39-62.
Reed, F., & Walsh, K. (2002). Enhancing Technological Capability Through Supplier Development: A Study of the U.K. Aerospace Industry. IEEE Transactions on Engineering Management, 49(3), 231-242.
Likert, R. (1932). A technique for the measurement of attitudes. Archives of Pyschology, 22(140), 1-55.
Rhodes, E., Warren, J., & Carter, R. (2006). Supply chain and total product systems: OU reader. Malden, Massachusetts: Blackwell.
Rodriguez, C. S., Hemsworth, D., & Martinez, A. R. (2005). Effect of supplier development initiatives on supplier performance: a structural model. Supply Chain Management: A International Journal, 10(4), 289-301.
Sako, M. (2004). Supplier development at honda, nissan and toyota: Comparative case studies of organizational capability enhancement. Industrial and Corporate Change, 13(2), 281-308.
Sample size formulas for our sample size calculator. (n.d.). Retrieved November 11, 2009, from Survey System website: http://www.surveysystem.com/sample-size-formula.html
Susan, A. (2008). Supplier follow a roadmap to Lean. Purchaisingdata Magzine, 118(4), 53-55.
Tamir, G. (2008). Aspects of successul offshoring projects. Unpublished masters thesis, San Diego State University.
Taub, S. (2006, March 20). Dell doubles up on india headcount. Retrieved December 3, 2009, from CFONet website: http://www.cfo.com/article.cfm/5650889?f=search
Terpend, R., Tyler, B. B., Daniel, K., & Handfield, R. (2008). Buyer supplier relationship:Derived value over two decades. Journal of Supply Chain Management, 44(2), 28-67.
Tunstall, T. (2002). Responsible for supplier development, initiation of operations and commercial agreement signature procurement. Dallas, TX: EDUCASE.
Wagner, S. M. (2006). Supplier development practices: An exploratory study. European Journal of Marketing, 40(5), 554-571.
Wagner, S.M., & Krause, D. (2009). Supplier development: Communication approaches,activities and goals. International Journal of Production Research, 47(12), 3161-3177.
Wang, F.-K., Du, T.-S., & Li, E.-Y. (2004). Applying six sigma to supplier development. Total Quality Management & Business Excellance, 15(9), 1217-1229, .
Watts, C. K., & Hahn, C. K. (1993). Supplier development program:an empirical analysis. International Journal of Purchasing and Materials Management, 29(2), 10-17.
Weele, V., & Arjan, J. (2002). Strategic direction through purchasing portfolio management: A case study. Journal of Supply Chain Management, 38(2), 30-38.

49
Whitfield, G. L. (2006). Supplier diversity effectiveness: does organizational culture really matter? Journal of Supply Chain Management, 42(4), 16-28.
Wisner, J. D., Tan, K. C., & Leong, G. K. (2009). Principles of supply chain management. Mason, OH: South Western Cenange Learning.

50
APPENDIX A
COVER LETTER FOR SURVEY

51
Welcome to our Supplier development survey.
Dear Sir/Madam,
I am Logeek Shrimali, an MBA Student at San Diego State University (SDSU). It is my great
honor to invite you to participate in a brief survey to gather information on supplier
development programs. The information gathered by this survey will be analyzed in a thesis
which will examine factors associated with the success of supplier development strategies. A
theory will put forward that a specific set of factors are significant contributors to successful
supplier development programs.
Please take out 5-10 minutes to answer this 19 question survey about your experience. Your
viewpoint is extremely important for success of this thesis.
Please note that all the information provided by you will remain confidential and no
individual responses will be identified. Please answer fully and honestly as you can. In order
to express my sincere gratitude, I will be happy to share the conclusion and reports of my
thesis upon request.
If you have any questions related to this study, please do not hesitate to contact Logeek
Shrimali ([email protected]), Dr. Fred Raafat ([email protected]) or Dr. Robert
Judge ([email protected]).
I will greatly appreciate your time and contribution to this research.
With Best Regards,
Logeek Shrimali
(619) 315-1624

52
APPENDIX B
SURVEY INSTRUMENT
53
Introduction
Welcome to our supplier development survey
Dear Sir/Madam,
I am Logeek Shrimali, an MBA Student at San Diego State University (SDSU). It is my great honor to invite you to participate in a brief survey to gather information on supplier development programs. The information gathered by this survey will be analyzed in a thesis which will examine factors associated with the success of supplier development strategies. A theory will put forward that a specific set of factors are significant contributors to successful supplier development programs.
Please take out 5-10 minutes to answer this 19 question survey about your experience. Your view point is extremely important for success of this thesis. Please note that all the information provided by you will remain confidential and no individual responses will be identified. Please answer fully and honestly as you can. In order to express my sincere gratitude, I will be happy to share the conclusion and reports of my thesis upon request. If you have any questions related to this study, please do not hesitate to contact Logeek Shrimali ([email protected]), Dr. Fred Raafat ([email protected]) or Dr. Robert Judge ([email protected]). I greatly appreciate your time and contribution to this research. With Best Regards, Logeek Shrimali [email protected] ( Please refer to the most recently completed supplier development program while answer ing the questions below
Research Variable-Success of supplier development (PS) Q.1 The objectives of the supplier development program were met
Strongly Agree
Agree
Neither Agree nor Dis agree
Dis agree
Strongly Dis agree

54
Q.2 During the supplier development program suppliers learned new processes
Strongly Agree
Agree
Neither Agree nor Dis agree
Dis agree
Strongly Dis agree
Q.3 We observed that progress continued even after the supplier development program was ended
Strongly Agree
Agree
Neither Agree nor Dis agree
Dis agree
Strongly Dis agree Q.4 Suppliers w ere ISO 9000 certified
Strongly Agree
Agree
Neither Agree nor Dis agree
Dis agree
Strongly Dis agree
Research Variable-Effective communication (EC) Q.5 We provided a clear picture of the anticipated positive impact that the supplier development program will have on supplier's business
Strongly Agree
Agree
Neither Agree nor Dis agree
Dis agree
Strongly Dis agree Q.6 We communicated with supplier at regular interval
Strongly Agree
Agree

55
Neither Agree nor Dis agree
Dis agree
Strongly Dis agree Q.7 We communicated accurately quality requirements with supplier
Strongly Agree
Agree
Neither Agree nor Dis agree
Dis agree
Strongly Dis agree
Research Variable-Supplier commitment (SC) Q.8 Supplier provided several suggestions to enhance the supplier development program
Strongly Agree
Agree
Neither Agree nor Dis agree
Dis agree
Strongly Dis agree Q.9 Supplier w as concerned about the success of supplier development program
Strongly Agree
Agree
Neither Agree nor Dis agree
Dis agree
Strongly Dis agree Q.10 Supplier changed processes/equipment as per our recommendation
Strongly Agree
Agree
Neither Agree nor Dis agree
Dis agree
Strongly Dis agree

56
Research Variable-Upper management involvement (UMI) Q.11There w ere regular review s of supplier development performance in our top management meetings
Strongly Agree
Agree
Neither Agree nor Dis agree
Dis agree
Strongly Dis agree Q.12There w as participation by supplier's department heads in the supplier development process
Strongly Agree
Agree
Neither Agree nor Dis agree
Dis agree
Strongly Dis agree
Q.13 Top management w as supportive of supplier's efforts in supplier development
Strongly Agree
Agree
Neither Agree nor Dis agree
Dis agree
Strongly Dis agree
Research Variable- Strategic Process (SP) Q.14 The supplier development program helped our organization to get some advantage over our rivals (Competitive advantage strategy)
Strongly Agree
Agree
Neither Agree nor Dis agree
Dis agree
Strongly Dis agree
Q.15 The supplier development program helped our organization to secure a cost advantage of some kind – lower average cost, lower labor costs, etc.(Cost advantage strategy)
57
Strongly Agree
Agree
Neither Agree nor Dis agree
Dis agree
Strongly Dis agree Q.16 The Supplier Development Program helped our organization to look at new ways of doing the things to leverage our organization performance (Re engineering strategy)
Strongly Agree
Agree
Neither Agree nor Dis agree
Dis agree
Strongly Dis agree
Research Variable-Long term contract and rewards (LTC) Q.17 Suppliers expected that w e will be doing business with them for the long term
Strongly Agree
Agree
Neither Agree nor Dis agree
Dis agree
Strongly Dis agree
Q.18 We invited suppliers to our site to increase their awareness of how their product is used
Strongly Agree
Agree
Neither Agree nor Dis agree
Dis agree
Strongly Dis agree
Q.19We promised benefits to the supplier's, such as consideration for future business
Strongly Agree
Agree
Neither Agree nor Dis agree
Dis agree
Strongly Dis agree

58
APPENDIX C
FACTOR ANALYSIS

59
FACTOR ANALYSIS (1ST ITERATION WITH 6 FACTORS)
Table 15. Communalities for Six Independent Variables
Initial Extraction
PS1 1.000 .695
PS2 1.000 .459
PS3 1.000 .621
EC1 1.000 .713
EC2 1.000 .578
EC3 1.000 .636
SC1 1.000 .555
SC2 1.000 .728
SP1 1.000 .825
SP2 1.000 .829
SP3 1.000 .643
LTC1 1.000 .681
LTC2 1.000 .619
LTC3 1.000 .662
SC3 1.000 .595
UMI1 1.000 .523
UMI2 1.000 .563
UMI3 1.000 .684
Extraction Method: Principal Component Analysis.

60
Table 16. Total Variance with Six Variables
Compo
nent
Initial Eigen values Rotation Sums of Squared Loadings
Total % of Variance Cumulative % Total % of Variance Cumulative %
1 6.321 35.115 35.115 2.897 16.095 16.095
2 1.721 9.563 44.679 2.642 14.678 30.773
3 1.393 7.740 52.419 2.493 13.848 44.621
4 1.109 6.163 58.582 1.675 9.304 53.925
5 1.064 5.911 64.493 1.501 8.339 62.265
6 .913 5.070 69.563 1.314 7.298 69.563
7 .842 4.676 74.239
8 .726 4.031 78.270
9 .637 3.541 81.810
10 .591 3.281 85.092
11 .545 3.027 88.119
12 .466 2.589 90.708
13 .446 2.478 93.186
14 .354 1.965 95.151
15 .312 1.732 96.883
16 .242 1.346 98.229
17 .189 1.047 99.276
18 .130 .724 100.000
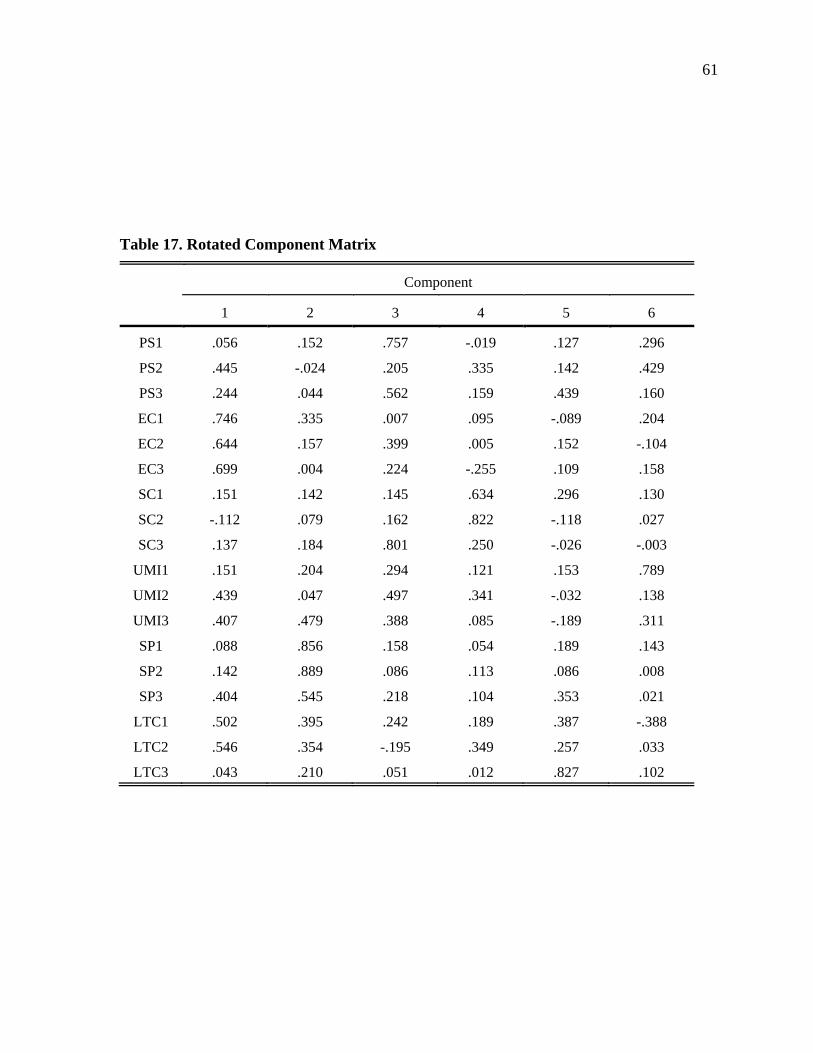
61
Table 17. Rotated Component Matrix
Component
1 2 3 4 5 6
PS1 .056 .152 .757 -.019 .127 .296
PS2 .445 -.024 .205 .335 .142 .429
PS3 .244 .044 .562 .159 .439 .160
EC1 .746 .335 .007 .095 -.089 .204
EC2 .644 .157 .399 .005 .152 -.104
EC3 .699 .004 .224 -.255 .109 .158
SC1 .151 .142 .145 .634 .296 .130
SC2 -.112 .079 .162 .822 -.118 .027
SC3 .137 .184 .801 .250 -.026 -.003
UMI1 .151 .204 .294 .121 .153 .789
UMI2 .439 .047 .497 .341 -.032 .138
UMI3 .407 .479 .388 .085 -.189 .311
SP1 .088 .856 .158 .054 .189 .143
SP2 .142 .889 .086 .113 .086 .008
SP3 .404 .545 .218 .104 .353 .021
LTC1 .502 .395 .242 .189 .387 -.388
LTC2 .546 .354 -.195 .349 .257 .033
LTC3 .043 .210 .051 .012 .827 .102

62
Table 18. Component Transformation Matrix
Component 1 2 3 4 5 6
1 .564 .501 .478 .278 .276 .221
2 -.152 -.575 .623 .225 -.252 .378
3 -.642 .328 -.039 .682 .115 -.024
4 .496 -.311 -.386 .633 -.266 -.191
5 .008 -.450 .081 .078 .830 -.309
6 .018 -.102 -.475 .018 .296 .822
FACTOR ANALYSIS (2ND ITERATION WITH 5 FACTORS)
Table 19. Communalities for Five Independent Variables
Initial Extraction
PS1 1.000 .771
PS2 1.000 .451
PS3 1.000 .743
EC1 1.000 .726
EC2 1.000 .568
EC3 1.000 .686
SC1 1.000 .632
SC2 1.000 .767
SP1 1.000 .841
SP2 1.000 .865
SP3 1.000 .652
LTC1 1.000 .669
LTC2 1.000 .624
LTC3 1.000 .775

63
Table 20. Total Variance With 2nd Iteration
Com
pone
nt
Initial Eigen values Extraction Sums of Squared
Loadings
Rotation Sums of Squared
Loadings
Total % of
Variance
Cumulative
% Total
% of
Variance
Cumulative
% Total
% of
Variance
Cumulative
%
1 5.007 35.762 35.762 5.007 35.762 35.762 2.602 18.586 18.586
2 1.408 10.056 45.818 1.408 10.056 45.818 2.345 16.751 35.336
3 1.354 9.670 55.488 1.354 9.670 55.488 1.683 12.018 47.354
4 1.057 7.551 63.039 1.057 7.551 63.039 1.607 11.477 58.831
5 .946 6.757 69.795 .946 6.757 69.795 1.535 10.964 69.795
6 .738 5.270 75.065
7 .647 4.622 79.687
8 .581 4.149 83.835
9 .540 3.860 87.696
10 .460 3.286 90.982
11 .405 2.896 93.878
12 .349 2.495 96.373
13 .327 2.338 98.710
14 .181 1.290 100.000
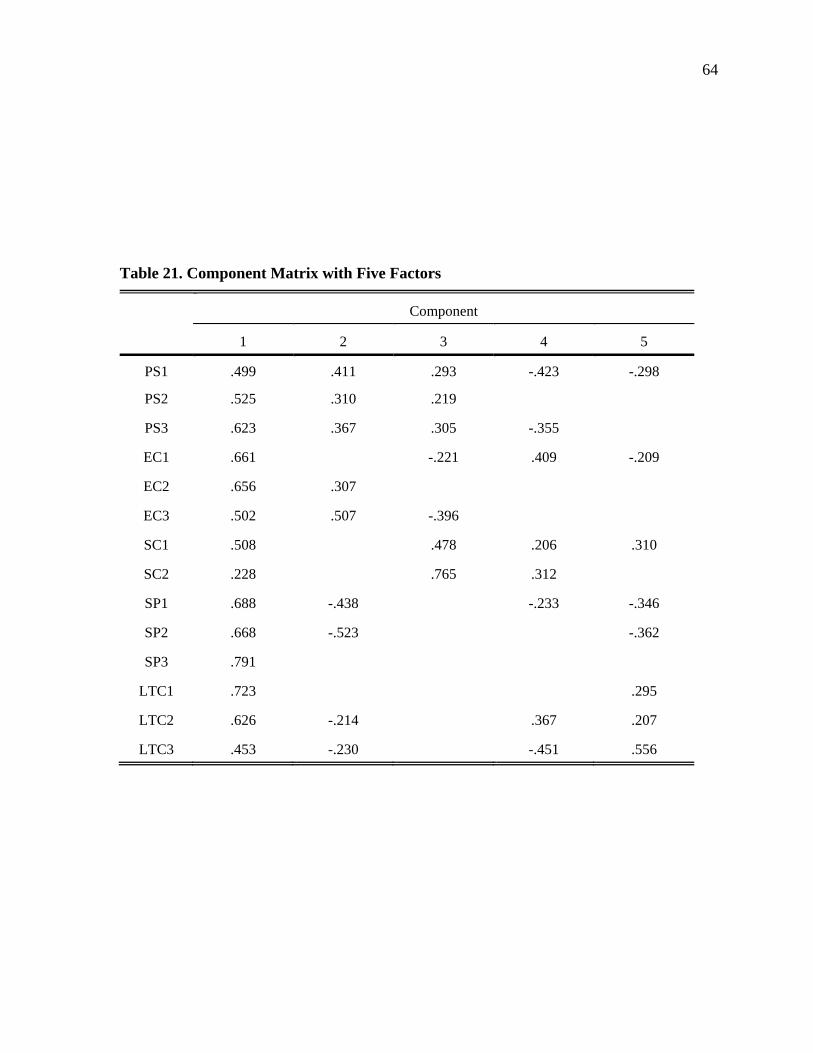
64
Table 21. Component Matrix with Five Factors
Component
1 2 3 4 5
PS1 .499 .411 .293 -.423 -.298
PS2 .525 .310 .219
PS3 .623 .367 .305 -.355
EC1 .661 -.221 .409 -.209
EC2 .656 .307
EC3 .502 .507 -.396
SC1 .508 .478 .206 .310
SC2 .228 .765 .312
SP1 .688 -.438 -.233 -.346
SP2 .668 -.523 -.362
SP3 .791
LTC1 .723 .295
LTC2 .626 -.214 .367 .207
LTC3 .453 -.230 -.451 .556
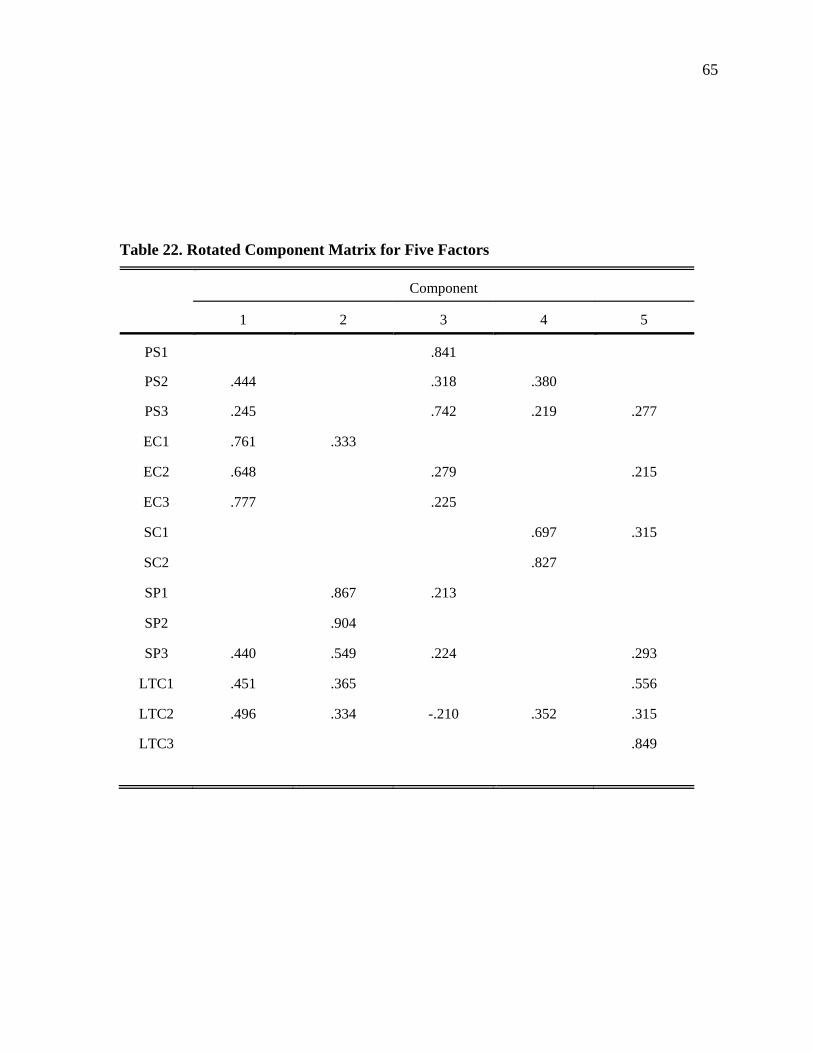
65
Table 22. Rotated Component Matrix for Five Factors
Component
1 2 3 4 5
PS1 .841
PS2 .444 .318 .380
PS3 .245 .742 .219 .277
EC1 .761 .333
EC2 .648 .279 .215
EC3 .777 .225
SC1 .697 .315
SC2 .827
SP1 .867 .213
SP2 .904
SP3 .440 .549 .224 .293
LTC1 .451 .365 .556
LTC2 .496 .334 -.210 .352 .315
LTC3 .849

66
Table 23. Component Transformation Matrix
Component 1 2 3 4 5
1 .598 .544 .350 .301 .365
2 .474 -.636 .544 -.139 -.234
3 -.435 -.125 .382 .796 -.125
4 .478 -.133 -.616 .475 -.386
5 .029 -.515 -.237 .174 .805

67
APPENDIX D
CRONBACH’S ALPHA ANALYSIS

68
Table 24. Case Processing Summary for Full Scale
N %
Cases
Valid 81 100.0
Excludeda 0 .0
Total 81 100.0
Table 25. Reliability Statistics for Full Scale
Cronbach's Alpha N of Items
.845 14
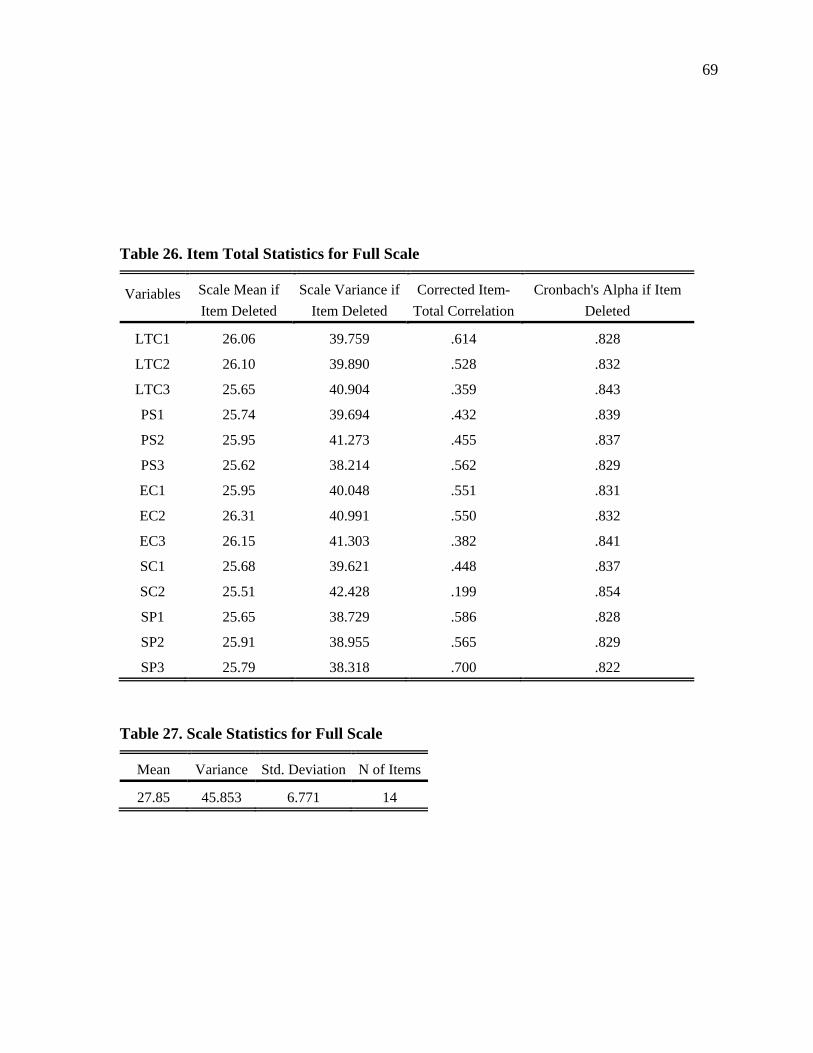
69
Table 26. Item Total Statistics for Full Scale
Variables Scale Mean if
Item Deleted
Scale Variance if
Item Deleted
Corrected Item-
Total Correlation
Cronbach's Alpha if Item
Deleted
LTC1 26.06 39.759 .614 .828
LTC2 26.10 39.890 .528 .832
LTC3 25.65 40.904 .359 .843
PS1 25.74 39.694 .432 .839
PS2 25.95 41.273 .455 .837
PS3 25.62 38.214 .562 .829
EC1 25.95 40.048 .551 .831
EC2 26.31 40.991 .550 .832
EC3 26.15 41.303 .382 .841
SC1 25.68 39.621 .448 .837
SC2 25.51 42.428 .199 .854
SP1 25.65 38.729 .586 .828
SP2 25.91 38.955 .565 .829
SP3 25.79 38.318 .700 .822
Table 27. Scale Statistics for Full Scale
Mean Variance Std. Deviation N of Items
27.85 45.853 6.771 14
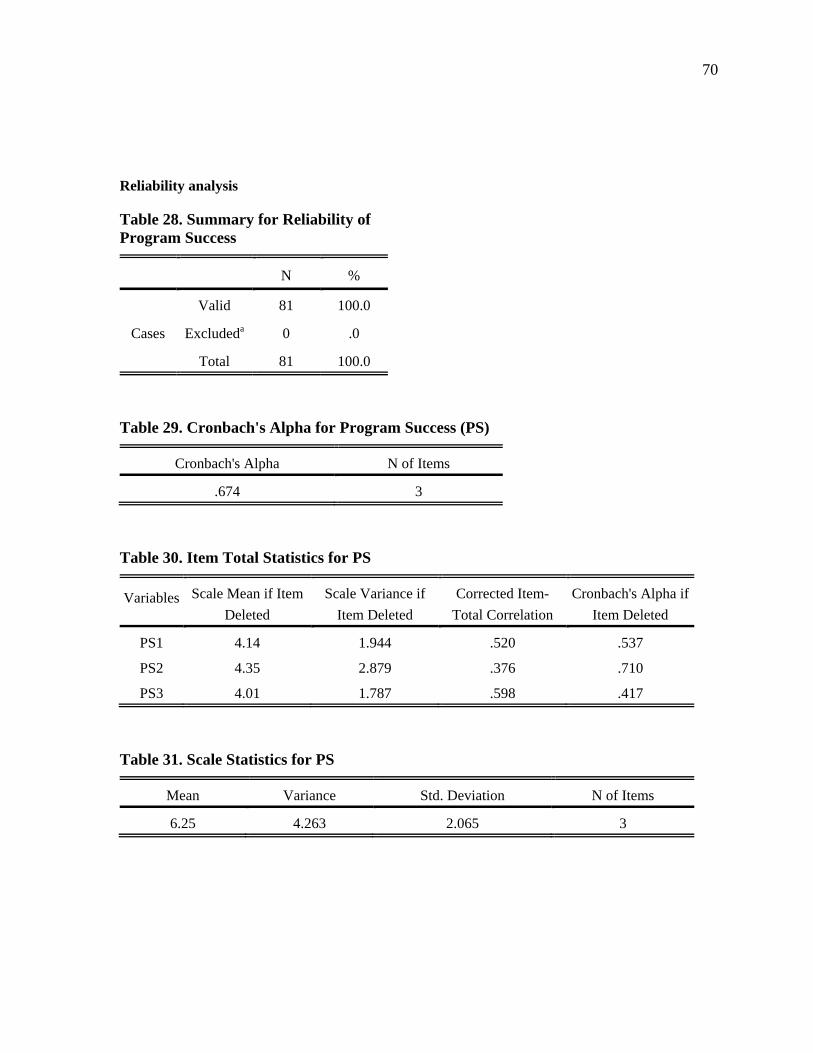
70
Reliability analysis
Table 28. Summary for Reliability of Program Success
N %
Cases
Valid 81 100.0
Excludeda 0 .0
Total 81 100.0
Table 29. Cronbach's Alpha for Program Success (PS)
Cronbach's Alpha N of Items
.674 3
Table 30. Item Total Statistics for PS
Variables Scale Mean if Item
Deleted
Scale Variance if
Item Deleted
Corrected Item-
Total Correlation
Cronbach's Alpha if
Item Deleted
PS1 4.14 1.944 .520 .537
PS2 4.35 2.879 .376 .710
PS3 4.01 1.787 .598 .417
Table 31. Scale Statistics for PS
Mean Variance Std. Deviation N of Items
6.25 4.263 2.065 3

71
Reliability analysis
Table 32. Summary for Reliability of Effective Communication (EC)
N %
Cases
Valid 81 100.0
Excludeda 0 .0
Total 81 100.0
Table 33. Reliability Statistics for Effective Communication
Cronbach's Alpha N of Items
.713 3
Table 34. Item-Total Statistics for EC
Variables Scale Mean if Item
Deleted
Scale Variance if
Item Deleted
Corrected Item-
Total Correlation
Cronbach's Alpha if
Item Deleted
EC1 3.25 1.463 .563 .582
EC2 3.60 1.767 .525 .640
EC3 3.44 1.425 .521 .644
Table 35. Scale Statistics for EC
Mean Variance Std. Deviation N of Items
5.15 3.053 1.747 3

72
Reliability analysis
Table 36. Summary for Reliability of Supplier Commitment (SC)
N %
Cases
Valid 81 100.0
Excludeda 0 .0
Total 81 100.0
Table 37. Reliability Statistics for SC
Cronbach's Alpha N of Items
.513 2
Table 38. Item Total Statistics for SC
Variables Scale Mean if Item
Deleted
Scale Variance if
Item Deleted
Corrected Item-
Total Correlation
Cronbach's Alpha if
Item Deleted
SC1 2.35 .929 .345 .a
SC2 2.17 .895 .345 .a
Table 39. Scale Statistics for SC
Mean Variance Std. Deviation N of Items
4.52 2.453 1.566 2
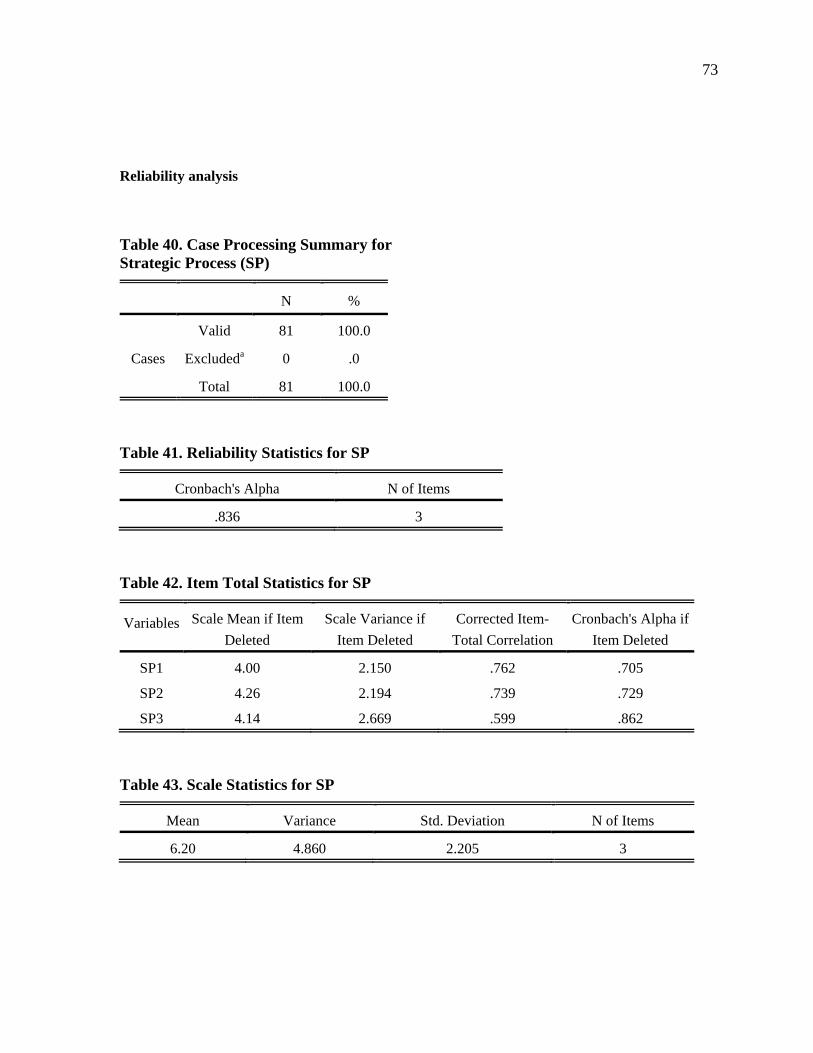
73
Reliability analysis
Table 40. Case Processing Summary for Strategic Process (SP)
N %
Cases
Valid 81 100.0
Excludeda 0 .0
Total 81 100.0
Table 41. Reliability Statistics for SP
Cronbach's Alpha N of Items
.836 3
Table 42. Item Total Statistics for SP
Variables Scale Mean if Item
Deleted
Scale Variance if
Item Deleted
Corrected Item-
Total Correlation
Cronbach's Alpha if
Item Deleted
SP1 4.00 2.150 .762 .705
SP2 4.26 2.194 .739 .729
SP3 4.14 2.669 .599 .862
Table 43. Scale Statistics for SP
Mean Variance Std. Deviation N of Items
6.20 4.860 2.205 3
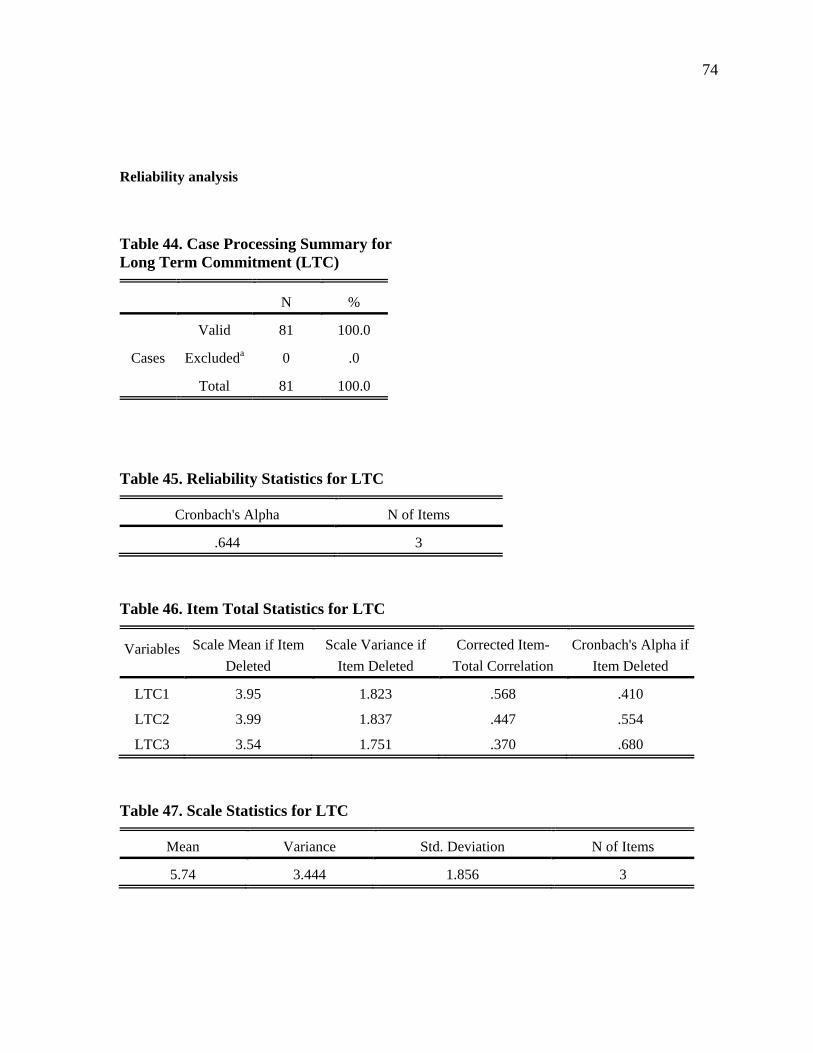
74
Reliability analysis
Table 44. Case Processing Summary for Long Term Commitment (LTC)
N %
Cases
Valid 81 100.0
Excludeda 0 .0
Total 81 100.0
Table 45. Reliability Statistics for LTC
Cronbach's Alpha N of Items
.644 3
Table 46. Item Total Statistics for LTC
Variables Scale Mean if Item
Deleted
Scale Variance if
Item Deleted
Corrected Item-
Total Correlation
Cronbach's Alpha if
Item Deleted
LTC1 3.95 1.823 .568 .410
LTC2 3.99 1.837 .447 .554
LTC3 3.54 1.751 .370 .680
Table 47. Scale Statistics for LTC
Mean Variance Std. Deviation N of Items
5.74 3.444 1.856 3

75
APPENDIX E
MULTIPLE REGRESSION ANALYSIS
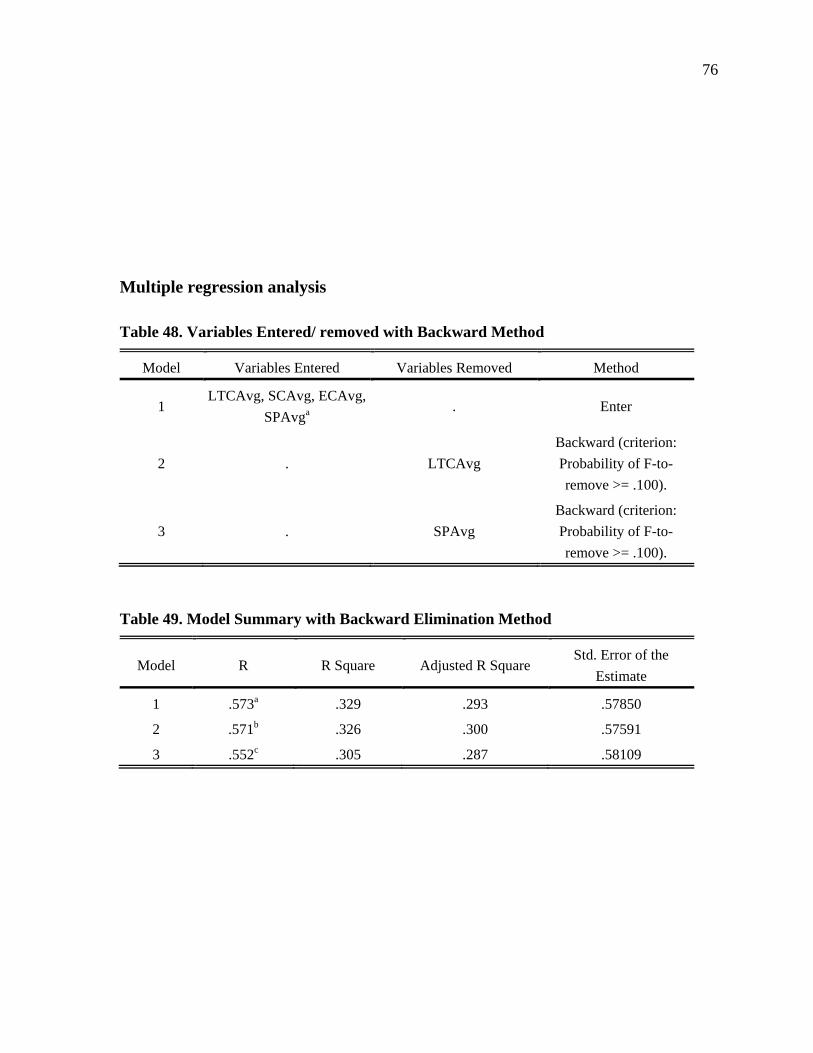
76
Multiple regression analysis
Table 48. Variables Entered/ removed with Backward Method
Model Variables Entered Variables Removed Method
1 LTCAvg, SCAvg, ECAvg,
SPAvga . Enter
2 . LTCAvg
Backward (criterion:
Probability of F-to-
remove >= .100).
3 . SPAvg
Backward (criterion:
Probability of F-to-
remove >= .100).
Table 49. Model Summary with Backward Elimination Method
Model R R Square Adjusted R Square Std. Error of the
Estimate
1 .573a .329 .293 .57850
2 .571b .326 .300 .57591
3 .552c .305 .287 .58109
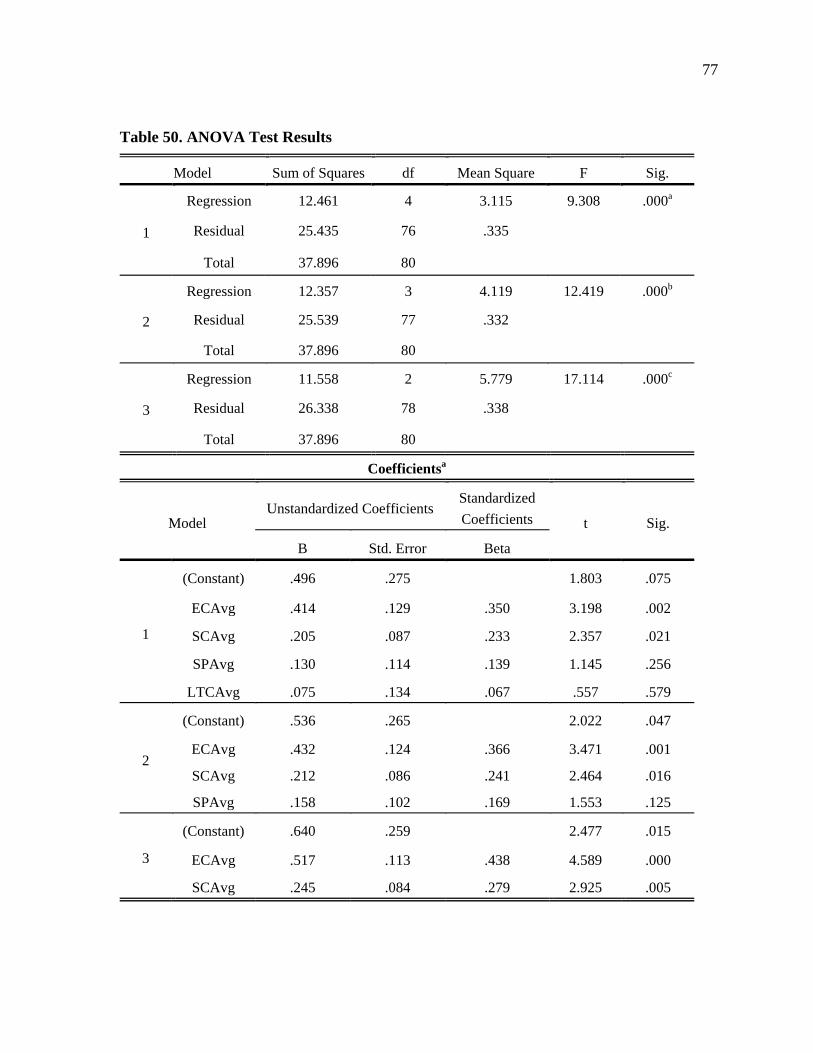
77
Table 50. ANOVA Test Results
Model Sum of Squares df Mean Square F Sig.
1
Regression 12.461 4 3.115 9.308 .000a
Residual 25.435 76 .335
Total 37.896 80
2
Regression 12.357 3 4.119 12.419 .000b
Residual 25.539 77 .332
Total 37.896 80
3
Regression 11.558 2 5.779 17.114 .000c
Residual 26.338 78 .338
Total 37.896 80
Coefficientsa
Model Unstandardized Coefficients
Standardized
Coefficients t Sig.
B Std. Error Beta
1
(Constant) .496 .275 1.803 .075
ECAvg .414 .129 .350 3.198 .002
SCAvg .205 .087 .233 2.357 .021
SPAvg .130 .114 .139 1.145 .256
LTCAvg .075 .134 .067 .557 .579
2
(Constant) .536 .265 2.022 .047
ECAvg .432 .124 .366 3.471 .001
SCAvg .212 .086 .241 2.464 .016
SPAvg .158 .102 .169 1.553 .125
3
(Constant) .640 .259 2.477 .015
ECAvg .517 .113 .438 4.589 .000
SCAvg .245 .084 .279 2.925 .005

78
Table 51. Excluded Variables from Regression
Model Beta In T Sig. Partial
Correlation
Co linearity Statistics
Tolerance
2 LTCAvg .067a .557 .579 .064 .609
3 LTCAvg .128b 1.176 .243 .133 .753
SPAvg .169b 1.553 .125 .174 .739
Regression analysis
Table 52. Variables Entered with Enter Method, Dependent-LTCAvg
Model Variables
Entered
Variables
Removed Method
1 SPAvga . Enter
Table 53. Model Summary for SPAvg with Enter Method
Model R R Square Adjusted R Square Std. Error of the
Estimate
1 .581a .337 .329 .50673
Table 54. ANOVA Test Results for SPAvg
Model Sum of Squares df Mean Square F Sig.
1
Regression 10.332 1 10.332 40.236 .000a
Residual 20.286 79 .257
Total 30.617 80

79
Table 55. Coefficient Table of SPAvg
Model Unstandardized Coefficients
Standardized
Coefficients t Sig.
B Std. Error Beta
1 (Constant) .903 .169 5.348 .000
SPAvg .489 .077 .581 6.343 .000
Regression
Table 56. Variable Entered with Enter Method, Dependent-SCAvg
Model
Variables
Entered
Variables
Removed Method
1 LTCAvga . Enter
Table 57. Model Summary with LTCAvg
Model R R Square Adjusted R Square Std. Error of the
Estimate
1 .270a .073 .061 .75864
Table 58. ANOVA Test Results with LTCAvg
Model Sum of Squares df Mean Square F Sig.
1
Regression 3.588 1 3.588 6.235 .015a
Residual 45.467 79 .576
Total 49.056 80
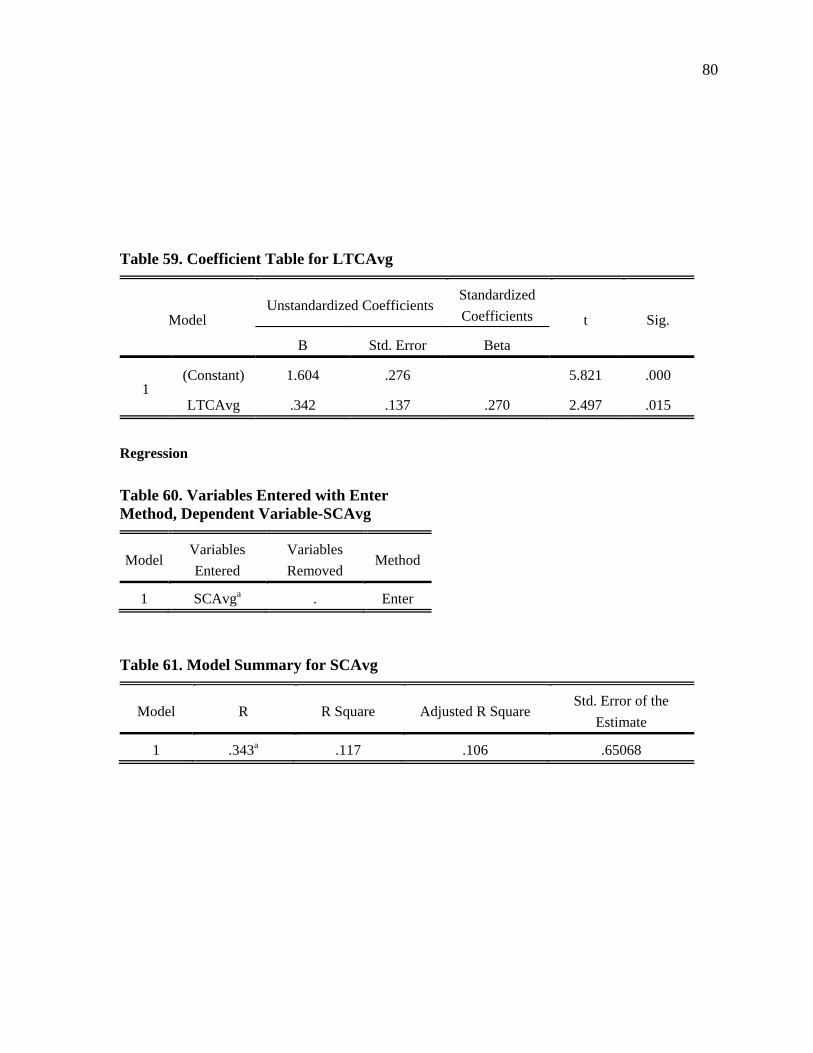
80
Table 59. Coefficient Table for LTCAvg
Model Unstandardized Coefficients
Standardized
Coefficients t Sig.
B Std. Error Beta
1 (Constant) 1.604 .276 5.821 .000
LTCAvg .342 .137 .270 2.497 .015
Regression
Table 60. Variables Entered with Enter Method, Dependent Variable-SCAvg
Model Variables
Entered
Variables
Removed Method
1 SCAvga . Enter
Table 61. Model Summary for SCAvg
Model R R Square Adjusted R Square Std. Error of the
Estimate
1 .343a .117 .106 .65068
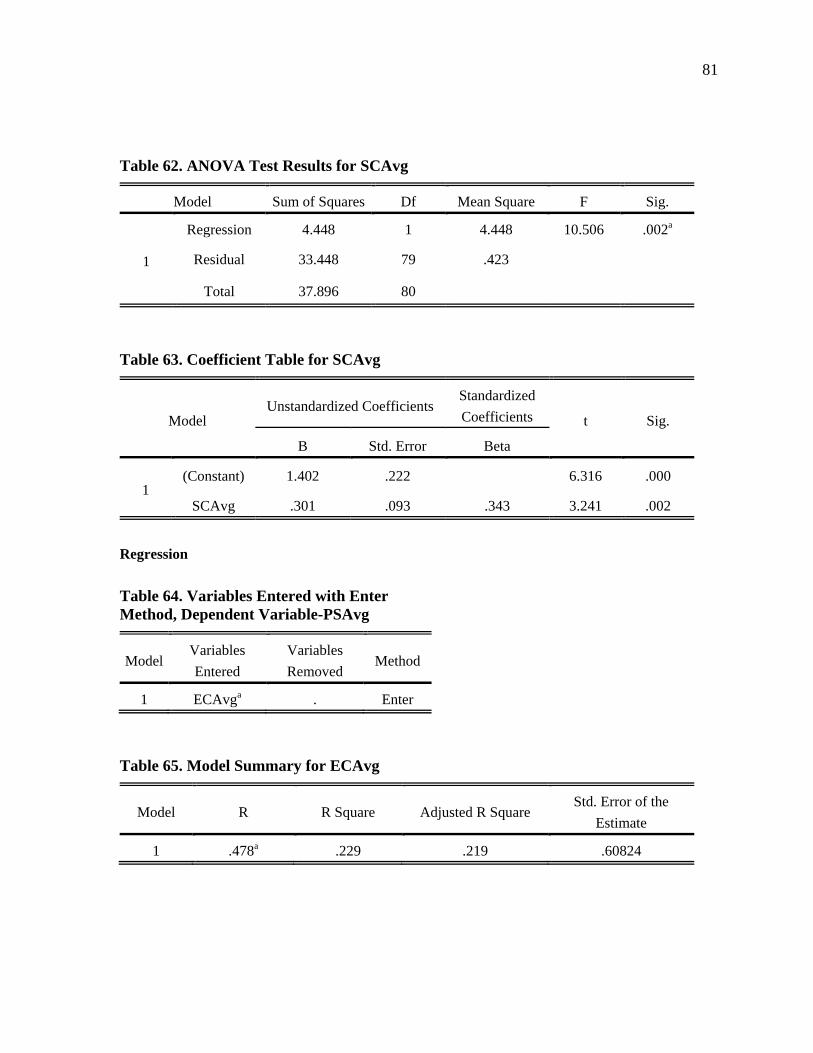
81
Table 62. ANOVA Test Results for SCAvg
Model Sum of Squares Df Mean Square F Sig.
1
Regression 4.448 1 4.448 10.506 .002a
Residual 33.448 79 .423
Total 37.896 80
Table 63. Coefficient Table for SCAvg
Model Unstandardized Coefficients
Standardized
Coefficients t Sig.
B Std. Error Beta
1 (Constant) 1.402 .222 6.316 .000
SCAvg .301 .093 .343 3.241 .002
Regression
Table 64. Variables Entered with Enter Method, Dependent Variable-PSAvg
Model Variables
Entered
Variables
Removed Method
1 ECAvga . Enter
Table 65. Model Summary for ECAvg
Model R R Square Adjusted R Square Std. Error of the
Estimate
1 .478a .229 .219 .60824

82
Table 66. ANOVA Test Results for ECAvg
Model Sum of Squares Df Mean Square F Sig.
1
Regression 8.669 1 8.669 23.432 .000a
Residual 29.227 79 .370
Total 37.896 80
Table 67. Coefficient Table for ECAvg
Model Unstandardized Coefficients
Standardized
Coefficients t Sig.
B Std. Error Beta
1 (Constant) 1.112 .211 5.260 .000
ECAvg .565 .117 .478 4.841 .000

83
APPENDIX F
RAW SURVEY RESULTS
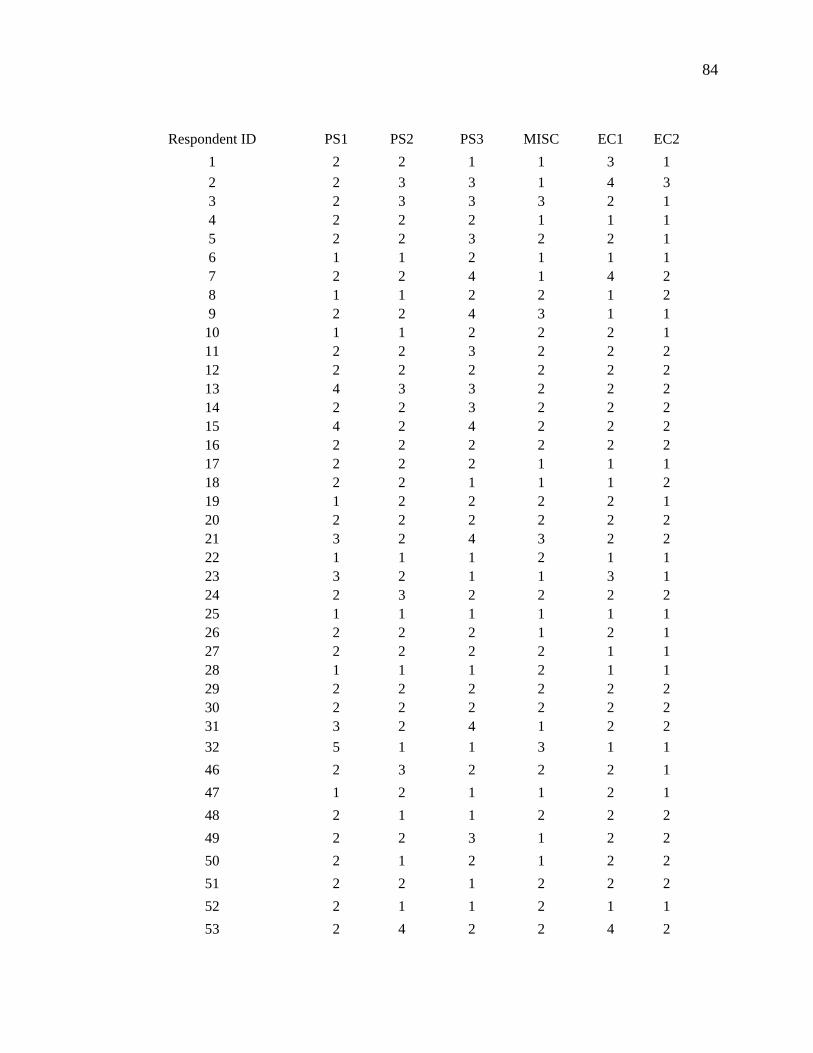
84
Respondent ID PS1 PS2 PS3 MISC EC1 EC2
1 2 2 1 1 3 1
2 2 3 3 1 4 3 3 2 3 3 3 2 1 4 2 2 2 1 1 1 5 2 2 3 2 2 1 6 1 1 2 1 1 1 7 2 2 4 1 4 2 8 1 1 2 2 1 2 9 2 2 4 3 1 1
10 1 1 2 2 2 1 11 2 2 3 2 2 2 12 2 2 2 2 2 2 13 4 3 3 2 2 2 14 2 2 3 2 2 2 15 4 2 4 2 2 2 16 2 2 2 2 2 2 17 2 2 2 1 1 1 18 2 2 1 1 1 2 19 1 2 2 2 2 1 20 2 2 2 2 2 2 21 3 2 4 3 2 2 22 1 1 1 2 1 1 23 3 2 1 1 3 1 24 2 3 2 2 2 2 25 1 1 1 1 1 1 26 2 2 2 1 2 1 27 2 2 2 2 1 1 28 1 1 1 2 1 1 29 2 2 2 2 2 2 30 2 2 2 2 2 2 31 3 2 4 1 2 2
32 5 1 1 3 1 1
46 2 3 2 2 2 1
47 1 2 1 1 2 1
48 2 1 1 2 2 2
49 2 2 3 1 2 2
50 2 1 2 1 2 2
51 2 2 1 2 2 2
52 2 1 1 2 1 1
53 2 4 2 2 4 2
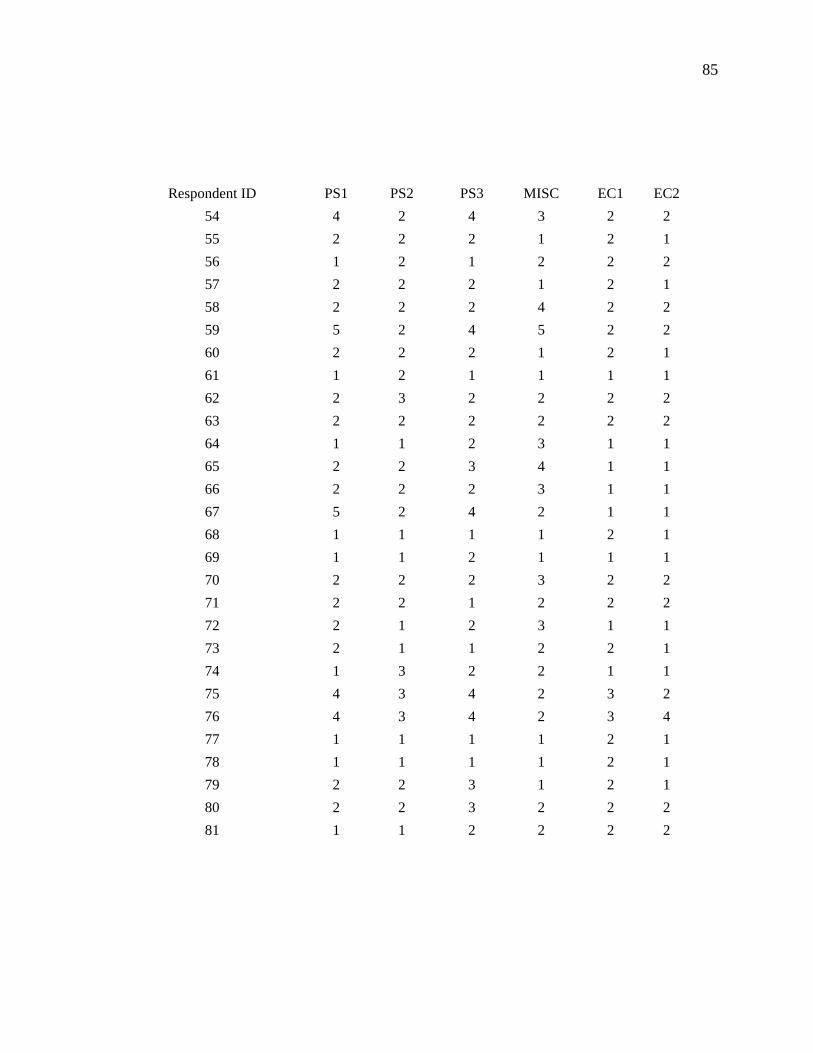
85
Respondent ID PS1 PS2 PS3 MISC EC1 EC2
54 4 2 4 3 2 2
55 2 2 2 1 2 1
56 1 2 1 2 2 2
57 2 2 2 1 2 1
58 2 2 2 4 2 2
59 5 2 4 5 2 2
60 2 2 2 1 2 1
61 1 2 1 1 1 1
62 2 3 2 2 2 2
63 2 2 2 2 2 2
64 1 1 2 3 1 1
65 2 2 3 4 1 1
66 2 2 2 3 1 1
67 5 2 4 2 1 1
68 1 1 1 1 2 1
69 1 1 2 1 1 1
70 2 2 2 3 2 2
71 2 2 1 2 2 2
72 2 1 2 3 1 1
73 2 1 1 2 2 1
74 1 3 2 2 1 1
75 4 3 4 2 3 2
76 4 3 4 2 3 4
77 1 1 1 1 2 1
78 1 1 1 1 2 1
79 2 2 3 1 2 1
80 2 2 3 2 2 2
81 1 1 2 2 2 2

86
Respondent ID EC3 SC1 SC2 SC3 UMI1 UMI2
1 1 2 3 1 2 1
2 2 5 5 3 3 3 3 2 2 3 2 3 2 4 1 2 2 2 2 2 5 2 2 2 2 2 1 6 1 2 1 2 1 2 7 4 1 2 2 2 2 8 1 2 2 2 1 1 9 1 5 5 3 2 1
10 1 1 1 1 1 1 11 2 4 2 2 2 2 12 2 3 2 3 2 2 13 2 3 3 4 2 3 14 1 3 2 2 3 2 15 2 3 3 2 3 2 16 2 2 2 2 2 2 17 2 1 1 2 1 1 18 1 2 1 1 2 1 19 1 2 3 2 1 2 20 2 2 2 3 2 2 21 4 3 2 2 3 2 22 1 2 3 2 1 1 23 3 1 1 3 2 1 24 2 2 2 2 2 2 25 1 1 3 1 1 1 26 1 2 2 1 2 1 27 1 3 2 3 3 2 28 1 1 1 1 1 1 29 2 2 2 2 2 2 30 2 2 2 2 2 2 31 2 2 1 2 2 2
32 1 1 4 2 1 1
46 2 2 2 2 4 2
47 1 2 1 1 1 2
48 2 2 3 2 2 2
49 2 1 2 2 2
50 2 2 3 2 1 2
51 2 2 4 2 4 2
52 1 2 2 3 1 1
53 3 2 2 2 2

87
Respondent ID EC3 SC1 SC2 SC3 UMI1 UMI2
54 1 2 2 2 2 2
55 2 4 2 1 3 2
56 1 1 2 2 2 2
57 2 2 2 2 4 2
58 2 3 2 2 2 2
59 2 2 4 5 4 4
60 1 1 4 1 1 1
61 1 1 1 1 1 1
62 1 3 2 2 2 2
63 1 2 3 2 2 2
64 1 2 4 2 2 2
65 1 2 4 2 2 2
66 1 2 2 2 2 1
67 1 2 2 2 5 1
68 1 1 2 1 1 1
69 2 1 2 1 1 1
70 2 4 4 2 2 2
71 2 4 2 2 4 1
72 2 2 1 2 1 2
73 1 2 2 2 2 1
74 1 1 2 2 2 4
75 4 2 3 4 2 2
76 2 4 2 3 2 2
77 1 1 2 1 1 1
78 1 1 2 1 1 1
79 1 2 2 1 1 1
80 2 1 1 1 1 1
81 2 2 2 1 1 1
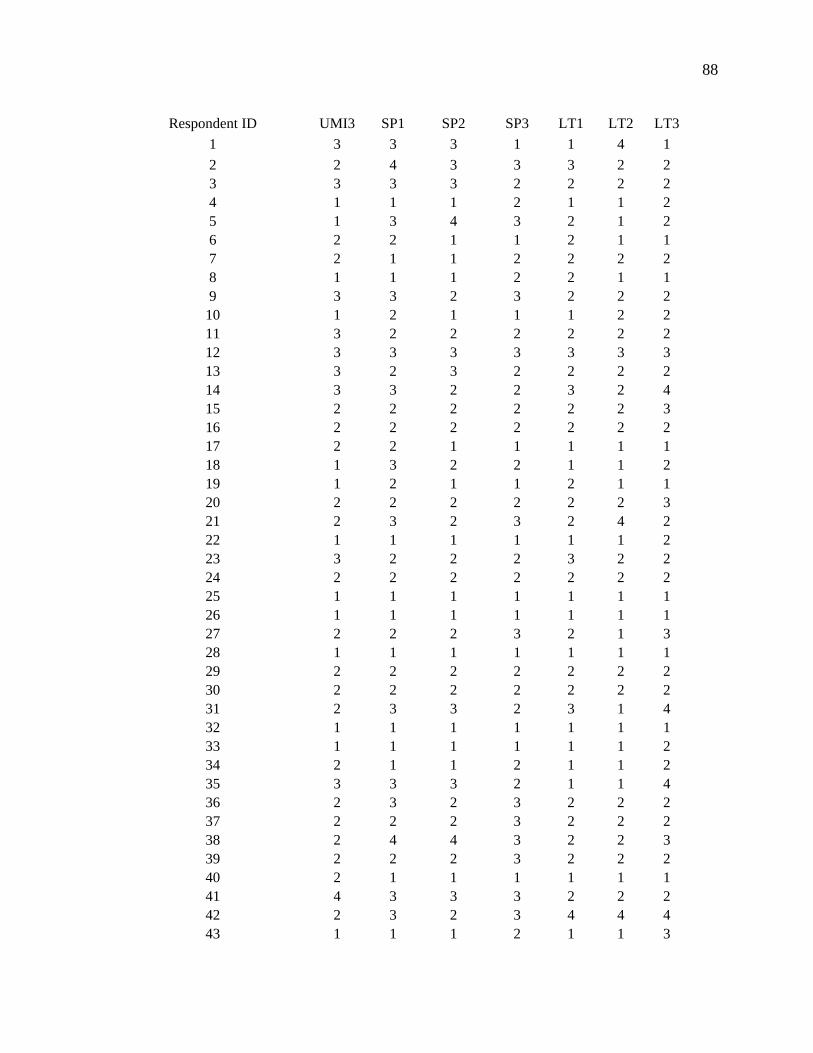
88
Respondent ID UMI3 SP1 SP2 SP3 LT1 LT2 LT3
1 3 3 3 1 1 4 1
2 2 4 3 3 3 2 2 3 3 3 3 2 2 2 2 4 1 1 1 2 1 1 2 5 1 3 4 3 2 1 2 6 2 2 1 1 2 1 1 7 2 1 1 2 2 2 2 8 1 1 1 2 2 1 1 9 3 3 2 3 2 2 2
10 1 2 1 1 1 2 2 11 3 2 2 2 2 2 2 12 3 3 3 3 3 3 3 13 3 2 3 2 2 2 2 14 3 3 2 2 3 2 4 15 2 2 2 2 2 2 3 16 2 2 2 2 2 2 2 17 2 2 1 1 1 1 1 18 1 3 2 2 1 1 2 19 1 2 1 1 2 1 1 20 2 2 2 2 2 2 3 21 2 3 2 3 2 4 2 22 1 1 1 1 1 1 2 23 3 2 2 2 3 2 2 24 2 2 2 2 2 2 2 25 1 1 1 1 1 1 1 26 1 1 1 1 1 1 1 27 2 2 2 3 2 1 3 28 1 1 1 1 1 1 1 29 2 2 2 2 2 2 2 30 2 2 2 2 2 2 2 31 2 3 3 2 3 1 4 32 1 1 1 1 1 1 1 33 1 1 1 1 1 1 2 34 2 1 1 2 1 1 2 35 3 3 3 2 1 1 4 36 2 3 2 3 2 2 2 37 2 2 2 3 2 2 2 38 2 4 4 3 2 2 3 39 2 2 2 3 2 2 2 40 2 1 1 1 1 1 1 41 4 3 3 3 2 2 2 42 2 3 2 3 4 4 4 43 1 1 1 2 1 1 3

89
Respondent ID UMI3 SP1 SP2 SP3 LT1 LT2 LT3
44 1 2 2 1 2 3 3
46 2 2 1 3 1 2 2
47 2 2 1 1 1 1 2
48 2 3 3 3 2 2 2
49 2 3 2 3 2 2 3
50 2 3 4 4 3 4 2
51 3 2 2 2 1 1 2
52 1 2 2 2 3 1 4
53 3 3 3 3 2 2 2
54 2 2 2 2 2 1 5
55 2 1 2 2 3 4 3
56 2 1 1 1 2 1 2
57 2 2 2 2 1 2 3
58 2 2 2 2 2 2 2
59 4 4 4 2 2 2 2
60 1 1 1 1 1 1 1
61 1 1 1 1 1 1 1
62 2 2 3 3 2 2 2
63 2 3 2 2 3 2 3
64 2 2 1 2 1 1 1
65 1 1 1 2 1 2 3
66 1 2 1 2 1 2 4
67 2 4 2 2 1 1 2
69 1 3 3 2 1 1 3
70 2 2 2 2 2 2 2
71 2 3 2 2 2 3 4
72 2 1 1 1 2 1 1
73 2 1 1 1 1 1 1
74 3 2 1 1 1 1 2
75 3 3 2 4 3 2 2
76 3 3 2 4 3 2 2
77 2 3 3 2 2 2 2
78 2 3 3 2 2 2 2
79 1 3 2 2 1 1 1
80 3 3 1 3 2 2 3
81 2 3 3 2 2 2 3