Retail in Australia: It's time to embrace the digital future

Analysis of small business retail energy bills in Australia
Final Report, June 2021
Small and Medium Enterprise (SME)Retail Tariff Tracker Project
Prepared by Alviss Consulting, with Energy Consumers Australia

Disclaimer
The energy offers, different energy plans (tariffs) and bill calculations presented in this report and associated workbooks should be used as a general guide only and should not be relied upon. The workbooks are not an appropriate substitute for obtaining an offer from an energy retailer. The information presented in this report and the workbooks is not provided as financial advice.
While we have taken great care to ensure accuracy of the information provided in this paper and the workbooks, they are suitable for use only as a research and analysis tool. We do not accept any legal responsibility for errors or inaccuracies. Alviss Consulting Pty Ltd does not accept liability for any action taken based on the information provided in this report or the associated workbooks or for any loss, economic or otherwise, suffered as a result of reliance on the information presented.
If you would like to obtain information about energy offers available to you as a customer, go to the relevant regulator’s website or contact the energy retailers directly.

Analysis of small business retail energy bills in Australia
ContentsThe Small Business Tariff-Tracking Project: Purpose and outputs 11. Key Findings 22. Methodology and caveats 4
2.1 Energy bill analysis and factors influencing price 52.2 Types of businesses and consumption levels 52.3 Consumption levels used for this analysis 52.4 Bill calculations 6
3. National comparison of energy bills 63.1 Electricity bills 7
3.1.1 Maximum price spread – electricity 93.1.2 Additional discounts – electricity 93.1.3 Fixed supply charge – electricity 103.1.4 Electricity network charges 113.1.5 Electricity ‘bill-stacks’ 133.1.6 Impact of the Default Market Offer (DMO) and Victorian Default Offer (VDO) 153.1.7 Broader market impacts from re-regulation 18
3.2 Gas bills 193.2.1 Maximum price spread – gas 203.2.2 Additional discounts – gas 213.2.3 Fixed supply charge – gas 22
4. Jurisdictional analysis 234.1 New South Wales 23
4.1.1 NSW electricity bills April 2021 244.1.2 NSW gas bills April 2021 294.1.3 Changes in energy bills in NSW 324.1.4 Impact of the DMO 35
4.2 Victoria 374.2.1 Victorian electricity bills April 2021 374.2.2 Victorian gas bills April 2021 454.2.3 Changes in energy bills in Victoria 534.2.4 Impact of the VDO 56
4.3 Queensland 594.3.1 Queensland electricity bills April 2021 594.3.2 Queensland gas bills April 2021 634.3.3 Changes in energy bills in Queensland 644.3.4 Impact of the DMO 66
4.4 South Australia 674.4.1 South Australian electricity bills April 2021 674.4.2 South Australian gas bills April 2021 694.4.3 Changes in energy bills in South Australia 714.4.4 Impact of the DMO 72
4.5 Tasmania 744.5.1 Tasmanian electricity bills April 2021 744.5.2 Tasmanian gas bills April 2021 754.5.3 Changes in energy bills in Tasmania 76
4.6 Australian Capital Territory (ACT) 784.6.1 ACT electricity bills April 2021 784.6.2 ACT gas bills April 2021 804.6.3 Changes in energy bills in the ACT 81
4.7 Western Australia and Northern Territory 834.7.1 Western Australia and Northern Territory electricity bills April 2021 834.7.2 Western Australian gas bills April 2021 834.7.3 Changes in energy bills in WA and NT 85
Appendix A - List of energy offers used in the analysis 87

Analysis of small business retail energy bills in Australia 1
The Small Business Tariff-Tracking Project: Purpose and outputs
The Small and Medium Enterprise (SME) Retail Tariff Tracker is an ongoing project that will evolve based on feedback received and new retail tariff data being collected.
To date this project has collected and compared small business electricity and gas retail tariffs across Australia and developed a spreadsheet-based tool that allows consumer advocates, and other interested parties, to compare prices and produce their own analysis. Workbooks, which allow the user to enter consumption levels and analyse bills for electricity and gas market offers available to small business customers as of April 2016, April 2017, October 2017, April 2018, October 2018, April 2019, October 2019, April 2020, October 2020 and April 2021, have been developed for each jurisdiction.1 While every update of the workbooks will be accompanied by a report, we stress that the workbooks themselves are integral to this project and can be accessed at: https://energyconsumersaustralia.com.au/publications/our-research.
The analysis presented in this SME Retail Tariff Tracker project update report is based on retail offers available in October 2020 as well as those collected in April 2021 as well as those collected in October 2020, April 2020, October 2019, April 2019, October 2018, April 2018, October 2017, April 2017 and April 2016. The consumption levels of 20,000 kilowatt hours for annual electricity consumption and 100 gigajoules for annual gas consumption used for comparing changes in annual bills in this update report reflect feedback received on the SME Retail Tariff-Tracker: Preliminary Report (October 2017) and are consistent with those used for the previous update-report (December 2017, June 2018, December 2018, June 2019, December 2019, June 2020 and December 2020).2 Readers interested in more background information about SME energy customers, contract and tariff types may also want to refer to the Preliminary Report.
As we collect more data over time the analysis and reporting will evolve. The project aims to highlight issues and trends in relation to price changes, bill-stacks, supply charges, discounting etc. However, the intention is not to ensure that every report covers all potentially interesting aspects in relation to SME energy prices. Timeliness of the update reports is crucial in order to ensure that SME customers, as well as other stakeholders, have access to up to date information. The timeliness aspect of the SME Tariff-Tracking project also means that the aim is not to explore or explain why changes are occurring. Rather the analysis and the findings should be regarded as a tool to track changes and identify potential issues in the SME energy retail markets. As such the aim of the reports is more to serve as conversation starters rather than proposing solutions to issues identified.
The tariff collection points will continue to be April and October each year. This means that the update report based on April data will be particularly relevant for capturing recent price changes in Victoria (where the major price re-set occurs in January every year) while the update report based on October data will be particularly relevant for analysis of recent price changes in all other jurisdictions.
This report presents some of the key findings produced by the SME Tariff-Tracking tool to date.
1 All market offers are published offers and do not include special offers that retailers market through special campaigns or brokers. All offers have been sourced from the retailers’ websites directly. The offers included in the analysis for this report are listed in Appendix A. 2 Available at https://energyconsumersaustralia.com.au/publications/sme-retail-tariff-tracker-preliminary-report-october-2017

2
1. Key Findings
Key findings in this update report on the SME Tariff-Tracking project in regard to bills, price changes, prices-spreads, discounts, supply charges and network charges include:
SME ENERGY BILLS AND ANNUAL PRICE CHANGES
• A jurisdictional comparison of SMEs consuming 20,000 kWh per annum shows that South Australian businesses continue to have the greatest annual electricity bills ($7,215) while Queensland businesses continue to have the lowest $5,190). See section 3.1.
• On average, nationally, annual electricity bills for SMEs with this consumption level decreased by approximately $270 or 4% between April 2020 and April 2021. The greatest decreases in annual electricity bills are in Victoria ($875) while businesses in the Western Australia had increases ($230). See section 3.1.
• A jurisdictional comparison of SMEs consuming 100 GJ of gas per annum shows that Tasmanian businesses continue have the greatest annual gas bills ($4,740) and Victorian businesses have the lowest $2,145). See section 3.2.
• On average, nationally, annual gas bills decreased by 2% between April 2020 and April 2021. On a jurisdictional level however, annual gas bills for SMEs with this consumption level (100 GJ) have increased by $140 (4%) in South Australia. In New South Wales and the ACT, on the other hand, they have decreased by $225 (8%) and $200 (6%). See section 3.2.
IMPACT OF REGULATED OFFERS
• The initial regulated Default Market Offers (DMOs) in NSW, South Australia and South East Queensland took effect on 1 July 2019 and were adjusted on 1 July 2020. In Victoria, the initial Victorian Default Offer (VDO) took effect on 1 July 2019 and was adjusted on 1 January 2020 and 1 January 2021. All SMEs that were on a retailer’s standing offer prior to the introduction of the DMO and VDO were moved to the DMO or VDO. See section 3.1.6.
• In Victoria, the average VDO decreased by 14% on 1 January 2021. On average, the current VDO is 33% lower than the standing offers prior to the initial VDO taking effect in Victoria. The DMO has remained unchanged since July 2020 (new rates will take effect in July 2021). In NSW and South East Queensland, the DMO is 10% lower than the standing offers prior to the initial DMO and in South Australia it is down by 16%.3 See section 3.1.6.
• In terms of broader market impacts since the introduction of the DMO/VDO, this analysis has found that:
• The number of retailers has increased significantly in NSW, South East Queensland and South Australia while it has remained the same in Victoria
• The use of additional discounts continues to decrease• A lower proportion of offers have conditions such as set contract terms and
limited ‘benefit periods’• A significant proportion of offers are now conditional upon the customer receiving
monthly bills• For more details, see section 3.1.7.
3 Based on the ‘big 3’ retailers’ standing offers prior to DMO/VDO taking effect on 1 July 2019 and the current (July 2020) DMO prices for small businesses consuming 20,000 kWh per annum.

Analysis of small business retail energy bills in Australia 3
PRICE-SPREADS
• The difference between the lowest and highest market offer, the maximum price-spread, has increased in all jurisdictions except Victoria over the last year. In April 2021 the maximum price-spread in Victoria was approximately $1,355, $2,140 in NSW, $1,775 in South East Queensland, $2,475 in South Australia and $740 in the ACT. 4 See section 3.1.1.
• The price-spread for gas decreased in the ACT and Victoria compared with the same period a year ago. For NSW, in particular, the price-spread has increased. As of April 2021, the maximum price-spread was $760 in NSW, $640 in South Australia, $455 in Victoria, $350 in the ACT and $260 in Queensland. In Tasmania, the maximum price-spread was $110.5 See section 3.2.1.
ADDITIONAL DISCOUNTS
• Compared to six months ago (October 2020), the level of discounting has reduced in Victoria and South East Queensland, increased in South Australia and remained unchanged in other jurisdictions. Additional discounts applied to electricity offers have the greatest impact in NSW (reduces a typical annual bill by approximately $390) while they have the least impact in Tasmania (approximately $150).6 See section 3.1.2.
• In relation to gas offers, some retailers offer guaranteed discounts while none of the gas offers currently contain conditional pay on time discounts. Discounts have greatest impact in Western Australia (reduces an average annual bill by approximately $985) while they have the least impact in South Australia, Queensland and Victoria.7 It should be noted, however, that Western Australia only has three retailers that publish SME market offers and that this discount reflects the 45% discount offered by AGL and 32% discount offered by Origin Energy. See section 3.2.2.
FIXED SUPPLY CHARGES
• Over the last year, fixed supply charges have decreased in the ACT, NSW, South Australia, Tasmania and Victoria, while they have remained unchanged in the Northern Territory. Western Australia used to have relatively low supply charges but in July 2018 it increased considerably (by $440 per annum) and it is now the highest supply charge in the country ($671 per annum). Annual fixed supply charges are $569 in NSW (decrease of 5%), $423 in Victoria (decrease of 8%), $514 in Queensland (increase of 2%), $483 in the ACT (decrease of 2%), $375 in Tasmania (decrease of 1%) and $373 in South Australia (decrease of 3%). The supply charge is lowest in the Northern Territory ($292). See section 3.1.3.
• Compared with the same period a year ago, fixed gas supply charges have decreased in the ACT (7%). In Queensland, Tasmania and Victoria, the supply charges have increased by a modest 1% to 2% since April 2020. Fixed supply charges as a proportion of the annual bill are highest in the ACT (18%) and lowest in Western Australia (4%). See section 3.2.3.
ELECTRICITY NETWORK CHARGES
• Compared with the same period a year ago, the Network Use of System Charges (NUOS) decreased in Victoria (18%), South Australia (2%) and Tasmania (6%). In NSW and the ACT, on the other hand, they increased by 2%. In Queensland they increased by 1%. As of April 2021, South Australia is the jurisdiction with the highest NUOS charges (approximately $3,190 for SMEs consuming 20,000 kWh per annum) while Tasmania has the lowest (approximately $1,960 for the same consumption level).8 With the recent price reduction in Victoria, the annual average NUOS charge is now the second lowest at $1,980. See section 3.1.4. 4 Based on annual consumption of 20,000 kWh and as of October 2020 the analysis is based on 7 retail offers in the ACT, 21 retailers South Australia, 25 in South East Queensland, 30 retailers in NSW and 21 in Victoria. 5 Based on annual consumption of 100 GJ and analysis based on 9 retail offers in Victoria, 8 retailers in NSW and South Australia, 5 in Queensland, 4 in the ACT and 2 retailers in Tasmania. Analysis does not include WA as AGL and Origin are relatively new entrants in the WA gas retail market. As of April 2021, however, the maximum price-spread in WA was $1,730..6 Jurisdictions without market offers have not been included in this analysis. For Queensland, it is based on market offers in South East Queensland (Energex network) only.7 Jurisdictions without or only a few market offers have not been included in this analysis.8 Based on annual consumption of 20,000 kWh

4
• Since April 2016 (when the SME Retail Tariff Tracker project commenced) there was first a trend decline in NUOS as proportion of the total retail bill in all jurisdictions. Since April 2020, however, the NUOS proportion has increased in all NEM jurisdictions except Victoria and Tasmania. In April 2021 the NUOS proportion of bills was highest in the ACT and South Australia (46.1% and 44.1%, respectively. See section 3.1.4.
ELECTRICITY BILL-STACKS
• In order to examine what businesses actually pay for the various goods, services and policies that are costed by the supply chain and passed on to consumers in a retail bill, we deduct estimated cost components from the average annual retail bill for businesses using 20,000 kWh per annum as of April 2021.9 The residual retail component of the average market offer bill is zero in the ACT and as high as 21% in Tasmania.10 The ‘green scheme’ component is highest in the ACT (17%) and lowest in NSW (8%). The cost of wholesale energy ranges from 31% in Queensland, South Australia and Tasmania to 36% in Victoria. That is a significant reduction to wholesale costs compared to a year ago when it was estimated to count for over 40% of bills in all jurisdictions except Tasmania. See section 3.1.5.
JURISDICTIONAL ANALYSIS
• Section 4 of this report analyses and compares electricity and gas offers available to small business customers in each of the jurisdictions. It compares price-spreads (maximum price differences between retail offers) and assesses the impact guaranteed and conditional pay on time discounts have on energy bills. It also examines changes to network cost and estimates the network cost proportion of total electricity bills. Furthermore, it highlights price changes (increases and/or decreases) that have occurred over the previous six months,11 differences to annual bills (based on assumed consumption levels) between retailers, as well as electricity networks and gas pricing zones within each jurisdiction.
• There are significant differences between the various retailers’ bills, use of additional discounts and network charge proportion of bills across jurisdictions.
• Both Victoria and South Australia experienced a significant reduction in electricity wholesale prices in 202012 but only Victorian SMEs have benefited from reduced retail bills over the last six months (since October 2020). In Victoria, new network tariffs took effect in January 2021 meaning that the electricity retail prices have been affected by an underlying price reset in this six-month period. Most of the retailers have thus changed their offers (rates, discounts or both). In South Australia, the underlying network tariffs have not changed over the last six months. However, retailers can still change their offers, and they often do, but there has been minimal change in South Australia since October 2020. In fact, only one retailer (Origin Energy) has changed, slightly reduced, its offer over the last six months.
9 To estimate wholesale and environmental (‘green-scheme’) costs we used the AEMC, Residential Electricity Price Trends 2020, Data available at https://www.aemc.gov.au/news-centre/data-portal/price-trends-202010 A zero-residual amount in the ACT does not mean that the retailers do not have costs or a margin in this jurisdiction. It can, however, indicate that the retail costs/margins are lower in the ACT compared to other jurisdictions.11 As the last data collection of retail offers occurred in April 2021, offers as of April 2021 have been compared to offers as of October 2020 (the previous data collection). 12 See AER, Wholesale Markets Quarterly, Q4 2020, October – December, February 2021

Analysis of small business retail energy bills in Australia 5
2. Methodology and caveats 2.1 Energy bill analysis and factors influencing price
When analysing the impact tariff changes have on customers’ energy bills it is important to be mindful of the various cost components bills are made up of (the bill stack), as well as demand side characteristics such as consumption levels and patterns, and how all these factors may influence the cost of energy.
Firstly, energy bills are made up of three key components: competitive market costs, network costs and ‘green scheme’ costs. According to the Australian Energy Regulator (AER), the wholesale costs account for 33% of residential customers’ electricity bills, the regulated network cost is 43%, retail (costs and margins) is 16%, and 8% are ‘green scheme’ costs.13 For gas, the wholesale component accounts for 33% of the total bill, network cost is 43%, and retail (costs and margins) is 25%.14
The regulated electricity network costs include transmission use of system charge and distribution use of system charges, as well as the cost of meters, meter reads and other ancillary services.15 The role of retailers is to manage the risk of the wholesale market and thus offer energy products suitable to end-users. All these components influence changes to energy costs and customers’ bills. For example: generation costs vary according to fuel sources used, and supply and demand; transmission and distribution costs can go up due to approved network upgrades; retail costs or pricing strategies will be influenced by how well the retailer has managed risk (i.e. their hedging contracts) and effectiveness of competition and other cost inputs the retailers have to manage.
Secondly, as the tariff-tracking tool allows the user to nominate consumption level as well as peak/off-peak proportions where relevant, it is important to be mindful of the significant difference between small businesses’ consumption level and usage pattern. Gas bills are particularly difficult to estimate as consumption can be highly seasonal. However, the tool allows the user to analyse bill impacts based on their own assumptions or the type of small business they have in mind. 2.2 Types of businesses and consumption levels
Small business customers are a very heterogeneous customer group in terms of consumption levels, consumption patterns and fuel mix. While households certainly vary in terms of consumption levels and patterns as well, the type of business being conducted can arguably have a much greater impact on consumption, and thus costs. A small office based business largely operating during business hours will have very different consumption levels and usage patterns to a restaurant that is open seven days a week with peak operating hours during the evening.
As part of the small business SME Retail Tariff Tracker project, we aim to establish some potential business profiles that can increase understanding of the various energy needs and usage patterns of different, but relatively common, types of small businesses. We therefore hope these reports will trigger interest in the issues pertaining to small business energy customers and start a dialogue amongst stakeholders that will inform this project as well as Energy Consumer Australia’s work more broadly.
2.3 Consumption levels used for this analysis
In order to make a national comparison of electricity and gas bills we have chosen a standard annual consumption level of 20,000 kWh per annum, with the same rate charged for usage all day (which is termed the single rate). For gas we have used a standard annual consumption level of 100 GJ per annum.16 The 20,000 kWh electricity consumption is based on a (rounded) average of average consumption for
13 Note that these are NEM averages and that the ‘bill-stack’ does vary between jurisdictions. Also, while the AER analysis is based on residential customers, the breakdown is similar for SMEs. AER, State of the Energy market 2020, Figure 6.2, 240. 14 Ibid, Figure 6.3, 241. Note that the AER states that percentages may not add to 100% due to rounding. 15 Note that the competition in metering rule (introduced in December 2017) made extensive amendments to metering-related arrangements in the NEM, including transferring metering related roles and responsibilities from the distributors to metering coordinators.16 Feedback received on our preliminary report (October 2017) included that previous assumptions used for consumption levels were too high for most networks and that using different consumption levels for the jurisdictions made the analysis unnecessarily confusing.

6
small businesses in various NEM networks by Jacobs Australia for the Australian Energy Market Operator (AEMO) presented in Table 1 below. We arrived at the 100 GJ gas consumption after receiving feedback that the previous assumption of 250 GJ was too high for all jurisdictions except Victoria.Average consumption levels vary significantly between jurisdictions due to factors such as climate and fuel mix. In Victoria, for example, gas penetration is high, and this means that many businesses use gas for purposes that Tasmanian businesses, for example, are more likely to use electricity for. Overall, an assumed standard annual electricity consumption of 20,000 kWh is high in NSW’s Ausgrid network, South Australia and South-East Queensland (Energex), while it is very low for the ACT. An assumed standard annual gas consumption of 100 GJ is low for Victoria and the ACT while more representative for other parts of Australia.
TABLE 1 | Estimated average consumption and typical tariff types for selected NEM network areas17
Jurisdiction Network kWh/annum Common tariff/meter type
NSW Ausgrid 13,000 EA050 (single rate)NSW Endeavour Energy 27,299 N90 (single rate)VIC Citipower 36,209 C1G (single rate)VIC Powercor 21,674 ND5 (interval tariff)VIC Ausnet Services 24,724 NEE12 (single rate)VIC Jemena 21,858 A200 (single rate)VIC United Energy 23,629 LVM1R (single rate)QLD Energex 16,628 8300 (demand tariff)SA SAPN 14,262 2 rate (peak/off-peak rate)TAS TasNetworks 25,315 TAS22 (single rate)ACT Evoenergy 32,257 General network (single rate)
In terms of tariff types, the single rate, the tariff type used for this analysis, is the most common for small businesses in all network areas except Energex, Powercor and South Australian Power Network (see table 1). Finally, we would encourage anyone with interest in energy bill analysis of different tariff types and/or consumption levels to use the small business SME Retail Tariff Tracker project workbooks available at: https://energyconsumersaustralia.com.au/publications/our-research/page/3.
2.4 Bill calculations
Energy offers are made up of numerous rates and charges (i.e. peak rates, off peak rates and supply charges) and in order to compare offers, or prices, we have based the analysis on estimated annual bills for certain consumption levels. Annual bills, inclusive of guaranteed discounts, pay on time discounts and GST, have been calculated for all retail offers.18 When the report refers to the average bill for a jurisdiction or a network, it refers to the average (arithmetic mean) bill based on all relevant retailers. The average bill is not weighted to reflect individual retailers’ customer numbers.
17 Table based on Jacobs Australia, Retail electricity price history and project trends, AEMO, 21 September 2017. Note that Powercor has advised that their most common small business tariff is the ND1 (single rate) and not ND5 as per Table 1. 18 Appendix A contains a list of all offers used for this report.

Analysis of small business retail energy bills in Australia 7
0
1,000
2,000
3,000
4,000
5,000
6,000
7,000
8,000
SA WA NT NSW ACT TAS VIC QLD
$ pe
r ann
um
3. National comparison of energy bills
This section analyses and compares electricity and gas offers available to small business customers in Australia, based on available retail offers as of April 2016, April 2017, October 2017, April 2018, October 2018, April 2019, October 2019, April 2020, October 2020 and April 2021. The analysis highlights changes to energy bills, jurisdictional differences to annual bills (based on assumed consumption levels) as well as electricity networks, differences in the fixed supply charges and the impact guaranteed and conditional pay on time discounts have on energy bills in various areas. It also estimates the size of the network, wholesale, ‘green schemes’ and retail components of electricity bills. As the electricity Network Use of System (NUOS) charges change on 1 January in Victoria and on 1 July in all other jurisdictions, the April data, and associated report, will typically reveal recent price changes in Victoria while the October data (and report) will highlight major price changes in the other jurisdictions. That said, there are minor changes to most of the competitive energy retail markets throughout the year, and the six-monthly update approach ensures that both major and minor price resets in each jurisdiction are covered.
3.1 Electricity bills
Chart 1 shows estimated annual electricity bills for SMEs that consume 20,000 kWh per annum across all states and territories. South Australian businesses with this consumption level will typically have an annual electricity bill of approximately $7,215, while Queensland businesses will pay $5,190.
CHART 1 | Estimated average annual electricity bills for SMEs using 20,000 kWh (single rate) per annum in each jurisdiction. Offers as of April 2021, GST inclusive.19
Chart 2 shows changes to electricity bills from April 2016 to April 2021. It shows that bills increased in all jurisdictions except for Tasmania and Queensland during the period but that the increases vary significantly between jurisdictions.20 Furthermore, it shows that average bills have decreased or remained unchanged in all jurisdictions over the last six months.
19 Based on offers available in April 2021. Average market offer (including guaranteed discounts and pay on time discounts) for each network area. For areas without market offers (the Ergon Energy, PWC, Horizon Energy and Western Power networks) the bills are based on the regulated/standing offer.20 Note that new retailers have entered the Tasmanian market during this period and that the average bill calculation for October 2019 and April 2020 is based on Aurora Energy and 1st Energy’s offers while October 2020 and April 2021 are based on Aurora Energy, 1st Energy and Future X Power.

8
4,000
4,500
5,000
5,500
6,000
6,500
7,000
7,500
8,000
8,500
9,000
Apr-16 Apr-17 Oct-17 Apr-18 Oct-18 Apr-19 Oct-19 Apr-20 Oct-20 Apr-21
Annu
al e
lect
ricity
bill
($)
SA WA NT NSW ACT TAS VIC QLD
-1,000
-800
-600
-400
-200
0
200
400
VIC SA QLD NSW ACT TAS NT WA
$ C
hang
e
$ change Average
CHART 2 | Trend estimated average annual electricity bills for SMEs using 20,000 kWh (single rate) per annum in each jurisdiction since April 2016. GST inclusive.21
Chart 3 shows $ changes to annual bills between April 2020 and April 2021. On average, nationally, annual electricity bills for SMEs with this consumption level decreased by approximately $270 or 4% between April 2020 and April 2021. The greatest decreases in annual electricity bills are in Victoria ($875) while businesses in Western Australia had increases ($230).22
CHART 3 | Changes ($) to average annual electricity bills for SMEs using 20,000 kWh (single rate) per annum in each jurisdiction from April 2020 and April 2021. GST inclusive.
In terms of percentage changes, Chart 4 shows that bills in Western Australia increased by 4% while bills in Victoria decreased by 14% during this period.
21 Average market offer (including guaranteed discounts and pay on time discounts) for each network area. For areas without market offers (the Ergon Energy, PWC, Horizon Energy and Western Power networks) the bills are based on the regulated/standing offer.22 Note that these price changes may differ from the overall averages in the jurisdictional analyses (section 4 below). This is because the average bill in this section is based on all retailers offering retail contracts as of April 2020 and April 2021 while the jurisdictional analyses compare retailers that had offers in both April 2020 and April 2021 only. Also, in relation to Tasmania, the October 2018 bill calculation is based on Aurora Energy only while the October 2019 and April 2020 bill calculations are based on Aurora and 1st Energy. The October 2020 and April 2021 calculations are based on Aurora, 1st Energy as well as Future X Power.

Analysis of small business retail energy bills in Australia 9
-16%
-14%
-12%
-10%
-8%
-6%
-4%
-2%
0%
2%
4%
6%
VIC SA QLD NSW ACT TAS NT WA
% c
hang
e
% change Average
0
1,000
2,000
3,000
4,000
5,000
6,000
ACT VIC QLD NSW SA
$ pe
r ann
um
Apr-16
Apr-17Oct-17
Apr-18Oct-18
Apr-19Oct-19
Apr-20
Oct-20Apr-21
CHART 4 | Changes (%) in average electricity bills for SMEs using 20,000 kWh (single rate) per annum in each jurisdiction from April 2020 and April 2021. GST inclusive
3.1.1 Maximum price spread – electricity
The difference between the market offers, the maximum price-spread, has increased in all jurisdictions except Victoria over the last year (since April 2020). In April 2021 the maximum price-spread in Victoria was approximately $1,355, $2,140 in NSW, $1,775 in South East Queensland, $2,475 in South Australia and $740 in the ACT.23 Chart 5 shows the trend in the maximum price-spread since April 2016 for all jurisdictions where a number of retailers offer electricity market contracts.
CHART 5 | Maximum price-spread for electricity market offers (including guaranteed and pay on time discounts) in each jurisdiction since April 2016. Based on SMEs using 20,000 kWh (single rate) per annum, GST inclusive
3.1.2 Additional discounts – electricity
While some retailers offer guaranteed discounts, others have discounts that are conditional upon bills being paid on time. Chart 6 shows the difference between the average market offer bill excluding guaranteed and conditional discounts, and the average market offer bill inclusive of discounts. It shows that discounts
23 Based on annual consumption of 20,000 kWh and as of April 2021 the analysis is based on 7 retail offers in the ACT, 21 retailers South Australia and Victoria and 26 in South East Queensland and NSW.

10
$0
$50
$100
$150
$200
$250
$300
$350
$400
$450
NSW SA ACT QLD VIC TAS
$ pe
r ann
um
$0
$100
$200
$300
$400
$500
$600
$700
$800
NT SA TAS VIC ACT QLD NSW WA
$ pe
r ann
um
Apr-16 Apr-17 Oct-17 Apr-18 Oct-18 Apr-19 Oct-19 Apr-20 Oct-20 Apr-21
have the greatest impact in NSW (reduces a typical annual bill by approximately $390) while they have the least impact in Tasmania (approximately $150).24 Compared to six months ago (October 2020), the level of discounting has reduced in Victoria and South East Queensland, increased in South Australia and remained unchanged in other jurisdictions.
CHART 6 | Difference ($) in average annual electricity bills inclusive and exclusive of discounts (guaranteed and conditional). Based on SMEs using 20,000 kWh (single rate) per annum, April 2021. GST inclusive
3.1.3 Fixed supply charge – electricity
Over the last year, fixed supply charges have decreased in the ACT, NSW, South Australia, Tasmania and Victoria, while they have remained unchanged in the Northern Territory. Western Australia used to have relatively low supply charges but in July 2018 it increased considerably (by $440 per annum) and it is now the highest supply charge in the country ($671 per annum). Annual fixed supply charges are $569 in NSW (decrease of 5%), $423 in Victoria (decrease of 8%), $514 in Queensland (increase of 2%), $483 in the ACT (decrease of 2%), $375 in Tasmania (decrease of 1%) and $373 in South Australia (decrease of 3%). The supply charge is lowest in the Northern Territory ($292).
CHART 7 | Trend in average annual electricity supply charge ($) for SMEs on the single rate in each jurisdiction from April 2016 to April 2021. GST inclusive.25
24 Jurisdictions without market offers have not been included in this analysis. For Queensland, it is based on market offers in South East Queensland (Energex network) only.25 Based on the average annual supply charge for electricity market offers except for in WA, NT, Tasmania and Northern Queensland (Ergon Energy network) where it is based on the regulated rate.

Analysis of small business retail energy bills in Australia 11
0.0%
2.0%
4.0%
6.0%
8.0%
10.0%
12.0%
14.0%
NT SA TAS VIC ACT NSW QLD WA
Supp
ly c
harg
e as
pro
porti
on (%
) of a
nnua
l bill
Apr-16 Apr-17 Oct-17 Apr-18 Oct-18 Apr-19 Oct-19 Apr-20 Oct-20 Apr-21
$2,6
39
$2,0
31
$2,4
56
$1,9
80
$3,1
86
$1,9
57
1,000
1,500
2,000
2,500
3,000
3,500
ACT QLD NSW VIC SA TAS
NU
OS
$ /a
nnum
Apr-16 Apr-17 Oct-17 Apr-18 Oct-18Apr-19 Oct-19 Apr-20 Oct-20 Apr-21
Fixed supply charges as a proportion of the annual bill are currently highest in Western Australia (10.5%) and lowest in the Northern Territory (4.6%). Over the last six months (since October 2020), the supply charge as proportion of bills has increased in Victoria and NSW. Chart 8 shows the trend in the average electricity supply charge as proportion of bill in each jurisdiction.
CHART 8 | Trend in average annual electricity supply charge as proportion (%) of bill for SMEs using 20,000 kWh per annum (single rate) in each jurisdiction from April 2016 to April 2021. GST inclusive.
3.1.4 Electricity network charges
Compared with the same period a year ago, the Network Use of System Charges (NUOS) decreased in Victoria (18%), South Australia (2%) and Tasmania (6%). In NSW and the ACT, on the other hand, they increased by 2%. In Queensland they increased by 1%. As of April 2021, South Australia is the jurisdiction with the highest NUOS charges (approximately $3,190 for SMEs consuming 20,000 kWh per annum) while Tasmania has the lowest (approximately $1,960 for the same consumption level).26 With the recent price reduction in Victoria, the annual average NUOS charge is now the second lowest at $1,980.
CHART 9 | Trend in the average annual NUOS bill for SMEs using 20,000 kWh (single rate) per annum in each jurisdiction since April 2016. GST exclusive.27
26 Based on annual consumption of 20,000 kWh.27 Queensland is based on Energex network only.
12
$0
$500
$1,000
$1,500
$2,000
$2,500
$3,000
$3,500
EvoEnerg
y
Energex
Ausgrid
Endeavour
Essentia
l
Ausnet
Citipow
er
Jemen
a
Powercor
United
SAPN
TasNetwork
NU
OS
$/an
num
46.1
42.8
42.4
37.6
44.1
35.8
0.0
10.0
20.0
30.0
40.0
50.0
60.0
70.0
ACT QLD NSW VIC SA TAS
NU
OS
prop
ortio
n (%
) of b
ill
Apr-16 Apr-17 Oct-17 Apr-18 Oct-18Apr-19 Oct-19 Apr-20 Oct-20 Apr-21
In NSW and Victoria, where there is more than one network area, the state variations in NUOS charges are significant. Large, and predominantly country networks, such as Essential Energy in NSW has network charges that are similar to that of the South Australia Power Network (SAPN). Victoria’s urban Citipower network, on the other hand is the network with the lowest NUOS charges in the National Electricity Market (NEM). See Chart 10.
CHART 10 | Annual NUOS bill for SMEs using 20,000 kWh (single rate) per annum in each network as of April 2021. GST exclusive.28
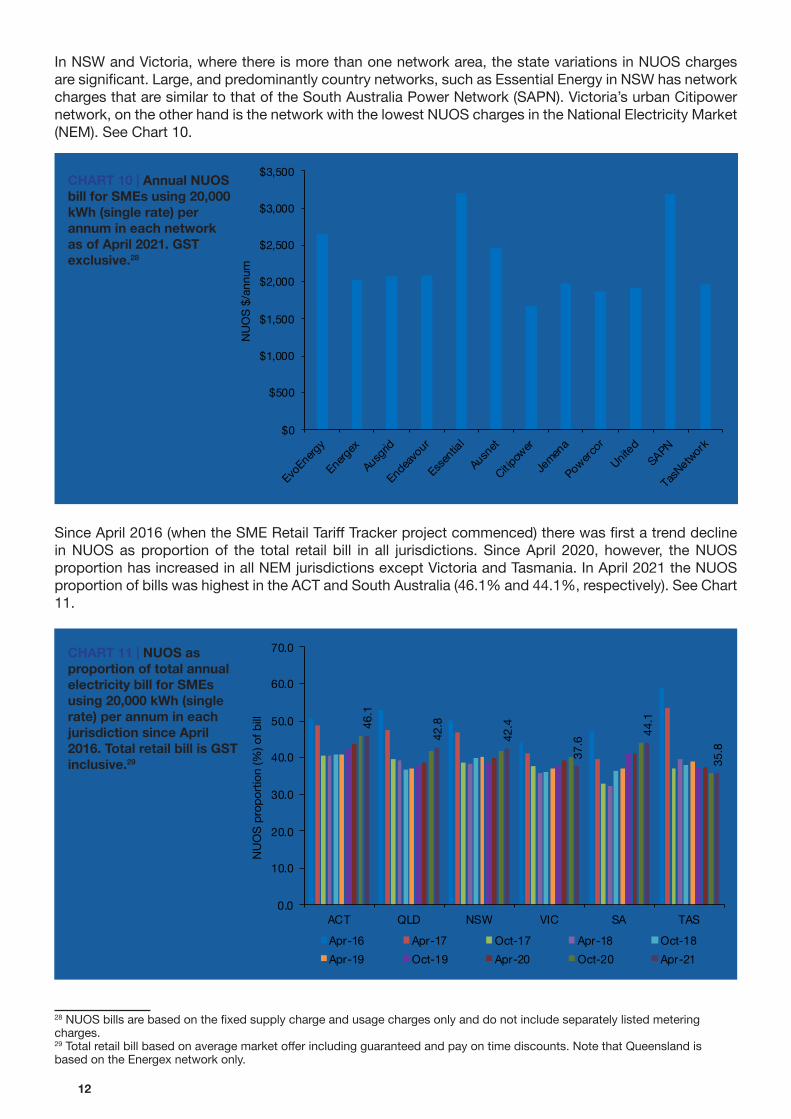
Since April 2016 (when the SME Retail Tariff Tracker project commenced) there was first a trend decline in NUOS as proportion of the total retail bill in all jurisdictions. Since April 2020, however, the NUOS proportion has increased in all NEM jurisdictions except Victoria and Tasmania. In April 2021 the NUOS proportion of bills was highest in the ACT and South Australia (46.1% and 44.1%, respectively). See Chart 11.
CHART 11 | NUOS as proportion of total annual electricity bill for SMEs using 20,000 kWh (single rate) per annum in each jurisdiction since April 2016. Total retail bill is GST inclusive.29
28 NUOS bills are based on the fixed supply charge and usage charges only and do not include separately listed metering charges.29 Total retail bill based on average market offer including guaranteed and pay on time discounts. Note that Queensland is based on the Energex network only.

Analysis of small business retail energy bills in Australia 13
3.1.5 Electricity ‘bill-stacks’
In the preceding section we estimated the proportion that network charges make up in the retail bill. The Australian Energy Market Commission (AEMC) annually publishes estimates of the components of the residential retail bill. We have undertaken a similar breakdown for the SME retail bill, but this needs to be qualified by the availability of public data to accurately estimate wholesale costs.
In order to estimate what retailers currently pay for wholesale energy we have used the average of the AEMC’s 2020/21 and 2021/22 figures.30 We note that wholesale prices have significantly decreased in recent months and while retailers may be contracted to higher prices, we would expect to start seeing the impact of lower wholesale prices by now.
TABLE 2 | AEMC electricity wholesale costs (c/kWh) 2020/21 and 2021/22
c/kWh 2020/21 c/kWh 2021/22 Average c/kWhACT 9.07 7.61 8.3NSW 9.27 8.00 8.6
Queensland 7.48 6.10 6.8South Australia 11.44 8.89 10.2
Tasmania 8.47 7.08 7.8Victoria* 10.12 7.29 8.7
The AEMC’s Electricity Price Trends data is also the source used to estimate ‘green scheme’ costs.31 Table 3 below shows AEMC’s estimated environmental costs for 2020/21 and 2021/22 as well as the average used for this analysis.
TABLE 3 | AEMC ‘Green scheme’ costs (c/kWh) 2020/21 and 2021/22
c/kWh 2020/21 c/kWh 2021/22 Average c/kWhACT 4.23 4.81 4.5NSW 2.28 2.14 2.2
Queensland 2.66 2.48 2.6South Australia 3.46 3.32 3.4
Tasmania 2.25 2.08 2.2Victoria 2.37 2.27 2.3
By deducting estimated GST, NUOS costs, wholesale costs and the cost of environmental policies (‘green schemes’), the residual retail component of the average market offer bill is shown in Chart 12. This component is currently zero in the ACT and as high as $1,025 in Tasmania.32
30 AEMC, Residential Electricity Price Trends 2020, Data available at https://www.aemc.gov.au/news-centre/data-portal/price-trends-2020.31 AEMC, Residential Electricity Price Trends 2020, Data available at https://www.aemc.gov.au/news-centre/data-portal/price-trends-2020. 32 Note that the retail component is the residual amount after deducting other costs from the bills. All market offers are inclusive of any guaranteed or pay on time discount offered by the retailers. A zero-residual amount in the ACT does not mean that the retailers do not have costs or a margin in this jurisdiction and we emphasise that this is based on average retail bill across all retailers (not weighted for market share). It can, however, indicate that the retail costs/margins are lower in the ACT compared to other jurisdictions. We have also been advised that the NUOS includes some ‘green scheme’ costs in the ACT.

14
2,63
9
2,03
1 2,45
6
1,98
0
3,18
6
1,95
7
1,66
8
1,35
8
1,72
7
1,74
1
2,03
3
1,55
5
415 64
2
606 1,
027
904
514
442
464 67
8
433
-1,000
0
1,000
2,000
3,000
4,000
5,000
6,000
7,000
ACT QLD NSW VIC SA TAS
$ pe
r ann
um
NUOS Wholesale Retail Green schemes Total (excl GST)
51 47 47 4149
39
3231 33
3631
31
0
10 12 13 1021
17 12 8 10 10 9
-20
0
20
40
60
80
100
ACT QLD NSW VIC SA TAS
Perc
enta
ge (%
)
NUOS Wholesale Retail Green schemes
CHART 12 | Estimated cost components of annual electricity bill for SMEs using 20,000 kWh (single rate) per annum in each jurisdiction in April 2021. Total retail bill is GST exclusive.33
Chart 13 shows the bill components as a percentage of the total bill. It shows that the NUOS component of a retail bill (exclusive of GST) is 39-51%. The cost of wholesale energy ranges from 31% in Queensland, South Australia and Tasmania to 36% in Victoria. The residual retail component also varies significantly. While it is zero in the ACT it is as high as 21% in Tasmania.34 The ‘green scheme’ component is highest in the ACT (17%) and lowest in NSW (8%).
CHART 13 | Estimated bill-stack proportions of annual electricity bill for SMEs using 20,000 kWh (single rate) per annum in each jurisdiction in April 2021. Total retail bill is GST exclusive.35
33 The NUOS does not include separately listed standard metering charges. The Queensland figures are based on the Energex network only 34 A zero-residual amount in the ACT does not mean that the retailers do not have costs or a margin in this jurisdiction. It can, however, indicate that the retail costs/margins are lower in the ACT compared to other jurisdictions.35 Total retail bill based on average market offer including guaranteed and pay on time discounts. Note that as these proportions are based on total retail bills exclusive of GST, the network proportion will be greater than in chart 11 which is based on bills inclusive of GST.

Analysis of small business retail energy bills in Australia 15
3.1.6 Impact of the Default Market Offer (DMO) and Victorian Default Offer (VDO)
In October 2018 the Australian Treasurer and the Minister for Energy requested the Australian Energy Regulator (AER) develop a Default Market Offer (DMO) for each electricity network area in NSW, South Australia and South East Queensland.36 This request was in response to recommendations outlined in the Australian Competition and Consumer Commission’s (ACCC) Retail Electricity Pricing Inquiry. The initial regulated DMOs took effect on 1 July 2019 but these rates were replaced by new DMO rates on 1 July 2020.37 The DMO has replaced the retailer determined standing offers previously available in these networks.
The Victorian Default Offer (VDO) is a Victorian Government initiative that requires the Essential Services Commission (ESC) to set a VDO for basic metering types (single rate) in each network area. All retailers are required to offer the VDO but they can, and still do, offer other market contracts. The initial VDO took effect on 1 July 2019 but these rates were replaced by new VDO rates on 1 January 2020 and 1 January 2021. All SMEs that were on a retailer’s standing offer prior to the introduction of the DMO and VDO were moved to the DMO or VDO.
On average, the current DMO/VDO have lowered standing offer bills by approximately 33% in Victoria, 10% in NSW and South East Queensland, and 16% in South Australia compared to the standing offers that were in place prior to the DMO/VDO taking effect in July 2019.38 The below outlines the decreases to standing offers post the DMO and VDO taking effect and further analysis on impacts and market changes are discussed under the jurisdictional analysis (Section 4).
The Default Market Offer (DMO)The AER’s DMO is expressed as an annual bill for a set consumption level and retailers are still able to “translate the annual amount into different tariff structures”.39 The Regulations stipulate that retailers must structure their prices to not exceed the annual DMO price for that consumption level.40
The DMO prices, effective from July 2020, for single rate in NSW, South East Queensland and South Australia, as well as AER’s estimated median saving for customers on set consumption levels are listed in table 4 below.41
TABLE 4 | Small business DMO prices in NSW, South East Queensland and South Australia for 2020-21 (including GST)
Ausgrid Endeavour Energy
Essential Energy Energex SAPN
SINGLE / FLAT RATEAnnual bill $7,240 $6,177 $8,041 $5,760 $8,305
Change* -$131 -$27 -$4 -$265 -$815Consumption
level 20,000 kWh/
annum20,000 kWh/
annum20,000 kWh/
annum20,000 kWh/
annum20,000 kWh/
annum* The change is the difference to annual bills between the DMO price that took effect in July 2019 and the DMO price that took effect in July 2020 based on the model annual usage.
In NSW, the current DMO produces significantly lower bills compared to AGL, Energy Australia and Origin Energy’s standing offers prior to 1 July 2019. Chart 14 compares the DMOs as of July 2020 and July 2019 to the ‘big 3’ retailers’ average standing offers in each network area.42 In the Ausgrid network the current DMO is 12% less than the average standing offer as of April 2019, in Endeavour Energy it is 8% less and bills are down by 9% in Essential Energy.
36 See https://www.aer.gov.au/system/files/Letter%20to%20the%20AER%20Chair%20-%20default%20pricing.pdf37 New DMO rates will take effect on 1 July 2021.38 Based on the ‘big 3’ retailers’ standing offers prior to DMO/VDO taking effect and small businesses consuming 20,000 kWh per annum.39 AER, Default Market Offer Prices 2019-20, Final Determination, April 2019, 940 Ibid., 941 AER, Default Market Offer Prices 2020-21, Final Determination, April 2020, 9 42 The ‘big 3’ retailers are AGL, Energy Australia and Origin Energy.
16
8,247
6,738
8,872
7,238
6,176
8,039
4,000
5,000
6,000
7,000
8,000
9,000
10,000
Ausgrid Endeavour Essential
Standing offer Apr 2019 DMO 2019/20 DMO 2020/21
6,649 6,256 6,348
6,023 6,024 6,024 5,757 5,758 5,759
4,000
5,000
6,000
7,000
8,000
9,000
10,000
AGL EnergyAustralia Origin Energy
Standing offer Apr 2019 DMO 2019/20 DMO 2020/21
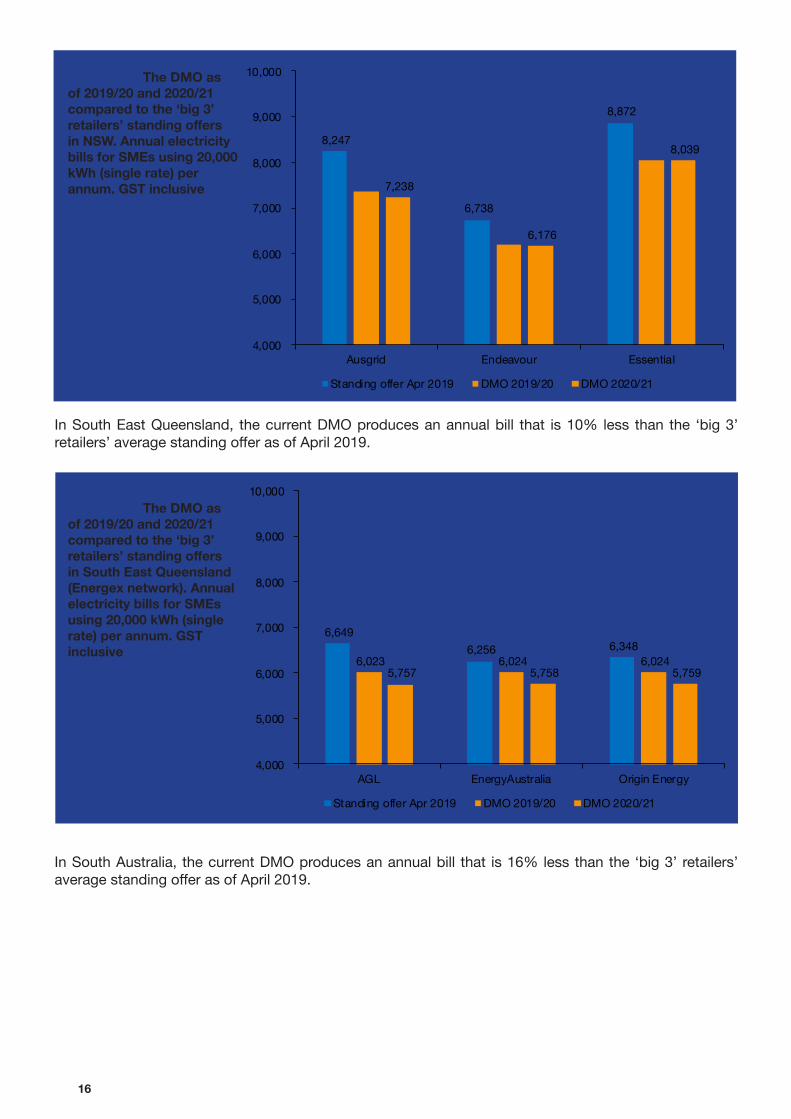
CHART 14 | The DMO as of 2019/20 and 2020/21 compared to the ‘big 3’ retailers’ standing offers in NSW. Annual electricity bills for SMEs using 20,000 kWh (single rate) per annum. GST inclusive
In South East Queensland, the current DMO produces an annual bill that is 10% less than the ‘big 3’ retailers’ average standing offer as of April 2019.
CHART 15 | The DMO as of 2019/20 and 2020/21 compared to the ‘big 3’ retailers’ standing offers in South East Queensland (Energex network). Annual electricity bills for SMEs using 20,000 kWh (single rate) per annum. GST inclusive
In South Australia, the current DMO produces an annual bill that is 16% less than the ‘big 3’ retailers’ average standing offer as of April 2019.

Analysis of small business retail energy bills in Australia 17
9,802
10,839
9,108 9,116 9,118 9,119
8,302 8,304 8,305
4,000
5,000
6,000
7,000
8,000
9,000
10,000
11,000
AGL EnergyAustralia Origin Energy
Standing offer Apr 2019 DMO 2019/20 DMO 2020/21
7,21
6 7,98
4
9,38
7
7,85
4
8,12
4
4,93
0
5,09
3
6,88
6
5,25
6
5,26
9
-
1,000
2,000
3,000
4,000
5,000
6,000
7,000
8,000
9,000
10,000
Citipower Powercor Ausnet Jemena United
Standing offer Apr 2019VDO Oct 2019
VDO Apr 2020VDO Oct 2020
VDO Apr 2021
CHART 16 | The DMO as of 2019/20 and 2020/21 compared to the ‘big 3’ retailers’ standing offers in South Australia (SA Power Networks). Annual electricity bills for SMEs using 20,000 kWh (single rate) per annum. GST inclusive
Victorian Default Offer (VDO) Chart 17 compares the VDO rates to the ‘big 3’ retailers’ average standing offers (as of April 2019) in each of the five Victorian network areas.43 In October 2019 the VDO in the Powercor network was 34% less than the average standing offer in place prior to the VDO taking effect. The increase in January 2020, however, means that the VDO increased by 8%. In January 2021, however, the VDO significantly decreased. The VDO is now 33% less than the average standing offer in April 2019 (prior to the VDO arrangements taking effect). In the Ausnet Services network area bills initially reduced by 21%, then increased by 6% before reducing by 12% in January 2021. Bills are now 27% less compared April 2019. In Jemena they initially went down by 26%, increased by 8% and reduced by 16%. The VDO is now 33% lower than the average standing offer bill in April 2019. In Citipower they first went down by 25%, increased by 8% and decreased by 15% in January 2021. The January 2020 increase was greatest in the United Energy network (10%) but that network also saw the greatest decrease in January 2021 (17%). Bills are now 35% less compared to April 2019.
CHART 17 | The VDO compared to the ‘big 3’ retailers’ standing offers in Victoria. Annual electricity bills for SMEs using 20,000 kWh (single rate) per annum. GST inclusive
43 While the VDO only applies to the single rate tariff, retailers have been required, since 1 January 2020, to ensure that all standing offers (irrespective of tariff type) are within the maximum bill determination for the single rate VDO offer.
18
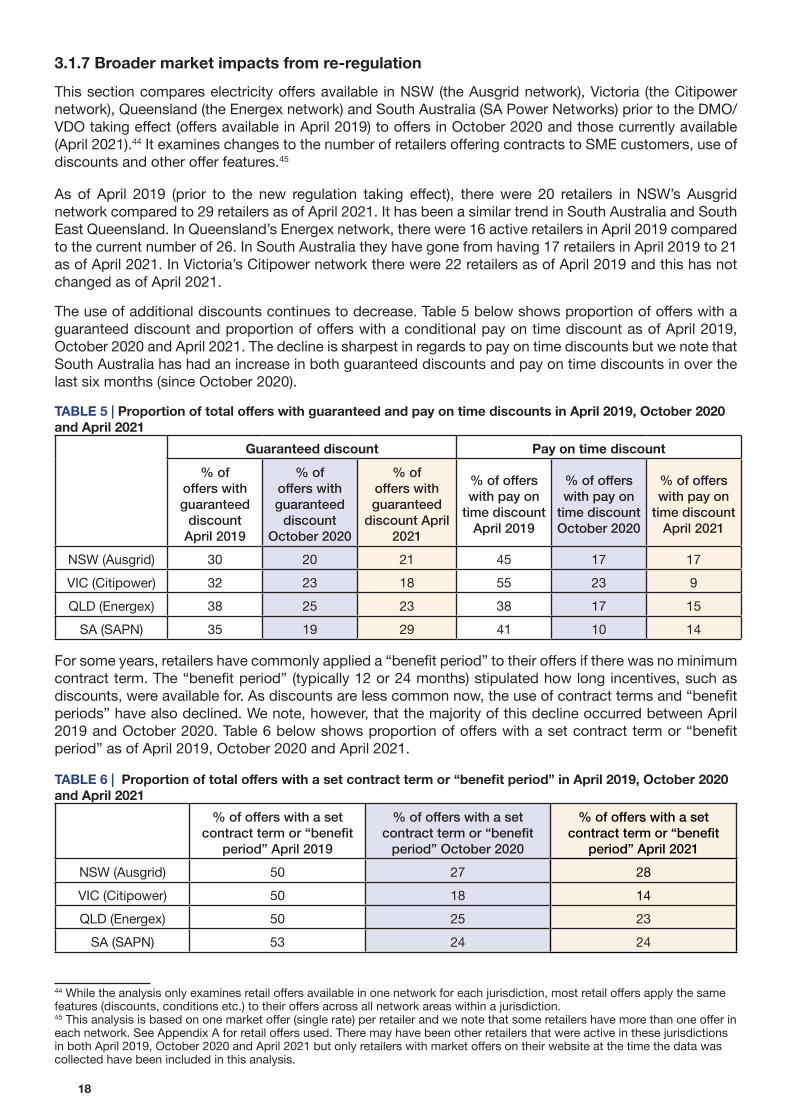
3.1.7 Broader market impacts from re-regulation This section compares electricity offers available in NSW (the Ausgrid network), Victoria (the Citipower network), Queensland (the Energex network) and South Australia (SA Power Networks) prior to the DMO/VDO taking effect (offers available in April 2019) to offers in October 2020 and those currently available (April 2021).44 It examines changes to the number of retailers offering contracts to SME customers, use of discounts and other offer features.45
As of April 2019 (prior to the new regulation taking effect), there were 20 retailers in NSW’s Ausgrid network compared to 29 retailers as of April 2021. It has been a similar trend in South Australia and South East Queensland. In Queensland’s Energex network, there were 16 active retailers in April 2019 compared to the current number of 26. In South Australia they have gone from having 17 retailers in April 2019 to 21 as of April 2021. In Victoria’s Citipower network there were 22 retailers as of April 2019 and this has not changed as of April 2021.
The use of additional discounts continues to decrease. Table 5 below shows proportion of offers with a guaranteed discount and proportion of offers with a conditional pay on time discount as of April 2019, October 2020 and April 2021. The decline is sharpest in regards to pay on time discounts but we note that South Australia has had an increase in both guaranteed discounts and pay on time discounts in over the last six months (since October 2020).
TABLE 5 | Proportion of total offers with guaranteed and pay on time discounts in April 2019, October 2020 and April 2021
Guaranteed discount Pay on time discount% of
offers with guaranteed
discount April 2019
% of offers with guaranteed
discount October 2020
% of offers with guaranteed
discount April 2021
% of offers with pay on
time discount April 2019
% of offers with pay on
time discount October 2020
% of offers with pay on
time discount April 2021
NSW (Ausgrid) 30 20 21 45 17 17VIC (Citipower) 32 23 18 55 23 9QLD (Energex) 38 25 23 38 17 15
SA (SAPN) 35 19 29 41 10 14
For some years, retailers have commonly applied a “benefit period” to their offers if there was no minimum contract term. The “benefit period” (typically 12 or 24 months) stipulated how long incentives, such as discounts, were available for. As discounts are less common now, the use of contract terms and “benefit periods” have also declined. We note, however, that the majority of this decline occurred between April 2019 and October 2020. Table 6 below shows proportion of offers with a set contract term or “benefit period” as of April 2019, October 2020 and April 2021.
TABLE 6 | Proportion of total offers with a set contract term or “benefit period” in April 2019, October 2020 and April 2021
% of offers with a set contract term or “benefit
period” April 2019
% of offers with a set contract term or “benefit
period” October 2020
% of offers with a set contract term or “benefit
period” April 2021NSW (Ausgrid) 50 27 28VIC (Citipower) 50 18 14QLD (Energex) 50 25 23
SA (SAPN) 53 24 24
44 While the analysis only examines retail offers available in one network for each jurisdiction, most retail offers apply the same features (discounts, conditions etc.) to their offers across all network areas within a jurisdiction. 45 This analysis is based on one market offer (single rate) per retailer and we note that some retailers have more than one offer in each network. See Appendix A for retail offers used. There may have been other retailers that were active in these jurisdictions in both April 2019, October 2020 and April 2021 but only retailers with market offers on their website at the time the data was collected have been included in this analysis.

Analysis of small business retail energy bills in Australia 19
0
1,000
2,000
3,000
4,000
5,000
Tas Qld SA ACT WA NSW Vic
$ pe
r ann
um
An offer feature that has become increasingly common is a mandatory shortened billing cycle. Typically, electricity bills are issued every quarter, but a significant proportion of offers are now conditional upon the customer receiving monthly bills. In Victoria, a significant proportion of retailers moved to monthly billing between April 2019 and October 2020 but some retailers have since made monthly billing optional. In South Australia, on the other hand, the proportion of offers with shortened billing cycles has reduced. Table 7 below shows the proportion of offers with a mandatory monthly billing condition as of April 2019, October 2020 and April 2021.
TABLE 7 | Proportion of total offers with a set “benefit period” in April 2019, October 2020 and April 2021
% of offers with monthly billing April 2019
% of offers with monthly billing October 2020
% of offers with monthly billing April 2021
NSW (Ausgrid) 35 40 41VIC (Citipower) 36 77 68QLD (Energex) 38 43 42
SA (SAPN) 35 29 33
3.2 Gas bills
Chart 18 shows estimated annual gas bills for SMEs that consume 100 GJ per annum across all states and territories. Tasmanian businesses with this consumption level will have an annual gas bill of just over $4,740, though this is understood to be a high level of use for a typical SME in Tasmania (with many using less). For this level of consumption Victorian businesses will pay approximately $2,145.
CHART 18 | Estimated average annual gas bill for SMEs using 100 GJ per annum in each jurisdiction. Offers as of April 2021, GST inclusive.46
Chart 19 shows the trend in annual gas bills from April 2016 to April 2021. It shows that bills increased in all jurisdictions except for Western Australia between April 2016 and April 2020. As of April 2021, however, gas prices in NSW are now lower than they were in April 2016. SMEs in Victoria and Tasmania have experienced the greatest price increases since April 2016.
46 Based on offers available in April 2021. Average market offer (including guaranteed discounts and pay on time discounts). In QLD this is based on offers available in the Brisbane North and the Brisbane South pricing zones, in NSW it is based on offers available in the Sydney/Jemena zone, in Victoria it is based on the eight major gas zones, and in WA it is based on the South West zone. Tasmania and SA only have one pricing zone.

20
1,000
1,500
2,000
2,500
3,000
3,500
4,000
4,500
5,000
Apr-16 Apr-17 Oct-17 Apr-18 Oct-18 Apr-19 Oct-19 Apr-20 Oct-20 Apr-21
Annu
al b
ill ($
)
Tas Qld SA ACT WA NSW Vic
-250
-200
-150
-100
-50
0
50
100
150
200
250
SA Tas WA Qld Vic ACT NSW
$ C
hang
e
$ change Average
CHART 19 | Estimated average annual gas bills for SMEs using 100 GJ per annum in each jurisdiction since April 2016. GST inclusive.47
Chart 20 shows $ change to annual bills from April 2020 to April 2021. On average, nationally, annual gas bills decreased by 2% between April 2020 and April 2021. Annual gas bills for SMEs decreased in every jurisdiction except South Australia (up by 4%) and Tasmania (unchanged), during this period. In New South Wales, they have decreased by $225 (8%) and in the ACT the average bill is now $200 (6%) less compared to a year ago.
CHART 20 | Changes ($) to average annual gas bill for SMEs using 100 GJ per annum in each jurisdiction from April 2020 to April 2021. GST inclusive
3.2.1 Maximum price spread – gas
The difference between the highest and lowest gas market offers, the maximum price-spread, decreased in the ACT and Victoria compared with the same period a year ago. For NSW, in particular, the price-spread has increased. As of April 2021, the maximum price-spread was approximately $760 in NSW, $640 in South Australia, $455 in Victoria, $350 in the ACT and $260 in Queensland. In Tasmania, the maximum
47 Average market offer (including guaranteed discounts and pay on time discounts) for each jurisdiction. In QLD this is based on offers available in the Brisbane North and the Brisbane South pricing zones, in NSW it is based on offers available in the Sydney/Jemena zone, in Victoria it is based on the eight major gas zones, and in WA it is based on the South West zone. Tasmania and SA only have one pricing zone.

Analysis of small business retail energy bills in Australia 21
0
100
200
300
400
500
600
700
800
900
1,000
ACT NSW QLD SA TAS VIC
$ pe
r ann
um
Apr-16 Apr-17 Oct-17 Apr-18 Oct-18Apr-19 Oct-19 Apr-20 Oct-20 Apr-21
$0
$200
$400
$600
$800
$1,000
$1,200
WA ACT NSW SA Qld Vic
$ pe
r ann
um
price-spread was $110.48 Chart 21 shows the trend in the maximum price-spread since April 2016 for all jurisdictions where a number of retailers offer gas market contracts.
CHART 21 | Trend in the maximum price-spread for gas market offers (including guaranteed and pay on time discounts) in each jurisdiction since April 2016 based on SMEs using 100 GJ per annum. GST inclusive
3.2.2 Additional discounts – gas
Some retailers offer guaranteed discounts while none of the gas retailers currently have discounts that are conditional upon bills being paid on time. Chart 22 shows the difference between the average market offer bill excluding guaranteed discounts, and the average market offer bill inclusive of discounts. It shows that discounts have the greatest impact in Western Australia (reduces an average annual bill by $985) while they have the least impact in South Australia, Queensland and Victoria.49 It should be noted, however, that Western Australia only has three retailers that publish SME market offers and that this discount reflects the 45% discount offered by AGL and 32% discount offered by Origin Energy. Both retailers are relatively new entrants in the WA gas retail market.
CHART 22 | Difference ($) to average annual gas bill inclusive and exclusive of discounts (guaranteed and conditional), based on SMEs using 100 GJ per annum, April 2021. GST inclusive
48 Based on annual consumption of 100 GJ and analysis based on 9 retail offers in Victoria, 8 retailers in NSW and South Australia, 5 in Queensland, 4 in the ACT and 2 retailers in Tasmania. Analysis does not include WA as AGL and Origin are relatively new entrants in the WA gas retail market. As of April 2021, however, the maximum price-spread in WA was $1,730..49 Jurisdictions without or only a few market offers have not been included in this analysis.

22
0
100
200
300
400
500
600
700
ACT NSW QLD SA TAS VIC WA
$ pe
r ann
um
Apr-16 Apr-17 Oct-17 Apr-18 Oct-18Apr-19 Oct-19 Apr-20 Oct-20 Apr-21
0
2
4
6
8
10
12
14
16
18
20
WA NSW Qld Tas SA Vic ACT
Supp
ly c
harg
e as
pro
porti
on (%
) of a
nnua
l bill
Apr-16 Apr-17 Oct-17 Apr-18 Oct-18Apr-19 Oct-19 Apr-20 Oct-20 Apr-21
3.2.3 Fixed supply charge – gas
For gas supply charges, there are significant differences between jurisdictions. Fixed supply charges are highest in the ACT and lowest in Western Australia. Compared with the same period a year ago, fixed supply charges have decreased in the ACT (7%). In Queensland, Tasmania and Victoria, the supply charges have increased by a modest 1% to 2% since April 2020. Fixed supply charges as a proportion of the annual bill are highest in the ACT (18%) and lowest in Western Australia (4%).
CHART 23 | Trend in average annual gas supply charge ($) for SMEs in each jurisdiction since April 2016. GST inclusive.50
CHART 24 | Trend in average annual gas supply charge as proportion (%) of bill for SMEs using 100 GJ per annum in each jurisdiction from April 2016 to April 2021. GST inclusive.
50 Based on the average supply charge for gas market offers. In WA, Alinta Energy and AGL’s supply charges are inclusive of a daily Account Administration Fee as of April 2019, October 2019, April 2020, October 2020 and April 2021. In the April 2018 update, only Alinta explicitly stated that an Account Administration Fee applies. Origin’s offers in WA do not mention this fee.

Analysis of small business retail energy bills in Australia 23
4. Jurisdictional analysis
This section analyses and compares electricity and gas offers available to small business customers in each of the jurisdictions. It compares price-spreads (maximum price differences between retail offers), the impact guaranteed and conditional pay on time discounts have on energy bills, and the network cost as a proportion of total electricity bills. It also highlights price changes (increases and/or decreases) that have occurred over both a six month and twelve-month period to April 2021,51 differences in annual bills (based on assumed consumption levels) between retailers, as well as between electricity networks and gas pricing zones within each jurisdiction.52
Consistent with section 3 above, we assume an annual consumption level of 20,000 kWh53 (single rate) for electricity and 100 GJ for gas. We stress that gas consumption varies significantly between jurisdictions and that the 100 GJ consumption level is a low consumption level in Victoria, medium in the ACT and South Australia, and high in Queensland. We note that the workbooks accompanying this report allow users to nominate their own consumption levels and we encourage all stakeholders to access the workbooks at: https://energyconsumersaustralia.com.au/publications/our-research.
4.1 New South Wales
Electricity retail prices in NSW have been deregulated since 2014 but on 1 July 2019 the Australian Energy Regulator’s Default Market Offer (DMO) replaced the previously retailer determined electricity standing offers in NSW. Gas retail prices for customers using less than 1,000 GJ per annum became deregulated in July 2017.
NSW has three electricity networks and several gas pricing zones:
Electricity network and incumbent retailer AreaAusgrid (Energy Australia) Inner Sydney, Northern Sydney, Swansea, Newcastle, Maitland,
Cessnock, Singleton and Upper HunterEndeavour Energy (Origin) Western Sydney, Wollongong, Blue Mountains, Lithgow, Kandos,
Moss Vale, Nowra, UlladullaEssential Energy (Origin) Rural and Regional NSWNSW Gas zones and host retailer AreaJemena/Sydney (AGL) Sydney, Newcastle, Wollongong, Blue MountainsAGN (Origin) Cooma and Bombala
Temora, Holbrook, Henty, Culcairn and Walla WallaTumut and GundagaiWagga Wagga and UranquityAlbury, Moama and JinderaMurray Valley Towns
Central ranges (Origin) TamworthJemena/Capital Region (ActewAGL) Boroowa, Goulburn, Yass and YoungQueanbeyan (ActewAGL) Queanbeyan and BundgendoreShoalhaven (ActewAGL) Shoalhaven
51 As the last data collection of retail offers occurred in April 2021, offers as of April 2021 have been compared to offers in October 2020 (the previous data collection), and the trend over the twelve months since April 2020. As the electricity Network Use of System (NUOS) charges change on 1 January in Victoria and on 1 July in all other jurisdictions, the April data, and associated report, will typically reveal recent price changes in Victoria while the October data (and report) will highlight major price changes in the other jurisdictions. 52 Appendix A contains a list of the various retail offers used for this analysis.53 This consumption level for electricity is based on the NEM average, see Jacobs Australia, Retail electricity price history and project trends, AEMO, 21 September 2017

24
4,000
5,000
6,000
7,000
8,000
9,000
1 2 3 4 5 6 7 8 9 1011121314151617181920212223242526272829
$ pe
r ann
um
Ausgrid Endeavour Essential
4.1.1 NSW electricity bills April 2021
The bill analysis presented in this report is based on SMEs using 20,000 kWh per annum on a single rate tariff. Research published by AEMO54 shows that small businesses, on average (across the NEM network areas), use approximately 20,000 kWh per annum and we use this average instead of network specific consumption profiles to readily enable comparison between network areas and jurisdictions. According to the AEMO report, average consumption for a small business in the Ausgrid network is 13,000 kWh per annum while the average consumption is 27,266 kWh in the Endeavour Energy network. We also note that the workbooks accompanying this report allow users to nominate their own consumption levels as well as undertaking analysis of different tariff types (2-rate tariffs, time of use tariffs etc.). The workbooks are available at: https://energyconsumersaustralia.com.au/publications/our-research.
The price-spreadChart 25 shows annual bills for SMEs consuming 20,000 kWh per annum (single rate) for 29 retailers across the three NSW distribution networks.55 It shows that the typical annual bill for SMEs with this consumption level is between $5,125 and $6,635 (depending on network area).
It also shows that prices are highest in the Essential Energy network and lowest in Endeavour Energy. The maximum price-spread is greatest in Ausgrid where the difference between the lowest and the highest annual bill is $2,715 compared to $1,625 in the Endeavour Energy network. The average maximum price-spread for all three networks is approximately $2,140. Compared to six months ago (October 2020), the average maximum price-spread has decreased by $260.
CHART 25 | The price-spread for each of the three NSW distribution networks. Annual bills based on market offers as of April 2021 (including guaranteed discounts and pay on time discounts), 20,000 kWh per annum, single rate and GST inclusive
Figures 1 - 3 below rank the retail offers from lowest to highest annual electricity bills in each of the three network areas.56 The lowest annual retail bill in each network area has decreased or remained unchanged since October 2020. In Ausgrid and Endeavour Energy the best offer, as of April 2021, is the same as the best offer six months ago. In Essential Energy the best offer produces an annual bill that is $80 less compared to six months ago.
54 Jacobs Australia, Retail electricity price history and project trends, AEMO, 21 September 2017 55 See appendix A for a list of retail offers included in this analysis. Many retailers have more than one market offer and the rates, conditions, size of discounts as well as discount types (e.g. guaranteed or conditional) may vary between their offers. 56 These market offers were collected in April 2020 and it should be noted that retailers may change their rates at any time. Bill calculations based on SMEs using 20,000 kWh/annum (single rate). All bills are inclusive of guaranteed and pay on time discounts as well as GST. Additional discounts for customers choosing to pay by direct debit are not included in these bill calculations.

Analysis of small business retail energy bills in Australia 25
FIGURE 3 | Lowest to highest annual electricity bills for market offers in NSW’s Essential Energy network
(April 2021)
FIGURE 1 | Lowest to highest annual electricity bills for market offers in
NSW’s Ausgrid network (April 2021)
BlueNRG $4,523
Powerclub $4,674
Energy Locals $5,022
CovaU $5,351
Tango Energy $5,364
EnergyAustralia $5,719
Discover Energy $5,735
Next Business Energy $4,857
Locality Planning Energy $5,497
Momentum Energy $5,560
Future X Power $5,696
Simply Energy $5,718
Sumo Power $5,841
FIGURE 2 | Lowest to highest annual electricity bills for market offers in
NSW’s Endeavour Energy network (April 2021)
Powerdirect $6,004
Red Energy $5,702
Radian Energy $6,223
Powershop $6,343
Diamond Energy $6,536
QEnergy $7,236
BlueNRG $4,552
Powerclub $4,574
Simply Energy $4,879Momentum Energy $4,913
Energy Locals $4,924
Tango Energy $4,928
Red Energy $5,060
CovaU $5,208
Discover Energy $5,128
Locality Planning Energy $5,308
Next Business Energy $4,765
Future X Power $4,962
Powerdirect $5,123
Enova Energy $5,267
Radian Energy $5,310
Energy Australia $5,373
Powershop $5,412
Origin Energy $5,364
Sumo Power $5,460
1st Energy $5,273
Diamond Energy $5,768
QEnergy $6,175
Powerclub $5,952
Next Business Energy $6,209
Energy Locals $6,268
Simply Energy $6,351
Momentum Energy $6,438
Glow Power $6,487
Locality Planning Energy $6,547
Powerdirect $6,672
Enova Energy $6,703
Discover Energy $6,705
CovaU $6,882
Bright Spark Power $6,322
AGL $6,432
EnergyAustralia $6,592
Red Energy $6,497
Tango Energy $6,652
Radian Energy $6,913
Origin Energy $7,001
Powershop $7,162
Diamond Energy $7,381
QEnergy $8,037
ReAmped Energy $4,854
Bright Spark Power $5,322
Alinta Energy $5,333
AGL $5,354
1st Energy $5,530
Electricity in a box $5,645
Enova Energy $5,681
Glow Power $5,693
Arc Energy Group $5,752
Origin Energy $6,316
ReAmped Energy $4,755
Bright Spark Power $4,940
Arc Energy Group $5,026
Alinta Energy $5,046
Glow Power $4,940
AGL $5,063
ReAmped Energy $6,203
Alinta Energy $6,463
1st Energy $7,614
Future X Power $6,506

26
0
200
400
600
800
1,000
1,200
1,400
1,600
DiamondEnergy
Powershop 1st Energy Enova Energy Arc EnergyGroup
$ pe
r ann
um
Ausgrid Endeavour Essential
Additional discountsFive of the twenty-nine retailers operating in NSW offer conditional pay on time discounts. For customers using 20,000kWh per annum the conditional discount can be worth up to $1,415 (Arc Energy Group’s offer in the Ausgrid network). Other retailers with conditional discounts are Diamond Energy, Powershop, 1st Energy and Enova Energy.57 Chart 26 below shows the difference between annual bills that include guaranteed discounts only compared to annual bills that include conditional pay on time discounts (only retailers that offer conditional discounts are included in this Chart).
CHART 26 | Difference in annual bills based on guaranteed discounts only and conditional discounts in all three NSW network areas. Annual bills based on market offers as of April 2021, 20,000 kWh per annum, single rate and GST inclusive
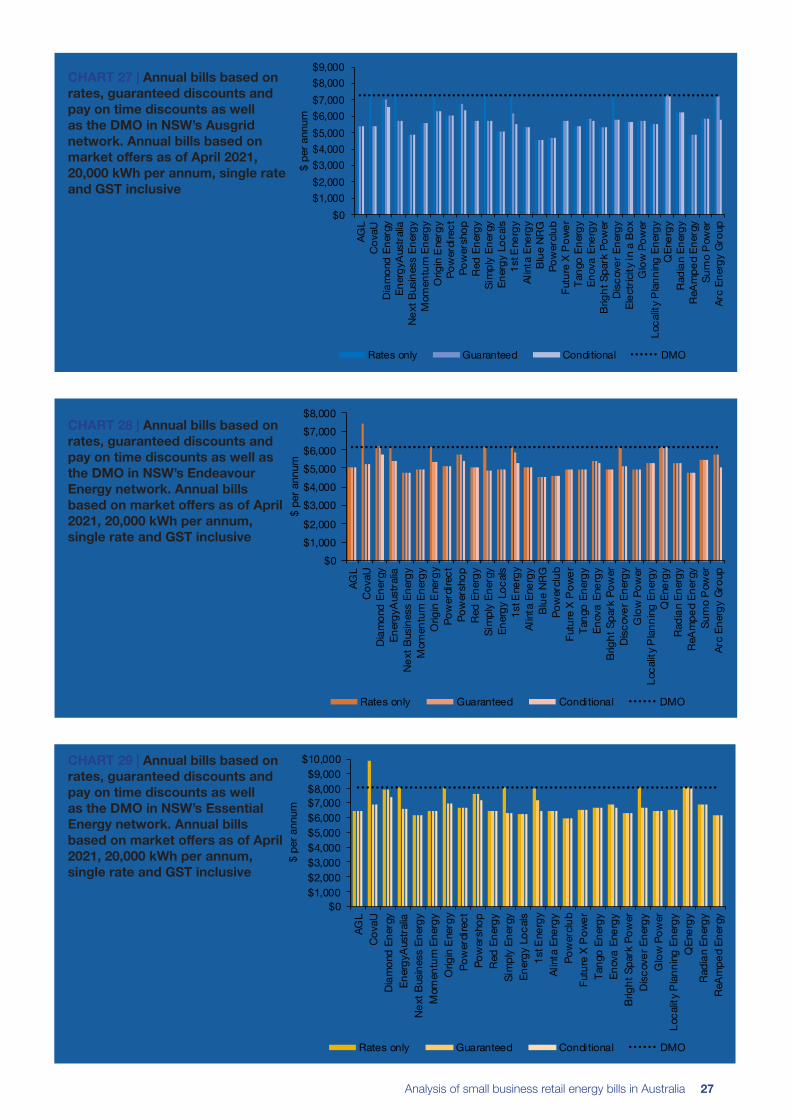
Charts 27 - 29 show annual bills based on their rates only, inclusive of guaranteed discounts and inclusive of guaranteed as well as conditional pay on time discounts for all three network areas. It shows that six retailers, CovaU, Energy Australia, Origin Energy, Simply Energy, 1st Energy and Discover Energy, offer significant guaranteed discounts. These retailers, however, also have some of the highest base rates.58 The charts also compare the market offers to the DMO and they show that none of the retailers have market offers (inclusive of discounts) that produce bills that are higher than the DMO.
57 Note that Powershop’s conditional discount is not a conventional pay on time discount as customers obtain the discount by pre-purchasing “specials”. Arc Energy Group’s offers in Ausgrid include a 22% off usage charges for customers that pay on time while the discount is 13% in Endeavour. They do not currently have offers in the Essential network. 58 Origin Energy and Powershop’s discounts are applied to amounts inclusive of GST while all other discounts are applied to amounts exclusive of GST.
Analysis of small business retail energy bills in Australia 27
$0$1,000$2,000$3,000$4,000$5,000$6,000$7,000$8,000$9,000
AGL
Cov
aUD
iam
ond
Ener
gyEn
ergy
Aus
tral
iaN
ext B
usin
ess
Ener
gyM
omen
tum
Ene
rgy
Orig
in E
nerg
yPo
wer
dire
ctPo
wer
shop
Red
Ene
rgy
Sim
ply
Ener
gyEn
ergy
Loc
als
1st E
nerg
yAl
inta
Ene
rgy
Blu
e N
RG
Pow
ercl
ubFu
ture
X P
ower
Tang
o En
ergy
Enov
a En
ergy
Brig
ht S
park
Pow
erD
isco
ver E
nerg
yEl
ectr
icity
in a
Box
Glo
w P
ower
Loca
lity
Pla
nnin
g En
ergy
QEn
ergy
Rad
ian
Ener
gyR
eAm
ped
Ener
gySu
mo
Pow
erAr
c En
ergy
Gro
up
$ pe
r ann
um
Rates only Guaranteed Conditional DMO
$0$1,000$2,000
$3,000$4,000$5,000$6,000
$7,000$8,000
AGL
Cova
UDi
amon
d En
ergy
Ener
gyAu
stra
liaNe
xt B
usin
ess
Ener
gyM
omen
tum
Ene
rgy
Orig
in E
nerg
yPo
wer
dire
ctPo
wer
shop
Red
Ener
gySi
mpl
y En
ergy
Ener
gy L
ocals
1st E
nerg
yAl
inta
Ener
gyBl
ue N
RGPo
wer
club
Futu
re X
Pow
erTa
ngo
Ener
gyEn
ova
Ener
gyBr
ight
Spa
rk P
ower
Disc
over
Ene
rgy
Glo
w Po
wer
Loca
lity P
lanni
ng E
nerg
yQ
Ener
gyRa
dian
Ene
rgy
ReAm
ped
Ener
gySu
mo
Pow
erAr
c En
ergy
Gro
up
$ pe
r ann
um
Rates only Guaranteed Conditional DMO
$0$1,000$2,000$3,000$4,000$5,000$6,000$7,000$8,000$9,000
$10,000
AGL
Cova
UDi
amon
d En
ergy
Ener
gyAu
stra
liaNe
xt B
usin
ess
Ener
gyM
omen
tum
Ene
rgy
Orig
in E
nerg
yPo
wer
dire
ctPo
wer
shop
Red
Ener
gySi
mpl
y En
ergy
Ener
gy L
ocals
1st E
nerg
yAl
inta
Ener
gyPo
wer
club
Futu
re X
Pow
erTa
ngo
Ener
gyEn
ova
Ener
gyBr
ight
Spa
rk P
ower
Disc
over
Ene
rgy
Glo
w Po
wer
Loca
lity P
lanni
ng E
nerg
yQ
Ener
gyRa
dian
Ene
rgy
ReAm
ped
Ener
gy
$ pe
r ann
um
Rates only Guaranteed Conditional DMO
CHART 27 | Annual bills based on rates, guaranteed discounts and pay on time discounts as well as the DMO in NSW’s Ausgrid network. Annual bills based on market offers as of April 2021, 20,000 kWh per annum, single rate and GST inclusive
CHART 28 | Annual bills based on rates, guaranteed discounts and pay on time discounts as well as the DMO in NSW’s Endeavour Energy network. Annual bills based on market offers as of April 2021, 20,000 kWh per annum, single rate and GST inclusive
CHART 29 | Annual bills based on rates, guaranteed discounts and pay on time discounts as well as the DMO in NSW’s Essential Energy network. Annual bills based on market offers as of April 2021, 20,000 kWh per annum, single rate and GST inclusive

28
20.0
25.0
30.0
35.0
40.0
45.0
50.0
55.0
$3,000
$4,000
$5,000
$6,000
$7,000
$8,000
$9,000
Blue
NRG
Powe
rclub
ReAm
ped
Ener
gy
Next
Bus
iness
Ene
rgy
Ener
gy L
ocal
s
Brig
ht S
park
Pow
erAl
inta
Ene
rgy
Cova
UAG
LTa
ngo
Ener
gy
Loca
lity P
lannin
g En
ergy
1st E
nerg
y
Mom
entu
m E
nerg
y
Elec
t rici
ty in
a B
oxEn
ova E
nerg
yGl
ow P
ower
Futu
re X
Pow
erRe
d En
ergy
Sim
ply E
nerg
yEn
ergy
Aust
ralia
Disc
over
Ene
rgy
Arc
Ener
gy G
roup
Sum
o Po
wer
Powe
rdire
ctRa
dian
Ener
gyOr
igin
Ener
gyPo
wersh
opDi
amon
d En
ergy
QEne
rgy
NU
OS
prop
ortio
n (%
) of b
ill
Annu
al re
tail
bill
($)
Total bill ($) NUOS proportion (%)
20.0
25.0
30.0
35.0
40.0
45.0
50.0
55.0
$3,000
$4,000
$5,000
$6,000
$7,000
$8,000
$9,000
Blue
NRG
Powe
rclub
ReAm
ped
Ener
gy
Next
Bus
iness
Ene
rgy
Sim
ply E
nerg
y
Mom
entu
m E
nerg
yEn
ergy
Loc
als
Tang
o En
ergy
Brig
ht S
park
Pow
erGl
ow P
ower
Futu
re X
Pow
er
Arc
Ener
gy G
roup
Alin
ta E
nerg
yRe
d En
ergy AG
LPo
werd
irect
Disc
over
Ene
rgy
Cova
UEn
ova E
nerg
y1s
t Ene
rgy
Loca
lity P
lannin
g En
ergy
Radia
n En
ergy
Origi
n En
ergy
Ener
gyAu
stra
liaPo
wersh
opSu
mo
Powe
rDi
amon
d En
ergy
QEne
rgy
NU
OS
prop
ortio
n (%
) of b
ill
Annu
al re
tail
bill
($)
Total bill ($) NUOS proportion (%)
Network chargesThe NSW electricity networks, Ausgrid, Endeavour Energy and Essential Energy, introduce new Network Use of System (NUOS) charges as of 1 July every year. These NUOS charges are approved by the Australian Energy Regulator (AER) and comprise Transmission Use of System (TUOS) and Distribution Use of System (DUOS) as well as other costs such as jurisdictional charges and metering charges. The retailers can, and generally will, build changes to the NUOS (in relation to both shape and price) into their retail tariffs.
The charts presented in this section show that the NUOS proportion of bills varies significantly between retail offers. In the Essential network, for example, the NUOS proportion of the bill for Powerclub’s customers is almost 54% while the NUOS is less than 40% of the total bill for QEnergy’s customers.
Charts 30 - 32 show annual retail bills (columns) and NUOS as proportion of annual bill (dotted line) for each of the three network areas.
CHART 30 | Ausgrid: Annual retail bills (incl. GST) and NUOS as proportion of total bill, April 2021. Based on retail market offers (including guaranteed and pay on time discounts), single rate, 20,000 kWh per annum).59
CHART 31 | Endeavour Energy: Annual retail bills (incl. GST) and NUOS as proportion of total bill, April 2021. Based on retail market offers (including guaranteed and pay on time discounts), single rate, 20,000 kWh per annum).60
59 Based on market offer rates as of April 2021, presented as annual bills for SMEs using 20,000kWh per annum (single rate). The annual NUOS charges are based on the Ausgrid’s charges (tariff EA 050) for the 2020/21 financial year. The NUOS also includes fixed charges. 60 Based on market offer rates as of April 2021, presented as annual bills for SMEs using 20,000kWh per annum (single rate). The annual NUOS charges are based on the Endeavour Energy’s charges (tariff N 90) for the 2020/21 financial year. The NUOS also includes fixed charges.

Analysis of small business retail energy bills in Australia 29
20.0
25.0
30.0
35.0
40.0
45.0
50.0
55.0
$3,000
$4,000
$5,000
$6,000
$7,000
$8,000
$9,000
Powe
rclub
ReAm
ped
Ener
gy
Next
Bus
iness
Ene
rgy
Ener
gy L
ocal
s
Brig
ht Sp
ark P
ower
Sim
ply E
nerg
yAG
L
Mom
entu
m E
nerg
yAl
inta E
nerg
yGl
ow P
ower
1st E
nerg
yRe
d En
ergy
Futu
re X
Pow
er
Loca
lity P
lannin
g En
ergy
Ener
gyAu
strali
aTa
ngo
Ener
gyPo
werd
irect
Enov
a Ene
rgy
Disc
over
Ene
rgy
Cova
URa
dian E
nerg
yOr
igin
Ener
gyPo
wers
hop
Diam
ond
Ener
gyQE
nerg
y
NU
OS
prop
ortio
n (%
) of b
ill
Annu
al re
tail
bill
($)
Total bill ($) NUOS proportion (%)
1,500
1,750
2,000
2,250
2,500
2,750
3,000
3,250
3,500
1 2 3 4 5 6 7 8
$ pe
r ann
um
CHART 32 | Essential Energy: Annual retail bills (incl. GST) and NUOS as proportion of total bill, April 2021. Based on retail market offers (including guaranteed and pay on time discounts), single rate, 20,000 kWh per annum).61
4.1.2 NSW gas bills April 2021
To calculate annual gas bills we have assumed an annual consumption of 100 GJ per annum and a flat consumption over the year (25 GJ per quarter or 16.66 GJ per bi-monthly bill.62 Small businesses using gas for heating purposes are unlikely to have a flat consumption profile.
The price-spreadThe Jemena/AGL (Sydney) gas zone is, unsurprisingly, the area with most gas market offers in NSW. AGL is the incumbent retailer in this area. The typical annual market offer bill for SMEs consuming 100 GJ per annum is $2,470 (including discounts). Chart 33 shows annual bills for eight retailers in the Jemena/AGL (Sydney) gas zone and that the maximum price-spread is approximately $760 per annum. The maximum price-spread has remained unchanged over the last six months (since October 2020).
CHART 33 | The price-spread in the Jemena/AGL (Sydney) gas zone. Annual bills based on market offers as of April 2021 (including guaranteed discounts and pay on time discounts), 100 GJ per annum and GST inclusive.
61 Based on market offer rates as of April 2021, presented as annual bills for SMEs using 20,000kWh per annum (single rate). The annual NUOS charges are based on the Essential Energy’s charges (tariff BLNN 1AU) for the 2020/21 financial year. The NUOS also includes fixed charges.62 See appendix A for a list of retail offers included in this analysis. Many retailers have more than one market offer and the rates, conditions, size of discounts as well as discount types (e.g. guaranteed or conditional) may vary between their offers.

30
0
500
1,000
1,500
2,000
2,500
3,000
3,500
4,000
AGLCovau
EnergyA
ustral
ia
Origin Ener
gy
Red Energ
y
Simply E
nergy
Alinta E
nergy
Discove
r Energ
y
$ pe
r ann
um
Rates only Guaranteed Discount
FIGURE 4 | Lowest to highest annual gas bills (incl GST) for market offers in the Jemena/AGL (Sydney) gas zone (April 2021). Bills including guaranteed discounts and pay on time discounts - SMEs consuming 100 GJ per annum.
$2,003Simply Energy
$2,265Alinta Energy
$2,428Origin Energy
$2,461CovaU
$2,499Red Energy
$2,624Discover Energy
$2,712AGL
$2,763EnergyAustralia
Figure 4 below ranks the retail offers from lowest to highest annual gas bills in the Jemena/Sydney gas zone.63
Additional discountsCovaU, Energy Australia, Origin Energy, Simply Energy and Discover Energy offer guaranteed discounts while AGL, Red Energy and Alinta Energy do not offer any additional discounts.
Chart 34 shows annual bills based on their rates only and inclusive of guaranteed discounts in the Jemena/AGL (Sydney) gas zone. It shows that Alinta Energy is the retailer that produces the lowest bill based on rates only. For bills inclusive of guaranteed discounts, however, Simply Energy’s offer produces the lowest bill.
CHART 34 | Annual bills based on rates, guaranteed discounts and pay on time discounts in the Jemena/AGL (Sydney) gas zone. Annual bills based on market offers as of April 2021, 100 GJ per annum and GST inclusive
Regional NSWThe Australian Gas Network (AGN) covers six different pricing zones in regional NSW and Origin Energy is the incumbent retailer. Origin Energy is also the incumbent retailer in the Tamworth gas zone. In
63 These market offers were collected on the 9th of April 2021 and it should be noted that retailers may change their rates at any time. Additional discounts for customers choosing to pay by direct debit are not included in these bill calculations.

Analysis of small business retail energy bills in Australia 31
$0
$500
$1,000
$1,500
$2,000
$2,500
$3,000
$3,500
$4,000
Albury
Cooma
Holbrook
Murray
ValleyTum
ut
Wagga W
agga
Tamworth
$ pe
r ann
um
$0
$500
$1,000
$1,500
$2,000
$2,500
$3,000
$3,500
$4,000
Queanbeyan Capital region Shoalhaven
$ pe
r ann
um
addition to Origin Energy’s market offers, AGL, Energy Australia and Red Energy also have offers in some of these price zones.
Chart 35 shows annual bills for Origin’s market offers (discounts included) in the AGN pricing zones. Origin’s market offers produce annual bills from approximately $2,070 (in Wagga Wagga) to $3,655 (Tamworth) for customers consuming 100 GJ per annum. Energy Australia and AGL also offer gas market offers in the Albury and Murray Valley gas zones. However, both Energy Australia and AGL’s offers produce annual bills that are higher than Origin’s. Red Energy offers gas in the Tumut and Cooma pricing zones, but these gas offers produce significantly higher bills than Origin Energy.
CHART 35 | Annual bills based in Origin’s gas zones. Annual bills based on market offers as of April 2021, 100 GJ per annum and GST inclusive
ActewAGL is the host retailer in three pricing zones: The Capital region, Shoalhaven and Queanbeyan. Energy Australia also has market offers in one of these pricing zones.
Chart 36 shows annual bills for ActewAGL’s offers in these three pricing zones. ActewAGL’s offers produce annual bills from approximately $2,750 (in Capital region) to $3,550 (Shoalhaven) for customers consuming 100 GJ per annum. Energy Australia also offers gas market offers in the Queanbeyan region gas zone. Energy Australia’s offers produce annual bills that are $180 less than ActewAGL’s offer in Queanbeyan.
CHART 36 | Annual bills based in ActewAGL’s gas zones. Annual bills based on market offers as of April 2021, 100 GJ per annum and GST inclusive

32
5,983
5,277
6,769
$5,623$5,125
$6,635
1,000
2,000
3,000
4,000
5,000
6,000
7,000
8,000
Ausgrid Endeavour Essential
Annu
al b
ill ($
)
Apr-20 Oct-20 Apr-21
4.1.3 Changes in energy bills in NSW
The SME Retail Tariff Tracker project collects information about energy offers and rates available to small businesses across Australia every six months (in April and October every year) and this section highlights changes (increases or decreases) to annual bills over that six month period, as well as the trend over the twelve months from April 2020 to April 2021.
In NSW, electricity prices have not had an underlying price reset, such as new network tariffs taking effect, during the last six months. However, some retailers have still changed their offers (rates, discounts or both).
On average, bills have decreased between 2% and 6% (depending on network area) since April 2020. Chart 37 below shows average annual bills as of April 2020, October 2020 and April 2021.
CHART 37 | Average annual electricity bills as of April 2020, October 2020 and April 2021 including guaranteed discounts and pay on time discounts. Annual bills based on market offers, single rate, 20,000 kWh per annum and GST inclusive
In the Ausgrid network, the annual bills for Electricity in a Box, Reamped Energy and Alinta Energy have decreased by 29%, 9% and 8% respectively since October 2020. AGL, Red Energy and 1st Energy’s bills have decreased by 6%. Bright Spark Energy, Origin Energy and Glow Power have also had small price decreases. None of the retailers have increased their prices in the Ausgrid network over the last six months. See Chart 38.
In the Endeavour network, 1st Energy and Reamped Energy have decreased their bills by 5% over the last six months. Red Energy, Alinta Energy, Discover Energy, Bright Spark Energy, Origin Energy and Glow Power have also had small price decreases. As in Ausgrid, none of the retailers have increased their prices in the Ausgrid network over the last six months. See Chart 39. In the Essential network, 1st Energy and Reamped Energy have decreased their bills by around 5%. Alinta Energy, AGL, Red Energy, Locality Planning Energy, Origin Energy, Enova Energy and Glow Power have also had small price decreases. Tango Energy and Bright Spark Energy, on the other hand, have had slight bill increases. See Chart 40.
Charts 38 to 40 below show changes ($) to the retailers’ bills (columns) as well as percentage changes (marker) for each network area.64
64 Note that only retailers that have changed their offers during the period are included in these charts.

Analysis of small business retail energy bills in Australia 33
-30%
-20%
-10%
0%
10%
20%
30%
-$3,000
-$2,000
-$1,000
$0
$1,000
$2,000
$3,000
Electr
icity
in a
Box
ReAm
ped E
nerg
yAl
inta E
nerg
y
AGL
Red
Energ
y1s
t Ene
rgy
Brigh
t Spa
rk P
ower
Origi
n Ene
rgy
Glow
Pow
er
Cha
nge
(%) t
o an
nual
bill
Cha
nge
($) t
o an
nual
bill
$ change % change
-30%
-20%
-10%
0%
10%
20%
30%
-$400
-$300
-$200
-$100
$0
$100
$200
$300
$400
1st E
nerg
yRe
Ampe
d Ene
rgy
Red
Energ
yAl
inta E
nerg
yDi
scov
er E
nerg
yBr
ight S
park
Pow
erOr
igin E
nerg
yGl
ow P
ower
Cha
nge
(%) t
o an
nual
bill
Cha
nge
($) t
o an
nual
bill
$ change % change
-30%
-20%
-10%
0%
10%
20%
30%
-$400
-$300
-$200
-$100
$0
$100
$200
$300
$400
1st E
nerg
yRe
Ampe
d En
ergy
Alint
a En
ergy
AGL
Red
Ener
gy
Loca
lity P
lanni
ng E
nerg
yO
rigin
Ene
rgy
Enov
a En
ergy
Glo
w Po
wer
Tang
o En
ergy
Brig
ht S
park
Pow
er
Cha
nge
(%) t
o an
nual
bill
Cha
nge
($) t
o an
nual
bill
$ change % change
CHART 38 | Ausgrid bill changes: Comparison of October 2020 and April 2021 annual electricity bills including guaranteed discounts and pay on time discounts in the Ausgrid network. Annual bills based on market offers, 20,000 kWh per annum, single rate and GST inclusive
CHART 39 | Endeavour Energy bill changes: Comparison of October 2020 and April 2021 annual electricity bills including guaranteed discounts and pay on time discounts in the Endeavour Energy network. Annual bills based on market offers, 20,000 kWh per annum, single rate and GST inclusive
CHART 40 | Essential Energy bill changes: Comparison of October 2020 and April 2021 annual electricity bills including guaranteed discounts and pay on time discounts in the Essential Energy network. Annual bills based on market offers, 20,000 kWh per annum, single rate and GST inclusive

34
$0
$500
$1,000
$1,500
$2,000
$2,500
$3,000
AGLCovau
EnergyA
ustral
ia
Origin Ener
gy
Red Energ
y
Simply E
nergy
Annu
al b
ills ($
)
Apr-20 Oct-20 Apr-21
$0
$500
$1,000
$1,500
$2,000
$2,500
$3,000
$3,500
$4,000
Albury Cooma Holbrook MurrayValley
Tumut WaggaWagga
Tamworth
Annu
al b
ills ($
)
Apr-20 Oct-20 Apr-21
In relation to gas, two retailers (AGL and Origin) have decreased their gas offer since April 2020 in the Sydney/Jemena pricing zone and one (Energy Australia) has increased. See Chart 41 below.
CHART 41 | Annual gas bills as April 2020, October 2020 and April 2021 including guaranteed discounts and pay on time discounts, in the Jemena/Sydney gas zone. Annual bills based on market offers, 100 GJ per annum and GST inclusive
In terms of the many smaller NSW pricing zones, Origin and ActewAGL are the main retailers (although AGL, Energy Australia and Red Energy do have offers in some of these zones). Between October 2020 and April 2021, Origin’s market offers decreased slightly (less than 1%) in all pricing zones except for Wagga Wagga. See Chart 42.
CHART 42 | Origin Energy’s annual gas bills as of April 2020, October 2020 and April 2021 including guaranteed discounts and pay on time discounts, in the AGN gas zones. Annual bills based on market offers, 100 GJ per annum and GST inclusive
Between October 2020 and April 2021, ActewAGL’s prices remained unchanged in all three pricing zones. See Chart 43.

Analysis of small business retail energy bills in Australia 35
$0
$500
$1,000
$1,500
$2,000
$2,500
$3,000
$3,500
$4,000
Queanbeyan Capital region Shoalhaven
Annu
al b
ills ($
)
Apr-20 Oct-20 Apr-21
8,626
7,913 8,201
7,369 7,369 7,370 7,238 7,239 7,238
4,000
5,000
6,000
7,000
8,000
9,000
10,000
AGL EnergyAustralia Origin Energy
Standing offer Apr 2019 DMO 2019/20 DMO 2020/21
CHART 43 | ActewAGL’s annual gas bills as of April 2020, October 2020 and April 2021 including guaranteed discounts and pay on time discounts. Annual bills based on market offers, 100 GJ per annum and GST inclusive
4.1.4 Impact of the DMO
Since the introduction of the DMO on 1 July 2019, fewer retailers offer conditional pay on time discounts compared to previously. Furthermore, as shown in section 4.1.3 above, the average market offer bill has continued to decrease in all three network areas in April 2021 and none of the retail market offers, inclusive of guaranteed discounts, produce annual bills that are greater than the DMO. See section 4.1.1 above.65
Businesses previously on a standing offer with one of the ‘big 3’ retailers (AGL, Energy Australia and Origin Energy) experienced significant bill reductions since the introduction of the DMO on 1 July 2019. Charts 44 – 46 below compare AGL, Energy Australia and Origin Energy’s standing offers prior to the DMO taking effect to the DMO as of 2019/20 and 2020/21. They show that the bills are currently between $510 and $1,390 less compared to April 2019 (depending on the network and retailer) for businesses using 20,000 kWh per annum. AGL’s bills in Ausgrid and Essential have reduced the most while Origin Energy’s bill reduction in the Endeavour network is more modest.
CHART 44 | The DMO compared to the ‘big 3’ retailers’ standing offers in the Ausgrid network. Annual electricity bills for SMEs using 20,000 kWh (single rate) per annum. GST inclusive
65 Market offer bills including guaranteed discounts compared to the DMO in each network area.
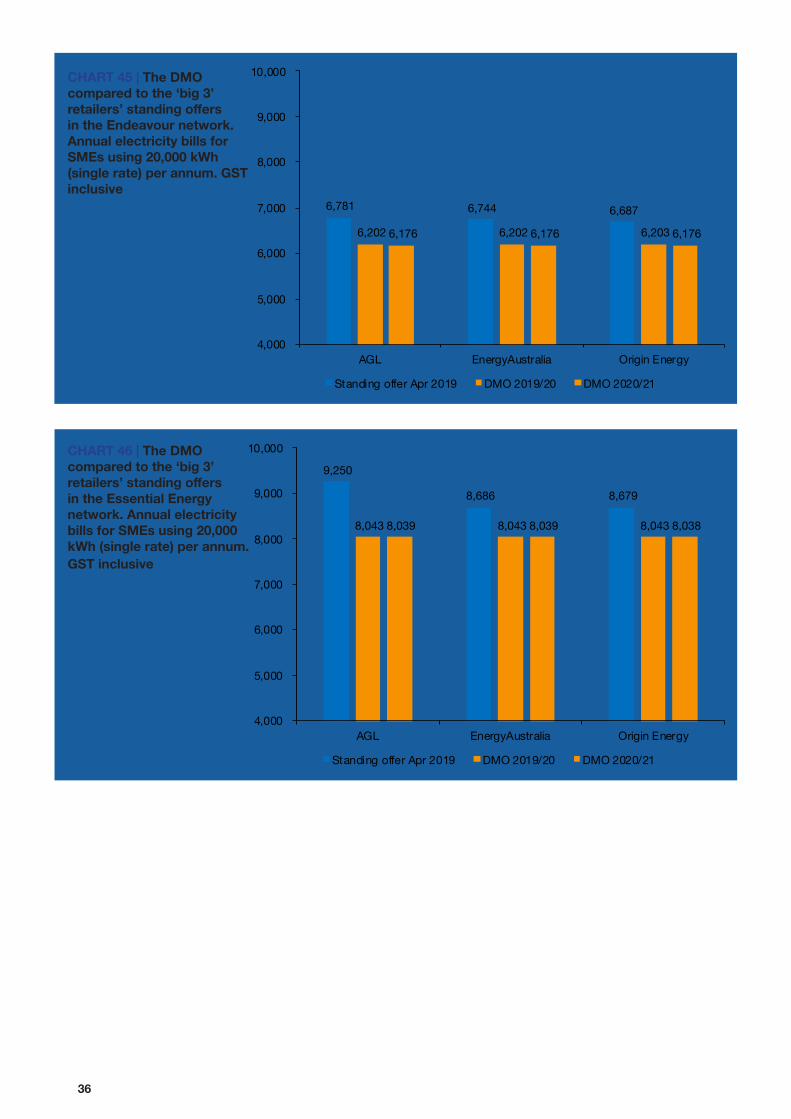
36
6,781 6,744 6,687
6,202 6,202 6,203 6,176 6,176 6,176
4,000
5,000
6,000
7,000
8,000
9,000
10,000
AGL EnergyAustralia Origin Energy
Standing offer Apr 2019 DMO 2019/20 DMO 2020/21
9,250
8,686 8,679
8,043 8,043 8,043 8,039 8,039 8,038
4,000
5,000
6,000
7,000
8,000
9,000
10,000
AGL EnergyAustralia Origin Energy
Standing offer Apr 2019 DMO 2019/20 DMO 2020/21
CHART 45 | The DMO compared to the ‘big 3’ retailers’ standing offers in the Endeavour network. Annual electricity bills for SMEs using 20,000 kWh (single rate) per annum. GST inclusive
CHART 46 | The DMO compared to the ‘big 3’ retailers’ standing offers in the Essential Energy network. Annual electricity bills for SMEs using 20,000 kWh (single rate) per annum. GST inclusive

Analysis of small business retail energy bills in Australia 37
4.2 Victoria
Victorian electricity and gas retail prices have been deregulated since 2009 but on 1 July 2019 the Essential Services Commission’s Victorian Default Offer (VDO) replaced the previously retailer determined electricity standing offers in Victoria. Victoria has five electricity networks and three gas distributors. There are, however, numerous gas pricing zones in Victoria and only the eight largest zones have been included in this analysis.
Victoria’s five electricity networks and eight main gas pricing zones:
Electricity network and incumbent retailer Area
Citipower (Origin) Inner city, inner North and Eastern suburbsPowercor (Origin) Outer Western suburbs and Western Victoria Ausnet Services (Energy Australia) Outer Northern and Eastern suburbs and Eastern VictoriaJemena (AGL) Inner West and North Western SuburbsUnited Energy (AGL) South Eastern suburbs and Mornington Peninsula
Gas zones and incumbent retailer AreaMultinet 1 (Origin) Eastern and South Eastern suburbsMultinet 2 (AGL) Bayside and outer South Eastern suburbsAusnet Services Central 1 (Energy Australia) Outer Western suburbs, Geelong and Bellarine PeninsulaAusnet Services Central 2 (AGL) Western and North Western suburbsAusnet Services West (Energy Australia) Macedon Ranges, Bendigo, Ballarat and Western VictoriaAGN Central 1 (Origin) Frankston, Mornington Peninsula and GippslandAGN Central 2 (Energy Australia) CBD, inner city and North Eastern suburbsAGN North (Origin) Northern and North Eastern Victoria
4.2.1 Victorian electricity bills April 2021
The bill analysis presented in this report is based on SMEs using 20,000 kWh per annum on a single rate tariff. Research published by AEMO66 shows that small businesses, on average (across the NEM network areas), use approximately 20,000 kWh per annum and we use this average instead of network specific consumption profiles to readily enable comparison between network areas and jurisdictions. According to the AEMO report, the network specific average consumption for small businesses is:
• 36,209 kWh/annum in Citipower• 21,674 kWh/annum in Powercor• 24,724 kWh/annum in Ausnet Services• 21,858 kWh/annum in Jemena• 23,629 kWh/annum in United Energy
We also note that the workbooks accompanying this report allow users to nominate their own consumption levels as well as undertaking analysis of different tariff types (2-rate tariffs, time of use tariffs etc.). The workbooks are available at: https://energyconsumersaustralia.com.au/publications/our-research.
The price-spreadThe typical annual bill for SMEs consuming 20,000 kWh per annum (single rate) is between $4,735 and $6,605 (depending on network area).67 Chart 47 shows annual bills for SMEs consuming 20,000 kWh per annum (single rate) for 21 retailers across the five Victorian distribution networks.68 It shows that bills are
66 Jacobs Australia, Retail electricity price history and project trends, AEMO, 21 September 201767 See appendix A for a list of retail offers included in this analysis. Many retailers have more than one market offer and the rates, conditions, size of discounts as well as discount types (e.g. guaranteed or conditional) may vary between their offers.68 There are less available offers (20) in Jemena and United Energy.

38
$3,000
$4,000
$5,000
$6,000
$7,000
$8,000
$9,000
1 2 3 4 5 6 7 8 9 10 11 12 13 14 15 16 17 18 19 20 21
$ pe
r ann
um
Ausnet Jemena Powercor United Citipower
highest in the Ausnet Services network and lowest in Citipower and that the offers in Citipower, Jemena, Powercor and United Energy network areas are quite similar. The maximum price-spread is currently greatest in the United Energy network where the difference between the lowest and the highest annual bill is approximately $1,730. Compared to six months ago (October 2020), the maximum price-spread has decreased in all network areas. In Ausnet Services, where the decrease is greatest, the maximum price-spread is $1,080 less than six months ago. It decreased by $665 in the Powercor network area whereas it has decreased by $550 in United Energy, $340 in the Jemena and $325 in Citipower network.
CHART 47 | The price-spread for each of the five Victorian distribution networks. Annual bills based on market offers as of April 2021 (including guaranteed discounts and pay on time discounts), 20,000 kWh per annum, single rate and GST inclusive
Figures 5 - 9 below rank the retail offers from lowest to highest annual electricity bills in each of the five network areas.69 The lowest annual retail bill in each network area has changed since October 2020. In United Energy, the best offer, as of April 2021, produces an annual bill that is $605 less than the best offer six months ago while in Ausnet Services it is approximately $35 more than the best offer six months ago.
69 These market offers were collected on the 18th of April 2021 and it should be noted that retailers may change their rates at any time. Additional discounts for customers choosing to pay by direct debit are not included in these bill calculations.

Analysis of small business retail energy bills in Australia 39
FIGURE 6 | Lowest to highest annual electricity bills (incl GST) for market offers in Victoria’s Powercor network (April 2021) including discounts and pay on time discounts - SMEs consuming 20,000kWh per annum (single rate)
FIGURE 7 | Lowest to highest annual electricity bills (incl GST) for market offers in Victoria’s Ausnet Services network (April 2021), including discounts and pay on time discounts - SMEs consuming 20,000kWh per annum (single rate)
FIGURE 5 | Lowest to highest annual electricity bills (incl GST) for market offers in Victoria’s Citipower network (April 2021) including discounts and pay on time discounts - SMEs consuming 20,000kWh per annum (single rate)
$4,125Powerclub
Next Business Energy $4,241
$4,400
Simply Energy $4,437
Tango Energy
$4,4861st Energy
$4,683
$4,683
Alinta Energy
$4,684
Powerdirect
$4,716
$4,781
Energy Locals
$4,861
$4,864
CovaU $4,873
$4,881
Origin Energy $4,923
$4,930GloBird Energy
$5,044Blue NRG
$5,181Diamond Energy
Sumo Power $5,368
$4,340
AGL
EnergyAustralia
Momentum Energy
Lumo Energy
Red Energy
Q Energy
$4,930Powershop
$4,388Powerclub
Next Business Energy $4,461
$4,510Tango Energy
Simply Energy $4,583
$4,6351st Energy
$4,643Q Energy
Alinta Energy $4,814
$4,838EnergyAustralia
$4,839AGL
$4,910Energy Locals
Powerdirect $4,939
CovaU $4,983
$5,021Momentum Energy
$5,040Red Energy
$5,074Lumo Energy
Origin Energy $5,082
$5,093GloBird Energy
$5,093Powershop
$5,194Blue NRG
$5,372Diamond Energy
Sumo Power $5,386
Next Business Energy $5,940
$6,025Powerclub
$6,146Tango Energy
$6,173Lumo Energy
Simply Energy $6,196
$6,2391st Energy
$6,540AGL
$6,542EnergyAustralia
$6,573Q Energy
$6,622Energy Locals
$6,644Blue NRG
Powerdirect $6,678
Alinta Energy $6,703
$6,796Red Energy
$6,799Momentum Energy
CovaU $6,812
$6,874Powershop
Origin Energy $6,878
$6,886GloBird Energy
$7,270Diamond Energy
Sumo Power $7,376

40
FIGURE 8 | Lowest to highest annual electricity bills (incl GST) for market offers in Victoria’s Jemena network (April 2021) including discounts and pay on time discounts - SMEs consuming 20,000kWh per annum (single rate)
FIGURE 9 | Lowest to highest annual electricity bills (incl GST) for market offers in Victoria’s United Energy network (April 2021) including discounts and pay on time discounts - SMEs consuming 20,000kWh per annum (single rate)
$4,470Powerclub
Origin Energy $5,240
Next Business Energy $4,588
$4,720Tango Energy
Simply Energy $4,731
$4,748Q Energy
$4,7751st Energy
$4,994EnergyAustralia
$4,994AGL
$5,033Energy Locals
Powerdirect $5,097
CovaU $5,143
$5,184Momentum Energy
$5,200Red Energy
Alinta Energy $5,256
$5,256GloBird Energy
$5,256Powershop
$5,322Lumo Energy
$5,634Diamond Energy
Sumo Power $5,834
$4,107Powerclub
$4,4861st Energy
Next Business Energy $4,556
$4,698Q Energy
$4,720Tango Energy
Simply Energy $4,740
$5,004AGL
$5,005EnergyAustralia
$5,015Energy Locals
Powerdirect $5,111
CovaU $5,155
$5,195Red Energy
$5,200Momentum Energy
Alinta Energy $5,230
Origin Energy $5,247
$5,269GloBird Energy
$5,269Powershop
$5,293Lumo Energy
$5,585Diamond Energy
Sumo Power $5,840
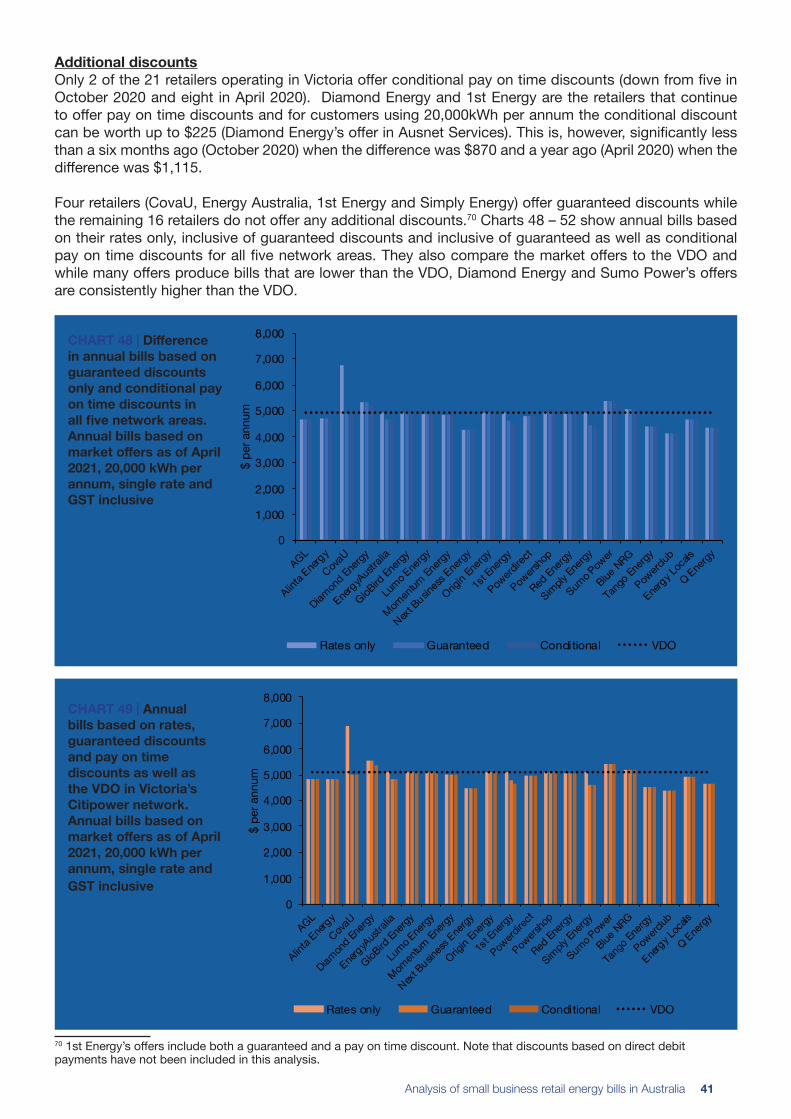
Analysis of small business retail energy bills in Australia 41
0
1,000
2,000
3,000
4,000
5,000
6,000
7,000
8,000
AGL
Alinta E
nergy
CovaU
Diamon
d Ene
rgy
EnergyA
ustral
ia
GloBird
Energ
y
Lumo E
nergy
Momen
tum En
ergy
Next Busin
ess Ene
rgy
Origin
Energ
y
1st E
nergy
Powerd
irect
Powers
hop
Red En
ergy
Simply
Energ
y
Sumo P
ower
Blue NRG
Tang
o Ene
rgy
Powerc
lub
Energy L
ocals
Q Energy
$ pe
r ann
um
Rates only Guaranteed Conditional VDO
Additional discountsOnly 2 of the 21 retailers operating in Victoria offer conditional pay on time discounts (down from five in October 2020 and eight in April 2020). Diamond Energy and 1st Energy are the retailers that continue to offer pay on time discounts and for customers using 20,000kWh per annum the conditional discount can be worth up to $225 (Diamond Energy’s offer in Ausnet Services). This is, however, significantly less than a six months ago (October 2020) when the difference was $870 and a year ago (April 2020) when the difference was $1,115.
Four retailers (CovaU, Energy Australia, 1st Energy and Simply Energy) offer guaranteed discounts while the remaining 16 retailers do not offer any additional discounts.70 Charts 48 – 52 show annual bills based on their rates only, inclusive of guaranteed discounts and inclusive of guaranteed as well as conditional pay on time discounts for all five network areas. They also compare the market offers to the VDO and while many offers produce bills that are lower than the VDO, Diamond Energy and Sumo Power’s offers are consistently higher than the VDO.
CHART 48 | Difference in annual bills based on guaranteed discounts only and conditional pay on time discounts in all five network areas. Annual bills based on market offers as of April 2021, 20,000 kWh per annum, single rate and GST inclusive
CHART 49 | Annual bills based on rates, guaranteed discounts and pay on time discounts as well as the VDO in Victoria’s Citipower network. Annual bills based on market offers as of April 2021, 20,000 kWh per annum, single rate and GST inclusive
70 1st Energy’s offers include both a guaranteed and a pay on time discount. Note that discounts based on direct debit payments have not been included in this analysis.

42
0
2,000
4,000
6,000
8,000
10,000
12,000
AGL
Alinta E
nergy
CovaU
Diamon
d Ene
rgy
EnergyA
ustral
ia
GloBird
Energ
y
Lumo E
nergy
Momen
tum En
ergy
Next Busin
ess Ene
rgy
Origin
Energ
y
1st E
nergy
Powerd
irect
Powers
hop
Red En
ergy
Simply
Energ
y
Sumo P
ower
Blue NRG
Tang
o Ene
rgy
Powerc
lub
Energy L
ocals
Q Energy
$ pe
r ann
um
Rates only Guaranteed Conditional VDO
0
1,000
2,000
3,000
4,000
5,000
6,000
7,000
8,000
AGL
Alinta E
nergy
CovaU
Diamon
d Ene
rgy
EnergyA
ustral
ia
GloBird
Energ
y
Lumo E
nergy
Momen
tum En
ergy
Next Busin
ess Ene
rgy
Origin
Energ
y
1st E
nergy
Powerd
irect
Powers
hop
Red En
ergy
Simply
Energ
y
Sumo P
ower
Tang
o Ene
rgy
Powerc
lub
Energy L
ocals
Q Energy
$ pe
r ann
um
Rates only Guaranteed Conditional VDO
CHART 50 | Annual bills based on rates, guaranteed discounts and pay on time discounts as well as the VDO in Victoria’s Powercor network. Annual bills based on market offers as of April 2021, 20,000 kWh per annum, single rate and GST inclusive
CHART 51 | Annual bills based on rates, guaranteed discounts and pay on time discounts as well as the VDO in Victoria’s Ausnet Services network. Annual bills based on market offers as of April 2021, 20,000 kWh per annum, single rate and GST inclusive
CHART 52 | Annual bills based on rates, guaranteed discounts and pay on time discounts as well as the VDO in Victoria’s Jemena network. Annual bills based on market offers as of April 2021, 20,000 kWh per annum, single rate and GST inclusive
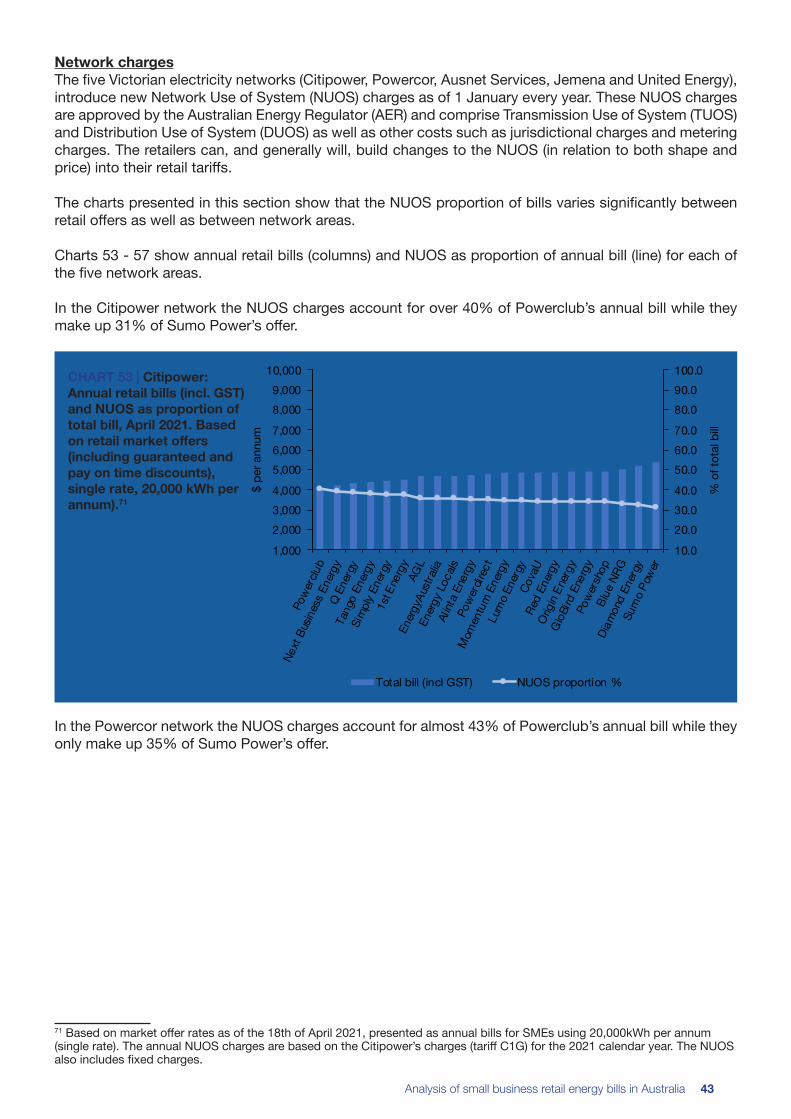
Analysis of small business retail energy bills in Australia 43
10.0
20.030.040.0
50.060.070.0
80.090.0100.0
1,000
2,0003,0004,000
5,0006,0007,000
8,0009,000
10,000
Powe
rclub
Next
Busin
ess E
nerg
yQ
Ener
gyTa
ngo
Energ
ySi
mply
Ener
gy1s
t Ene
rgy
AGL
Energ
yAus
tralia
Energ
y Loc
alsAl
inta E
nerg
yPo
werd
irect
Mom
entu
m En
ergy
Lum
o Ene
rgy
Cova
URe
d En
ergy
Origi
n Ene
rgy
GloB
ird E
nerg
yPo
wers
hop
Blue
NRG
Diam
ond
Ener
gySu
mo P
ower
% o
f tot
al b
ill
$ pe
r ann
um
Total bill (incl GST) NUOS proportion %
Network chargesThe five Victorian electricity networks (Citipower, Powercor, Ausnet Services, Jemena and United Energy), introduce new Network Use of System (NUOS) charges as of 1 January every year. These NUOS charges are approved by the Australian Energy Regulator (AER) and comprise Transmission Use of System (TUOS) and Distribution Use of System (DUOS) as well as other costs such as jurisdictional charges and metering charges. The retailers can, and generally will, build changes to the NUOS (in relation to both shape and price) into their retail tariffs.
The charts presented in this section show that the NUOS proportion of bills varies significantly between retail offers as well as between network areas.
Charts 53 - 57 show annual retail bills (columns) and NUOS as proportion of annual bill (line) for each of the five network areas. In the Citipower network the NUOS charges account for over 40% of Powerclub’s annual bill while they make up 31% of Sumo Power’s offer.
CHART 53 | Citipower: Annual retail bills (incl. GST) and NUOS as proportion of total bill, April 2021. Based on retail market offers (including guaranteed and pay on time discounts), single rate, 20,000 kWh per annum).71
In the Powercor network the NUOS charges account for almost 43% of Powerclub’s annual bill while they only make up 35% of Sumo Power’s offer.
71 Based on market offer rates as of the 18th of April 2021, presented as annual bills for SMEs using 20,000kWh per annum (single rate). The annual NUOS charges are based on the Citipower’s charges (tariff C1G) for the 2021 calendar year. The NUOS also includes fixed charges.

44
10.0
20.030.040.0
50.060.070.0
80.090.0100.0
1,000
2,0003,0004,000
5,0006,0007,000
8,0009,000
10,000
Pow
erclu
b
Next
Bus
ines
s En
ergy
Tang
o En
ergy
Sim
ply
Ener
gy1s
t Ene
rgy
Q E
nerg
yAl
inta
Ener
gyEn
ergy
Aust
ralia
AGL
Ener
gy L
ocals
Pow
erdi
rect
Cova
U
Mom
entu
m E
nerg
yRe
d En
ergy
Lum
o En
ergy
Orig
in E
nerg
yG
loBi
rd E
nerg
yPo
wer
shop
Blue
NRG
Diam
ond
Ener
gySu
mo
Pow
er
% o
f tot
al b
ill
$ pe
r ann
um
Total bill (incl GST) NUOS proportion %
10.020.030.0
40.050.060.0
70.080.090.0
100.0
1,0002,0003,000
4,0005,0006,000
7,0008,0009,000
10,000
Next
Busin
ess E
nerg
yPo
werc
lubTa
ngo
Energ
yLu
mo E
nerg
ySi
mply
Ener
gy1s
t Ene
rgy
AGL
Energ
yAus
tralia
Q En
ergy
Energ
y Loc
alsBl
ue N
RGPo
werd
irect
Alint
a Ene
rgy
Red
Energ
y
Mom
entu
m En
ergy
Cova
UPo
wers
hop
Origi
n Ene
rgy
GloB
ird E
nerg
yDi
amon
d En
ergy
Sum
o Pow
er
% o
f tot
al b
ill
$ pe
r ann
um
Total bill (incl GST) NUOS proportion %
CHART 54 | Powercor: Annual retail bills (incl. GST) and NUOS as proportion of total bill, April 2021. Based on retail market offers (including guaranteed and pay on time discounts), single rate, 20,000 kWh per annum.72
In the Ausnet Services network where the NUOS charges are higher, the NUOS charges account for almost 41.5% of Next Business Energy’s annual bill while they only make up 33% of Sumo Power’s offer.
CHART 55 | Ausnet Services: Annual retail bills (incl. GST) and NUOS as proportion of total bill, April 2021. Based on retail market offers (including guaranteed and pay on time discounts), single rate, 20,000 kWh per annum73
In the Jemena network the NUOS charges account for 44.5% of Powerclub’s annual bills while they only make up 34% of Sumo Power’s offer.
72 Based on market offer rates as of the 18th of April 2021, presented as annual bills for SMEs using 20,000kWh per annum (single rate). The annual NUOS charges are based on the Powercor’s charges (tariff ND1) for the 2021 calendar year. The NUOS also includes fixed charges. 73 Based on market offer rates as of the 18th of April 2021, presented as annual bills for SMEs using 20,000kWh per annum (single rate). The annual NUOS charges are based on the Ausnet Services’ charges (tariff NEE 12) for the 2021 calendar year. The NUOS also includes fixed charges.

Analysis of small business retail energy bills in Australia 45
10.0
20.030.040.0
50.060.070.0
80.090.0100.0
1,000
2,0003,0004,000
5,0006,0007,000
8,0009,000
10,000
Powe
rclub
Next
Busin
ess E
nerg
yTa
ngo
Energ
ySi
mply
Ener
gyQ
Ener
gy1s
t Ene
rgy
Energ
yAus
tralia
AGL
Energ
y Loc
alsPo
werd
irect
Cova
U
Mom
entu
m En
ergy
Red
Energ
yOr
igin E
nerg
yAl
inta E
nerg
yGl
oBird
Ene
rgy
Powe
rsho
pLu
mo E
nerg
yDi
amon
d En
ergy
Sum
o Pow
er
% o
f tot
al b
ill
$ pe
r ann
um
Total bill (incl GST) NUOS proportion %
10.0
20.0
30.0
40.0
50.0
60.0
70.0
80.0
90.0
100.0
1,000
2,000
3,000
4,000
5,000
6,000
7,000
8,000
9,000
10,000
Powerclub
1st Ene
rgy
Next Busi
ness Energ
y
Q Energy
Tango
Energy
Simply E
nergyAGL
EnergyA
ustral
ia
Energy L
ocals
Powerdire
ct
CovaU
Red Energ
y
Momen
tum Energy
Alinta E
nergy
Origin Ener
gy
GloBird Ene
rgy
Powersho
p
Lumo E
nergy
Diamond Energ
y
Sumo Pow
er%
of t
otal
bill
$ pe
r ann
um
Total bill (incl GST) NUOS proportion %
CHART 56 | Jemena: Annual retail bills (incl. GST) and NUOS as proportion of total bill, April 2021. Based on retail market offers (including guaranteed and pay on time discounts), single rate, 20,000 kWh per annum74
In the United Energy network, the NUOS charges account for 46.5% of Powerclub’s offer while they only make up 33% of Sumo Power’s offer.
CHART 57 | United Energy: Annual retail bills (incl. GST) and NUOS as proportion of total bill, April 2021. Based on retail market offers (including guaranteed and pay on time discounts), single rate, 20,000 kWh per annum75
4.2.2 Victorian gas bills April 2021
There are eight main pricing zones in Victoria, two in the Multinet network, three in Ausnet Services and three in Australian Gas Networks (AGN).
To calculate annual gas bills we have assumed an annual consumption of 100 GJ per annum and a flat
74 Based on market offer rates as of the 18th of April, presented as annual bills for SMEs using 20,000kWh per annum (single rate). The annual NUOS charges are based on the Jemena’s charges (tariff A200) for the 2021 calendar year. The NUOS also includes fixed charges. 75 Based on market offer rates as of the 18th of April 2021, presented as annual bills for SMEs using 20,000kWh per annum (single rate). The annual NUOS charges are based on the United Energy’s charges (tariff LVM 1R) for the 2021 calendar year. The NUOS also includes fixed charges.

46
$100
$200
$300
$400
$500
$600
$700
$800
$1,000
$1,200
$1,400
$1,600
$1,800
$2,000
$2,200
$2,400
Multi 1
Multi 2
Ausnet
Centra
l 1
Ausnet
Centra
l 2
Ausnet
West
AGN Central 1
AGN Central 2
AGN North
Max
pric
e sp
read
($)
Aver
age
annu
al b
ill ($
)
Avg. bill Max Price Spread
consumption over the year (25 GJ per quarter or 16.66 GJ per bi-monthly bill).76 Small businesses using gas for heating purposes are unlikely to have a flat consumption profile and may use more at peak rates (winter months) than what has been calculated here. Furthermore, as Victorian small businesses typically have a higher gas consumption compared to SMEs in other jurisdictions, a 100 GJ annual consumption is a relatively low gas consumption in Victoria.
The price-spreadThe typical annual market offer bill for SMEs consuming 100 GJ per annum ranges from $1,995 (including discounts) in the Ausnet Central pricing zones to $2,275 in the AGN/Envestra pricing zones. The maximum price-spread is highest in the Ausnet Central pricing zones where the difference between the highest and lowest annual bill is approximately $530 per annum. The price-spread is lowest in the Ausnet West pricing zone (around $185). Compared to six months ago (October 2020), the maximum price-spread has decreased in six of the pricing zones and increased in two. The average maximum price-spread for all eight pricing zones has decreased by $115.
Chart 58 shows the average gas market offer bill for the eight main pricing zone as well as the maximum price-spread for each area.
CHART 58 | Average annual bills and price-spread in the Victorian gas pricing zones. Annual bills based on market offers as of April 2021 (including guaranteed discounts and pay on time discounts), 100 GJ per annum and GST inclusive
Chart 59 shows the retailers’ gas market offer bills in the two Multinet pricing zones.
76 See appendix A for a list of retail offers included in this analysis. Many retailers have more than one market offer and the rates, conditions, size of discounts as well as discount types (e.g. guaranteed or conditional) may vary between their offers.

Analysis of small business retail energy bills in Australia 47
$1,000
$1,200
$1,400
$1,600
$1,800
$2,000
$2,200
$2,400
$2,600
AGLCovau
EnergyA
ustral
ia
Lumo E
nergy
Momen
tum Energy
Origin Ener
gy
Simply E
nergy
Powersho
p
Red Energ
y$
per a
nnum
Mult i 1 Multi 2
FIGURE 10 | Lowest to highest annual gas bills (incl GST) for market offers in the Multinet 1 gas zone (April 2021). Bills including guaranteed discounts and pay on time discounts - SMEs consuming 100 GJ per annum
FIGURE 11 | Lowest to highest annual gas bills (incl GST) for market offers in the Multinet 2 gas zone (April 2021). Bills including guaranteed discounts and pay on time discounts - SMEs consuming 100 GJ per annum
$2,044Simply Energy
$2,100Powershop
$2,111Lumo Energy
$2,136CovaU
$2,149Red Energy
$2,177Origin Energy
$2,239AGL
$2,267EnergyAustralia
$2,446Momentum Energy
$2,017AGL
$2,044Simply Energy
$2,100Powershop
$2,114 Lumo Energy
$2,136CovaU
$2,149 Red Energy
$2,177Origin Energy
$2,287EnergyAustralia
$2,446Momentum Energy
CHART 59 | Annual gas bills in Victoria’s Multinet pricing zones. Annual bills based on market offers as of April 2021 (including guaranteed discounts and pay on time discounts), 100 GJ per annum and GST inclusive
Figures 10 - 11 below rank the retail offers from lowest to highest annual gas bills in the two Multinet pricing zones.77 The lowest annual retail bill in Multinet 1’s pricing zone remained unchanged between October 2020 and April 2021, whereas it decreased by approximately $25 in Multinet 2’s pricing zone.
Chart 60 shows the retailers’ gas market offer bills in the three Ausnet Services pricing zones.
77 These market offers were collected on the 18th of April 2021 and it should be noted that retailers may change their rates at any time. Additional discounts for customers choosing to pay by direct debit are not included in these bill calculations.

48
$1,000
$1,200
$1,400
$1,600
$1,800
$2,000
$2,200
$2,400
$2,600
AGLCovau
EnergyA
ustral
ia
Lumo E
nergy
Momen
tum Energy
Origin Ener
gy
Simply E
nergy
Powersho
p
Red Energ
y
$ pe
r ann
um
Ausnet Central 1 Ausnet Central 2 Ausnet West
FIGURE 12 | Lowest to highest annual gas bills (incl GST) for market offers in the Ausnet Services Central 1 gas zone (April 2021). Bills including guaranteed discounts and pay on time discounts - SMEs consuming 100 GJ per annum
FIGURE 13 | Lowest to highest annual gas bills (incl GST) for market offers in the Ausnet Services Central 2 gas zone (April 2021). Bills including guaranteed discounts and pay on time discounts - SMEs consuming 100 GJ per annum
FIGURE 14 | Lowest to highest annual gas bills (incl GST) for market offers in the Ausnet Services West gas zone (April 2021). Bills including guaranteed discounts and pay on time discounts - SMEs consuming 100 GJ per annum
$1,789Simply Energy
$1,923
$1,952Origin Energy
$1,960
$2,021
Powershop
$2,118EnergyAustralia
$2,207
$2,261
Momentum Energy
Lumo Energy
Red Energy
AGL
$1,789Simply Energy
$1,923Lumo Energy
$1,960Powershop
$1,796Simply Energy
$2,001Lumo Energy
$2,247
$2,219
$2,032Origin Energy
$2,185
$2,371
AGL
Red Energy
EnergyAustralia
Momentum Energy
$1,941
$2,128
AGL
$1,952Origin Energy
$2,207
$2,261
Momentum Energy
Red Energy
EnergyAustralia
$1,729CovaU $1,729CovaU $1,735CovaU
$1,983Powershop
CHART 60 | Annual gas bills in Victoria’s Ausnet Services pricing zones. Annual bills based on market offers as of April 2021 (including guaranteed discounts and pay on time discounts), 100 GJ per annum and GST inclusive
Figures 12 - 14 below rank the retail offers from lowest to highest annual gas bills in the three Ausnet Services pricing zones.78 The lowest annual retail bills in Ausnet Services’ pricing zones have decreased since October 2020. On average, across all three pricing zones, the best offers, as of April 2021, produce an annual bill that is $60 less than the best offers six months ago.
78 These market offers were collected on the 18th of April 2021 and it should be noted that retailers may change their rates at any time. Additional discounts for customers choosing to pay by direct debit are not included in these bill calculations.

Analysis of small business retail energy bills in Australia 49
$1,000
$1,200
$1,400
$1,600
$1,800
$2,000
$2,200
$2,400
$2,600
AGLCovau
EnergyA
ustral
ia
Lumo E
nergy
Momen
tum Energy
Origin Ener
gy
Simply E
nergy
Powersho
p
Red Energ
y
$ pe
r ann
um
AGN Central 1 AGN Central 2 AGN North
FIGURE 15 | Lowest to highest annual gas bills (incl GST) for market offers in the AGN Central 1 gas zone (April 2021). Bills including guaranteed discounts and pay on time discounts - SMEs consuming 100 GJ per annum.
FIGURE 16 | Lowest to highest annual gas bills (incl GST) for market offers in the AGN Central 2 gas zone (April 2021). Bills including guaranteed discounts and pay on time discounts - SMEs consuming 100 GJ per annum.
FIGURE 17 | Lowest to highest annual gas bills (incl GST) for market offers in the AGN North gas zone (April 2021). Bills including guaranteed discounts and pay on time discounts - SMEs consuming 100 GJ per annum.
$2,107Simply Energy
$2,212
$2,247
$2,340
$2,269
$2,468Momentum Energy
EnergyAustralia
Lumo Energy
Red Energy
Origin Energy
AGL $2,245
$2,286Powershop
$2,107Simply Energy
$2,212
$2,247
$2,372
$2,269
$2,468Momentum Energy
EnergyAustralia
Lumo Energy
Red Energy
Origin Energy
AGL $2,245
$2,286Powershop
$2,267CovaU $2,267CovaU
$2,029Lumo Energy
$2,051Simply Energy
$2,207CovaU
AGL $2,227
$2,236Powershop
$2,269Origin Energy
$2,269Red Energy
$2,337
$2,424Momentum Energy
EnergyAustralia
Chart 61 shows the retailers’ gas market offer bills in the three AGN pricing zones.
CHART 61 | Annual gas bills in Victoria’s AGN pricing zones. Annual bills based on market offers as of April 2021 (including guaranteed discounts and pay on time discounts), 100 GJ per annum and GST inclusive
Figures 15 - 17 below rank the retail offers from lowest to highest annual gas bills in the three AGN pricing zones.79 The lowest annual retail bills in the AGN Central pricing zones have remained unchanged since October 2020, whereas it decreased by approximately $20 in AGN North’s pricing zone.
79 These market offers were collected on the 18th of April 2021 and it should be noted that retailers may change their rates at any time. Additional discounts for customers choosing to pay by direct debit are not included in these bill calculations.
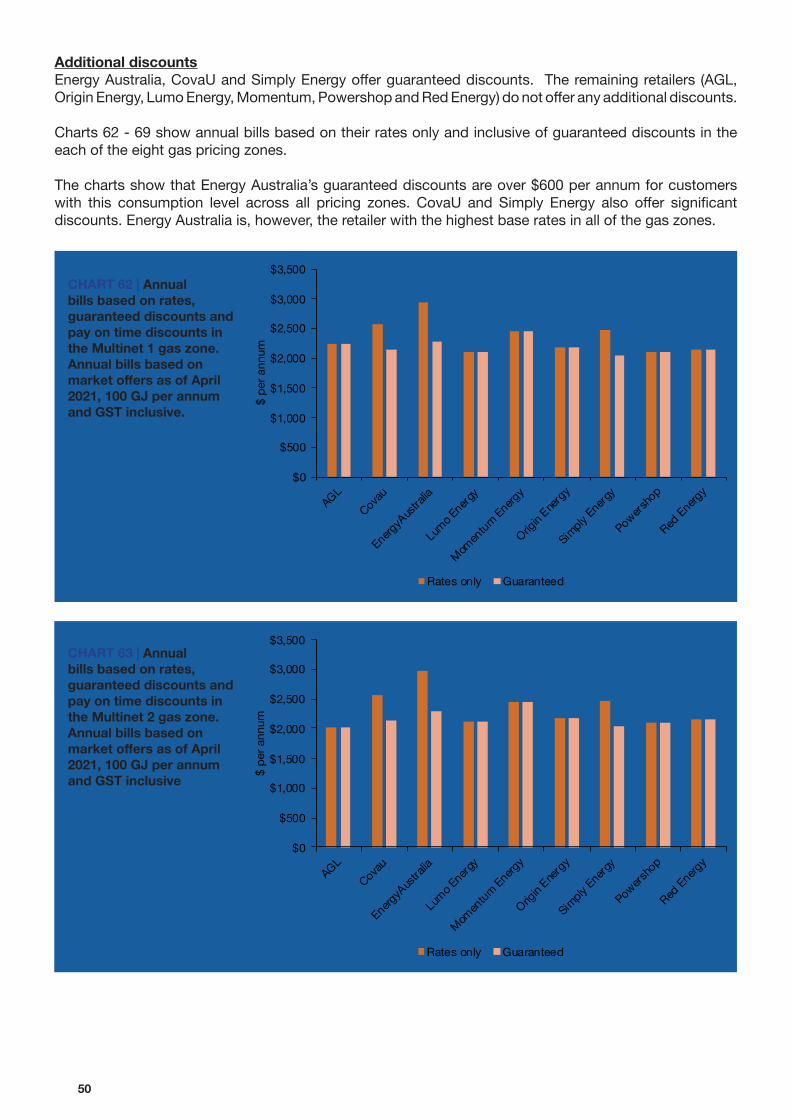
50
$0
$500
$1,000
$1,500
$2,000
$2,500
$3,000
$3,500
AGLCovau
EnergyA
ustral
ia
Lumo E
nergy
Momen
tum Energy
Origin Ener
gy
Simply E
nergy
Powersho
p
Red Energ
y
$ pe
r ann
um
Rates only Guaranteed
$0
$500
$1,000
$1,500
$2,000
$2,500
$3,000
$3,500
AGLCovau
EnergyA
ustral
ia
Lumo E
nergy
Momen
tum Energy
Origin Ener
gy
Simply E
nergy
Powersho
p
Red Energ
y
$ pe
r ann
um
Rates only Guaranteed
Additional discountsEnergy Australia, CovaU and Simply Energy offer guaranteed discounts. The remaining retailers (AGL, Origin Energy, Lumo Energy, Momentum, Powershop and Red Energy) do not offer any additional discounts.
Charts 62 - 69 show annual bills based on their rates only and inclusive of guaranteed discounts in the each of the eight gas pricing zones.
The charts show that Energy Australia’s guaranteed discounts are over $600 per annum for customers with this consumption level across all pricing zones. CovaU and Simply Energy also offer significant discounts. Energy Australia is, however, the retailer with the highest base rates in all of the gas zones.
CHART 62 | Annual bills based on rates, guaranteed discounts and pay on time discounts in the Multinet 1 gas zone. Annual bills based on market offers as of April 2021, 100 GJ per annum and GST inclusive.
CHART 63 | Annual bills based on rates, guaranteed discounts and pay on time discounts in the Multinet 2 gas zone. Annual bills based on market offers as of April 2021, 100 GJ per annum and GST inclusive
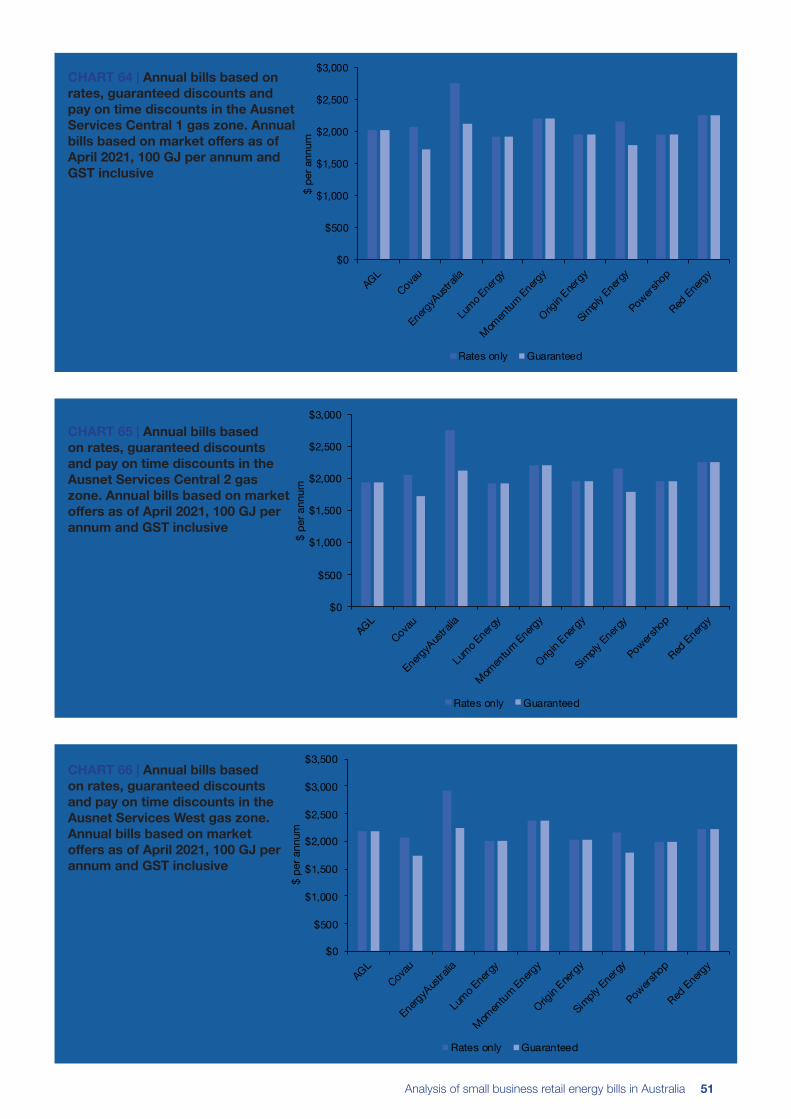
Analysis of small business retail energy bills in Australia 51
$0
$500
$1,000
$1,500
$2,000
$2,500
$3,000
AGLCova
u
EnergyA
ustra
lia
Lumo E
nergy
Momen
tum Energy
Origin Ene
rgy
Simply
Energy
Powersho
p
Red Energ
y
$ pe
r ann
um
Rates only Guaranteed
$0
$500
$1,000
$1,500
$2,000
$2,500
$3,000
AGLCovau
EnergyA
ustral
ia
Lumo E
nergy
Momen
tum Energy
Origin Ener
gy
Simply E
nergy
Powersho
p
Red Energ
y
$ pe
r ann
um
Rates only Guaranteed
$0
$500
$1,000
$1,500
$2,000
$2,500
$3,000
$3,500
AGLCovau
EnergyA
ustral
ia
Lumo E
nergy
Momen
tum Energy
Origin Ener
gy
Simply E
nergy
Powersho
p
Red Energ
y
$ pe
r ann
um
Rates only Guaranteed
CHART 64 | Annual bills based on rates, guaranteed discounts and pay on time discounts in the Ausnet Services Central 1 gas zone. Annual bills based on market offers as of April 2021, 100 GJ per annum and GST inclusive
CHART 65 | Annual bills based on rates, guaranteed discounts and pay on time discounts in the Ausnet Services Central 2 gas zone. Annual bills based on market offers as of April 2021, 100 GJ per annum and GST inclusive
CHART 66 | Annual bills based on rates, guaranteed discounts and pay on time discounts in the Ausnet Services West gas zone. Annual bills based on market offers as of April 2021, 100 GJ per annum and GST inclusive
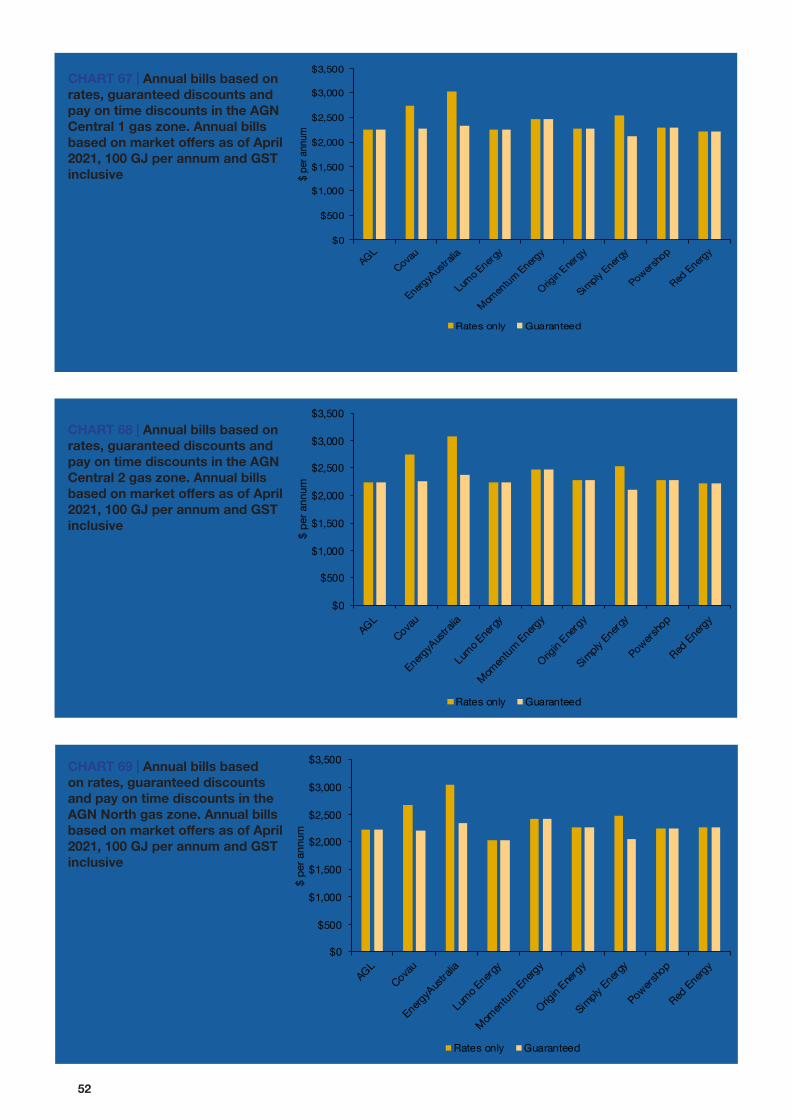
52
$0
$500
$1,000
$1,500
$2,000
$2,500
$3,000
$3,500
AGLCovau
EnergyA
ustral
ia
Lumo E
nergy
Momen
tum Energy
Origin Ener
gy
Simply E
nergy
Powersho
p
Red Energ
y
$ pe
r ann
um
Rates only Guaranteed
$0
$500
$1,000
$1,500
$2,000
$2,500
$3,000
$3,500
AGLCovau
EnergyA
ustral
ia
Lumo E
nergy
Momen
tum Energy
Origin Ener
gy
Simply E
nergy
Powersho
p
Red Energ
y
$ pe
r ann
um
Rates only Guaranteed
$0
$500
$1,000
$1,500
$2,000
$2,500
$3,000
$3,500
AGLCovau
EnergyA
ustral
ia
Lumo E
nergy
Momen
tum Energy
Origin Ener
gy
Simply E
nergy
Powersho
p
Red Energ
y
$ pe
r ann
um
Rates only Guaranteed
CHART 67 | Annual bills based on rates, guaranteed discounts and pay on time discounts in the AGN Central 1 gas zone. Annual bills based on market offers as of April 2021, 100 GJ per annum and GST inclusive
CHART 68 | Annual bills based on rates, guaranteed discounts and pay on time discounts in the AGN Central 2 gas zone. Annual bills based on market offers as of April 2021, 100 GJ per annum and GST inclusive
CHART 69 | Annual bills based on rates, guaranteed discounts and pay on time discounts in the AGN North gas zone. Annual bills based on market offers as of April 2021, 100 GJ per annum and GST inclusive

Analysis of small business retail energy bills in Australia 53
5,55
2
5,60
1
7,50
8
5,94
3
5,97
4
$5,4
51
$5,4
59
$7,3
36
$5,9
02
$5,9
17
$4,7
35
$4,9
00
$6,6
05
$5,0
74
$5,0
36
3,000
3,500
4,000
4,500
5,000
5,500
6,000
6,500
7,000
7,500
8,000
Citipower Powercor Ausnet Jemena United
Ann
ual b
ills
($)
Apr-20 Oct-20 Apr-21
4.2.3 Changes in energy bills in Victoria
The SME Retail Tariff Tracker project collects information about energy offers and rates available to small businesses across Australia every six months (in April and October every year) and this section highlights changes (increases or decreases) to annual bills over that six month period, as well as the trend over the twelve months to April 2021.
In Victoria, new network tariffs took effect in January 2021 meaning that the electricity retail prices have been affected by an underlying price reset in this six-month period. Most of the retailers have thus changed their offers (rates, discounts or both).
From October 2020 to April 2021, average retail electricity bills for SMEs consuming 20,000 kWh per annum (single rate) decreased by just under 10% in the Powercor and Ausnet network areas and by approximately 12.5% in Citipower. In the Jemena network the average decrease was 13.5% and the greatest average decrease occurred in the United Energy network at 14.5%. Chart 70 below shows average annual bills as of April 2020, October 2020 and April 2021.
CHART 70 | Average annual electricity bills as of April 2020, October 2020 and April 2021 including guaranteed discounts and pay on time discounts. Annual bills based on market offers, single rate, 20,000 kWh per annum and GST inclusive
In terms of individual retailers, all retailers except Sumo Power and Blue NRG, have offers that produce lower bills in April 2021 compared to six months ago (October 2020) in all network areas. Compared to one year ago (April 2020) all retailers have offers that produce lower bills. Charts 71 to 75 show retail bills as of April 2020, October 2020 and April 2021 for each network area.

54
$2,000
$2,500$3,000$3,500$4,000$4,500$5,000$5,500$6,000$6,500$7,000
AGL
Alinta E
nergy
CovaU
Diamond Energ
y
EnergyA
ustral
ia
GloBird Ene
rgy
Lumo E
nergy
Momen
tum Energy
Next Busi
ness Energ
y
Origin Ener
gy
1st Ene
rgy
Powerdire
ct
Powersho
p
Red Energ
y
Simply E
nergy
Sumo Pow
er
Blue NRG
Tango
Energy
Powerclub
Energy L
ocals
$ pe
r ann
um
Apr-20 Oct-20 Apr-21
3,000
3,500
4,000
4,500
5,000
5,500
6,000
6,500
7,000
7,500
AGL
Alinta E
nergy
CovaU
Diamond Energ
y
EnergyA
ustral
ia
GloBird Ene
rgy
Lumo E
nergy
Momen
tum Energy
Next Busi
ness Energ
y
Origin Ener
gy
1st Ene
rgy
Powerdire
ct
Powersho
p
Red Energ
y
Simply E
nergy
Sumo Pow
er
Blue NRG
Tango
Energy
Powerclub
Energy L
ocals
$ pe
r ann
um
Apr-20 Oct-20 Apr-21
$4,500
$5,000
$5,500
$6,000
$6,500
$7,000
$7,500
$8,000
$8,500
$9,000
AGL
Alinta E
nergy
CovaU
Diamond Energ
y
EnergyA
ustral
ia
GloBird Ene
rgy
Lumo E
nergy
Momen
tum Energy
Next Busi
ness Energ
y
Origin Ener
gy
1st Ene
rgy
Powerdire
ct
Powersho
p
Red Energ
y
Simply E
nergy
Sumo Pow
er
Blue NRG
Tango
Energy
Powerclub
Energy L
ocals
$ pe
r ann
um
Apr-20 Oct-20 Apr-21
CHART 71 | Electricity bills including guaranteed discounts and pay on time discounts, from April 2020 to April 2021 in Citipower’s network area. Annual bills based on market offers as of April 2020, October 2020 and April 2021, 20,000 kWh per annum, single rate and GST inclusive
CHART 72 | Electricity bills including guaranteed discounts and pay on time discounts, from April 2020 to April 2021 in Powercor’s network area. Annual bills based on market offers as of April 2020, October 2020 and April 2021, 20,000 kWh per annum, single rate and GST inclusive
CHART 73 | Electricity bills including guaranteed discounts and pay on time discounts, from April 2020 to April 2021 in Ausnet Services’ network area. Annual bills based on market offers as of April 2020, October 2020 and April 2021, 20,000 kWh per annum, single rate and GST inclusive

Analysis of small business retail energy bills in Australia 55
$3,000
$3,500
$4,000
$4,500
$5,000
$5,500
$6,000
$6,500
$7,000
AGL
Alinta E
nergy
CovaU
Diamond Energ
y
EnergyA
ustral
ia
GloBird Ene
rgy
Lumo E
nergy
Momen
tum Energy
Next Busi
ness Energ
y
Origin Ener
gy
1st Ene
rgy
Powerdire
ct
Powersho
p
Red Energ
y
Simply E
nergy
Sumo Pow
er
Tango
Energy
Powerclub
Energy L
ocals$
per a
nnum
Apr-20 Oct-20 Apr-21
$3,000
$3,500
$4,000
$4,500
$5,000
$5,500
$6,000
$6,500
$7,000
AGL
Alinta E
nergy
CovaU
Diamond Energ
y
EnergyA
ustral
ia
GloBird Ene
rgy
Lumo E
nergy
Momen
tum Energy
Next Busi
ness Energ
y
Origin Ener
gy
1st Ene
rgy
Powerdire
ct
Powersho
p
Red Energ
y
Simply E
nergy
Sumo Pow
er
Tango
Energy
Powerclub
Energy L
ocals
$ pe
r ann
um
Apr-20 Oct-20 Apr-21
CHART 74 | Electricity bills including guaranteed discounts and pay on time discounts, from April 2020 to April 2021 in Jemena’s network area. Annual bills based on market offers as of April 2020, October 2020 and April 2021, 20,000 kWh per annum, single rate and GST inclusive
CHART 75 | Electricity bills including guaranteed discounts and pay on time discounts, from April 2020 to April 2021 in United Energy’s network area. Annual bills based on market offers as of April 2020, October 2020 and April 2021, 20,000 kWh per annum, single rate and GST inclusive
On average, across all gas pricing zones, annual gas bills for businesses using 100 GJ per annum decreased by 3% between October 2020 and April 2021.80 It shows that Momentum Energy had the greatest increase over the last 6 months. Chart 76 shows retailers’ average annual gas bills (across all gas zones) as of April 2020, October 2020 and April 2021.
80 The gas zones included in this analysis are: Multinet 1 and 2, AGN Central 1 and 2, AGN North, Ausnet Services Central 1 and 2, and Ausnet Services West.
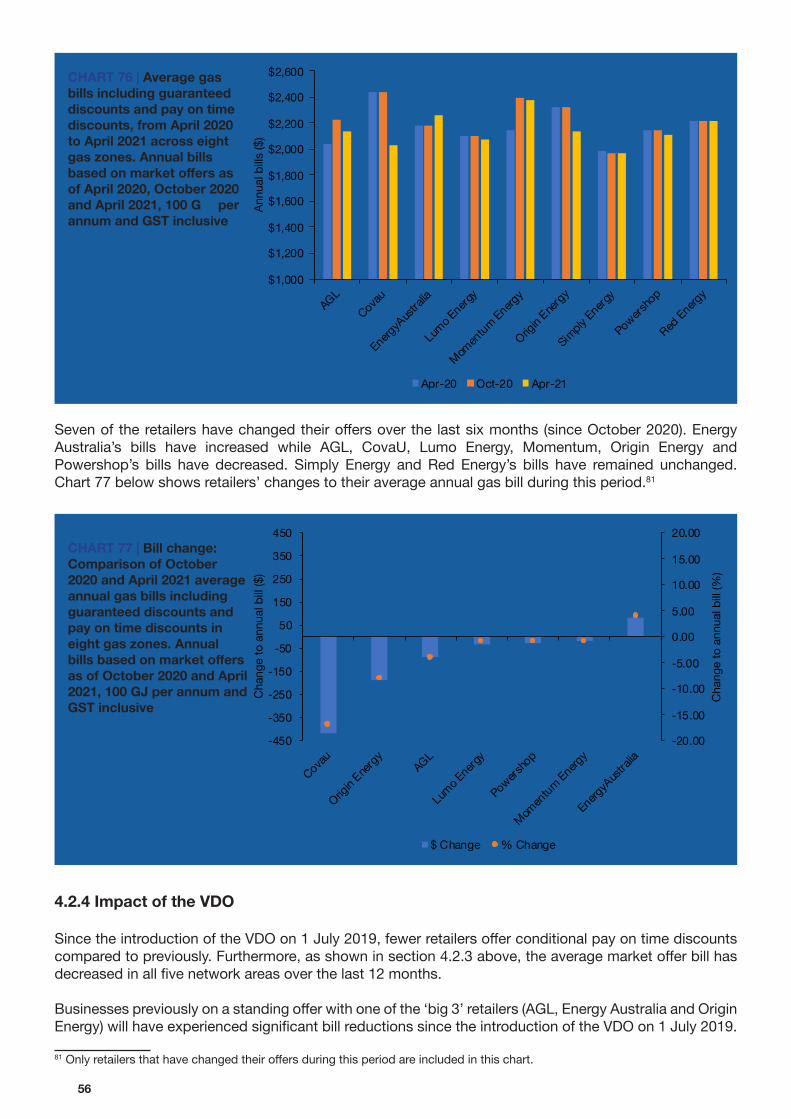
56
$1,000
$1,200
$1,400
$1,600
$1,800
$2,000
$2,200
$2,400
$2,600
AGLCovau
EnergyA
ustral
ia
Lumo E
nergy
Momen
tum Energy
Origin Ener
gy
Simply E
nergy
Powersho
p
Red Energ
y
Annu
al b
ills ($
)
Apr-20 Oct-20 Apr-21
-20.00
-15.00
-10.00
-5.00
0.00
5.00
10.00
15.00
20.00
-450
-350
-250
-150
-50
50
150
250
350
450
Covau
Origin Ener
gyAGL
Lumo E
nergy
Powersho
p
Momen
tum Energy
EnergyA
ustral
ia
Cha
nge
to a
nnua
l bill
(%)
Cha
nge
to a
nnua
l bill
($)
$ Change % Change
CHART 76 | Average gas bills including guaranteed discounts and pay on time discounts, from April 2020 to April 2021 across eight gas zones. Annual bills based on market offers as of April 2020, October 2020 and April 2021, 100 GJ per annum and GST inclusive
Seven of the retailers have changed their offers over the last six months (since October 2020). Energy Australia’s bills have increased while AGL, CovaU, Lumo Energy, Momentum, Origin Energy and Powershop’s bills have decreased. Simply Energy and Red Energy’s bills have remained unchanged. Chart 77 below shows retailers’ changes to their average annual gas bill during this period.81
CHART 77 | Bill change: Comparison of October 2020 and April 2021 average annual gas bills including guaranteed discounts and pay on time discounts in eight gas zones. Annual bills based on market offers as of October 2020 and April 2021, 100 GJ per annum and GST inclusive
4.2.4 Impact of the VDO
Since the introduction of the VDO on 1 July 2019, fewer retailers offer conditional pay on time discounts compared to previously. Furthermore, as shown in section 4.2.3 above, the average market offer bill has decreased in all five network areas over the last 12 months.
Businesses previously on a standing offer with one of the ‘big 3’ retailers (AGL, Energy Australia and Origin Energy) will have experienced significant bill reductions since the introduction of the VDO on 1 July 2019.
81 Only retailers that have changed their offers during this period are included in this chart.

Analysis of small business retail energy bills in Australia 57
7,7248,276 7,951
5,093 5,093 5,093
0
1,000
2,000
3,000
4,000
5,000
6,000
7,000
8,000
9,000
10,000
AGL EnergyAustralia Origin Energy
Standing offer Apr 2019 VDO Oct 2019 VDO Apr 2020
VDO Oct 2020 VDO Apr 2021
7,370 7,559
6,721
4,930 4,930 4,930
0
1,000
2,000
3,000
4,000
5,000
6,000
7,000
8,000
9,000
10,000
AGL EnergyAustralia Origin Energy
Standing offer Apr 2019 VDO Oct 2019 VDO Apr 2020VDO Oct 2020 VDO Apr 2021
Charts 78 – 82 below compare AGL, Energy Australia and Origin Energy’s standing offers prior to the VDO taking effect to the VDO as of October 2019, April 2020, October 2020 and April 2021. They show that the initial bill reduction (October 2019), for businesses using 20,000 kWh per annum, was between $1,320 and $2,995 (depending on the network and retailer) but increases to the VDO in January 2020 reduced the overall drop to $900 and $2,530. In January 2021 the VDO decreased by 14% (on average) and bills are now between $1,790 and $3,290 less than they were prior to the VDO taking effect. Energy Australia’s bill in the United Energy network has reduced the most (by around $3,290) while Origin Energy’s bill reduction in the Citipower network, where it is the incumbent retailer, is more moderate (approximately $1,790).
CHART 78 | The VDO compared to the ‘big 3’ retailers’ standing offers in the Citipower network. Annual electricity bills for SMEs using 20,000 kWh (single rate) per annum. GST inclusive
CHART 79 | The VDO compared to the ‘big 3’ retailers’ standing offers in the Powercor network. Annual electricity bills for SMEs using 20,000 kWh (single rate) per annum. GST inclusive

58
7,6178,167
7,779
5,256 5,256 5,256
0
1,000
2,000
3,000
4,000
5,000
6,000
7,000
8,000
9,000
10,000
AGL EnergyAustralia Origin Energy
Standing offer Apr 2019 VDO Oct 2019 VDO Apr 2020
VDO Oct 2020 VDO Apr 2021
9,7079,203 9,251
6,886 6,886 6,886
0
1,000
2,000
3,000
4,000
5,000
6,000
7,000
8,000
9,000
10,000
AGL EnergyAustralia Origin Energy
Standing offer Apr 2019 VDO Oct 2019 VDO Apr 2020
VDO Oct 2020 VDO Apr 2021
8,242 8,557
7,572
5,269 5,269 5,269
0
1,000
2,000
3,000
4,000
5,000
6,000
7,000
8,000
9,000
10,000
AGL EnergyAustralia Origin Energy
Standing offer Apr 2019 VDO Oct 2019 VDO Apr 2020VDO Oct 2020 VDO Apr 2021
CHART 80 | The VDO compared to the ‘big 3’ retailers’ standing offers in the Ausnet Services network. Annual electricity bills for SMEs using 20,000 kWh (single rate) per annum. GST inclusive.
CHART 81 | The VDO compared to the ‘big 3’ retailers’ standing offers in the Jemena network. Annual electricity bills for SMEs using 20,000 kWh (single rate) per annum. GST inclusive.
CHART 82 | The VDO compared to the ‘big 3’ retailers’ standing offers in the United Energy network. Annual electricity bills for SMEs using 20,000 kWh (single rate) per annum. GST inclusive.

Analysis of small business retail energy bills in Australia 59
4.3 Queensland
Electricity prices in South East Queensland have been deregulated since July 2016 but on 1 July 2019 the Australian Energy Regulator’s Default Market Offer (DMO) replaced the previously retailer determined electricity standing offers in South East Queensland. The Queensland Competition Authority (QCA) still regulates retail prices for customers of Ergon Energy (Retail). Gas retail prices have been deregulated since 2007.
Queensland has two electricity networks, Energex in South East Queensland and Ergon Energy in Northern and regional Queensland. There is currently no effective retail competition for SME customers in regions supplied by the Ergon Energy network business. Queensland also has four gas pricing zones.
Queensland’s two electricity networks and four gas pricing zones:
Electricity network AreaEnergex South East QueenslandErgon Energy Regional and Northern Queensland
Gas zones AreaAllgas – Brisbane South South Brisbane, Gold Coast, Toowoomba and OakeyAGN – Brisbane North North Brisbane and IpswichAGN - Northern Rockhampton and Gladstone AGN – Wide Bay Bundaberg, Maryborough and Hervey Bay
4.3.1 Queensland electricity bills April 2021
The bill analysis presented in this report is based on SMEs using 20,000 kWh per annum on a single rate tariff. Research published by AEMO82 shows that small businesses, on average (across the NEM network areas), use approximately 20,000 kWh per annum and we use this average instead of network specific consumption profiles to readily enable comparison between network areas and jurisdictions. According to the AEMO report, average consumption for a small business in the Energex network is 16,678 kWh per annum. We also note that the workbooks accompanying this report allow users to nominate their own consumption levels as well as undertaking analysis of different tariff types (2-rate tariffs, time of use tariffs etc.). The workbooks are available at: https://energyconsumersaustralia.com.au/publications/our-research.
The price-spreadThe typical annual bill for SMEs consuming 20,000 kWh per annum (single rate) is approximately $4,750.83 Chart 83 shows annual bills for twenty-six retailers in South East Queensland (Energex network) and that the maximum price-spread is approximately $1,775 per annum. Compared to six months ago (October 2020), the maximum price-spread has decreased by $280.
82 Jacobs Australia, Retail electricity price history and project trends, AEMO, 21 September 2017 83 See appendix A for a list of retail offers included in this analysis. Many retailers have more than one market offer and the rates, conditions, size of discounts as well as discount types (e.g. guaranteed or conditional) may vary between their offers.

60
$3,000
$3,500
$4,000
$4,500
$5,000
$5,500
$6,000
1 2 3 4 5 6 7 8 9 10 11 12 13 14 15 16 17 18 19 20 21 22 23 24 25 26
$ pe
r ann
um
FIGURE 18 | Lowest to highest annual electricity bills (incl GST) for market offers in Queensland’s Energex network (April 2021) Including discounts and pay on time discounts - SMEs consuming 20,000kWh per annum (single rate)
BlueNRG $3,706
Powerclub $4,167
Bright Spark Power $4,508
Locality Planning Energy $4,582
Energy Locals $4,593
Alinta Energy $4,662
Glow Power $4,881
Future X Power $4,884
1st Energy $4,918
Powerdirect $4,949
Origin Energy $5,071
AGL $4,663
Simply Energy $4,722Electricity in a box $4,777
CovaU $4,788
Powershop $4,850Next Business Energy $4,880
EnergyAustralia $5,010
Radian Energy $5,184
Red Energy $5,244
Diamond Energy $5,478
Sumo Power $4,664
Discover Energy $4,814
Momentum Energy $4,539
ReAmped Energy $4,483
Enova Energy $4,488
CHART 83 | The price-spread in the South East Queensland’s Energex distribution network. Annual bills based on market offers as of April 2021 (including guaranteed discounts and pay on time discounts), 20,000 kWh per annum, single rate and GST inclusive
Figure 18 below ranks the retail offers from lowest to highest annual electricity bills.84 The lowest annual retail bill in the Energex network area has remained unchanged since October 2020.
84 These market offers were collected on the 7th of April 2021 and it should be noted that retailers may change their rates at any time. Additional discounts for customers choosing to pay by direct debit are not included in these bill calculations.

Analysis of small business retail energy bills in Australia 61
3,000
3,500
4,000
4,500
5,000
5,500
6,000
6,500
AGL
Diam
ond
Ener
gyEn
ergyA
ustra
liaOr
igin E
nerg
yPo
werd
irect
Powe
rsho
pEn
ergy L
ocals
Simp
ly En
ergy
Alint
a Ene
rgy
1st E
nerg
yPo
werc
lub
Next
Busin
ess E
nerg
yRe
d En
ergy
Blue
NRG
Futu
re X
Pow
er
Loca
lity P
lannin
g En
ergy
Brigh
t Spa
rk P
ower
Cova
UDi
scov
er E
nerg
yGl
ow P
ower
Radia
n Ene
rgy
ReAm
ped E
nerg
ySu
mo P
ower
Enov
a En
ergy
Mom
entu
m En
ergy
Electr
icity
in a
box
$ pe
r ann
um
Rates only Guaranteed Conditional DMO
Additional discountsNine out of the twenty-six retailers operating in South East Queensland offer additional discounts. Energy Australia, Origin, Simply Energy, 1st Energy, CovaU and Discover Energy offer guaranteed discounts while the remaining three retailers (Diamond Energy, Powershop and Enova) offer discounts conditional upon bills being paid on time.85 The conditional pay on time discount can be worth up to $545 per annum for customers using 20,000 kWh/annum. Chart 84 shows annual bills based on their rates only, inclusive of guaranteed discounts and inclusive of guaranteed as well as conditional pay on time discount. The chart also compares the market offers to the DMO and it shows that all of the market offers produce bills that are lower than the DMO. We note, however, that Diamond Energy’s offer is only lower than the DMO if the conditional pay on time discount is obtained.
CHART 84 | Annual bills based on rates, guaranteed discounts and pay on time discounts as well as the DMO in South East Queensland (Energex). Annual bills based on market offers as of April 2021, 20,000 kWh per annum, single rate and GST inclusive
Network chargesThe South East Queensland electricity network, Energex, introduces new Network Use of System (NUOS) charges as of 1 July every year. These NUOS charges are approved by the Australian Energy Regulator (AER) and comprise Transmission Use of System (TUOS) and Distribution Use of System (DUOS) as well as other costs such as jurisdictional charges and metering charges. The retailers can, and generally will, build changes to the NUOS (in relation to both shape and price) into their retail tariffs.
The chart presented in this section shows that the NUOS proportion of bills varies significantly between retail offers. The NUOS proportion of the bill for BlueNRG is 54.8% while the NUOS comprises 37.1% of the total bill for Diamond Energy’s customers.
Charts 85 shows annual retail bills (columns) and NUOS as proportion of annual bill (line).
85 Note that Powershop’s conditional discount is not a conventional pay on time discount as customers obtain the discount by pre-purchasing “specials”. Also note that 1st Energy’s 1st Saver Plus offer has both a guaranteed and a conditional discount.

62
0.0
10.0
20.0
30.0
40.0
50.0
60.0
70.0
$0
$1,000
$2,000
$3,000
$4,000
$5,000
$6,000
Blue
NRG
Powe
rclub
ReAm
ped E
nerg
yEn
ova
Ener
gy
Brigh
t Spa
rk P
ower
Mom
entu
m En
ergy
Loca
lity P
lannin
g En
ergy
Energ
y Loc
alsAl
inta E
nerg
yAG
LSu
mo P
ower
Simp
ly En
ergy
Electr
icity
in a
box
Cova
UDi
scov
er E
nerg
yPo
wers
hop
Next
Busin
ess E
nerg
yGl
ow P
ower
Futu
re X
Pow
er1s
t Ene
rgy
Powe
rdire
ct
Energ
yAus
tralia
Origi
n Ene
rgy
Radia
n Ene
rgy
Red
Energ
y
Diam
ond
Ener
gy
% o
f tot
al b
ill
$ pe
r ann
um
Total bill (incl GST) NUOS proportion %
$0
$1,000
$2,000
$3,000
$4,000
$5,000
$6,000
Single
$ pe
r ann
um
Energex (avg.) Ergon
CHART 85 | South East Queensland (Energex): Annual retail bills (incl. GST) and NUOS as proportion of total bill, April 2021. Based on retail market offers (including guaranteed and pay on time discounts), single rate, 20,000 kWh per annum86
Regional QueenslandThere is no effective retail competition in regional and northern Queensland (customers supplied by the Ergon Energy network) and small businesses in this area are therefore charged based on the regulated prices determined by the Queensland Competition Authority. As customers in the Ergon Energy network are generally unable to access discounted market offers by competitive retailers, they may pay more for electricity compared to businesses in South East Queensland. Compared to the DMO, however, customers using 20,000 kWh per annum in the Ergon Energy network will have an annual bill that is $130 less than customers on the DMO.
Chart 86 shows that the average market offer in the Energex network (including discounts) is approximately $880 less than the regulated offer in the Ergon Energy network for businesses using 20,000 kWh per annum. It is important to note that in determining the regulated retail rates for small customers in regional Queensland, the Queensland Competition Authority are required to use the equivalent Energex network rate, so that customers in regional Queensland pay a similar amount to customers in South East Queensland. The difference in the cost of supply is paid to the Ergon Energy retailer as a community service obligation by the Queensland Government.87
CHART 86 | Annual bills for the single rate tariff in the Energex and Ergon Energy networks. Annual bills based on the regulated offer (Ergon Energy) and market offers including discounts (Energex) as of April 2021, 20,000 kWh per annum and GST inclusive
86 Based on market offer rates as of April 2021, presented as annual bills for SMEs using 20,000kWh per annum (single rate). The annual NUOS charges are based on the Energex’s charges (tariff NTC 8500) for the 2020/21 financial year. The NUOS also includes fixed charges. 87 QCA, SEQ retail electricity market monitoring: 2016–17, November 2017

Analysis of small business retail energy bills in Australia 63
$0
$500
$1,000
$1,500
$2,000
$2,500
$3,000
$3,500
$4,000
$4,500
Allgas AGN
$ pe
r ann
um
AGL Origin Energy Red Energy Covau Alinta Energy
4.3.2 Queensland gas bills April 2021
To calculate annual gas bills we have assumed an annual consumption of 100 GJ per annum and a flat consumption over the year (25 GJ per quarter or 16.66 GJ per bi-monthly bill). Small businesses using gas for heating purposes are unlikely to have a flat consumption profile.
The price-spreadThere are two main gas zones in Queensland: the Allgas zone covering South Brisbane, Gold Coast, Toowoomba and Oakey, and the Australian Gas Networks (AGN) zone covering North Brisbane and Ipswich. AGL, Origin, Red Energy, CovaU, Discover Energy and Origin Energy have market offers in both areas. AGN also has two other pricing zones: Northern covering Rockhampton and Gladstone, and Wide Bay covering Bundaberg, Maryborough and Hervey Bay. Origin is the only retailer that offers contracts in the Northern pricing zones while AGL, Origin and CovaU have offers in the Hervey Bay area. Origin Energy and CovaU are currently the only gas retailers that offers additional discounts (a guaranteed 8% off usage charges for Origin Energy and 15% for CovaU).
The maximum price-spread is approximately $200 in the Allgas zone and $325 in the AGN zone. Compared to six months ago (October 2020), the maximum price-spread has increased by $20 in the Allgas zone but has decreased by $125 in the AGN zone. The typical annual market offer bill for SMEs consuming 100 GJ per annum is approximately $3,215 (including discounts) in the Allgas zone and $3,980 in the AGN zone.88 This is a significant difference for two gas zones that cover neighbouring areas. Chart 87 shows AGL, Origin, Red Energy, CovaU and Alinta Energy’s annual bills for the two pricing zones.
CHART 87 | Gas bills in Queensland’s Allgas and AGN pricing zones. Annual bills based on market offers as of April 2021 (including guaranteed discounts), 100 GJ per annum and GST inclusive
Figures 19 - 20 below rank the retail offers from lowest to highest annual gas bills in the two main pricing zones.89
88 See appendix A for a list of retail offers included in this analysis. Many retailers have more than one market offer and the rates, conditions, size of discounts as well as discount types (e.g. guaranteed or conditional) may vary between their offers.89 These market offers were collected on the 7th of April 2021 and it should be noted that retailers may change their rates at any time. Additional discounts for customers choosing to pay by direct debit are not included in these bill calculations

64
$1,000
$1,500
$2,000
$2,500
$3,000
$3,500
$4,000
$4,500
AGN Northern AGN Wide Bay
$ pe
r ann
um
In the two smaller AGN pricing zones (Northern and Wide Bay), Origin Energy’s annual bills for this consumption level amount to approximately $4,270 and $3,940 respectively. However, AGL and CovaU do have an offer in Hervey Bay pricing zone and AGL’s offer produces an annual bill that is almost $400 less than Origin’s offer
CHART 88 | Origin gas bills in Queensland’s AGN Northern and AGN Wide Bay pricing zones. Annual bills based on market offers as of April 2021 (including guaranteed discounts), 100 GJ per annum and GST inclusive
4.3.3 Changes in energy bills in Queensland
This section compares annual energy bills as of October 2020 to bills as of April 2021. The SME Retail Tariff Tracker project collects information about energy offers and rates available to small businesses across Australia every six months (in April and October every year) and this section highlights changes (increases or decreases) to annual bills over that six month period, as well as the trend over the twelve months to April 2021.
In Queensland, electricity prices have not had an underlying price reset, such as new network tariffs taking effect, during the last six months. However, some retailers have still changed their offers (rates, discounts or both).
The average annual market offer bill has decreased by $70 (or 1.4%) in the Energex network since October 2020. Chart 89 below shows average annual bills as of April 2020, October 2020 and April 2021.
FIGURE 19 | Lowest to highest annual gas bills (incl GST) for market offers in the Allgas pricing zone (April 2021). Bills including guaranteed discounts - SMEs consuming 100 GJ per annum
FIGURE 20 | Lowest to highest annual gas bills (incl GST) for market offers in the AGN pricing zone (April 2021). Bills including guaranteed discounts - SMEs consuming 100 GJ per annum
$3,940AGL
$4,025Red Energy
$4,070CovaU
$4,094Origin Energy
$3,770Alinta Energy
$3,171AGL
$3,207CovaU
$3,272Red Energy
$3,314Origin Energy
$3,114Alinta Energy

Analysis of small business retail energy bills in Australia 65
$5,114
$4,820$4,750
$3,000
$3,500
$4,000
$4,500
$5,000
$5,500
Apr-20 Oct-20 Apr-21
Annu
al b
ill ($
)
-$800
-$600
-$400
-$200
$0
$200
$400
LPE
ReAm
ped E
nerg
y
Alint
a Ene
rgy
Glow
Pow
er
Brigh
t Spa
rk P
ower
Cha
nge
($) t
o an
nual
bill
CHART 89 | Average annual electricity bills as of April 2020, October 2020 and April 2021 including guaranteed discounts and pay on time discounts in the Energex network. Annual bills based on market offers, single rate, 20,000 kWh per annum and GST inclusive
Three retailers have decreased their prices since October 2020, two have slight increases, and eighteen retailers have not changed their offers. Chart 90 below shows changes to annual bills for each retailer from October 2020 to April 2021.90
CHART 90 | Bill change: Comparison of October 2020 to April 2021 annual electricity bills including guaranteed discounts and pay on time discounts in the Energex network. Annual bills based on market offers as of October 2020 to April 2021, 20,000 kWh per annum, single rate and GST inclusive
In relation to gas, Origin’s gas bills have decreased by around 1 to 2% since April 2021. AGL, Red Energy and CovaU’s annual bills have remained unchanged. Alinta Energy is a new gas retailer in Queensland and did not have any offers in October 2020.
90 Based on market offers inclusive of guaranteed and conditional pay on time discounts. Note that only retailers that have changed their offers during this period are included in this chart.

66
-$80
-$70
-$60
-$50
-$40
-$30
-$20
-$10
$0
Allgas AGN
Cha
nges
($) t
o an
nual
bill
Origin Energy
6,649 6,256 6,348
6,023 6,024 6,024 5,757 5,758 5,759
4,000
5,000
6,000
7,000
8,000
9,000
10,000
AGL EnergyAustralia Origin Energy
Standing offer Apr 2019 DMO 2019/20 DMO 2020/21
CHART 91 | Bill change: Comparison of Origin Energy’s October 2020 and April 2021 annual gas bills including guaranteed discounts and pay on time discounts in the Allgas and AGN pricing zones. Annual bills based on market offers as of October 2020 and April 2021, 100 GJ per annum and GST inclusive
4.3.4 Impact of the DMO
Initially, the introduction of the DMO on 1 July 2019 had little impact on additional discounting in South East Queensland. Over the last eighteen months, however, many retailers have ceased offering additional discounts. Importantly, none of the retail market offers, inclusive of discounts, produce annual bills that are greater than the DMO (see section 4.3.1 above).91
Businesses previously on a standing offer with one of the ‘big 3’ retailers (AGL, Energy Australia and Origin Energy) will have experienced bill reductions since the introduction of the DMO. Chart 92 below compares AGL, Energy Australia and Origin Energy’s standing offers prior to the DMO taking effect to the DMO as of 2019/20 and 2020/21. It shows that the bills are currently between $500 and $890 less compared to April 2019 (depending on the retailer) for businesses using 20,000 kWh per annum. AGL’s bill has reduced the most (by approximately $890) while Energy Australia and Origin Energy’s bill reductions are somewhat more modest at $500 and $590 respectively.
CHART 92 | The DMO compared to the ‘big 3’ retailers’ standing offers in the Energex network. Annual electricity bills for SMEs using 20,000 kWh (single rate) per annum. GST inclusive.
91 Market offer bills including guaranteed discounts compared to the DMO.

Analysis of small business retail energy bills in Australia 67
6000
6500
7000
7500
8000
8500
9000
9500
10000
1 2 3 4 5 6 7 8 9 10 11 12 13 14 15 16 17 18 19 20 21
$ pe
r ann
um
4.4 South Australia
South Australia deregulated electricity and gas retail prices in 2013 but on 1 July 2019 the Australian Energy Regulator’s Default Market Offer (DMO) replaced the previously retailer determined electricity standing offers in South Australia. SA Power Networks cover the entire state and AGL is the incumbent retailer. In relation to gas, there are several gas pricing zones, but as the incumbent retailer (Origin) does not currently differentiate its offers between these zones, this analysis compares gas offers in the AGN South Australia zone. That said, customers in regional areas such as Mt Gambier, Riverland and Whyalla may only be able to access Origin’s market offer.
4.4.1 South Australian electricity bills April 2021
The bill analysis presented in this report is based on SMEs using 20,000 kWh per annum on a single rate tariff. Research published by AEMO92 shows that small businesses, on average (across the NEM network areas), use approximately 20,000 kWh per annum and we use this average instead of network specific consumption profiles to readily enable comparison between network areas and jurisdictions. According to the AEMO report, average consumption for a small business in South Australia Power Networks is 14,262 kWh per annum. We also note that the workbooks accompanying this report allow users to nominate their own consumption levels as well as undertaking analysis of different tariff types (2-rate tariffs, time of use tariffs etc.). The workbooks are available at: https://energyconsumersaustralia.com.au/publications/our-research.
The price-spreadThe typical annual bill for SMEs consuming 20,000 kWh per annum (single rate) is approximately $7,215.93 Chart 93 shows annual bills for twenty-one retailers in the SA Power Networks (SAPN) and that the maximum price-spread is approximately $2,475 per annum. If we exclude the single lowest and single highest bills, however, the maximum price-spread is reduced to $2,035. Compared to six months ago (October 2020), the maximum price-spread has remained unchanged.
CHART 93 | The price-spread in the South Australia’s SAPN distribution network. Annual bills based on market offers as of April 2021 (including guaranteed discounts and pay on time discounts), 20,000 kWh per annum, single rate and GST inclusive
Figure 21 below ranks the retail offers from lowest to highest annual electricity bills.94
92 Jacobs Australia, Retail electricity price history and project trends, AEMO, 21 September 2017 93 See appendix A for a list of retail offers included in this analysis. Many retailers have more than one market offer and the rates, conditions, size of discounts as well as discount types (e.g. guaranteed or conditional) may vary between their offers.94 These market offers were collected on the 8th of April 2021 and it should be noted that retailers may change their rates at any time. Additional discounts for customers choosing to pay by direct debit are not included in these bill calculations.

68
FIGURE 21 | Lowest to highest annual electricity bills (incl GST) for South Australian market offers (April 2021) Including discounts and pay on time discounts - SMEs consuming 20,000kWh per annum (single rate)
Powerclub $5,971
$6,268
$6,284
$6,298Energy Locals
$6,455
$6,721
$7,036
$7,057
Next Business Energy
CovaU
Future X Power
ReAmped Energy
BlueNRG
AGL
$7,104
$7,108
$7,172
$7,222
$7,391
$7,442
$7,512
Discover Energy
Origin Energy
1st Energy
Simply Energy
Powerdirect
Powershop
Momentum Energy
$7,805Lumo Energy
$7,805
$8,055
$8,071
$8,303
$8,447
Alinta Energy
EnergyAustralia
Red Energy
Diamond Energy
QEnergy
$0$1,000$2,000$3,000$4,000$5,000$6,000$7,000$8,000
$9,000$10,000
AGL
Alinta E
nergy
Diamond Energ
y
EnergyA
ustral
ia
Lumo E
nergy
Momen
tum Energy
Origin Ener
gy
Powerdire
ct
Red Energ
y
Simply E
nergy
Blue NRG
Powersho
p
Powerclub
Energy L
ocals
Future X Power
Discove
r Energ
y
Next Busi
ness Energ
y
QEnergy
ReAmped E
nergyCovau
1st Ene
rgy
$ pe
r ann
um
Rates only Guaranteed Conditional DMO
Additional discountsCurrently, only three of the twenty-one retailers operating in South Australia offer conditional pay on time discounts (Powershop, Diamond Energy and 1st Energy). For customers using 20,000kWh per annum, this conditional discount can be worth as much as $800 per annum (1st Energy’s offer). Five other retailers (Energy Australia, Origin, Simply Energy, Discover Energy and CovaU) offer guaranteed discounts while the remaining thirteen retailers do not offer any additional discounts. The practice of discounting has thus continued to reduce in South Australia. Chart 94 shows annual bills based on their rates only, inclusive of guaranteed discounts and inclusive of guaranteed as well as conditional pay on time discounts.95 The chart also compares the market offers to the DMO and it shows that all retailers have market offers that produce bills that are similar or lower than the DMO. It should be noted, however, that Diamond Energy’s would be more than the DMO if the conditional pay on time discount is not obtained.
CHART 94 | Annual bills based on rates, guaranteed discounts and pay on time discounts as well as the DMO in SA Power Networks. Annual bills based on market offers as of April 2021, 20,000 kWh per annum, single rate and GST inclusive
95 Note that Powershop’s conditional discount is not a conventional pay on time discount as customers obtain the discount by pre-purchasing “specials”. Origin Energy and Powershop’s discounts are applied to amounts inclusive of GST while all other discounts are applied to amounts exclusive of GST.

Analysis of small business retail energy bills in Australia 69
0.0
10.0
20.0
30.0
40.0
50.0
60.0
$5,000$5,500$6,000$6,500$7,000$7,500$8,000$8,500$9,000$9,500
$10,000
Powerclub
ReAmped E
nergy
Next Busi
ness Energ
y
Energy L
ocals
Blue NRGCovau
Future X Power
AGL
Discove
r Energ
y
Origin Ener
gy
1st Ene
rgy
Powerdire
ct
Simply E
nergy
Powersho
p
Momen
tum Energy
Lumo E
nergy
Alinta E
nergy
EnergyA
ustral
ia
Red Energ
y
QEnergy
Diamond Energ
y
% o
f tot
al b
ill
$ pe
r ann
um
Total bill (incl GST) NUOS proportion %
Network chargesThe South Australian electricity network, SA Power Networks, introduces new Network Use of System (NUOS) charges as of 1 July every year. These NUOS charges are approved by the Australian Energy Regulator (AER) and comprise Transmission Use of System (TUOS) and Distribution Use of System (DUOS) as well as other costs such as jurisdictional charges and metering charges. The retailers can, and generally will, build changes to the NUOS (in relation to both shape and price) into their retail tariffs.
The chart presented in this section shows that the NUOS proportion of bills varies significantly between retail offers. The NUOS proportion of the bill for Powerclub is 53.4% while the NUOS comprises around 38% of the total bill for Diamond Energy customers.
Chart 95 shows annual retail bills (columns) and NUOS as proportion of annual bill (line).
CHART 95 | South Australia (SAPN): Annual retail bills (incl. GST) and NUOS as proportion of total bill, April 2021. Based on retail market offers (including guaranteed and pay on time discounts), single rate, 20,000 kWh per annum96
4.4.2 South Australian gas bills April 2021
To calculate annual gas bills we have assumed an annual consumption of 100 GJ per annum and a flat consumption over the year (25 GJ per quarter or 16.66 GJ per bi-monthly bill). Small businesses using gas for heating purposes are unlikely to have a flat consumption profile.
The price-spreadThe typical annual market offer bill for SMEs consuming 100 GJ per annum is $3,585 (including discounts). Chart 96 shows annual bills for seven retailers in South Australia and that the maximum price-spread is approximately $640 per annum.97 Compared to six months ago (October 2020), the maximum price-spread has increased by $210.
96 Based on market offer rates as of April 2021, presented as annual bills for SMEs using 20,000kWh per annum (single rate). The annual NUOS charges are based on the SAPN’s charges for the 2020/21 financial year. The NUOS also includes fixed charges. 97 See appendix A for a list of retail offers included in this analysis. Many retailers have more than one market offer and the rates, conditions, size of discounts as well as discount types (e.g. guaranteed or conditional) may vary between their offers..

70
2000
2500
3000
3500
4000
4500
5000
1 2 3 4 5 6 7 8
$ pe
r ann
um
FIGURE 22 | Lowest to highest annual gas bills (incl GST) for market offers in South Australia (Australian Gas Network), April 2021. Bills including guaranteed discounts and pay on time discounts - SMEs consuming 100 GJ per annum
$3,268Lumo Energy
$3,394Red Energy
$3,503Simply Energy
$3,595Origin Energy
$3,642AGL
$3,667Discover Energy
$3,696EnergyAustralia
$3,907Alinta Energy
CHART 96 | The price-spread in the South Australia. Annual bills based on market offers as of April 2021 (including guaranteed discounts and pay on time discounts), 100 GJ per annum and GST inclusive
Figure 22 below ranks the retail offers from lowest to highest annual gas bills.98 Compared to six months ago, the lowest annual retail bill has remained unchanged (since October 2020).
Additional discountsFour of the retailers, Energy Australia, Origin Energy, Simply Energy and Discover Energy offer additional discounts and they are all guaranteed discounts (3% off bill, 8% off usage, 11% off bill and 15% off usage, respectively).
Chart 97 shows annual bills based on their rates only, inclusive of guaranteed discounts and inclusive of guaranteed as well as conditional pay on time discounts.
98 These market offers were collected in October 2020 and it should be noted that retailers may change their rates at any time. Additional discounts for customers choosing to pay by direct debit are not included in these bill calculations.
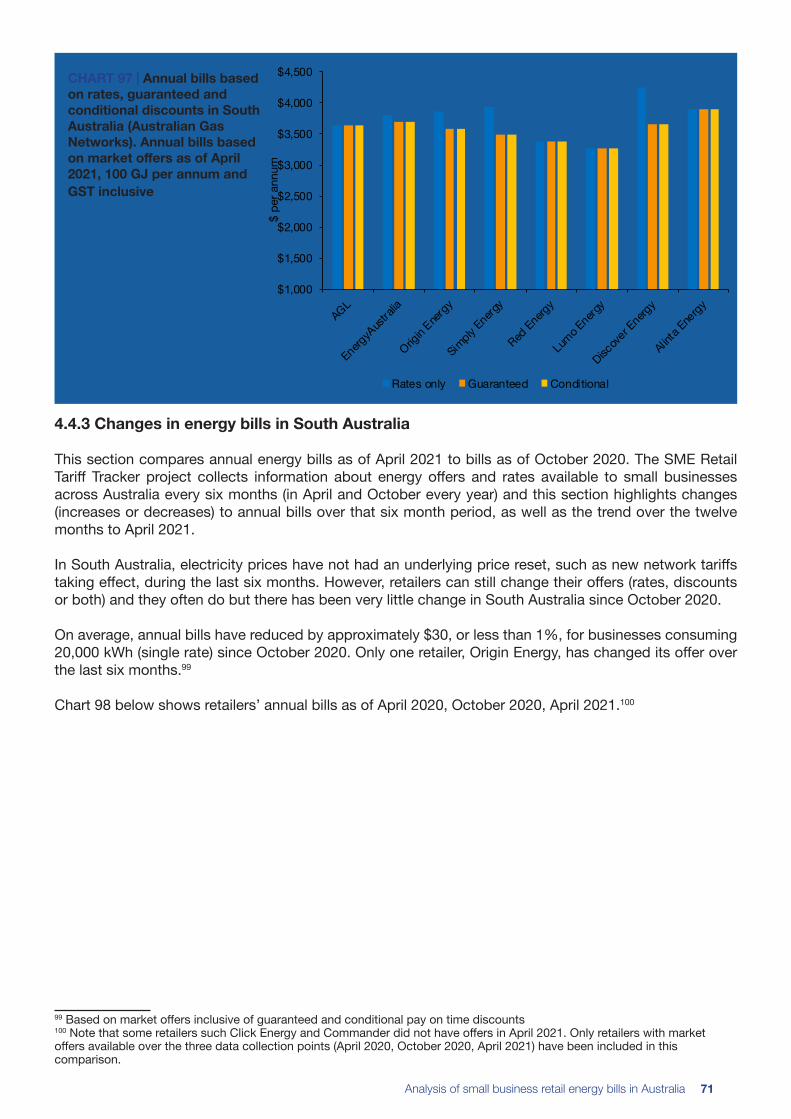
Analysis of small business retail energy bills in Australia 71
$1,000
$1,500
$2,000
$2,500
$3,000
$3,500
$4,000
$4,500
AGL
EnergyA
ustral
ia
Origin Ener
gy
Simply E
nergy
Red Energ
y
Lumo E
nergy
Discove
r Energ
y
Alinta E
nergy
$ pe
r ann
um
Rates only Guaranteed Conditional
CHART 97 | Annual bills based on rates, guaranteed and conditional discounts in South Australia (Australian Gas Networks). Annual bills based on market offers as of April 2021, 100 GJ per annum and GST inclusive
4.4.3 Changes in energy bills in South Australia
This section compares annual energy bills as of April 2021 to bills as of October 2020. The SME Retail Tariff Tracker project collects information about energy offers and rates available to small businesses across Australia every six months (in April and October every year) and this section highlights changes (increases or decreases) to annual bills over that six month period, as well as the trend over the twelve months to April 2021.
In South Australia, electricity prices have not had an underlying price reset, such as new network tariffs taking effect, during the last six months. However, retailers can still change their offers (rates, discounts or both) and they often do but there has been very little change in South Australia since October 2020.
On average, annual bills have reduced by approximately $30, or less than 1%, for businesses consuming 20,000 kWh (single rate) since October 2020. Only one retailer, Origin Energy, has changed its offer over the last six months.99
Chart 98 below shows retailers’ annual bills as of April 2020, October 2020, April 2021.100
99 Based on market offers inclusive of guaranteed and conditional pay on time discounts100 Note that some retailers such Click Energy and Commander did not have offers in April 2021. Only retailers with market offers available over the three data collection points (April 2020, October 2020, April 2021) have been included in this comparison.

72
$0
$1,000
$2,000
$3,000
$4,000
$5,000
$6,000
$7,000
$8,000
$9,000
$10,000
AGL
Alinta E
nergy
Diamond Energ
y
EnergyA
ustral
ia
Lumo E
nergy
Momen
tum Energy
Origin Ener
gy
Powerdire
ct
Red Energ
y
Simply E
nergy
Blue NRG
Powersho
p
Powerclub
Energy L
ocals
Future X Power
$ pe
r ann
um
Apr-20 Oct-20 Apr-21
$1,500
$2,000
$2,500
$3,000
$3,500
$4,000
AGL
EnergyA
ustral
ia
Origin Ener
gy
Simply E
nergy
Red Energ
y
Lumo E
nergy
Annu
al b
ill $
Apr-20 Oct-20 Apr-21
CHART 98 | Bill change: Comparison of April 2020, October 2020, April 2021 annual electricity bills including guaranteed discounts and pay on time discounts in the SA Power Networks. Annual bills based on market offers as of April 2020, October 2020, April 2021, 20,000 kWh per annum, single rate and GST inclusive
In relation to gas, only Origin Energy has changed their offer between October 2020 and April 2021. Origin Energy’s offer produces an annual bill that is $35 (or 1%) lower compared to 6 months ago.
Chart 99 below shows annual gas bills in the Envestra/AGN gas zone as of April 2020, October 2020, April 2021
CHART 99 | Annual gas bills including guaranteed discounts and pay on time discounts in South Australia. Annual bills based on market offers as of April 2020, October 2020, April 2021, 100 GJ per annum and GST inclusive
4.4.4 Impact of the DMO
Since the introduction of the DMO on 1 July 2019, fewer retailers offer conditional pay on time discounts compared to previously.
Businesses previously on a standing offer with AGL or Energy Australia will have experienced significant bill reductions since the introduction of the DMO. Chart 100 below compares AGL, Energy Australia and Origin Energy’s standing offers prior to the DMO taking effect to the DMO as of 2019/20 and 2020/21. It shows that the bills are currently between $805 and $2,535 less compared to April 2019 (depending on

Analysis of small business retail energy bills in Australia 73
9,917
9,118
8,304
4,000
5,000
6,000
7,000
8,000
9,000
10,000
Standing offer Apr 2019 DMO 2019/20 DMO 2020/21
the retailer) for businesses using 20,000 kWh per annum. Energy Australia’s bill has reduced the most (by approximately $2,535) while AGL and Origin Energy’s bill reductions are somewhat lower at $1,500 and $805 respectively.
CHART 100 | The DMO compared to the ‘big 3’ retailers’ standing offers in the SA Power Networks. Annual electricity bills for SMEs using 20,000 kWh (single rate) per annum. GST inclusive
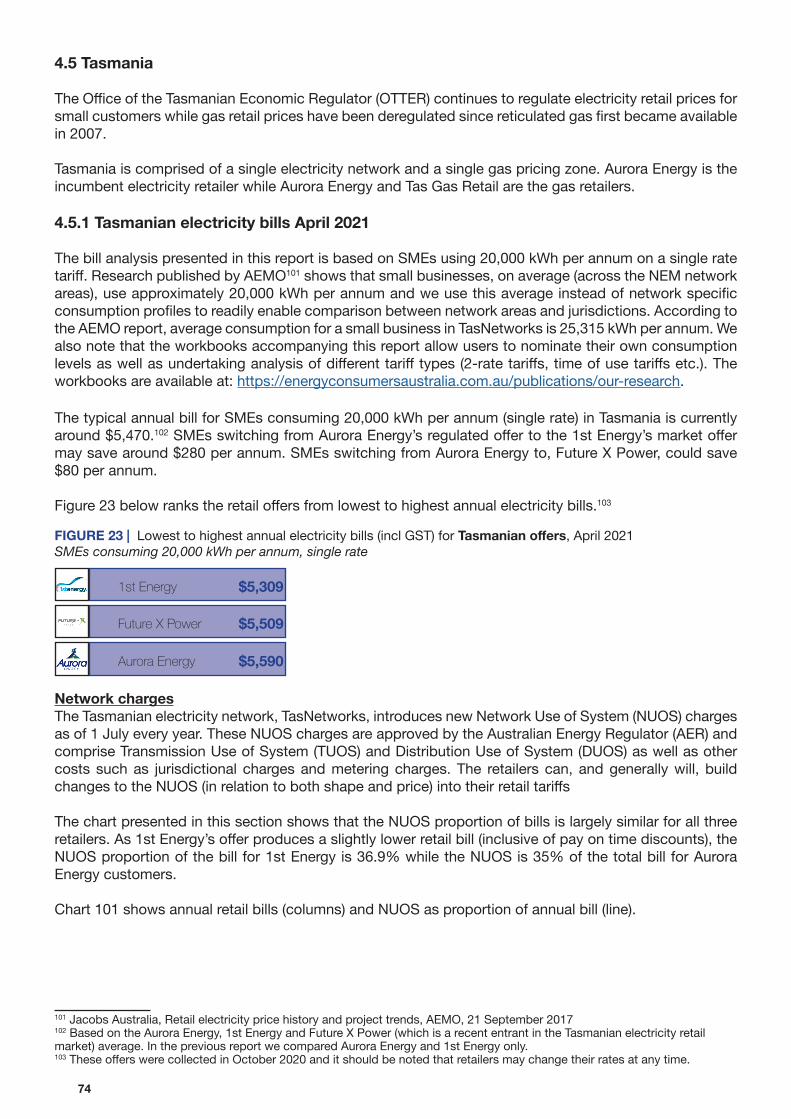
74
FIGURE 23 | Lowest to highest annual electricity bills (incl GST) for Tasmanian offers, April 2021 SMEs consuming 20,000 kWh per annum, single rate
$5,3091st Energy
$5,509Future X Power
$5,590Aurora Energy
4.5 Tasmania
The Office of the Tasmanian Economic Regulator (OTTER) continues to regulate electricity retail prices for small customers while gas retail prices have been deregulated since reticulated gas first became available in 2007.
Tasmania is comprised of a single electricity network and a single gas pricing zone. Aurora Energy is the incumbent electricity retailer while Aurora Energy and Tas Gas Retail are the gas retailers.
4.5.1 Tasmanian electricity bills April 2021
The bill analysis presented in this report is based on SMEs using 20,000 kWh per annum on a single rate tariff. Research published by AEMO101 shows that small businesses, on average (across the NEM network areas), use approximately 20,000 kWh per annum and we use this average instead of network specific consumption profiles to readily enable comparison between network areas and jurisdictions. According to the AEMO report, average consumption for a small business in TasNetworks is 25,315 kWh per annum. We also note that the workbooks accompanying this report allow users to nominate their own consumption levels as well as undertaking analysis of different tariff types (2-rate tariffs, time of use tariffs etc.). The workbooks are available at: https://energyconsumersaustralia.com.au/publications/our-research.
The typical annual bill for SMEs consuming 20,000 kWh per annum (single rate) in Tasmania is currently around $5,470.102 SMEs switching from Aurora Energy’s regulated offer to the 1st Energy’s market offer may save around $280 per annum. SMEs switching from Aurora Energy to, Future X Power, could save $80 per annum.
Figure 23 below ranks the retail offers from lowest to highest annual electricity bills.103
Network chargesThe Tasmanian electricity network, TasNetworks, introduces new Network Use of System (NUOS) charges as of 1 July every year. These NUOS charges are approved by the Australian Energy Regulator (AER) and comprise Transmission Use of System (TUOS) and Distribution Use of System (DUOS) as well as other costs such as jurisdictional charges and metering charges. The retailers can, and generally will, build changes to the NUOS (in relation to both shape and price) into their retail tariffs
The chart presented in this section shows that the NUOS proportion of bills is largely similar for all three retailers. As 1st Energy’s offer produces a slightly lower retail bill (inclusive of pay on time discounts), the NUOS proportion of the bill for 1st Energy is 36.9% while the NUOS is 35% of the total bill for Aurora Energy customers.
Chart 101 shows annual retail bills (columns) and NUOS as proportion of annual bill (line).
101 Jacobs Australia, Retail electricity price history and project trends, AEMO, 21 September 2017 102 Based on the Aurora Energy, 1st Energy and Future X Power (which is a recent entrant in the Tasmanian electricity retail market) average. In the previous report we compared Aurora Energy and 1st Energy only.103 These offers were collected in October 2020 and it should be noted that retailers may change their rates at any time.

Analysis of small business retail energy bills in Australia 75
20.0
25.0
30.0
35.0
40.0
45.0
50.0
55.0
60.0
65.0
70.0
$3,000
$3,500
$4,000
$4,500
$5,000
$5,500
$6,000
1st Energy Future X Power Aurora Energy
% o
f tot
al b
ill
$ pe
r ann
um
Total bill (incl GST) NUOS proportion %
$2,000
$2,400
$2,800
$3,200
$3,600
$4,000
$4,400
$4,800
Aurora Tas Gas
$ pe
r ann
um
CHART 101 | Tasmania (TasNetworks): Annual retail bills (incl. GST) and NUOS as proportion of total bill, for April 2021. Based on Aurora Energy’s regulated offer and 1st Energy’s market offer, 20,000 kWh per annum104
4.5.2 Tasmanian gas bills April 2021
To calculate annual gas bills we have assumed an annual consumption of 100 GJ per annum and a flat consumption over the year (25 GJ per quarter or 16.66 GJ per bi-monthly bill). Small businesses using gas for heating purposes are unlikely to have a flat consumption profile.
There are two retailers, Aurora Energy and Tas Gas Retail, offering market contracts to gas customers in Tasmania and the typical annual bill for a SME customer using 100 GJ per annum is $4,740. The difference between the two offers is approximately $110 per annum. Neither Aurora Energy nor Tas Gas Retail offer any additional discounts.
CHART 102 | Annual gas market offer bills in Tasmania. Annual bills based on market offers as of April 2021, 100 GJ per annum and GST inclusive
104 Based on retail offer rates as April 2021, presented as annual bills for SMEs using 20,000kWh per annum (single rate). The annual NUOS charges are based on the TasNetworks’s charges (tariff Tas 22) for the 2020/21 financial year. The NUOS also includes fixed charges.

76
FIGURE 24 | Lowest to highest annual gas bills (incl GST) for Tasmanian market offers, April 2021SMEs consuming 100 GJ per annum
$4,686Tas Gas
$4,796Aurora Energy
$3,000
$3,500
$4,000
$4,500
$5,000
$5,500
$6,000
Aurora Energy 1st Energy Future X Power
Annu
al b
ill ($
)
Apr-20 Oct-20 Apr-21
Figure 24 below ranks the retail offers from lowest to highest annual gas bills.105
4.5.3 Changes in energy bills in Tasmania
This section compares annual energy bills as of April 2021 to bills as of October 2020. The SME Retail Tariff Tracker project collects information about energy offers and rates available to small businesses across Australia every six months (in April and October every year) and this section highlights changes (increases or decreases) to annual bills over that six month period, as well as the trend over the twelve months to April 2021.
In Tasmania, electricity prices have not had an underlying price reset, such as new network tariffs taking effect, during the last six months. However, retailers can still change their offers (rates, discounts or both), and they often do, but there have been no changes to Tasmanian energy retail offers in Tasmania since October 2020.
Chart 103 below shows annual electricity bills for Aurora Energy and 1st Energy as of April 2020, October 2020 and April 2021.106
CHART 103 | Annual electricity retail bills (incl. GST) as of April 2020, October 2020 and April 2021. Based on Aurora Energy’s regulated offer and 1st Energy’s market offer, 20,000 kWh per annum)
In relation to gas, Aurora Energy and Tas Gas Retail’s rates remain unchanged since April 2020. Chart 104 below shows annual gas bills for Aurora and Tas Gas Retail as of April 2020, October 2020 and April 2021.
105 These offers were collected on the 15th of April 2021 and it should be noted that retailers may change their rates at any time. 106 Future X Power did not have any offers in April 2020.

Analysis of small business retail energy bills in Australia 77
$3,000
$3,250
$3,500
$3,750
$4,000
$4,250
$4,500
$4,750
$5,000
Apr-20 Oct-20 Apr-21
Annu
al b
ill ($
)
Aurora Tas Gas
CHART 104 | Annual gas bills from April 2020, October 2020 and April 2021 in Tasmania. Annual bills based on 100 GJ per annum and GST inclusive

78
$4,000
$4,250
$4,500
$4,750
$5,000
$5,250
$5,500
$5,750
$6,000
$6,250
$6,500
$6,750
$7,000
1 2 3 4 5 6 7
$ pe
r ann
um
4.6 Australian Capital Territory (ACT)
Electricity retail prices in the ACT continue to be regulated by the Independent Competition and Regulatory Commission (ICRC) while gas retail prices have been deregulated since 2002. The regulated electricity rates are currently the same as ActewAGL’s electricity standing offer.
The ACT is comprised of a single electricity network and a single gas pricing zone.107 ActewAGL is the incumbent retailer.
4.6.1 ACT electricity bills April 2021
The bill analysis presented in this report is based on SMEs using 20,000 kWh per annum on a single rate tariff. Research published by AEMO108 shows that small businesses, on average (across the NEM network areas), use approximately 20,000 kWh per annum and we use this average instead of network specific consumption profiles to readily enable comparison between network areas and jurisdictions. According to the AEMO report, average consumption for a small business in the Evoenergy network is 32,257 kWh per annum. We also note that the workbooks accompanying this report allow users to nominate their own consumption levels as well as undertaking analysis of different tariff types (2-rate tariffs, time of use tariffs etc.). The workbooks are available at: https://energyconsumersaustralia.com.au/publications/our-research. The price-spreadThe typical annual bill for SMEs consuming 20,000 kWh per annum (single rate) is approximately $5,730.109 Chart 105 shows annual bills for seven retailers in the Evoenergy distribution network and that the maximum price-spread is $740 per annum. Compared to six months ago (October 2020), the maximum price-spread has decreased slightly (by $20).
CHART 105 | The price-spread in the ACT’s Evoenergy distribution network. Annual bills based on market offers as of April 2021 (including guaranteed discounts and pay on time discounts), 20,000 kWh per annum, single rate and GST inclusive
Figure 25 below ranks the retail offers from lowest to highest annual bills.110 The lowest annual retail bill has remained unchanged since October 2020.
107 Evoenergy, formerly known as ActewAGL, is the electricity network and gas distributor while the retail arm continues to operate as ActewAGL.108 Jacobs Australia, Retail electricity price history and project trends, AEMO, 21 September 2017 109 See appendix A for a list of retail offers included in this analysis. Many retailers have more than one market offer and the rates, conditions, size of discounts as well as discount types (e.g. guaranteed or conditional) may vary between their offers.110 These market offers were collected on the 18th of April 2021 and it should be noted that retailers may change their rates at any time. Additional discounts for customers choosing to pay by direct debit are not included in these bill calculations.

Analysis of small business retail energy bills in Australia 79
FIGURE 25 | Lowest to highest annual bills (incl GST) for market offers in ACT’s Evoenergy (formerly ActewAGL) (April 2021). ls including guaranteed discounts and pay on time discounts - SMEs consuming 20,000kWh per annum (single rate)
Powerclub $5,293
$5,514Next Business Energy
$5,590Energy Locals
$5,853ActewAGL
$5,860EnergyAustralia
$5,970Origin Energy
$6,033Red Energy
$2,000$2,500$3,000$3,500$4,000$4,500$5,000$5,500$6,000
$6,500$7,000
ActewAGL
EnergyA
ustral
ia
Origin Ener
gy
Next Busi
ness Energ
y
Powerclub
Red Energ
y
Energy L
ocals
$ pe
r ann
um
Rates only Guaranteed Conditional
Additional discountsThree retailers, ActewAGL, Energy Australia and Origin Energy, offer guaranteed discounts and none of the retailers currently offer conditional pay on time discounts. Chart 106 shows annual bills based on their rates only, inclusive of guaranteed discounts and inclusive of guaranteed as well as conditional pay on time discounts.111
CHART 106 | Annual bills based on rates, guaranteed discounts and pay on time discounts in the ACT (Evoenergy). Annual bills based on market offers as of April 2021, 20,000 kWh per annum, single rate and GST inclusive
Network charges The ACT electricity network, Evoenergy, introduces new Network Use of System (NUOS) charges as of 1 July every year. These NUOS charges are approved by the Australian Energy Regulator (AER) and comprise Transmission Use of System (TUOS) and Distribution Use of System (DUOS) as well as other costs such as jurisdictional charges and metering charges. The retailers can, and generally will, build changes to the NUOS (in relation to both shape and price) into their retail tariffs.
The chart presented in this section shows that the NUOS proportion of bills varies slightly between retail offers. The NUOS proportion of the bill for Powerclub is 49.9% while the NUOS comprises 43.7% of the total bill for Red Energy customers.
111 Origin Energy’s discount is applied to amounts inclusive of GST while all other discounts are applied to amounts exclusive of GST.

80
0.0
20.0
40.0
60.0
80.0
100.0
$2,000
$2,500
$3,000
$3,500
$4,000
$4,500
$5,000
$5,500
$6,000
$6,500
Powerclub
Next Busi
ness Energ
y
Energy L
ocals
ActewAGL
EnergyA
ustral
ia
Origin Ener
gy
Red Energ
y
% o
f bill
$ pe
r ann
um
Total bill (incl GST) NUOS proportion
$2,000
$2,500
$3,000
$3,500
$4,000
1 2 3 4
$ pe
r ann
um
Chart 107 shows annual retail bills (columns) and NUOS as proportion of annual bill (line).
CHART 107 | Evoenergy: Annual retail bills (incl. GST) and NUOS as proportion of total bill, April 2021. Based on retail market offers (including guaranteed and pay on time discounts), single rate, 20,000 kWh per annum112
4.6.2 ACT gas bills April 2021
To calculate annual gas bills we have assumed an annual consumption pf 100 GJ per annum and a flat consumption over the year (25 GJ per quarter or 16.66 GJ per bi-monthly bill). Small businesses using gas for heating purposes are unlikely to have a flat consumption profile.
The price-spreadThe typical annual market offer bill for SMEs consuming 100 GJ per annum is $3,060 (including discounts). Chart 108 shows annual bills for four retailers in the ACT and that the maximum price-spread is approximately $460 per annum.113 Compared to six months ago (October 2020), the maximum price-spread has decreased by $460.
CHART 108 | The price-spread in the ACT. Annual bills based on market offers as of April 2021 (including guaranteed discounts and pay on time discounts), 100 GJ per annum and GST inclusive
112 Based on market offer rates as of April 2021, presented as annual bills for SMEs using 20,000kWh per annum (single rate). The annual NUOS charges are based on the Evoenergy’s charges for the 2020/21 financial year. The NUOS also includes fixed charges. 113 See appendix A for a list of retail offers included in this analysis. Many retailers have more than one market offer and the rates, conditions, size of discounts as well as discount types (e.g. guaranteed or conditional) may vary between their offers
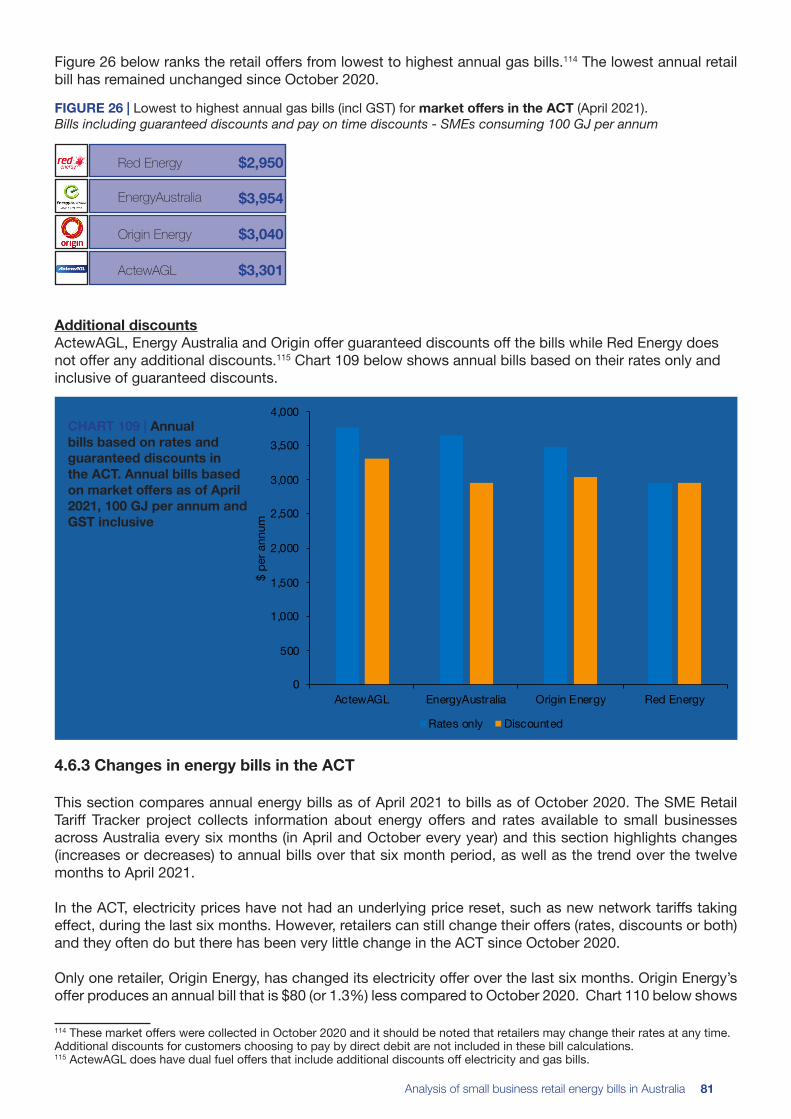
Analysis of small business retail energy bills in Australia 81
Figure 26 below ranks the retail offers from lowest to highest annual gas bills.114 The lowest annual retail bill has remained unchanged since October 2020.
Additional discountsActewAGL, Energy Australia and Origin offer guaranteed discounts off the bills while Red Energy does not offer any additional discounts.115 Chart 109 below shows annual bills based on their rates only and inclusive of guaranteed discounts.
CHART 109 | Annual bills based on rates and guaranteed discounts in the ACT. Annual bills based on market offers as of April 2021, 100 GJ per annum and GST inclusive
4.6.3 Changes in energy bills in the ACT
This section compares annual energy bills as of April 2021 to bills as of October 2020. The SME Retail Tariff Tracker project collects information about energy offers and rates available to small businesses across Australia every six months (in April and October every year) and this section highlights changes (increases or decreases) to annual bills over that six month period, as well as the trend over the twelve months to April 2021.
In the ACT, electricity prices have not had an underlying price reset, such as new network tariffs taking effect, during the last six months. However, retailers can still change their offers (rates, discounts or both) and they often do but there has been very little change in the ACT since October 2020.
Only one retailer, Origin Energy, has changed its electricity offer over the last six months. Origin Energy’s offer produces an annual bill that is $80 (or 1.3%) less compared to October 2020. Chart 110 below shows
114 These market offers were collected in October 2020 and it should be noted that retailers may change their rates at any time. Additional discounts for customers choosing to pay by direct debit are not included in these bill calculations. 115 ActewAGL does have dual fuel offers that include additional discounts off electricity and gas bills.
FIGURE 26 | Lowest to highest annual gas bills (incl GST) for market offers in the ACT (April 2021). Bills including guaranteed discounts and pay on time discounts - SMEs consuming 100 GJ per annum
$2,950Red Energy
$3,954EnergyAustralia
$3,040Origin Energy
$3,301ActewAGL
0
500
1,000
1,500
2,000
2,500
3,000
3,500
4,000
ActewAGL EnergyAustralia Origin Energy Red Energy
$ pe
r ann
um
Rates only Discounted

82
$2,000
$2,500
$3,000
$3,500
$4,000
$4,500
$5,000
$5,500
$6,000
$6,500
ActewAGL
EnergyA
ustral
ia
Origin Ener
gy
Next Busi
ness Energ
y
Powerclub
Red Energ
y
Energy L
ocals
$ pe
r ann
um
Apr-20 Oct-20 Apr-21
0
500
1,000
1,500
2,000
2,500
3,000
3,500
4,000
ActewAGL EnergyAustralia Origin Energy Red Energy
$ pe
r ann
um
Apr-20 Oct-20 Apr-21
annual electricity bills for retailers operating in the ACT as of April 2020, October 2020 and April 2021.
CHART 110 | Comparison of April 2020, October 2020 and April 2021 annual electricity bills including guaranteed discounts and pay on time discounts in the ACT (Evoenergy). Annual bills based on market offers as of April 2020, October 2020 and April 2021, 20,000 kWh per annum, single rate and GST inclusive
In relation to gas, Energy Australia’s prices have remained unchanged between October 2020 and April 2021 while Origin Energy’s prices have increased by $20 (or 1%). Red Energy and ActewAGL’s offers, on the other hand, have decreased by 8% and 12% respectively. Chart 111 below shows annual gas bills for customers using 100 GJ per annum as of April 2020, October 2020 and April 2021.116
CHART 111 | Comparison of April 2020, October 2020 and April 2021 annual gas bills including guaranteed discounts and pay on time discounts in the ACT (Evoenergy). Annual bills based on market offers as of April 2020, October 2020 and April 2021, 100 GJ per annum and GST inclusive
116 Red Energy did not have offers in April 2020 and ActewAGL’s bill reduction is due to the non-conditional discount now being available rather than any changes to their rates.

Analysis of small business retail energy bills in Australia 83
3,000
3,500
4,000
4,500
5,000
5,500
6,000
6,500
7,000
NT WA
$ pe
r ann
um
4.7 Western Australia and Northern Territory
Electricity prices remain regulated in Western Australia and the Northern Territory. In Western Australia the Minister for Energy also determines a maximum price cap for gas prices.117
The Northern Territory has a single electricity network (the Power and Water Corporation) and Jacana Energy is the retailer. In Western Australia there are two electricity networks: Horizon Power and Western Power. Western Power supplies the South West Interconnected System (SWIS) while Horizon Power supplies northern areas and remote communities. In the SWIS area, Synergy is the main retailer but the regulated retail price is the same for customers across Western Australia. In relation to gas, Western Australia has three pricing zones. The main pricing zone covers the South West and two smaller pricing zones cover Albany and Kalgoorlie.
The bill analysis presented in this report is based on SMEs using 20,000 kWh per annum on a single rate tariff. Research published by AEMO118 shows that small businesses, on average (across the NEM network areas), use approximately 20,000 kWh per annum and we use this average instead of network specific consumption profiles to readily enable comparison between network areas and jurisdictions. The AEMO report does not cover WA and NT, but average consumption levels in the most comparable networks of Energex and South Australia Power Networks are 16,678 kWh/annum and 14,262 kWh/annum respectively. We also note that the workbooks accompanying this report allow users to nominate their own consumption levels as well as undertaking analysis of different tariff types (2-rate tariffs, time of use tariffs etc.). The workbooks are available at: https://energyconsumersaustralia.com.au/publications/our-research.
4.7.1 Western Australia and Northern Territory electricity bills April 2021
SMEs using 20,000 kWh per annum (single rate) in the Northern Territory will have an annual bill of $6,355 while Western Australian businesses will have a bill of around $6,415.
CHART 112 | Annual bills for the single rate tariff in the Northern Territory and Western Australia. Annual bills based on regulated offers as of April 2021, 20,000 kWh per annum and GST inclusive
4.7.2 Western Australian gas bills April 2021
To calculate annual gas bills we have assumed an annual consumption of 100 GJ per annum and a flat consumption over the year (25 GJ per quarter or 16.66 GJ per bi-monthly bill). Small businesses using gas for heating purposes are unlikely to have a flat consumption profile.
117 There are no reticulated gas offers for small business customers in the Northern Territory.118 Jacobs Australia, Retail electricity price history and project trends, AEMO, 21 September 2017

84
Chart 113 below shows annual bills for gas customers in the South West (Perth region). While all three retailers have the same base rates for gas consumption, the daily supply charge and additional discounts vary.119 Alinta does not offer an additional discount while AGL and Origin offer 45% and 32% off usage charges during the benefit period. A small business on Alinta’s offer can save approximately $1,730 per annum by switching to AGL’s offer.
CHART 113 | Annual bills for gas customers the South West (Perth region). Annual bills based on Market offers as of April 2021, 100 GJ per annum and GST inclusive.120
Figure 27 below ranks the retail offers from lowest to highest annual gas bills.121
Alinta also offers gas retail contracts to SMEs in the Albany and Kalgoorlie pricing zones. Chart 114 below shows that the annual bill for a small business using 100 GJ per annum in Albany will pay approximately $4,955 per annum and customers in Karlgoorlie will pay around $3,735.
119 Western Australia uses a unit price for gas and 1 unit equals 3.6 MJ. All bill analysis for WA in this report has converted the unit price to the price per MJ. Kleenheat also offers gas contracts to small businesses in WA but as they do not post their business rates on their website (requesting a quote is necessary), we have not included Kleenheat in this analysis. 120 Alinta Energy and AGL’s supply charges are inclusive of a daily Account Administration Fee as of October 2018, April 2019, October 2019, April 2020, October 2020 and April 2021. In an earlier update (April 2018), only Alinta explicitly stated that an Account Administration Fee applies. Origin’s offers in WA do not mention this fee.121 These market offers were collected on the 15th of April 2021 and it should be noted that retailers may change their rates at any time. Additional discounts for customers choosing to pay by direct debit are not included in these bill calculations.
1,000
1,500
2,000
2,500
3,000
3,500
4,000
4,500
AGL Origin Energy Alinta
$ pe
r ann
um
FIGURE 27 | Lowest to highest annual gas bills (incl GST) for market offers in Western Australia, April 2021. Bills including guaranteed discounts and pay on time discounts - SMEs consuming 100 GJ per annum
$2,256AGL
$2,680Origin Energy
$3,987Alinta Energy

Analysis of small business retail energy bills in Australia 85
0
1,000
2,000
3,000
4,000
5,000
6,000
Albany Kalgoorlie
$ pe
r ann
um
3,000
3,500
4,000
4,500
5,000
5,500
6,000
6,500
7,000
Apr-20 Oct-20 Apr-21
$ pe
r ann
um
NT WA
CHART 114 | Annual bills for gas customers in Alinta and Kargoorlie. Annual bills based on Alinta’s standard tariff as of April 2021, 100 GJ per annum and GST inclusive
4.7.3 Changes in energy bills in WA and NT
This section compares annual energy bills as of October 2020 to annual energy bills as of April 2021. The SME Retail Tariff Tracker project collects information about energy offers and rates available to small businesses across Australia every six months (in April and October every year) and this section highlights changes (increases or decreases) to annual bills over that six month period, as well as the trend over the twelve months to October 2020.
In the Northern Territory and Western Australia, electricity prices have not had an underlying price reset, such as new network tariffs taking effect, during the last six months and there have been no changes to the electricity retail offers.
Chart 115 below shows annual electricity bills for the regulated offer in the Northern Territory and Western Australia as of April 2020, October 2020 and April 2021.
CHART 115 | Annual electricity bills in the Northern Territory and Western Australia in April 2020, October 2020 and April 2021. Annual bills based on regulated offers as of April 2020, October 2020 and April 2021, 20,000 kWh per annum, single rate and GST inclusive

86
2,000
2,500
3,000
3,500
4,000
4,500
5,000
5,500
South West Albany Kalgoorlie
$ pe
r ann
um
Apr-20 Oct-20 Apr-21
Alinta Energy’s gas prices have remained unchanged for one and a half year (since October 2019). Chart 116 below shows Alinta Energy’s annual gas bills in Western Australia as of April 2020, October 2020 and April 2021.122
CHART 116 | Comparison of April 2020, October 2020 and April 2021 annual gas bills in Western Australia. Annual bills based on Alinta’s offers as of April 2020, October 2020 and April 2021, 100 GJ per annum and GST inclusive
122 This is based on Alinta Energy’s offers only.

State DB Meter type Retailer Name Guaranteed discount on bill (%)
Guaranteed discount on usage (%)
POT discount on bill (%)
POT discount on usage (%)
NSW Ausgrid Single AGL Business Essentials 0 0 0 0
NSW Ausgrid Single CovaU Freedom Plus 30 0 0 0
NSW Ausgrid Single Diamond Energy Renewable Saver POT 0 0 7 0
NSW Ausgrid Single EnergyAustralia Total Plan 21 0 0 0
NSW Ausgrid Single Next Business Energy Assured 0 0 0 0
NSW Ausgrid Single Momentum Energy SmilePower Flexi 0 0 0 0
NSW Ausgrid Single Origin Energy Flexi 0 14 0 0
NSW Ausgrid Single Powerdirect Business Rate Saver 0 0 0 0
NSW Ausgrid Single Powershop Shopper with Mega Pack 0 0 6 0
NSW Ausgrid Single Red Energy Red Business Saver 0 0 0 0
NSW Ausgrid Single Simply Energy Business Saver 21 0 0 0
NSW Ausgrid Single Energy Locals Business Member 0 0 0 0
NSW Ausgrid Single 1st Energy 1st Saver Plus 15 0 10 0
NSW Ausgrid Single Alinta Energy BusinessDeal 0 0 0 0
NSW Ausgrid Single Blue NRG Blue Saver 0 0 0 0
NSW Ausgrid Single Powerclub Bis Flat 0 0 0 0
NSW Ausgrid Single Future X Power Business Smart 0 0 0 0
NSW Ausgrid Single Tango Energy Business Select 0 0 0 0
NSW Ausgrid Single Enova Energy Business Economy Plus 0 0 0 3
NSW Ausgrid Single Bright Spark Power Business 12 Months 0 0 0 0
NSW Ausgrid Single Discover Energy Business Smart Saver 0 23 0 0
NSW Ausgrid Single Electricity in a Box Biz Anytime 0 0 0 0
NSW Ausgrid Single Glow Power Saver 0 0 0 0
NSW Ausgrid Single Locality Planning Energy Principal Offer 0 0 0 0
NSW Ausgrid Single QEnergy Biz your Way 0 0 0 0
Appendix A - List of energy offers used in the analysis
Electricity offers for April 2021 bill analysis:

State DB Meter type Retailer Name Guaranteed discount on bill (%)
Guaranteed discount on usage (%)
POT discount on bill (%)
POT discount on usage (%)
NSW Ausgrid Single Radian Energy GTG Business Anytime 0 0 0 0
NSW Ausgrid Single ReAmped Energy ReAmped Business 0 0 0 0
NSW Ausgrid Single Sumo Power Business Freedom 0 0 0 0
NSW Ausgrid Single Arc Energy Group Business 0 0 0 22
NSW Ausgrid Controlled AGL Business Essentials 0 0 0 0
NSW Ausgrid Controlled CovaU Freedom Plus 30 0 0 0
NSW Ausgrid Controlled Diamond Energy Renewable Saver POT 0 0 7 0
NSW Ausgrid Controlled EnergyAustralia Total Plan 21 0 0 0
NSW Ausgrid Controlled Momentum Energy SmilePower Flexi 0 0 0 0
NSW Ausgrid Controlled Origin Energy Flexi 0 14 0 0
NSW Ausgrid Controlled Powerdirect Business Rate Saver 0 0 0 0
NSW Ausgrid Controlled Powershop Shopper with Mega Pack 0 0 6 0
NSW Ausgrid Controlled Red Energy Red Business Saver 0 0 0 0
NSW Ausgrid Controlled Simply Energy Business Saver 21 0 0 0
NSW Ausgrid Controlled Energy Locals Business Member 0 0 0 0
NSW Ausgrid Controlled 1st Energy 1st Saver Plus 15 0 10 0
NSW Ausgrid Controlled Alinta Energy BusinessDeal 0 0 0 0
NSW Ausgrid Controlled Blue NRG Blue Saver 0 0 0 0
NSW Ausgrid Controlled Future X Power Business Smart 0 0 0 0
NSW Ausgrid Controlled Tango Energy Business Select 0 0 0 0
NSW Ausgrid Controlled Enova Energy Business Economy Plus 0 0 0 3
NSW Ausgrid Controlled Discover Energy Business Smart Saver 0 23 0 0
NSW Ausgrid Controlled Glow Power Saver 0 0 0 0
NSW Ausgrid Controlled Locality Planning Energy Principal Offer 0 0 0 0
NSW Ausgrid Controlled ReAmped Energy ReAmped Business 0 0 0 0
NSW Ausgrid Controlled Sumo Power Business Freedom 0 0 0 0
NSW Ausgrid Controlled Bright Spark Power Business 12 Months 0 0 0 0
NSW Ausgrid TOU AGL Business Essentials 0 0 0 0
NSW Ausgrid TOU Diamond Energy Renewable Saver POT 0 0 7 0
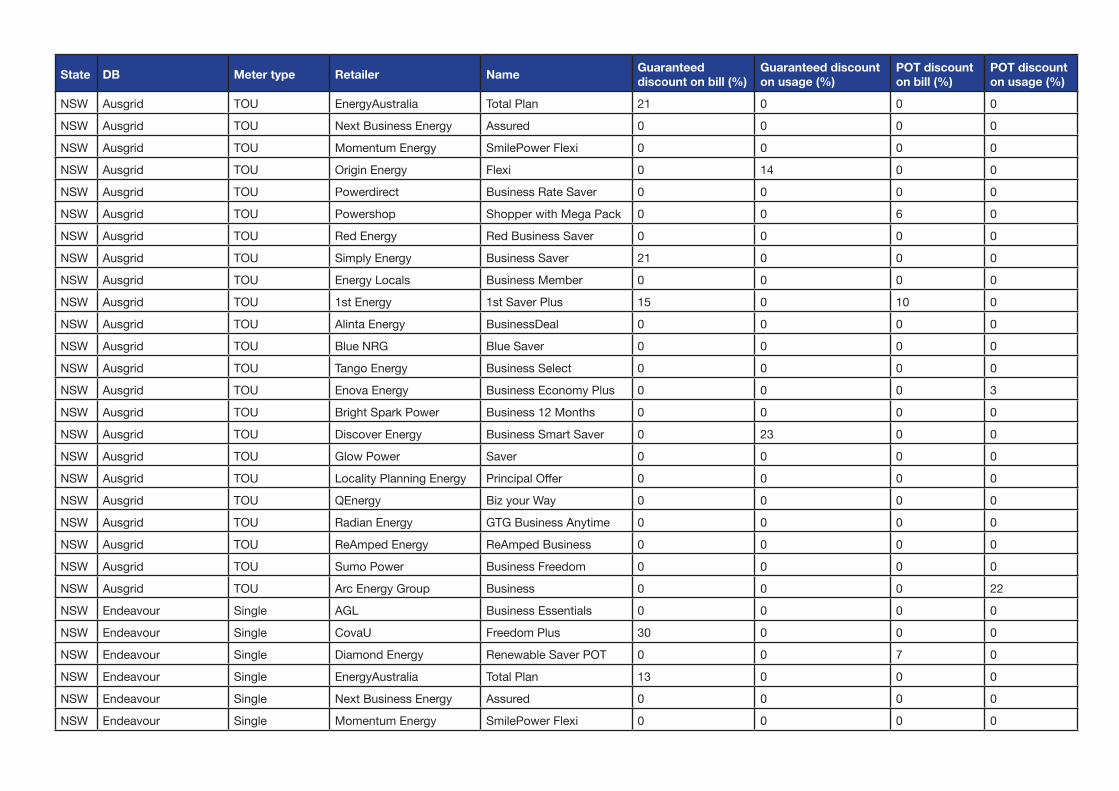
State DB Meter type Retailer Name Guaranteed discount on bill (%)
Guaranteed discount on usage (%)
POT discount on bill (%)
POT discount on usage (%)
NSW Ausgrid TOU EnergyAustralia Total Plan 21 0 0 0
NSW Ausgrid TOU Next Business Energy Assured 0 0 0 0
NSW Ausgrid TOU Momentum Energy SmilePower Flexi 0 0 0 0
NSW Ausgrid TOU Origin Energy Flexi 0 14 0 0
NSW Ausgrid TOU Powerdirect Business Rate Saver 0 0 0 0
NSW Ausgrid TOU Powershop Shopper with Mega Pack 0 0 6 0
NSW Ausgrid TOU Red Energy Red Business Saver 0 0 0 0
NSW Ausgrid TOU Simply Energy Business Saver 21 0 0 0
NSW Ausgrid TOU Energy Locals Business Member 0 0 0 0
NSW Ausgrid TOU 1st Energy 1st Saver Plus 15 0 10 0
NSW Ausgrid TOU Alinta Energy BusinessDeal 0 0 0 0
NSW Ausgrid TOU Blue NRG Blue Saver 0 0 0 0
NSW Ausgrid TOU Tango Energy Business Select 0 0 0 0
NSW Ausgrid TOU Enova Energy Business Economy Plus 0 0 0 3
NSW Ausgrid TOU Bright Spark Power Business 12 Months 0 0 0 0
NSW Ausgrid TOU Discover Energy Business Smart Saver 0 23 0 0
NSW Ausgrid TOU Glow Power Saver 0 0 0 0
NSW Ausgrid TOU Locality Planning Energy Principal Offer 0 0 0 0
NSW Ausgrid TOU QEnergy Biz your Way 0 0 0 0
NSW Ausgrid TOU Radian Energy GTG Business Anytime 0 0 0 0
NSW Ausgrid TOU ReAmped Energy ReAmped Business 0 0 0 0
NSW Ausgrid TOU Sumo Power Business Freedom 0 0 0 0
NSW Ausgrid TOU Arc Energy Group Business 0 0 0 22
NSW Endeavour Single AGL Business Essentials 0 0 0 0
NSW Endeavour Single CovaU Freedom Plus 30 0 0 0
NSW Endeavour Single Diamond Energy Renewable Saver POT 0 0 7 0
NSW Endeavour Single EnergyAustralia Total Plan 13 0 0 0
NSW Endeavour Single Next Business Energy Assured 0 0 0 0
NSW Endeavour Single Momentum Energy SmilePower Flexi 0 0 0 0

State DB Meter type Retailer Name Guaranteed discount on bill (%)
Guaranteed discount on usage (%)
POT discount on bill (%)
POT discount on usage (%)
NSW Endeavour Single Origin Energy Flexi 0 14 0 0
NSW Endeavour Single Powerdirect Business Rate Saver 0 0 0 0
NSW Endeavour Single Powershop Shopper with Mega Pack 0 0 6 0
NSW Endeavour Single Red Energy Red Business Saver 0 0 0 0
NSW Endeavour Single Simply Energy Business Saver 21 0 0 0
NSW Endeavour Single Energy Locals Business Member 0 0 0 0
NSW Endeavour Single 1st Energy 1st Saver 5 0 10 0
NSW Endeavour Single Alinta Energy BusinessDeal 0 0 0 0
NSW Endeavour Single Blue NRG Blue Saver 0 0 0 0
NSW Endeavour Single Powerclub Bis Flat 0 0 0 0
NSW Endeavour Single Future X Power Business Smart 0 0 0 0
NSW Endeavour Single Tango Energy Business Select 0 0 0 0
NSW Endeavour Single Enova Energy Business Economy Plus 0 0 0 3
NSW Endeavour Single Bright Spark Power Business 12 Months 0 0 0 0
NSW Endeavour Single Discover Energy Business Smart Saver 0 18 0 0
NSW Endeavour Single Glow Power Saver 0 0 0 0
NSW Endeavour Single Locality Planning Energy Principal Offer 0 0 0 0
NSW Endeavour Single QEnergy Biz your Way 0 0 0 0
NSW Endeavour Single Radian Energy GTG Business Anytime 0 0 0 0
NSW Endeavour Single ReAmped Energy ReAmped Business 0 0 0 0
NSW Endeavour Single Sumo Power Business Freedom 0 0 0 0
NSW Endeavour Single Arc Energy Group Business 0 0 0 13
NSW Endeavour Controlled AGL Business Essentials 0 0 0 0
NSW Endeavour Controlled CovaU Freedom Plus 30 0 0 0
NSW Endeavour Controlled Diamond Energy Renewable Saver POT 0 0 7 0
NSW Endeavour Controlled EnergyAustralia Total Plan 13 0 0 0
NSW Endeavour Controlled Momentum Energy SmilePower Flexi 0 0 0 0
NSW Endeavour Controlled Origin Energy Flexi 0 14 0 0
NSW Endeavour Controlled Powerdirect Business Rate Saver 0 0 0 0
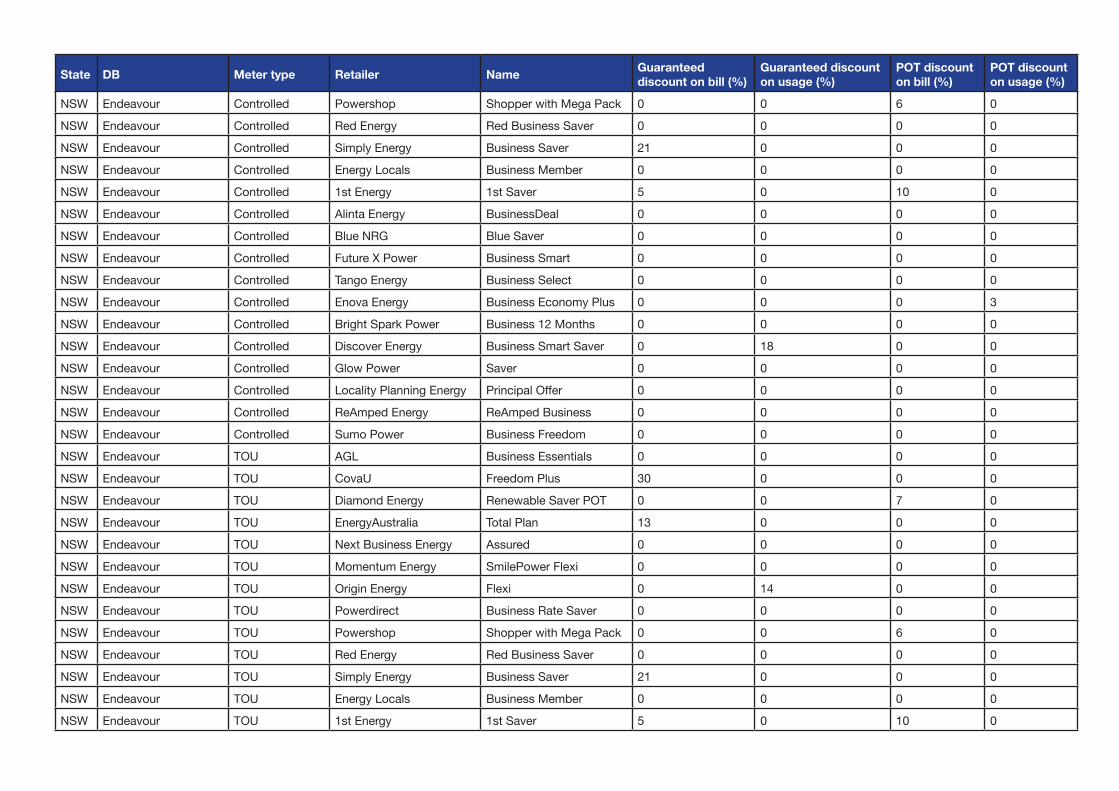
State DB Meter type Retailer Name Guaranteed discount on bill (%)
Guaranteed discount on usage (%)
POT discount on bill (%)
POT discount on usage (%)
NSW Endeavour Controlled Powershop Shopper with Mega Pack 0 0 6 0
NSW Endeavour Controlled Red Energy Red Business Saver 0 0 0 0
NSW Endeavour Controlled Simply Energy Business Saver 21 0 0 0
NSW Endeavour Controlled Energy Locals Business Member 0 0 0 0
NSW Endeavour Controlled 1st Energy 1st Saver 5 0 10 0
NSW Endeavour Controlled Alinta Energy BusinessDeal 0 0 0 0
NSW Endeavour Controlled Blue NRG Blue Saver 0 0 0 0
NSW Endeavour Controlled Future X Power Business Smart 0 0 0 0
NSW Endeavour Controlled Tango Energy Business Select 0 0 0 0
NSW Endeavour Controlled Enova Energy Business Economy Plus 0 0 0 3
NSW Endeavour Controlled Bright Spark Power Business 12 Months 0 0 0 0
NSW Endeavour Controlled Discover Energy Business Smart Saver 0 18 0 0
NSW Endeavour Controlled Glow Power Saver 0 0 0 0
NSW Endeavour Controlled Locality Planning Energy Principal Offer 0 0 0 0
NSW Endeavour Controlled ReAmped Energy ReAmped Business 0 0 0 0
NSW Endeavour Controlled Sumo Power Business Freedom 0 0 0 0
NSW Endeavour TOU AGL Business Essentials 0 0 0 0
NSW Endeavour TOU CovaU Freedom Plus 30 0 0 0
NSW Endeavour TOU Diamond Energy Renewable Saver POT 0 0 7 0
NSW Endeavour TOU EnergyAustralia Total Plan 13 0 0 0
NSW Endeavour TOU Next Business Energy Assured 0 0 0 0
NSW Endeavour TOU Momentum Energy SmilePower Flexi 0 0 0 0
NSW Endeavour TOU Origin Energy Flexi 0 14 0 0
NSW Endeavour TOU Powerdirect Business Rate Saver 0 0 0 0
NSW Endeavour TOU Powershop Shopper with Mega Pack 0 0 6 0
NSW Endeavour TOU Red Energy Red Business Saver 0 0 0 0
NSW Endeavour TOU Simply Energy Business Saver 21 0 0 0
NSW Endeavour TOU Energy Locals Business Member 0 0 0 0
NSW Endeavour TOU 1st Energy 1st Saver 5 0 10 0

State DB Meter type Retailer Name Guaranteed discount on bill (%)
Guaranteed discount on usage (%)
POT discount on bill (%)
POT discount on usage (%)
NSW Endeavour TOU Alinta Energy BusinessDeal 0 0 0 0
NSW Endeavour TOU Blue NRG Blue Saver 0 0 0 0
NSW Endeavour TOU Tango Energy Business Select 0 0 0 0
NSW Endeavour TOU Enova Energy Business Economy Plus 0 0 0 3
NSW Endeavour TOU Discover Energy Business Smart Saver 0 18 0 0
NSW Endeavour TOU Glow Power Saver 0 0 0 0
NSW Endeavour TOU QEnergy Biz your Way 0 0 0 0
NSW Endeavour TOU Radian Energy GTG Business Anytime 0 0 0 0
NSW Endeavour TOU ReAmped Energy ReAmped Business 0 0 0 0
NSW Endeavour TOU Sumo Power Business Freedom 0 0 0 0
NSW Endeavour TOU Arc Energy Group Business 0 0 0 13
NSW Essential Energy Single AGL Business Essentials 0 0 0 0
NSW Essential Energy Single CovaU Freedom Plus 30 0 0 0
NSW Essential Energy Single Diamond Energy Renewable Saver POT 0 0 7 0
NSW Essential Energy Single EnergyAustralia Total Plan 18 0 0 0
NSW Essential Energy Single Next Business Energy Assured 0 0 0 0
NSW Essential Energy Single Momentum Energy SmilePower Flexi 0 0 0 0
NSW Essential Energy Single Origin Energy Flexi 0 14 0 0
NSW Essential Energy Single Powerdirect Business Rate Saver 0 0 0 0
NSW Essential Energy Single Powershop Shopper with Mega Pack 0 0 6 0
NSW Essential Energy Single Red Energy Red Business Saver 0 0 0 0
NSW Essential Energy Single Simply Energy Business Saver 21 0 0 0
NSW Essential Energy Single Energy Locals Business Member 0 0 0 0
NSW Essential Energy Single 1st Energy 1st Saver Plus 10 0 10 0
NSW Essential Energy Single Alinta Energy BusinessDeal 0 0 0 0
NSW Essential Energy Single Powerclub Bis Flat 0 0 0 0
NSW Essential Energy Single Future X Power Business Smart 0 0 0 0
NSW Essential Energy Single Tango Energy Business Select 0 0 0 0
NSW Essential Energy Single Enova Energy Business Economy Plus 0 0 0 3
92

93
State DB Meter type Retailer Name Guaranteed discount on bill (%)
Guaranteed discount on usage (%)
POT discount on bill (%)
POT discount on usage (%)
NSW Essential Energy Single Bright Spark Power Business 12 Months 0 0 0 0
NSW Essential Energy Single Discover Energy Business Smart Saver 0 18 0 0
NSW Essential Energy Single Glow Power Saver 0 0 0 0
NSW Essential Energy Single Locality Planning Energy Principal Offer 0 0 0 0
NSW Essential Energy Single QEnergy Biz your Way 0 0 0 0
NSW Essential Energy Single Radian Energy GTG Business Anytime 0 0 0 0
NSW Essential Energy Single ReAmped Energy ReAmped Business 0 0 0 0
NSW Essential Energy Controlled AGL Business Essentials 0 0 0 0
NSW Essential Energy Controlled CovaU Freedom Plus 30 0 0 0
NSW Essential Energy Controlled Diamond Energy Renewable Saver POT 0 0 7 0
NSW Essential Energy Controlled EnergyAustralia Total Plan 18 0 0 0
NSW Essential Energy Controlled Momentum Energy SmilePower Flexi 0 0 0 0
NSW Essential Energy Controlled Origin Energy Flexi 0 14 0 0
NSW Essential Energy Controlled Powerdirect Business Rate Saver 0 0 0 0
NSW Essential Energy Controlled Powershop Shopper with Mega Pack 0 0 6 0
NSW Essential Energy Controlled Red Energy Red Business Saver 0 0 0 0
NSW Essential Energy Controlled Simply Energy Business Saver 21 0 0 0
NSW Essential Energy Controlled Energy Locals Business Member 0 0 0 0
NSW Essential Energy Controlled 1st Energy 1st Saver Plus 10 0 10 0
NSW Essential Energy Controlled Alinta Energy BusinessDeal 0 0 0 0
NSW Essential Energy Controlled Future X Power Business Smart 0 0 0 0
NSW Essential Energy Controlled Tango Energy Business Select 0 0 0 0
NSW Essential Energy Controlled Enova Energy Business Economy Plus 0 0 0 3
NSW Essential Energy Controlled Bright Spark Power Business 12 Months 0 0 0 0
NSW Essential Energy Controlled Discover Energy Business Smart Saver 0 18 0 0
NSW Essential Energy Controlled Glow Power Saver 0 0 0 0
NSW Essential Energy Controlled Locality Planning Energy Principal Offer 0 0 0 0
NSW Essential Energy Controlled ReAmped Energy ReAmped Business 0 0 0 0
NSW Essential Energy TOU AGL Business Essentials 0 0 0 0

94
State DB Meter type Retailer Name Guaranteed discount on bill (%)
Guaranteed discount on usage (%)
POT discount on bill (%)
POT discount on usage (%)
NSW Essential Energy TOU CovaU Freedom Plus 0 30 0 0
NSW Essential Energy TOU Diamond Energy Renewable Saver POT 0 0 7 0
NSW Essential Energy TOU EnergyAustralia Total Plan 18 0 0 0
NSW Essential Energy TOU Next Business Energy Assured 0 0 0 0
NSW Essential Energy TOU Origin Energy Flexi 0 14 0 0
NSW Essential Energy TOU Powerdirect Business Rate Saver 0 0 0 0
NSW Essential Energy TOU Powershop Shopper with Mega Pack 0 0 6 0
NSW Essential Energy TOU Red Energy Red Business Saver 0 0 0 0
NSW Essential Energy TOU Simply Energy Business Saver 21 0 0 0
NSW Essential Energy TOU Energy Locals Business Member 0 0 0 0
NSW Essential Energy TOU 1st Energy 1st Saver Plus 10 0 10 0
NSW Essential Energy TOU Alinta Energy BusinessDeal 0 0 0 0
NSW Essential Energy TOU Tango Energy Business Select 0 0 0 0
NSW Essential Energy TOU Enova Energy Business Economy Plus 0 0 0 3
NSW Essential Energy TOU Bright Spark Power Business 12 Months 0 0 0 0
NSW Essential Energy TOU Discover Energy Business Smart Saver 0 18 0 0
NSW Essential Energy TOU Glow Power Saver 0 0 0 0
NSW Essential Energy TOU Locality Planning Energy Principal Offer 0 0 0 0
NSW Essential Energy TOU Radian Energy GTG Business Anytime 0 0 0 0
NSW Essential Energy TOU ReAmped Energy ReAmped Business 0 0 0 0
VIC CitiPower Single AGL Business Essentials 0 0 0 0
VIC CitiPower Single Alinta Energy BusinessDeal 0 0 0 0
VIC CitiPower Single CovaU Super Saver 0 30 0 0
VIC CitiPower Single Diamond Energy Renewable Saver POT 0 0 3 0
VIC CitiPower Single EnergyAustralia Total Plan 5 0 0 0
VIC CitiPower Single GloBird Energy Biz VicSave 0 0 0 0
VIC CitiPower Single Lumo Energy Value 0 0 0 0
VIC CitiPower Single Momentum Energy SmilePower Flexi 0 0 0 0
VIC CitiPower Single Next Business Energy Market offer 0 0 0 0

95
State DB Meter type Retailer Name Guaranteed discount on bill (%)
Guaranteed discount on usage (%)
POT discount on bill (%)
POT discount on usage (%)
VIC CitiPower Single Origin Energy Basic 0 0 0 0
VIC CitiPower Single 1st Energy 1st Saver Plus 0 7 0 3
VIC CitiPower Single Powerdirect Rate Saver 0 0 0 0
VIC CitiPower Single Powershop Carbon Neutral 0 0 0 0
VIC CitiPower Single Red Energy Red Business Saver 0 0 0 0
VIC CitiPower Single Simply Energy Business Saver 10 0 0 0
VIC CitiPower Single Sumo Power Freedom 0 0 0 0
VIC CitiPower Single Blue NRG Blue Business Expert 0 0 0 0
VIC CitiPower Single Tango Energy Business Select 0 0 0 0
VIC CitiPower Single Powerclub Bis Flat 0 0 0 0
VIC CitiPower Single Energy Locals Business Saver 0 0 0 0
VIC CitiPower Single Q Energy Mini Me Biz 0 0 0 0
VIC CitiPower Single Available from all retailers VDO 0 0 0 0
VIC CitiPower Controlled AGL Business Essentials 0 0 0 0
VIC CitiPower Controlled Alinta Energy BusinessDeal 0 0 0 0
VIC CitiPower Controlled CovaU Super Saver 0 30 0 0
VIC CitiPower Controlled Diamond Energy Renewable Saver POT 0 0 3 0
VIC CitiPower Controlled EnergyAustralia Total Plan 5 0 0 0
VIC CitiPower Controlled GloBird Energy Biz VicSave 0 0 0 0
VIC CitiPower Controlled Lumo Energy Value 0 0 0 0
VIC CitiPower Controlled Momentum Energy SmilePower Flexi 0 0 0 0
VIC CitiPower Controlled Next Business Energy Market offer 0 0 0 0
VIC CitiPower Controlled Origin Energy Basic 0 0 0 0
VIC CitiPower Controlled 1st Energy 1st Saver Plus 0 7 0 3
VIC CitiPower Controlled Powerdirect Rate Saver 0 0 0 0
VIC CitiPower Controlled Powershop Carbon Neutral 0 0 0 0
VIC CitiPower Controlled Red Energy Red Business Saver 0 0 0 0
VIC CitiPower Controlled Simply Energy Business Saver 10 0 0 0
VIC CitiPower Controlled Sumo Power Freedom 0 0 0 0

96
State DB Meter type Retailer Name Guaranteed discount on bill (%)
Guaranteed discount on usage (%)
POT discount on bill (%)
POT discount on usage (%)
VIC CitiPower Controlled Energy Locals Business Saver 0 0 0 0
VIC CitiPower Controlled Q Energy Mini Me Biz 0 0 0 0
VIC CitiPower Two Rate AGL Business Essentials 0 0 0 0
VIC CitiPower Two Rate Alinta Energy BusinessDeal 0 0 0 0
VIC CitiPower Two Rate CovaU Super Saver 0 30 0 0
VIC CitiPower Two Rate Diamond Energy Renewable Saver POT 0 0 3 0
VIC CitiPower Two Rate EnergyAustralia Total Plan 5 0 0 0
VIC CitiPower Two Rate GloBird Energy Biz VicSave 0 0 0 0
VIC CitiPower Two Rate Lumo Energy Value 0 0 0 0
VIC CitiPower Two Rate Momentum Energy SmilePower Flexi 0 0 0 0
VIC CitiPower Two Rate Next Business Energy Market offer 0 0 0 0
VIC CitiPower Two Rate Origin Energy Basic 0 0 0 0
VIC CitiPower Two Rate 1st Energy 1st Saver Plus 0 7 0 3
VIC CitiPower Two Rate Powerdirect Rate Saver 0 0 0 0
VIC CitiPower Two Rate Powershop Carbon Neutral 0 0 0 0
VIC CitiPower Two Rate Red Energy Red Business Saver 0 0 0 0
VIC CitiPower Two Rate Simply Energy Business Saver 10 0 0 0
VIC CitiPower Two Rate Sumo Power Freedom 0 0 0 0
VIC CitiPower Two Rate Blue NRG Blue Business Expert 0 0 0 0
VIC CitiPower Two Rate Powerclub Bis Flex 0 0 0 0
VIC CitiPower Two Rate Energy Locals Business Saver 0 0 0 0
VIC CitiPower Two Rate Q Energy Mini Me Biz 0 0 0 0
VIC CitiPower TOU Alinta Energy BusinessDeal 0 0 0 0
VIC CitiPower TOU Momentum Energy SmilePower Flexi 0 0 0 0
VIC CitiPower TOU Red Energy Red Business Saver 0 0 0 0
VIC CitiPower TOU Blue NRG Blue Business Expert 0 0 0 0
VIC CitiPower TOU AGL Business Essentials 0 0 0 0
VIC CitiPower TOU Diamond Energy Renewable Saver POT 0 0 3 0
VIC CitiPower TOU Lumo Energy Value 0 0 0 0

97
State DB Meter type Retailer Name Guaranteed discount on bill (%)
Guaranteed discount on usage (%)
POT discount on bill (%)
POT discount on usage (%)
VIC CitiPower TOU Energy Locals Business Saver 0 0 0 0
VIC Powercor Single AGL Business Essentials 0 0 0 0
VIC Powercor Single Alinta Energy BusinessDeal 0 0 0 0
VIC Powercor Single CovaU Super Saver 0 30 0 0
VIC Powercor Single Diamond Energy Renewable Saver POT 0 0 3 0
VIC Powercor Single EnergyAustralia Total Plan 5 0 0 0
VIC Powercor Single GloBird Energy Biz VicSave 0 0 0 0
VIC Powercor Single Lumo Energy Value 0 0 0 0
VIC Powercor Single Momentum Energy SmilePower Flexi 0 0 0 0
VIC Powercor Single Next Business Energy Market offer 0 0 0 0
VIC Powercor Single Origin Energy Basic 0 0 0 0
VIC Powercor Single 1st Energy 1st Saver Plus 0 7 0 3
VIC Powercor Single Powerdirect Rate Saver 0 0 0 0
VIC Powercor Single Powershop Carbon Neutral 0 0 0 0
VIC Powercor Single Red Energy Red Business Saver 0 0 0 0
VIC Powercor Single Simply Energy Business Saver 10 0 0 0
VIC Powercor Single Sumo Power Freedom 0 0 0 0
VIC Powercor Single Blue NRG Blue Business Expert 0 0 0 0
VIC Powercor Single Tango Energy Business Select 0 0 0 0
VIC Powercor Single Powerclub Bis Flat 0 0 0 0
VIC Powercor Single Energy Locals Business Saver 0 0 0 0
VIC Powercor Single Q Energy Mini Me Biz 0 0 0 0
VIC Powercor Single Available from all retailers VDO 0 0 0 0
VIC Powercor Controlled AGL Business Essentials 0 0 0 0
VIC Powercor Controlled Alinta Energy BusinessDeal 0 0 0 0
VIC Powercor Controlled CovaU Super Saver 0 30 0 0
VIC Powercor Controlled Diamond Energy Renewable Saver POT 0 0 3 0
VIC Powercor Controlled EnergyAustralia Total Plan 5 0 0 0
VIC Powercor Controlled GloBird Energy Biz VicSave 0 0 0 0

State DB Meter type Retailer Name Guaranteed discount on bill (%)
Guaranteed discount on usage (%)
POT discount on bill (%)
POT discount on usage (%)
VIC Powercor Controlled Lumo Energy Value 0 0 0 0
VIC Powercor Controlled Momentum Energy SmilePower Flexi 0 0 0 0
VIC Powercor Controlled Next Business Energy Market offer 0 0 0 0
VIC Powercor Controlled Origin Energy Basic 0 0 0 0
VIC Powercor Controlled 1st Energy 1st Saver Plus 0 7 0 3
VIC Powercor Controlled Powerdirect Rate Saver 0 0 0 0
VIC Powercor Controlled Powershop Carbon Neutral 0 0 0 0
VIC Powercor Controlled Red Energy Red Business Saver 0 0 0 0
VIC Powercor Controlled Simply Energy Business Saver 10 0 0 0
VIC Powercor Controlled Sumo Power Freedom 0 0 0 0
VIC Powercor Controlled Energy Locals Business Saver 0 0 0 0
VIC Powercor Controlled Q Energy Mini Me Biz 0 0 0 0
VIC Powercor Two Rate AGL Business Essentials 0 0 0 0
VIC Powercor Two Rate Alinta Energy BusinessDeal 0 0 0 0
VIC Powercor Two Rate CovaU Super Saver 0 30 0 0
VIC Powercor Two Rate Diamond Energy Renewable Saver POT 0 0 3 0
VIC Powercor Two Rate EnergyAustralia Total Plan 5 0 0 0
VIC Powercor Two Rate GloBird Energy Biz VicSave 0 0 0 0
VIC Powercor Two Rate Lumo Energy Value 0 0 0 0
VIC Powercor Two Rate Momentum Energy SmilePower Flexi 0 0 0 0
VIC Powercor Two Rate Next Business Energy Market offer 0 0 0 0
VIC Powercor Two Rate Origin Energy Basic 0 0 0 0
VIC Powercor Two Rate 1st Energy 1st Saver Plus 0 7 0 3
VIC Powercor Two Rate Powerdirect Rate Saver 0 0 0 0
VIC Powercor Two Rate Powershop Carbon Neutral 0 0 0 0
VIC Powercor Two Rate Red Energy Red Business Saver 0 0 0 0
VIC Powercor Two Rate Simply Energy Business Saver 10 0 0 0
VIC Powercor Two Rate Sumo Power Freedom 0 0 0 0
VIC Powercor Two Rate Blue NRG Blue Business Expert 0 0 0 0

State DB Meter type Retailer Name Guaranteed discount on bill (%)
Guaranteed discount on usage (%)
POT discount on bill (%)
POT discount on usage (%)
VIC Powercor Two Rate Powerclub Bis Flex 0 0 0 0
VIC Powercor Two Rate Energy Locals Business Saver 0 0 0 0
VIC Powercor Two Rate Q Energy Mini Me Biz 0 0 0 0
VIC Powercor TOU Alinta Energy BusinessDeal 0 0 0 0
VIC Powercor TOU Momentum Energy SmilePower Flexi 0 0 0 0
VIC Powercor TOU Red Energy Red Business Saver 0 0 0 0
VIC Powercor TOU Energy Locals Business Saver 0 0 0 0
VIC Powercor TOU Blue NRG Blue Business Expert 0 0 0 0
VIC Powercor TOU AGL Business Essentials 0 0 0 0
VIC Powercor TOU CovaU Super Saver 0 30 0 0
VIC Powercor TOU Lumo Energy Value 0 0 0 0
VIC AusNet Services Single AGL Business Essentials 0 0 0 0
VIC AusNet Services Single Alinta Energy BusinessDeal 0 0 0 0
VIC AusNet Services Single CovaU Super Saver 0 30 0 0
VIC AusNet Services Single Diamond Energy Renewable Saver POT 0 0 3 0
VIC AusNet Services Single EnergyAustralia Total Plan 5 0 0 0
VIC AusNet Services Single GloBird Energy Biz VicSave 0 0 0 0
VIC AusNet Services Single Lumo Energy Value 0 0 0 0
VIC AusNet Services Single Momentum Energy SmilePower Flexi 0 0 0 0
VIC AusNet Services Single Next Business Energy Market offer 0 0 0 0
VIC AusNet Services Single Origin Energy Basic 0 0 0 0
VIC AusNet Services Single 1st Energy 1st Saver Plus 0 7 0 3
VIC AusNet Services Single Powerdirect Rate Saver 0 0 0 0
VIC AusNet Services Single Powershop Carbon Neutral 0 0 0 0
VIC AusNet Services Single Red Energy Red Business Saver 0 0 0 0
VIC AusNet Services Single Simply Energy Business Saver 10 0 0 0
VIC AusNet Services Single Sumo Power Freedom 0 0 0 0
VIC AusNet Services Single Blue NRG Blue Business Expert 0 0 0 0
VIC AusNet Services Single Tango Energy Business Select 0 0 0 0

100
State DB Meter type Retailer Name Guaranteed discount on bill (%)
Guaranteed discount on usage (%)
POT discount on bill (%)
POT discount on usage (%)
VIC AusNet Services Single Powerclub Bis Flat 0 0 0 0
VIC AusNet Services Single Energy Locals Business Saver 0 0 0 0
VIC AusNet Services Single Q Energy Mini Me Biz 0 0 0 0
VIC AusNet Services Single Available from all retailers VDO 0 0 0 0
VIC AusNet Services Controlled AGL Business Essentials 0 0 0 0
VIC AusNet Services Controlled Alinta Energy BusinessDeal 0 0 0 0
VIC AusNet Services Controlled CovaU Super Saver 0 30 0 0
VIC AusNet Services Controlled Diamond Energy Renewable Saver POT 0 0 3 0
VIC AusNet Services Controlled EnergyAustralia Total Plan 5 0 0 0
VIC AusNet Services Controlled GloBird Energy Biz VicSave 0 0 0 0
VIC AusNet Services Controlled Lumo Energy Value 0 0 0 0
VIC AusNet Services Controlled Momentum Energy SmilePower Flexi 0 0 0 0
VIC AusNet Services Controlled Next Business Energy Market offer 0 0 o 0
VIC AusNet Services Controlled Origin Energy Basic 0 0 0 0
VIC AusNet Services Controlled 1st Energy 1st Saver Plus 0 7 0 3
VIC AusNet Services Controlled Powerdirect Rate Saver 0 0 0 0
VIC AusNet Services Controlled Powershop Carbon Neutral 0 0 0 0
VIC AusNet Services Controlled Red Energy Red Business Saver 0 0 0 0
VIC AusNet Services Controlled Simply Energy Business Saver 10 0 0 0
VIC AusNet Services Controlled Sumo Power Freedom 0 0 0 0
VIC AusNet Services Controlled Energy Locals Business Saver 0 0 0 0
VIC AusNet Services Controlled Q Energy Mini Me Biz 0 0 0 0
VIC AusNet Services Two Rate AGL Business Essentials 0 0 0 0
VIC AusNet Services Two Rate Alinta Energy BusinessDeal 0 0 0 0
VIC AusNet Services Two Rate CovaU Super Saver 0 30 0 0
VIC AusNet Services Two Rate Diamond Energy Renewable Saver POT 0 0 3 0
VIC AusNet Services Two Rate EnergyAustralia Total Plan 5 0 0 0
VIC AusNet Services Two Rate GloBird Energy Biz VicSave 0 0 0 0
VIC AusNet Services Two Rate Lumo Energy Value 0 0 0 0

101
State DB Meter type Retailer Name Guaranteed discount on bill (%)
Guaranteed discount on usage (%)
POT discount on bill (%)
POT discount on usage (%)
VIC AusNet Services Two Rate Momentum Energy SmilePower Flexi 0 0 0 0
VIC AusNet Services Two Rate Next Business Energy Market offer 0 0 o 0
VIC AusNet Services Two Rate Origin Energy Basic 0 0 0 0
VIC AusNet Services Two Rate 1st Energy 1st Saver Plus 0 7 0 3
VIC AusNet Services Two Rate Powerdirect Rate Saver 0 0 0 0
VIC AusNet Services Two Rate Powershop Carbon Neutral 0 0 0 0
VIC AusNet Services Two Rate Red Energy Red Business Saver 0 0 0 0
VIC AusNet Services Two Rate Sumo Power Freedom 0 0 0 0
VIC AusNet Services Two Rate Blue NRG Blue Business Expert 0 0 0 0
VIC AusNet Services Two Rate Powerclub Bis Flex 0 0 0 0
VIC AusNet Services Two Rate Energy Locals Business Saver 0 0 0 0
VIC AusNet Services Two Rate Simply Energy Business Saver 10 0 0 0
VIC AusNet Services Two Rate Q Energy Mini Me Biz 0 0 0 0
VIC Jemena Network Single AGL Business Essentials 0 0 0 0
VIC Jemena Network Single Alinta Energy BusinessDeal 0 0 0 0
VIC Jemena Network Single CovaU Super Saver 0 30 0 0
VIC Jemena Network Single Diamond Energy Renewable Saver POT 0 0 3 0
VIC Jemena Network Single EnergyAustralia Total Plan 5 0 0 0
VIC Jemena Network Single GloBird Energy Biz VicSave 0 0 0 0
VIC Jemena Network Single Lumo Energy Value 0 0 0 0
VIC Jemena Network Single Momentum Energy SmilePower Flexi 0 0 0 0
VIC Jemena Network Single Next Business Energy Market offer 0 0 0 0
VIC Jemena Network Single Origin Energy Basic 0 0 0 0
VIC Jemena Network Single 1st Energy 1st Saver Plus 0 7 0 3
VIC Jemena Network Single Powerdirect Rate Saver 0 0 0 0
VIC Jemena Network Single Powershop Carbon Neutral 0 0 0 0
VIC Jemena Network Single Red Energy Red Business Saver 0 0 0 0
VIC Jemena Network Single Simply Energy Business Saver 10 0 0 0
VIC Jemena Network Single Sumo Power Freedom 0 0 0 0

102
State DB Meter type Retailer Name Guaranteed discount on bill (%)
Guaranteed discount on usage (%)
POT discount on bill (%)
POT discount on usage (%)
VIC Jemena Network Single Tango Energy Business Select 0 0 0 0
VIC Jemena Network Single Powerclub Bis Flat 0 0 0 0
VIC Jemena Network Single Energy Locals Business Saver 0 0 0 0
VIC Jemena Network Single Q Energy Mini Me Biz 0 0 0 0
VIC Jemena Network Single Available from all retailers VDO 0 0 0 0
VIC Jemena Network Controlled AGL Business Essentials 0 0 0 0
VIC Jemena Network Controlled Alinta Energy BusinessDeal 0 0 0 0
VIC Jemena Network Controlled CovaU Super Saver 0 30 0 0
VIC Jemena Network Controlled EnergyAustralia Total Plan 5 0 0 0
VIC Jemena Network Controlled GloBird Energy Biz VicSave 0 0 0 0
VIC Jemena Network Controlled Lumo Energy Value 0 0 0 0
VIC Jemena Network Controlled Momentum Energy SmilePower Flexi 0 0 0 0
VIC Jemena Network Controlled Next Business Energy Market offer 0 0 0 0
VIC Jemena Network Controlled Origin Energy Basic 0 0 0 0
VIC Jemena Network Controlled 1st Energy 1st Saver Plus 0 7 0 3
VIC Jemena Network Controlled Powerdirect Rate Saver 0 0 0 0
VIC Jemena Network Controlled Powershop Carbon Neutral 0 0 0 0
VIC Jemena Network Controlled Red Energy Red Business Saver 0 0 0 0
VIC Jemena Network Controlled Simply Energy Business Saver 10 0 0 0
VIC Jemena Network Controlled Sumo Power Freedom 0 0 0 0
VIC Jemena Network Controlled Q Energy Mini Me Biz 0 0 0 0
VIC Jemena Network Two Rate AGL Business Essentials 0 0 0 0
VIC Jemena Network Two Rate Alinta Energy BusinessDeal 0 0 0 0
VIC Jemena Network Two Rate CovaU Super Saver 0 30 0 0
VIC Jemena Network Two Rate Diamond Energy Renewable Saver POT 0 0 3 0
VIC Jemena Network Two Rate EnergyAustralia Total Plan 5 0 0 0
VIC Jemena Network Two Rate GloBird Energy Biz VicSave 0 0 0 0
VIC Jemena Network Two Rate Lumo Energy Value 0 0 0 0
VIC Jemena Network Two Rate Momentum Energy SmilePower Flexi 0 0 0 0

103
State DB Meter type Retailer Name Guaranteed discount on bill (%)
Guaranteed discount on usage (%)
POT discount on bill (%)
POT discount on usage (%)
VIC Jemena Network Two Rate Next Business Energy Market offer 0 0 0 0
VIC Jemena Network Two Rate Origin Energy Basic 0 0 0 0
VIC Jemena Network Two Rate 1st Energy 1st Saver Plus 0 7 0 3
VIC Jemena Network Two Rate Powerdirect Rate Saver 0 0 0 0
VIC Jemena Network Two Rate Powershop Carbon Neutral 0 0 0 0
VIC Jemena Network Two Rate Red Energy Red Business Saver 0 0 0 0
VIC Jemena Network Two Rate Simply Energy Business Saver 10 0 0 0
VIC Jemena Network Two Rate Sumo Power Freedom 0 0 0 0
VIC Jemena Network Two Rate Blue NRG Blue Business Expert 0 0 0 0
VIC Jemena Network Two Rate Powerclub Bis Flex 0 0 0 0
VIC Jemena Network Two Rate Energy Locals Business Saver 0 0 0 0
VIC Jemena Network Two Rate Q Energy Mini Me Biz 0 0 0 0
VIC United Energy Single AGL Business Essentials 0 0 0 0
VIC United Energy Single Alinta Energy BusinessDeal 0 0 0 0
VIC United Energy Single CovaU Super Saver 0 30 0 0
VIC United Energy Single Diamond Energy Renewable Saver POT 0 0 3 0
VIC United Energy Single EnergyAustralia Total Plan 5 0 0 0
VIC United Energy Single GloBird Energy Biz VicSave 0 0 0 0
VIC United Energy Single Lumo Energy Value 0 0 0 0
VIC United Energy Single Momentum Energy SmilePower Flexi 0 0 0 0
VIC United Energy Single Next Business Energy Market offer 0 0 0 0
VIC United Energy Single Origin Energy Basic 0 0 0 0
VIC United Energy Single 1st Energy 1st Saver Plus 0 7 0 3
VIC United Energy Single Powerdirect Rate Saver 0 0 0 0
VIC United Energy Single Powershop Carbon Neutral 0 0 0 0
VIC United Energy Single Red Energy Red Business Saver 0 0 0 0
VIC United Energy Single Simply Energy Business Saver 10 0 0 0
VIC United Energy Single Sumo Power Freedom 0 0 0 0
VIC United Energy Single Tango Energy Business Select 0 0 0 0

104
State DB Meter type Retailer Name Guaranteed discount on bill (%)
Guaranteed discount on usage (%)
POT discount on bill (%)
POT discount on usage (%)
VIC United Energy Single Powerclub Bis Flat 0 0 0 0
VIC United Energy Single Energy Locals Business Saver 0 0 0 0
VIC United Energy Single Q Energy Mini Me Biz 0 0 0 0
VIC United Energy Single Available from all retailers VDO 0 0 0 0
VIC United Energy Controlled AGL Business Essentials 0 0 0 0
VIC United Energy Controlled Alinta Energy BusinessDeal 0 0 0 0
VIC United Energy Controlled CovaU Super Saver 0 30 0 0
VIC United Energy Controlled Diamond Energy Renewable Saver POT 0 0 3 0
VIC United Energy Controlled EnergyAustralia Total Plan 5 0 0 0
VIC United Energy Controlled GloBird Energy Biz VicSave 0 0 0 0
VIC United Energy Controlled Lumo Energy Value 0 0 0 0
VIC United Energy Controlled Momentum Energy SmilePower Flexi 0 0 0 0
VIC United Energy Controlled Next Business Energy Market offer 0 0 0 0
VIC United Energy Controlled Origin Energy Basic 0 0 0 0
VIC United Energy Controlled 1st Energy 1st Saver Plus 0 7 0 3
VIC United Energy Controlled Powerdirect Rate Saver 0 0 0 0
VIC United Energy Controlled Powershop Carbon Neutral 0 0 0 0
VIC United Energy Controlled Red Energy Red Business Saver 0 0 0 0
VIC United Energy Controlled Simply Energy Business Saver 10 0 0 0
VIC United Energy Controlled Sumo Power Freedom 0 0 0 0
VIC United Energy Controlled Q Energy Mini Me Biz 0 0 0 0
VIC United Energy Two Rate AGL Business Essentials 0 0 0 0
VIC United Energy Two Rate Alinta Energy BusinessDeal 0 0 0 0
VIC United Energy Two Rate CovaU Super Saver 0 30 0 0
VIC United Energy Two Rate Diamond Energy Renewable Saver POT 0 0 3 0
VIC United Energy Two Rate EnergyAustralia Total Plan 5 0 0 0
VIC United Energy Two Rate GloBird Energy Biz VicSave 0 0 0 0
VIC United Energy Two Rate Lumo Energy Value 0 0 0 0
VIC United Energy Two Rate Momentum Energy SmilePower Flexi 0 0 0 0

105
State DB Meter type Retailer Name Guaranteed discount on bill (%)
Guaranteed discount on usage (%)
POT discount on bill (%)
POT discount on usage (%)
VIC United Energy Two Rate Next Business Energy Market offer 0 0 0 0
VIC United Energy Two Rate Origin Energy Basic 0 0 0 0
VIC United Energy Two Rate 1st Energy 1st Saver Plus 0 7 0 3
VIC United Energy Two Rate Powerdirect Rate Saver 0 0 0 0
VIC United Energy Two Rate Powershop Carbon Neutral 0 0 0 0
VIC United Energy Two Rate Red Energy Red Business Saver 0 0 0 0
VIC United Energy Two Rate Sumo Power Freedom 0 0 0 0
VIC United Energy Two Rate Blue NRG Blue Business Expert 0 0 0 0
VIC United Energy Two Rate Simply Energy Business Saver 10 0 0 0
VIC United Energy Two Rate Powerclub Bis Flex 0 0 0 0
VIC United Energy Two Rate Energy Locals Business Saver 0 0 0 0
VIC United Energy Two Rate Q Energy Mini Me Biz 0 0 0 0
QLD Energex Single AGL Business Essentials 0 0 0 0
QLD Energex Single Diamond Energy Renewable Saver POT 0 0 7 0
QLD Energex Single EnergyAustralia Total Plan 13 0 0 0
QLD Energex Single Origin Energy Flexi 0 13 0 0
QLD Energex Single Powerdirect Business Rate Saver 0 0 0 0
QLD Energex Single Powershop Shopper with Mega Pack 0 0 6 0
QLD Energex Single Energy Locals Business Member 0 0 0 0
QLD Energex Single Simply Energy Business Saver 18 0 0 0
QLD Energex Single Alinta Energy BusinessDeal 0 0 0 0
QLD Energex Single 1st Energy 1st Saver Plus 5 0 10 0
QLD Energex Single Powerclub Bis Flat 0 0 0 0
QLD Energex Single Next Business Energy Assured 0 0 0 0
QLD Energex Single Red Energy Red Business Saver 0 0 0 0
QLD Energex Single Blue NRG Blue Saver 0 0 0 0
QLD Energex Single Future X Power Business Smart 0 0 0 0
QLD Energex Single Locality Planning Energy Business Advantage 0 0 0 0
QLD Energex Single Bright Spark Power Business 12 Months 0 0 0 0

106
State DB Meter type Retailer Name Guaranteed discount on bill (%)
Guaranteed discount on usage (%)
POT discount on bill (%)
POT discount on usage (%)
QLD Energex Single CovaU Freedom Plus 15 0 0 0
QLD Energex Single Discover Energy Business Smart Saver 0 18 0 0
QLD Energex Single Glow Power Saver 0 0 0 0
QLD Energex Single Radian Energy GTG Business Anytime 0 0 0 0
QLD Energex Single ReAmped Energy ReAmped Business 0 0 0 0
QLD Energex Single Sumo Power Freedom Business 0 0 0 0
QLD Energex Single Enova Energy Economy Plus 0 0 0 3
QLD Energex Single Momentum Energy Smile Power 0 0 0 0
QLD Energex Single Electricity in a box Business Anytime 0 0 0 0
QLD Energex Controlled AGL Business Essentials 0 0 0 0
QLD Energex Controlled Diamond Energy Renewable Saver POT 0 0 7 0
QLD Energex Controlled EnergyAustralia Total Plan 13 0 0 0
QLD Energex Controlled Origin Energy Flexi 0 13 0 0
QLD Energex Controlled Powerdirect Business Rate Saver 0 0 0 0
QLD Energex Controlled Powershop Shopper with Mega Pack 0 0 6 0
QLD Energex Controlled Energy Locals Business Member 0 0 0 0
QLD Energex Controlled Simply Energy Business Saver 18 0 0 0
QLD Energex Controlled Alinta Energy BusinessDeal 0 0 0 0
QLD Energex Controlled 1st Energy 1st Saver Plus 5 0 10 0
QLD Energex Controlled Red Energy Red Business Saver 0 0 0 0
QLD Energex Controlled Future X Power Business Smart 0 0 0 0
QLD Energex Controlled Locality Planning Energy Business Advantage 0 0 0 0
QLD Energex Controlled Bright Spark Power Business 12 Months 0 0 0 0
QLD Energex Controlled CovaU Freedom Plus 15 0 0 0
QLD Energex Controlled Discover Energy Business Smart Saver 0 18 0 0
QLD Energex Controlled Glow Power Saver 0 0 0 0
QLD Energex Controlled ReAmped Energy Reamped Business 0 0 0 0
QLD Energex Controlled Sumo Power Freedom Business 0 0 0 0
QLD Energex Controlled Momentum Energy Smile Power 0 0 0 0
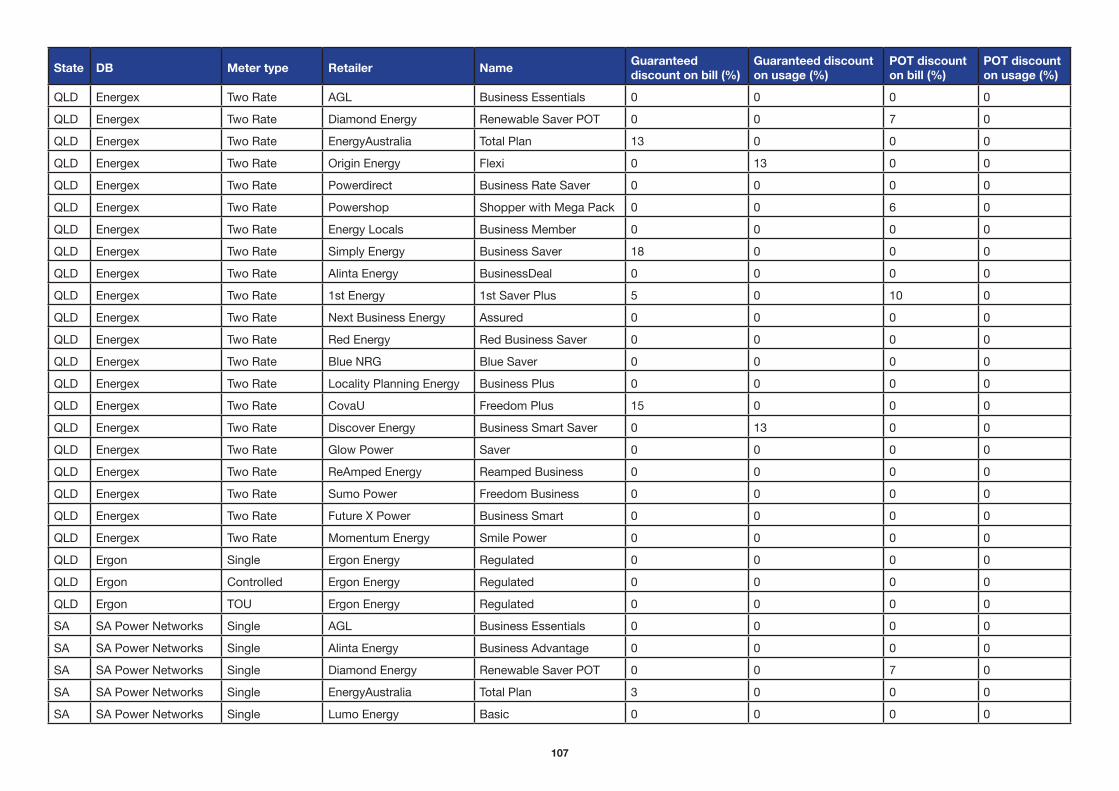
107
State DB Meter type Retailer Name Guaranteed discount on bill (%)
Guaranteed discount on usage (%)
POT discount on bill (%)
POT discount on usage (%)
QLD Energex Two Rate AGL Business Essentials 0 0 0 0
QLD Energex Two Rate Diamond Energy Renewable Saver POT 0 0 7 0
QLD Energex Two Rate EnergyAustralia Total Plan 13 0 0 0
QLD Energex Two Rate Origin Energy Flexi 0 13 0 0
QLD Energex Two Rate Powerdirect Business Rate Saver 0 0 0 0
QLD Energex Two Rate Powershop Shopper with Mega Pack 0 0 6 0
QLD Energex Two Rate Energy Locals Business Member 0 0 0 0
QLD Energex Two Rate Simply Energy Business Saver 18 0 0 0
QLD Energex Two Rate Alinta Energy BusinessDeal 0 0 0 0
QLD Energex Two Rate 1st Energy 1st Saver Plus 5 0 10 0
QLD Energex Two Rate Next Business Energy Assured 0 0 0 0
QLD Energex Two Rate Red Energy Red Business Saver 0 0 0 0
QLD Energex Two Rate Blue NRG Blue Saver 0 0 0 0
QLD Energex Two Rate Locality Planning Energy Business Plus 0 0 0 0
QLD Energex Two Rate CovaU Freedom Plus 15 0 0 0
QLD Energex Two Rate Discover Energy Business Smart Saver 0 13 0 0
QLD Energex Two Rate Glow Power Saver 0 0 0 0
QLD Energex Two Rate ReAmped Energy Reamped Business 0 0 0 0
QLD Energex Two Rate Sumo Power Freedom Business 0 0 0 0
QLD Energex Two Rate Future X Power Business Smart 0 0 0 0
QLD Energex Two Rate Momentum Energy Smile Power 0 0 0 0
QLD Ergon Single Ergon Energy Regulated 0 0 0 0
QLD Ergon Controlled Ergon Energy Regulated 0 0 0 0
QLD Ergon TOU Ergon Energy Regulated 0 0 0 0
SA SA Power Networks Single AGL Business Essentials 0 0 0 0
SA SA Power Networks Single Alinta Energy Business Advantage 0 0 0 0
SA SA Power Networks Single Diamond Energy Renewable Saver POT 0 0 7 0
SA SA Power Networks Single EnergyAustralia Total Plan 3 0 0 0
SA SA Power Networks Single Lumo Energy Basic 0 0 0 0
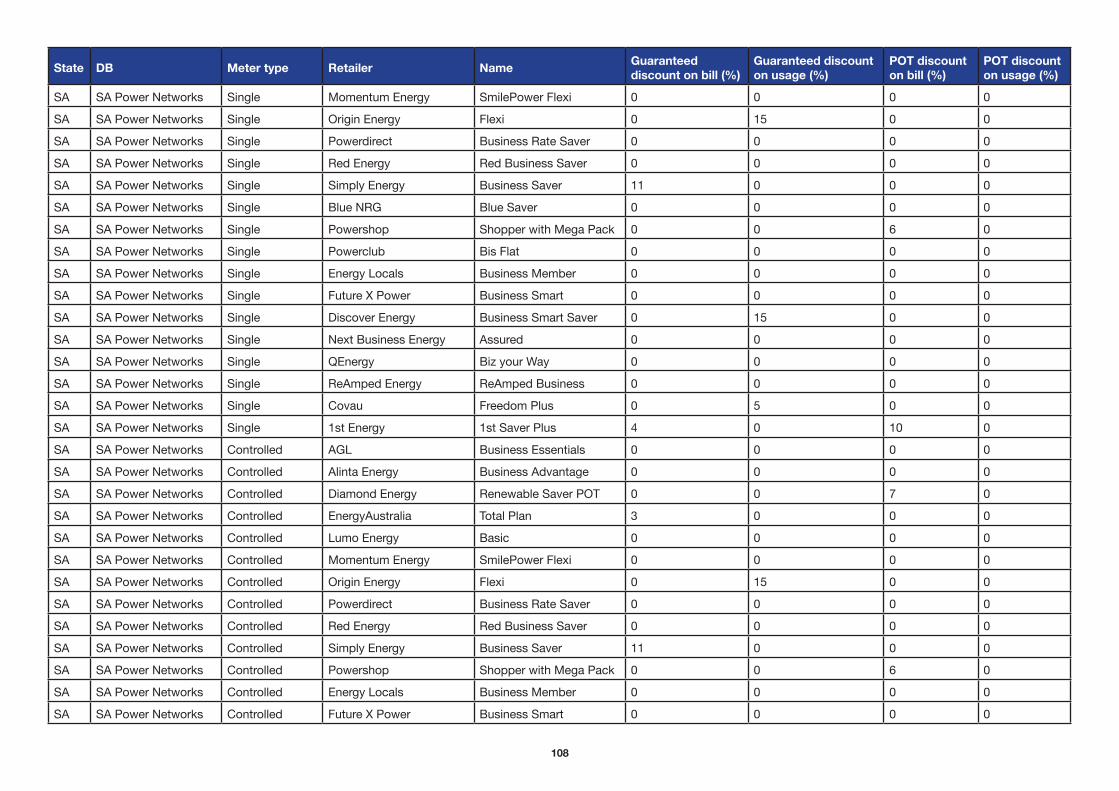
108
State DB Meter type Retailer Name Guaranteed discount on bill (%)
Guaranteed discount on usage (%)
POT discount on bill (%)
POT discount on usage (%)
SA SA Power Networks Single Momentum Energy SmilePower Flexi 0 0 0 0
SA SA Power Networks Single Origin Energy Flexi 0 15 0 0
SA SA Power Networks Single Powerdirect Business Rate Saver 0 0 0 0
SA SA Power Networks Single Red Energy Red Business Saver 0 0 0 0
SA SA Power Networks Single Simply Energy Business Saver 11 0 0 0
SA SA Power Networks Single Blue NRG Blue Saver 0 0 0 0
SA SA Power Networks Single Powershop Shopper with Mega Pack 0 0 6 0
SA SA Power Networks Single Powerclub Bis Flat 0 0 0 0
SA SA Power Networks Single Energy Locals Business Member 0 0 0 0
SA SA Power Networks Single Future X Power Business Smart 0 0 0 0
SA SA Power Networks Single Discover Energy Business Smart Saver 0 15 0 0
SA SA Power Networks Single Next Business Energy Assured 0 0 0 0
SA SA Power Networks Single QEnergy Biz your Way 0 0 0 0
SA SA Power Networks Single ReAmped Energy ReAmped Business 0 0 0 0
SA SA Power Networks Single Covau Freedom Plus 0 5 0 0
SA SA Power Networks Single 1st Energy 1st Saver Plus 4 0 10 0
SA SA Power Networks Controlled AGL Business Essentials 0 0 0 0
SA SA Power Networks Controlled Alinta Energy Business Advantage 0 0 0 0
SA SA Power Networks Controlled Diamond Energy Renewable Saver POT 0 0 7 0
SA SA Power Networks Controlled EnergyAustralia Total Plan 3 0 0 0
SA SA Power Networks Controlled Lumo Energy Basic 0 0 0 0
SA SA Power Networks Controlled Momentum Energy SmilePower Flexi 0 0 0 0
SA SA Power Networks Controlled Origin Energy Flexi 0 15 0 0
SA SA Power Networks Controlled Powerdirect Business Rate Saver 0 0 0 0
SA SA Power Networks Controlled Red Energy Red Business Saver 0 0 0 0
SA SA Power Networks Controlled Simply Energy Business Saver 11 0 0 0
SA SA Power Networks Controlled Powershop Shopper with Mega Pack 0 0 6 0
SA SA Power Networks Controlled Energy Locals Business Member 0 0 0 0
SA SA Power Networks Controlled Future X Power Business Smart 0 0 0 0

109
State DB Meter type Retailer Name Guaranteed discount on bill (%)
Guaranteed discount on usage (%)
POT discount on bill (%)
POT discount on usage (%)
SA SA Power Networks Controlled Discover Energy Business Smart Saver 0 15 0 0
SA SA Power Networks Controlled ReAmped Energy ReAmped Business 0 0 0 0
SA SA Power Networks Controlled Covau Freedom Plus 0 5 0 0
SA SA Power Networks Controlled 1st Energy 1st Saver Plus 4 0 10 0
SA SA Power Networks Two Rate AGL Business Essentials 0 0 0 0
SA SA Power Networks Two Rate Alinta Energy Business Advantage 0 0 0 0
SA SA Power Networks Two Rate Diamond Energy Renewable Saver POT 0 0 7 0
SA SA Power Networks Two Rate EnergyAustralia Total Plan 3 0 0 0
SA SA Power Networks Two Rate Momentum Energy SmilePower Flexi 0 0 0 0
SA SA Power Networks Two Rate Origin Energy Flexi 0 15 0 0
SA SA Power Networks Two Rate Powerdirect Business Rate Saver 0 0 0 0
SA SA Power Networks Two Rate Red Energy Red Business Saver 0 0 0 0
SA SA Power Networks Two Rate Powershop Shopper with Mega Pack 0 0 6 0
SA SA Power Networks Two Rate Energy Locals Business Member 0 0 0 0
SA SA Power Networks Two Rate Discover Energy Business Smart Saver 0 15 0 0
SA SA Power Networks Two Rate Next Business Energy Assured 0 0 0 0
SA SA Power Networks Two Rate QEnergy Biz your Way 0 0 0 0
SA SA Power Networks Two Rate Lumo Energy Basic 0 0 0 0
SA SA Power Networks Two Rate Simply Energy Business Saver 11 0 0 0
SA SA Power Networks Two Rate ReAmped Energy ReAmped Business 0 0 0 0
SA SA Power Networks Two Rate Covau Freedom Plus 0 5 0 0
SA SA Power Networks Two Rate 1st Energy 1st Saver Plus 4 0 10 0
TAS TasNetworks Single Aurora Energy Regulated 0 0 0 0
TAS TasNetworks Single 1st Energy 1st Saver 0 0 0 5
TAS TasNetworks Single Future X Power Business Smart 0 0 3 0
TAS TasNetworks Controlled Aurora Energy Regulated 0 0 0 0
TAS TasNetworks Controlled 1st Energy 1st Saver 0 0 0 5
TAS TasNetworks Controlled Future X Power Business Smart 0 0 3 0
TAS TasNetworks TOU Aurora Energy Regulated 0 0 0 0
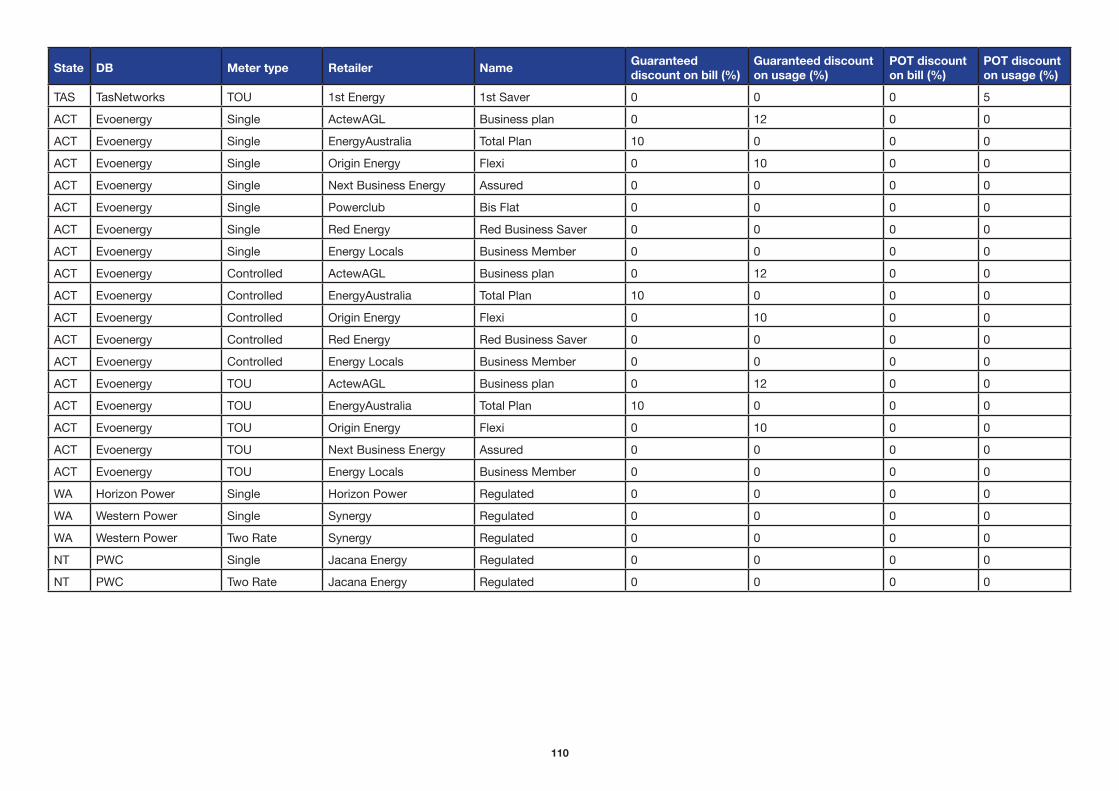
110
State DB Meter type Retailer Name Guaranteed discount on bill (%)
Guaranteed discount on usage (%)
POT discount on bill (%)
POT discount on usage (%)
TAS TasNetworks TOU 1st Energy 1st Saver 0 0 0 5
ACT Evoenergy Single ActewAGL Business plan 0 12 0 0
ACT Evoenergy Single EnergyAustralia Total Plan 10 0 0 0
ACT Evoenergy Single Origin Energy Flexi 0 10 0 0
ACT Evoenergy Single Next Business Energy Assured 0 0 0 0
ACT Evoenergy Single Powerclub Bis Flat 0 0 0 0
ACT Evoenergy Single Red Energy Red Business Saver 0 0 0 0
ACT Evoenergy Single Energy Locals Business Member 0 0 0 0
ACT Evoenergy Controlled ActewAGL Business plan 0 12 0 0
ACT Evoenergy Controlled EnergyAustralia Total Plan 10 0 0 0
ACT Evoenergy Controlled Origin Energy Flexi 0 10 0 0
ACT Evoenergy Controlled Red Energy Red Business Saver 0 0 0 0
ACT Evoenergy Controlled Energy Locals Business Member 0 0 0 0
ACT Evoenergy TOU ActewAGL Business plan 0 12 0 0
ACT Evoenergy TOU EnergyAustralia Total Plan 10 0 0 0
ACT Evoenergy TOU Origin Energy Flexi 0 10 0 0
ACT Evoenergy TOU Next Business Energy Assured 0 0 0 0
ACT Evoenergy TOU Energy Locals Business Member 0 0 0 0
WA Horizon Power Single Horizon Power Regulated 0 0 0 0
WA Western Power Single Synergy Regulated 0 0 0 0
WA Western Power Two Rate Synergy Regulated 0 0 0 0
NT PWC Single Jacana Energy Regulated 0 0 0 0
NT PWC Two Rate Jacana Energy Regulated 0 0 0 0

111
State Pricing zone Retailer Name Guaranteed discount off bill (%)
Guaranteed discount off usage (%)
POT discount off bill (%)
POT discount off usage (%)
NSW Jemena Sydney AGL Business Essentials Saver 0 0 0 0
NSW Jemena Sydney Covau Business Freedom Plus 25 0 0 0
NSW Jemena Sydney EnergyAustralia Total Plan 17 0 0 0
NSW Jemena Sydney Origin Energy Business Flexi 0 14 0 0
NSW Jemena Sydney Red Energy Business Saver 0 0 0 0
NSW Jemena Sydney Simply Energy Business Saver 21 0 0 0
NSW Jemena Sydney Alinta Energy BusinessDeal 0 0 0 0
NSW Jemena Sydney Discover Energy Budget 0 25 0 0
NSW ActewAGL Queanbeyan ActewAGL Business plan 10 0 0 0
NSW ActewAGL Queanbeyan EnergyAustralia Total Plan 19 0 0 0
NSW ActewAGL Shoalhaven ActewAGL Standard plan 0 0 0 0
NSW Capital Region ActewAGL Business plan 10 0 0 0
NSW Tamworth Origin Energy Business Flexi 0 14 0 0
NSW AGN Albury EnergyAustralia Total Plan 19 0 0 0
NSW AGN Albury Origin Energy Business Flexi 0 14 0 0
NSW AGN Albury AGL Business Essentials Saver 0 0 0 0
NSW AGN Cooma Origin Energy Business Flexi 0 14 0 0
NSW AGN Cooma Red Energy Business Saver 0 0 0 0
NSW AGN Holbrook Origin Energy Business Flexi 0 14 0 0
NSW AGN Murray Valley EnergyAustralia Total Plan 19 0 0 0
NSW AGN Murray Valley Origin Energy Business Flexi 0 14 0 0
NSW AGN Murray Valley AGL Business Essentials Saver 0 0 0 0
NSW AGN Tumut Origin Energy Business Flexi 0 14 0 0
NSW AGN Tumut Red Energy Business Saver 0 0 0 0
NSW AGN Wagga Wagga Origin Energy Business Flexi 0 14 0 0
VIC Multinet 1 AGL Business Essentials Saver 0 0 0 0
VIC Multinet 1 Covau Super Saver Plus 0 20 0 0
Gas offers for April 2021 bill analysis:
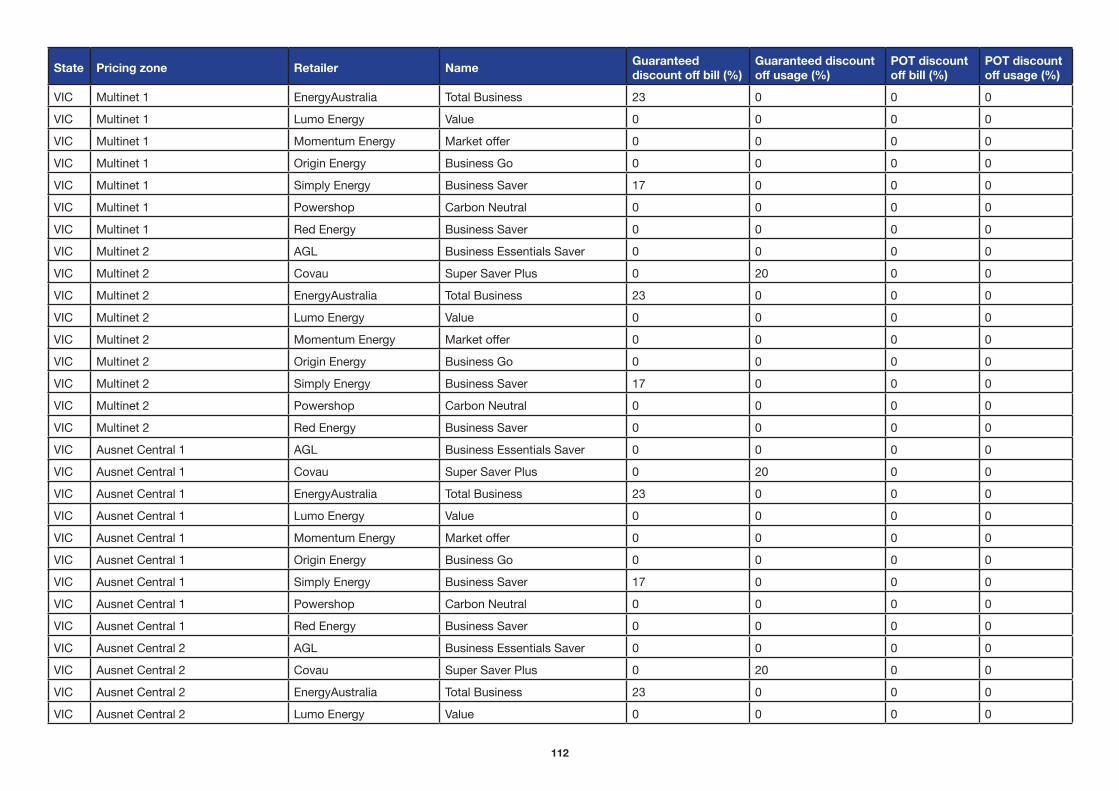
112
State Pricing zone Retailer Name Guaranteed discount off bill (%)
Guaranteed discount off usage (%)
POT discount off bill (%)
POT discount off usage (%)
VIC Multinet 1 EnergyAustralia Total Business 23 0 0 0
VIC Multinet 1 Lumo Energy Value 0 0 0 0
VIC Multinet 1 Momentum Energy Market offer 0 0 0 0
VIC Multinet 1 Origin Energy Business Go 0 0 0 0
VIC Multinet 1 Simply Energy Business Saver 17 0 0 0
VIC Multinet 1 Powershop Carbon Neutral 0 0 0 0
VIC Multinet 1 Red Energy Business Saver 0 0 0 0
VIC Multinet 2 AGL Business Essentials Saver 0 0 0 0
VIC Multinet 2 Covau Super Saver Plus 0 20 0 0
VIC Multinet 2 EnergyAustralia Total Business 23 0 0 0
VIC Multinet 2 Lumo Energy Value 0 0 0 0
VIC Multinet 2 Momentum Energy Market offer 0 0 0 0
VIC Multinet 2 Origin Energy Business Go 0 0 0 0
VIC Multinet 2 Simply Energy Business Saver 17 0 0 0
VIC Multinet 2 Powershop Carbon Neutral 0 0 0 0
VIC Multinet 2 Red Energy Business Saver 0 0 0 0
VIC Ausnet Central 1 AGL Business Essentials Saver 0 0 0 0
VIC Ausnet Central 1 Covau Super Saver Plus 0 20 0 0
VIC Ausnet Central 1 EnergyAustralia Total Business 23 0 0 0
VIC Ausnet Central 1 Lumo Energy Value 0 0 0 0
VIC Ausnet Central 1 Momentum Energy Market offer 0 0 0 0
VIC Ausnet Central 1 Origin Energy Business Go 0 0 0 0
VIC Ausnet Central 1 Simply Energy Business Saver 17 0 0 0
VIC Ausnet Central 1 Powershop Carbon Neutral 0 0 0 0
VIC Ausnet Central 1 Red Energy Business Saver 0 0 0 0
VIC Ausnet Central 2 AGL Business Essentials Saver 0 0 0 0
VIC Ausnet Central 2 Covau Super Saver Plus 0 20 0 0
VIC Ausnet Central 2 EnergyAustralia Total Business 23 0 0 0
VIC Ausnet Central 2 Lumo Energy Value 0 0 0 0

113
State Pricing zone Retailer Name Guaranteed discount off bill (%)
Guaranteed discount off usage (%)
POT discount off bill (%)
POT discount off usage (%)
VIC Ausnet Central 2 Momentum Energy Market offer 0 0 0 0
VIC Ausnet Central 2 Origin Energy Business Go 0 0 0 0
VIC Ausnet Central 2 Simply Energy Business Saver 17 0 0 0
VIC Ausnet Central 2 Powershop Carbon Neutral 0 0 0 0
VIC Ausnet Central 2 Red Energy Business Saver 0 0 0 0
VIC Ausnet West AGL Business Essentials Saver 0 0 0 0
VIC Ausnet West Covau Super Saver Plus 0 20 0 0
VIC Ausnet West EnergyAustralia Total Business 23 0 0 0
VIC Ausnet West Lumo Energy Value 0 0 0 0
VIC Ausnet West Momentum Energy Market offer 0 0 0 0
VIC Ausnet West Origin Energy Business Go 0 0 0 0
VIC Ausnet West Simply Energy Business Saver 17 0 0 0
VIC Ausnet West Powershop Carbon Neutral 0 0 0 0
VIC Ausnet West Red Energy Business Saver 0 0 0 0
VIC AGN Central 1 AGL Business Essentials Saver 0 0 0 0
VIC AGN Central 1 Covau Super Saver Plus 0 20 0 0
VIC AGN Central 1 EnergyAustralia Total Business 23 0 0 0
VIC AGN Central 1 Lumo Energy Value 0 0 0 0
VIC AGN Central 1 Momentum Energy Market offer 0 0 0 0
VIC AGN Central 1 Origin Energy Business Go 0 0 0 0
VIC AGN Central 1 Simply Energy Business Saver 17 0 0 0
VIC AGN Central 1 Powershop Carbon Neutral 0 0 0 0
VIC AGN Central 1 Red Energy Business Saver 0 0 0 0
VIC AGN Central 2 AGL Business Essentials Saver 0 0 0 0
VIC AGN Central 2 Covau Super Saver Plus 0 20 0 0
VIC AGN Central 2 EnergyAustralia Total Business 23 0 0 0
VIC AGN Central 2 Lumo Energy Value 0 0 0 0
VIC AGN Central 2 Momentum Energy Market offer 0 0 0 0
VIC AGN Central 2 Origin Energy Business Go 0 0 0 0

114
State Pricing zone Retailer Name Guaranteed discount off bill (%)
Guaranteed discount off usage (%)
POT discount off bill (%)
POT discount off usage (%)
VIC AGN Central 2 Simply Energy Business Saver 17 0 0 0
VIC AGN Central 2 Powershop Carbon Neutral 0 0 0 0
VIC AGN Central 2 Red Energy Business Saver 0 0 0 0
VIC AGN North AGL Business Essentials Saver 0 0 0 0
VIC AGN North Covau Super Saver Plus 0 20 0 0
VIC AGN North EnergyAustralia Total Business 23 0 0 0
VIC AGN North Lumo Energy Value 0 0 0 0
VIC AGN North Momentum Energy Market offer 0 0 0 0
VIC AGN North Origin Energy Business Go 0 0 0 0
VIC AGN North Simply Energy Business Saver 17 0 0 0
VIC AGN North Powershop Carbon Neutral 0 0 0 0
VIC AGN North Red Energy Business Saver 0 0 0 0
QLD APT Brisbane South AGL Business Essential Saver 0 0 0 0
QLD APT Brisbane South Origin Energy Business Flexi 0 8 0 0
QLD APT Brisbane South Red Energy Business Saver 0 0 0 0
QLD APT Brisbane South Covau Freedom 0 15 0 0
QLD APT Brisbane South Alinta Energy Business Deal 0 0 0 0
QLD Envestra Brisbane North AGL Business Essential Saver 0 0 0 0
QLD Envestra Brisbane North Origin Energy Business Flexi 0 8 0 0
QLD Envestra Brisbane North Red Energy Business Saver 0 0 0 0
QLD Envestra Brisbane North Covau Freedom 0 15 0 0
QLD Envestra Brisbane North Alinta Energy Business Deal 0 0 0 0
QLD Envestra Northern Origin Energy Business Flexi 0 8 0 0
QLD Envestra Wide Bay AGL Business Essential Saver 0 0 0 0
QLD Envestra Wide Bay Origin Energy Business Flexi 0 8 0 0
QLD Envestra Wide Bay Covau Freedom 0 15 0 0
SA Envestra SA AGL Standing offer 0 0 0 0
SA Envestra SA EnergyAustralia Total Plan Business 3 0 0 0
SA Envestra SA Origin Energy Business Flexi 0 8 0 0
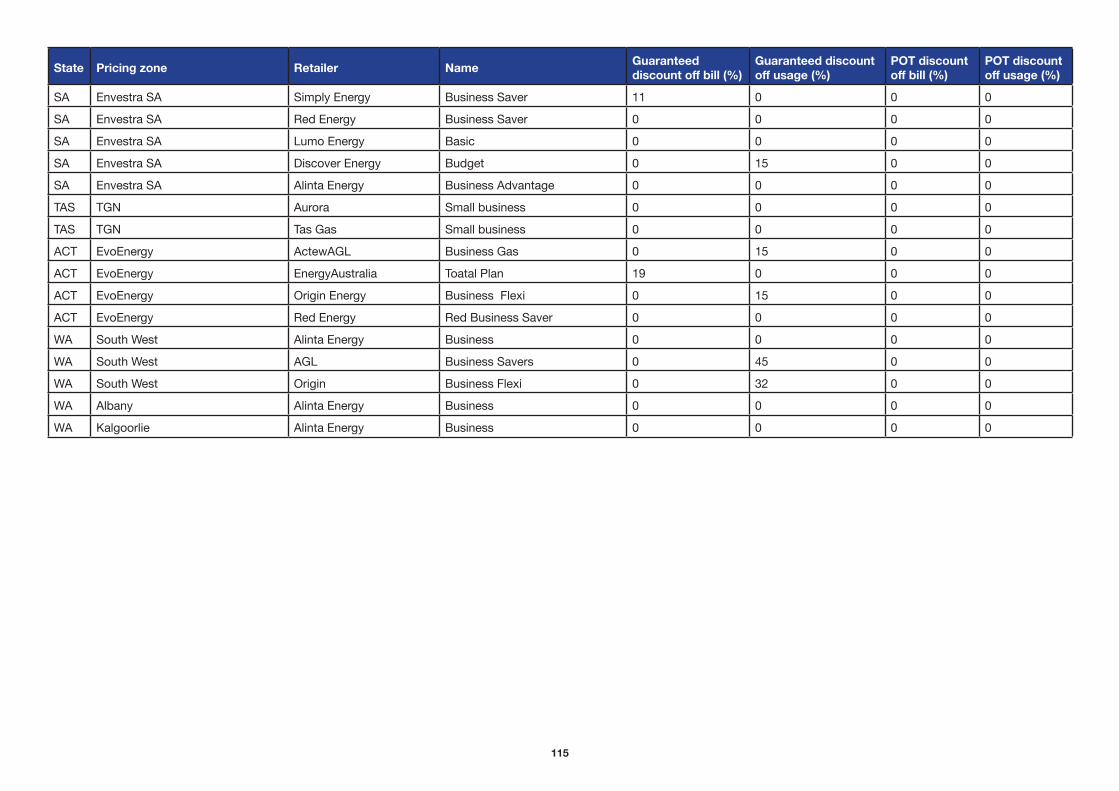
115
State Pricing zone Retailer Name Guaranteed discount off bill (%)
Guaranteed discount off usage (%)
POT discount off bill (%)
POT discount off usage (%)
SA Envestra SA Simply Energy Business Saver 11 0 0 0
SA Envestra SA Red Energy Business Saver 0 0 0 0
SA Envestra SA Lumo Energy Basic 0 0 0 0
SA Envestra SA Discover Energy Budget 0 15 0 0
SA Envestra SA Alinta Energy Business Advantage 0 0 0 0
TAS TGN Aurora Small business 0 0 0 0
TAS TGN Tas Gas Small business 0 0 0 0
ACT EvoEnergy ActewAGL Business Gas 0 15 0 0
ACT EvoEnergy EnergyAustralia Toatal Plan 19 0 0 0
ACT EvoEnergy Origin Energy Business Flexi 0 15 0 0
ACT EvoEnergy Red Energy Red Business Saver 0 0 0 0
WA South West Alinta Energy Business 0 0 0 0
WA South West AGL Business Savers 0 45 0 0
WA South West Origin Business Flexi 0 32 0 0
WA Albany Alinta Energy Business 0 0 0 0
WA Kalgoorlie Alinta Energy Business 0 0 0 0