
Analysis of Sampling Data - Digital Commons
36
Montana Tech Library Digital Commons @ Montana Tech Graduate eses & Non-eses Student Scholarship Spring 2015 Analysis of Sampling Data Tracy Altrock Montana Tech of the University of Montana Follow this and additional works at: hp://digitalcommons.mtech.edu/grad_rsch Part of the Occupational Health and Industrial Hygiene Commons is Non-esis Project is brought to you for free and open access by the Student Scholarship at Digital Commons @ Montana Tech. It has been accepted for inclusion in Graduate eses & Non-eses by an authorized administrator of Digital Commons @ Montana Tech. For more information, please contact [email protected]. Recommended Citation Altrock, Tracy, "Analysis of Sampling Data" (2015). Graduate eses & Non-eses. 4. hp://digitalcommons.mtech.edu/grad_rsch/4
Transcript of Analysis of Sampling Data - Digital Commons

Montana Tech LibraryDigital Commons @ Montana Tech
Graduate Theses & Non-Theses Student Scholarship
Spring 2015
Analysis of Sampling DataTracy AltrockMontana Tech of the University of Montana
Follow this and additional works at: http://digitalcommons.mtech.edu/grad_rsch
Part of the Occupational Health and Industrial Hygiene Commons
This Non-Thesis Project is brought to you for free and open access by the Student Scholarship at Digital Commons @ Montana Tech. It has beenaccepted for inclusion in Graduate Theses & Non-Theses by an authorized administrator of Digital Commons @ Montana Tech. For more information,please contact [email protected].
Recommended CitationAltrock, Tracy, "Analysis of Sampling Data" (2015). Graduate Theses & Non-Theses. 4.http://digitalcommons.mtech.edu/grad_rsch/4

ANALYSIS OF SAMPLING DATA
by
Tracy Altrock
A report submitted in partial fulfillment of the
requirements for the degree of
Master of Science
Industrial Hygiene Distance Learning / Professional Track
Montana Tech of the University of Montana
2015
LA-UR-15-22882

ii
Abstract
A Similar Exposure Group (SEG) can be created through the evaluation of workers performing the same or similar task, hazards they are exposed to, frequency and duration of their exposures, engineering controls available during their operations, personal protective equipment used, and exposure data. For this report, the samples of one facility that has collected nearly 40,000 various types of samples will be evaluated to determine if the creation of a SEG can be supported. The data will be reviewed for consistency with collection methods and laboratory detection limits. A subset of the samples may be selected based on the review. Data will also be statistically evaluated in order to determine whether the data is sufficient to terminate the sampling. IHDataAnalyst V1.27 will be used to assess the data. This program uses Bayesian Analysis to assist in making determinations. The 95 percent confidence interval will be calculated and evaluated in making decisions. This evaluation will be used to determine if a SEG can be created for any of the workers and determine the need for future sample collection. The data and evaluation presented in this report have been selected and evaluated specifically for the purposes of this project.
Keywords: Similar Exposure Group (SEG), Bayesian, IHDataAnalyst V1.27

iii
Acknowledgements
Los Alamos National Laboratory for providing data and financial assistance in completing this program.

iv
Table of Contents
ABSTRACT ............................................................................................................................................. II
KEYWORDS: SIMILAR EXPOSURE GROUP (SEG), BAYESIAN, IHDATAANALYST V1.27 .... II
ACKNOWLEDGEMENTS ........................................................................................................................ III
LIST OF TABLES ...................................................................................................................................... V
LIST OF FIGURES ................................................................................................................................... VI
1. BERYLLIUM HISTORY ........................................................................................................................... 1
2. HEALTH EFFECTS OF BERYLLIUM EXPOSURE ............................................................................................. 4
2.1. Routes of Exposure ............................................................................................................. 4
2.2. Prevalence of Exposure and Disease .................................................................................. 5
3. OCCUPATIONAL EXPOSURE LIMITS ........................................................................................................ 5
4. PROJECT SPECIFIC INFORMATION .......................................................................................................... 7
5. SIMILAR EXPOSURE GROUP (SEG) ........................................................................................................ 7
5.1. Developing a SEG ............................................................................................................... 7
5.2. Exposure Assessment and Sampling .................................................................................. 9
5.3. Statistical Evaluation of the Data ..................................................................................... 12
5.4. Conclusions ....................................................................................................................... 17
REFERENCES CITED .............................................................................................................................. 19
APPENDIX A: TABLE VII. RAW DATA ..................................................................................................... 21

v
List of Tables
Table I. Interational Work-Place Exposure Limits ..............................................................6
Table II: Exposure Groups ...................................................................................................8
Table III: Machinist Tasks ...................................................................................................9
Table IV: Frequency Distribution of Exposures ................................................................12
Table V. Summary of IHDA Statistics ..............................................................................14
Table VI. Bayesian Decision Analysis ..............................................................................15
Table VII. Exposure Exposure Assessment Controls and Management ..........................17

vi
List of Figures
Figure 1. Beryllium ..............................................................................................................1
Figure 2. Beryl Crystals Ready for Refining .......................................................................2
Figure 3. Pouring Molten Beryl Frit - Be Extraction ...........................................................3
Figure 4. Frequency Distribution Histogram .....................................................................13
Figure 5. Goodness of Fit Chart .........................................................................................14
Figure 6. Log Probability Chart .........................................................................................14
Figure 7. Prior Graph .........................................................................................................16
Figure 8. Likelihood Graph................................................................................................16
Figure 9. Posterior Graph ...................................................................................................16
1
1. Beryllium History
The naturally occurring element, beryllium (Be) was isolated in 1791 by the French
chemist, Nicholas Louis Vauquelin. It is a silvery-gray metal with an atomic number of 4 and an
atomic mass of 9.0122. Beryllium is the lightest of the metals; has a melting point of 1278°C,
the highest of the light metals; is extremely rigid; is non-sparking; non-magnetic; and has a high
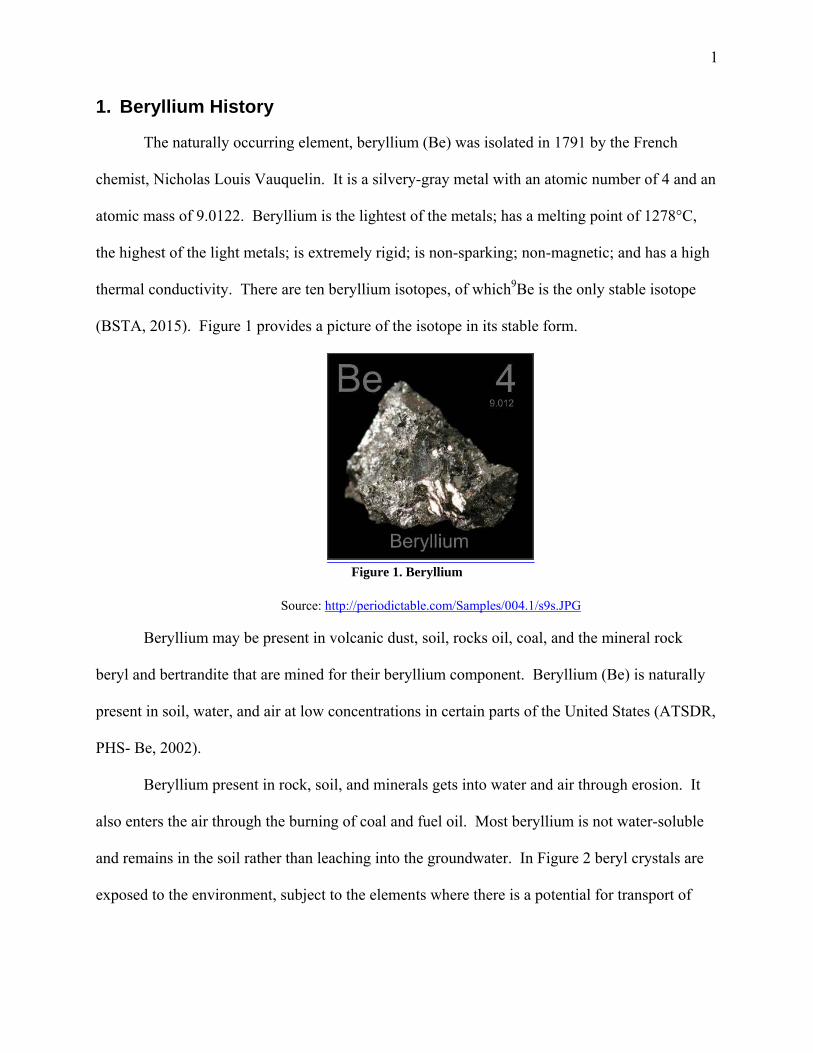
thermal conductivity. There are ten beryllium isotopes, of which9Be is the only stable isotope
(BSTA, 2015). Figure 1 provides a picture of the isotope in its stable form.
Figure 1. Beryllium
Source: http://periodictable.com/Samples/004.1/s9s.JPG
Beryllium may be present in volcanic dust, soil, rocks oil, coal, and the mineral rock
beryl and bertrandite that are mined for their beryllium component. Beryllium (Be) is naturally
present in soil, water, and air at low concentrations in certain parts of the United States (ATSDR,
PHS- Be, 2002).
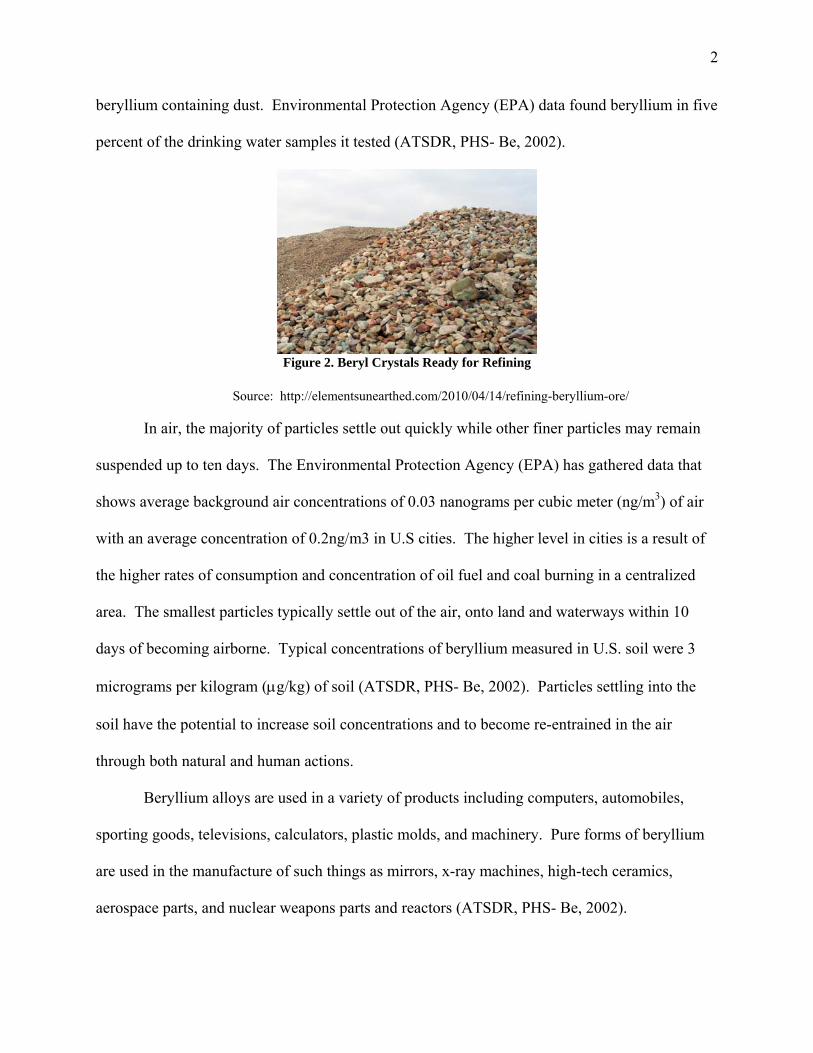
Beryllium present in rock, soil, and minerals gets into water and air through erosion. It
also enters the air through the burning of coal and fuel oil. Most beryllium is not water-soluble
and remains in the soil rather than leaching into the groundwater. In Figure 2 beryl crystals are
exposed to the environment, subject to the elements where there is a potential for transport of
2
beryllium containing dust. Environmental Protection Agency (EPA) data found beryllium in five
percent of the drinking water samples it tested (ATSDR, PHS- Be, 2002).
Figure 2. Beryl Crystals Ready for Refining
Source: http://elementsunearthed.com/2010/04/14/refining-beryllium-ore/
In air, the majority of particles settle out quickly while other finer particles may remain
suspended up to ten days. The Environmental Protection Agency (EPA) has gathered data that
shows average background air concentrations of 0.03 nanograms per cubic meter (ng/m3) of air
with an average concentration of 0.2ng/m3 in U.S cities. The higher level in cities is a result of
the higher rates of consumption and concentration of oil fuel and coal burning in a centralized
area. The smallest particles typically settle out of the air, onto land and waterways within 10
days of becoming airborne. Typical concentrations of beryllium measured in U.S. soil were 3
micrograms per kilogram (g/kg) of soil (ATSDR, PHS- Be, 2002). Particles settling into the
soil have the potential to increase soil concentrations and to become re-entrained in the air
through both natural and human actions.
Beryllium alloys are used in a variety of products including computers, automobiles,
sporting goods, televisions, calculators, plastic molds, and machinery. Pure forms of beryllium
are used in the manufacture of such things as mirrors, x-ray machines, high-tech ceramics,
aerospace parts, and nuclear weapons parts and reactors (ATSDR, PHS- Be, 2002).

3
Some background exposure to beryllium through nature and from consumer goods may
exist depending on where you live and consumer goods you use. Individuals living within close
proximity to a National Priority List (NPL) site or living near an industry that processes
beryllium may be exposed to higher concentrations of beryllium than the rest of the general
public. Beryllium is also present in tobacco and may be a source of exposure to cigarette
smokers (ATSDR, PHS- Be, 2002).
Occupational exposure to beryllium is the most prevalent source of exposure to higher,
elevated concentrations of the chemical. Beryllium is extracted from the earth through mining
and the associated processes that separate it from other materials. It may be combined with other
metals to form an alloy. Employees that recycle or machine beryllium materials are also at risk
of exposure (ATSDR, PHS- Be, 2002). Figure 3 shows molten beryl frit being poured during the
process to extract the beryllium. Workers are shown wearing personal protective equipment
(PPE) including respiratory protection to reduce the potential for exposure to beryllium fumes.
Figure 3. Pouring Molten Beryl Frit - Be Extraction
Source: http://elementsunearthed.files.wordpress.com/2010/04_molten_pour_3sig.jpg
4
2. Health Effects of Beryllium Exposure
In the 1930s Europe recognized beryllium as causing lung disease. It wasn’t until the
1940s when the United States acknowledged the link (Cooper & Harrison, 2009). Beryllium and
beryllium oxide, formed when beryllium is exposed to the oxygen in air, are toxic to humans.
Detrimental health effects including Chronic Beryllium Disease (CBD), Beryllium Sensitivity
(BeS), lung cancer, and skin disease may result from exposure to beryllium.
2.1. Routes of Exposure
Beryllium may be taken into the body through ingestion of food or water. Plants have the
potential to uptake beryllium. It may also be consumed in drinking water, although this is not a
prevalent source of exposure in the U.S. Beryllium may also enter the body through an open cut
or abrasion in the skin or through inhalation.
When beryllium is ingested, only around one percent will move from the digestive tract
into the bloodstream (Cooper & Harrison, 2009). The exposure of cut or abraded skin to
beryllium can lead to sores or ulcers. Granulomas may form on the skin when insoluble
beryllium becomes trapped under the skin of a beryllium sensitive person and can lead to
sensitization (Klaassen, 2013). Dermal exposure to water soluble beryllium can cause
papulovesicular dermatitis and conjunctivitis (Cooper & Harrison, 2009).
Acute exposure to beryllium through inhalation is known to cause pneumonitis,
coughing, pain in the chest, pneumonia, and dyspnea (Cooper & Harrison, 2009). The entire
respiratory tract may become immediately inflamed following exposure and is potentially fatal
(Klaassen, 2013).
Chronic Beryllium Disease (CBD), also known as Berylliosis or Chronic Granulomatous
Disease, affects the lungs forming lesions. Fibrosis of the lung tissue, interference with alveolar
5
function, and enlargement of the return flow, right side, of the heart may eventually result
(Klaassen, 2013, pg 989). Individuals possessing the HLA‐DPB1E69gene are genetically
predisposed to beryllium sensitivity (McCanlies, 2004, Chp.22). Inhaled soluble
beryllium that settles in the lungs is slowly released into the bloodstream. In the bloodstream it
is often bound in a serum of prealbumin and globulins protein (Klaassen, 2013). In addition to
residing in the lungs until it is released, it can also be stored in bone. The “liver, lymph nodes,
spleen, heart, muscle, skin, and kidneys” all may receive a dose of soluble beryllium (Klaassen,
2013). The biological half-life of Be is greater than a year because of the amount of time that it
will remain in bone and the lungs (Klaassen, 2013).
Beryllium is classified by the International Agency for Research on Cancer (IARC) as a
human carcinogen. An increase in the rate in lung cancer cases is associated with exposure; a
higher incidence is linked to acute exposure than it is to chronic exposure (Klaassen, 2013).
2.2. Prevalence of Exposure and Disease
The Center for Disease Control (CDC) estimates that in the U.S. worker population
134,000 workers, (26,000 in the either the Department of Energy or the Department of Defense)
are currently exposed to beryllium (Henneberger, et al. 2004). A cross-sectional study found that
up to ten percent of U.S. workers have beryllium sensitivity. Of this population, ten to 100
percent had developed CBD (NIOSH 2006-2007).
3. Occupational Exposure Limits
Various countries have established occupational exposure limits (OEL) for beryllium
including time-weighted average (TWA), short-term exposure limits (STEL), and ceiling (C)
limits. International beryllium standards for occupational exposure were available through the
World Health Organization (WHO) publication from 1990 and are provided in Table I (WHO
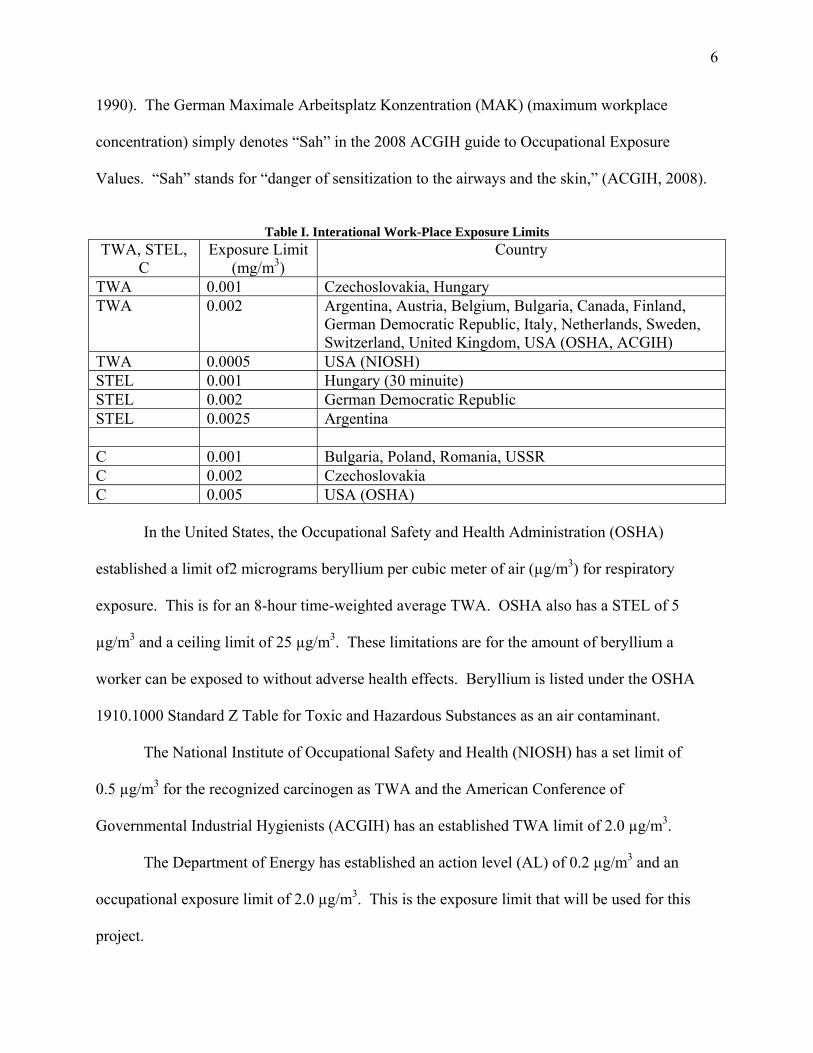
6
1990). The German Maximale Arbeitsplatz Konzentration (MAK) (maximum workplace
concentration) simply denotes “Sah” in the 2008 ACGIH guide to Occupational Exposure
Values. “Sah” stands for “danger of sensitization to the airways and the skin,” (ACGIH, 2008).
Table I. Interational Work-Place Exposure Limits
TWA, STEL, C
Exposure Limit (mg/m3)
Country
TWA 0.001 Czechoslovakia, Hungary TWA 0.002 Argentina, Austria, Belgium, Bulgaria, Canada, Finland,
German Democratic Republic, Italy, Netherlands, Sweden, Switzerland, United Kingdom, USA (OSHA, ACGIH)
TWA 0.0005 USA (NIOSH) STEL 0.001 Hungary (30 minuite) STEL 0.002 German Democratic Republic STEL 0.0025 Argentina C 0.001 Bulgaria, Poland, Romania, USSR C 0.002 Czechoslovakia C 0.005 USA (OSHA)
In the United States, the Occupational Safety and Health Administration (OSHA)
established a limit of2 micrograms beryllium per cubic meter of air (µg/m3) for respiratory
exposure. This is for an 8-hour time-weighted average TWA. OSHA also has a STEL of 5
µg/m3 and a ceiling limit of 25 µg/m3. These limitations are for the amount of beryllium a
worker can be exposed to without adverse health effects. Beryllium is listed under the OSHA
1910.1000 Standard Z Table for Toxic and Hazardous Substances as an air contaminant.
The National Institute of Occupational Safety and Health (NIOSH) has a set limit of
0.5 µg/m3 for the recognized carcinogen as TWA and the American Conference of
Governmental Industrial Hygienists (ACGIH) has an established TWA limit of 2.0 µg/m3.
The Department of Energy has established an action level (AL) of 0.2 µg/m3 and an
occupational exposure limit of 2.0 µg/m3. This is the exposure limit that will be used for this
project.

7
4. Project Specific Information
Beryllium has been machined at Department of Energy facilities since the 1940’s..
Beryllium exposure data has been collected for many years at the facility that specializes in
machining beryllium. The data has been recorded into the central tracking system since 2000.
This report will be used to determine whether a Similar Exposure Group (SEG) can be
established for activities performed at this facility and will be analyzed in order to determine the
necessity for the continuation of air monitoring at the facility.
5. Similar Exposure Group (SEG)
5.1. Developing a SEG
A Similar Exposure Group (SEG) is a group of workers with common risks and similar
exposure that have been grouped together. The similar exposure group may be developed for
workers performing the same task or for workers exposed to the same agent or both. In this case,
all workers performing tasks in the same area were looked at to determine if there is a potential
SEG. Information is provided in the Table I below to show the groups of employees and
variables that were taken into consideration.

8
Table II: Exposure Groups
Maintenance Electrician Fabrication Technician
Machinist Chemist
Hazard Beryllium, electrical, various chemicals
Beryllium, electrical
Beryllium Beryllium, noise
Beryllium, various chemicals
Duration Variable based on task
Variable based on task
Variable based on task
Variable based on task, weekly up to 8 hours/day
Variable based on task
Frequency Variable based on task
Variable based on task
Variable based on task
Daily Variable based on task
Engineering Controls
Variable based on task
Variable based on task
Variable based on task
Variable based on task
Fume Hood
PPE Standard Standard Standard Standard Standard
Standard personal protective equipment for work in the facility includes scrubs as an
undergarment, with coveralls and booties when wearing footwear designated to use at the facility
or two pairs of booties when over footwear not designated to the facility. Full-face
air-purifying respirators used with P100 particulate filters are required for certain tasks.
Respirators are not considered to be standard PPE as they are not required for general entry into
the work area. Respirators are issued by the facility IH for specific tasks with the potential for
airborne beryllium exposure.
Upon leaving the machining area, workers first wash their hands then proceed to the
downdraft area where they remove their outer coveralls, booties, and shoes if they are designated
to the facility. Workers then proceed to the locker room where they are required to shower.
Scrubs and undergarments are placed in a designated receptacle for laundering. Engineering
controls include general ventilation, localized ventilation, and enclosed machines.
After breaking out the variables associated with the workers, it was determined that there
is a lot of variability in the work performed by all of the groups. Work performed by the

9
Machinists showed the least variability and greatest potential for similar exposures and was
further broken down. This group of workers performs several different machining tasks on
various beryllium parts. Some activities are routine while others are for specialty orders. Both
routine and non-routine machining may involve the use of closed or open machines, wet or dry
machining, use of lathes, mills, Computerized Numerical Control (CNC) machines, and wire
cutting tools (See Table II).
Engineering controls and PPE for these operations are the same as described above based
largely on the type of machine being used to shape the item.
Table III: Machinist Tasks
Wet Machining
Dry Machining
Open Machines
Closed Machines
Frequency Duration
Routine Machining of Standard Items
Yes Yes Yes Yes Daily *8 hours per day
Non-routine Machining of Specialty Items
Yes Yes Yes Yes Variable Based on
Need
Variable based on
part
*Standard machining work shift for the machinists at this facility is 8 hours per day 5 days per week.
5.2. Exposure Assessment and Sampling
Air monitoring using personal sampling pumps has been performed and recorded in the
central data tracking system from between 2000 to the present. This data will be looked at to
determine if it supports the existence of a Similar Exposure Group and it will also be statistically
evaluated to determine the need for future sampling.

10
5.2.1. Introduction of Sampling Data
Including 4,728 blanks, a total of 39,231 personal air, area air, and surface wipe samples
were submitted for analysis during the time period of September 1, 2000 to October 31, 2013.
Personal air sample were collected from the breathing zone of the employee using pre-
calibrated personal sampling pumps with sampling train including 0.8-μm cellulose ester
membrane filters. Samples were pre calibrated to a range between 1 and 4 liters per minute
(LPM) and the pumps were post calibrated after the samples had been collected. Sampling
pumps are calibrated using a primary standard calibrator in line with tubing connecting it to the
inlet of the sample cassette and tubing connecting the cassette to the sample pump. The
Defender® 520 is typically used.
Samples were submitted to ALS, Analytical Laboratory (formerly DataChem) in Salt
Lake City, Utah for analysis throughout the eight-year collection period. Samples were analyzed
using the National Institute of Safety and Health (NIOSH) Analytical Method Number 7300 for
beryllium. The analytical method uses inductively coupled argon plasma, atomic emission
spectroscopy (ICP-AES) to determine the amount of beryllium collected onto the sample filter
(NIOSH 2013).
5.2.2. Data Set Criteria
The first step in sorting the available data was to separate out personal air samples from
surface wipe and area air samples. Second, the job titles of the individuals were sorted to select
only those that were Machinists. Activities such as maintenance, chemists, carpenters,
electricians, technicians, staff members, machinist fabrication technicians, health and safety
support, management, and any other non-machining activities were removed from the data set.
Non-routine machining activities were separated out from routine machining activities.

11
Eight-hour TWA samples were separated from task sampling, samples with incomplete data in
the tracking database, and samples with a pre-/post-flow rate difference of the pump exceeding
ten percent were not included in the data. In the end, a total of 914 air samples meeting the
criteria have been collected. Air sample data is presented in Table VI in Appendix A.
Further narrowing down the available data set, the laboratory limit of quantitation (LOQ)
or reporting limit (RL) was reviewed for each sample to account for variations in laboratory’s
technological capabilities over the course of the sample collection period. Sample results prior
to the end of 2011 have a higher analytical reporting limit, up to 0.03 micrograms per sample.
The reporting limit recorded in the tracking database dropped to 0.013 micrograms per sample
starting with December 6, 2011 data. The laboratory’s method to determine limit of detection
(LOD) in the earlier samples was not available. Presently, samples with an LOQ/RL of 0.013 µg
also have an LOD of 0.0038 µg per sample. Samples prior to the reduction in the reporting limit
will not be used for determining whether sampling can be terminated. The reason for this is to
establish consistency in the data that will be used to make the determinations.
Samples collected for open and closed, and wet and dry machining processes with only
general ventilation were chosen for this evaluation. One hundred ninety-two (192) samples
remained in the sample set.
Data was downloaded from the central database housing the information on the collected
samples and imported into IHDataAnalyst V1.27.
5.2.3. Software Used to Evaluate Data
The data software that was selected for this project is IHDataAnalyst V1.27 (herein
referred to as IHDA). The software is commercially available through Exposure Assessment
Solutions (EASi) and can be purchased and downloaded from the Internet. Raw data is provided

12
as an attachment. Names and identifying information of workers have been removed to preserve
their privacy.
Once entered into IHDA, each data point was reviewed. Data below the analytical
laboratory’s LOQ was censored. Censored data is presented in IHDA as one-half of the LOQ or
0.0065 µg/m3. These data points are important therefore, they need to be included in the
statistical analysis. Since we know the true value of the left-censored data must fall between
zero and the LOQ we have selected to use half the LOQ. This is a simple way to account for the
data and is a commonly accepted practice that has been evaluated by others (Croghan and
Egeghy).
5.3. Statistical Evaluation of the Data
5.3.1. Frequency of Distribution
The frequency of distribution of the exposures is presented in Table III and illustrated by
the histogram in Figure 4. One hundred seventy-one (171) of the sample results were below the
RL of 0.013 µg, 21 were below 0.1 µg/m3 (half of the AL), and no sample results were over.
The data is right skewed.
Table IV: Frequency Distribution of Exposures
Average TWA Concentration (µg/m3)
Frequency
< RL (0.013 µg) 171 > 0.013 – < 0.1 21
> 0.1 - < 0.2 0 > 0.2 0 Total 192

13
Figure 4. Frequency Distribution Histogram
5.3.2. Statistical Data
One hundred ninety two (192) samples were entered into the software program for
analysis. The sample data ranged from 0.0043 to 0.0651 µg/m3 with a median exposure of
0.0047 µg/m3. The data set mean is, 0.0121, with a standard deviation (sd) of 0.0721, geometric
mean (gm) of 0.0058, and a geometric standard deviation (gsd) of 1.8822.
The confidence interval (CI) was set to 95% with a 95% Lower Confidence Limit (LCL)
and 95% Upper Confidence Limits (UCL) for regulatory compliance with OSHA standards. The
calculated LCL is 0.0146 with an UCL of 0.0185. At this level, we are confident that 95% of the
true values of the samples will fall within the range of the LCL to the UCL, 0.0146 to 0.0185.
These concentrations are well below the DOE AL of 0.2 μg/m3 and the ACGIH and OSHA TWA
of 2.0 μg/m3. The Exceedance Fraction (percent above the OEL) for both is estimated to be less
than 0.001%, significantly below the standard 5%. A summary of the statistical data from IHDA
is provided in Table IV. Figure 5 provides a Goodness of Fit Chart. This chart could be used to
evaluate new data to see how well it fits with the existing data. In determining OSHA
compliance, the UCL is < 1, therefore, there is no violation.

14
Table V. Summary of IHDA Statistics
Parameter Result (µg/m3) Data Range 0.0043 to 0.0651 Median 0.0047 Mean 0.0121 SD 0.0721 GM 0.0058 GSD 1.8822 LCL compliance 0.0146 UCL compliance 0.0185
Figure 5. Goodness of Fit Chart
Figure 6. Log Probability Chart

15
Figure 6 charts the log probability for the existing data. The data does not appear to be
log normal as industrial hygiene sampling data tends to be. However, one can see that if the
censored data were not included in the chart, it would appear log normal.
5.3.2.1. Bayesian Analysis
The calculated Bayesian Analysis data is provided in Table V below and graphically
displayed in the following charts.
Table VI. Bayesian Decision Analysis
Exposure Rating
0-T 1-HC 2-WC 3-C 4-PC
Cutoff (ug.m3)
0.02 0.2 1 2 >2
Cutoff (%OEL)
1 10 50 100 >100
Prior 0.2 0.2 0.2 0.2 0.2 Likelihood 1.000 0.000 0.000 0.000 0.000 Posterior 1.000 0.000 0.000 0.000 0.000 Cumulative Likelihood
1.000 1.000 1.000 1.000
Cumulative Posterior
1.000 1.000 1.000 1.000
Table created by IHDA. Notes: 0 – T = negligible or trivial exposure 1-HC = highly controlled 2-WC = well controlled 3-C = controlled 4-PC = poorly controlled
The probability of the decision statistic falling into each of the exposure rating categories
is 0.2 or 1/5th for each category prior to analyzing the data (See Figure 7). An even breakdown
of probability was chosen for the Prior Graph before the data was calculated and reviewed to
illustrate the there was a 0.2 percent chance of the data falling into any of the rating categories.

16
Figure 7. Prior Graph
The likelihood of the sample result falling in the first category is 1 or 100% based on the
sampling data (See Figure 8).
Figure 8. Likelihood Graph
Figure 9. Posterior Graph
17
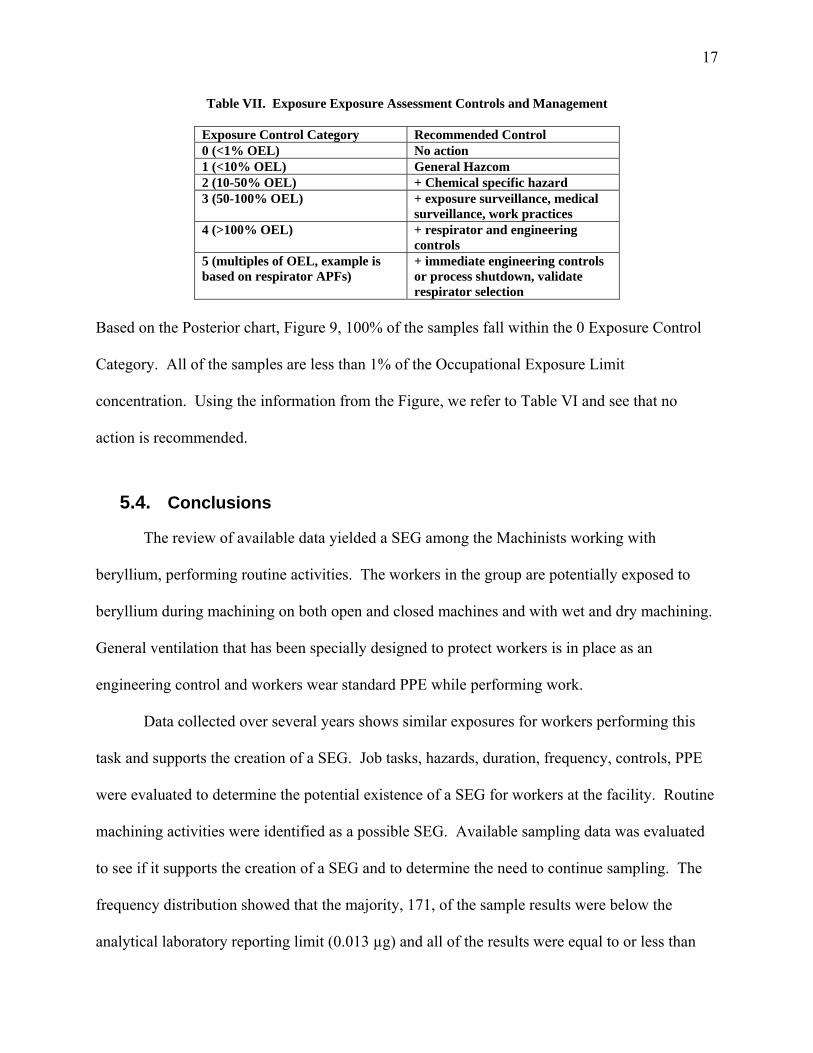
Table VII. Exposure Exposure Assessment Controls and Management
Exposure Control Category Recommended Control 0 (<1% OEL) No action 1 (<10% OEL) General Hazcom 2 (10-50% OEL) + Chemical specific hazard 3 (50-100% OEL) + exposure surveillance, medical
surveillance, work practices 4 (>100% OEL) + respirator and engineering
controls 5 (multiples of OEL, example is based on respirator APFs)
+ immediate engineering controls or process shutdown, validate respirator selection
Based on the Posterior chart, Figure 9, 100% of the samples fall within the 0 Exposure Control
Category. All of the samples are less than 1% of the Occupational Exposure Limit
concentration. Using the information from the Figure, we refer to Table VI and see that no
action is recommended.
5.4. Conclusions
The review of available data yielded a SEG among the Machinists working with
beryllium, performing routine activities. The workers in the group are potentially exposed to
beryllium during machining on both open and closed machines and with wet and dry machining.
General ventilation that has been specially designed to protect workers is in place as an
engineering control and workers wear standard PPE while performing work.
Data collected over several years shows similar exposures for workers performing this
task and supports the creation of a SEG. Job tasks, hazards, duration, frequency, controls, PPE
were evaluated to determine the potential existence of a SEG for workers at the facility. Routine
machining activities were identified as a possible SEG. Available sampling data was evaluated
to see if it supports the creation of a SEG and to determine the need to continue sampling. The
frequency distribution showed that the majority, 171, of the sample results were below the
analytical laboratory reporting limit (0.013 µg) and all of the results were equal to or less than

18
0.1 μg/m3, half of the reporting limit that has been set at 1/10th of the OEL. One hundred ninety-
two personal breathing zone air samples meeting the SEG criteria established for this project
have been collected since September2000. The data statistically shows that there is a calculated
less than 0.001 percent chance of over exposure to an employee working under these conditions.
The GSD for this data set was 1.8822 typical GSD of IH data is 2 to 3. There is slightly less
variation in this data set than may be expected. The Goodness of Fit chart could be used to
determine if a new data point belongs in this set. In this data set there was the large number of
sample results that were below the reporting limit. On the chart, it does not appear that this data
fits. However, the data above the RL fits well together and could be illustrated by adding a
Goodness of Fit Line to the chart. Statistical analysis of the data supports the idea of making this
activity under the given conditions a SEG. The data supports the conclusion that sampling efforts
can, with confidence be reduced as prescribed by the DOE Laboratory policy. If changes do
occur, the Bayesian Decision analysis can be performed with far fewer samples as it typically is.
Any changes in controls or procedures will prompt a reevaluation of the SEG and potential
exposures.
In the future, the exposure groups may be further subdivided to identify other SEGs. Due
to variations in exposures it is unlikely that there will be a SEG with more than one discipline
such as Maintenance and Fabrication. Should another potential SEG be identified, existing data
will be identified. If needed, additional sampling will be performed. The data will then be
statistically analyzed using IHDA and evaluated to determine compliance and if it supports the
creation of a new SEG.

19
References Cited
Agency for Toxic Substances and Disease Registry. Public Health Statement Beryllium
ATDSTR PHS – Beryllium CAS# 7440-41-7. September 2002.
American Conference of Governmental Industrial Hygienists. Guide to Occupational Exposure
Values. 2008.
Beryllium Science and Technology Association. Properties of Pure Beryllium. 2015 Retrieved
from http://beryllium.eu/about-beryllium-and-beryllium-alloys/properties-of-
beryllium/properties-of-pure-beryllium/
Cooper, R. G., and Harrison, A. P. (2009). The uses and adverse effects of beryllium on health.
Indian Journal of Occupational and Environmental Medicine, 13, 65-76. Retrieved from
http://www.ijoem.com/text.asp?2009/13/2/65/55122
Croghan, Carry W., and Egeghy, Peter P. US-EPA, Research Triangle Park, NC and US-EPA,
Las Vegas, NM. Methods of Dealing with Values Below the Limit of Detection using
SAS. Retrieved from http://analytics.ncsu.edu/sesug/2003/SD08-Croghan.pdf
Henneberger, P.K.; Goe, S.K.; Miller, W.E.; Doney, B.; Groce D.W. (2004). Journal of
Occupational and Environmental Hygiene, 2004 Oct; 1(10):648-659, Industries in the
United States with airborne beryllium exposure and estimates of the number of current
workers potentially exposed.
Klaassen, Curtis D. Casarett & Doull’s Toxicology: The Basic Science of Poisons-
8th ed.. McGraw-Hill Publishers, New York, 2013.
McCanlies, E. C., Andrew M. E., and Weston A. (2004). CDC, Part IV Human Genome
Epidemiology: Case Studies: Using human genome epidemiology information to
improve health. Chapter 22, Immunogenetic Factors in Chronic Beryllium Disease.

20
National Research Council Managing Health Effects of Beryllium Exposure by Committee on
Beryllium Alloy Exposures, Committee on Toxicology, Published by National
Academies Press, Washington, DC, 2008.
National Institute of Occupational Safety and Health. Method 7300, ed. 3. Elements by ICP.
March 15, 2003.
National Institute of Occupational Safety and Health. NIOSH Respiratory Disease Research
Program, 3.4 Chronic Beryllium Disease. Evidence package for the National Academies’
Review 2006-2007.
World Health Organization, IPCS International Programme on Chemical Safety, Health and
Safety Guide No. 44, Beryllium. Geneva, Switzerland. 1990.

21
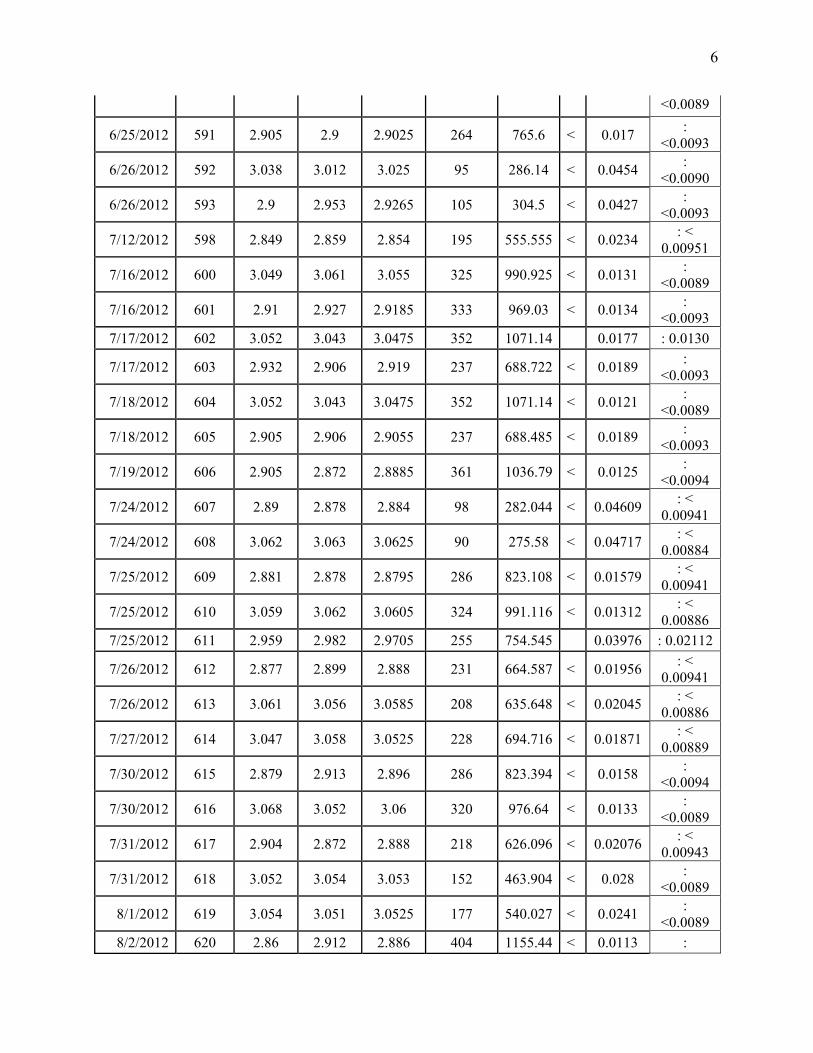
Appendix A: Table VII. Raw Data

1
Sample Date
Sample ID
Start Flow
(LPM)
Stop Flow
(LPM)
Avg Flow
(LPM)
Total Time
Air Volume
Concen-tration
TWA Result
(ug/m3) (Minutes) (L)
12/6/2011 438 3.213 3.171 3.192 221 700.791 < 0.01855 : <
0.00854
12/7/2011 439 2.982 3.157 3.0695 287 855.834 0.09231 : 0.05519
12/8/2011 440 3.226 2.927 3.0765 321 939.567 < 0.01855 : <
0.00854
12/9/2011 441 3.886 3.192 3.539 302 963.984 < 0.01855 : <
0.00854
1/12/2012 444 3.029 3.008 3.0185 268 806.1 < 0.0161 :
<0.0090
1/17/2012 445 3.036 3.058 3.047 238 722.6 < 0.01799 : <
0.00892
1/17/2012 446 2.913 2.911 2.912 59 171.7 < 0.07571 : <
0.00931
1/17/2012 447 3.02 3.267 3.1435 286 863.7 < 0.01505 : <
0.00897
1/18/2012 448 3.061 3.055 3.058 327 999 < 0.01301 : <
0.00886
1/18/2012 449 3.026 3.097 3.0615 325 983.5 < 0.01322 : <
0.00895
1/19/2012 450 3.071 3.08 3.0755 239 734 < 0.01771 : <
0.00882
1/19/2012 451 3.027 3.062 3.0445 423 1280.4 < 0.01015 : <
0.00894
1/20/2012 452 3.077 3.061 3.069 277 847.9 < 0.01533 : <
0.00885
1/30/2012 453 3.074 3.05 3.062 428 1305.4 < 0.0176 :
<0.0157
1/30/2012 454 3.015 3.077 3.046 378 1139.7 < 0.0114 :
<0.0090
1/31/2012 455 3.627 3.033 3.33 325 985.7 < 0.0233 :
<0.0158
2/1/2012 456 3.035 3.569 3.302 236 716.3 < 0.0321 :
<0.0158
2/2/2012 457 3.082 3.045 3.0635 439 1336.8 < 0.0172 :
<0.0157
2/2/2012 458 3.036 3.009 3.0225 486 1462.4 < 0.0157 :
<0.0159
2/3/2012 459 3.045 3.057 3.051 336 1023.1 < 0.0225 :
<0.0157
2/13/2012 461 3.04 3.041 3.0405 499 1516.96 < 0.00857 : <
0.00891
2/14/2012 462 3.078 3.063 3.0705 427 1307.9 < 0.00994 : <
0.00884
2/14/2012 463 3.043 3.085 3.064 426 1296.32 < 0.01003 : <
0.0089

2
2/15/2012 464 3.078 3.05 3.064 369 1125.45 < 0.01155 : <
0.00888
2/15/2012 465 3.05 3.079 3.0645 363 1107.15 < 0.01174 : <
0.00888
2/16/2012 466 3.039 3.058 3.0485 195 592.605 < 0.02194 : <
0.00891
2/16/2012 467 3.012 3.026 3.019 245 737.94 < 0.01762 : <
0.00899
2/17/2012 468 3.064 3.07 3.067 358 1096.91 < 0.01185 : <
0.00884
2/17/2012 469 3.033 3.032 3.0325 353 1070.3 < 0.01215 : <
0.00894
2/20/2012 470 3.087 3.065 3.076 380 1164.7 < 0.0112 :
<0.0088
2/20/2012 471 2.948 2.933 2.9405 384 1126.3 < 0.0115 :
<0.0092
2/21/2012 472 3.05 3.057 3.0535 399 1217 < 0.0107 :
<0.0089
2/21/2012 473 2.926 2.861 2.8935 393 1124.4 < 0.0116 :
<0.0095
2/22/2012 474 3.064 3.043 3.0535 292 888.6 < 0.0146 :
<0.0089
2/22/2012 475 2.861 2.933 2.897 226 646.6 < 0.0201 :
<0.0095 2/28/2012 476 3.078 3.05 3.064 258 786.9 0.0432 : 0.0232
2/28/2012 477 2.955 2.92 2.9375 253 738.8 < 0.0176 :
<0.0093
2/29/2012 478 3.049 3.08 3.0645 200 609.8 < 0.0213 :
<0.0089
2/29/2012 479 2.92 2.942 2.931 358 1045.4 < 0.0124 :
<0.0093 3/1/2012 480 3.083 3.059 3.071 408 1248.07 0.0232 : 0.0198
3/1/2012 481 2.945 2.944 2.9445 434 1277.7 < 0.0102 :
<0.0092
3/2/2012 482 3.062 3.059 3.0605 408 1248.07 < 0.0104 :
<0.0089
3/2/2012 483 2.943 2.944 2.9435 434 1277.26 < 0.0102 :
<0.0092
3/12/2012 484 3.054 3.058 3.056 260 794.04 < 0.0164 :
<0.0089
3/12/2012 485 2.921 2.885 2.903 355 1024.18 < 0.0127 :
<0.0094
3/13/2012 486 3.039 3.04 3.0395 257 781.023 < 0.0166 :
<0.0089
3/13/2012 487 2.921 3.302 3.1115 258 753.618 < 0.0173 :
<0.0093
3/14/2012 488 3.036 3.03 3.033 160 484.8 < 0.0268 :
<0.0089

3
3/14/2012 489 2.918 2.91 2.914 155 451.05 < 0.0288 :
<0.0093
3/15/2012 490 3.036 3.057 3.0465 193 585.948 < 0.0222 :
<0.0089
3/15/2012 491 2.906 2.898 2.902 191 553.518 < 0.0235 :
<0.0093
3/16/2012 492 3.045 3.076 3.0605 146 444.57 < 0.0292 :
<0.0089
4/11/2012 518 3.025 3.029 3.027 235 710.9 < 0.0183 :
<0.0090
4/11/2012 519 2.895 2.851 2.873 125 356.4 < 0.0365 :
<0.0095
4/24/2012 520 3.031 3.04 3.0355 156 472.836 < 0.0275 :
<0.0089
4/24/2012 521 2.914 2.909 2.9115 156 453.804 < 0.0286 :
<0.0093
4/25/2012 522 3.039 3.055 3.047 219 665.541 < 0.0195 :
<0.0089
4/25/2012 523 2.912 2.912 2.912 185 538.72 0.1058 : 0.0408
5/1/2012 524 3.038 3.05 3.044 222 674.436 < 0.0193 :
<0.0089
5/1/2012 525 2.908 2.923 2.9155 324 942.192 < 0.0138 :
<0.0093
5/2/2012 526 3.049 3.033 3.041 191 579.303 < 0.0224 :
<0.0089
5/2/2012 527 2.923 3.397 3.16 333 973.359 < 0.0134 :
<0.0093
5/3/2012 528 2.918 3.042 2.98 311 907.498 < 0.0143 :
<0.0093
5/3/2012 529 2.918 2.843 2.8805 126 358.218 < 0.0363 :
<0.0095
5/4/2012 530 3.038 3.043 3.0405 306 929.628 < 0.0104 :
<0.0089
5/4/2012 531 2.84 2.906 2.873 293 832.12 < 0.0156 :
<0.0095
5/5/2012 532 3.035 3.043 3.039 394 1195.79 < 0.0109 :
<0.0089
5/5/2012 533 2.905 2.855 2.88 414 1181.97 < 0.011 :
<0.0095
5/6/2012 534 3.019 3.047 3.033 376 1135.14 0.0326 : 0.0255
5/6/2012 535 2.852 2.846 2.849 495 1408.77 < 0.0092 :
<0.0095
5/7/2012 536 3.038 3.028 3.033 227 687.356 < 0.0189 :
<0.0089
5/7/2012 537 2.85 2.85 2.85 364 1037.4 < 0.0125 :
<0.0095
5/8/2012 538 3.038 3.022 3.03 136 410.992 0.1071 : 0.0303
5/9/2012 539 3.024 3.049 3.0365 366 1106.78 < 0.0117 :

4
<0.0090
5/9/2012 540 2.9 2.942 2.921 240 696 < 0.0187 :
<0.0093
5/10/2012 541 3.051 3.021 3.036 261 788.481 < 0.0165 :
<0.0090
5/10/2012 542 2.947 2.911 2.929 74 215.414 < 0.0603 :
<0.0093
5/14/2012 543 3.019 3.035 3.027 252 760.788 < 0.0171 :
<0.0090
5/14/2012 544 3.387 2.854 3.1205 122 348.188 < 0.0373 :
<0.0095
5/15/2012 545 3.032 3.053 3.0425 138 418.416 < 0.0311 :
<0.0089
5/15/2012 546 2.854 2.914 2.884 173 493.742 < 0.0263 :
<0.0095
5/16/2012 547 3.051 3.044 3.0475 402 1223.69 < 0.0106 :
<0.0089 5/16/2012 548 2.916 2.855 2.8855 367 1047.79 0.0334 : 0.0255
5/21/2012 549 3.042 3.04 3.041 152 462.08 < 0.0281 :
<0.0089 5/21/2012 550 2.949 2.869 2.909 190 545.11 0.0238 : 0.0094
5/22/2012 551 3.044 3.066 3.055 238 724.472 < 0.0179 :
<0.0089
5/22/2012 552 2.87 2.933 2.9015 270 774.9 < 0.0168 :
<0.0094
5/23/2012 553 2.928 2.938 2.933 229 670.512 < 0.0194 :
<0.0092
5/24/2012 554 3.048 3.026 3.037 307 928.982 < 0.014 :
<0.0090
5/24/2012 555 2.932 2.85 2.891 383 1091.55 < 0.0119 :
<0.0095
5/29/2012 556 2.914 2.901 2.9075 320 928.32 0.0248 : 0.0165
5/29/2012 557 3.041 3.038 3.0395 198 601.524 0.0399 : 0.0165
5/30/2012 558 2.91 2.899 2.9045 215 623.285 < 0.0209 :
<0.0093
5/30/2012 559 3.041 3.054 3.0475 290 881.89 < 0.0147 :
<0.0089
5/31/2012 560 2.849 2.937 2.893 207 589.743 < 0.0217 :
<0.0094
5/31/2012 561 3.047 3.054 3.0505 187 569.789 < 0.0228 :
<0.0089
6/1/2012 562 2.929 2.867 2.898 340 974.78 < 0.0133 :
<0.0094
6/1/2012 563 3.046 3.051 3.0485 320 974.72 < 0.0133 :
<0.0089
6/4/2012 564 2.924 2.906 2.915 364 1057.78 < 0.0123 :
<0.0093

5
6/4/2012 565 3.04 3.047 3.0435 264 802.56 0.0449 : 0.0247
6/5/2012 566 2.905 2.903 2.904 249 722.847 < 0.018 :
<0.0093
6/5/2012 567 3.048 3.055 3.0515 259 789.432 < 0.0165 :
<0.0089
6/7/2012 568 2.906 2.827 2.8665 363 1026.2 < 0.0127 :
<0.0096
6/7/2012 569 3.066 3.044 3.055 289 879.716 < 0.0148 :
<0.0089
6/8/2012 570 3.04 2.873 2.9565 332 953.836 < 0.0136 :
<0.0094
6/8/2012 571 3.04 3.036 3.038 309 938.124 < 0.0139 :
<0.0089
6/9/2012 572 2.908 2.851 2.8795 308 878.108 < 0.0148 :
<0.0095
6/9/2012 573 3.033 3.046 3.0395 294 891.702 < 0.0146 :
<0.0089
6/11/2012 574 3.041 3.038 3.0395 207 628.866 < 0.0207 :
<0.0089
6/11/2012 575 2.851 2.849 2.85 351 999.999 < 0.013 :
<0.0095
6/12/2012 576 3.034 3.048 3.041 359 1089.21 < 0.0119 :
<0.0089
6/12/2012 577 2.855 2.904 2.8795 316 902.18 < 0.0144 :
<0.0095
6/13/2012 578 3.042 3.041 3.0415 240 729.84 < 0.0178 :
<0.0089
6/13/2012 579 2.915 2.865 2.89 376 1077.24 < 0.0121 :
<0.0095
6/14/2012 580 3.038 3.063 3.0505 164 498.232 < 0.0261 :
<0.0089
6/14/2012 581 2.902 2.854 2.878 288 821.952 < 0.0158 :
<0.0095
6/18/2012 582 3.051 3.047 3.049 183 557.601 < 0.02331 : <
0.00889
6/18/2012 583 2.855 2.862 2.8585 153 436.815 < 0.02976 : <
0.00949 6/19/2012 584 3.056 3.043 3.0495 352 1071.14 0.02054 : 0.01506
6/19/2012 585 2.924 2.856 2.89 358 1022.45 < 0.01271 : <
0.00948
6/20/2012 586 3.053 3.059 3.056 291 888.423 < 0.01463 : <
0.00887
6/20/2012 587 2.857 2.906 2.8815 331 945.667 < 0.01375 : <
0.00948 6/21/2012 588 2.904 2.836 2.87 405 1148.58 0.01132 : 0.00955
6/22/2012 589 3.04 3.027 3.0335 260 787.02 < 0.01652 : <
0.00895 6/25/2012 590 3.031 3.043 3.037 264 800.184 < 0.0162 :
6
<0.0089
6/25/2012 591 2.905 2.9 2.9025 264 765.6 < 0.017 :
<0.0093
6/26/2012 592 3.038 3.012 3.025 95 286.14 < 0.0454 :
<0.0090
6/26/2012 593 2.9 2.953 2.9265 105 304.5 < 0.0427 :
<0.0093
7/12/2012 598 2.849 2.859 2.854 195 555.555 < 0.0234 : <
0.00951
7/16/2012 600 3.049 3.061 3.055 325 990.925 < 0.0131 :
<0.0089
7/16/2012 601 2.91 2.927 2.9185 333 969.03 < 0.0134 :
<0.0093
7/17/2012 602 3.052 3.043 3.0475 352 1071.14 0.0177 : 0.0130
7/17/2012 603 2.932 2.906 2.919 237 688.722 < 0.0189 :
<0.0093
7/18/2012 604 3.052 3.043 3.0475 352 1071.14 < 0.0121 :
<0.0089
7/18/2012 605 2.905 2.906 2.9055 237 688.485 < 0.0189 :
<0.0093
7/19/2012 606 2.905 2.872 2.8885 361 1036.79 < 0.0125 :
<0.0094
7/24/2012 607 2.89 2.878 2.884 98 282.044 < 0.04609 : <
0.00941
7/24/2012 608 3.062 3.063 3.0625 90 275.58 < 0.04717 : <
0.00884
7/25/2012 609 2.881 2.878 2.8795 286 823.108 < 0.01579 : <
0.00941
7/25/2012 610 3.059 3.062 3.0605 324 991.116 < 0.01312 : <
0.00886 7/25/2012 611 2.959 2.982 2.9705 255 754.545 0.03976 : 0.02112
7/26/2012 612 2.877 2.899 2.888 231 664.587 < 0.01956 : <
0.00941
7/26/2012 613 3.061 3.056 3.0585 208 635.648 < 0.02045 : <
0.00886
7/27/2012 614 3.047 3.058 3.0525 228 694.716 < 0.01871 : <
0.00889
7/30/2012 615 2.879 2.913 2.896 286 823.394 < 0.0158 :
<0.0094
7/30/2012 616 3.068 3.052 3.06 320 976.64 < 0.0133 :
<0.0089
7/31/2012 617 2.904 2.872 2.888 218 626.096 < 0.02076 : <
0.00943
7/31/2012 618 3.052 3.054 3.053 152 463.904 < 0.028 :
<0.0089
8/1/2012 619 3.054 3.051 3.0525 177 540.027 < 0.0241 :
<0.0089 8/2/2012 620 2.86 2.912 2.886 404 1155.44 < 0.0113 :

7
<0.0095
8/2/2012 621 3.048 3.06 3.054 176 536.448 < 0.0242 :
<0.0089
8/3/2012 622 2.906 2.912 2.909 404 1174.02 < 0.0111 :
<0.0093
8/3/2012 623 3.055 3.06 3.0575 176 537.68 < 0.0242 :
<0.0089
8/4/2012 624 2.906 2.904 2.905 496 1440.38 < 0.009 :
<0.0093
8/4/2012 625 3.055 3.024 3.0395 447 1351.73 < 0.0096 :
<0.0090
8/5/2012 626 3.039 3.045 3.042 372 1130.51 < 0.0115 :
<0.0089
8/5/2012 627 2.898 2.888 2.893 522 1507.54 < 0.0086 :
<0.0094
8/7/2012 628 3.039 3.038 3.0385 176 534.688 < 0.02431 : <
0.00891
8/7/2012 629 2.887 2.863 2.875 184 526.792 < 0.02468 : <
0.00946
8/8/2012 630 3.035 3.032 3.0335 193 585.176 < 0.02222 : <
0.00893
8/8/2012 631 2.865 2.869 2.867 212 607.38 < 0.0214 : <
0.00945 8/9/2012 632 3.035 3.033 3.034 121 366.993 0.04087 : 0.0103
8/9/2012 633 2.876 7.873 5.3745 120 345.12 < 0.03767 : <
0.00942
8/13/2012 634 2.873 2.879 2.876 121 347.633 0.04027 : 0.01015
8/15/2012 635 3.033 3.128 3.0805 138 418.554 < 0.03106 : <
0.00893
8/16/2012 636 2.878 2.909 2.8935 58 166.924 < 0.0779 :
<0.0094
8/16/2012 637 3.046 3.027 3.0365 226 684.102 < 0.019 : <
0.00895
8/20/2012 638 3.028 3.038 3.033 215 651.02 < 0.01997 : <
0.00894
8/23/2012 639 2.922 2.919 2.9205 324 945.756 < 0.01375 : <
0.00928
8/23/2012 640 3.033 3.056 3.0445 176 533.808 < 0.02435 : <
0.00893
9/10/2012 654 2.183 2.178 2.1805 216 470.448 < 0.02763 : <
0.01243
9/11/2012 655 2.183 2.188 2.1855 292 637.436 < 0.02039 : <
0.0124
9/13/2012 656 2.169 2.169 2.169 308 668.052 < 0.01946 : <
0.01249
11/8/2012 681 2.969 2.951 2.96 280 826.28 < 0.02784 : <
0.01624 11/9/2012 682 2.968 2.976 2.972 305 905.24 < 0.02541 : <

8
0.01615
11/14/2012 686 2.987 2.967 2.977 374 1109.66 < 0.02073 : <
0.01615
11/15/2012 688 3.541 3.01 3.2755 258 776.58 < 0.02073 : <
0.01615
11/16/2012 689 2.993 2.972 2.9825 253 751.916 < 0.02073 : <
0.01615
11/17/2012 690 3.22 3.032 3.126 200 606.4 < 0.02073 : <
0.01615
11/18/2012 691 2.929 3.052 2.9905 372 1089.59 < 0.02073 : <
0.01615 1/14/2013 718 3.042 3.042 3.042 68 206.856 0.45926 : 0.06506
1/14/2013 719 2.248 2.282 2.265 126 283.248 0.19418 : 0.05097
1/16/2013 722 2.282 2.205 2.2435 270 595.35 < 0.02184 : <
0.01229
6/10/2013 783 3.024 3.015 3.0195 256 771.84 < 0.01684 : <
0.00898
6/12/2013 786 3.019 3.028 3.0235 261 787.959 < 0.0165 : <
0.00897
6/13/2013 787 3.033 3.01 3.0215 285 857.85 < 0.01515 : < 0.009
7/9/2013 809 3.025 2.978 3.0015 295 878.51 0.02049 : 0.01259
7/10/2013 810 2.999 2.988 2.9935 225 672.3 < 0.01934 : <
0.00907
7/11/2013 811 3.026 2.99 3.008 335 1001.65 < 0.01298 : <
0.00906
7/12/2013 812 3.028 2.996 3.012 169 506.324 < 0.02568 : <
0.00904 8/6/2013 828 2.997 3.018 3.0075 280 839.16 0.01668 : 0.00973
8/10/2013 832 2.932 2.997 2.9645 343 1005.68 < 0.01293 : <
0.00924


