Analysis of RSPO certification and surveillance …Analysis of RSPO certification and surveillance...
50
Analysis of RSPO certification and surveillance audit reports across Indonesia, Malaysia and the Rest of the World Simon Lord and Katrina Durham Global Sustainability Associates 18 Duxton Hill Singapore 089601
Transcript of Analysis of RSPO certification and surveillance …Analysis of RSPO certification and surveillance...

Analysis of RSPO certification and surveillance audit reports across Indonesia, Malaysia and the Rest of the
World
Simon Lord and Katrina Durham
Global Sustainability Associates
18 Duxton Hill
Singapore 089601

2 Report compiled by Global Sustainability Associates
March 2013
Contents
List of Tables ................................................................................................................................... 3
List of Figures ................................................................................................................................. 4
1.0 Executive Summary ......................................................................................................... 5
2.0 Introduction .......................................................................................................................... 6
3.0 Aims and objectives ........................................................................................................ 6
4.0 Scope ....................................................................................................................................... 7
5.0 Methodology ......................................................................................................................... 7
6.0 Results .................................................................................................................................... 9
6.1 Overview of Principles and Criteria ....................................................................................... 9
6.2 Comparison of expected versus observed non conformances ......................................... 9
6.3 Overview of criteria and indicators by country ................................................................... 14
6.3.1 Indonesia ............................................................................................................................. 15
6.3.2 Malaysia ............................................................................................................................... 20
6.3.3 Papua New Guinea ............................................................................................................ 25
6.3.4 Solomon Islands, Colombia and Brazil ........................................................................... 26
6.4 Independent Smallholders .................................................................................................... 26
6.5 A comparison of countries with estates and smallholders ............................................... 27
7.0 Conclusion .......................................................................................................................... 29
8.0 References .......................................................................................................................... 32
9.0 Appendices ......................................................................................................................... 33
9.1 Appendix A - Definitions ........................................................................................................ 33
9.2 Appendix B - The RSPO Principles and Criteria ............................................................... 34
9.3 Appendix C – Indonesia Data Tables .................................................................................. 37
9.4 Appendix D – Malaysia Data Tables ................................................................................... 41
9.5 Appendix E – Papua New Guinea and Solomon Islands data table relating to estates
with all other smallholders ................................................................................................................. 44
9.6 Appendix F – Colombia and Brazil data table relating to estates with schemed
smallholders ........................................................................................................................................ 48
3 Report compiled by Global Sustainability Associates
March 2013
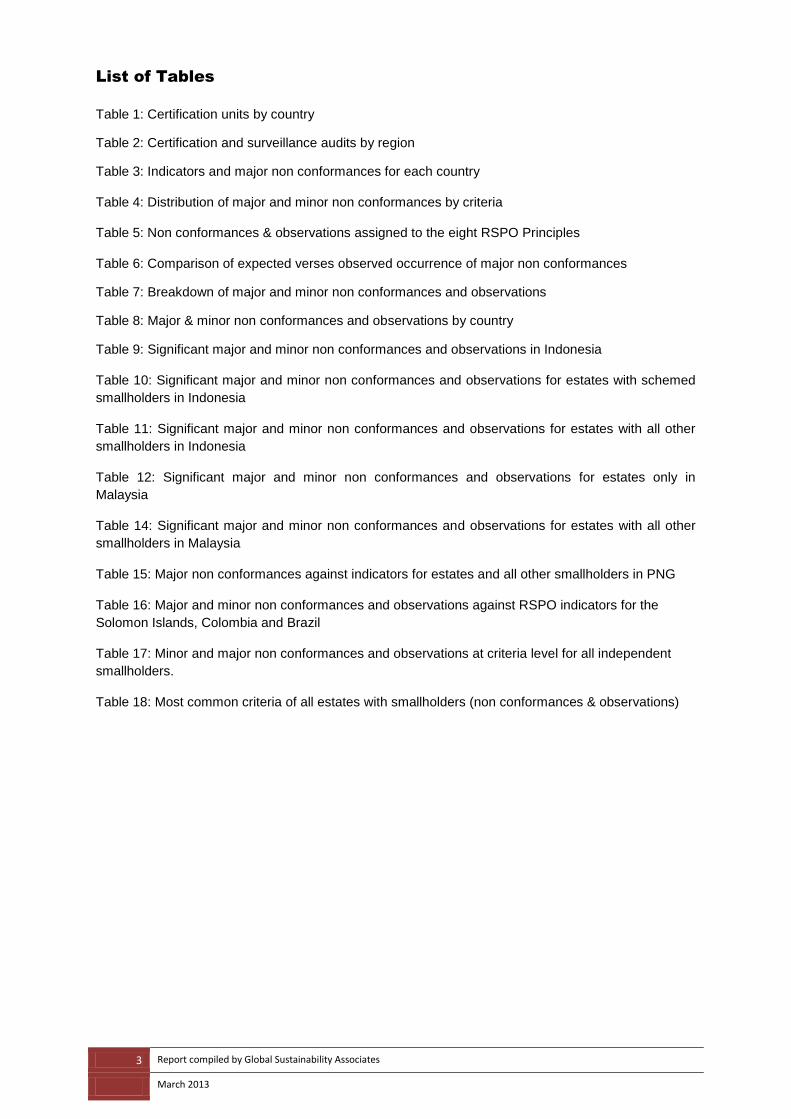
List of Tables
Table 1: Certification units by country
Table 2: Certification and surveillance audits by region
Table 3: Indicators and major non conformances for each country
Table 4: Distribution of major and minor non conformances by criteria Table 5: Non conformances & observations assigned to the eight RSPO Principles Table 6: Comparison of expected verses observed occurrence of major non conformances
Table 7: Breakdown of major and minor non conformances and observations
Table 8: Major & minor non conformances and observations by country
Table 9: Significant major and minor non conformances and observations in Indonesia
Table 10: Significant major and minor non conformances and observations for estates with schemed
smallholders in Indonesia
Table 11: Significant major and minor non conformances and observations for estates with all other
smallholders in Indonesia
Table 12: Significant major and minor non conformances and observations for estates only in
Malaysia
Table 14: Significant major and minor non conformances and observations for estates with all other
smallholders in Malaysia
Table 15: Major non conformances against indicators for estates and all other smallholders in PNG
Table 16: Major and minor non conformances and observations against RSPO indicators for the
Solomon Islands, Colombia and Brazil
Table 17: Minor and major non conformances and observations at criteria level for all independent
smallholders.
Table 18: Most common criteria of all estates with smallholders (non conformances & observations)

4 Report compiled by Global Sustainability Associates
March 2013
List of Figures
Figure 1: Combined major and minor non conformances and observations for all criteria
Figure 2: Top 10 major non conformances across all countries
Figure 3: Top 10 minor non conformances across all countries
Figure 4: Major & minor non conformances and observations for estates only in Indonesia
Figure 5: Major & minor non conformances and observations for estates with schemed smallholders
in Indonesia
Figure 6: Major & minor non conformances and observations for estates with all other smallholders in
Indonesia
Figure 7: Major & minor non conformances and observations for estates only in Malaysia
Figure 8: Major & minor non conformances and observations for estates with schemed smallholders
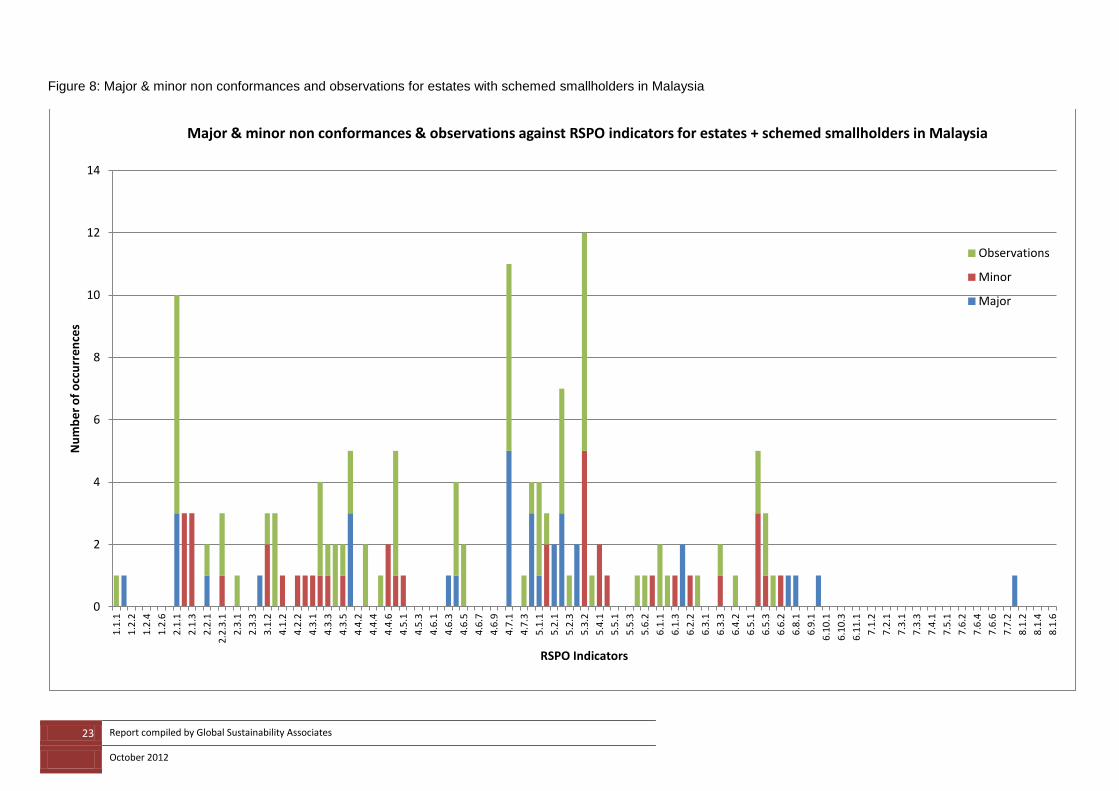
in Malaysia
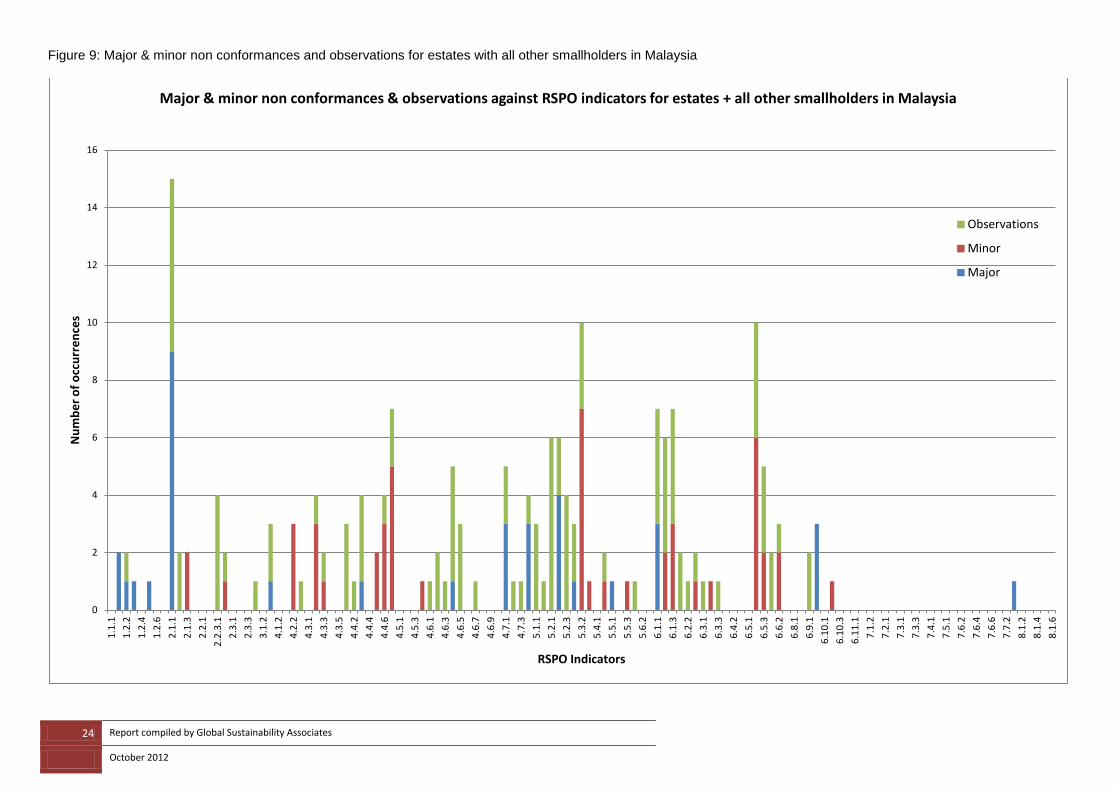
Figure 9: Major & minor non conformances and observations for estates with all other smallholders in
Malaysia
Figure 10: Major & minor non conformances and observations for estates with all other smallholders
in PNG.
Figure 11: Most frequent non conformances & observations for estates with smallholders in Indonesia
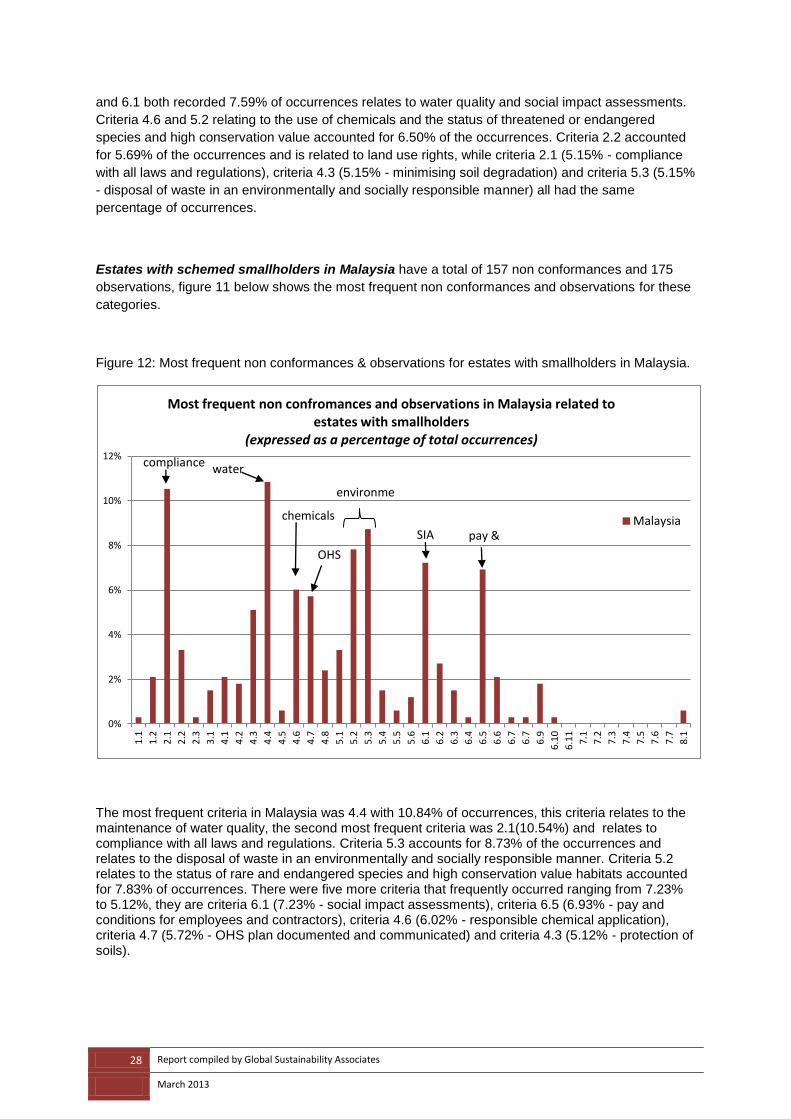
Figure 12: Most frequent non conformances & observations for estates with smallholders in Malaysia.

5 Report compiled by Global Sustainability Associates
March 2013
1.0 Executive Summary
This report is an analysis of Roundtable on Sustainable Palm Oil (RSPO) certification and surveillance audit reports across Malaysia, Indonesia and the Rest of the World (ROW). It looks at the introduction of a global standard (comprising principles, criteria and indicators) and the difficulties growers and smallholders have incorporating these standards into their daily business.
RSPOs vision was to transform the palm oil industry to move toward sustainable production and supply to global markets as the norm. To achieve this, rigorous and credible global standards were developed that are applicable to the supply chain to advance the production, procurement, finance and use of sustainable palm oil products.
Sustainability certification in the palm oil industry is defined by a global standard known as the RSPO Principles & Criteria (P&C), a document that has several national interpretations and is the basis for certification. A total of 114 certification and surveillance audits from 2008-2012 were analysed across specific categories. It looked at the performance of growers and smallholders from Indonesia, Malaysia, Brazil, Colombia, Ivory Coast, Papua New Guinea, Solomon Islands and Thailand. Each of the audits were assigned to a specific category depending on what was to be certified. The categories were determined according to whether the certification unit was a stand alone estate, an estate that included smallholders or independent smallholders seeking certification in the absence of an estate.
The analysis looked at all of the non conformances and “observations for improvement” in the audits and collated them to determine what particular principles and criteria proved to be difficult for certification units (growers and smallholders) to implement. Across all of the audits there were 1819 non conformances and observations of which 394 were major non conformances, 674 were minor non conformances and 751 were observations.
Growers complying with the RSPO P&C experienced the greatest difficulties with certain criteria relating to Principles 2, 4, 5 and 6. Of the ten indicators that recorded the highest number of non conformances one was from Principle 2, three were from Principle 4, four were from Principle 5 and two were from Principle 6.
A clear picture has been painted indicating areas of difficulty during the certification process and how that relates to specific operational aspects of any business. Analysis such as this will contribute to the continued effort to build a robust global standard for the palm oil industry.
6 Report compiled by Global Sustainability Associates
March 2013
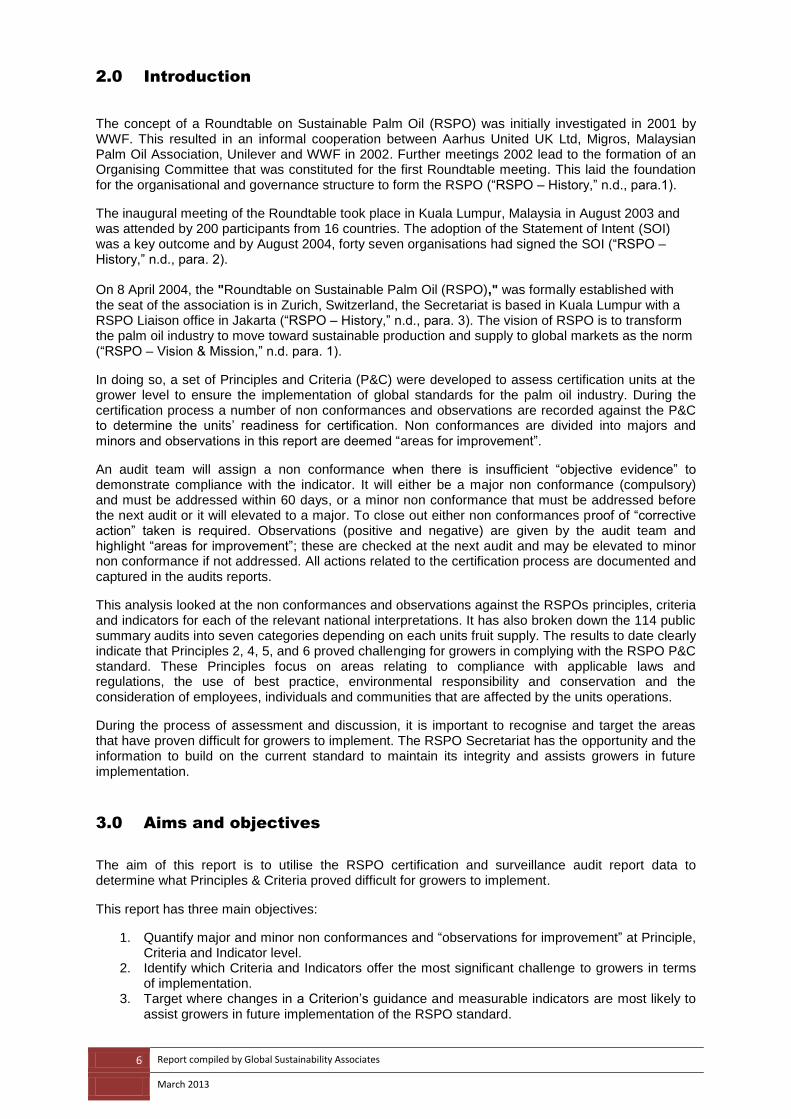
2.0 Introduction
The concept of a Roundtable on Sustainable Palm Oil (RSPO) was initially investigated in 2001 by WWF. This resulted in an informal cooperation between Aarhus United UK Ltd, Migros, Malaysian Palm Oil Association, Unilever and WWF in 2002. Further meetings 2002 lead to the formation of an Organising Committee that was constituted for the first Roundtable meeting. This laid the foundation for the organisational and governance structure to form the RSPO (“RSPO – History,” n.d., para.1).
The inaugural meeting of the Roundtable took place in Kuala Lumpur, Malaysia in August 2003 and was attended by 200 participants from 16 countries. The adoption of the Statement of Intent (SOI) was a key outcome and by August 2004, forty seven organisations had signed the SOI (“RSPO – History,” n.d., para. 2). On 8 April 2004, the "Roundtable on Sustainable Palm Oil (RSPO)," was formally established with the seat of the association is in Zurich, Switzerland, the Secretariat is based in Kuala Lumpur with a RSPO Liaison office in Jakarta (“RSPO – History,” n.d., para. 3). The vision of RSPO is to transform the palm oil industry to move toward sustainable production and supply to global markets as the norm (“RSPO – Vision & Mission,” n.d. para. 1).
In doing so, a set of Principles and Criteria (P&C) were developed to assess certification units at the grower level to ensure the implementation of global standards for the palm oil industry. During the certification process a number of non conformances and observations are recorded against the P&C to determine the units’ readiness for certification. Non conformances are divided into majors and minors and observations in this report are deemed “areas for improvement”.
An audit team will assign a non conformance when there is insufficient “objective evidence” to demonstrate compliance with the indicator. It will either be a major non conformance (compulsory) and must be addressed within 60 days, or a minor non conformance that must be addressed before the next audit or it will elevated to a major. To close out either non conformances proof of “corrective action” taken is required. Observations (positive and negative) are given by the audit team and highlight “areas for improvement”; these are checked at the next audit and may be elevated to minor non conformance if not addressed. All actions related to the certification process are documented and captured in the audits reports.
This analysis looked at the non conformances and observations against the RSPOs principles, criteria and indicators for each of the relevant national interpretations. It has also broken down the 114 public summary audits into seven categories depending on each units fruit supply. The results to date clearly indicate that Principles 2, 4, 5, and 6 proved challenging for growers in complying with the RSPO P&C standard. These Principles focus on areas relating to compliance with applicable laws and regulations, the use of best practice, environmental responsibility and conservation and the consideration of employees, individuals and communities that are affected by the units operations.
During the process of assessment and discussion, it is important to recognise and target the areas that have proven difficult for growers to implement. The RSPO Secretariat has the opportunity and the information to build on the current standard to maintain its integrity and assists growers in future implementation.
3.0 Aims and objectives
The aim of this report is to utilise the RSPO certification and surveillance audit report data to determine what Principles & Criteria proved difficult for growers to implement.
This report has three main objectives:
1. Quantify major and minor non conformances and “observations for improvement” at Principle, Criteria and Indicator level.
2. Identify which Criteria and Indicators offer the most significant challenge to growers in terms of implementation.
3. Target where changes in a Criterion’s guidance and measurable indicators are most likely to assist growers in future implementation of the RSPO standard.

7 Report compiled by Global Sustainability Associates
March 2013
4.0 Scope
This report is an analysis of the certification and surveillance audits for the period 2008 to 2012 available from the RSPO website www.rspo.org. Not all audits could be downloaded from the website and there may be omissions relating to some countries and companies. This analysis includes all available public summary audits up to October 2012.
The data was collected from the audit reports of 38 different companies comprising 97 certification units. The breakdown of the number of certification units and their respective countries can be seen below in table 1.
Table 1: Certification units by country
Country Certification Units
Indonesia 44
Malaysia 43
Rest of the World
Papua New Guinea 4
Solomon Islands 1
Brazil 1
Ivory Coast 1
Colombia 1
Thailand 2
A total of 114 audits have been summarised, they represent a combination of stages one and two of the initial certification and annual surveillance audits. Ninety five of the 114 audits determined a company’s initial certification, this accounts for 83% of the audits. The remaining 17% or 19 audits were annual surveillances. Indonesia and Malaysia alone account for 90% of the total certification units and 89% of the certification and surveillance audits (see table 2 below).
Table 2: Certification and surveillance audits by region
Indonesia Malaysia
ROW
Brazil Colombia Ivory Coast
PNG Solomon Islands
Thailand
Certification audit
42 43 1 1 1 4 1 2
Surveillance audit
7 9 3
Total 49 52 1 1 1 7 1 2
Definitions of terms, such as “certification units”, used throughout this report can be found in Appendix A. The full RSPO P&C are in Appendix B and the relevant RSPO national interpretation documents are listed in the reference section of this report (Section 8.0).
5.0 Methodology
Major and minor non conformances together with “observations for improvement” were collated and analysed for each audit. Non conformances and observations were then assigned to each of the relevant Principles (8) and Criteria (39) and Indicators (128) found in the generic RSPO P&C. The number of indicators varies in each of the national interpretation of the RSPO P&C. Some have more major indicators in each criterion than others (see table 3 below). The table also includes the percent contribution that the major non conformances make to the overall indicators for each national
89% 11%

8 Report compiled by Global Sustainability Associates
March 2013
interpretation; this varies from 46% in Colombia and Indonesia to 56% in the Solomon Islands. It is important to note that the absolute totals and percentages may not be completely accurate as not all of the indicators were clearly defined as majors or minors. No attempt has been made to test significance of the findings. Table 3: Indicators and major non conformances for each country
Country Indicators Major NC. Colombia 178 83 (46%) PNG 146 81 (55%) Solomon Islands 141 79 (56%) Indonesia 139 64 (46%) Generic 128 57 (45%) Malaysia 125 65 (52%) Brazil 120 56 (47%) Thailand 118 56 (48%) Ivory Coast 112 62 (55%)
Please note: The indicator numbering system for Brazil and Colombia were not defined in their national interpretations and therefore were assigned in reference to the generic RSPO P&C document for this analysis.
This report also looks at data at the individual indicator level for all of the audits. Future harmonisation of the numbering of indicators is necessary and is a task for the RSPO Standards and Certification Working Group.
However all countries have eight principles and 39 criteria and for the purpose of this analysis comparison is made against the generic P&C using the verification documents to determine major indicator status. The RSPO verification guidelines for the generic standard indicate that 33 of the 39 criteria contain indicators that are classed as major. Therefore there are six criteria with indicators with no majors (see table 4 below) Table 4: Distribution of major and minor non conformances by criteria
P1 P2 P3 P4 P5 P6 P7 P8
C1.1 maj C2.1 maj C3.1 maj C4.1 maj C5.1 maj C6.1 maj C7.1 maj C8.1 maj
C1.2 maj C2.2 maj C4.2 min C5.2 maj C6.2 maj C7.2 maj
C2.3 maj C4.3 min C5.3 maj C6.3 maj C7.3 maj
C4.4 maj C5.4 min C6.4 maj C7.4 min
C4.5 min C5.5 maj C6.5 maj C7.5 maj
C4.6 maj C5.6 maj C6.6 maj C7.6 maj
C4.7 maj C6.7 maj C7.7 maj
C4.8 maj C6.8 maj
C6.9 maj
C6.10 maj
C6.11 min
The analysis of the audits was also performed for units of certification in the following categories:
Unit of certification Audit occurrence
1. Mill(s) with managed estates 51 2. Mill(s) with managed estates and schemed smallholders 26 3. Mill(s) with managed estates and unknown smallholder types 13 4. Mill(s) with managed estates and independent smallholders 11 5. Mill(s) with managed estates and associated smallholders 6 6. Independent Smallholders 5 7. Mill(s) with managed estates, independent and schemed smallholders 2 TOTAL AUDITS 114
Please note: some audits do not specify the type of smallholders which contribute to the fruit base; these have been placed in category 3.

9 Report compiled by Global Sustainability Associates
March 2013
6.0 Results
6.1 Overview of Principles and Criteria
A total of 114 audits were analysed across seven certification categories, 97 certification units and eight countries. Major & minor conformances and observations were attributed to the relevant Principle of the RSPO P&C (see table 5 below).
Table 5: Non conformances & observations assigned to the eight RSPO Principles
P. 1 P. 2 P. 3 P. 4 P. 5 P. 6 P. 7* P. 8 Total
Major Non Conformance 35 65 3 102 100 52 24 13 394
Minor Non Conformance 0 65 5 260 158 163 13 10 674
Observations 24 83 11 307 149 161 11 5 751
Total 59 213 19 669 407 376 48 28 1819
*Please note: Principle 7 (New Developments) does not apply to all certification units, only 30 audits were analysed for this principle. There are a total of 394 major non conformances, 674 minor non conformances and 751 observations spread over the 39 criteria. The results are indicative as no statistical comparison has been completed. The analysis indicated that Principle 4 had the highest number of major non conformances (102), with 260 minor non conformances and 307 observations across all the audits. Principle 5 was second in line with 100 major non conformances, 158 minor non conformances and 149 observations. It was determined that Principles 2, 5, 6 and 6 accounted for 81% of the major non conformances, 96% of the minor non conformances and 93% of the observations and appeared to present the most challenges to growers when complying with the RSPO P&C standard. Inversely, Principle 3 had the least non conformances and observations thus providing less challenges during implementation.
6.2 Comparison of expected versus observed non conformances
In Table 6 below, it is assumed that each criterion has an equal degree of difficulty to implement and therefore the expected frequency of occurrence can be determined by expressing the number of criterion in a Principle over the total number of criteria. There were a total of 369 major non-conformances, spread over 32 criteria within 7 of the 8 principles (this comparison excludes principle 7).
Table 6: Comparison of expected verses observed occurrence of major non conformances
Principle Major non-conformance criteria in the
Principle
Frequency of
occurrence
Expected Occurrences
in audits
Observed Occurrences
in audits
Comment
1 2 0.0740 27 35 as expected
2 3 0.1111 41 65 58% higher than expected
3 1 0.0370 14 3 lower than expected
4 5 0.1851 68 102 51% higher than expected
5 5 0.1851 68 100 45% higher than expected
6 10 0.3703 137 52 lower than expected
7 PRINCIPLE 7 WAS NOT USED IN THIS COMPARISON
8 1 0.0370 14 13 lower than expected
Total 27 1 369 370
10 Report compiled by Global Sustainability Associates
March 2013
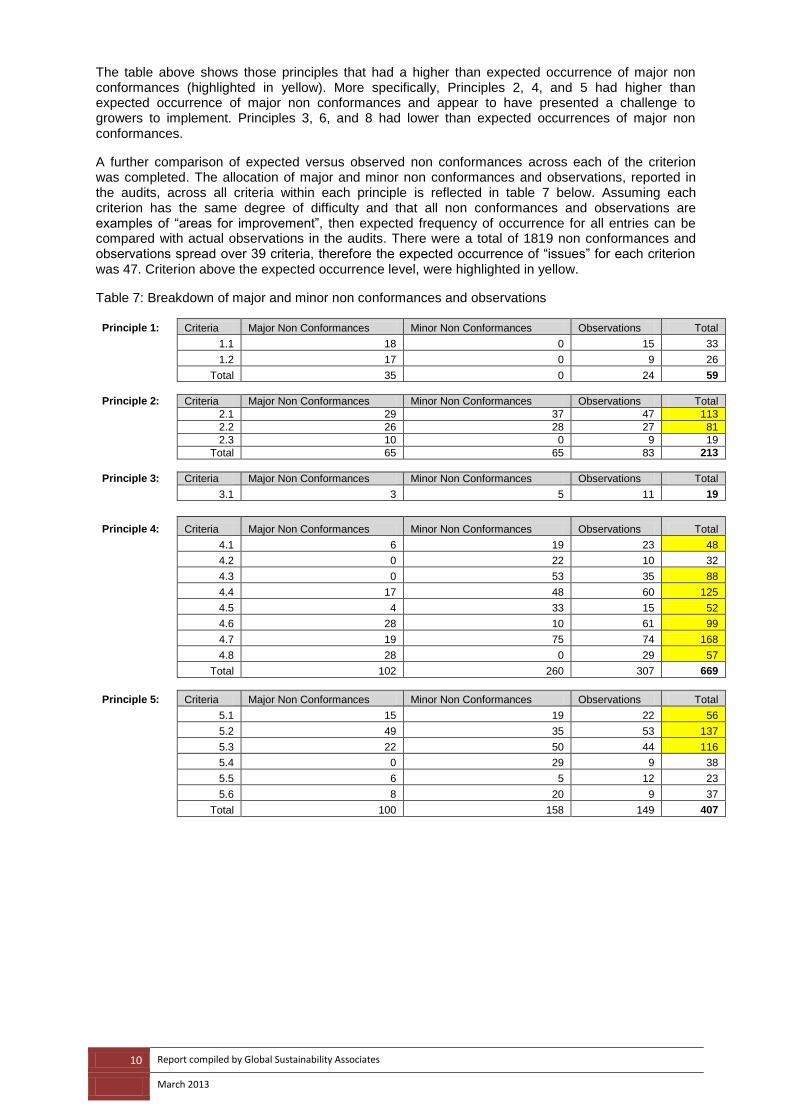
The table above shows those principles that had a higher than expected occurrence of major non conformances (highlighted in yellow). More specifically, Principles 2, 4, and 5 had higher than expected occurrence of major non conformances and appear to have presented a challenge to growers to implement. Principles 3, 6, and 8 had lower than expected occurrences of major non conformances.
A further comparison of expected versus observed non conformances across each of the criterion was completed. The allocation of major and minor non conformances and observations, reported in the audits, across all criteria within each principle is reflected in table 7 below. Assuming each criterion has the same degree of difficulty and that all non conformances and observations are examples of “areas for improvement”, then expected frequency of occurrence for all entries can be compared with actual observations in the audits. There were a total of 1819 non conformances and observations spread over 39 criteria, therefore the expected occurrence of “issues” for each criterion was 47. Criterion above the expected occurrence level, were highlighted in yellow.
Table 7: Breakdown of major and minor non conformances and observations
Principle 1: Criteria Major Non Conformances Minor Non Conformances Observations Total
1.1 18 0 15 33
1.2 17 0 9 26
Total 35 0 24 59
Principle 2: Criteria Major Non Conformances Minor Non Conformances Observations Total
2.1 29 37 47 113
2.2 26 28 27 81
2.3 10 0 9 19
Total 65 65 83 213
Principle 3: Criteria Major Non Conformances Minor Non Conformances Observations Total
3.1 3 5 11 19
Principle 4: Criteria Major Non Conformances Minor Non Conformances Observations Total
4.1 6 19 23 48
4.2 0 22 10 32
4.3 0 53 35 88
4.4 17 48 60 125
4.5 4 33 15 52
4.6 28 10 61 99
4.7 19 75 74 168
4.8 28 0 29 57
Total 102 260 307 669
Principle 5: Criteria Major Non Conformances Minor Non Conformances Observations Total
5.1 15 19 22 56
5.2 49 35 53 137
5.3 22 50 44 116
5.4 0 29 9 38
5.5 6 5 12 23
5.6 8 20 9 37
Total 100 158 149 407

11 Report compiled by Global Sustainability Associates
March 2013
Principle 6: Criteria Major Non Conformances Minor Non Conformances Observations Total
6.1 14 58 40 112
6.2 9 16 21 46
6.3 8 16 16 40
6.4 4 7 2 13
6.5 5 38 31 74
6.6 1 8 5 14
6.7 3 1 3 7
6.8 2 1 6 9
6.9 5 9 14 28
6.10 1 1 9 11
6.11 0 8 14 22
Total 52 163 161 376
Principle 7: Criteria Major Non Conformances Minor Non Conformances Observations Total
7.1 2 5 3 10
7.2 5 1 0 6
7.3 9 0 3 12
7.4 0 6 0 6
7.5 3 0 3 6
7.6 3 1 0 4
7.7 2 0 2 4
Total 24 13 11 48
Principle 8: Criteria Major Non Conformances Minor Non Conformances Observations Total
8.1 13 10 5 28
Total non conformances and observations 1819
With the expectation that each criterion has the same degree of difficulty, then Principles 2, 4 and 5 proved to be the most difficult to implement with the highest number of “issues”. Within Principle 2, criteria 2.1 and 2.2 were substantially above the expected frequency. All criteria in Principle, with the exception of criteria 4.2, were above the expected frequency. In Principle 5 criteria 5.1 was above the expected frequency, both criteria 5.2 and 5.3 were significantly above the expected frequency. Criteria 6.1 and 6.5 in Principle 6 were also above the expected frequency.
Non conformances and observations observed during each of the audits are attributed to the relevant criteria. Across the 114 audits, there were 1819 occurrences reported, figure 1 below reflects this at criteria level.

12 Report compiled by Global Sustainability Associates
March 2013
Figure 1: Combined major and minor non conformances and observations for all criteria
For all non conformances and observations, criteria 4.7 expressed the highest number of occurrences
(168), followed by criteria 5.2 (137), next was criteria 4.4 with 125, criteria 5.3 with 116 and criteria 2.1
with 113 occurrences. The next five were criteria 6.1 (112), criteria 4.6 (99), criteria 4.3 (88), criteria
2.2 (81) and criteria 6.5 with 74 occurrences.
The top ten major non conformances across all countries were calculated at the criterion level, due to the variable number of indicators for each national interpretation. The top 10 major non conformances accounted for 61% of all the major non conformances across the 114 audits. They were predominately in the areas of transparency, legal, Best Management Practice (BMP) and the environment and natural resources.
Figure 2 reflects the top ten major non conformances expressed as a percentage of total major non conformance occurrences. Criteria 5.2 is the most difficult to implement with accounting for 12.44% of occurrences, this criteria relates the status of rare, threatened or endangered species and high conservation value habitats. Criteria 2.1 account for 7.36% of occurrences and relates to compliance with all applicable local, national and ratified international law and regulations. Criteria 4.6 and 4.8 both account for 7.11% of occurrences and relate to chemicals training respectively. Criteria 5.3 had the fifth highest percentage of major non conformances (5.58%) and relates to waste. The next four criteria that comprise the “top ten” are 4.7 (4.82% - OHS), 1.1 (4.57% - transparency), 4.4 (4.31% - water quality) and 1.2 (4.31% - transparency). One of the principles with the lower percentages of major non conformances was Principle 7; this is related to new plantings.
0
20
40
60
80
100
120
140
160
180 1
.1
2.1
2.3
4.1
4.3
4.5
4.7
5.1
5.3
5.5
6.1
6.3
6.5
6.7
6.9
6.1
1
7.2
7.4
7.6
8.1
nu
mb
er
of
occ
ure
nce
s
RSPO criteria
Observations
Minor Non Conformances
Major Non Conformances
Public Summary Audits: all non conformances & observations against the RSPO P&C 2008-2012

13 Report compiled by Global Sustainability Associates
March 2013
Figure 2: Top 10 major non conformances across all countries
Please note 4.5 (IPM) and 5.3 (waste) do not have major non conformances assigned in the generic RSPO P&C.
In Figure 3 below are the top ten criteria in terms of minor non conformance as a percentage of total minor non conformance occurrences. Minor non conformances will become major non conformances at the next audit if not properly closed out and therefore remain an important component of the certification process. The top ten minor non conformances accounted for 68% of the total minor non conformances.
Figure 3: Top 10 minor non conformances across all countries
Criteria 4.7 has the highest percentage of occurrences (11.13%) and relates to OHS. Criteria 6.1
accounted for second highest percentage of occurrences (8.61%) was related to social impact
assessments (SIA). Criteria 4.3 is related to soil best management practices (BMP) has the third
0%
2%
4%
6%
8%
10%
12%
14% 1
.1
1.2
2.1
2.2
2.3
3.1
4.1
4.2
4.3
4.4
4.5
4.6
4.7
4.8
5.1
5.2
5.3
5.4
5.5
5.6
6.1
6.2
6.3
6.4
6.5
6.6
6.7
6.8
6.9
6.1
0
6.1
1
7.1
7.2
7.3
7.4
7.5
7.6
7.7
8.1
RSPO Criteria
Top 10 = 64% (red columns)
chemicals, OHS & training
waste
transparency & legal
HCV
0%
2%
4%
6%
8%
10%
12%
14%
1.1
1.2
2.1
2.2
2.3
3.1
4.1
4.2
4.3
4.4
4.5
4.6
4.7
4.8
5.1
5.2
5.3
5.4
5.5
5.6
6.1
6.2
6.3
6.4
6.5
6.6
6.7
6.8
6.9
6.1
0
6.1
1
7.1
7.2
7.3
7.4
7.5
7.6
7.7
8.1
RSPO Criteria
Top 10 = 68% (red columns)
OHS
SIA
BMP environmental
pay & conditions compliance
Public Summary Audits 2008-2012: all minor non conformances across all countries
(expressed as a percentage of the total minor non conformance occurrences)
Public Summary Audits 2008-2012: all major non conformances across all countries
(expressed as a percentage of total major non conformance occurrences)
water
14 Report compiled by Global Sustainability Associates
March 2013
highest percentage of occurrences (7.86%). Criteria 5.3 accounted for 7.42% of the occurrences and
relates to waste. Criteria 4.4 has 7.12% of the occurrences and is related to BMPs associated with
water quality. The final five criteria that relate to the “top ten” minor non conformances are criteria 6.5
(5.64% - pay and conditions), criteria 2.1 (5.49% - compliance with applicable local, national and
ratified international laws and regulations), criteria 5.2 (5.19% - the status of rare, threatened or
endangered species and high conservation value habitats), criteria 4.5 (4.90% - integrated pest
management) and criteria 5.4 (4.30% - energy efficiency). As seen with major non conformances,
minor non conformances related to Principle 7 remain low.
6.3 Overview of criteria and indicators by country
Further analysis of the public summary audits was completed at both the criteria and indicator level
over 114 audits. The number of indicators varied according to the specific country’s national
interpretation. The analysis was done by country and looked at the differences between:
1. estates only (category 1)
2. estates with schemed smallholders (category 2)
3. estates with all other types of smallholders (combination of categories 3, 4, 5 & 7).
‘All other types of smallholders’ consist of associated, independent and unknown smallholders.
Unknown smallholders refer to smallholder types that were not specified in the audits. Independent
smallholder were analysed separately.
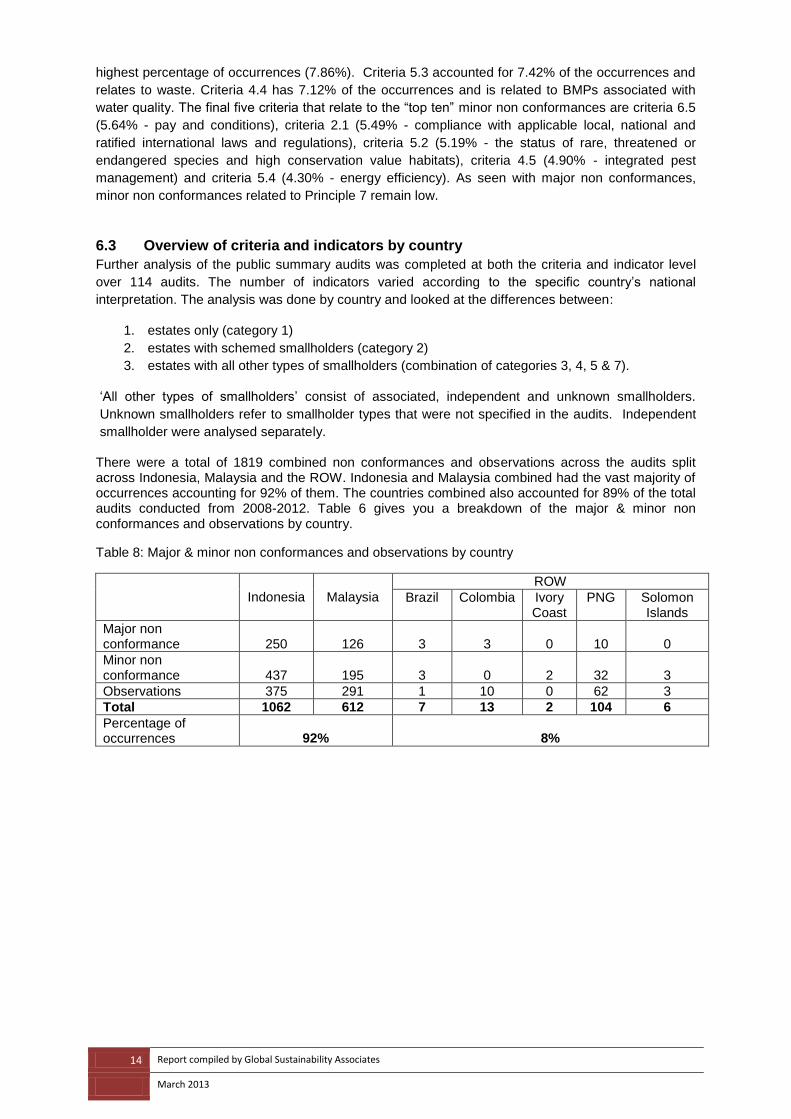
There were a total of 1819 combined non conformances and observations across the audits split across Indonesia, Malaysia and the ROW. Indonesia and Malaysia combined had the vast majority of occurrences accounting for 92% of them. The countries combined also accounted for 89% of the total audits conducted from 2008-2012. Table 6 gives you a breakdown of the major & minor non conformances and observations by country.
Table 8: Major & minor non conformances and observations by country
Indonesia Malaysia
ROW
Brazil Colombia Ivory Coast
PNG Solomon Islands
Major non conformance 250 126 3 3 0 10 0
Minor non conformance 437 195 3 0 2 32 3
Observations 375 291 1 10 0 62 3
Total 1062 612 7 13 2 104 6
Percentage of occurrences 92% 8%

15 Report compiled by Global Sustainability Associates
March 2013
6.3.1 Indonesia
Certification units were spread across all three categories mentioned with 27 certification and
surveillance audits for estates, 14 for estates with schemed smallholders and eight for estates with all
other types of smallholders.
Estates only, had the highest number of audits with 174 major non conformances, 293 minor and
226 observations over 139 indicators (64 major and 75 minor). Table 9 represents the most significant
indicators for estates in Indonesia across the related audits.
Table 9: Significant major and minor non conformances and observations for estates only in
Indonesia
Indicator Majors Minors Observations
2.2.3 8
4.6.4 7
4.7.3 14
5.1.1 10
5.1.2 8
5.2.1 8 10 7
5.2.2 9 14
5.3.1 12
5.4.1 11
6.11.1 9 Please note: number in red signify the highest number of occurrences
All major and minor non conformances and observations for estates are represented in Figure 4 on
page 15.
Estates with schemed smallholders had 14 audits and recorded 35 major non conformances, 52
minor non conformances and 116 observations. Table 10 represents the most significant indicators
for estates with schemed smallholders in Indonesia across the related audits.
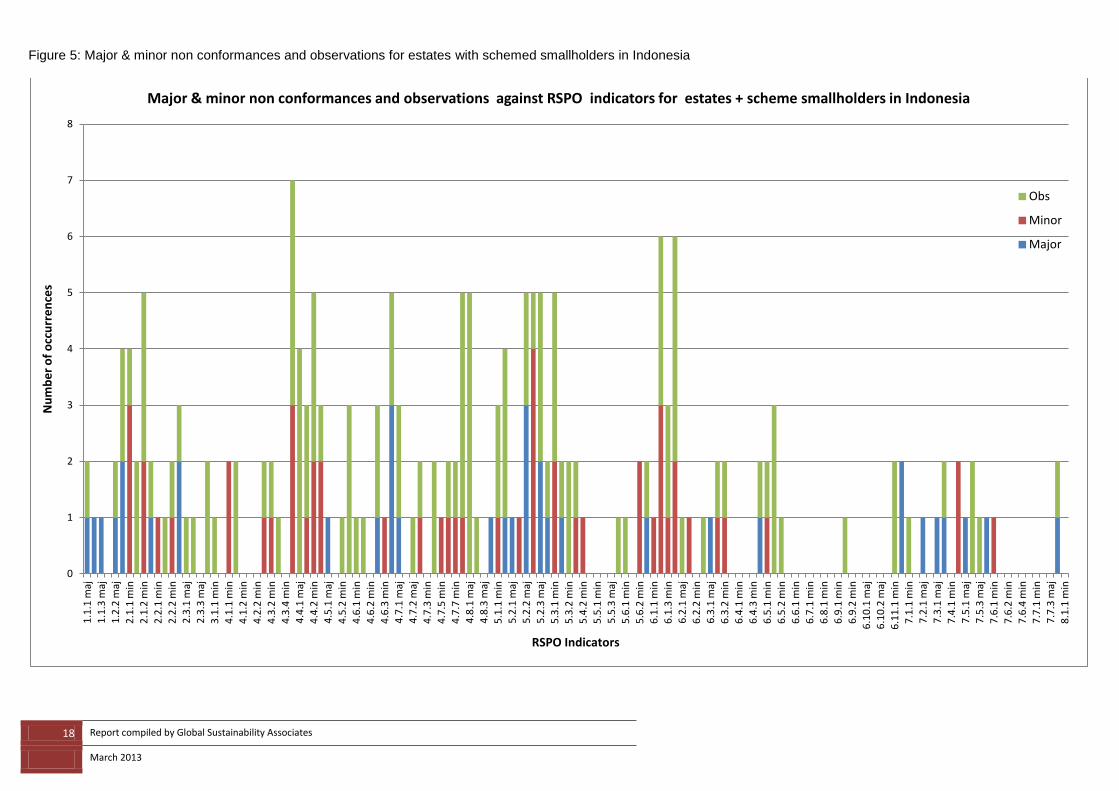
Major and minor non conformances and observations for estates with schemed smallholders are
represented in Figure 5 on page 16.
Table 10: Significant major and minor non conformances and observations for estates with schemed
smallholders in Indonesia
Indicator Majors Minors Observations
2.1.1 3
4.3.5 3
4.6.4 3
4.8.1 3 5
5.2.2 4
6.1.2 3 Please note: number in red signify the highest number of occurrences
16 Report compiled by Global Sustainability Associates
March 2013
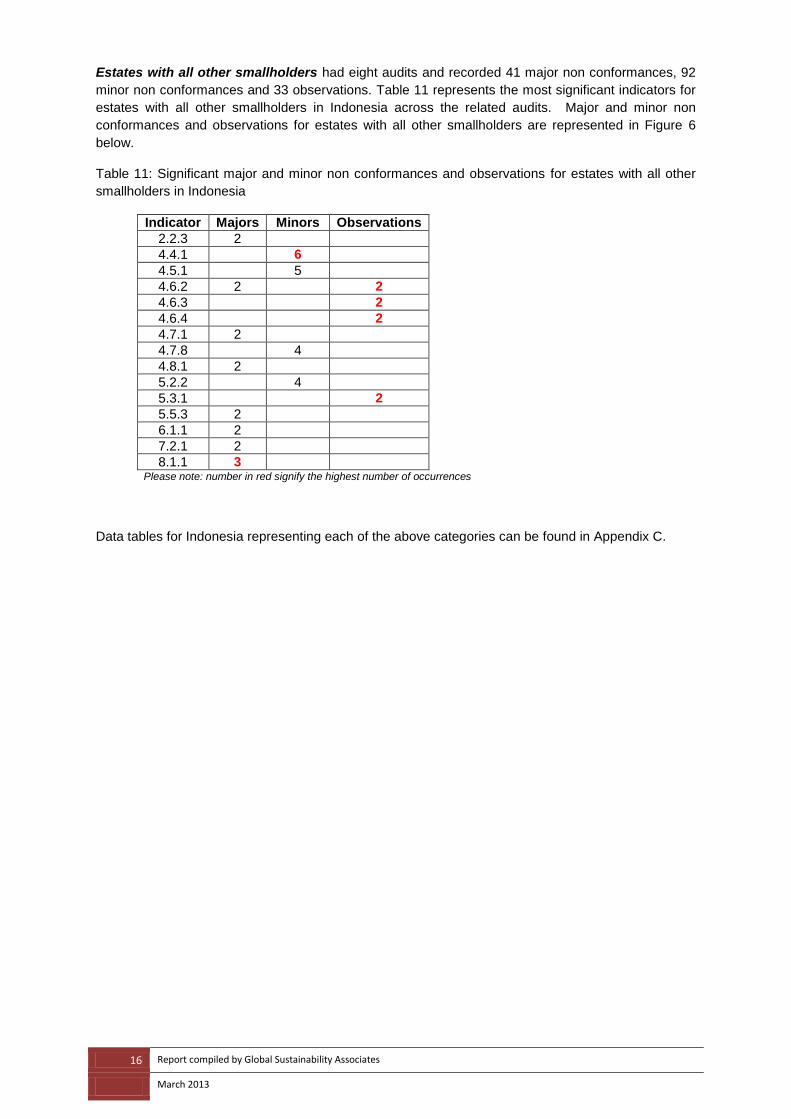
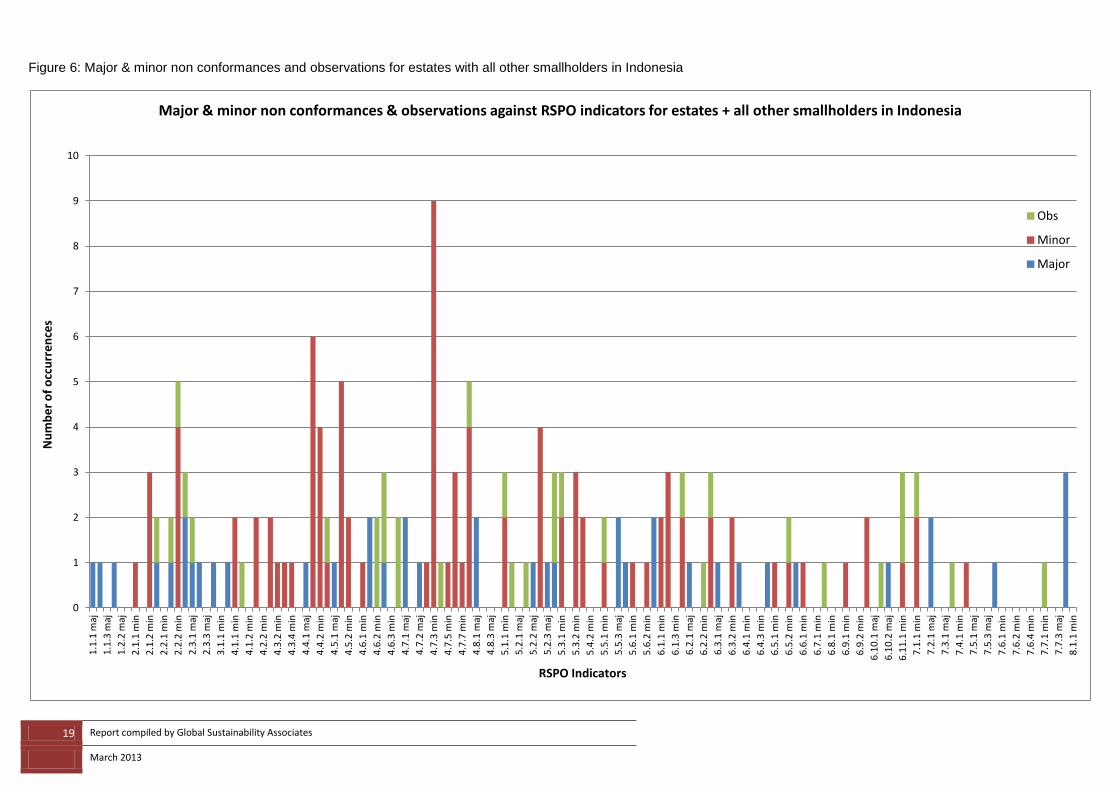
Estates with all other smallholders had eight audits and recorded 41 major non conformances, 92
minor non conformances and 33 observations. Table 11 represents the most significant indicators for
estates with all other smallholders in Indonesia across the related audits. Major and minor non
conformances and observations for estates with all other smallholders are represented in Figure 6
below.
Table 11: Significant major and minor non conformances and observations for estates with all other
smallholders in Indonesia
Indicator Majors Minors Observations
2.2.3 2
4.4.1 6
4.5.1 5
4.6.2 2 2
4.6.3 2
4.6.4 2
4.7.1 2
4.7.8 4
4.8.1 2
5.2.2 4
5.3.1 2
5.5.3 2
6.1.1 2
7.2.1 2
8.1.1 3 Please note: number in red signify the highest number of occurrences
Data tables for Indonesia representing each of the above categories can be found in Appendix C.

17 Report compiled by Global Sustainability Associates
March 2013
Figure 4: Major & minor non conformances and observations for estates only in Indonesia
0
5
10
15
20
25
1.1
.1 m
aj
1.1
.3 m
aj
1.2
.2 m
aj
2.1
.1 m
in
2.1
.2 m
in
2.2
.1 m
in
2.2
.2 m
in
2.3
.1 m
aj
2.3
.3 m
aj
3.1
.1 m
in
4.1
.1 m
in
4.1
.2 m
in
4.2
.2 m
in
4.3
.2 m
in
4.3
.4 m
in
4.4
.1 m
aj
4.4
.2 m
in
4.5
.1 m
aj
4.5
.2 m
in
4.6
.1 m
in
4.6
.2 m
in
4.6
.3 m
in
4.7
.1 m
aj
4.7
.2 m
aj
4.7
.3 m
in
4.7
.5 m
in
4.7
.7 m
in
4.8
.1 m
aj
4.8
.3 m
aj
5.1
.1 m
in
5.2
.1 m
aj
5.2
.2 m
aj
5.2
.3 m
aj
5.3
.1 m
in
5.3
.2 m
in
5.4
.2 m
in
5.5
.1 m
in
5.5
.3 m
aj
5.6
.1 m
in
5.6
.2 m
in
6.1
.1 m
in
6.1
.3 m
in
6.2
.1 m
aj
6.2
.2 m
in
6.3
.1 m
aj
6.3
.2 m
in
6.4
.1 m
in
6.4
.3 m
in
6.5
.1 m
in
6.5
.2 m
in
6.6
.1 m
in
6.7
.1 m
in
6.8
.1 m
in
6.9
.1 m
in
6.9
.2 m
in
6.1
0.1
maj
6.1
0.2
maj
6.1
1.1
min
7.1
.1 m
in
7.2
.1 m
aj
7.3
.1 m
aj
7.4
.1 m
in
7.5
.1 m
aj
7.5
.3 m
aj
7.6
.1 m
in
7.6
.2 m
in
7.6
.4 m
in
7.7
.1 m
in
7.7
.3 m
aj
8.1
.1 m
in
Nu
mb
er
of
occ
urr
en
ces
RSPO Indicators
Major & minor non conformances and observations against RSPO indicators for estates in Indonesia
Obs
Minor
Major
18 Report compiled by Global Sustainability Associates
March 2013
Figure 5: Major & minor non conformances and observations for estates with schemed smallholders in Indonesia
0
1
2
3
4
5
6
7
8
1.1
.1 m
aj
1.1
.3 m
aj
1.2
.2 m
aj
2.1
.1 m
in
2.1
.2 m
in
2.2
.1 m
in
2.2
.2 m
in
2.3
.1 m
aj
2.3
.3 m
aj
3.1
.1 m
in
4.1
.1 m
in
4.1
.2 m
in
4.2
.2 m
in
4.3
.2 m
in
4.3
.4 m
in
4.4
.1 m
aj
4.4
.2 m
in
4.5
.1 m
aj
4.5
.2 m
in
4.6
.1 m
in
4.6
.2 m
in
4.6
.3 m
in
4.7
.1 m
aj
4.7
.2 m
aj
4.7
.3 m
in
4.7
.5 m
in
4.7
.7 m
in
4.8
.1 m
aj
4.8
.3 m
aj
5.1
.1 m
in
5.2
.1 m
aj
5.2
.2 m
aj
5.2
.3 m
aj
5.3
.1 m
in
5.3
.2 m
in
5.4
.2 m
in
5.5
.1 m
in
5.5
.3 m
aj
5.6
.1 m
in
5.6
.2 m
in
6.1
.1 m
in
6.1
.3 m
in
6.2
.1 m
aj
6.2
.2 m
in
6.3
.1 m
aj
6.3
.2 m
in
6.4
.1 m
in
6.4
.3 m
in
6.5
.1 m
in
6.5
.2 m
in
6.6
.1 m
in
6.7
.1 m
in
6.8
.1 m
in
6.9
.1 m
in
6.9
.2 m
in
6.1
0.1
maj
6
.10
.2 m
aj
6.1
1.1
min
7.1
.1 m
in
7.2
.1 m
aj
7.3
.1 m
aj
7.4
.1 m
in
7.5
.1 m
aj
7.5
.3 m
aj
7.6
.1 m
in
7.6
.2 m
in
7.6
.4 m
in
7.7
.1 m
in
7.7
.3 m
aj
8.1
.1 m
in
Nu
mb
er
of
occ
urr
en
ces
RSPO Indicators
Major & minor non conformances and observations against RSPO indicators for estates + scheme smallholders in Indonesia
Obs
Minor
Major
19 Report compiled by Global Sustainability Associates
March 2013
Figure 6: Major & minor non conformances and observations for estates with all other smallholders in Indonesia
0
1
2
3
4
5
6
7
8
9
10
1.1
.1 m
aj
1.1
.3 m
aj
1.2
.2 m
aj
2.1
.1 m
in
2.1
.2 m
in
2.2
.1 m
in
2.2
.2 m
in
2.3
.1 m
aj
2.3
.3 m
aj
3.1
.1 m
in
4.1
.1 m
in
4.1
.2 m
in
4.2
.2 m
in
4.3
.2 m
in
4.3
.4 m
in
4.4
.1 m
aj
4.4
.2 m
in
4.5
.1 m
aj
4.5
.2 m
in
4.6
.1 m
in
4.6
.2 m
in
4.6
.3 m
in
4.7
.1 m
aj
4.7
.2 m
aj
4.7
.3 m
in
4.7
.5 m
in
4.7
.7 m
in
4.8
.1 m
aj
4.8
.3 m
aj
5.1
.1 m
in
5.2
.1 m
aj
5.2
.2 m
aj
5.2
.3 m
aj
5.3
.1 m
in
5.3
.2 m
in
5.4
.2 m
in
5.5
.1 m
in
5.5
.3 m
aj
5.6
.1 m
in
5.6
.2 m
in
6.1
.1 m
in
6.1
.3 m
in
6.2
.1 m
aj
6.2
.2 m
in
6.3
.1 m
aj
6.3
.2 m
in
6.4
.1 m
in
6.4
.3 m
in
6.5
.1 m
in
6.5
.2 m
in
6.6
.1 m
in
6.7
.1 m
in
6.8
.1 m
in
6.9
.1 m
in
6.9
.2 m
in
6.1
0.1
maj
6.1
0.2
maj
6.1
1.1
min
7.1
.1 m
in
7.2
.1 m
aj
7.3
.1 m
aj
7.4
.1 m
in
7.5
.1 m
aj
7.5
.3 m
aj
7.6
.1 m
in
7.6
.2 m
in
7.6
.4 m
in
7.7
.1 m
in
7.7
.3 m
aj
8.1
.1 m
in
Nu
mb
er
of
occ
urr
en
ces
RSPO Indicators
Major & minor non conformances & observations against RSPO indicators for estates + all other smallholders in Indonesia
Obs
Minor
Major
20 Report compiled by Global Sustainability Associates
October 2012
6.3.2 Malaysia
A total of 52 certification and surveillance audits across all three categories were analysed from
Malaysia. Of the audits, 24 accounted for estates only, ten were related to estates with scheme
smallholders and 16 to estates with all other smallholders.
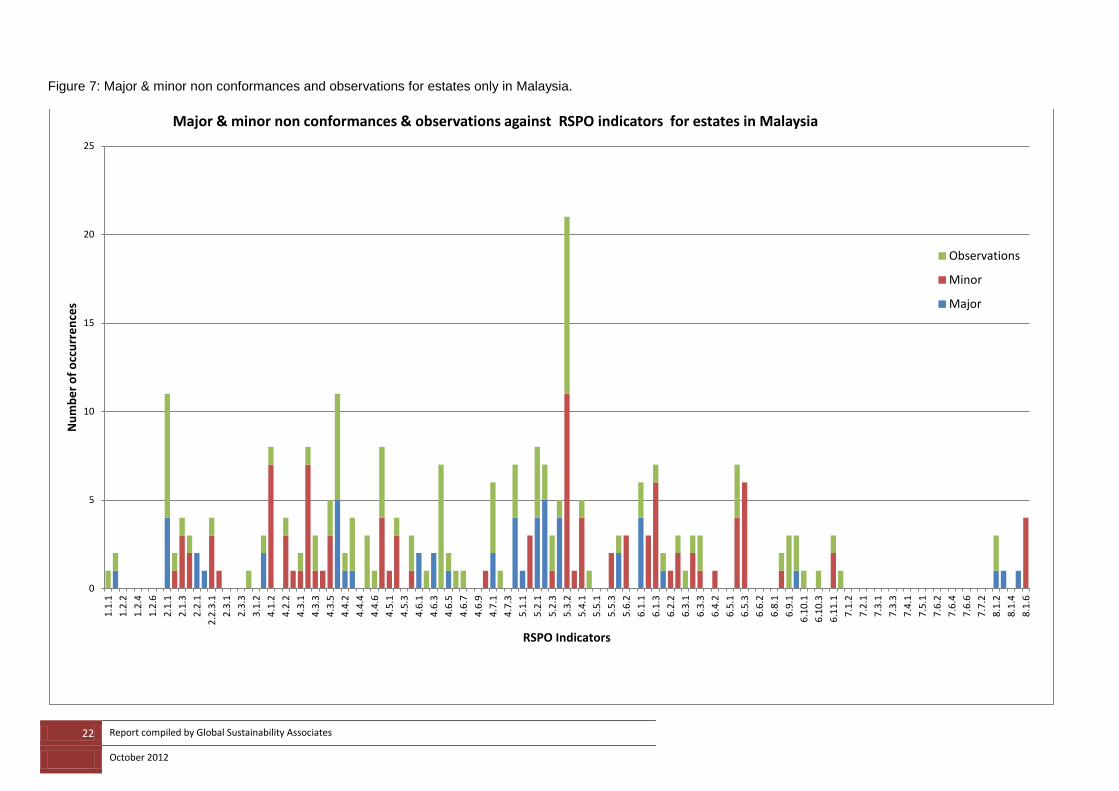
Estates only had 53 major non conformances, 102 minor non conformances and 109 observations
over a total of 125 indicators (65 major and 60 minor). Table 12 represents the most significant
indicators for estates in Malaysia across the related audits.
Table 12: Significant major and minor non conformances and observations for estates only in
Malaysia
Indicator Majors Minors Observations
2.2.1 4 7
4.1.2 7
4.3.2 7
4.4.1 5 6
4.6.4 7
4.8.1 4
5.2.1 4
5.2.2 5
5.3.1 4
5.3.2 11 10
6.1.1 4
6.1.3 6
6.5.3 6 Please note: number in red signify the highest number of occurrences
Major and minor non conformances and observations for estates are represented in Figure 7 on page
21.
Estates with schemed smallholders had ten audits. Against these audits 33 major non
conformances, 39 minor non conformances and 75 observations were recorded. Table 13 represents
the most significant major and minor non conformances and observations for estates with schemed
smallholders in Malaysia.
Table 13: Significant major and minor non conformances and observations for estates with schemed
smallholders in Malaysia
Indicator Majors Minors Observations
2.1.1
2.2.1 3 3 7
2.1.3 3
4.4.1 3
4.7.1 5 6
4.8.1 3
5.2.2 3
5.3.2 5 7
6.5.2 3 Please note: number in red signify the highest number of occurrences
Major and minor non conformances and observations for estates with schemed smallholders are
represented in Figure 8 on page 22.
21 Report compiled by Global Sustainability Associates
October 2012
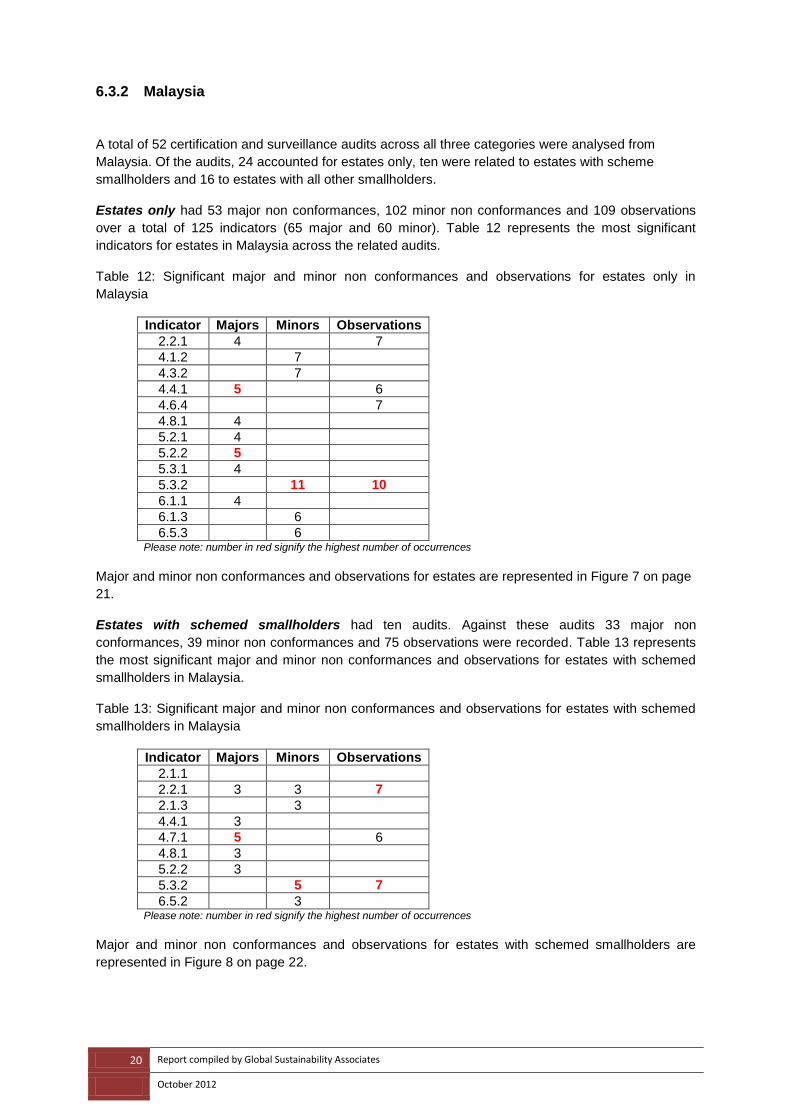
The combined estates and all other smallholders had 36 major non conformances, 49 minor non
conformances and 100 observations over 16 audits. Table 14 represents the most significant major
and minor non conformances and observations for estates with all other smallholders in Malaysia.
Table 14: Significant major and minor non conformances and observations for estates with all other
smallholders in Malaysia
Indicator Majors Minors Observations
2.1.1 9 6
2.2.3.1 4
4.4.7 5
4.6.4 4
5.2.1 6
5.2.2 4
5.3.2 7
6.1.1 4
6.1.2 4
6.1.3 4
6.5.2 6 4 Please note: number in red signify the highest number of occurrences
Major and minor non conformances and observations for estates with all other smallholders are
represented in Figure 9 on page 23.
Data tables for Malaysia representing each of the categories can be found in Appendix D.
22 Report compiled by Global Sustainability Associates
October 2012
Figure 7: Major & minor non conformances and observations for estates only in Malaysia.
0
5
10
15
20
25
1.1
.1
1.2
.2
1.2
.4
1.2
.6
2.1
.1
2.1
.3
2.2
.1
2.2
.3.1
2.3
.1
2.3
.3
3.1
.2
4.1
.2
4.2
.2
4.3
.1
4.3
.3
4.3
.5
4.4
.2
4.4
.4
4.4
.6
4.5
.1
4.5
.3
4.6
.1
4.6
.3
4.6
.5
4.6
.7
4.6
.9
4.7
.1
4.7
.3
5.1
.1
5.2
.1
5.2
.3
5.3
.2
5.4
.1
5.5
.1
5.5
.3
5.6
.2
6.1
.1
6.1
.3
6.2
.2
6.3
.1
6.3
.3
6.4
.2
6.5
.1
6.5
.3
6.6
.2
6.8
.1
6.9
.1
6.1
0.1
6.1
0.3
6.1
1.1
7.1
.2
7.2
.1
7.3
.1
7.3
.3
7.4
.1
7.5
.1
7.6
.2
7.6
.4
7.6
.6
7.7
.2
8.1
.2
8.1
.4
8.1
.6
Nu
mb
er
of
occ
urr
en
ces
RSPO Indicators
Major & minor non conformances & observations against RSPO indicators for estates in Malaysia
Observations
Minor
Major
23 Report compiled by Global Sustainability Associates
October 2012
Figure 8: Major & minor non conformances and observations for estates with schemed smallholders in Malaysia
0
2
4
6
8
10
12
14
1.1
.1
1.2
.2
1.2
.4
1.2
.6
2.1
.1
2.1
.3
2.2
.1
2.2
.3.1
2.3
.1
2.3
.3
3.1
.2
4.1
.2
4.2
.2
4.3
.1
4.3
.3
4.3
.5
4.4
.2
4.4
.4
4.4
.6
4.5
.1
4.5
.3
4.6
.1
4.6
.3
4.6
.5
4.6
.7
4.6
.9
4.7
.1
4.7
.3
5.1
.1
5.2
.1
5.2
.3
5.3
.2
5.4
.1
5.5
.1
5.5
.3
5.6
.2
6.1
.1
6.1
.3
6.2
.2
6.3
.1
6.3
.3
6.4
.2
6.5
.1
6.5
.3
6.6
.2
6.8
.1
6.9
.1
6.1
0.1
6.1
0.3
6.1
1.1
7.1
.2
7.2
.1
7.3
.1
7.3
.3
7.4
.1
7.5
.1
7.6
.2
7.6
.4
7.6
.6
7.7
.2
8.1
.2
8.1
.4
8.1
.6
Nu
mb
er
of
occ
urr
en
ces
RSPO Indicators
Major & minor non conformances & observations against RSPO indicators for estates + schemed smallholders in Malaysia
Observations
Minor
Major
24 Report compiled by Global Sustainability Associates
October 2012
Figure 9: Major & minor non conformances and observations for estates with all other smallholders in Malaysia
0
2
4
6
8
10
12
14
16
1.1
.1
1.2
.2
1.2
.4
1.2
.6
2.1
.1
2.1
.3
2.2
.1
2.2
.3.1
2.3
.1
2.3
.3
3.1
.2
4.1
.2
4.2
.2
4.3
.1
4.3
.3
4.3
.5
4.4
.2
4.4
.4
4.4
.6
4.5
.1
4.5
.3
4.6
.1
4.6
.3
4.6
.5
4.6
.7
4.6
.9
4.7
.1
4.7
.3
5.1
.1
5.2
.1
5.2
.3
5.3
.2
5.4
.1
5.5
.1
5.5
.3
5.6
.2
6.1
.1
6.1
.3
6.2
.2
6.3
.1
6.3
.3
6.4
.2
6.5
.1
6.5
.3
6.6
.2
6.8
.1
6.9
.1
6.1
0.1
6.1
0.3
6.1
1.1
7.1
.2
7.2
.1
7.3
.1
7.3
.3
7.4
.1
7.5
.1
7.6
.2
7.6
.4
7.6
.6
7.7
.2
8.1
.2
8.1
.4
8.1
.6
Nu
mb
er
of
occ
urr
en
ces
RSPO Indicators
Major & minor non conformances & observations against RSPO indicators for estates + all other smallholders in Malaysia
Observations
Minor
Major

25 Report compiled by Global Sustainability Associates
March 2013
6.3.3 Papua New Guinea
Seven public summary audits over two companies were analysed in Papua New Guinea (PNG). In
total there were nine major non conformances, 32 minor non conformances and 63 observations
across 146 indicators (81 major and 65 minor). Only one category was applicable to PNG as there are
no estates only or schemed smallholders, therefore this analysis are related to estates with all other
smallholders. More specifically it relates to estates with associated and independent smallholders.
Major non conformances were spread across Principles 1, 2, 4, 5, and 6 with one occurrence each to
the following indicators.
Table 15: Major non conformances against indicators for estates and all other smallholders in PNG
Principle Indicators with major non conformances
P1 1.2.7
P2 2.1.1 2.3.7
P4 4.7.1 4.7.7 4.8.1
P5 5.3.1 5.6.1
P6 6.3.1 6.7.1
Indicators 4.7.2 & 4.7.3 ranked the highest for minor non conformances with three each from the
seven audits. Indicators 5.6.2, 6.1.3, 6.2.2, and 6.5.4 all recorded two non conformances against
them. Of the 63 observations recorded the highest occurrence was with indicator 4.4.1 (4) and
indicators 4.7.3 and 6.3.1 equal second with two. Major and minor non conformances and
observations for PNG are in Figure 10 below.
Figure 10: Major & minor non conformances and observations for estates with all other smallholders
in PNG.
0
1
2
3
4
5
6
7
1.1
.1
1.2
.4
1.2
.7
2.1
.1
2.2
.2
2.3
.2
2.3
.6
4.1
.1
4.2
.1
4.3
.2
4.3
.6
4.5
.2
4.6
.3
4.6
.7
4.6
.11
4.7
.2
4.7
.6
4.8
.2
5.2
.1
5.2
.5
5.4
.2
5.5
.4
6.1
.1
6.2
.2
6.4
.2
6.5
.2
6.5
.6
6.7
.1
6.9
.2
6.1
0.3
6.1
1.2
7.2
.1
7.4
.1
7.5
.2
7.6
.2
7.6
.6
8.1
.1
RSPO Indicators
Minor & major non conformances & observations against RSPO indicators for estates + other smallholders in Papua New Guinea
Observations
Minor
Major

26 Report compiled by Global Sustainability Associates
March 2013
6.3.4 Solomon Islands, Colombia and Brazil
All three countries had one public summary audit each, across two categories, the Solomon Islands
relates to estates with all other smallholders, namely associated smallholders. Both Colombia and
Brazil relate to the “estates with schemed smallholder” category. The major and minor non
conformances and observations recorded can be seen below in table 8.
Table 16: Major and minor non conformances and observations against RSPO indicators for the
Solomon Islands, Colombia and Brazil.
Country Major Non Conformance
Minor Non Conformance
Observation/s
Solomon Islands 0 3 3
Colombia 3 0 10
Brazil 3 3 1
The Solomon Islands minor non conformances were against indicators 4.7.2, 4.7.3 and 6.5.6 with one
each. Indicators 4.3.5, 4.4.1 and 6.3.1 all had once observation against them. Major non
conformances in Colombia were recorded against indicators 2.1.1, 4.8.1 and 6.5.2. The bulk of the
observation were found in Principle 4, with one each recorded against 4.1.1, 4.1.2, 4.3.1, 4.7.1, 4.7.2,
4.7.3 and 4.7.5. Over the one audit in Brazil there were three major non conformances against
indicators 5.3.2, 5.6.1 and 6.5.1; minor non conformances were recorded against indicators 2.1.2,
4.3.5 and 4.4.1 with one observation against 1.1.1. Data tables for PNG and the Solomon Islands
category can be found in Appendix 5. Data tables Colombia and Brazil are located in Appendix 6.
6.4 Independent Smallholders
An analysis of independent smallholders was conducted at the criteria level; there are five public
summary audits across three countries. In Malaysia there were two audits, Thailand also two and the
Ivory Coast one. The results of the analysis across the three countries have been combined and are
shown in table 9 below.
Table 17: Minor and major non conformances and observations at criteria level for all independent
smallholders.
Criteria Total Major non conformances
Total Minor non conformances
Total Observations
2.1 8 1 3
4.6 1 1 2
4.5 0 1 3
2.2 0 2 1
4.2 0 1 2
4.8 0 0 2
6.1 0 0 2
3.1 0 1 0
4.1 0 0 1
4.3 0 1 0
5.6 0 1 0
Criteria 2.1 had the highest number of major non conformances with eight in total over the five audits
and relates to compliance with all applicable laws and regulation.

27 Report compiled by Global Sustainability Associates
March 2013
6.5 A comparison of countries with estates and smallholders
Half of the public summary audits included smallholders, they were independent, schemed,
associated or unknown the combination of estates plus smallholders accounted for 51% of the audits
that were analysed. Indonesia and Malaysia combined account for 84% of the total non conformances
and observations reported across the public summary audits. Therefore only Indonesia & Malaysia
were analysed to determine which criteria estates with smallholders were having difficulty
implementing.
Estates with smallholders in Indonesia and Malaysia reported 145 major non conformances, 232
minor non conformances and 324 observations. When comparing the most frequent non conformance
and observations by criteria for estates with smallholders, it was noted that Indonesia and Malaysia
share 8 of the same criteria. This can be seen in table 10 below.
Table 18: Most common criteria of all estates with smallholders (non conformances & observations)
2.1 2.2 4.3 4.4 4.6 4.7 5.2 5.3 6.1 6.5
Malaysia estates + schemed smallholders
X X X X X X X X X
Indonesia estates + all other smallholders
X X X X X X X X X
The criteria above relates to legal aspects of certification, soil & water, chemicals and OHS, HCV &
water management, social impact assessments (SIAs) and worker pay & conditions.
Estates with schemed smallholders in Indonesia have a total of 220 non conformances and 149
observations, figure 11 below shows the most frequent non conformances and observations for these
categories.
Figure 11: Most frequent non conformances & observations for estates with smallholders in Indonesia
There were nine criteria that had significant frequencies across all non conformances and
observations. The most frequent was criteria 4.7 (11.38%) that relates to OHS, followed by criteria 4.4
0%
2%
4%
6%
8%
10%
12%
1.1
1.2
2.1
2.2
2.3
3.1
4.1
4.2
4.3
4.4
4.5
4.6
4.7
4.8
5.1
5.2
5.3
5.4
5.5
5.6
6.1
6.2
6.3
6.4
6.5
6.6
6.7
6.7
6.9
6.1
6.1
1
7.1
7.2
7.3
7.4
7.5
7.6
7.7
8.1
Most frequent non conformances and observations in Indonesia related to estates with smallholders
(expressed as a percentage of total occurrences)
Indonesia
complianc
water
OHS
chemicals
environmneSIA
soils
28 Report compiled by Global Sustainability Associates
March 2013
and 6.1 both recorded 7.59% of occurrences relates to water quality and social impact assessments.
Criteria 4.6 and 5.2 relating to the use of chemicals and the status of threatened or endangered
species and high conservation value accounted for 6.50% of the occurrences. Criteria 2.2 accounted
for 5.69% of the occurrences and is related to land use rights, while criteria 2.1 (5.15% - compliance
with all laws and regulations), criteria 4.3 (5.15% - minimising soil degradation) and criteria 5.3 (5.15%
- disposal of waste in an environmentally and socially responsible manner) all had the same
percentage of occurrences.
Estates with schemed smallholders in Malaysia have a total of 157 non conformances and 175
observations, figure 11 below shows the most frequent non conformances and observations for these
categories.
Figure 12: Most frequent non conformances & observations for estates with smallholders in Malaysia.
The most frequent criteria in Malaysia was 4.4 with 10.84% of occurrences, this criteria relates to the maintenance of water quality, the second most frequent criteria was 2.1(10.54%) and relates to compliance with all laws and regulations. Criteria 5.3 accounts for 8.73% of the occurrences and relates to the disposal of waste in an environmentally and socially responsible manner. Criteria 5.2 relates to the status of rare and endangered species and high conservation value habitats accounted for 7.83% of occurrences. There were five more criteria that frequently occurred ranging from 7.23% to 5.12%, they are criteria 6.1 (7.23% - social impact assessments), criteria 6.5 (6.93% - pay and conditions for employees and contractors), criteria 4.6 (6.02% - responsible chemical application), criteria 4.7 (5.72% - OHS plan documented and communicated) and criteria 4.3 (5.12% - protection of soils).
0%
2%
4%
6%
8%
10%
12%
1.1
1.2
2.1
2.2
2.3
3.1
4.1
4.2
4.3
4.4
4.5
4.6
4.7
4.8
5.1
5.2
5.3
5.4
5.5
5.6
6.1
6.2
6.3
6.4
6.5
6.6
6.7
6.7
6.9
6.1
0
6.1
1
7.1
7.2
7.3
7.4
7.5
7.6
7.7
8.1
Most frequent non confromances and observations in Malaysia related to estates with smallholders
(expressed as a percentage of total occurrences)
Malaysia
compliance water
chemicals
OHS
environme
SIA pay &
29 Report compiled by Global Sustainability Associates
March 2013
7.0 Conclusion
Based on the analysis of the available certification and surveillance audits, this report clearly indicates that Principles 2, 4, 5 and 6 appear to offer the most challenge to certification units in complying with the RSPO P&C standard.
Within these Principles the key criteria are:
Principle 2: Compliance with applicable laws and regulations (3 Criteria in the P&C)
Criterion 2.1: There is compliance with all applicable local, national and ratified international laws and regulations. Criterion 2.2 The right to use the land can be demonstrated, and is not legitimately contested by
local communities with demonstrable rights.
Principle 4: Use of appropriate best practices by growers and millers (8 Criteria in the P&C)
Criterion 4.3 Practices minimise and control erosion and degradation of soils. Criterion 4.4 Practices maintain the quality and availability of surface and ground water. Criterion 4.6 Agrochemicals are used in a way that does not endanger health or the environment.
There is no prophylactic use, and where agrochemicals are used that are categorised as World Health Organisation Type 1A or 1B, or are listed by the Stockholm or Rotterdam Conventions, growers are actively seeking to identify alternatives, and this is documented.
Criterion 4.7 An occupational health and safety plan is documented, effectively communicated and implemented
Principle 5: Environmental responsibility and conservation of natural resources and biodiversity (6 Criteria in the P&C)
Criterion 5.2 The status of rare, threatened or endangered species and high conservation value
habitats, if any, that exist in the plantation or that could be affected by plantation or mill management, shall be identified and their conservation taken into account in management plans and operations.
Criterion 5.3 Waste is reduced, recycled, re-used and disposed of in an environmentally and
socially responsible manner.
Principle 6: Responsible consideration of employees and of individuals and communities affected by growers and mills (11 Criteria in the P&C)
Criterion 6.1 Aspects of plantation and mill management that have social impacts are identified in a participatory way and plans to mitigate the negative impacts and promote the positive ones are made, implemented and monitored, to demonstrate continuous improvement.
Criterion 6.5 Pay and conditions for employees and for employees of contractors always meet at
least legal or industry minimum standards and are sufficient to meet basic needs of personnel and to provide some discretionary income.

30 Report compiled by Global Sustainability Associates
March 2013
There are specific indicators within Principles 2, 4, 5 and 6 that contributed to the challenges certification units experienced when complying with the RSPO P&C standard.
These indicators are listed below and have been ranked according to the total major and minor non conformances recorded against them. They were copied from the Indonesia national interpretation as it is the only P&C with minor and major indicators with the same indicator numbers.
Indicator 5.2.2 (ranked first)
Major Indicator: If, rare, threatened, or endangered species, or high conservation value habitats are present, appropriate measures to preserve them are taken. (26 non conformances)
Minor Indicator: Companies are to appoint dedicated and trained officers to monitor any plans and activities as above. (22 non conformances)
Indicator 5.3.2 (ranked second)
Major Indicator: Estates and mills waste management and disposal are implemented to avoid or reduce pollution. (6 non conformances)
Minor Indicator: Records of waste monitoring/analysis. (32 non conformances)
Indicator 2.1.1 (ranked third)
Major Indicator: Evidence of compliance with relevant legal requirements. (29 non conformances)
Minor Indicator: A documented system, which includes written information on legal requirements that the palm oil company should comply with. (7 non conformances)
Indicator 4.4.1 (ranked fourth)
Major Indicator: Standard Operating Procedures (SOPs) for estates, from land clearing to harvesting. (14 non conformances)
Minor Indicator: An implemented water management plan. (14 non conformances)
Indicator 5.2.1 (ranked fifth)
Major Indicator: Records of results of identifications of any protected, rare, threatened or endangered species, and HCV habitat. (15 non conformances)
Minor Indicator: Posters and signs warning of the presence of protected species are to be produced, distributed, and made visible to all workers and the community, including guidelines in handling them. (11 non conformances)
Indicator 5.3.1 (ranked sixth)
Major Indicator: All waste and pollutions sources are indentified and documented. (16 non conformances)
Minor Indicators: Management plan of hazardous waste and instruction of disposal of agrochemicals and their containers waste in accordance with the product label and existing regulations. (16 non conformances)
Indicator 6.1.1 (ranked seventh)
Major Indicator: Documented environmental & social impact assessment. (14 non conformances)
31 Report compiled by Global Sustainability Associates
March 2013
Minor Indicator: Monitoring and management of social and environmental management documentation. (12 non conformances)
Indicator 4.7.3 (ranked eight)
Minor Indicator: A documented risk assessment of for Occupational Health and Safety (OHS). (27 non conformances)
Indicator 4.8.1 (ranked ninth)
Major Indicator: A documented training programme for staff, employee and scheme smallholders in accordance with workers’ positions and competences. (20 non conformances)
Indicator 6.5.2 (ranked tenth)
Major Indicator: A company working regulations and work contracts, in accordance with existing regulations. (2 non conformances)
Minor Indicator: Agreements entered into with contractors are to specify that contractors abide by labor laws. (16 non conformances)
Throughout this process it has been noted that the indicators numbers and numbering system varies greatly across all of the national interpretations. The Indonesian national interpretation is the only one to split the indicators into major and minor with the same number e.g. 3.1.1 major and 3.1.1 minor. In some cases it the attribution of indicators was not clear therefore leading to misinterpretation in a number of the audits. In the Brazilian and Colombian national interpretations there was no numbering system linked to the indicators, yet indicators were numbered in one of the certification audits. In the interest of creating a global system applicable to all palm oil producing regions the RSPO Standards and Certification Working Group may consider investigating this further.
32 Report compiled by Global Sustainability Associates
March 2013
8.0 References
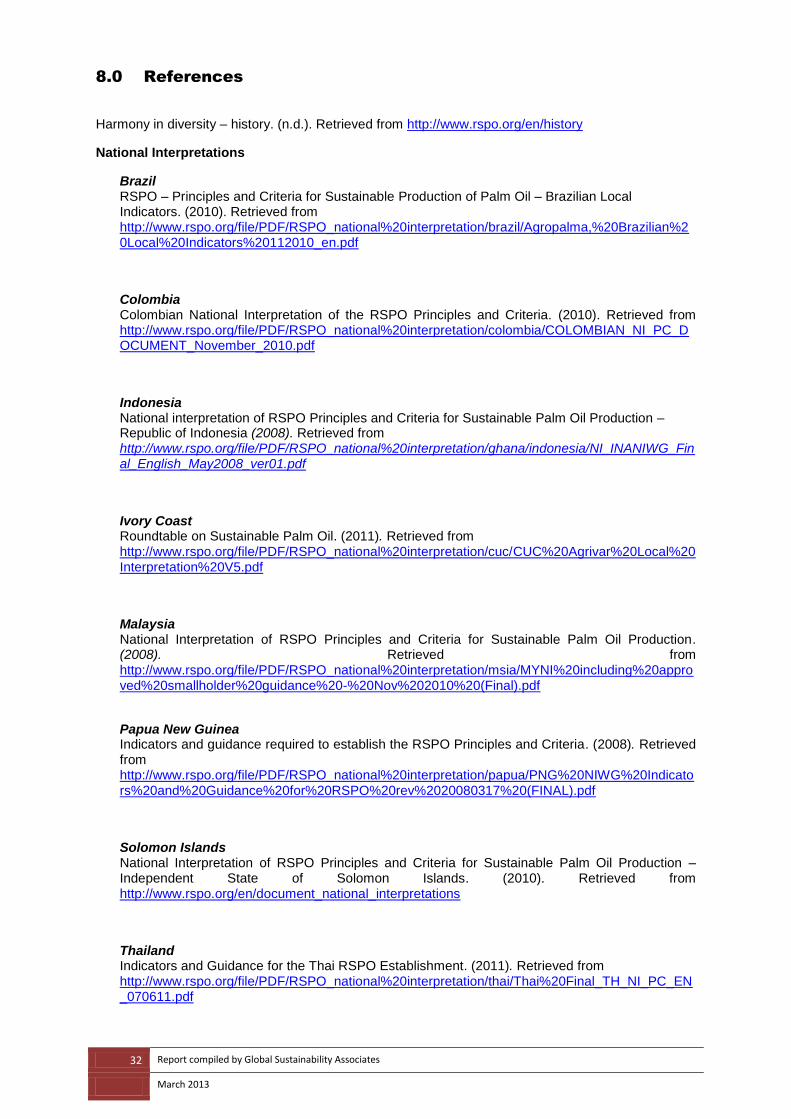
Harmony in diversity – history. (n.d.). Retrieved from http://www.rspo.org/en/history
National Interpretations
Brazil RSPO – Principles and Criteria for Sustainable Production of Palm Oil – Brazilian Local Indicators. (2010). Retrieved from http://www.rspo.org/file/PDF/RSPO_national%20interpretation/brazil/Agropalma,%20Brazilian%20Local%20Indicators%20112010_en.pdf
Colombia Colombian National Interpretation of the RSPO Principles and Criteria. (2010). Retrieved from http://www.rspo.org/file/PDF/RSPO_national%20interpretation/colombia/COLOMBIAN_NI_PC_DOCUMENT_November_2010.pdf
Indonesia National interpretation of RSPO Principles and Criteria for Sustainable Palm Oil Production – Republic of Indonesia (2008). Retrieved from http://www.rspo.org/file/PDF/RSPO_national%20interpretation/ghana/indonesia/NI_INANIWG_Final_English_May2008_ver01.pdf
Ivory Coast Roundtable on Sustainable Palm Oil. (2011). Retrieved from http://www.rspo.org/file/PDF/RSPO_national%20interpretation/cuc/CUC%20Agrivar%20Local%20Interpretation%20V5.pdf
Malaysia National Interpretation of RSPO Principles and Criteria for Sustainable Palm Oil Production. (2008). Retrieved from http://www.rspo.org/file/PDF/RSPO_national%20interpretation/msia/MYNI%20including%20approved%20smallholder%20guidance%20-%20Nov%202010%20(Final).pdf
Papua New Guinea Indicators and guidance required to establish the RSPO Principles and Criteria. (2008). Retrieved from http://www.rspo.org/file/PDF/RSPO_national%20interpretation/papua/PNG%20NIWG%20Indicators%20and%20Guidance%20for%20RSPO%20rev%2020080317%20(FINAL).pdf
Solomon Islands National Interpretation of RSPO Principles and Criteria for Sustainable Palm Oil Production – Independent State of Solomon Islands. (2010). Retrieved from http://www.rspo.org/en/document_national_interpretations
Thailand Indicators and Guidance for the Thai RSPO Establishment. (2011). Retrieved from http://www.rspo.org/file/PDF/RSPO_national%20interpretation/thai/Thai%20Final_TH_NI_PC_EN_070611.pdf

33 Report compiled by Global Sustainability Associates
March 2013
9.0 Appendices
9.1 Appendix A - Definitions
Unit of certification The unit of certification is a mill and 100% of its fruit base. A fruit base may
either contain:
Only directly managed land (estates) Only Smallholders (schemed, associated, independent or unknown) Estates and smallholder in any of the above combinations Estates with a portion of the fruit sourced from other non related estates
Types of Audits The first audit of a company is called certification Stage one. This is typically 6 months prior to the main certification audit (Stage two). All subsequent audits are called ‘surveillance” audits. These annual audits continue until the 5 year certification period expires and the unit of certification is re certified and the process of surveillance audits is then repeated.
Types of non-conformances A major non-conformance is an audit finding where certification cannot proceed until the outstanding issues is closed out. The non-conformance is assigned to a specific indicator in a specific criterion within one of the 8 Principles of the P&C standard. This is the most serious level of non-conformance. The timeline for closing out is 60 days. If a major non-conformance is assigned to a unit of certification then the lead auditor(s) must revisit the unit to confirm closure within 60 days. If the timeline is not met then certification is withheld. No public summary is given until the issue is closed. The public summary will always contain a record of the major non-conformances assigned, a statement as to how these issues were addressed and confirmation of their closure.
A minor non-conformance is an audit finding where certification can proceed with the issues left open but with the unit of certification stating how it intends to close out the issue. The non-conformance is assigned to a specific indicator in a specific criterion within one of the 8 Principles of the P&C standard. Both a record of the minor non-conformance and the action to close it out are stated in the public summary. The timeline for closing out is the next audit which is less than 12 months from the date of the previous audit. At this audit the audit teams check that the actions to close out the non-conformance previously stated have been carried out. If by the next audit a minor non-conformance is not closed out it is automatically elevated to a major non-conformance and the unit has 60 days to close this out or lose certification. A minor non-conformance is therefore an indicator of a potential ‘major” issue.
Observations are assigned at the auditor(s) discretion. They vary widely and often stray into areas outside of the scope of the audit. The observation should be assigned to a specific indicator but are often assigned at the criteria level. Observation can be positive or negative. In this analysis only negative observations have been reviewed and are referred to as observations for improvement. Less reliable than either major or minor they do not reflect non-conformance but instead reflect the auditor(s) experience in detecting areas which if left unattended may become minor non-conformances. They can be seen as a precursor to minor non-conformances.
34 Report compiled by Global Sustainability Associates
March 2013
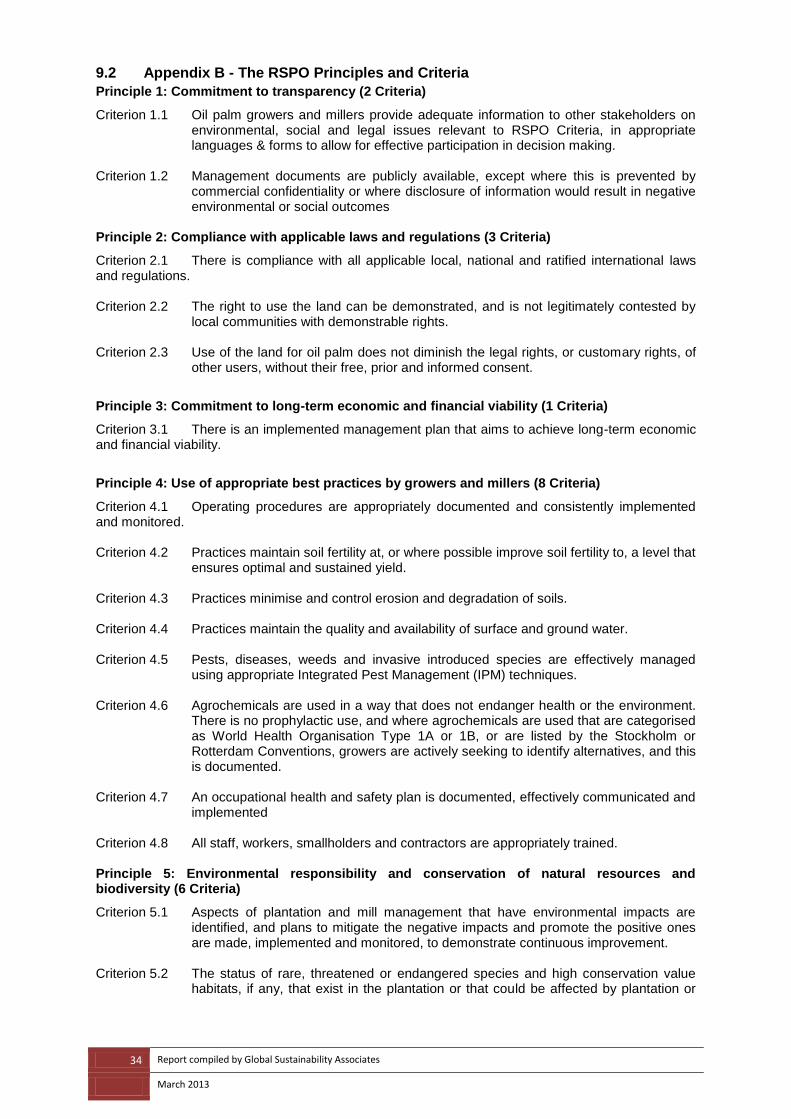
9.2 Appendix B - The RSPO Principles and Criteria
Principle 1: Commitment to transparency (2 Criteria)
Criterion 1.1 Oil palm growers and millers provide adequate information to other stakeholders on environmental, social and legal issues relevant to RSPO Criteria, in appropriate languages & forms to allow for effective participation in decision making.
Criterion 1.2 Management documents are publicly available, except where this is prevented by
commercial confidentiality or where disclosure of information would result in negative environmental or social outcomes
Principle 2: Compliance with applicable laws and regulations (3 Criteria)
Criterion 2.1 There is compliance with all applicable local, national and ratified international laws and regulations. Criterion 2.2 The right to use the land can be demonstrated, and is not legitimately contested by
local communities with demonstrable rights. Criterion 2.3 Use of the land for oil palm does not diminish the legal rights, or customary rights, of
other users, without their free, prior and informed consent.
Principle 3: Commitment to long-term economic and financial viability (1 Criteria)
Criterion 3.1 There is an implemented management plan that aims to achieve long-term economic and financial viability.
Principle 4: Use of appropriate best practices by growers and millers (8 Criteria)
Criterion 4.1 Operating procedures are appropriately documented and consistently implemented and monitored. Criterion 4.2 Practices maintain soil fertility at, or where possible improve soil fertility to, a level that
ensures optimal and sustained yield. Criterion 4.3 Practices minimise and control erosion and degradation of soils. Criterion 4.4 Practices maintain the quality and availability of surface and ground water. Criterion 4.5 Pests, diseases, weeds and invasive introduced species are effectively managed
using appropriate Integrated Pest Management (IPM) techniques. Criterion 4.6 Agrochemicals are used in a way that does not endanger health or the environment.
There is no prophylactic use, and where agrochemicals are used that are categorised as World Health Organisation Type 1A or 1B, or are listed by the Stockholm or Rotterdam Conventions, growers are actively seeking to identify alternatives, and this is documented.
Criterion 4.7 An occupational health and safety plan is documented, effectively communicated and
implemented Criterion 4.8 All staff, workers, smallholders and contractors are appropriately trained. Principle 5: Environmental responsibility and conservation of natural resources and biodiversity (6 Criteria)
Criterion 5.1 Aspects of plantation and mill management that have environmental impacts are identified, and plans to mitigate the negative impacts and promote the positive ones are made, implemented and monitored, to demonstrate continuous improvement.
Criterion 5.2 The status of rare, threatened or endangered species and high conservation value
habitats, if any, that exist in the plantation or that could be affected by plantation or

35 Report compiled by Global Sustainability Associates
March 2013
mill management, shall be identified and their conservation taken into account in management plans and operations.
Criterion 5.3 Waste is reduced, recycled, re-used and disposed of in an environmentally and
socially responsible manner. Criterion 5.4 Efficiency of energy use and use of renewable energy is maximised. Criterion 5.5 Use of fire for waste disposal and for preparing land for replanting is avoided except
in specific situations, as identified in the ASEAN guidelines or other regional best practice.
Criterion 5.6 Plans to reduce pollution and emissions, including greenhouse gases, are developed,
implemented and monitored. Principle 6: Responsible consideration of employees and of individuals and communities affected by growers and mills (11 Criteria)
Criterion 6.1 Aspects of plantation and mill management that have social impacts are identified in a participatory way and plans to mitigate the negative impacts and promote the positive ones are made, implemented and monitored, to demonstrate continuous improvement.
Criterion 6.2 There are open and transparent methods for communication and consultation
between growers and/or millers, local communities and other affected or interested parties.
Criterion 6.3 There is a mutually agreed and documented system for dealing with complaints and
grievances, which is implemented and accepted by all parties. Criterion 6.4 Any negotiations concerning compensation for loss of legal or customary rights are
dealt with through a documented system that enables indigenous peoples, local communities and other stakeholders to express their views through their own representative institutions.
Criterion 6.5 Pay and conditions for employees and for employees of contractors always meet at
least legal or industry minimum standards and are sufficient to meet basic needs of personnel and to provide some discretionary income.
Criterion 6.6 The employer respects the right of all personnel to form and join trade unions of their
choice and to bargain collectively. Where the right to freedom of association and collective bargaining are restricted under law, the employer facilitates parallel means of independent and free association and bargaining for all such personnel.
Criterion 6.7 Child labour is not used. Children are not exposed to hazardous working conditions.
Work by children is acceptable on family farms, under adult supervision, and when not interfering with education programmes.
Criterion 6.8 The employer shall not engage in or support discrimination based on race, caste,
national origin, religion, disability, gender, sexual orientation, union membership, political affiliation, or age.
Criterion 6.9 A policy to prevent sexual harassment and all other forms of violence against women
and to protect their reproductive rights is developed and applied. Criterion 6.10 Growers and mills deal fairly and transparently with smallholders and other local businesses. Criterion 6.11 Growers and millers contribute to local sustainable development wherever appropriate.
Principle 7: Responsible development of new plantings (7 Criteria)

36 Report compiled by Global Sustainability Associates
March 2013
Criterion 7.1 A comprehensive and participatory independent social and environmental impact assessment is undertaken prior to establishing new plantings or operations, or expanding existing ones, and the results incorporated into planning, management and operations.
Criterion 7.2 Soil surveys and topographic information are used for site planning in the
establishment of new plantings, and the results are incorporated into plans and operations.
Criterion 7.3 New plantings since November 2005 (which is the expected date of adoption of these
criteria by the RSPO membership), have not replaced primary forest or any area containing one or more High Conservation Values.
Criterion 7.4 Extensive planting on steep terrain, and/or on marginal and fragile soils, is avoided. Criterion 7.5 No new plantings are established on local peoples’ land without their free, prior and
informed consent, dealt with through a documented system that enables indigenous peoples, local communities and other stakeholders to express their views through their own representative institutions.
Criterion 7.6 Local people are compensated for any agreed land acquisitions and relinquishment of
rights, subject to their free, prior and informed consent and negotiated agreements.
Criterion 7.7 Use of fire in the preparation of new plantings is avoided other than in specific situations, as identified in the ASEAN guidelines or other regional best practice.
Principle 8: Commitment to continuous improvement in key areas of activity (1 Criteria) Criterion 8.1 Growers and millers regularly monitor and review their activities and develop and
implement action plans that allow demonstrable continuous improvement in key operations.
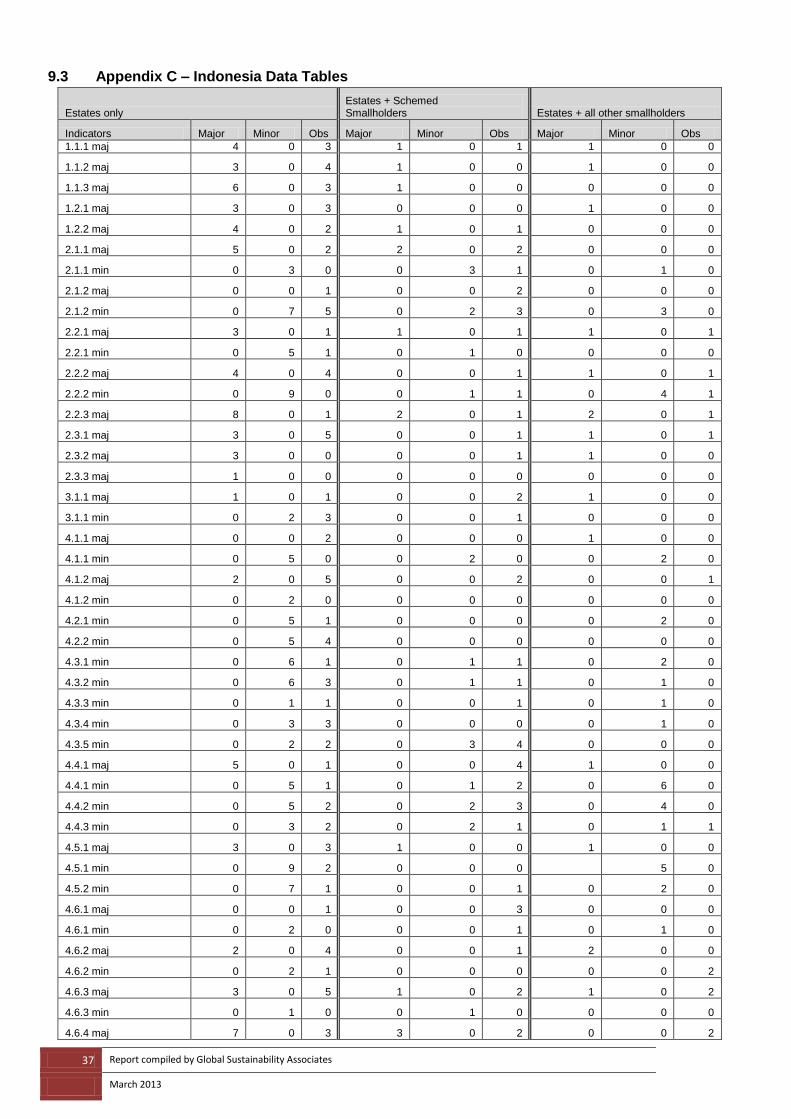
37 Report compiled by Global Sustainability Associates
March 2013
9.3 Appendix C – Indonesia Data Tables
Estates only Estates + Schemed Smallholders Estates + all other smallholders
Indicators Major Minor Obs Major Minor Obs Major Minor Obs
1.1.1 maj 4 0 3 1 0 1 1 0 0
1.1.2 maj 3 0 4 1 0 0 1 0 0
1.1.3 maj 6 0 3 1 0 0 0 0 0
1.2.1 maj 3 0 3 0 0 0 1 0 0
1.2.2 maj 4 0 2 1 0 1 0 0 0
2.1.1 maj 5 0 2 2 0 2 0 0 0
2.1.1 min 0 3 0 0 3 1 0 1 0
2.1.2 maj 0 0 1 0 0 2 0 0 0
2.1.2 min 0 7 5 0 2 3 0 3 0
2.2.1 maj 3 0 1 1 0 1 1 0 1
2.2.1 min 0 5 1 0 1 0 0 0 0
2.2.2 maj 4 0 4 0 0 1 1 0 1
2.2.2 min 0 9 0 0 1 1 0 4 1
2.2.3 maj 8 0 1 2 0 1 2 0 1
2.3.1 maj 3 0 5 0 0 1 1 0 1
2.3.2 maj 3 0 0 0 0 1 1 0 0
2.3.3 maj 1 0 0 0 0 0 0 0 0
3.1.1 maj 1 0 1 0 0 2 1 0 0
3.1.1 min 0 2 3 0 0 1 0 0 0
4.1.1 maj 0 0 2 0 0 0 1 0 0
4.1.1 min 0 5 0 0 2 0 0 2 0
4.1.2 maj 2 0 5 0 0 2 0 0 1
4.1.2 min 0 2 0 0 0 0 0 0 0
4.2.1 min 0 5 1 0 0 0 0 2 0
4.2.2 min 0 5 4 0 0 0 0 0 0
4.3.1 min 0 6 1 0 1 1 0 2 0
4.3.2 min 0 6 3 0 1 1 0 1 0
4.3.3 min 0 1 1 0 0 1 0 1 0
4.3.4 min 0 3 3 0 0 0 0 1 0
4.3.5 min 0 2 2 0 3 4 0 0 0
4.4.1 maj 5 0 1 0 0 4 1 0 0
4.4.1 min 0 5 1 0 1 2 0 6 0
4.4.2 min 0 5 2 0 2 3 0 4 0
4.4.3 min 0 3 2 0 2 1 0 1 1
4.5.1 maj 3 0 3 1 0 0 1 0 0
4.5.1 min 0 9 2 0 0 0 5 0
4.5.2 min 0 7 1 0 0 1 0 2 0
4.6.1 maj 0 0 1 0 0 3 0 0 0
4.6.1 min 0 2 0 0 0 1 0 1 0
4.6.2 maj 2 0 4 0 0 1 2 0 0
4.6.2 min 0 2 1 0 0 0 0 0 2
4.6.3 maj 3 0 5 1 0 2 1 0 2
4.6.3 min 0 1 0 0 1 0 0 0 0
4.6.4 maj 7 0 3 3 0 2 0 0 2

38 Report compiled by Global Sustainability Associates
March 2013
Estates only Estates + Schemed Smallholders Estates + all other smallholders
Indicators Major Minor Obs Major Minor Obs Major Minor Obs
4.7.1 maj 3 0 2 1 0 2 2 0 0
4.7.1 min 0 2 0 0 0 0 0 0 0
4.7.2 maj 0 0 2 0 0 1 1 0 0
4.7.2 min 0 2 4 0 1 1 0 1 0
4.7.3 min 0 14 6 0 0 0 0 9 0
4.7.4 min 0 9 2 0 0 2 0 0 1
4.7.5 min 0 4 4 0 1 0 0 1 0
4.7.6 min 0 5 4 0 1 1 0 3 0
4.7.7 min 0 2 2 0 1 1 0 1 0
4.7.8 min 0 3 5 0 1 4 0 4 1
4.8.1 maj 6 0 5 0 0 5 2 0 0
4.8.2 maj 3 0 4 0 0 1 0 0 0
4.8.3 maj 5 0 4 0 0 0 0 0 0
5.1.1 maj 3 0 1 1 0 0 0 0 0
5.1.1 min 0 10 1 0 1 2 0 2 1
5.1.2 maj 8 0 4 1 0 3 0 0 1
5.2.1 maj 8 0 2 1 0 0 0 0 0
5.2.1 min 0 10 7 0 1 0 0 0 1
5.2.2 maj 9 0 4 3 0 2 1 0 0
5.2.2 min 0 14 5 0 4 1 0 4 0
5.2.3 maj 4 0 2 2 0 3 1 0 0
5.3.1 maj 6 0 2 1 0 1 1 0 2
5.3.1 min 0 12 0 2 3 2 1
5.3.2 maj 5 0 1 1 0 1 0 0 0
5.3.2 min 0 6 4 0 0 2 0 3 0
5.4.1 min 0 11 3 0 1 1 0 2 0
5.4.2 min 0 6 1 0 1 0 0 0 0
5.5.1 maj 0 0 2 0 0 0 0 0 0
5.5.1 min 0 0 5 0 0 0 0 1 1
5.5.2 maj 0 0 1 0 0 0 0 0 0
5.5.3 maj 3 0 3 0 0 0 2 0 0
5.6.1 maj 2 0 0 0 0 1 1 0 0
5.6.1 min 0 7 1 0 0 1 0 1 0
5.6.2 maj 1 0 1 0 0 0 0 0 0
5.6.2 min 0 2 1 0 2 0 0 1 0
6.1.1 maj 4 0 1 1 0 1 2 0 0
6.1.1 min 0 9 1 0 1 0 0 2 0
6.1.2 min 0 10 1 0 3 3 0 3 0
6.1.3 min 0 6 3 0 1 2 0 0 0
6.1.4 min 0 2 1 0 2 4 0 2 1
6.2.1 maj 5 0 1 0 0 1 1 0 0
6.2.1 min 0 0 2 0 1 0 0 0 0
6.2.2 min 0 4 2 0 0 0 0 0 1
6.2.3 min 0 1 2 0 0 1 0 2 1
6.3.1 maj 5 0 1 1 0 0 1 0 0
6.3.1 min 0 3 1 0 1 1 0 0 0
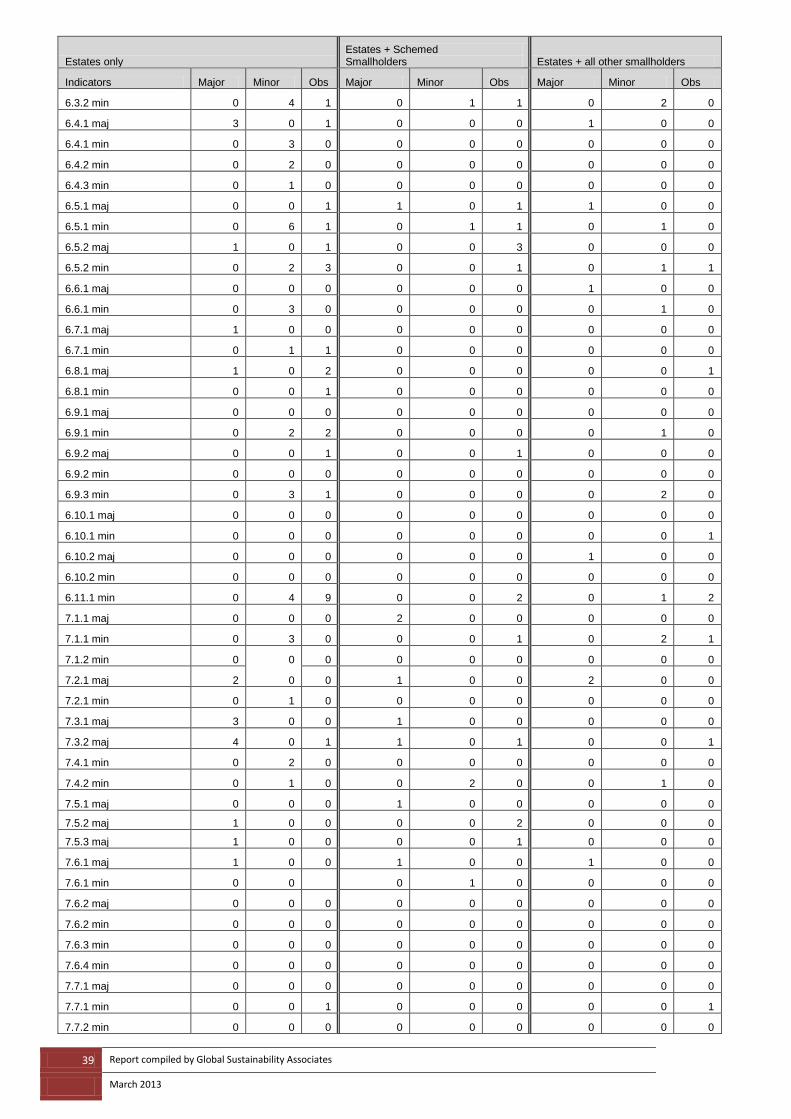
39 Report compiled by Global Sustainability Associates
March 2013
Estates only Estates + Schemed Smallholders Estates + all other smallholders
Indicators Major Minor Obs Major Minor Obs Major Minor Obs
6.3.2 min 0 4 1 0 1 1 0 2 0
6.4.1 maj 3 0 1 0 0 0 1 0 0
6.4.1 min 0 3 0 0 0 0 0 0 0
6.4.2 min 0 2 0 0 0 0 0 0 0
6.4.3 min 0 1 0 0 0 0 0 0 0
6.5.1 maj 0 0 1 1 0 1 1 0 0
6.5.1 min 0 6 1 0 1 1 0 1 0
6.5.2 maj 1 0 1 0 0 3 0 0 0
6.5.2 min 0 2 3 0 0 1 0 1 1
6.6.1 maj 0 0 0 0 0 0 1 0 0
6.6.1 min 0 3 0 0 0 0 0 1 0
6.7.1 maj 1 0 0 0 0 0 0 0 0
6.7.1 min 0 1 1 0 0 0 0 0 0
6.8.1 maj 1 0 2 0 0 0 0 0 1
6.8.1 min 0 0 1 0 0 0 0 0 0
6.9.1 maj 0 0 0 0 0 0 0 0 0
6.9.1 min 0 2 2 0 0 0 0 1 0
6.9.2 maj 0 0 1 0 0 1 0 0 0
6.9.2 min 0 0 0 0 0 0 0 0 0
6.9.3 min 0 3 1 0 0 0 0 2 0
6.10.1 maj 0 0 0 0 0 0 0 0 0
6.10.1 min 0 0 0 0 0 0 0 0 1
6.10.2 maj 0 0 0 0 0 0 1 0 0
6.10.2 min 0 0 0 0 0 0 0 0 0
6.11.1 min 0 4 9 0 0 2 0 1 2
7.1.1 maj 0 0 0 2 0 0 0 0 0
7.1.1 min 0 3 0 0 0 1 0 2 1
7.1.2 min 0 0 0 0 0 0 0 0 0
7.2.1 maj 2 0 0 1 0 0 2 0 0
7.2.1 min 0 1 0 0 0 0 0 0 0
7.3.1 maj 3 0 0 1 0 0 0 0 0
7.3.2 maj 4 0 1 1 0 1 0 0 1
7.4.1 min 0 2 0 0 0 0 0 0 0
7.4.2 min 0 1 0 0 2 0 0 1 0
7.5.1 maj 0 0 0 1 0 0 0 0 0
7.5.2 maj 1 0 0 0 0 2 0 0 0
7.5.3 maj 1 0 0 0 0 1 0 0 0
7.6.1 maj 1 0 0 1 0 0 1 0 0
7.6.1 min 0 0 0 1 0 0 0 0
7.6.2 maj 0 0 0 0 0 0 0 0 0
7.6.2 min 0 0 0 0 0 0 0 0 0
7.6.3 min 0 0 0 0 0 0 0 0 0
7.6.4 min 0 0 0 0 0 0 0 0 0
7.7.1 maj 0 0 0 0 0 0 0 0 0
7.7.1 min 0 0 1 0 0 0 0 0 1
7.7.2 min 0 0 0 0 0 0 0 0 0
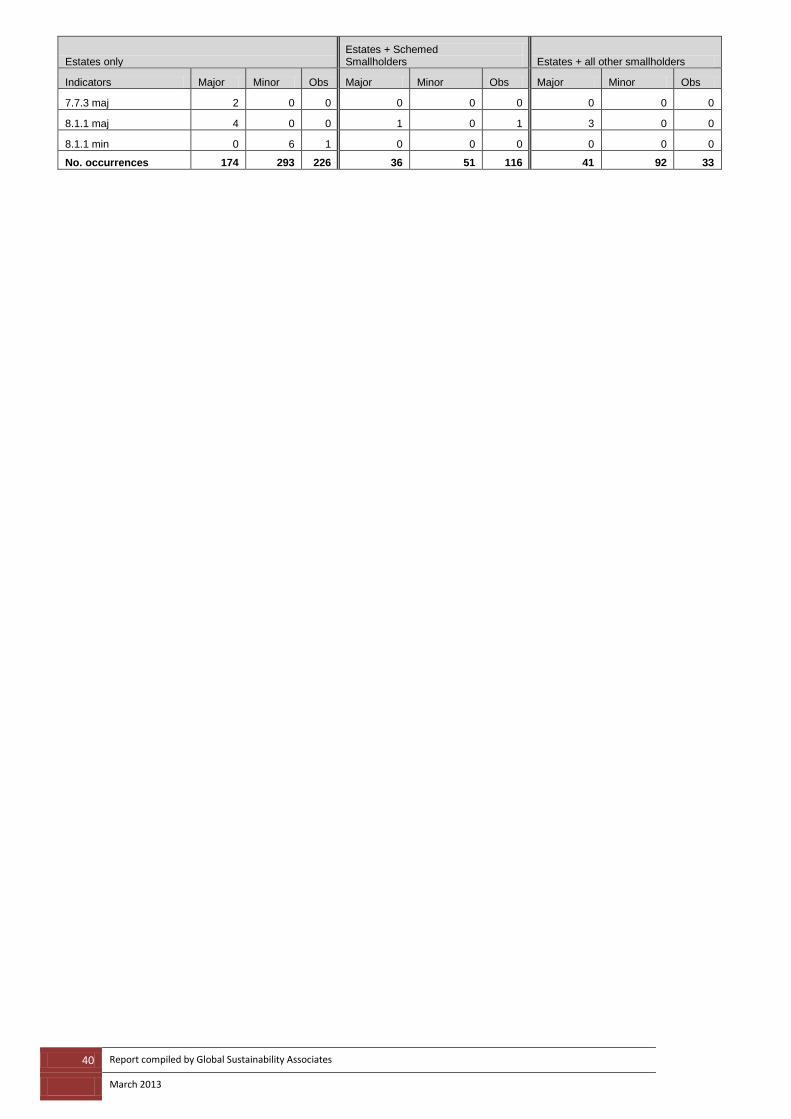
40 Report compiled by Global Sustainability Associates
March 2013
Estates only Estates + Schemed Smallholders Estates + all other smallholders
Indicators Major Minor Obs Major Minor Obs Major Minor Obs
7.7.3 maj 2 0 0 0 0 0 0 0 0
8.1.1 maj 4 0 0 1 0 1 3 0 0
8.1.1 min 0 6 1 0 0 0 0 0 0
No. occurrences 174 293 226 36 51 116 41 92 33
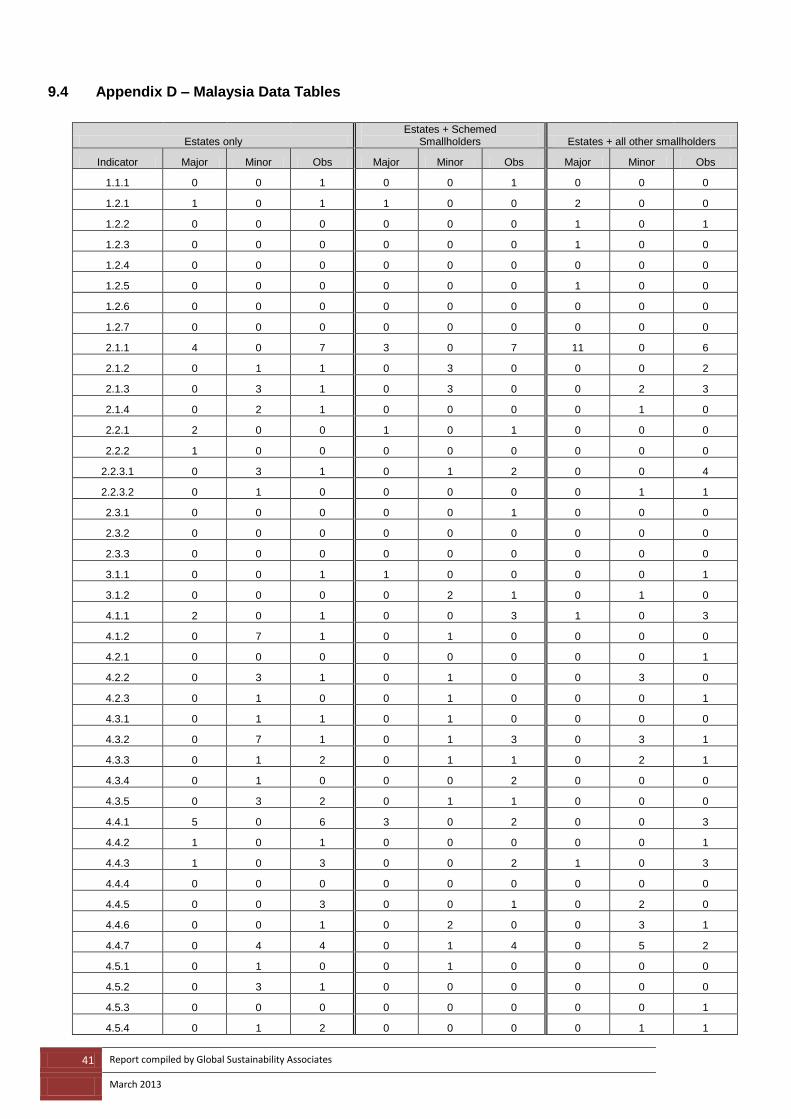
41 Report compiled by Global Sustainability Associates
March 2013
9.4 Appendix D – Malaysia Data Tables
Estates only
Estates + Schemed Smallholders Estates + all other smallholders
Indicator Major Minor Obs Major Minor Obs Major Minor Obs
1.1.1 0 0 1 0 0 1 0 0 0
1.2.1 1 0 1 1 0 0 2 0 0
1.2.2 0 0 0 0 0 0 1 0 1
1.2.3 0 0 0 0 0 0 1 0 0
1.2.4 0 0 0 0 0 0 0 0 0
1.2.5 0 0 0 0 0 0 1 0 0
1.2.6 0 0 0 0 0 0 0 0 0
1.2.7 0 0 0 0 0 0 0 0 0
2.1.1 4 0 7 3 0 7 11 0 6
2.1.2 0 1 1 0 3 0 0 0 2
2.1.3 0 3 1 0 3 0 0 2 3
2.1.4 0 2 1 0 0 0 0 1 0
2.2.1 2 0 0 1 0 1 0 0 0
2.2.2 1 0 0 0 0 0 0 0 0
2.2.3.1 0 3 1 0 1 2 0 0 4
2.2.3.2 0 1 0 0 0 0 0 1 1
2.3.1 0 0 0 0 0 1 0 0 0
2.3.2 0 0 0 0 0 0 0 0 0
2.3.3 0 0 0 0 0 0 0 0 0
3.1.1 0 0 1 1 0 0 0 0 1
3.1.2 0 0 0 0 2 1 0 1 0
4.1.1 2 0 1 0 0 3 1 0 3
4.1.2 0 7 1 0 1 0 0 0 0
4.2.1 0 0 0 0 0 0 0 0 1
4.2.2 0 3 1 0 1 0 0 3 0
4.2.3 0 1 0 0 1 0 0 0 1
4.3.1 0 1 1 0 1 0 0 0 0
4.3.2 0 7 1 0 1 3 0 3 1
4.3.3 0 1 2 0 1 1 0 2 1
4.3.4 0 1 0 0 0 2 0 0 0
4.3.5 0 3 2 0 1 1 0 0 0
4.4.1 5 0 6 3 0 2 0 0 3
4.4.2 1 0 1 0 0 0 0 0 1
4.4.3 1 0 3 0 0 2 1 0 3
4.4.4 0 0 0 0 0 0 0 0 0
4.4.5 0 0 3 0 0 1 0 2 0
4.4.6 0 0 1 0 2 0 0 3 1
4.4.7 0 4 4 0 1 4 0 5 2
4.5.1 0 1 0 0 1 0 0 0 0
4.5.2 0 3 1 0 0 0 0 0 0
4.5.3 0 0 0 0 0 0 0 0 1
4.5.4 0 1 2 0 0 0 0 1 1
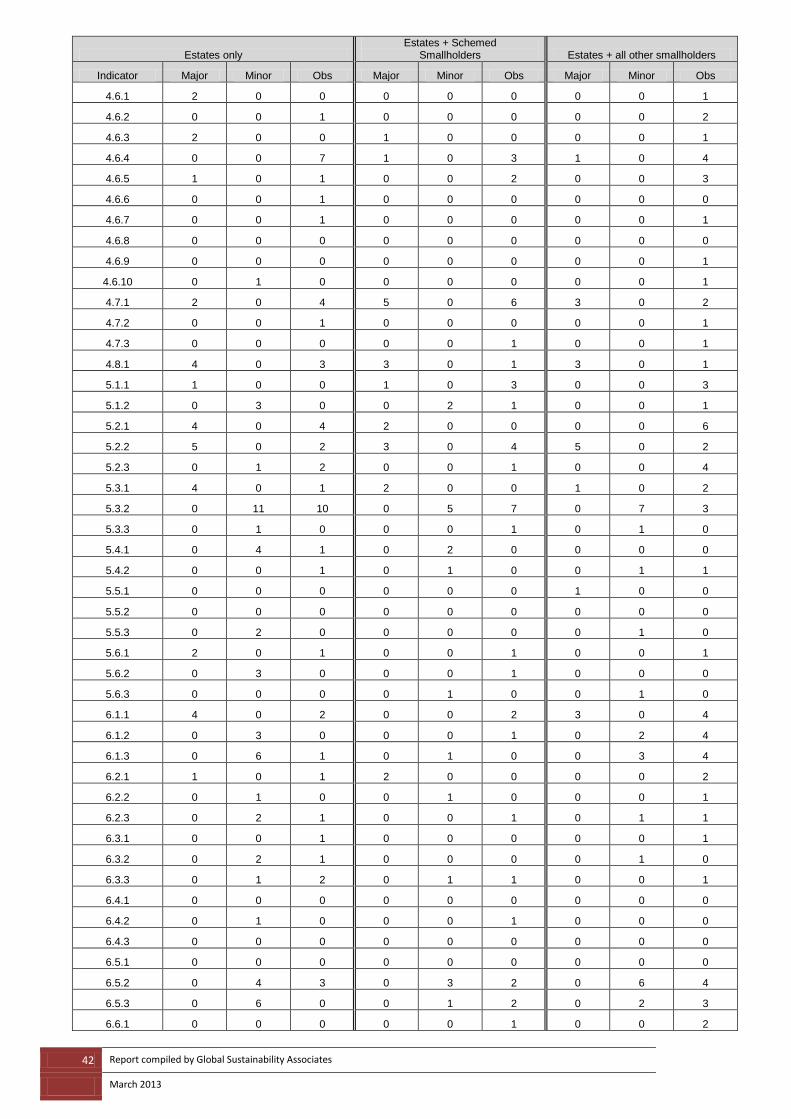
42 Report compiled by Global Sustainability Associates
March 2013
Estates only Estates + Schemed
Smallholders Estates + all other smallholders
Indicator Major Minor Obs Major Minor Obs Major Minor Obs
4.6.1 2 0 0 0 0 0 0 0 1
4.6.2 0 0 1 0 0 0 0 0 2
4.6.3 2 0 0 1 0 0 0 0 1
4.6.4 0 0 7 1 0 3 1 0 4
4.6.5 1 0 1 0 0 2 0 0 3
4.6.6 0 0 1 0 0 0 0 0 0
4.6.7 0 0 1 0 0 0 0 0 1
4.6.8 0 0 0 0 0 0 0 0 0
4.6.9 0 0 0 0 0 0 0 0 1
4.6.10 0 1 0 0 0 0 0 0 1
4.7.1 2 0 4 5 0 6 3 0 2
4.7.2 0 0 1 0 0 0 0 0 1
4.7.3 0 0 0 0 0 1 0 0 1
4.8.1 4 0 3 3 0 1 3 0 1
5.1.1 1 0 0 1 0 3 0 0 3
5.1.2 0 3 0 0 2 1 0 0 1
5.2.1 4 0 4 2 0 0 0 0 6
5.2.2 5 0 2 3 0 4 5 0 2
5.2.3 0 1 2 0 0 1 0 0 4
5.3.1 4 0 1 2 0 0 1 0 2
5.3.2 0 11 10 0 5 7 0 7 3
5.3.3 0 1 0 0 0 1 0 1 0
5.4.1 0 4 1 0 2 0 0 0 0
5.4.2 0 0 1 0 1 0 0 1 1
5.5.1 0 0 0 0 0 0 1 0 0
5.5.2 0 0 0 0 0 0 0 0 0
5.5.3 0 2 0 0 0 0 0 1 0
5.6.1 2 0 1 0 0 1 0 0 1
5.6.2 0 3 0 0 0 1 0 0 0
5.6.3 0 0 0 0 1 0 0 1 0
6.1.1 4 0 2 0 0 2 3 0 4
6.1.2 0 3 0 0 0 1 0 2 4
6.1.3 0 6 1 0 1 0 0 3 4
6.2.1 1 0 1 2 0 0 0 0 2
6.2.2 0 1 0 0 1 0 0 0 1
6.2.3 0 2 1 0 0 1 0 1 1
6.3.1 0 0 1 0 0 0 0 0 1
6.3.2 0 2 1 0 0 0 0 1 0
6.3.3 0 1 2 0 1 1 0 0 1
6.4.1 0 0 0 0 0 0 0 0 0
6.4.2 0 1 0 0 0 1 0 0 0
6.4.3 0 0 0 0 0 0 0 0 0
6.5.1 0 0 0 0 0 0 0 0 0
6.5.2 0 4 3 0 3 2 0 6 4
6.5.3 0 6 0 0 1 2 0 2 3
6.6.1 0 0 0 0 0 1 0 0 2
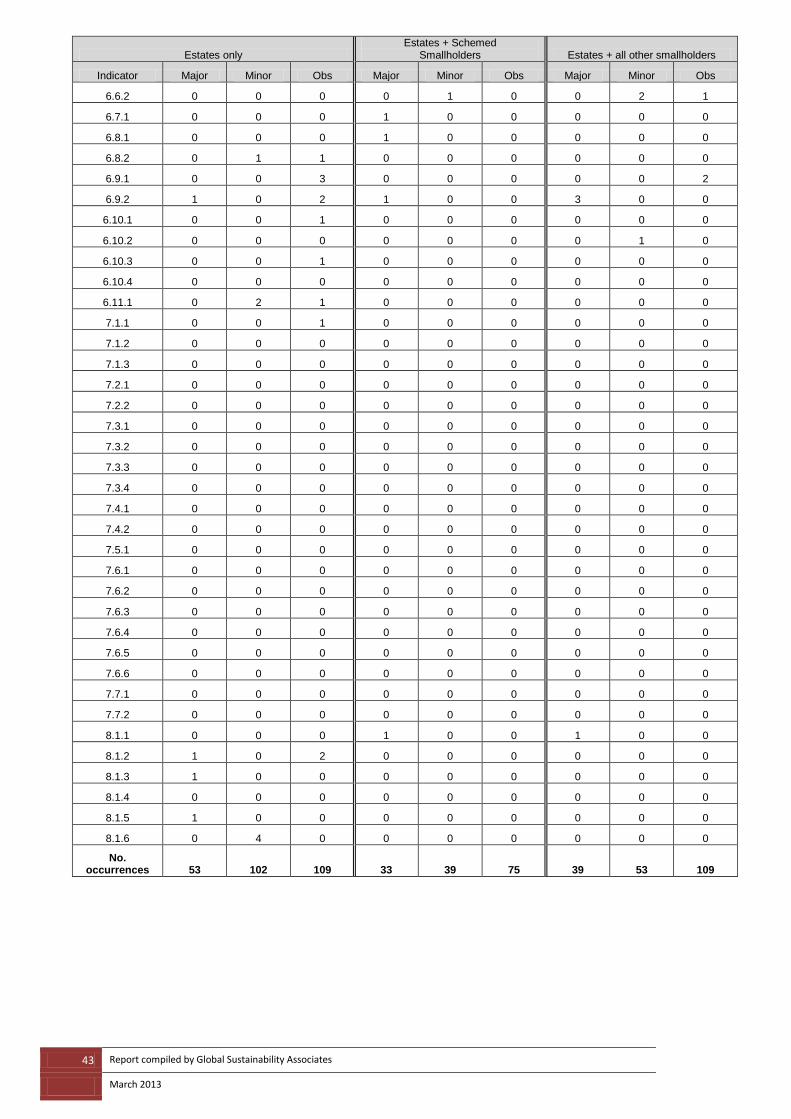
43 Report compiled by Global Sustainability Associates
March 2013
Estates only Estates + Schemed
Smallholders Estates + all other smallholders
Indicator Major Minor Obs Major Minor Obs Major Minor Obs
6.6.2 0 0 0 0 1 0 0 2 1
6.7.1 0 0 0 1 0 0 0 0 0
6.8.1 0 0 0 1 0 0 0 0 0
6.8.2 0 1 1 0 0 0 0 0 0
6.9.1 0 0 3 0 0 0 0 0 2
6.9.2 1 0 2 1 0 0 3 0 0
6.10.1 0 0 1 0 0 0 0 0 0
6.10.2 0 0 0 0 0 0 0 1 0
6.10.3 0 0 1 0 0 0 0 0 0
6.10.4 0 0 0 0 0 0 0 0 0
6.11.1 0 2 1 0 0 0 0 0 0
7.1.1 0 0 1 0 0 0 0 0 0
7.1.2 0 0 0 0 0 0 0 0 0
7.1.3 0 0 0 0 0 0 0 0 0
7.2.1 0 0 0 0 0 0 0 0 0
7.2.2 0 0 0 0 0 0 0 0 0
7.3.1 0 0 0 0 0 0 0 0 0
7.3.2 0 0 0 0 0 0 0 0 0
7.3.3 0 0 0 0 0 0 0 0 0
7.3.4 0 0 0 0 0 0 0 0 0
7.4.1 0 0 0 0 0 0 0 0 0
7.4.2 0 0 0 0 0 0 0 0 0
7.5.1 0 0 0 0 0 0 0 0 0
7.6.1 0 0 0 0 0 0 0 0 0
7.6.2 0 0 0 0 0 0 0 0 0
7.6.3 0 0 0 0 0 0 0 0 0
7.6.4 0 0 0 0 0 0 0 0 0
7.6.5 0 0 0 0 0 0 0 0 0
7.6.6 0 0 0 0 0 0 0 0 0
7.7.1 0 0 0 0 0 0 0 0 0
7.7.2 0 0 0 0 0 0 0 0 0
8.1.1 0 0 0 1 0 0 1 0 0
8.1.2 1 0 2 0 0 0 0 0 0
8.1.3 1 0 0 0 0 0 0 0 0
8.1.4 0 0 0 0 0 0 0 0 0
8.1.5 1 0 0 0 0 0 0 0 0
8.1.6 0 4 0 0 0 0 0 0 0
No. occurrences 53 102 109 33 39 75 39 53 109
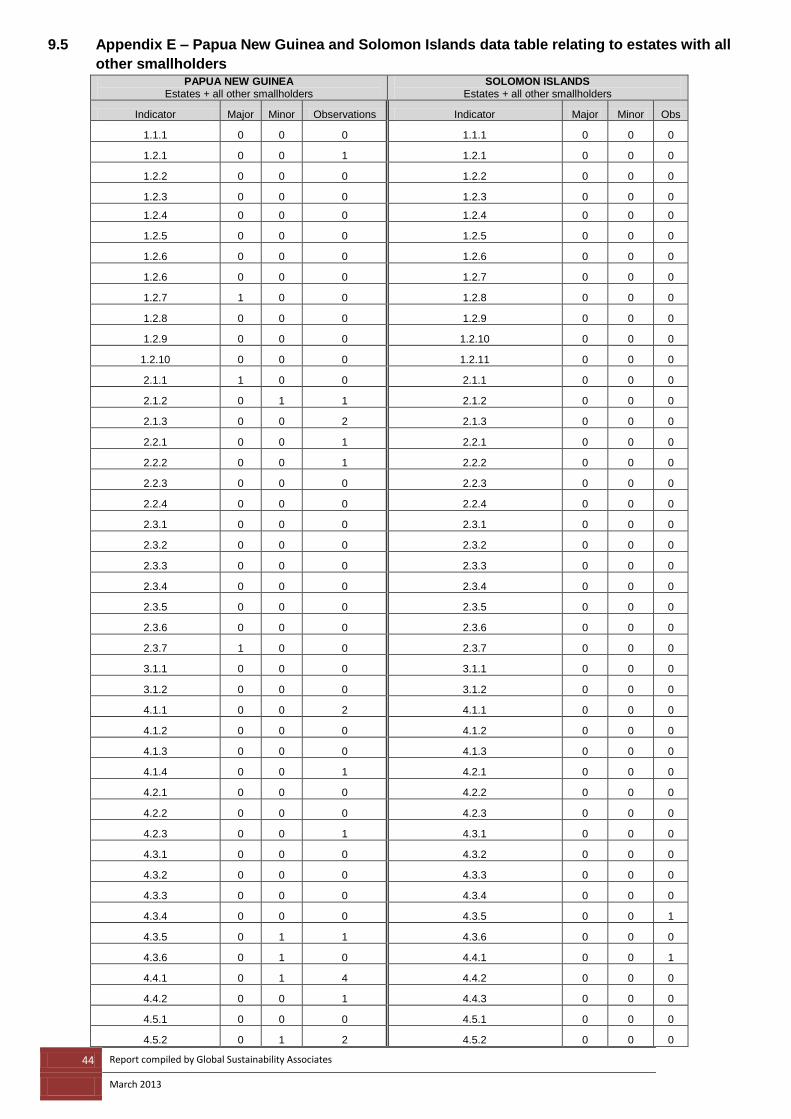
44 Report compiled by Global Sustainability Associates
March 2013
9.5 Appendix E – Papua New Guinea and Solomon Islands data table relating to estates with all
other smallholders PAPUA NEW GUINEA
Estates + all other smallholders SOLOMON ISLANDS
Estates + all other smallholders
Indicator Major Minor Observations Indicator Major Minor Obs
1.1.1 0 0 0 1.1.1 0 0 0
1.2.1 0 0 1 1.2.1 0 0 0
1.2.2 0 0 0 1.2.2 0 0 0
1.2.3 0 0 0 1.2.3 0 0 0
1.2.4 0 0 0 1.2.4 0 0 0
1.2.5 0 0 0 1.2.5 0 0 0
1.2.6 0 0 0 1.2.6 0 0 0
1.2.6 0 0 0 1.2.7 0 0 0
1.2.7 1 0 0 1.2.8 0 0 0
1.2.8 0 0 0 1.2.9 0 0 0
1.2.9 0 0 0 1.2.10 0 0 0
1.2.10 0 0 0 1.2.11 0 0 0
2.1.1 1 0 0 2.1.1 0 0 0
2.1.2 0 1 1 2.1.2 0 0 0
2.1.3 0 0 2 2.1.3 0 0 0
2.2.1 0 0 1 2.2.1 0 0 0
2.2.2 0 0 1 2.2.2 0 0 0
2.2.3 0 0 0 2.2.3 0 0 0
2.2.4 0 0 0 2.2.4 0 0 0
2.3.1 0 0 0 2.3.1 0 0 0
2.3.2 0 0 0 2.3.2 0 0 0
2.3.3 0 0 0 2.3.3 0 0 0
2.3.4 0 0 0 2.3.4 0 0 0
2.3.5 0 0 0 2.3.5 0 0 0
2.3.6 0 0 0 2.3.6 0 0 0
2.3.7 1 0 0 2.3.7 0 0 0
3.1.1 0 0 0 3.1.1 0 0 0
3.1.2 0 0 0 3.1.2 0 0 0
4.1.1 0 0 2 4.1.1 0 0 0
4.1.2 0 0 0 4.1.2 0 0 0
4.1.3 0 0 0 4.1.3 0 0 0
4.1.4 0 0 1 4.2.1 0 0 0
4.2.1 0 0 0 4.2.2 0 0 0
4.2.2 0 0 0 4.2.3 0 0 0
4.2.3 0 0 1 4.3.1 0 0 0
4.3.1 0 0 0 4.3.2 0 0 0
4.3.2 0 0 0 4.3.3 0 0 0
4.3.3 0 0 0 4.3.4 0 0 0
4.3.4 0 0 0 4.3.5 0 0 1
4.3.5 0 1 1 4.3.6 0 0 0
4.3.6 0 1 0 4.4.1 0 0 1
4.4.1 0 1 4 4.4.2 0 0 0
4.4.2 0 0 1 4.4.3 0 0 0
4.5.1 0 0 0 4.5.1 0 0 0
4.5.2 0 1 2 4.5.2 0 0 0
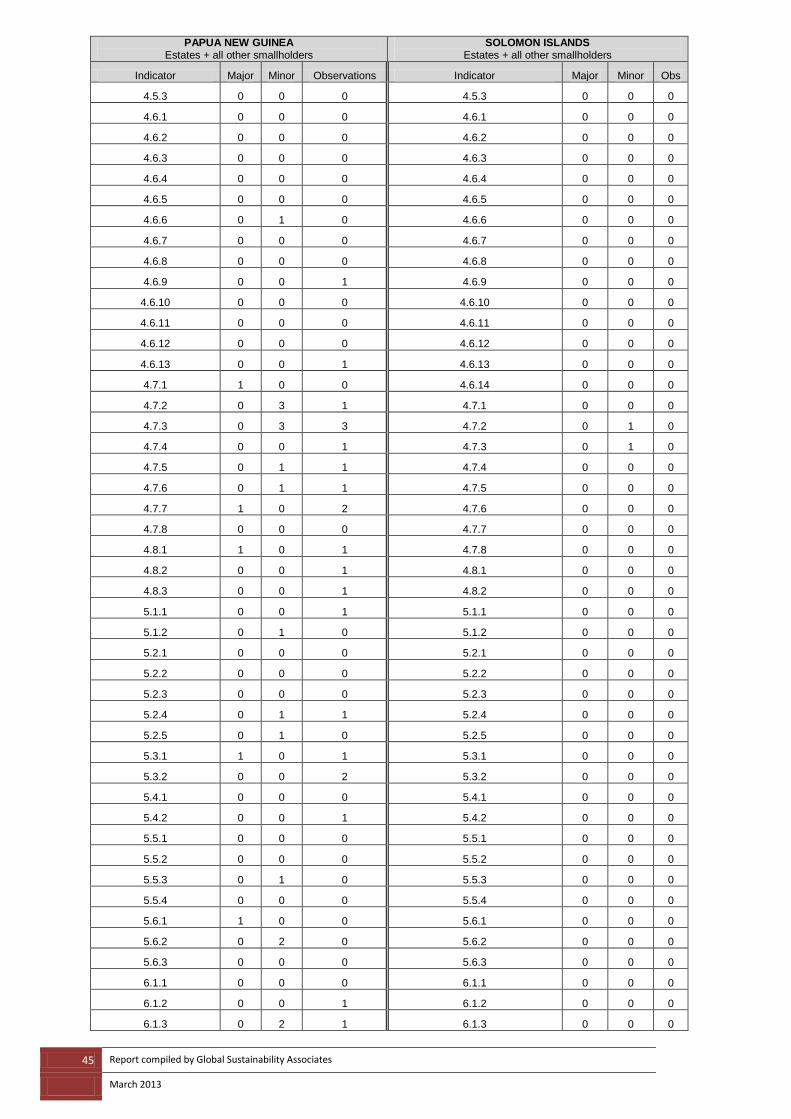
45 Report compiled by Global Sustainability Associates
March 2013
PAPUA NEW GUINEA Estates + all other smallholders
SOLOMON ISLANDS Estates + all other smallholders
Indicator Major Minor Observations Indicator Major Minor Obs
4.5.3 0 0 0 4.5.3 0 0 0
4.6.1 0 0 0 4.6.1 0 0 0
4.6.2 0 0 0 4.6.2 0 0 0
4.6.3 0 0 0 4.6.3 0 0 0
4.6.4 0 0 0 4.6.4 0 0 0
4.6.5 0 0 0 4.6.5 0 0 0
4.6.6 0 1 0 4.6.6 0 0 0
4.6.7 0 0 0 4.6.7 0 0 0
4.6.8 0 0 0 4.6.8 0 0 0
4.6.9 0 0 1 4.6.9 0 0 0
4.6.10 0 0 0 4.6.10 0 0 0
4.6.11 0 0 0 4.6.11 0 0 0
4.6.12 0 0 0 4.6.12 0 0 0
4.6.13 0 0 1 4.6.13 0 0 0
4.7.1 1 0 0 4.6.14 0 0 0
4.7.2 0 3 1 4.7.1 0 0 0
4.7.3 0 3 3 4.7.2 0 1 0
4.7.4 0 0 1 4.7.3 0 1 0
4.7.5 0 1 1 4.7.4 0 0 0
4.7.6 0 1 1 4.7.5 0 0 0
4.7.7 1 0 2 4.7.6 0 0 0
4.7.8 0 0 0 4.7.7 0 0 0
4.8.1 1 0 1 4.7.8 0 0 0
4.8.2 0 0 1 4.8.1 0 0 0
4.8.3 0 0 1 4.8.2 0 0 0
5.1.1 0 0 1 5.1.1 0 0 0
5.1.2 0 1 0 5.1.2 0 0 0
5.2.1 0 0 0 5.2.1 0 0 0
5.2.2 0 0 0 5.2.2 0 0 0
5.2.3 0 0 0 5.2.3 0 0 0
5.2.4 0 1 1 5.2.4 0 0 0
5.2.5 0 1 0 5.2.5 0 0 0
5.3.1 1 0 1 5.3.1 0 0 0
5.3.2 0 0 2 5.3.2 0 0 0
5.4.1 0 0 0 5.4.1 0 0 0
5.4.2 0 0 1 5.4.2 0 0 0
5.5.1 0 0 0 5.5.1 0 0 0
5.5.2 0 0 0 5.5.2 0 0 0
5.5.3 0 1 0 5.5.3 0 0 0
5.5.4 0 0 0 5.5.4 0 0 0
5.6.1 1 0 0 5.6.1 0 0 0
5.6.2 0 2 0 5.6.2 0 0 0
5.6.3 0 0 0 5.6.3 0 0 0
6.1.1 0 0 0 6.1.1 0 0 0
6.1.2 0 0 1 6.1.2 0 0 0
6.1.3 0 2 1 6.1.3 0 0 0

46 Report compiled by Global Sustainability Associates
March 2013
PAPUA NEW GUINEA Estates + all other smallholders
SOLOMON ISLANDS Estates + all other smallholders
Indicator Major Minor Observations Indicator Major Minor Obs
6.2.1 0 0 1 6.2.1 0 0 0
6.2.2 0 2 2 6.2.2 0 0 0
6.2.3 0 1 0 6.2.3 0 0 0
6.3.1 1 0 3 6.3.1 0 0 1
6.4.1 0 0 0 6.3.2 0 0 0
6.4.2 0 0 0 6.4.1 0 0 0
6.4.3 0 0 0 6.4.2 0 0 0
6.4.4 0 0 0 6.4.3 0 0 0
6.5.1 0 0 0 6.5.1 0 0 0
6.5.2 0 0 1 6.5.2 0 0 0
6.5.3 0 1 1 6.5.3 0 0 0
6.5.4 0 2 2 6.5.4 0 0 0
6.5.5 0 0 0 6.5.5 0 0 0
6.5.6 0 1 0 6.5.6 0 1 0
6.6.1 0 0 0 6.6.1 0 0 0
6.6.2 0 0 1 6.6.2 0 0 0
6.6.3 0 1 0 6.6.3 0 0 0
6.7.1 1 0 2 6.7.1 0 0 0
6.8.1 0 0 1 6.8.1 0 0 0
6.8.2 0 0 0 6.8.2 0 0 0
6.9.1 0 0 1 6.9.1 0 0 0
6.9.2 0 0 0 6.9.2 0 0 0
6.9.3 0 1 1 6.9.3 0 0 0
6.10.1 0 0 2 6.10.1 0 0 0
6.10.2 0 0 1 6.10.2 0 0 0
6.10.3 0 0 2 6.10.3 0 0 0
6.10.4 0 0 0 6.10.4 0 0 0
6.10.5 0 0 0 6.10.5 0 0 0
6.11.1 0 1 0 6.11.1 0 0 0
6.11.2 0 0 0 7.1.1 0 0 0
7.1.1 0 0 0 7.1.2 0 0 0
7.1.2 0 0 0 7.1.3 0 0 0
7.1.3 0 0 0 7.2.1 0 0 0
7.2.1 0 0 0 7.2.2 0 0 0
7.2.2 0 0 0 7.3.1 0 0 0
7.3.1 0 0 0 7.3.2 0 0 0
7.3.2 0 0 0 7.4.1 0 0 0
7.4.1 0 0 0 7.4.2 0 0 0
7.4.2 0 0 0 7.4.3 0 0 0
7.4.3 0 0 0 7.5.1 0 0 0
7.5.1 0 0 0 7.5.2 0 0 0
7.5.2 0 0 0 7.5.3 0 0 0
7.5.3 0 0 0 7.6.1 0 0 0
7.5.4 0 0 0 7.6.2 0 0 0
7.6.1 0 0 0 7.6.3 0 0 0
7.6.2 0 0 0 7.6.4 0 0 0
7.6.3 0 0 0 7.6.5 0 0 0

47 Report compiled by Global Sustainability Associates
March 2013
PAPUA NEW GUINEA Estates + all other smallholders
SOLOMON ISLANDS Estates + all other smallholders
Indicator Major Minor Observations Indicator Major Minor Obs
7.6.4 0 0 0 7.6.6 0 0 0
7.6.5 0 0 0 7.7.1 0 0 0
7.6.6 0 0 0 7.7.2 0 0 0
7.7.1 0 0 0 8.1.1 0 0 0
7.7.2 0 0 0 8.1.2 0 0 0
7.7.3 0 0 0
8.1.1 0 0 1
8.1.2 0 0 0
No. occurrences 10 32 62 No. occurrences 0 3 3

48 Report compiled by Global Sustainability Associates
March 2013
9.6 Appendix F – Colombia and Brazil data table relating to estates with schemed smallholders
COLOMBIA Estates + schemed smallholders
BRAZIL Estates + schemed smallholders
Indicator Major Minor Obs Indicator Major Minor Obs
1.1.1 0 0 1 1.1.1 0 0 1
1.2.1 0 0 0 1.2.1 0 0 0
1.2.2 0 0 0 1.2.2 0 0 0
1.2.3 0 0 0 1.2.3 0 0 0
1.2.4 0 0 0 1.2.4 0 0 0
1.2.5 0 0 0 1.2.5 0 0 0
1.2.6 0 0 0 1.2.6 0 0 0
1.2.7 0 0 0 1.2.7 0 0 0
1.2.8 0 0 0 1.2.8 0 0 0
1.2.9 0 0 0 1.2.9 0 0 0
1.2.10 0 0 0 1.2.10 0 0 0
1.2.11 0 0 0 1.2.11 0 0 0
1.2.12 0 0 0 1.2.12 0 0 0
1.2.13 0 0 0 1.2.13 0 0 0
2.1.1 1 0 0 2.1.1 0 0 0
2.1.2 0 0 0 2.1.2 0 1 0
2.1.3 0 0 0 2.1.3 0 0 0
2.1.4 0 0 0 2.1.4 0 0 0
2.1.5 0 0 0 2.2.1 0 0 0
2.2.1 0 0 0 2.2.2 0 0 0
2.2.2 0 0 0 2.2.3 0 0 0
2.2.3 0 0 0 2.2.4 0 0 0
2.2.4 0 0 0 2.3.1 0 0 0
2.3.1 0 0 0 2.3.2 0 0 0
2.3.2 0 0 0 2.3.3 0 0 0
2.3.3 0 0 0 2.3.4 0 0 0
2.3.4 0 0 0 3.1.1 0 0 0
3.1.1 0 0 0 3.1.2 0 0 0
3.1.2 0 0 1 3.1.3 0 0 0
3.1.3 0 0 0 4.1.1 0 0 0
4.1.1 0 0 1 4.1.2 0 0 0
4.1.2 0 0 1 4.1.3 0 0 0
4.1.3 0 0 0 4.1.4 0 0 0
4.1.4 0 0 0 4.2.1 0 0 0
4.2.1 0 0 0 4.2.2 0 0 0
4.2.2 0 0 0 4.2.3 0 0 0
4.2.3 0 0 0 4.2.4 0 0 0
4.2.4 0 0 0 4.2.5 0 0 0
4.2.5 0 0 0 4.2.6 0 0 0
4.2.6 0 0 0 4.3.1 0 0 0
4.3.1 0 0 1 4.3.2 0 0 0
4.3.2 0 0 0 4.3.3 0 0 0
4.3.3 0 0 0 4.3.4 0 0 0
4.3.4 0 0 0 4.3.5 0 1 0
4.3.5 0 0 0 4.3.6 0 0 0
4.3.6 0 0 0 4.3.7 0 0 0
4.3.7 0 0 0 4.4.1 0 1 0
4.4.1 0 0 0 4.4.2 0 0 0
4.4.2 0 0 0 4.4.3 0 0 0
4.4.3 0 0 0 4.4.4 0 0 0
4.4.4 0 0 0 4.4.5 0 0 0
4.4.5 0 0 0 4.4.6 0 0 0
4.4.6 0 0 0 4.4.7 0 0 0
4.4.7 0 0 0 4.4.8 0 0 0
4.4.8 0 0 0 4.5.1 0 0 0
4.5.1 0 0 0 4.5.2 0 0 0
4.5.2 0 0 0 4.5.3 0 0 0
4.5.3 0 0 0 4.5.4 0 0 0
4.5.4 0 0 0 4.5.5 0 0 0
4.5.5 0 0 0 4.5.6 0 0 0
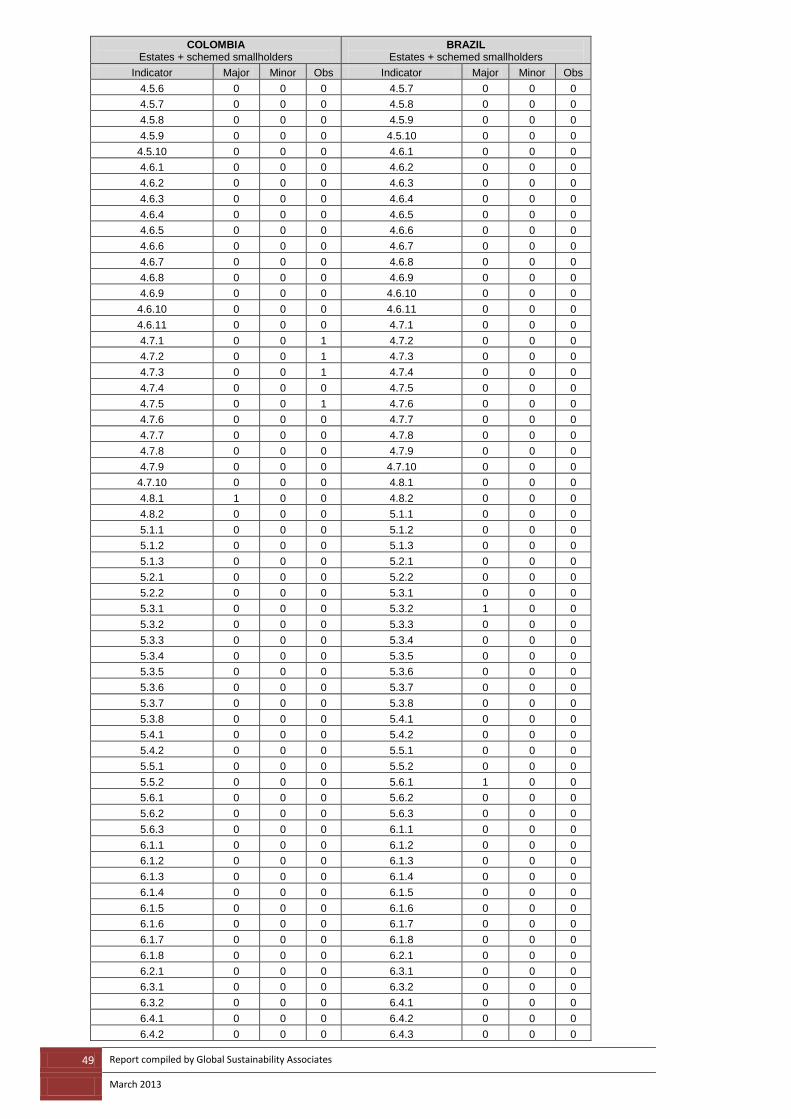
49 Report compiled by Global Sustainability Associates
March 2013
COLOMBIA Estates + schemed smallholders
BRAZIL Estates + schemed smallholders
Indicator Major Minor Obs Indicator Major Minor Obs
4.5.6 0 0 0 4.5.7 0 0 0
4.5.7 0 0 0 4.5.8 0 0 0
4.5.8 0 0 0 4.5.9 0 0 0
4.5.9 0 0 0 4.5.10 0 0 0
4.5.10 0 0 0 4.6.1 0 0 0
4.6.1 0 0 0 4.6.2 0 0 0
4.6.2 0 0 0 4.6.3 0 0 0
4.6.3 0 0 0 4.6.4 0 0 0
4.6.4 0 0 0 4.6.5 0 0 0
4.6.5 0 0 0 4.6.6 0 0 0
4.6.6 0 0 0 4.6.7 0 0 0
4.6.7 0 0 0 4.6.8 0 0 0
4.6.8 0 0 0 4.6.9 0 0 0
4.6.9 0 0 0 4.6.10 0 0 0
4.6.10 0 0 0 4.6.11 0 0 0
4.6.11 0 0 0 4.7.1 0 0 0
4.7.1 0 0 1 4.7.2 0 0 0
4.7.2 0 0 1 4.7.3 0 0 0
4.7.3 0 0 1 4.7.4 0 0 0
4.7.4 0 0 0 4.7.5 0 0 0
4.7.5 0 0 1 4.7.6 0 0 0
4.7.6 0 0 0 4.7.7 0 0 0
4.7.7 0 0 0 4.7.8 0 0 0
4.7.8 0 0 0 4.7.9 0 0 0
4.7.9 0 0 0 4.7.10 0 0 0
4.7.10 0 0 0 4.8.1 0 0 0
4.8.1 1 0 0 4.8.2 0 0 0
4.8.2 0 0 0 5.1.1 0 0 0
5.1.1 0 0 0 5.1.2 0 0 0
5.1.2 0 0 0 5.1.3 0 0 0
5.1.3 0 0 0 5.2.1 0 0 0
5.2.1 0 0 0 5.2.2 0 0 0
5.2.2 0 0 0 5.3.1 0 0 0
5.3.1 0 0 0 5.3.2 1 0 0
5.3.2 0 0 0 5.3.3 0 0 0
5.3.3 0 0 0 5.3.4 0 0 0
5.3.4 0 0 0 5.3.5 0 0 0
5.3.5 0 0 0 5.3.6 0 0 0
5.3.6 0 0 0 5.3.7 0 0 0
5.3.7 0 0 0 5.3.8 0 0 0
5.3.8 0 0 0 5.4.1 0 0 0
5.4.1 0 0 0 5.4.2 0 0 0
5.4.2 0 0 0 5.5.1 0 0 0
5.5.1 0 0 0 5.5.2 0 0 0
5.5.2 0 0 0 5.6.1 1 0 0
5.6.1 0 0 0 5.6.2 0 0 0
5.6.2 0 0 0 5.6.3 0 0 0
5.6.3 0 0 0 6.1.1 0 0 0
6.1.1 0 0 0 6.1.2 0 0 0
6.1.2 0 0 0 6.1.3 0 0 0
6.1.3 0 0 0 6.1.4 0 0 0
6.1.4 0 0 0 6.1.5 0 0 0
6.1.5 0 0 0 6.1.6 0 0 0
6.1.6 0 0 0 6.1.7 0 0 0
6.1.7 0 0 0 6.1.8 0 0 0
6.1.8 0 0 0 6.2.1 0 0 0
6.2.1 0 0 0 6.3.1 0 0 0
6.3.1 0 0 0 6.3.2 0 0 0
6.3.2 0 0 0 6.4.1 0 0 0
6.4.1 0 0 0 6.4.2 0 0 0
6.4.2 0 0 0 6.4.3 0 0 0

50 Report compiled by Global Sustainability Associates
March 2013
COLOMBIA Estates + schemed smallholders
BRAZIL Estates + schemed smallholders
Indicator Major Minor Obs Indicator Major Minor Obs
6.4.3 0 0 0 6.5.1 1 0 0
6.5.1 0 0 0 6.5.2 0 0 0
6.5.2 1 0 0 6.5.3 0 0 0
6.5.3 0 0 0 6.5.4 0 0 0
6.5.4 0 0 0 6.5.5 0 0 0
6.5.5 0 0 0 6.6.1 0 0 0
6.6.1 0 0 0 6.6.2 0 0 0
6.6.2 0 0 0 6.6.3 0 0 0
6.6.3 0 0 0 6.7.1 0 0 0
6.7.1 0 0 0 6.7.2 0 0 0
6.7.2 0 0 0 6.7.3 0 0 0
6.7.3 0 0 0 6.7.4 0 0 0
6.7.4 0 0 0 6.8.1 0 0 0
6.8.1 0 0 0 6.8.2 0 0 0
6.8.2 0 0 0 6.8.3 0 0 0
6.8.3 0 0 0 6.8.4 0 0 0
6.8.4 0 0 0 6.9.1 0 0 0
6.9.1 0 0 0 6.9.2 0 0 0
6.9.2 0 0 0 6.9.3 0 0 0
6.9.3 0 0 0 6.9.4 0 0 0
6.9.4 0 0 0 6.9.5 0 0 0
6.9.5 0 0 0 6.9.6 0 0 0
6.9.6 0 0 0 6.10.1 0 0 0
6.10.1 0 0 0 6.10.2 0 0 0
6.10.2 0 0 1 6.10.3 0 0 0
6.10.3 0 0 0 6.10.4 0 0 0
6.10.4 0 0 0 6.11.1 0 0 0
6.11.1 0 0 0 7.1.1 0 0 0
7.1.1 0 0 0 7.1.2 0 0 0
7.1.2 0 0 0 7.1.3 0 0 0
7.1.3 0 0 0 7.1.4 0 0 0
7.1.4 0 0 0 7.2.1 0 0 0
7.2.1 0 0 0 7.2.2 0 0 0
7.2.2 0 0 0 7.2.3 0 0 0
7.2.3 0 0 0 7.3.1 0 0 0
7.3.1 0 0 0 7.3.2 0 0 0
7.3.2 0 0 0 7.3.3 0 0 0
7.3.3 0 0 0 7.3.4 0 0 0
7.3.4 0 0 0 7.3.5 0 0 0
7.3.5 0 0 0 7.4.1 0 0 0
7.4.1 0 0 0 7.4.2 0 0 0
7.4.2 0 0 0 7.5.1 0 0 0
7.5.1 0 0 0 7.5.2 0 0 0
7.5.2 0 0 0 7.5.3 0 0 0
7.5.3 0 0 0 7.6.1 0 0 0
7.6.1 0 0 0 7.6.2 0 0 0
7.6.2 0 0 0 7.6.3 0 0 0
7.6.3 0 0 0 7.6.4 0 0 0
7.6.4 0 0 0 7.6.5 0 0 0
7.6.5 0 0 0 7.6.6 0 0 0
7.6.6 0 0 0 7.7.1 0 0 0
7.7.1 0 0 0 7.7.2 0 0 0
7.7.2 0 0 0 7.7.3 0 0 0
7.7.3 0 0 0 8.1.1 0 0 0
8.1.1 0 0 0 8.1.2 0 0 0
8.1.2 0 0 0 8.1.3 0 0 0
8.1.3 0 0 0 No. occurrences 3 0 10 No. occurrences 3 3 1
No. indicators