Analysis of Rankine Cycle with FWH P M V Subbarao Professor Mechanical Engineering Department I I T...
25
Analysis of Rankine Cycle with FWH P M V Subbarao Professor Mechanical Engineering Department I I T Delhi ngineering solution to Pure Thoughts ..…..
-
Upload
thomasina-jones -
Category
Documents
-
view
217 -
download
2
Transcript of Analysis of Rankine Cycle with FWH P M V Subbarao Professor Mechanical Engineering Department I I T...

Analysis of Rankine Cycle with FWH
P M V SubbaraoProfessor
Mechanical Engineering Department
I I T DelhiEngineering solution to Pure Thoughts ..…..

Regeneration Cycle with Open FWH

Analysis of OFWH
h3
h6
y
h2
1-y
Conservation of energy:
326 1 hhyhy 2326 hhhhy
26
23
hh
hhy

Haywood MethodologyAnalysis of Engineering Cycles : R.W. Haywood
PB
26
23
hh
hhy
26
361hh
hhy
45
17111
hh
hhy
q
q
in
out
26
36
45
171hh
hh
hh
hh

• Assumptions :
1. The Difference between local steam enthalpy and enthalpy of saturated water at the same pressure is constant throughout the expansion.
2. Constant ‘β’ Assumption by Haywood.
By assuming that the turbine expansion line follows a path on the diagram such that the (h-hf)=constant= β
Where, h- local enthalpy on the turbine expansion line at a given
pressure. hf=Enthalpy of saturated water at that pressure .

173645 hhhhhh f
Let the enthalpy rise of feed water in the heater is .
23 hh
263623 hhhhhh
45
2
26
36
45
17 11hhhh
hh
hh
hh
4f

45
2
26
36
45
17 11hhhh
hh
hh
hh
f
ff
hh
hhhhhh
44
444545
4f
Maximum irreversibility to be eliminated = The total enthalpy rise of feed water = h4f – h1
Let 14 hh f
fhh 44
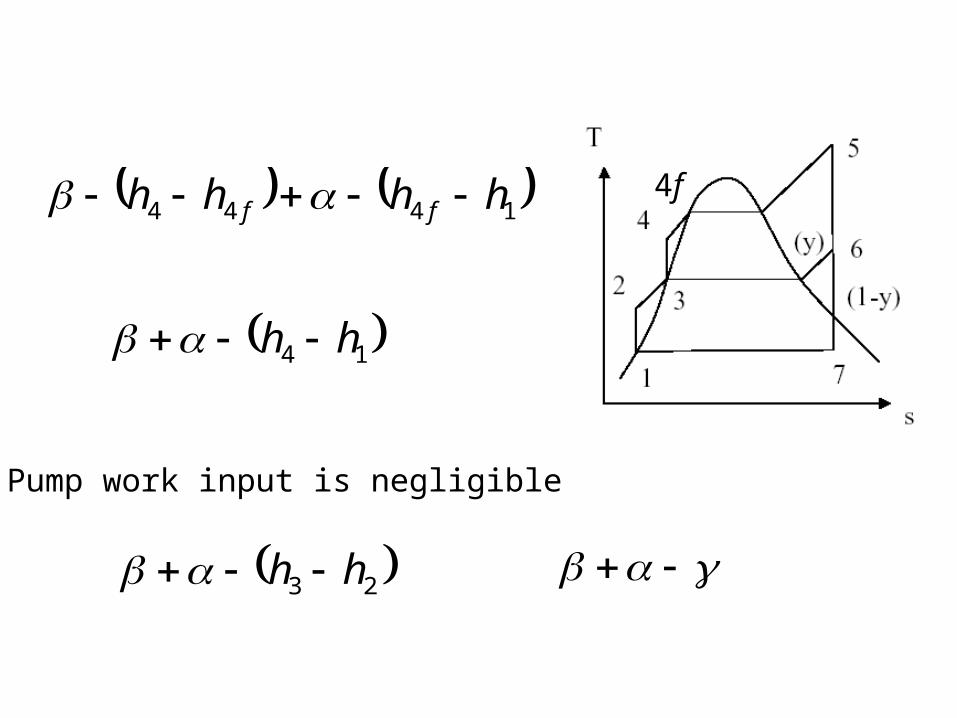
1444 hhhh ff
14 hh
4f
23 hh
Pump work input is negligible

There fore the efficiency can be written as
Here β and α are fixed and is variable. So, there is an optimum value of γ for which η is a maximum. On differentiation,
02
d
d
There fore = α / 2
The cycle efficiency is maximum when the total enthalpy rise of feed water (h4f – h1) from the condenser temperature to the boiler saturation temperature is divided equally between the feed water heater and the economizer ( i.e. h4f – h4 = h3 – h2) in a single bleed cycle.
2
26
36
45
17 11hh
hh
hh
hh

So the temperature rise in the feed water heater is
ΔT = ½ ( Tboiler saturation – T condenser)
And the corresponding cycle efficiency is
2
2
2
4
For a non-regenerative cycle,
0

The maximum gain in efficiency due to regeneration
2
2
02
This is positive. This shows that the cycle efficiency has improved due to regeneration.

Location of Haywood’s Optimum OFWH
h3
h6
y
h2
1-y
26
23
hh
hhy
2
2423
hhhh f
26
24
2 hh
hhy f
224
3
hhh f

Analysis of Regeneration through OFWH
26
23
hh
hhy
45 hhmQ in
171 hhymQOut
pumpscondbleednet WWWW
3412 & hhhh 0
pumpsW
7565 1 hhyhhymWWW condbleednet

45
7565 1
hhm
hhyhhym
in
net
Q
W
35
7565 1
hh
hhyhhy
35
75
35
65 1
hh
hhy
hh
hhy
condensing bleed

16
13
26
23
hh
hh
hh
hhy
16
1311hh
hhy
16
361hh
hhy

35
65
16
13
35
65
hh
hh
hh
hh
hh
hhybleed
16
75
35
36condensing hh
hh
hh
hh
t workoutpuspecific fractional steam bled offraction bleed
t workoutpuspecific fractional steam condensing offraction bleed

0
0.05
0.1
0.15
0.2
0.25
0.3
0.35
0.4
0.45
0.5
0 5 10 15 20
16
13
hh
hhy
35
65
hh
hh
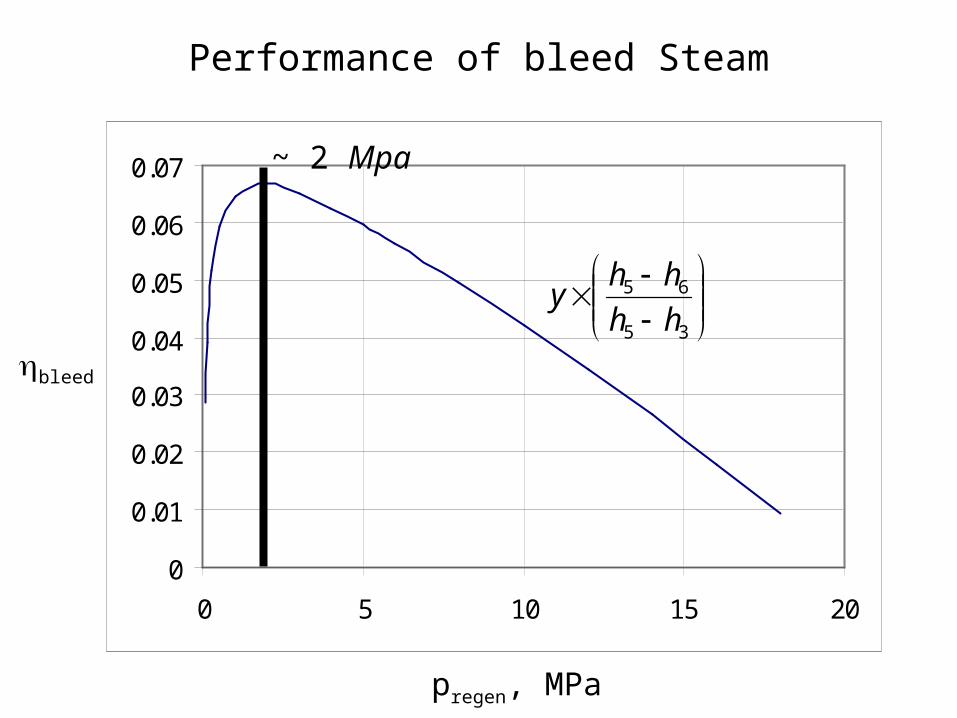
Analysis of Bleed Steam Performance
pbleed, MPa

Analysis of Condensing Steam Performance
0.4
0.5
0.6
0.7
0.8
0.9
1
1.1
0 5 10 15 20
35
36
hh
hh
16
75
hh
hh
pbleed, MPa

Comparison of Performance of Bleed & Condensing steams
0
0.05
0.1
0.15
0.2
0.25
0.3
0.35
0.4
0.45
0.5
0 5 10 15 20
Pregen, MPa
cond
bleed

Performance of FWH Cycle
0.45
0.455
0.46
0.465
0.47
0.475
0.48
0.485
0.49
0 5 10 15 20
pregen, MPa
total
~ 12MPa
0
0.01
0.02
0.03
0.04
0.05
0.06
0.07
0 5 10 15 20
35
65
hh
hhy
Performance of bleed Steam
pregen, MPa
bleed
~ 2 Mpa

wbl
eed
0
20
40
60
80
100
120
140
160
180
200
0 5 10 15 20
65 hhy
Workoutput of bleed Steam
pregen, MPa
~ 12MPa
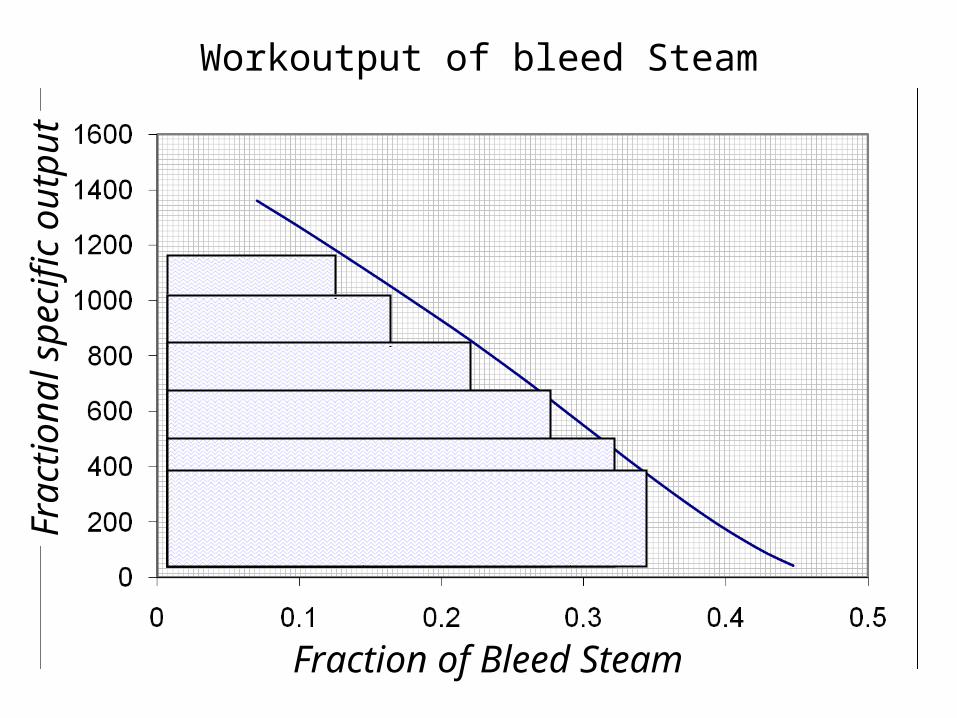
Fra
ctio
nal s
peci
fic
outp
utWorkoutput of bleed Steam
Fraction of Bleed Steam

0
200
400
600
800
1000
1200
1400
1600
0 0.1 0.2 0.3 0.4 0.5
wbl
eed
Workoutput of bleed Steam

Progress in Rankine Cycle
Year 1907 1919 1938 1950 1958 1959 1966 1973 1975
MW 5 20 30 60 120 200 500 660 1300
p,MPa 1.3 1.4 4.1 6.2 10.3 16.2 15.9 15.9 24.1
Th oC 260 316 454 482 538 566 566 565 538
Tr oC -- -- -- -- 538 538 566 565 538
FHW -- 2 3 4 6 6 7 8 8
Pc,kPa 13.5 5.1 4.5 3.4 3.7 3.7 4.4 5.4 5.1
,% -- ~17 27.6 30.5 35.6 37.5 39.8 39.5 40