Analysis of Precision Agriculture Adoption & … · 1/53 Analysis of Precision Agriculture Adoption...
53
1/53 Analysis of Precision Agriculture Adoption & Barriers in western Canada Producer Survey of western Canada April 2017 Prepared for Agriculture and Agri-Food Canada by Dale Steele, P.Ag. © HER MAJESTY THE QUEEN IN RIGHT OF CANADA 2016
-
Upload
truongtuong -
Category
Documents
-
view
224 -
download
0
Transcript of Analysis of Precision Agriculture Adoption & … · 1/53 Analysis of Precision Agriculture Adoption...

1/53
Analysis of Precision Agriculture
Adoption & Barriers in western Canada
Producer Survey of western Canada
April 2017
Prepared for Agriculture and Agri-Food Canada
by Dale Steele, P.Ag.
© HER MAJESTY THE QUEEN IN RIGHT OF CANADA 2016
2/53
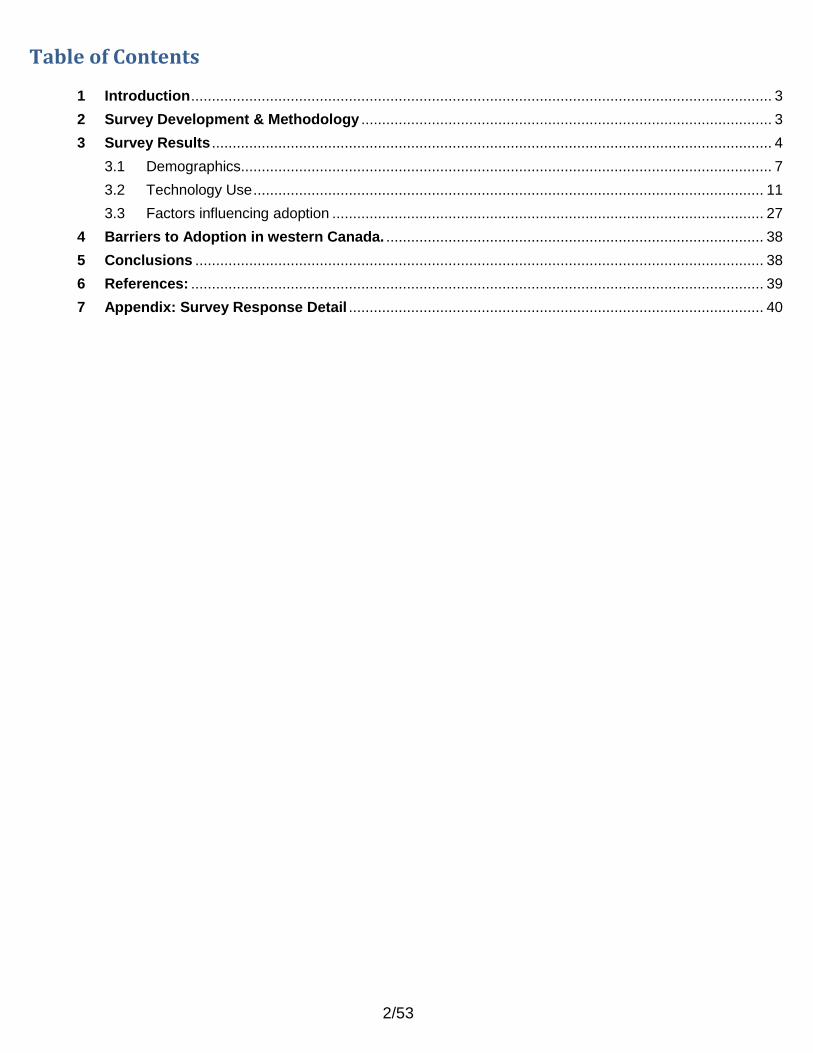
Table of Contents
1 Introduction ............................................................................................................................................ 3
2 Survey Development & Methodology ................................................................................................... 3
3 Survey Results ....................................................................................................................................... 4
Demographics ................................................................................................................................ 7 3.1
Technology Use ........................................................................................................................... 11 3.2
Factors influencing adoption ........................................................................................................ 27 3.3
4 Barriers to Adoption in western Canada. ........................................................................................... 38
5 Conclusions ......................................................................................................................................... 38
6 References: .......................................................................................................................................... 39
7 Appendix: Survey Response Detail .................................................................................................... 40
3/53
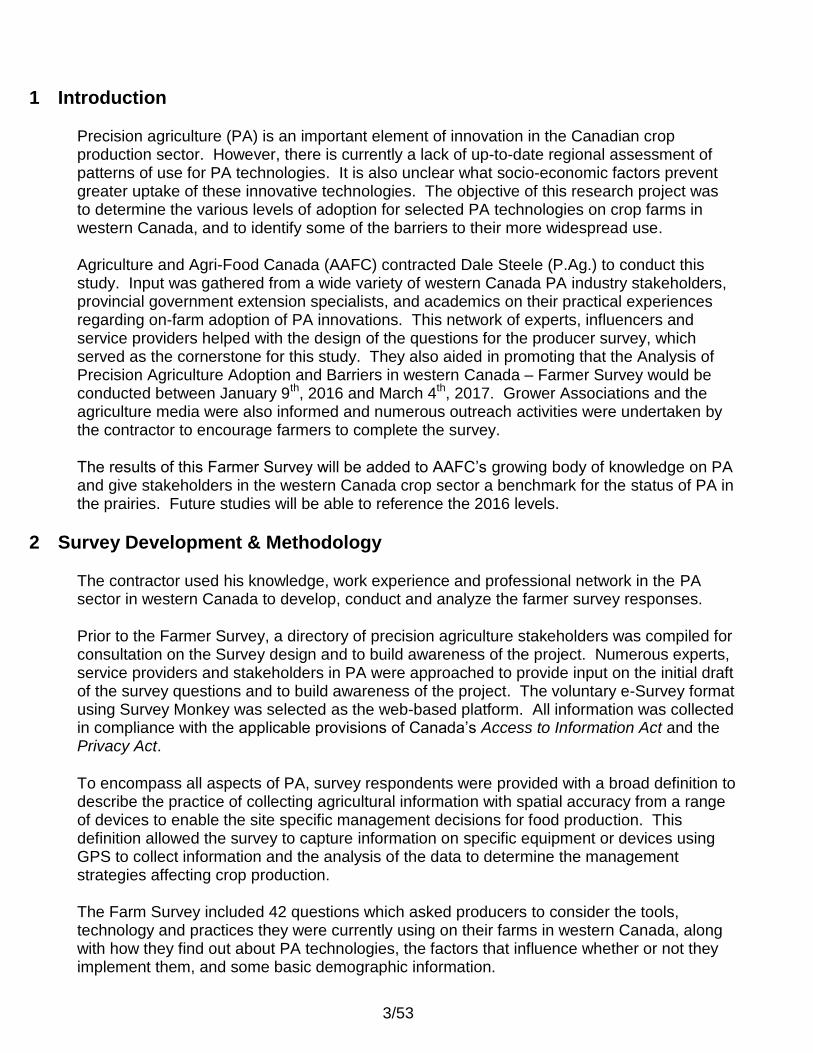
1 Introduction
Precision agriculture (PA) is an important element of innovation in the Canadian crop production sector. However, there is currently a lack of up-to-date regional assessment of patterns of use for PA technologies. It is also unclear what socio-economic factors prevent greater uptake of these innovative technologies. The objective of this research project was to determine the various levels of adoption for selected PA technologies on crop farms in western Canada, and to identify some of the barriers to their more widespread use.
Agriculture and Agri-Food Canada (AAFC) contracted Dale Steele (P.Ag.) to conduct this study. Input was gathered from a wide variety of western Canada PA industry stakeholders, provincial government extension specialists, and academics on their practical experiences regarding on-farm adoption of PA innovations. This network of experts, influencers and service providers helped with the design of the questions for the producer survey, which served as the cornerstone for this study. They also aided in promoting that the Analysis of Precision Agriculture Adoption and Barriers in western Canada – Farmer Survey would be conducted between January 9th, 2016 and March 4th, 2017. Grower Associations and the agriculture media were also informed and numerous outreach activities were undertaken by the contractor to encourage farmers to complete the survey.
The results of this Farmer Survey will be added to AAFC’s growing body of knowledge on PA and give stakeholders in the western Canada crop sector a benchmark for the status of PA in the prairies. Future studies will be able to reference the 2016 levels.
2 Survey Development & Methodology
The contractor used his knowledge, work experience and professional network in the PA sector in western Canada to develop, conduct and analyze the farmer survey responses.
Prior to the Farmer Survey, a directory of precision agriculture stakeholders was compiled for consultation on the Survey design and to build awareness of the project. Numerous experts, service providers and stakeholders in PA were approached to provide input on the initial draft of the survey questions and to build awareness of the project. The voluntary e-Survey format using Survey Monkey was selected as the web-based platform. All information was collected in compliance with the applicable provisions of Canada’s Access to Information Act and the Privacy Act.
To encompass all aspects of PA, survey respondents were provided with a broad definition to describe the practice of collecting agricultural information with spatial accuracy from a range of devices to enable the site specific management decisions for food production. This definition allowed the survey to capture information on specific equipment or devices using GPS to collect information and the analysis of the data to determine the management strategies affecting crop production.
The Farm Survey included 42 questions which asked producers to consider the tools, technology and practices they were currently using on their farms in western Canada, along with how they find out about PA technologies, the factors that influence whether or not they implement them, and some basic demographic information.
4/53
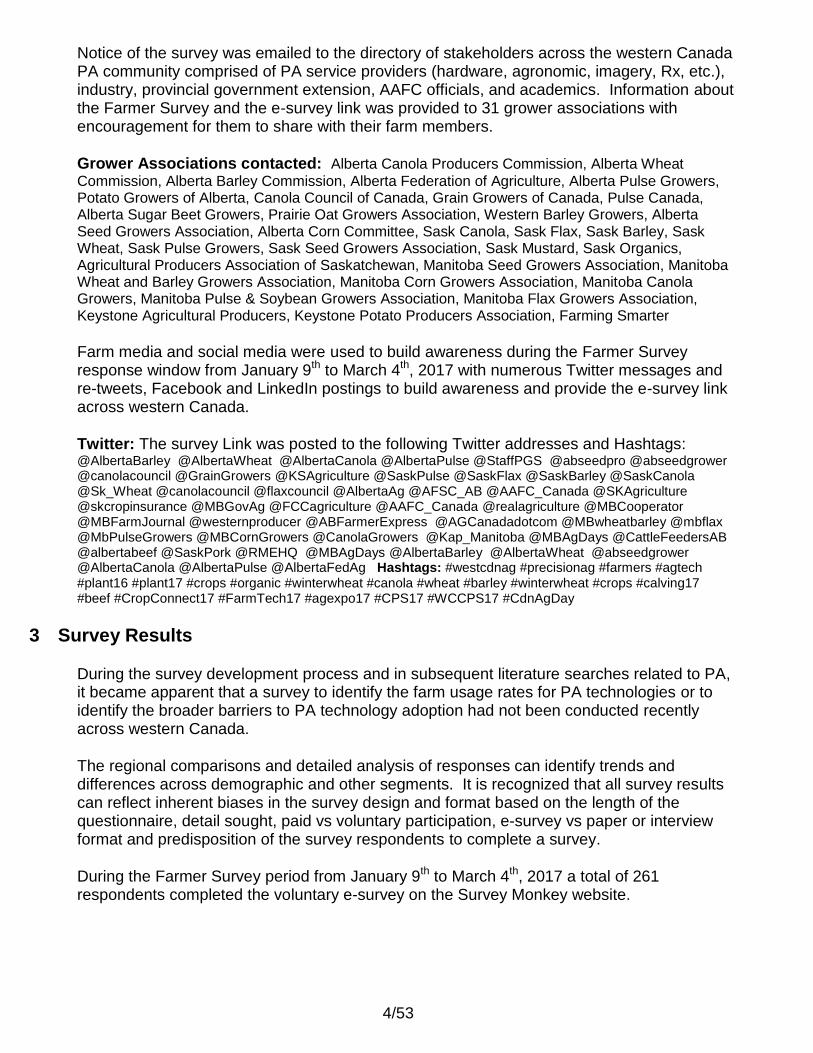
Notice of the survey was emailed to the directory of stakeholders across the western Canada PA community comprised of PA service providers (hardware, agronomic, imagery, Rx, etc.), industry, provincial government extension, AAFC officials, and academics. Information about the Farmer Survey and the e-survey link was provided to 31 grower associations with encouragement for them to share with their farm members.
Grower Associations contacted: Alberta Canola Producers Commission, Alberta Wheat
Commission, Alberta Barley Commission, Alberta Federation of Agriculture, Alberta Pulse Growers, Potato Growers of Alberta, Canola Council of Canada, Grain Growers of Canada, Pulse Canada, Alberta Sugar Beet Growers, Prairie Oat Growers Association, Western Barley Growers, Alberta Seed Growers Association, Alberta Corn Committee, Sask Canola, Sask Flax, Sask Barley, Sask Wheat, Sask Pulse Growers, Sask Seed Growers Association, Sask Mustard, Sask Organics, Agricultural Producers Association of Saskatchewan, Manitoba Seed Growers Association, Manitoba Wheat and Barley Growers Association, Manitoba Corn Growers Association, Manitoba Canola Growers, Manitoba Pulse & Soybean Growers Association, Manitoba Flax Growers Association, Keystone Agricultural Producers, Keystone Potato Producers Association, Farming Smarter
Farm media and social media were used to build awareness during the Farmer Survey response window from January 9th to March 4th, 2017 with numerous Twitter messages and re-tweets, Facebook and LinkedIn postings to build awareness and provide the e-survey link across western Canada.
Twitter: The survey Link was posted to the following Twitter addresses and Hashtags: @AlbertaBarley @AlbertaWheat @AlbertaCanola @AlbertaPulse @StaffPGS @abseedpro @abseedgrower @canolacouncil @GrainGrowers @KSAgriculture @SaskPulse @SaskFlax @SaskBarley @SaskCanola @Sk_Wheat @canolacouncil @flaxcouncil @AlbertaAg @AFSC_AB @AAFC_Canada @SKAgriculture @skcropinsurance @MBGovAg @FCCagriculture @AAFC_Canada @realagriculture @MBCooperator @MBFarmJournal @westernproducer @ABFarmerExpress @AGCanadadotcom @MBwheatbarley @mbflax @MbPulseGrowers @MBCornGrowers @CanolaGrowers @Kap_Manitoba @MBAgDays @CattleFeedersAB @albertabeef @SaskPork @RMEHQ @MBAgDays @AlbertaBarley @AlbertaWheat @abseedgrower @AlbertaCanola @AlbertaPulse @AlbertaFedAg Hashtags: #westcdnag #precisionag #farmers #agtech #plant16 #plant17 #crops #organic #winterwheat #canola #wheat #barley #winterwheat #crops #calving17 #beef #CropConnect17 #FarmTech17 #agexpo17 #CPS17 #WCCPS17 #CdnAgDay
3 Survey Results
During the survey development process and in subsequent literature searches related to PA, it became apparent that a survey to identify the farm usage rates for PA technologies or to identify the broader barriers to PA technology adoption had not been conducted recently across western Canada.
The regional comparisons and detailed analysis of responses can identify trends and differences across demographic and other segments. It is recognized that all survey results can reflect inherent biases in the survey design and format based on the length of the questionnaire, detail sought, paid vs voluntary participation, e-survey vs paper or interview format and predisposition of the survey respondents to complete a survey.
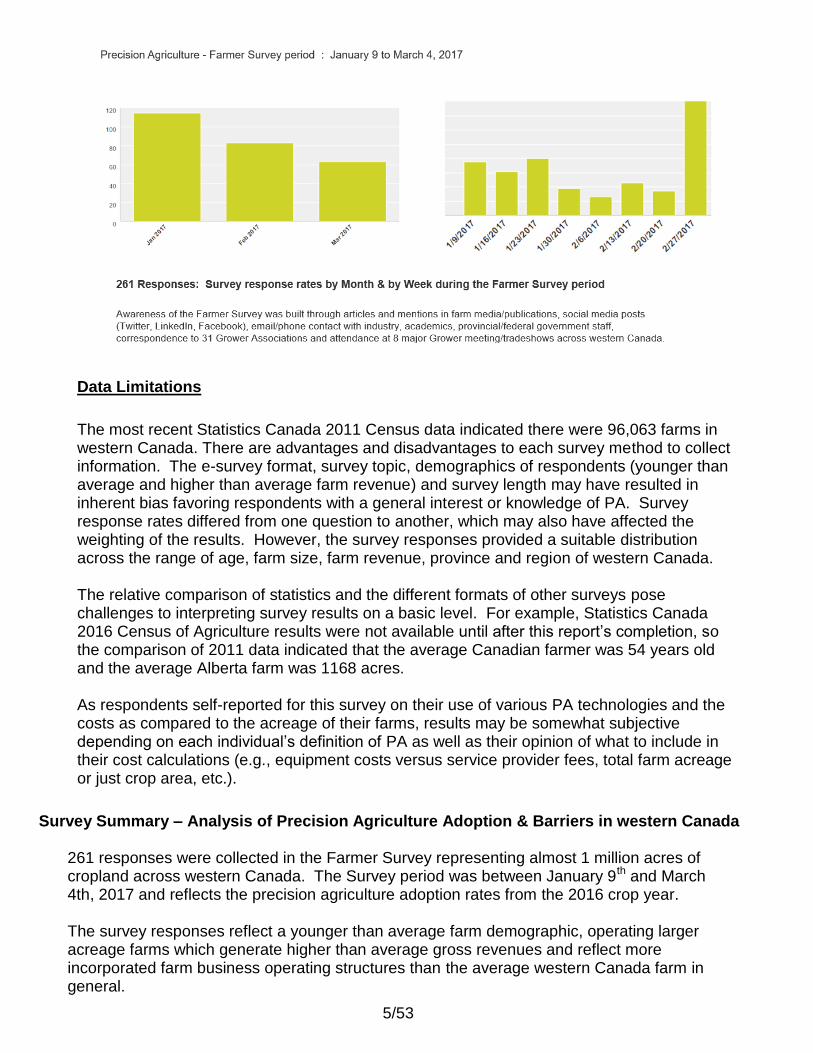
During the Farmer Survey period from January 9th to March 4th, 2017 a total of 261 respondents completed the voluntary e-survey on the Survey Monkey website.
5/53
Data Limitations
The most recent Statistics Canada 2011 Census data indicated there were 96,063 farms in western Canada. There are advantages and disadvantages to each survey method to collect information. The e-survey format, survey topic, demographics of respondents (younger than average and higher than average farm revenue) and survey length may have resulted in inherent bias favoring respondents with a general interest or knowledge of PA. Survey response rates differed from one question to another, which may also have affected the weighting of the results. However, the survey responses provided a suitable distribution across the range of age, farm size, farm revenue, province and region of western Canada. The relative comparison of statistics and the different formats of other surveys pose challenges to interpreting survey results on a basic level. For example, Statistics Canada 2016 Census of Agriculture results were not available until after this report’s completion, so the comparison of 2011 data indicated that the average Canadian farmer was 54 years old and the average Alberta farm was 1168 acres. As respondents self-reported for this survey on their use of various PA technologies and the costs as compared to the acreage of their farms, results may be somewhat subjective depending on each individual’s definition of PA as well as their opinion of what to include in their cost calculations (e.g., equipment costs versus service provider fees, total farm acreage or just crop area, etc.).
Survey Summary – Analysis of Precision Agriculture Adoption & Barriers in western Canada
261 responses were collected in the Farmer Survey representing almost 1 million acres of cropland across western Canada. The Survey period was between January 9th and March 4th, 2017 and reflects the precision agriculture adoption rates from the 2016 crop year. The survey responses reflect a younger than average farm demographic, operating larger acreage farms which generate higher than average gross revenues and reflect more incorporated farm business operating structures than the average western Canada farm in general.
6/53
98% indicated they have access to DSL, cable or wireless internet
98% indicated they use GPS guidance on their farm
93% agree or strongly agree that precision agriculture (PA) is useful
84% indicated they are currently using PA technologies
84% have combine yield monitoring capability
83% looked at imagery or maps of farm field(s)
81% managed their own farm data
79% use GPS Auto-Steer equipment guidance
75% intend to use more precision agriculture in the future
75% use farm management software on a computer
73% use Automatic Sectional Control (ASC) on equipment
72% use farm management apps or websites on a smartphone or tablet
70% use Automatic Sectional Control (ASC) for spray applications of crop inputs
68% use temperature and/or moisture sensors in 25%-100% of their stored grain
63% of crop acres were soil sampled
60% indicated their combines were equipped with GPS
52% were Somewhat/Very Unsatisfied with their internet service & internet speed
50% logged & stored combine yield data
48% had created Yield Map(s)
48% indicated they were using prescription maps and/or variable rate technology
45% were somewhat/very unsatisfied with their cellular & cellular data coverage
41% looked at in-season Imagery or remote sensing of field(s)
39% were not comfortable sharing their farm precision ag data
28% looked at in-season satellite imagery of crop
21% use free weather info from government networks as their primary weather information
10% use a paid weather service as their primary weather information
19% looked at in-season UAV/Drone imagery of crop
15% are comfortable sharing their farm precision agriculture data with government
13% use WI-FI or cellular networks to transfer equipment data
2% indicated they do not use any GPS guidance on their farm
On average, survey respondents reported that they spent $6.47 per acre on precision agriculture. The allocation towards hardware, software, service providers and cellular/internet fees is unknown.
7/53
Demographics 3.1
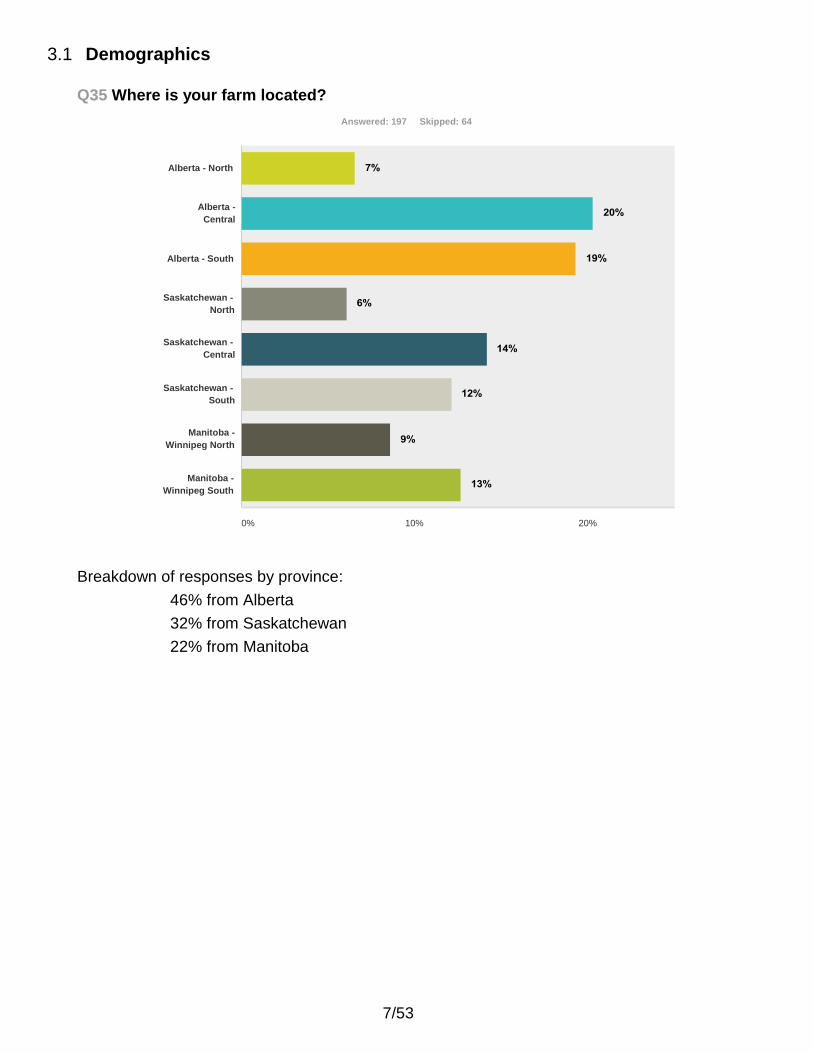
Q35 Where is your farm located?
Answered: 197 Skipped: 64
Alberta - North
Alberta -
Central
Alberta - South
Saskatchewan -
North
Saskatchewan -
Central
Saskatchewan -
South
Manitoba -
Winnipeg North
Manitoba -
Winnipeg South
0% 10% 20%
Breakdown of responses by province:
46% from Alberta
32% from Saskatchewan
22% from Manitoba

8/53
Q36 What does your farm grow?
Answered: 197 Skipped: 64
100%
80%
60%
40%
20%
0%
Wheat Canola Barley Peas Lentil Soy Corn Oats Forage Cattle Hogs Other
Peas: mainly AB responses, Lentils: mainly SK responses Soybean & Corn: mainly MB responses, Oats: mainly Central/North responses
Q38 Do you farm?
Answered: 202 Skipped: 59
No, but I work
with Farmers 9% (19)
Part Time
19% (38)
Full Time
72% (145)
9/53
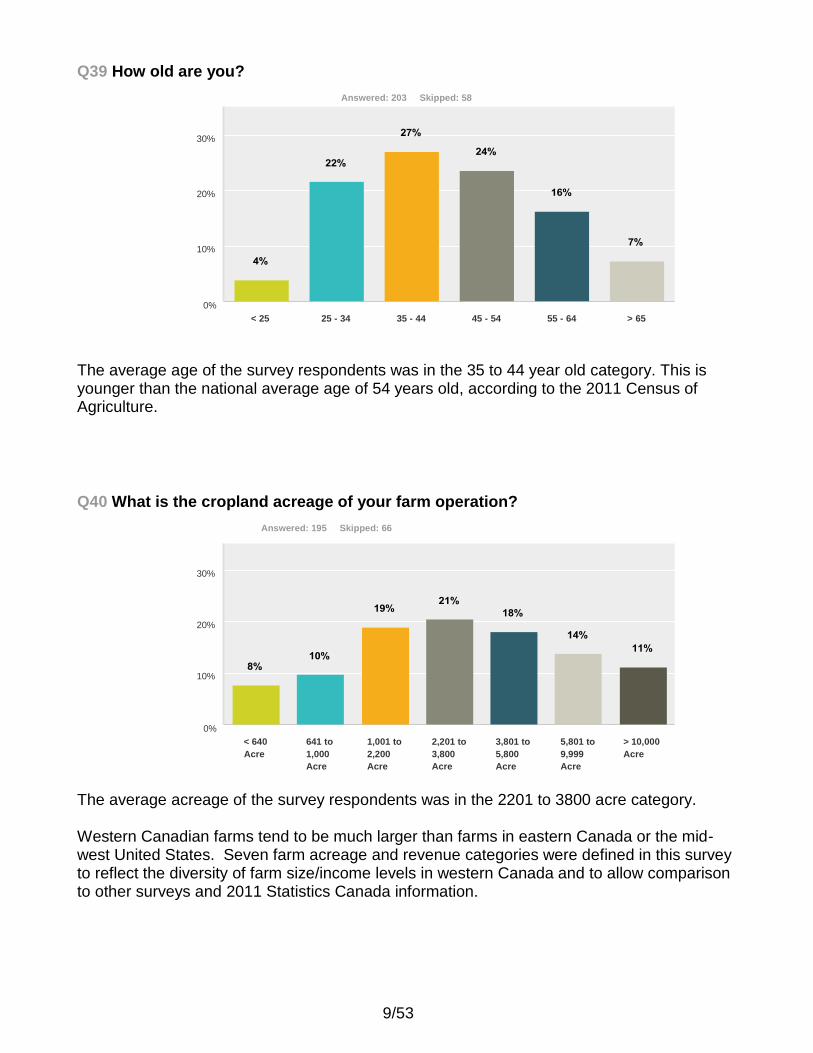
Q39 How old are you?
Answered: 203 Skipped: 58
30%
20%
10%
0%
< 25 25 - 34 35 - 44 45 - 54 55 - 64 > 65
The average age of the survey respondents was in the 35 to 44 year old category. This is younger than the national average age of 54 years old, according to the 2011 Census of Agriculture.
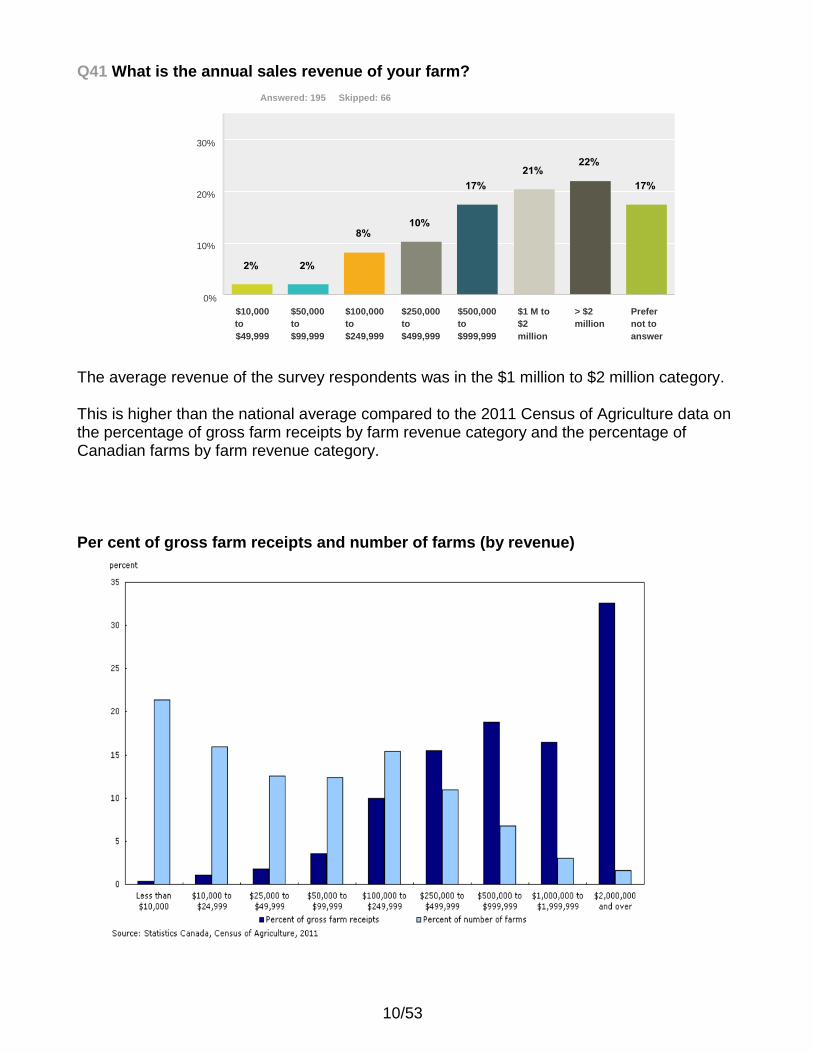
Q40 What is the cropland acreage of your farm operation?
Answered: 195 Skipped: 66
30%
20%
10%
0% < 640 641 to 1,001 to 2,201 to 3,801 to 5,801 to > 10,000
Acre 1,000
Acre
2,200
Acre
3,800
Acre
5,800
Acre
9,999
Acre
Acre
The average acreage of the survey respondents was in the 2201 to 3800 acre category. Western Canadian farms tend to be much larger than farms in eastern Canada or the mid-west United States. Seven farm acreage and revenue categories were defined in this survey to reflect the diversity of farm size/income levels in western Canada and to allow comparison to other surveys and 2011 Statistics Canada information.
10/53
Q41 What is the annual sales revenue of your farm?
Answered: 195 Skipped: 66
30%
20%
10%
0% $10,000 $50,000 $100,000 $250,000 $500,000 $1 M to > $2 Prefer
to to to to to $2 million not to
$49,999 $99,999 $249,999 $499,999 $999,999 million answer
The average revenue of the survey respondents was in the $1 million to $2 million category. This is higher than the national average compared to the 2011 Census of Agriculture data on the percentage of gross farm receipts by farm revenue category and the percentage of Canadian farms by farm revenue category. Per cent of gross farm receipts and number of farms (by revenue)
11/53
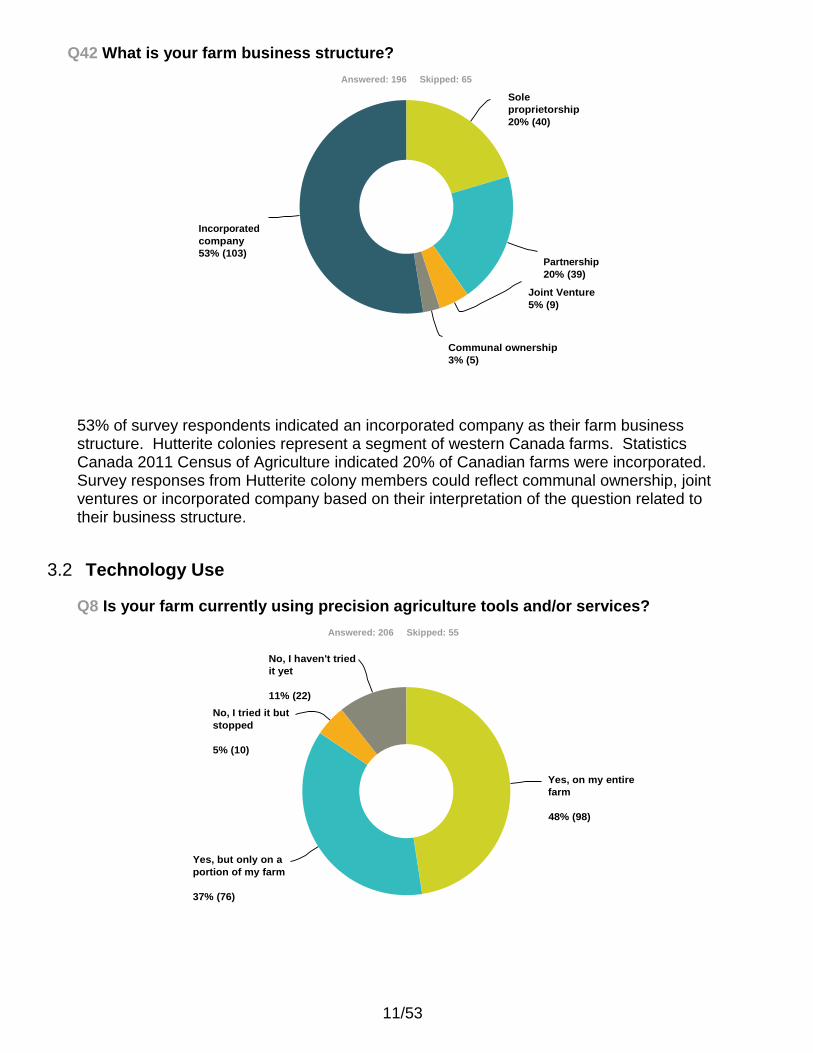
Q42 What is your farm business structure?
Answered: 196 Skipped: 65
Sole
proprietorship
20% (40)
Incorporated
company
53% (103)
Partnership
20% (39)
Joint Venture
5% (9)
Communal ownership
3% (5)
53% of survey respondents indicated an incorporated company as their farm business structure. Hutterite colonies represent a segment of western Canada farms. Statistics Canada 2011 Census of Agriculture indicated 20% of Canadian farms were incorporated. Survey responses from Hutterite colony members could reflect communal ownership, joint ventures or incorporated company based on their interpretation of the question related to their business structure.
Technology Use 3.2
Q8 Is your farm currently using precision agriculture tools and/or services?
Answered: 206 Skipped: 55
No, I haven't tried
it yet
11% (22)
No, I tried it but
stopped
5% (10)
Yes, on my entire
farm
48% (98)
Yes, but only on a
portion of my farm
37% (76)
12/53
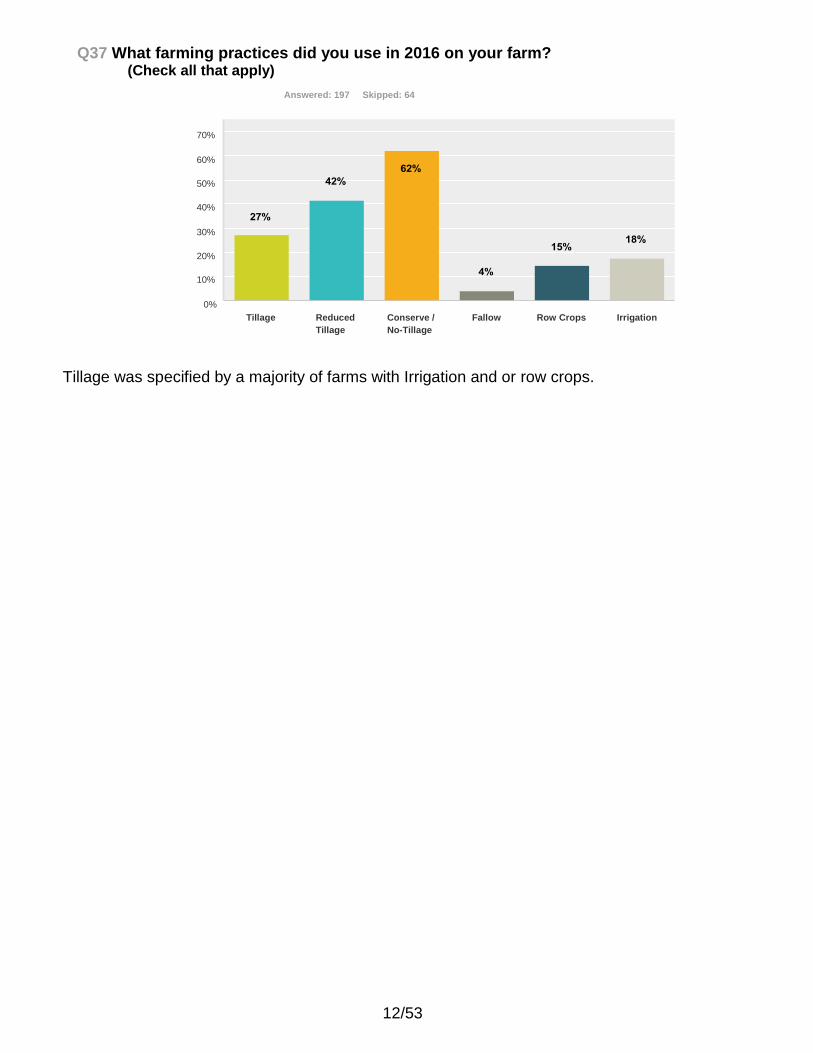
Q37 What farming practices did you use in 2016 on your farm? (Check all that apply)
Answered: 197 Skipped: 64
70%
60%
50%
40%
30%
20%
10%
0%
Tillage Reduced
Tillage
Conserve /
No-Tillage
Fallow Row Crops Irrigation
Tillage was specified by a majority of farms with Irrigation and or row crops.
13/53
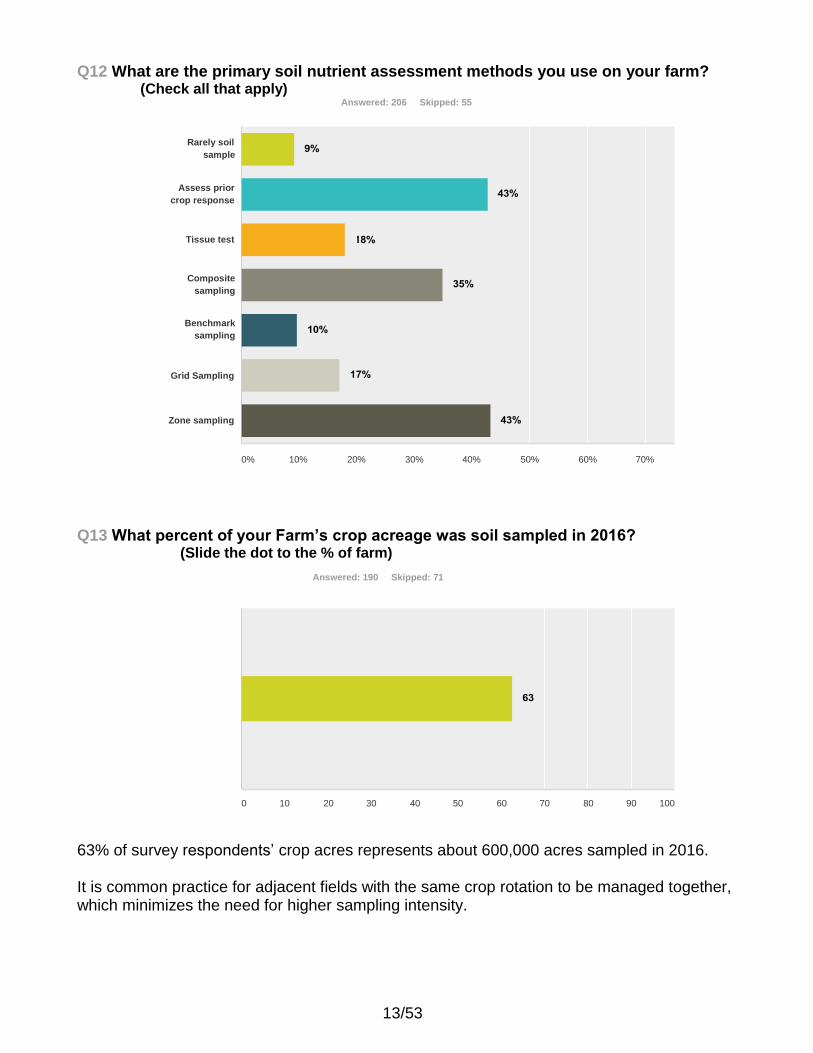
Q12 What are the primary soil nutrient assessment methods you use on your farm?
(Check all that apply) Answered: 206 Skipped: 55
Rarely soil
sample
Assess prior
crop response
Tissue test
Composite
sampling
Benchmark
sampling
Grid Sampling
Zone sampling
0% 10% 20% 30% 40% 50% 60% 70%
Q13 What percent of your Farm’s crop acreage was soil sampled in 2016?
(Slide the dot to the % of farm)
Answered: 190 Skipped: 71
0 10 20 30 40 50 60 70 80 90 100
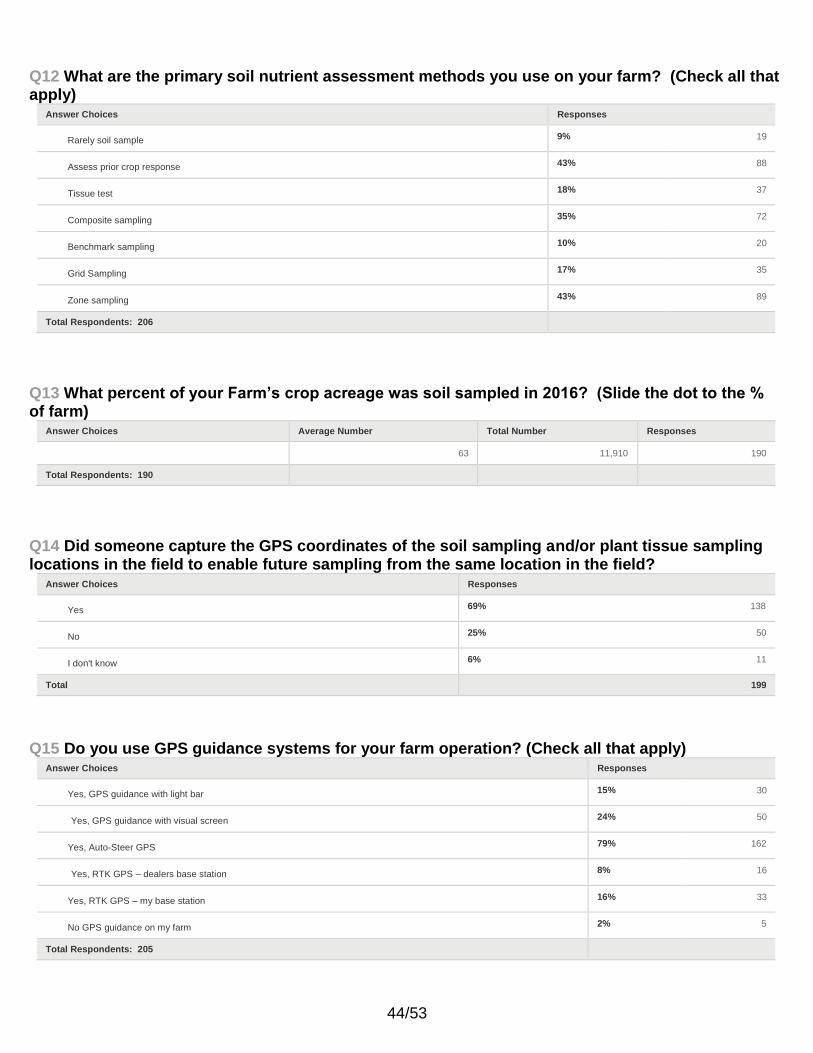
63% of survey respondents’ crop acres represents about 600,000 acres sampled in 2016. It is common practice for adjacent fields with the same crop rotation to be managed together, which minimizes the need for higher sampling intensity.
14/53
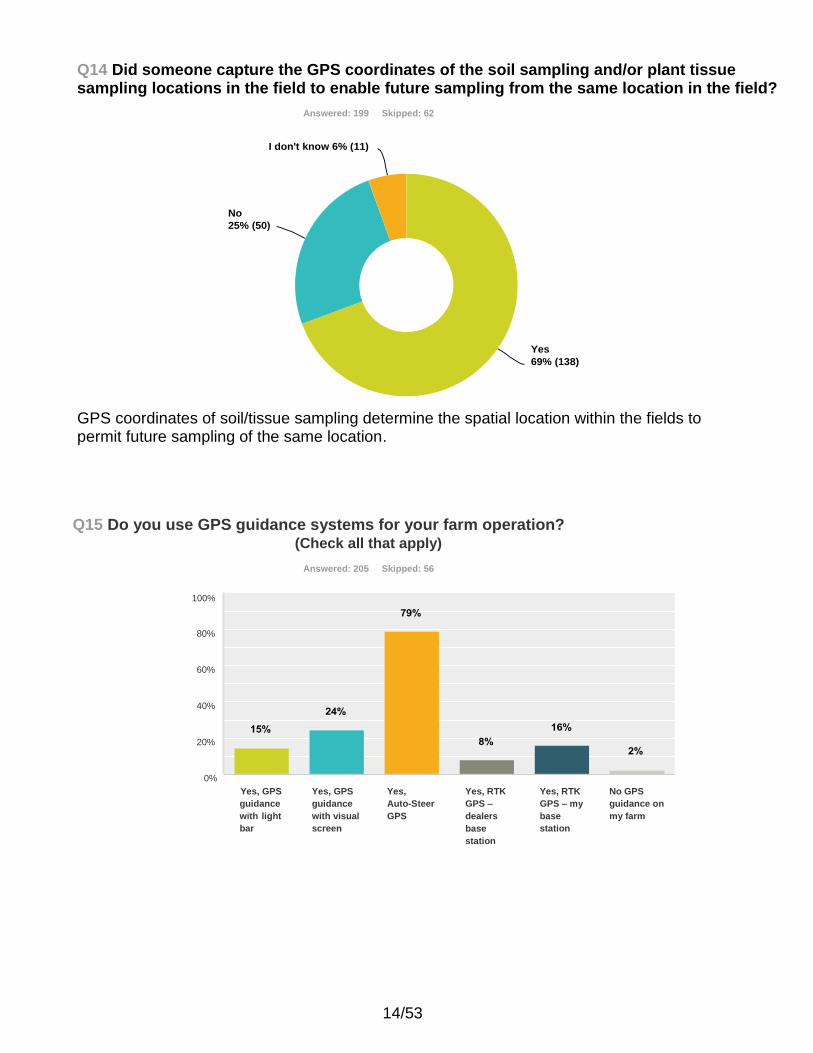
Q14 Did someone capture the GPS coordinates of the soil sampling and/or plant tissue sampling locations in the field to enable future sampling from the same location in the field?
Answered: 199 Skipped: 62
I don't know 6% (11)
No
25% (50)
Yes
69% (138)
GPS coordinates of soil/tissue sampling determine the spatial location within the fields to permit future sampling of the same location.
Q15 Do you use GPS guidance systems for your farm operation? (Check all that apply)
Answered: 205 Skipped: 56
100%
80%
60%
40%
20%
0%
Yes, GPS
guidance
with light
bar
Yes, GPS
guidance
with visual
screen
Yes,
Auto-Steer
GPS
Yes, RTK
GPS –
dealers
base
station
Yes, RTK
GPS – my
base
station
No GPS
guidance on
my farm
15/53
347
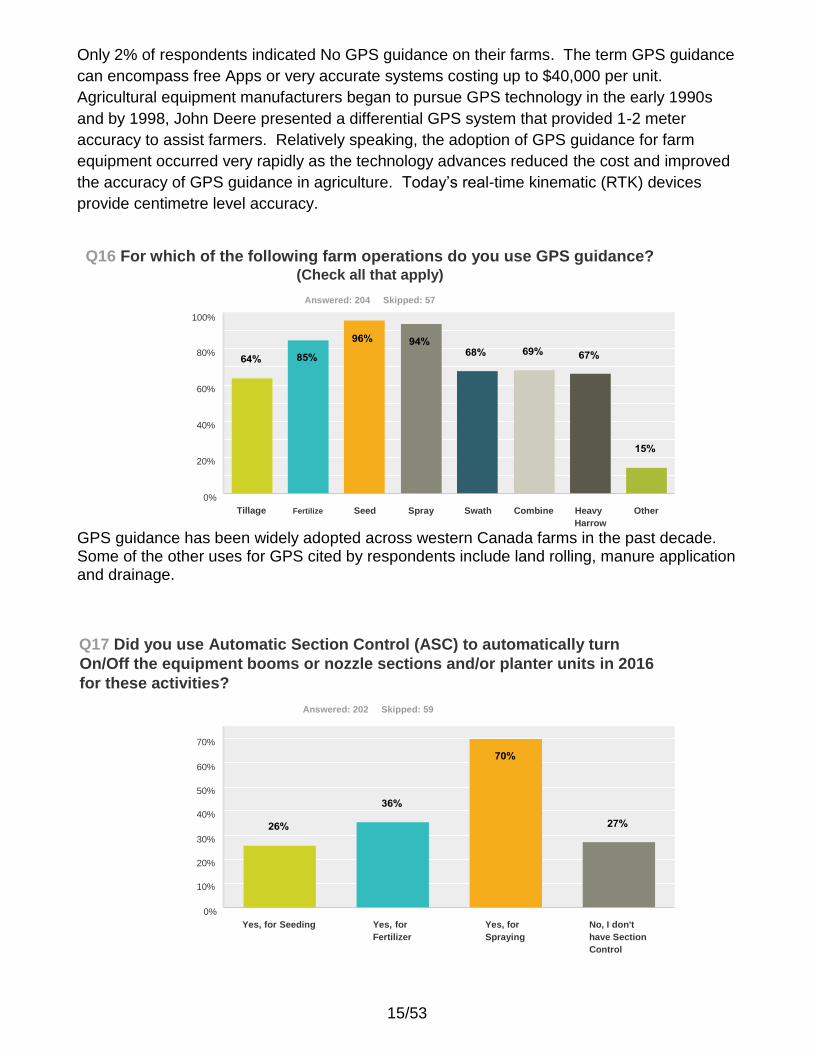
Only 2% of respondents indicated No GPS guidance on their farms. The term GPS guidance
can encompass free Apps or very accurate systems costing up to $40,000 per unit.
Agricultural equipment manufacturers began to pursue GPS technology in the early 1990s
and by 1998, John Deere presented a differential GPS system that provided 1-2 meter
accuracy to assist farmers. Relatively speaking, the adoption of GPS guidance for farm
equipment occurred very rapidly as the technology advances reduced the cost and improved
the accuracy of GPS guidance in agriculture. Today’s real-time kinematic (RTK) devices
provide centimetre level accuracy.
Q16 For which of the following farm operations do you use GPS guidance? (Check all that apply)
Answered: 204 Skipped: 57
100%
80%
60%
40%
20%
0%
Tillage Fertilize
Seed Spray Swath Combine Heavy
Harrow
Other
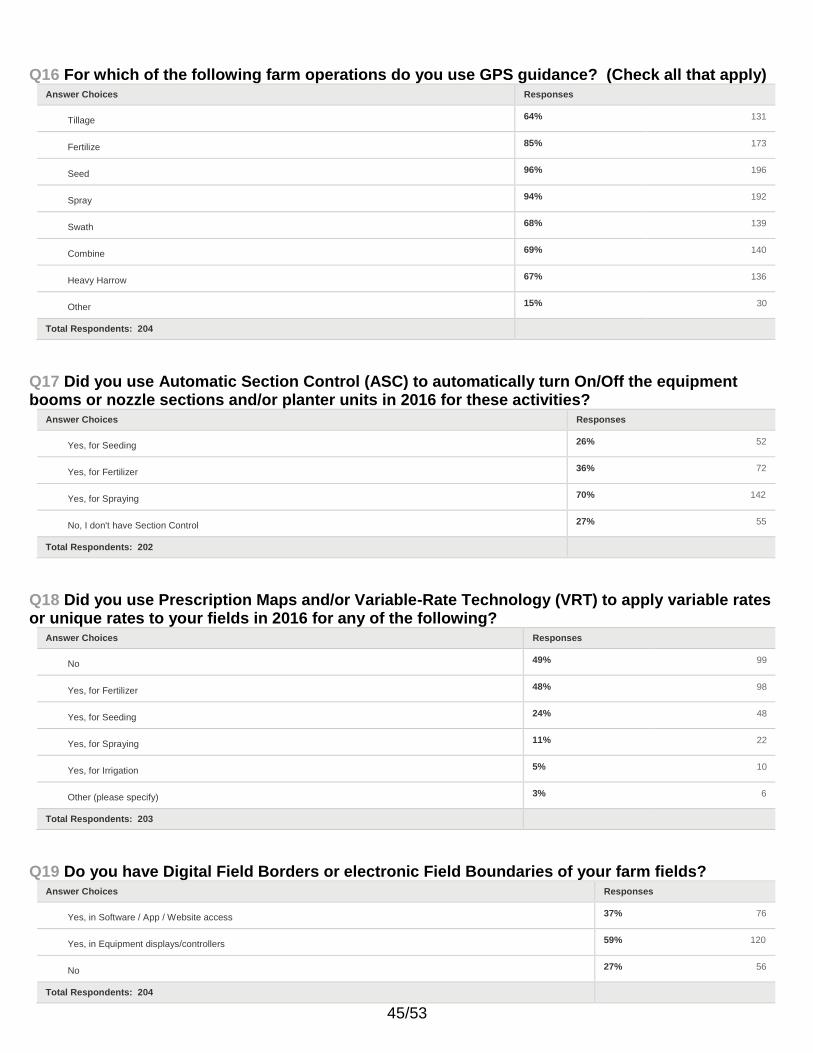
GPS guidance has been widely adopted across western Canada farms in the past decade. Some of the other uses for GPS cited by respondents include land rolling, manure application and drainage.
Q17 Did you use Automatic Section Control (ASC) to automatically turn
On/Off the equipment booms or nozzle sections and/or planter units in 2016
for these activities?
Answered: 202 Skipped: 59
70%
60%
50%
40%
30%
20%
10%
0%
Yes, for Seeding Yes, for
Fertilizer
Yes, for
Spraying
No, I don't
have Section
Control
16/53
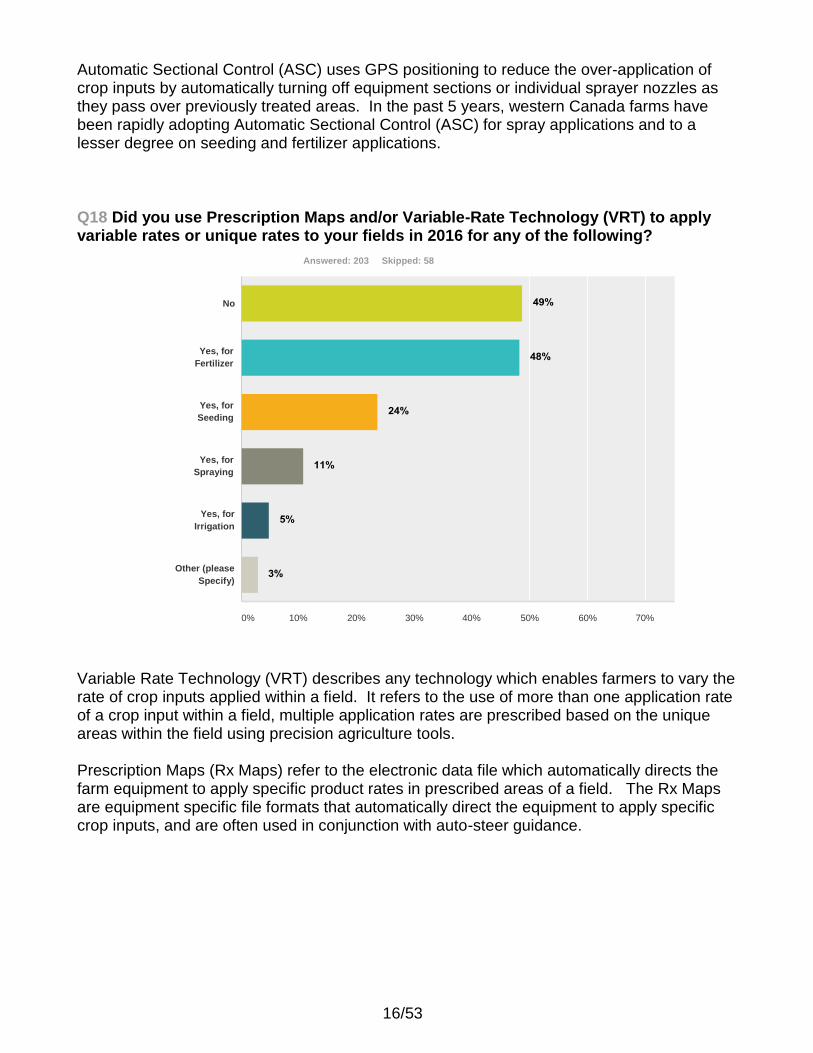
Automatic Sectional Control (ASC) uses GPS positioning to reduce the over-application of crop inputs by automatically turning off equipment sections or individual sprayer nozzles as they pass over previously treated areas. In the past 5 years, western Canada farms have been rapidly adopting Automatic Sectional Control (ASC) for spray applications and to a lesser degree on seeding and fertilizer applications.
Q18 Did you use Prescription Maps and/or Variable-Rate Technology (VRT) to apply variable rates or unique rates to your fields in 2016 for any of the following?
Answered: 203 Skipped: 58
No
Yes, for
Fertilizer
Yes, for
Seeding
Yes, for
Spraying
Yes, for
Irrigation
Other (please
Specify)
0% 10% 20% 30% 40% 50% 60% 70%
Variable Rate Technology (VRT) describes any technology which enables farmers to vary the rate of crop inputs applied within a field. It refers to the use of more than one application rate of a crop input within a field, multiple application rates are prescribed based on the unique areas within the field using precision agriculture tools. Prescription Maps (Rx Maps) refer to the electronic data file which automatically directs the farm equipment to apply specific product rates in prescribed areas of a field. The Rx Maps are equipment specific file formats that automatically direct the equipment to apply specific crop inputs, and are often used in conjunction with auto-steer guidance.

17/53
Q19 Do you have Digital Field Borders or electronic Field Boundaries of your farm fields?
Answered: 204 Skipped: 57
70%
60%
50%
40%
30%
20%
10%
0%
Yes, in Software /
App / Website access
Yes, in Equipment No
Displays /controllers
Digital Field Borders of Field Boundaries define the field area and obstacles or non-crop areas within the field. Digital Field Borders can be created in the field or created remotely with geospatial information system (GIS) software and imagery. Geospatial accuracy of the digital field borders can vary based on methods and techniques used and they are useful for equipment operation and geospatial analysis of field data. There are specific equipment file formats and shapefile formats used by different equipment.
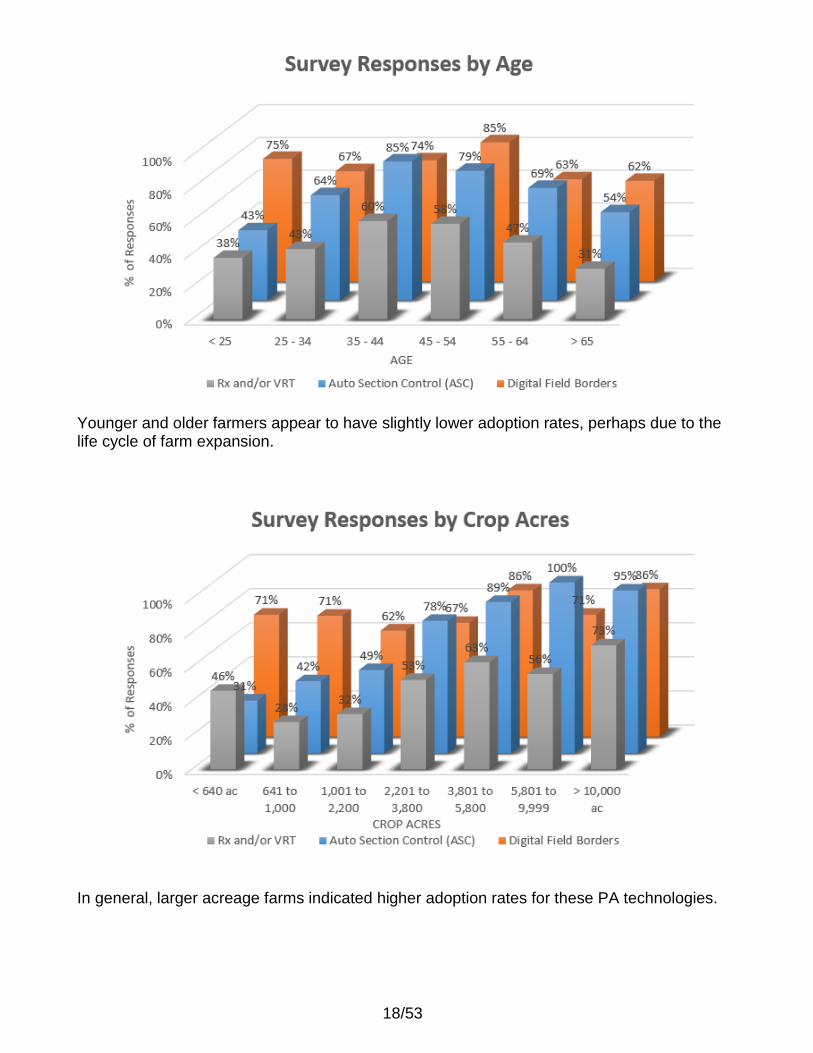
Demographic analysis of Survey Questions 17, 18, 19
Adoption rates of these PA tools appear similar between provinces.
18/53
Younger and older farmers appear to have slightly lower adoption rates, perhaps due to the life cycle of farm expansion.
In general, larger acreage farms indicated higher adoption rates for these PA technologies.
19/53
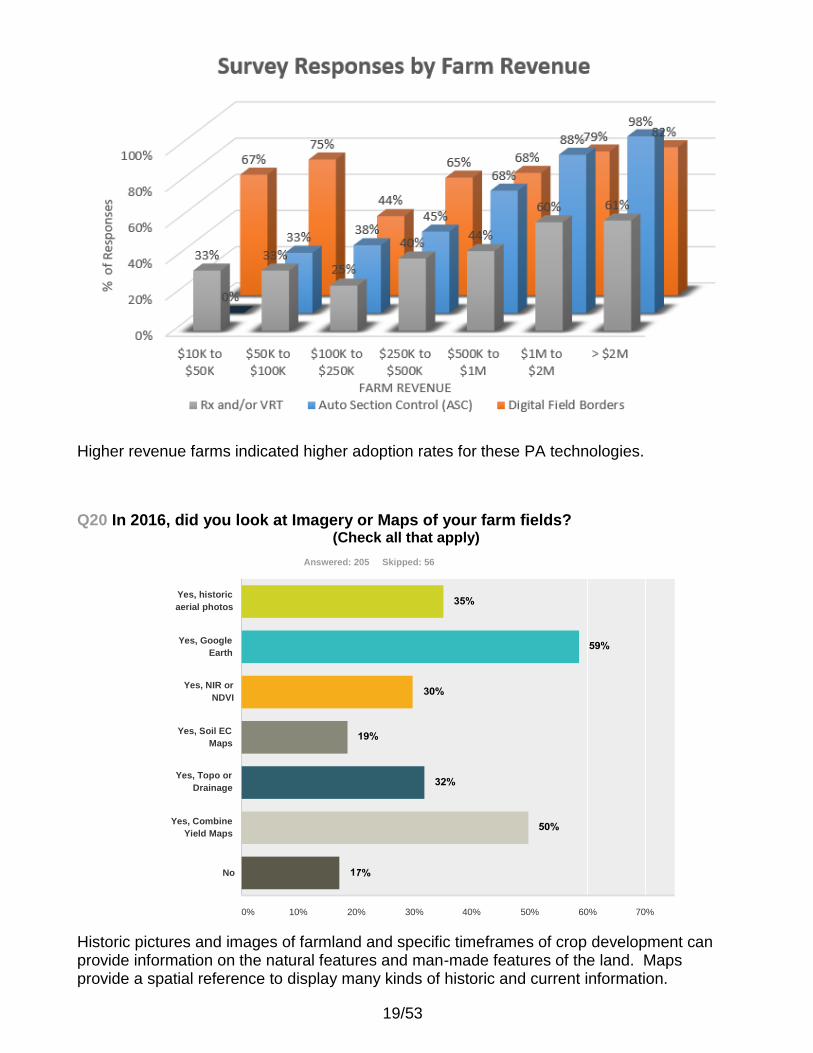
Higher revenue farms indicated higher adoption rates for these PA technologies.
Q20 In 2016, did you look at Imagery or Maps of your farm fields? (Check all that apply)
Answered: 205 Skipped: 56
Yes, historic
aerial photos
Yes, Google
Earth
Yes, NIR or
NDVI
Yes, Soil EC
Maps
Yes, Topo or
Drainage
Yes, Combine
Yield Maps
No
0% 10% 20% 30% 40% 50% 60% 70%
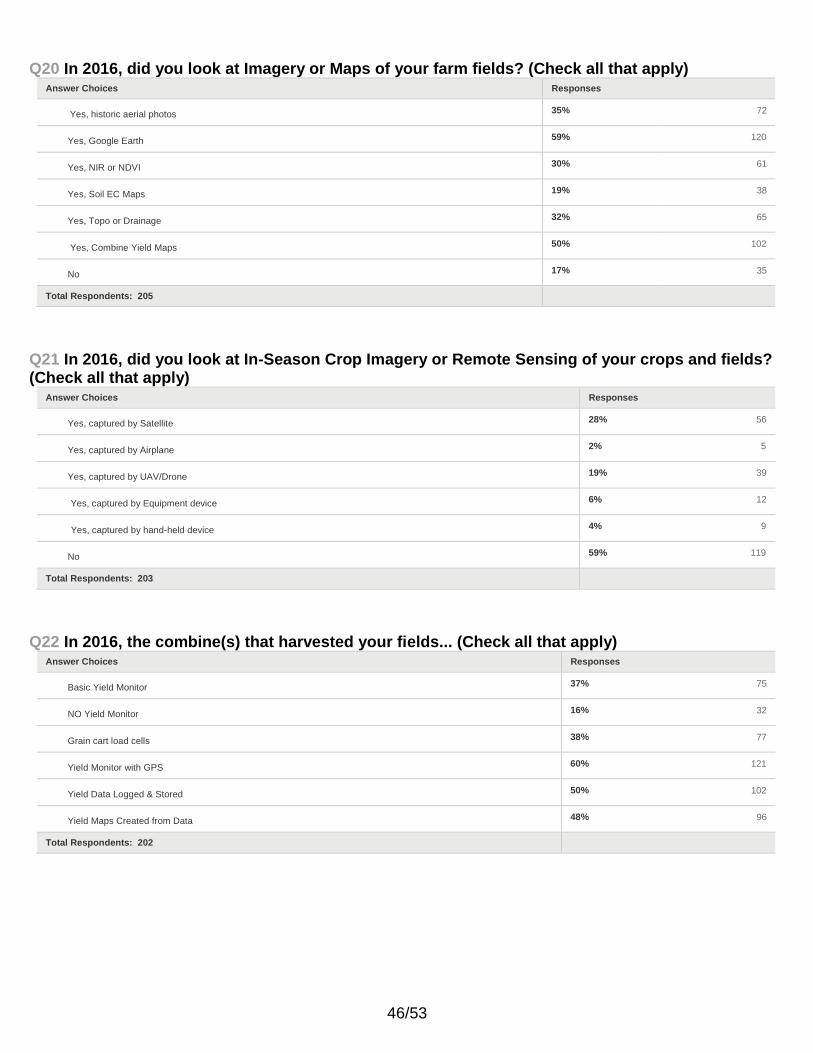
Historic pictures and images of farmland and specific timeframes of crop development can provide information on the natural features and man-made features of the land. Maps provide a spatial reference to display many kinds of historic and current information.
20/53
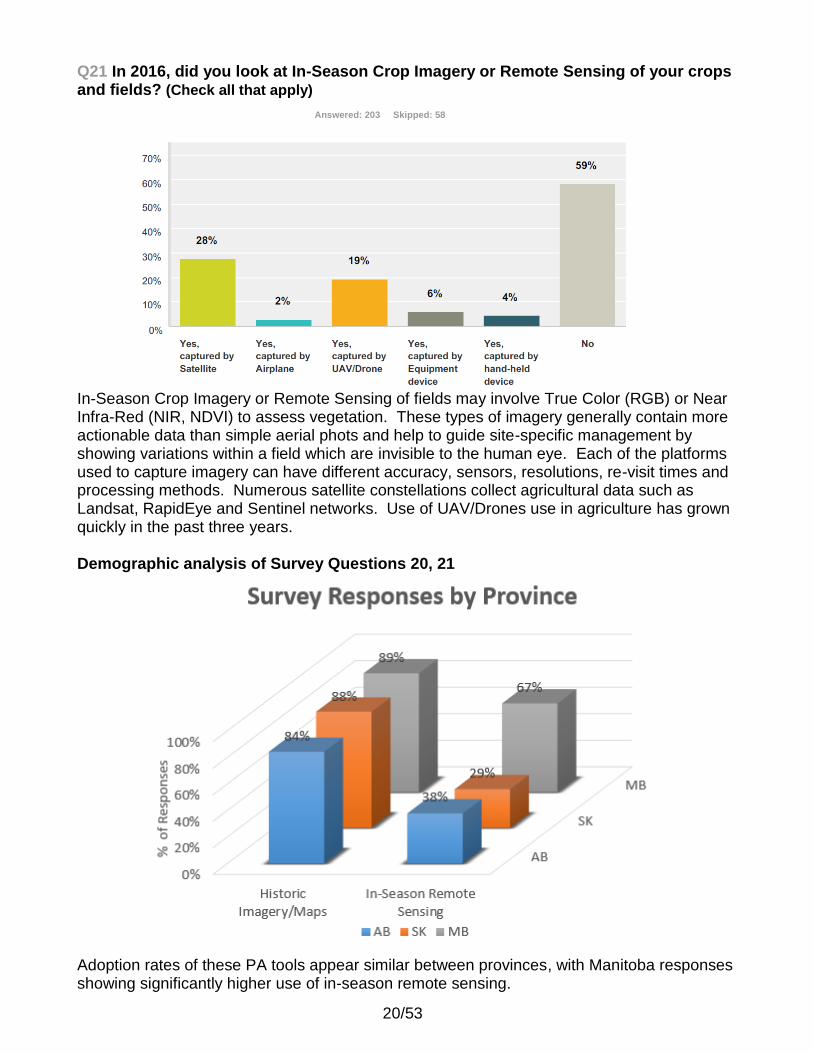
Q21 In 2016, did you look at In-Season Crop Imagery or Remote Sensing of your crops and fields? (Check all that apply)
Answered: 203 Skipped: 58
In-Season Crop Imagery or Remote Sensing of fields may involve True Color (RGB) or Near Infra-Red (NIR, NDVI) to assess vegetation. These types of imagery generally contain more actionable data than simple aerial phots and help to guide site-specific management by showing variations within a field which are invisible to the human eye. Each of the platforms used to capture imagery can have different accuracy, sensors, resolutions, re-visit times and processing methods. Numerous satellite constellations collect agricultural data such as Landsat, RapidEye and Sentinel networks. Use of UAV/Drones use in agriculture has grown quickly in the past three years. Demographic analysis of Survey Questions 20, 21
Adoption rates of these PA tools appear similar between provinces, with Manitoba responses showing significantly higher use of in-season remote sensing.
21/53
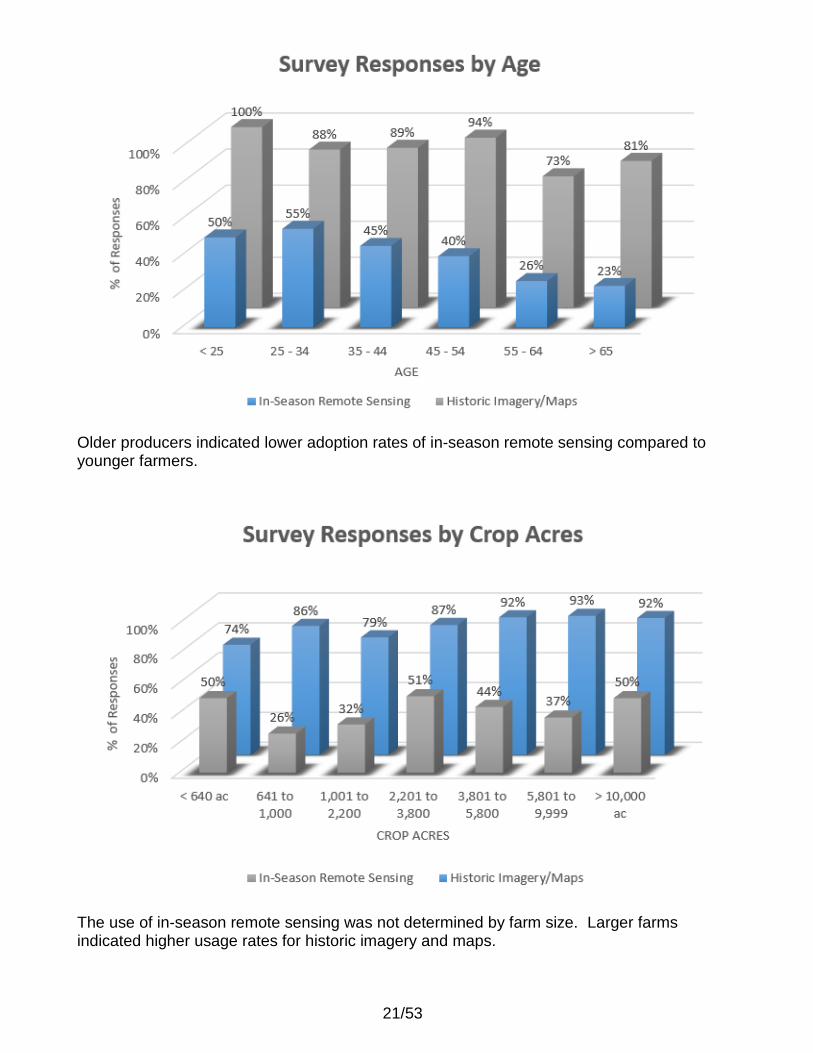
Older producers indicated lower adoption rates of in-season remote sensing compared to younger farmers.
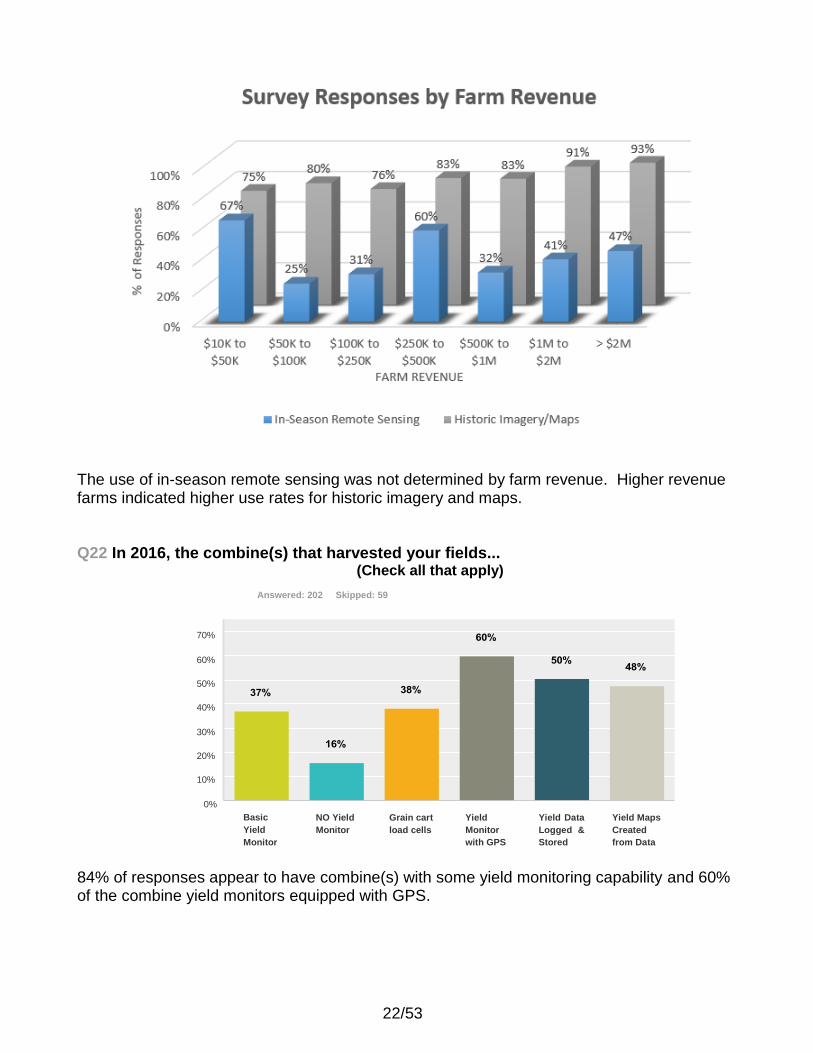
The use of in-season remote sensing was not determined by farm size. Larger farms indicated higher usage rates for historic imagery and maps.
22/53
The use of in-season remote sensing was not determined by farm revenue. Higher revenue farms indicated higher use rates for historic imagery and maps. Q22 In 2016, the combine(s) that harvested your fields...
(Check all that apply)
Answered: 202 Skipped: 59
70%
60%
50%
40%
30%
20%
10%
0%
Basic
Yield
Monitor
NO Yield
Monitor
Grain cart
load cells
Yield
Monitor
with GPS
Yield Data
Logged &
Stored
Yield Maps
Created
from Data
84% of responses appear to have combine(s) with some yield monitoring capability and 60% of the combine yield monitors equipped with GPS.
23/53
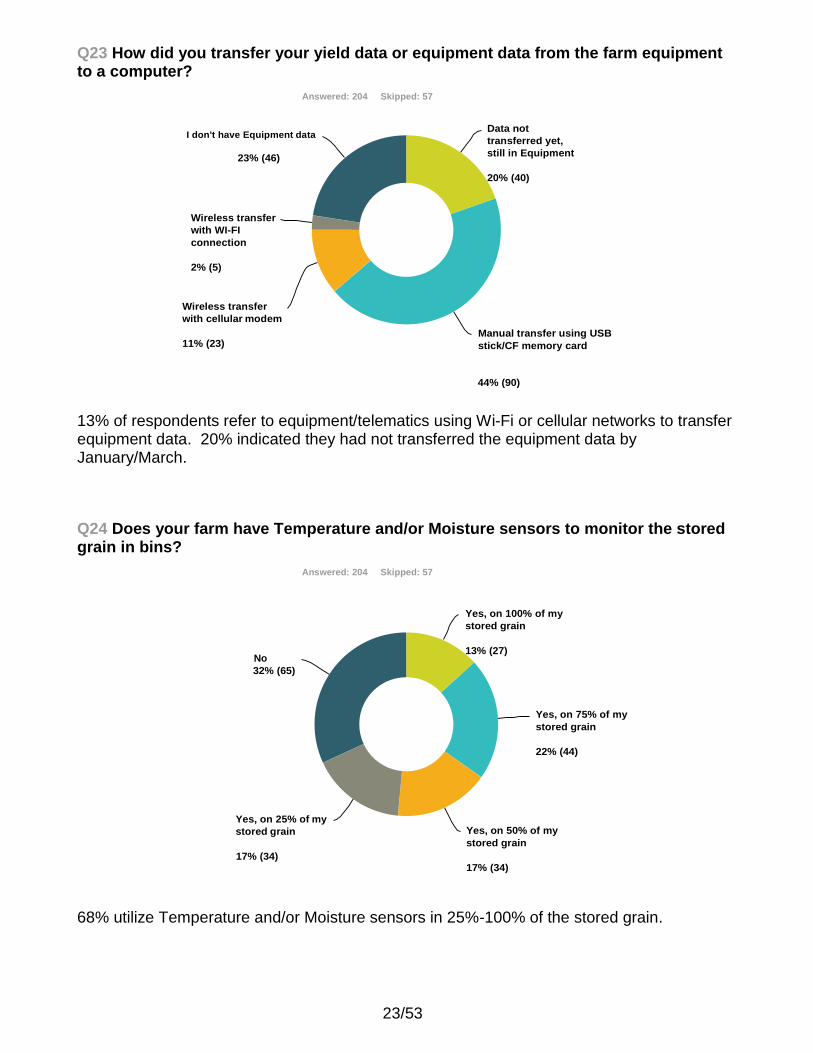
Q23 How did you transfer your yield data or equipment data from the farm equipment to a computer?
Answered: 204 Skipped: 57
I don't have Equipment data
23% (46)
Data not
transferred yet,
still in Equipment
20% (40)
Wireless transfer
with WI-FI
connection
2% (5)
Wireless transfer
with cellular modem
11% (23)
Manual transfer using USB
stick/CF memory card
44% (90)
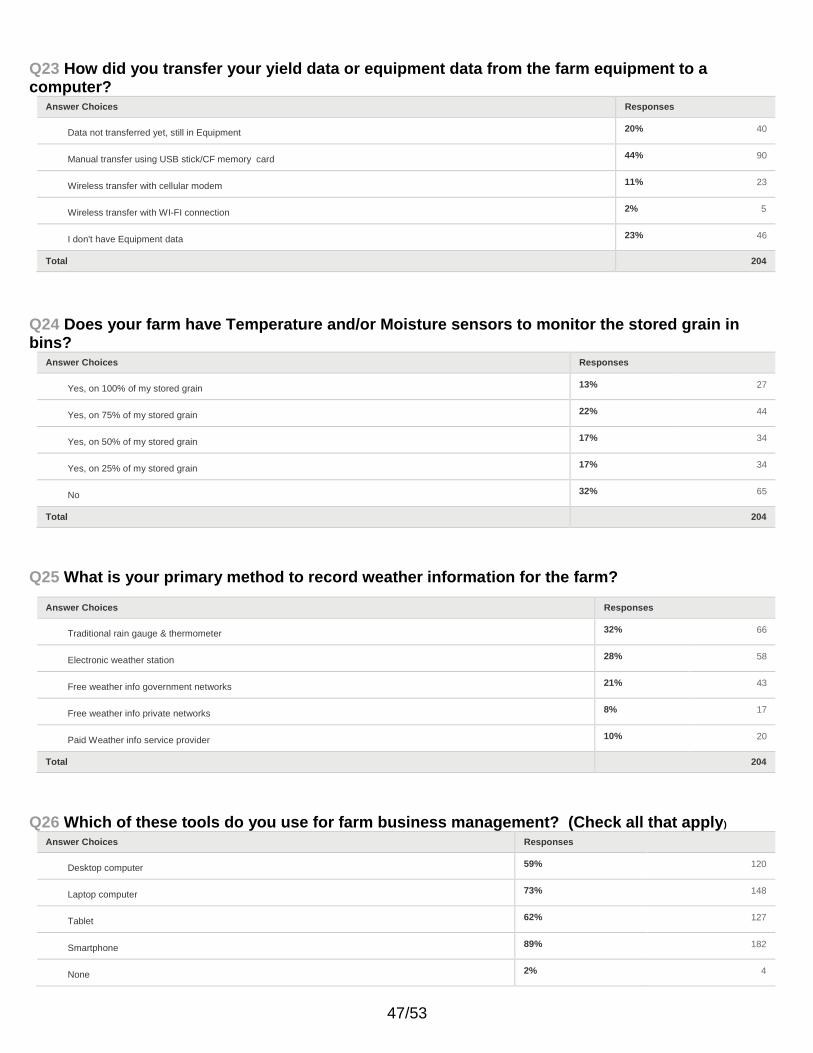
13% of respondents refer to equipment/telematics using Wi-Fi or cellular networks to transfer equipment data. 20% indicated they had not transferred the equipment data by January/March.
Q24 Does your farm have Temperature and/or Moisture sensors to monitor the stored grain in bins?
Answered: 204 Skipped: 57
No
32% (65)
Yes, on 25% of my
stored grain
17% (34)
Yes, on 100% of my
stored grain
13% (27)
Yes, on 75% of my
stored grain
22% (44)
Yes, on 50% of my
stored grain
17% (34)
68% utilize Temperature and/or Moisture sensors in 25%-100% of the stored grain.
24/53
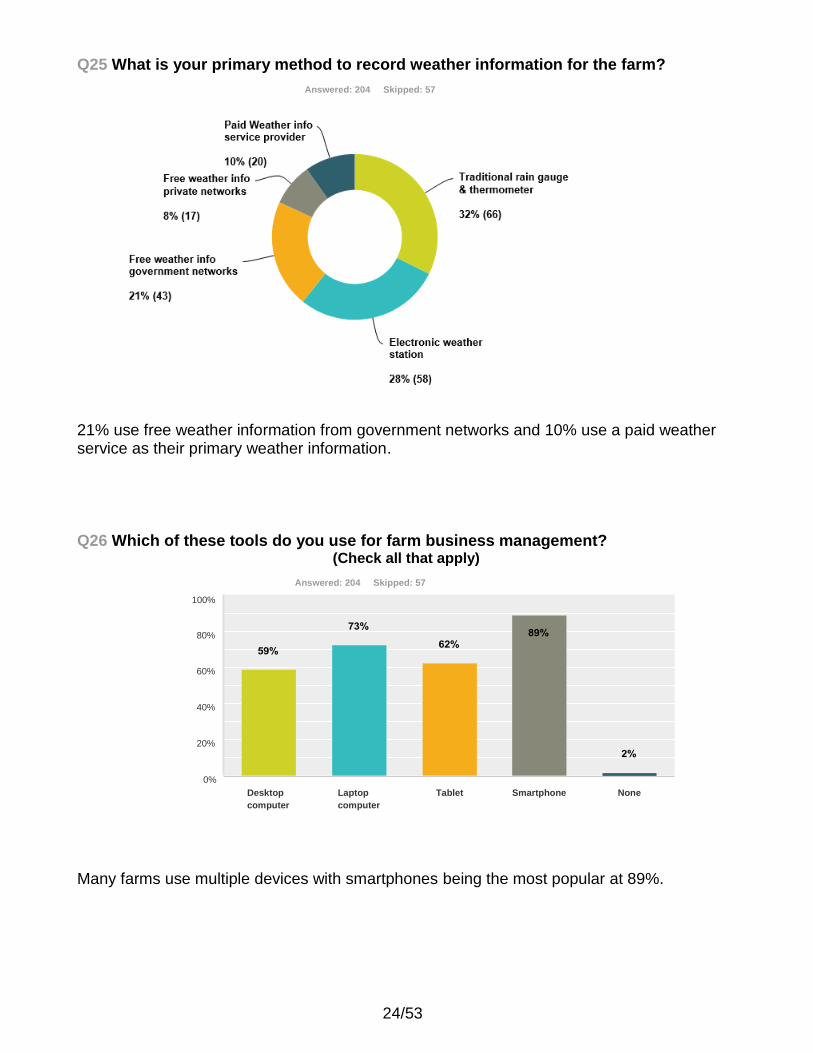
Q25 What is your primary method to record weather information for the farm?
Answered: 204 Skipped: 57
21% use free weather information from government networks and 10% use a paid weather service as their primary weather information.
Q26 Which of these tools do you use for farm business management? (Check all that apply)
Answered: 204 Skipped: 57
100%
80%
60%
40%
20%
0%
Desktop
computer
Laptop
computer
Tablet Smartphone None
Many farms use multiple devices with smartphones being the most popular at 89%.
25/53
347
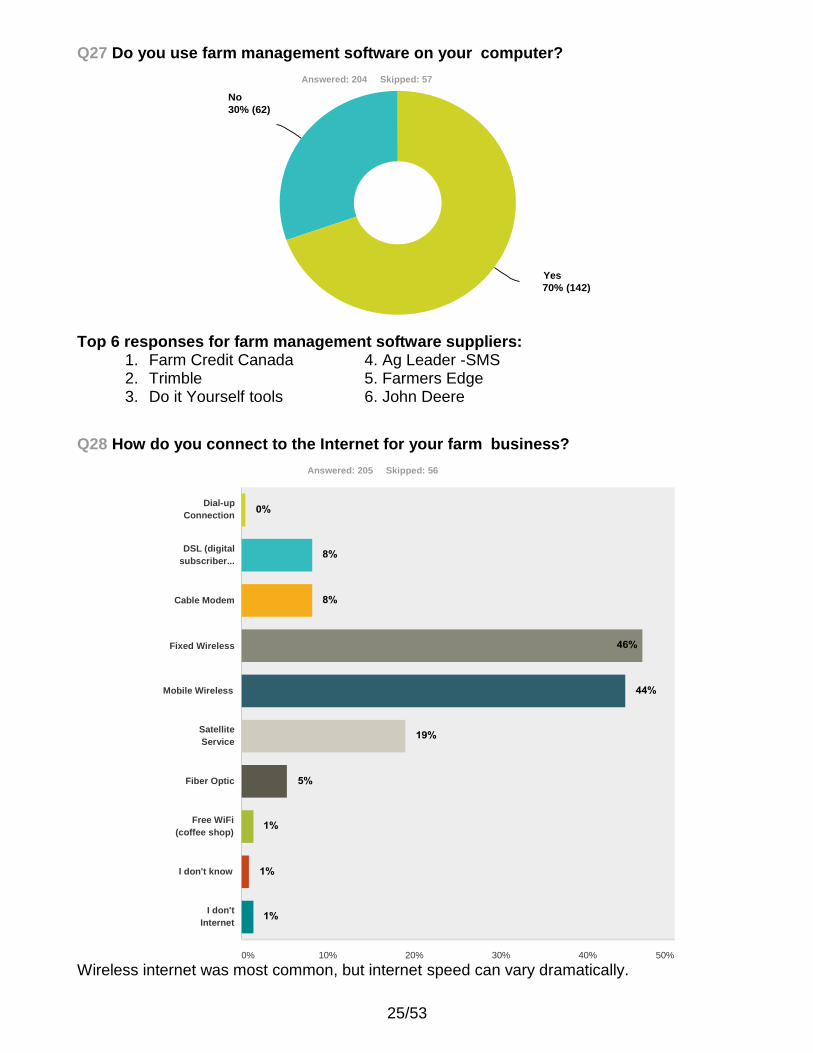
Q27 Do you use farm management software on your computer?
Answered: 204 Skipped: 57
No
30% (62)
Yes
70% (142)
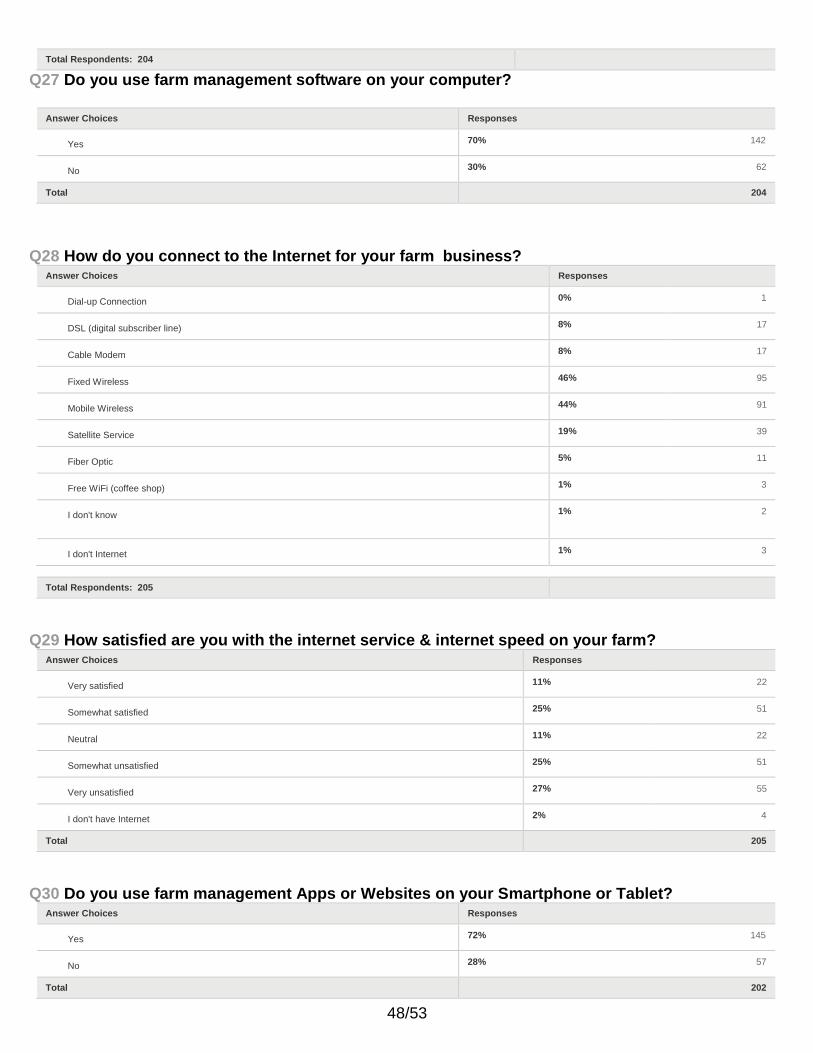
Top 6 responses for farm management software suppliers: 1. Farm Credit Canada 4. Ag Leader -SMS 2. Trimble 5. Farmers Edge 3. Do it Yourself tools 6. John Deere
Q28 How do you connect to the Internet for your farm business?
Answered: 205 Skipped: 56
Dial-up
Connection
DSL (digital
subscriber...
Cable Modem
Fixed Wireless
Mobile Wireless
Satellite
Service
Fiber Optic
Free WiFi
(coffee shop)
I don't know
I don't
Internet
0% 10% 20% 30% 40% 50%
Wireless internet was most common, but internet speed can vary dramatically.
26/53
347
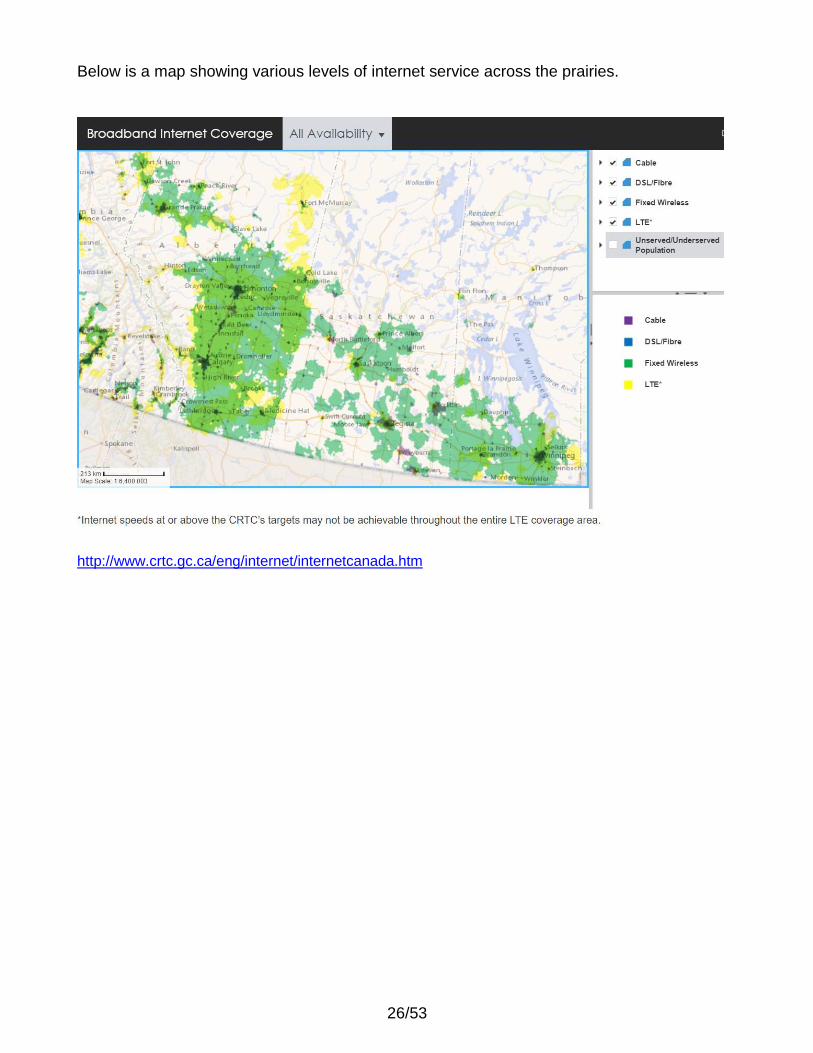
Below is a map showing various levels of internet service across the prairies.
http://www.crtc.gc.ca/eng/internet/internetcanada.htm
27/53
347
Factors influencing adoption 3.3
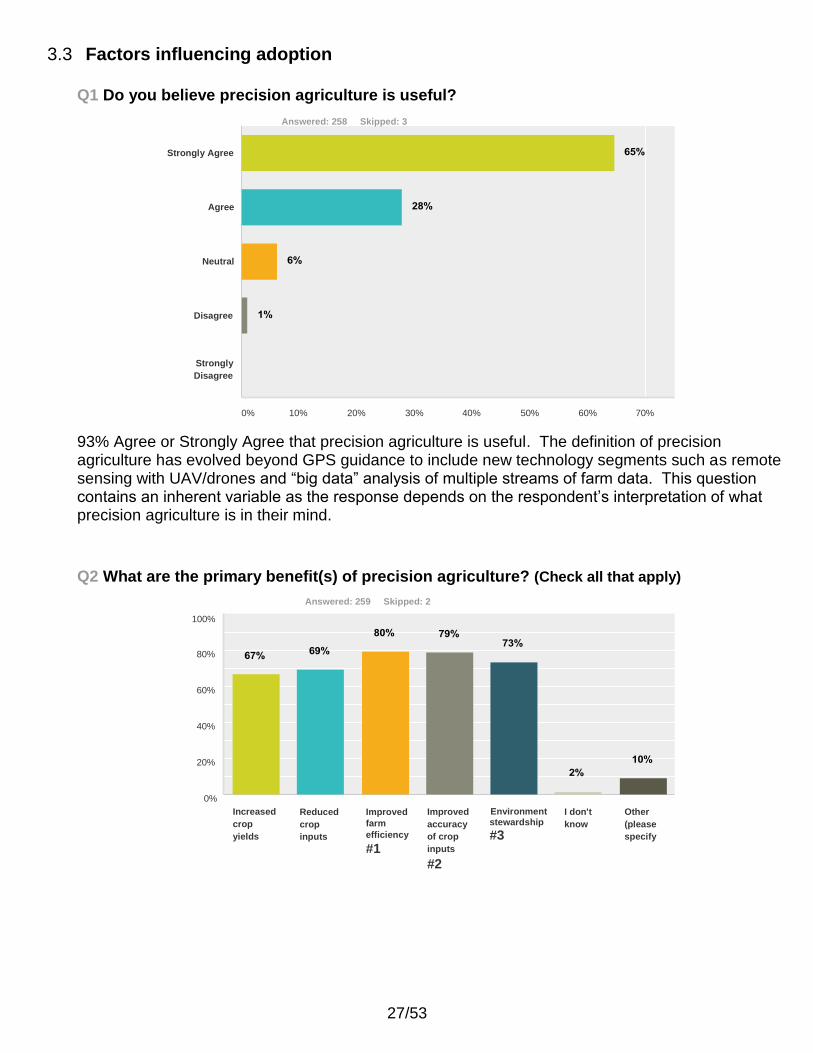
Q1 Do you believe precision agriculture is useful?
Answered: 258 Skipped: 3
Strongly Agree
Agree
Neutral
Disagree
Strongly
Disagree
0% 10% 20% 30% 40% 50% 60% 70%
93% Agree or Strongly Agree that precision agriculture is useful. The definition of precision agriculture has evolved beyond GPS guidance to include new technology segments such as remote sensing with UAV/drones and “big data” analysis of multiple streams of farm data. This question contains an inherent variable as the response depends on the respondent’s interpretation of what precision agriculture is in their mind.
Q2 What are the primary benefit(s) of precision agriculture? (Check all that apply)
Answered: 259 Skipped: 2
100%
80%
60%
40%
20%
0%
Increased
crop
yields
Reduced
crop
inputs
Improved
farm
efficiency
#1
Improved
accuracy
of crop
inputs
#2
Environment stewardship
#3
I don't
know
Other
(please
specify
28/53
347
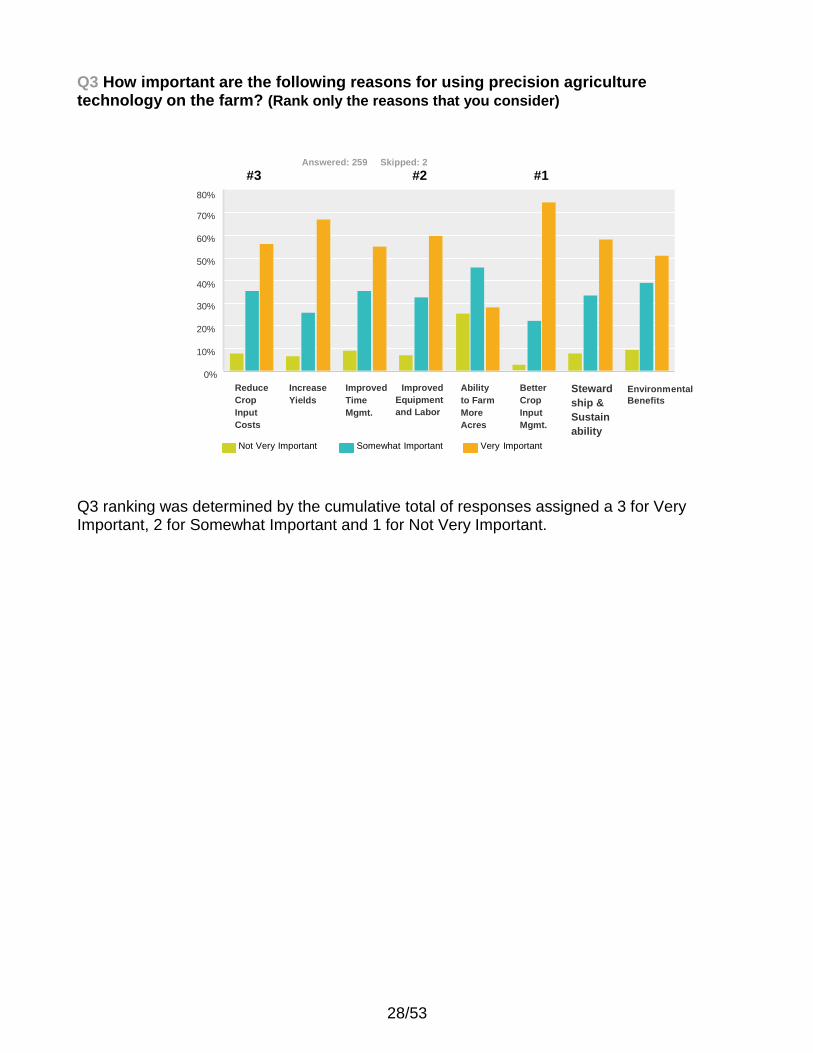
Q3 How important are the following reasons for using precision agriculture technology on the farm? (Rank only the reasons that you consider)
Answered: 259 Skipped: 2
#3 #2 #1
80%
70%
60%
50%
40%
30%
20%
10%
0%
Reduce
Crop
Input
Costs
Increase
Yields
Improved
Time
Mgmt.
Improved
Equipment
and Labor
Ability
to Farm
More
Acres
Better
Crop
Input
Mgmt.
Steward
ship &
Sustain
ability
Environmental
Benefits
Not Very Important Somewhat Important Very Important
Q3 ranking was determined by the cumulative total of responses assigned a 3 for Very Important, 2 for Somewhat Important and 1 for Not Very Important.
29/53
347
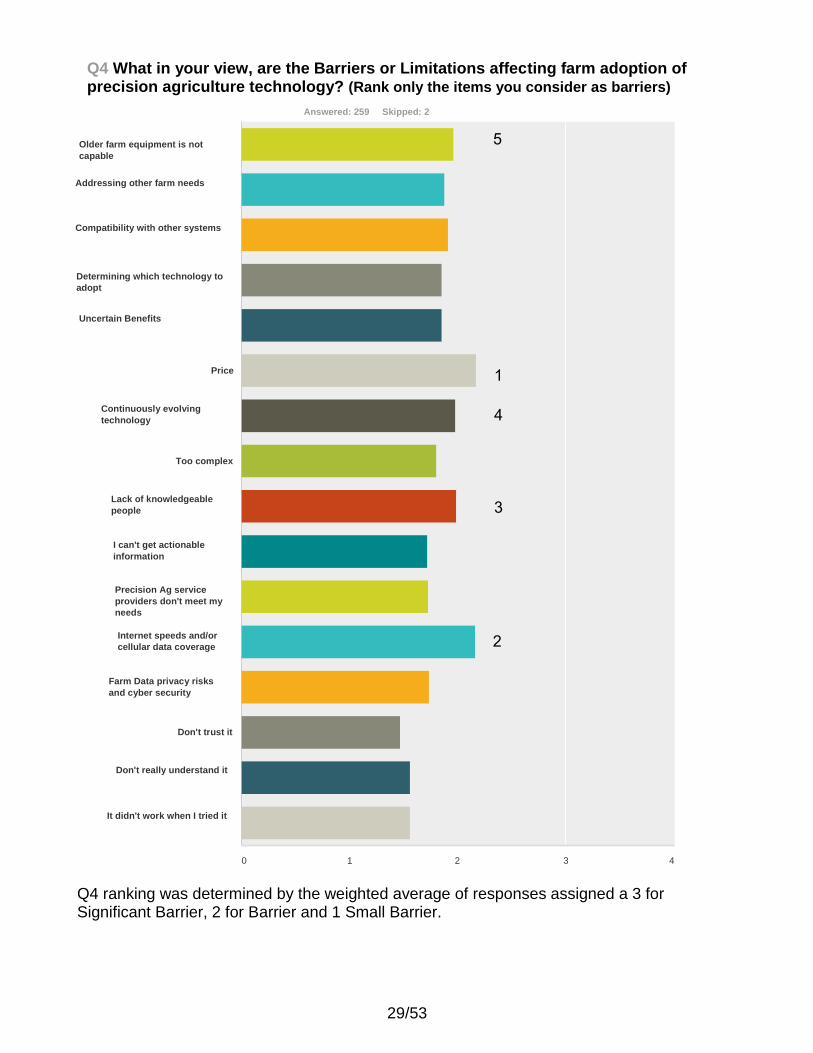
Q4 What in your view, are the Barriers or Limitations affecting farm adoption of precision agriculture technology? (Rank only the items you consider as barriers)
Answered: 259 Skipped: 2
Older farm equipment is not
capable
Addressing other farm needs
Compatibility with other systems
Determining which technology to
adopt
Uncertain Benefits
Price
Continuously evolving
technology
Too complex
Lack of knowledgeable
people
I can't get actionable
information
Precision Ag service
providers don't meet my
needs
Internet speeds and/or
cellular data coverage
Farm Data privacy risks
and cyber security
Don't trust it
Don't really understand it
It didn't work when I tried it
0 1 2 3 4
Q4 ranking was determined by the weighted average of responses assigned a 3 for Significant Barrier, 2 for Barrier and 1 Small Barrier.

30/53 347
Price of PA applications tends to be an important consideration with producers, but what portion of the PA barrier is hardware, software or services-related is difficult to determine. If the tangible benefits to PA adoption are uncertain, then the price equation becomes more important. The #2 Barrier is Internet speeds and/or cellular coverage, as the collection, transfer and analysis of farm data rely on cellular or internet.
Q5 How do you find out about new or improved products, processes or practices? Or find out about precision agriculture technologies? (Rank only the sources you utilize)
Answered: 258 Skipped: 3
Other farmers
Demonstration
farms and field days
Workshops,
seminars, meetings
& conferences
Input supply
companies...
Equipment
suppliers/dealers
Independent
consultants
Government
specialists
Trade magazines
& own
investigations
Other
0 1 2 3 4
31/53 347
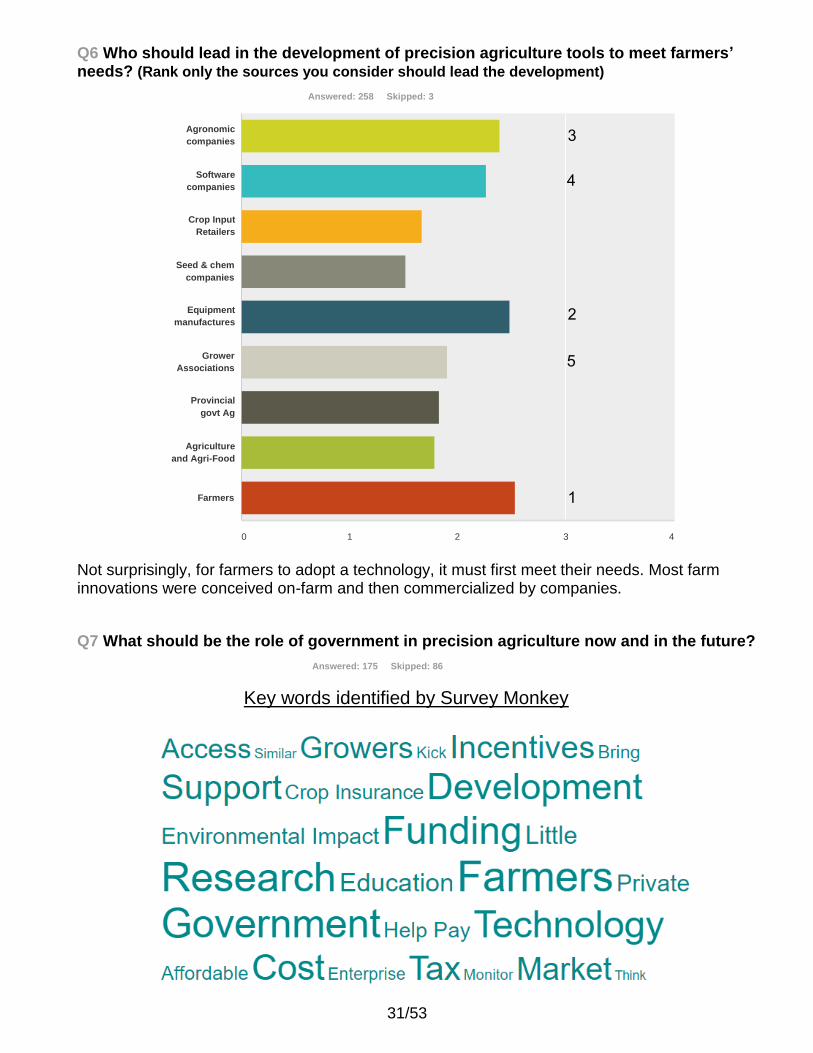
Q6 Who should lead in the development of precision agriculture tools to meet farmers’ needs? (Rank only the sources you consider should lead the development)
Answered: 258 Skipped: 3
Agronomic
companies
Software
companies
Crop Input
Retailers
Seed & chem
companies
Equipment
manufactures
Grower
Associations
Provincial
govt Ag
Agriculture
and Agri-Food
Farmers
0 1 2 3 4
Not surprisingly, for farmers to adopt a technology, it must first meet their needs. Most farm innovations were conceived on-farm and then commercialized by companies.
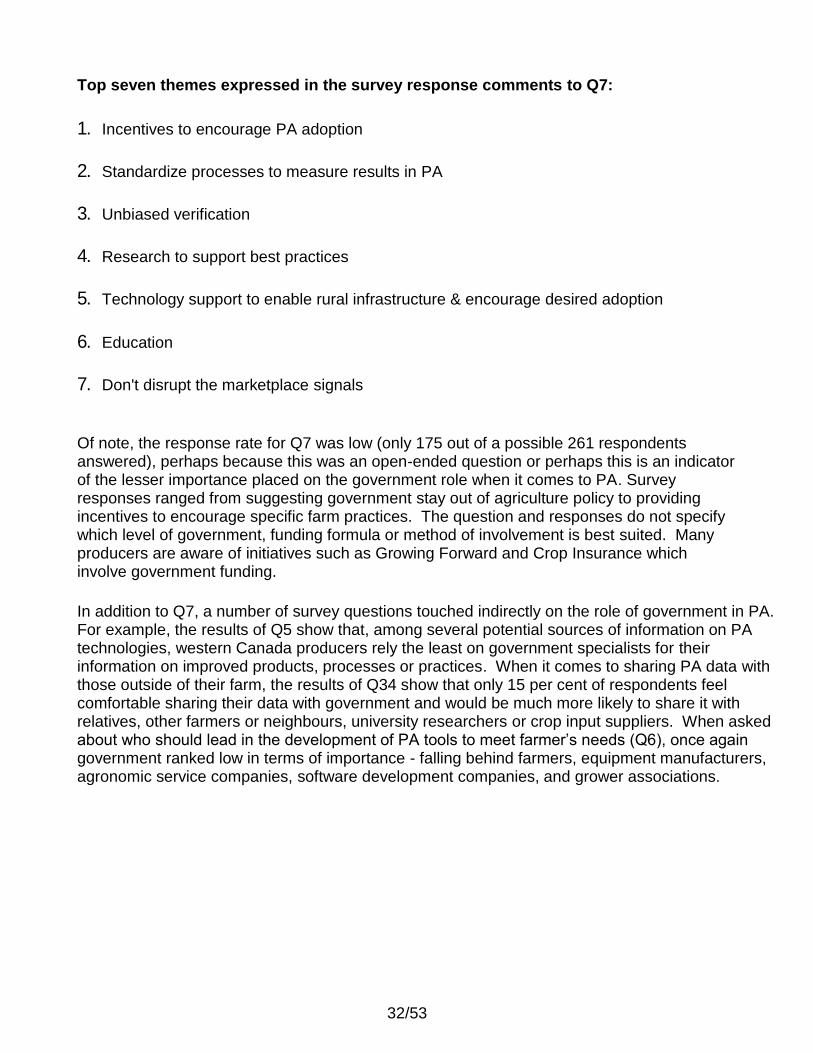
Q7 What should be the role of government in precision agriculture now and in the future?
Answered: 175 Skipped: 86
Key words identified by Survey Monkey
32/53 347
Top seven themes expressed in the survey response comments to Q7:
1. Incentives to encourage PA adoption
2. Standardize processes to measure results in PA
3. Unbiased verification
4. Research to support best practices
5. Technology support to enable rural infrastructure & encourage desired adoption
6. Education
7. Don't disrupt the marketplace signals
Of note, the response rate for Q7 was low (only 175 out of a possible 261 respondents answered), perhaps because this was an open-ended question or perhaps this is an indicator of the lesser importance placed on the government role when it comes to PA. Survey responses ranged from suggesting government stay out of agriculture policy to providing incentives to encourage specific farm practices. The question and responses do not specify which level of government, funding formula or method of involvement is best suited. Many producers are aware of initiatives such as Growing Forward and Crop Insurance which involve government funding.
In addition to Q7, a number of survey questions touched indirectly on the role of government in PA. For example, the results of Q5 show that, among several potential sources of information on PA technologies, western Canada producers rely the least on government specialists for their information on improved products, processes or practices. When it comes to sharing PA data with those outside of their farm, the results of Q34 show that only 15 per cent of respondents feel comfortable sharing their data with government and would be much more likely to share it with relatives, other farmers or neighbours, university researchers or crop input suppliers. When asked about who should lead in the development of PA tools to meet farmer’s needs (Q6), once again government ranked low in terms of importance - falling behind farmers, equipment manufacturers, agronomic service companies, software development companies, and grower associations.

33/53 347
Q9 How much did your farm spend on precision agriculture in 2016? ($ without decimals or non-numeric characters)
Answered: 155 Skipped: 106
Answer Choices Average Number Total Number Responses
Total Dollars $ 23,974 $ 3,404,259 142
$ Per Acre $ 6.74 126
Total Respondents: 155
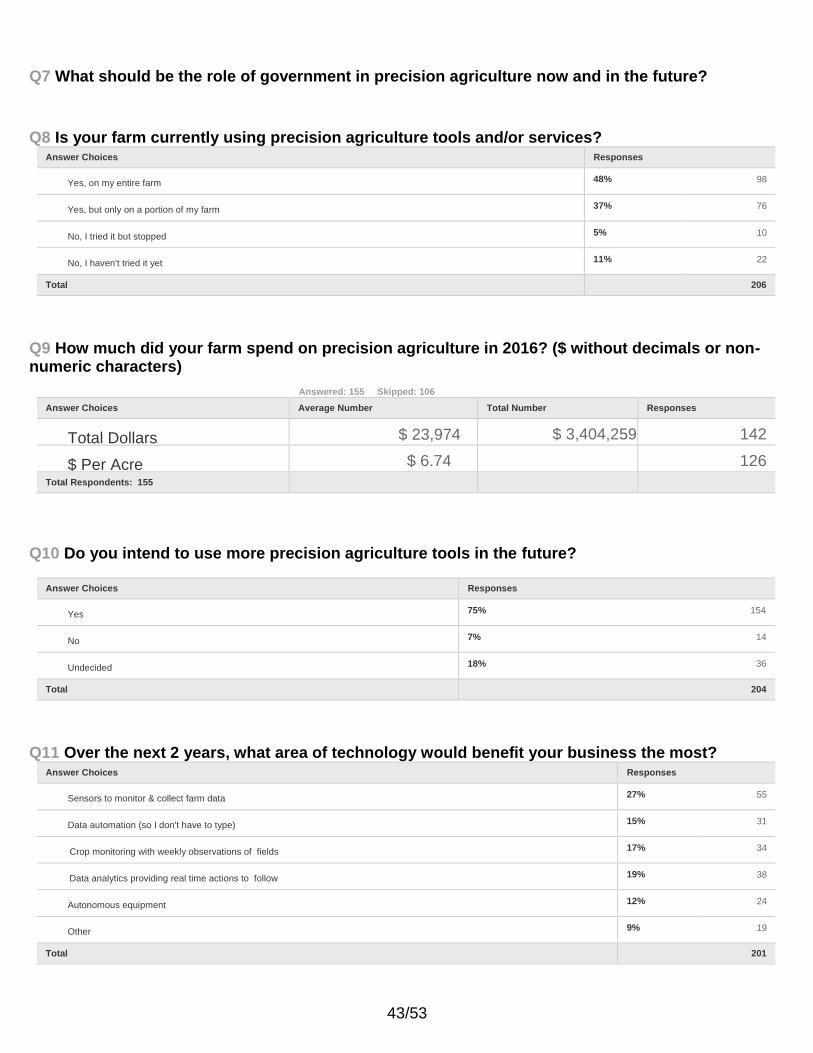
Average farm spending on PA based on survey responses was $6.74 per Acre Analysis by province: Alberta: $8.24/Acre, Saskatchewan: $5.26/Acre, Manitoba: $6.12/Acre Total Dollars and Dollars per Acre represent the respondents’ perceptions of their farm spend. Responses could represent whole farm or part farm PA services and may or may not include equipment hardware, depreciation, internet/cellular fees, etc.
Q10 Do you intend to use more precision agriculture tools in the future?
Answered: 204 Skipped: 57
Undecided 18% (36)
No
7% (14)
Yes
75% (154)
Responses provide a benchmark of precision agriculture spending in 2016 and the positive intent to use more PA tools in the future.

34/53 347
Q11 Over the next 2 years, what area of technology would benefit your business the most?
Answered: 201 Skipped: 60
Other 9% (19)
Autonomous
equipment
12% (24)
Sensors to monitor
& collect farm data
27% (55)
Data analytics
providing real time
actions to follow
19% (38)
Crop monitoring
with weekly
observations of
fields
17% (34)
Data automation
(so I don't have to
type)
15% (31)
Responses to Q11 indicate a desire for new technology that is not currently available commercially and not widely used. Q29 How satisfied are you with the internet service & internet speed on your farm?
Answered: 205 Skipped: 56
Very satisfied
Somewhat
satisfied
Neutral
Somewhat
unsatisfied
Very
unsatisfied
I don't have
Internet
0% 10% 20% 30% 40% 50%
52% of survey responses were Somewhat unsatisfied or Very unsatisfied with their internet service and internet speed.
35/53 347
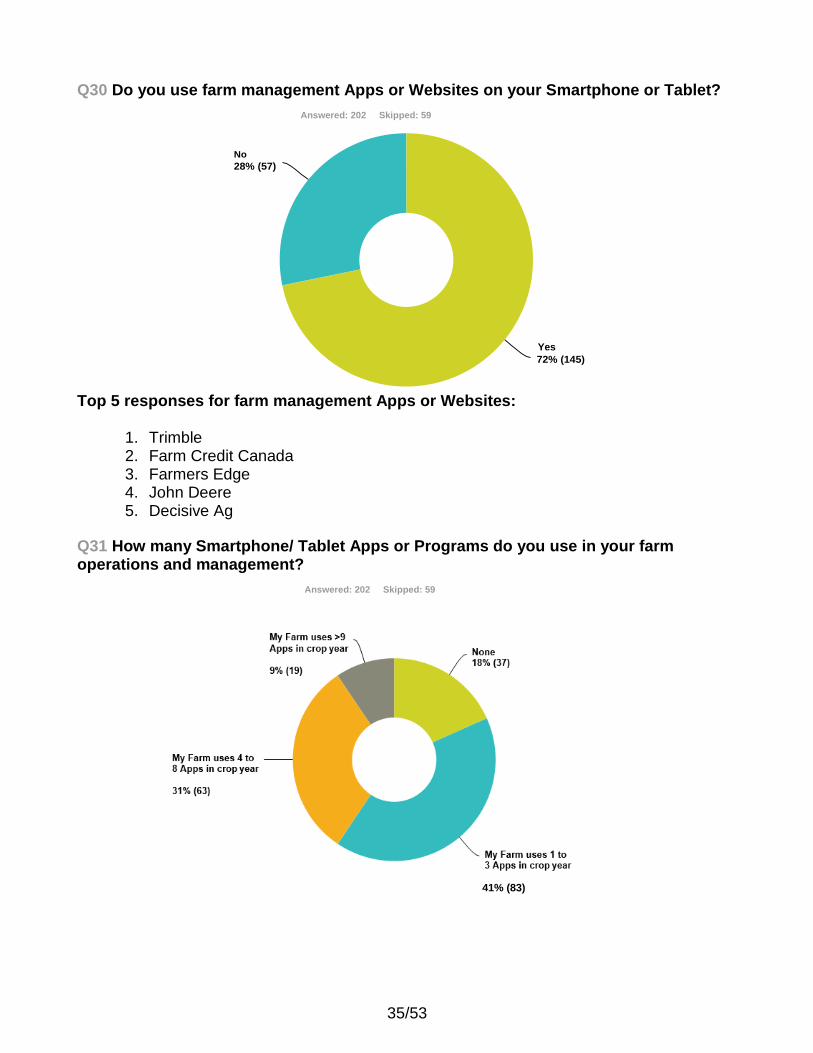
Q30 Do you use farm management Apps or Websites on your Smartphone or Tablet?
Answered: 202 Skipped: 59
No
28% (57)
Yes
72% (145)
Top 5 responses for farm management Apps or Websites:
1. Trimble 2. Farm Credit Canada 3. Farmers Edge 4. John Deere 5. Decisive Ag
Q31 How many Smartphone/ Tablet Apps or Programs do you use in your farm operations and management?
Answered: 202 Skipped: 59
41% (83)
36/53 347
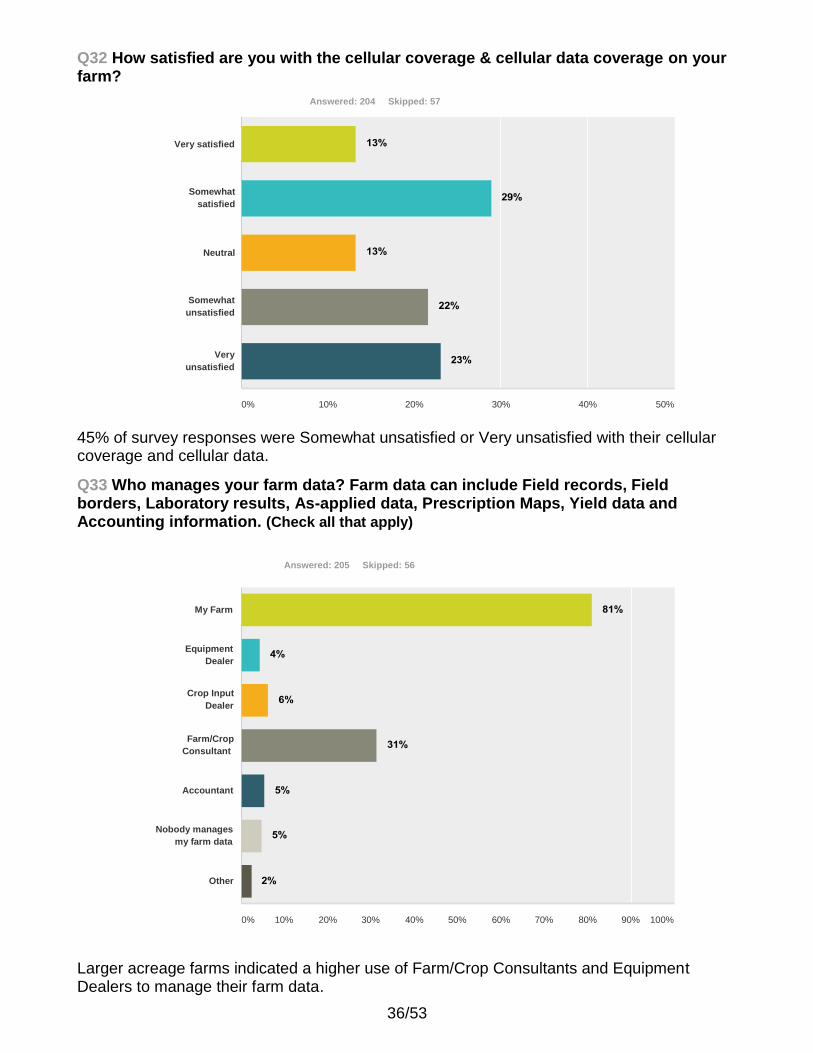
Q32 How satisfied are you with the cellular coverage & cellular data coverage on your farm?
Answered: 204 Skipped: 57
Very satisfied
Somewhat
satisfied
Neutral
Somewhat
unsatisfied
Very
unsatisfied
0% 10% 20% 30% 40% 50%
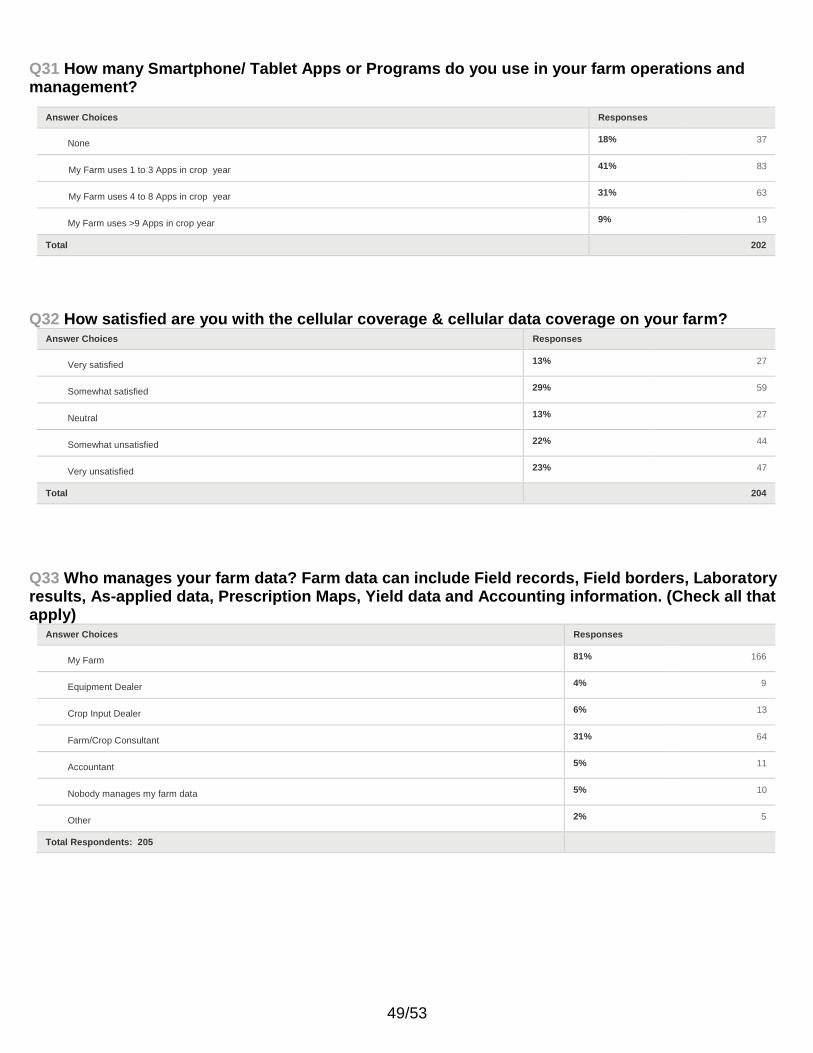
45% of survey responses were Somewhat unsatisfied or Very unsatisfied with their cellular coverage and cellular data.
Q33 Who manages your farm data? Farm data can include Field records, Field borders, Laboratory results, As-applied data, Prescription Maps, Yield data and Accounting information. (Check all that apply)
Answered: 205 Skipped: 56
My Farm
Equipment
Dealer
Crop Input
Dealer
Farm/Crop
Consultant
Accountant
Nobody manages
my farm data
Other
0% 10% 20% 30% 40% 50% 60% 70% 80% 90% 100%
Larger acreage farms indicated a higher use of Farm/Crop Consultants and Equipment Dealers to manage their farm data.

37/53 347
Q34 Who do you feel comfortable sharing your farm precision ag data with? (Check all that apply)
Answered: 201 Skipped: 60
Relatives
Farmers or
Neighbours
Equipment
dealers
Equipment
manufacturers
Crop Input
suppliers
Crop Input
manufacturers
Local
cooperatives
Grower
associations
University
researchers
Government
Nobody outside
my Farm
0% 10% 20% 30% 40% 50% 60%
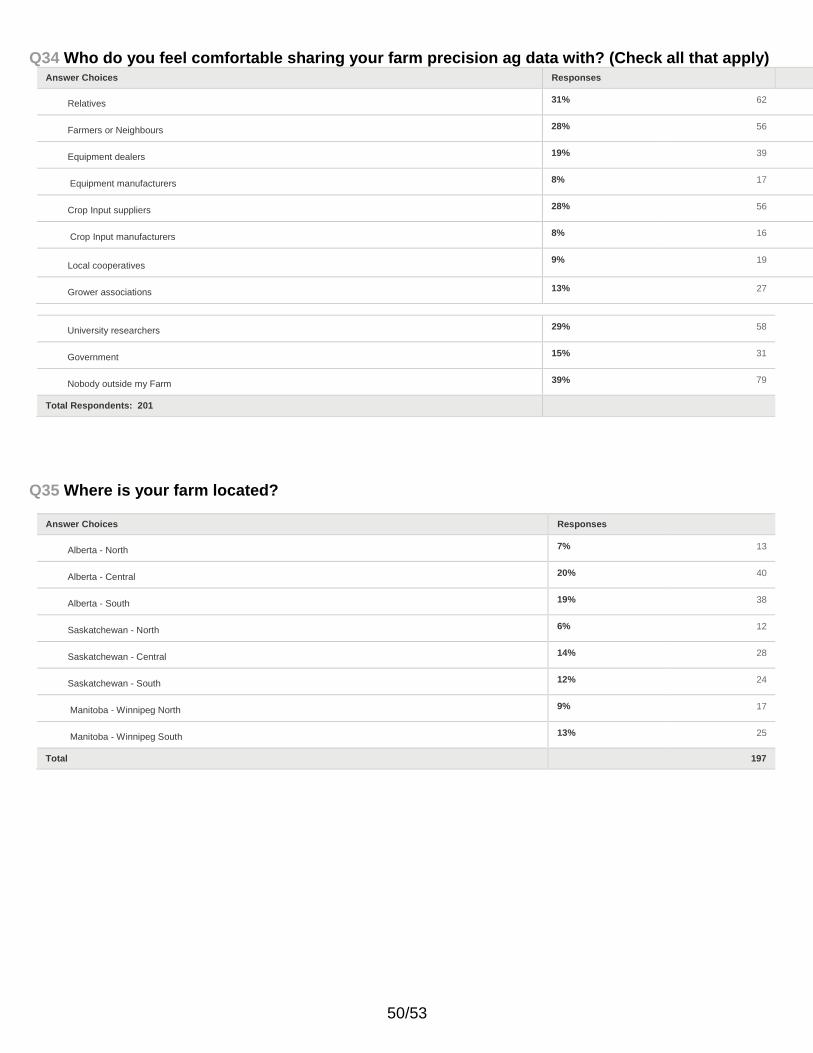
Top 5 responses of Who you feel comfortable sharing your farm precision ag data with:
1. Nobody outside my farm 2. Relatives 3. University researchers 4. Crop input suppliers 5. Farmers or neighbours

38/53 347
4 Barriers to Adoption in western Canada. Survey question 4 asked respondents what they consider as the barriers or limitations affecting farm adoption of precision agriculture technology. Respondents were provided with 16 choices for ranking the items which the respondent considered as barriers to them. The Top five barriers to PA adoption in the survey responses were:
Price
Internet speeds and/or cellular coverage
Lack of knowledgeable people
Continuously evolving technology
Older farm equipment
5 Conclusions PA is comprised of a wide segment of tools and technologies and it appears that the adoption of PA tools and technologies in western Canada is strong based on the survey responses. All farms are selective in their use of crop inputs, striving to apply them accurately, making
management decisions and measuring results. GPS guidance of farm equipment appears to
now be universally adopted with 98% of respondents using GPS for guidance and the rapid
adoption of more accurate forms like Auto-Steer and Automatic Sectional Control. Many of
the sensors to monitor weather and crops are now in place and the tools to measure the
soils, water, vegetation and yields are fully understood. Each year, more of the farm
equipment fleet is capable of capturing data and the systems become more user friendly and
reliable for technicians and precision agronomists to process the data into actionable
outcomes for the farmer.
The ongoing development of the PA infrastructure is also required to enable the efficient transport of the inputs and outputs of agricultural production. These inputs and outputs are data, information and knowledge. In rural areas, the development of railway, highway and road infrastructure has enabled the efficient transport of the inputs and outputs of agricultural production in western Canada and the speed of the movement to and from the farm is a critical part of price competitiveness.
39/53 347
An emerging issue in PA is the lack of developers focused on agriculture to create the
software, platforms and applications that reduce the data complexity to provide actionable
information to meet stakeholder needs.
6 References:
Stats Canada 2011 http://www.statcan.gc.ca/eng/ca2011/index
CRTC http://www.crtc.gc.ca/eng/internet/internetcanada.htm
USDA released a report on Farm Profits and Adoption of Precision Agriculture www.ers.usda.gov
CropLife magazine and Purdue University conducted the 17th Survey of Precision Agriculture Service Dealerships. 2015 Purdue survey results: http://agribusiness.purdue.edu/precision-ag-survey
40/53 347
7 Appendix: Survey Response Detail
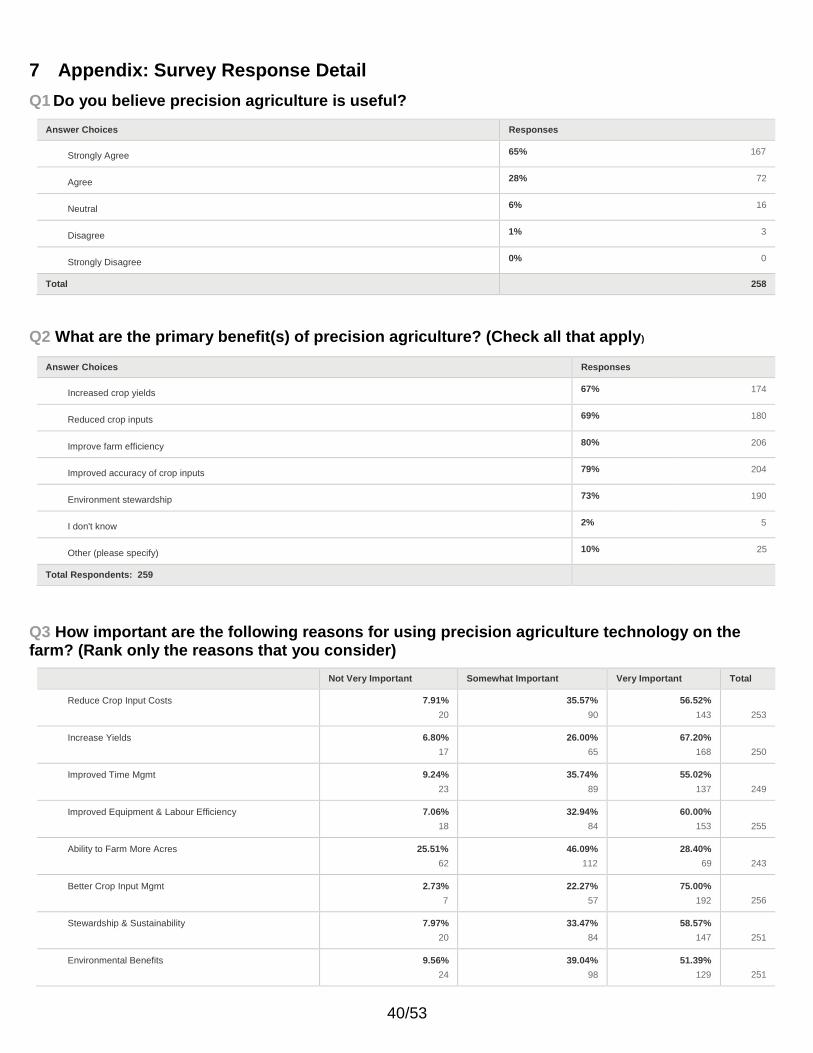
Q1 Do you believe precision agriculture is useful?
Answer Choices Responses
Strongly Agree 65% 167
Agree 28% 72
Neutral 6% 16
Disagree 1% 3
Strongly Disagree 0% 0
Total 258
Q2 What are the primary benefit(s) of precision agriculture? (Check all that apply)
Answer Choices Responses
Increased crop yields 67% 174
Reduced crop inputs 69% 180
Improve farm efficiency 80% 206
Improved accuracy of crop inputs 79% 204
Environment stewardship 73% 190
I don't know 2% 5
Other (please specify) 10% 25
Total Respondents: 259
Q3 How important are the following reasons for using precision agriculture technology on the farm? (Rank only the reasons that you consider)
Not Very Important Somewhat Important Very Important Total
Reduce Crop Input Costs 7.91%
20
35.57%
90
56.52%
143
253
Increase Yields 6.80%
17
26.00%
65
67.20%
168
250
Improved Time Mgmt 9.24%
23
35.74%
89
55.02%
137
249
Improved Equipment & Labour Efficiency 7.06%
18
32.94%
84
60.00%
153
255
Ability to Farm More Acres 25.51%
62
46.09%
112
28.40%
69
243
Better Crop Input Mgmt 2.73%
7
22.27%
57
75.00%
192
256
Stewardship & Sustainability 7.97%
20
33.47%
84
58.57%
147
251
Environmental Benefits 9.56%
24
39.04%
98
51.39%
129
251
41/53 347
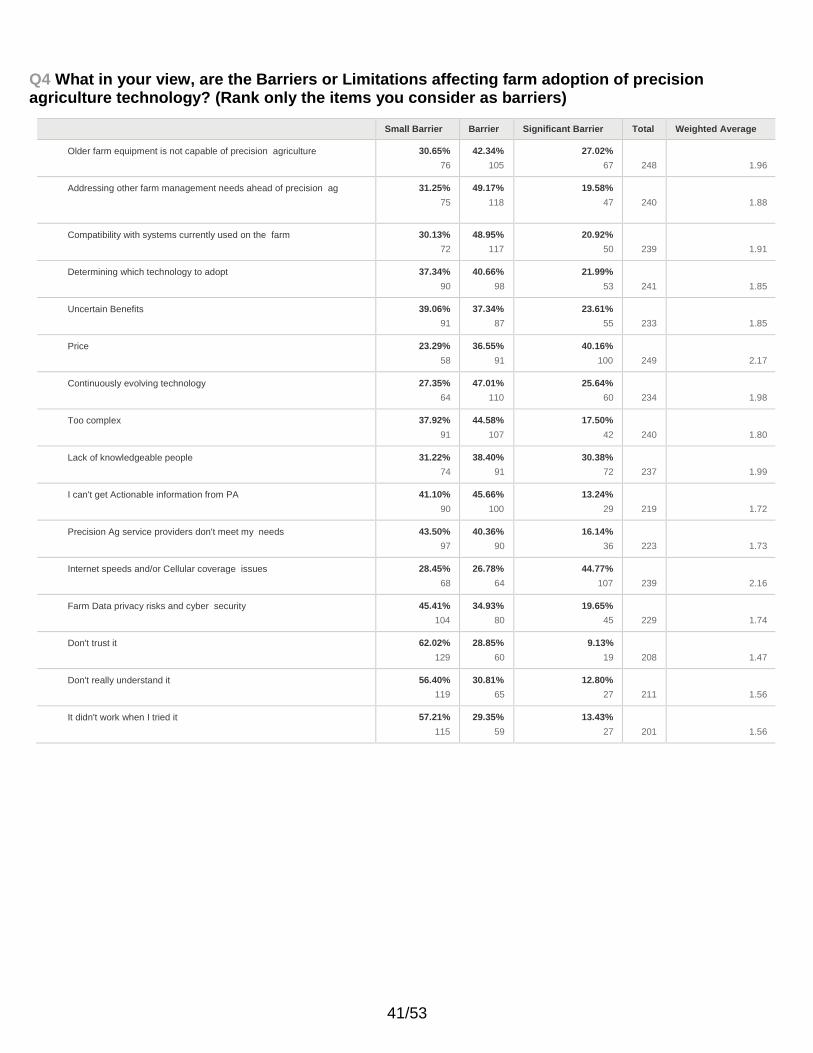
Q4 What in your view, are the Barriers or Limitations affecting farm adoption of precision agriculture technology? (Rank only the items you consider as barriers)
Small Barrier Barrier Significant Barrier Total Weighted Average
Older farm equipment is not capable of precision agriculture 30.65%
76
42.34%
105
27.02%
67
248
1.96
Addressing other farm management needs ahead of precision ag 31.25%
75
49.17%
118
19.58%
47
240
1.88
Compatibility with systems currently used on the farm 30.13%
72
48.95%
117
20.92%
50
239
1.91
Determining which technology to adopt 37.34%
90
40.66%
98
21.99%
53
241
1.85
Uncertain Benefits 39.06%
91
37.34%
87
23.61%
55
233
1.85
Price 23.29%
58
36.55%
91
40.16%
100
249
2.17
Continuously evolving technology 27.35%
64
47.01%
110
25.64%
60
234
1.98
Too complex 37.92%
91
44.58%
107
17.50%
42
240
1.80
Lack of knowledgeable people 31.22%
74
38.40%
91
30.38%
72
237
1.99
I can't get Actionable information from PA 41.10%
90
45.66%
100
13.24%
29
219
1.72
Precision Ag service providers don't meet my needs 43.50%
97
40.36%
90
16.14%
36
223
1.73
Internet speeds and/or Cellular coverage issues 28.45%
68
26.78%
64
44.77%
107
239
2.16
Farm Data privacy risks and cyber security 45.41%
104
34.93%
80
19.65%
45
229
1.74
Don't trust it 62.02%
129
28.85%
60
9.13%
19
208
1.47
Don't really understand it 56.40%
119
30.81%
65
12.80%
27
211
1.56
It didn't work when I tried it 57.21%
115
29.35%
59
13.43%
27
201
1.56
42/53 347
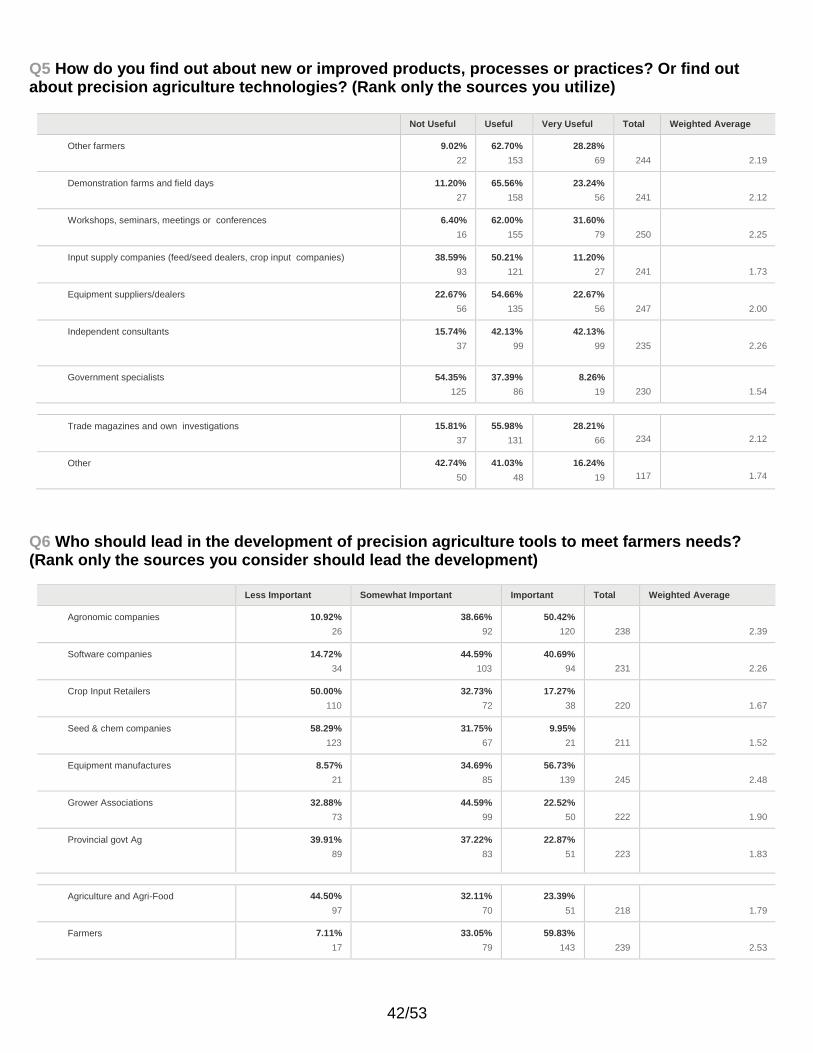
Q5 How do you find out about new or improved products, processes or practices? Or find out about precision agriculture technologies? (Rank only the sources you utilize)
Not Useful Useful Very Useful Total Weighted Average
Other farmers 9.02%
22
62.70%
153
28.28%
69
244
2.19
Demonstration farms and field days 11.20%
27
65.56%
158
23.24%
56
241
2.12
Workshops, seminars, meetings or conferences 6.40%
16
62.00%
155
31.60%
79
250
2.25
Input supply companies (feed/seed dealers, crop input companies) 38.59%
93
50.21%
121
11.20%
27
241
1.73
Equipment suppliers/dealers 22.67%
56
54.66%
135
22.67%
56
247
2.00
Independent consultants 15.74%
37
42.13%
99
42.13%
99
235
2.26
Government specialists 54.35%
125
37.39%
86
8.26%
19
230
1.54
Trade magazines and own investigations 15.81%
37
55.98%
131
28.21%
66
234
2.12
Other 42.74%
50
41.03%
48
16.24%
19
117
1.74
Q6 Who should lead in the development of precision agriculture tools to meet farmers needs? (Rank only the sources you consider should lead the development)
Less Important Somewhat Important Important Total Weighted Average
Agronomic companies 10.92%
26
38.66%
92
50.42%
120
238
2.39
Software companies 14.72%
34
44.59%
103
40.69%
94
231
2.26
Crop Input Retailers 50.00%
110
32.73%
72
17.27%
38
220
1.67
Seed & chem companies 58.29%
123
31.75%
67
9.95%
21
211
1.52
Equipment manufactures 8.57%
21
34.69%
85
56.73%
139
245
2.48
Grower Associations 32.88%
73
44.59%
99
22.52%
50
222
1.90
Provincial govt Ag 39.91%
89
37.22%
83
22.87%
51
223
1.83
Agriculture and Agri-Food 44.50%
97
32.11%
70
23.39%
51
218
1.79
Farmers 7.11%
17
33.05%
79
59.83%
143
239
2.53
43/53 347
Q7 What should be the role of government in precision agriculture now and in the future?
Q8 Is your farm currently using precision agriculture tools and/or services? Answer Choices Responses
Yes, on my entire farm 48% 98
Yes, but only on a portion of my farm 37% 76
No, I tried it but stopped 5% 10
No, I haven't tried it yet 11% 22
Total 206
Q9 How much did your farm spend on precision agriculture in 2016? ($ without decimals or non-numeric characters)
Answered: 155 Skipped: 106
Answer Choices Average Number Total Number Responses
Total Dollars $ 23,974 $ 3,404,259 142
$ Per Acre $ 6.74 126
Total Respondents: 155
Q10 Do you intend to use more precision agriculture tools in the future?
Answer Choices Responses
Yes 75% 154
No 7% 14
Undecided 18% 36
Total 204
Q11 Over the next 2 years, what area of technology would benefit your business the most? Answer Choices Responses
Sensors to monitor & collect farm data 27% 55
Data automation (so I don't have to type) 15% 31
Crop monitoring with weekly observations of fields 17% 34
Data analytics providing real time actions to follow 19% 38
Autonomous equipment 12% 24
Other 9% 19
Total 201
44/53 347
Q12 What are the primary soil nutrient assessment methods you use on your farm? (Check all that apply)
Answer Choices Responses
Rarely soil sample 9% 19
Assess prior crop response 43% 88
Tissue test 18% 37
Composite sampling 35% 72
Benchmark sampling 10% 20
Grid Sampling 17% 35
Zone sampling 43% 89
Total Respondents: 206
Q13 What percent of your Farm’s crop acreage was soil sampled in 2016? (Slide the dot to the % of farm)
Answer Choices Average Number Total Number Responses
63 11,910 190
Total Respondents: 190
Q14 Did someone capture the GPS coordinates of the soil sampling and/or plant tissue sampling locations in the field to enable future sampling from the same location in the field?
Answer Choices Responses
Yes 69% 138
No 25% 50
I don't know 6% 11
Total 199
Q15 Do you use GPS guidance systems for your farm operation? (Check all that apply) Answer Choices Responses
Yes, GPS guidance with light bar 15% 30
Yes, GPS guidance with visual screen 24% 50
Yes, Auto-Steer GPS 79% 162
Yes, RTK GPS – dealers base station 8% 16
Yes, RTK GPS – my base station 16% 33
No GPS guidance on my farm 2% 5
Total Respondents: 205
45/53 347
Q16 For which of the following farm operations do you use GPS guidance? (Check all that apply) Answer Choices Responses
Tillage 64% 131
Fertilize 85% 173
Seed 96% 196
Spray 94% 192
Swath 68% 139
Combine 69% 140
Heavy Harrow 67% 136
Other 15% 30
Total Respondents: 204
Q17 Did you use Automatic Section Control (ASC) to automatically turn On/Off the equipment booms or nozzle sections and/or planter units in 2016 for these activities?
Answer Choices Responses
Yes, for Seeding 26% 52
Yes, for Fertilizer 36% 72
Yes, for Spraying 70% 142
No, I don't have Section Control 27% 55
Total Respondents: 202
Q18 Did you use Prescription Maps and/or Variable-Rate Technology (VRT) to apply variable rates or unique rates to your fields in 2016 for any of the following?
Answer Choices Responses
No 49% 99
Yes, for Fertilizer 48% 98
Yes, for Seeding 24% 48
Yes, for Spraying 11% 22
Yes, for Irrigation 5% 10
Other (please specify) 3% 6
Total Respondents: 203
Q19 Do you have Digital Field Borders or electronic Field Boundaries of your farm fields? Answer Choices Responses
Yes, in Software / App / Website access 37% 76
Yes, in Equipment displays/controllers 59% 120
No 27% 56
Total Respondents: 204
46/53 347
Q20 In 2016, did you look at Imagery or Maps of your farm fields? (Check all that apply) Answer Choices Responses
Yes, historic aerial photos 35% 72
Yes, Google Earth 59% 120
Yes, NIR or NDVI 30% 61
Yes, Soil EC Maps 19% 38
Yes, Topo or Drainage 32% 65
Yes, Combine Yield Maps 50% 102
No 17% 35
Total Respondents: 205
Q21 In 2016, did you look at In-Season Crop Imagery or Remote Sensing of your crops and fields? (Check all that apply)
Answer Choices Responses
Yes, captured by Satellite 28% 56
Yes, captured by Airplane 2% 5
Yes, captured by UAV/Drone 19% 39
Yes, captured by Equipment device 6% 12
Yes, captured by hand-held device 4% 9
No 59% 119
Total Respondents: 203
Q22 In 2016, the combine(s) that harvested your fields... (Check all that apply) Answer Choices Responses
Basic Yield Monitor 37% 75
NO Yield Monitor 16% 32
Grain cart load cells 38% 77
Yield Monitor with GPS 60% 121
Yield Data Logged & Stored 50% 102
Yield Maps Created from Data 48% 96
Total Respondents: 202
47/53 347
Q23 How did you transfer your yield data or equipment data from the farm equipment to a computer?
Answer Choices Responses
Data not transferred yet, still in Equipment 20% 40
Manual transfer using USB stick/CF memory card 44% 90
Wireless transfer with cellular modem 11% 23
Wireless transfer with WI-FI connection 2% 5
I don't have Equipment data 23% 46
Total 204
Q24 Does your farm have Temperature and/or Moisture sensors to monitor the stored grain in bins?
Answer Choices Responses
Yes, on 100% of my stored grain 13% 27
Yes, on 75% of my stored grain 22% 44
Yes, on 50% of my stored grain 17% 34
Yes, on 25% of my stored grain 17% 34
No 32% 65
Total 204
Q25 What is your primary method to record weather information for the farm?
Answer Choices Responses
Traditional rain gauge & thermometer 32% 66
Electronic weather station 28% 58
Free weather info government networks 21% 43
Free weather info private networks 8% 17
Paid Weather info service provider 10% 20
Total 204
Q26 Which of these tools do you use for farm business management? (Check all that apply)
Answer Choices Responses
Desktop computer 59% 120
Laptop computer 73% 148
Tablet 62% 127
Smartphone 89% 182
None 2% 4
48/53 347
Total Respondents: 204
Q27 Do you use farm management software on your computer?
Answer Choices Responses
Yes 70% 142
No 30% 62
Total 204
Q28 How do you connect to the Internet for your farm business? Answer Choices Responses
Dial-up Connection 0% 1
DSL (digital subscriber line) 8% 17
Cable Modem 8% 17
Fixed Wireless 46% 95
Mobile Wireless 44% 91
Satellite Service 19% 39
Fiber Optic 5% 11
Free WiFi (coffee shop) 1% 3
I don't know 1% 2
I don't Internet 1% 3
Total Respondents: 205
Q29 How satisfied are you with the internet service & internet speed on your farm? Answer Choices Responses
Very satisfied 11% 22
Somewhat satisfied 25% 51
Neutral 11% 22
Somewhat unsatisfied 25% 51
Very unsatisfied 27% 55
I don't have Internet 2% 4
Total 205
Q30 Do you use farm management Apps or Websites on your Smartphone or Tablet? Answer Choices Responses
Yes 72% 145
No 28% 57
Total 202
49/53 347
Q31 How many Smartphone/ Tablet Apps or Programs do you use in your farm operations and management?
Answer Choices Responses
None 18% 37
My Farm uses 1 to 3 Apps in crop year 41% 83
My Farm uses 4 to 8 Apps in crop year 31% 63
My Farm uses >9 Apps in crop year 9% 19
Total 202
Q32 How satisfied are you with the cellular coverage & cellular data coverage on your farm? Answer Choices Responses
Very satisfied 13% 27
Somewhat satisfied 29% 59
Neutral 13% 27
Somewhat unsatisfied 22% 44
Very unsatisfied 23% 47
Total 204
Q33 Who manages your farm data? Farm data can include Field records, Field borders, Laboratory results, As-applied data, Prescription Maps, Yield data and Accounting information. (Check all that apply)
Answer Choices Responses
My Farm 81% 166
Equipment Dealer 4% 9
Crop Input Dealer 6% 13
Farm/Crop Consultant 31% 64
Accountant 5% 11
Nobody manages my farm data 5% 10
Other 2% 5
Total Respondents: 205
50/53 347
Q34 Who do you feel comfortable sharing your farm precision ag data with? (Check all that apply)
Answer Choices Responses
Relatives 31% 62
Farmers or Neighbours 28% 56
Equipment dealers 19% 39
Equipment manufacturers 8% 17
Crop Input suppliers 28% 56
Crop Input manufacturers 8% 16
Local cooperatives
9% 19
Grower associations 13% 27
University researchers 29% 58
Government 15% 31
Nobody outside my Farm 39% 79
Total Respondents: 201
Q35 Where is your farm located?
Answer Choices Responses
Alberta - North 7% 13
Alberta - Central 20% 40
Alberta - South 19% 38
Saskatchewan - North 6% 12
Saskatchewan - Central 14% 28
Saskatchewan - South 12% 24
Manitoba - Winnipeg North 9% 17
Manitoba - Winnipeg South 13% 25
Total 197
51/53 347
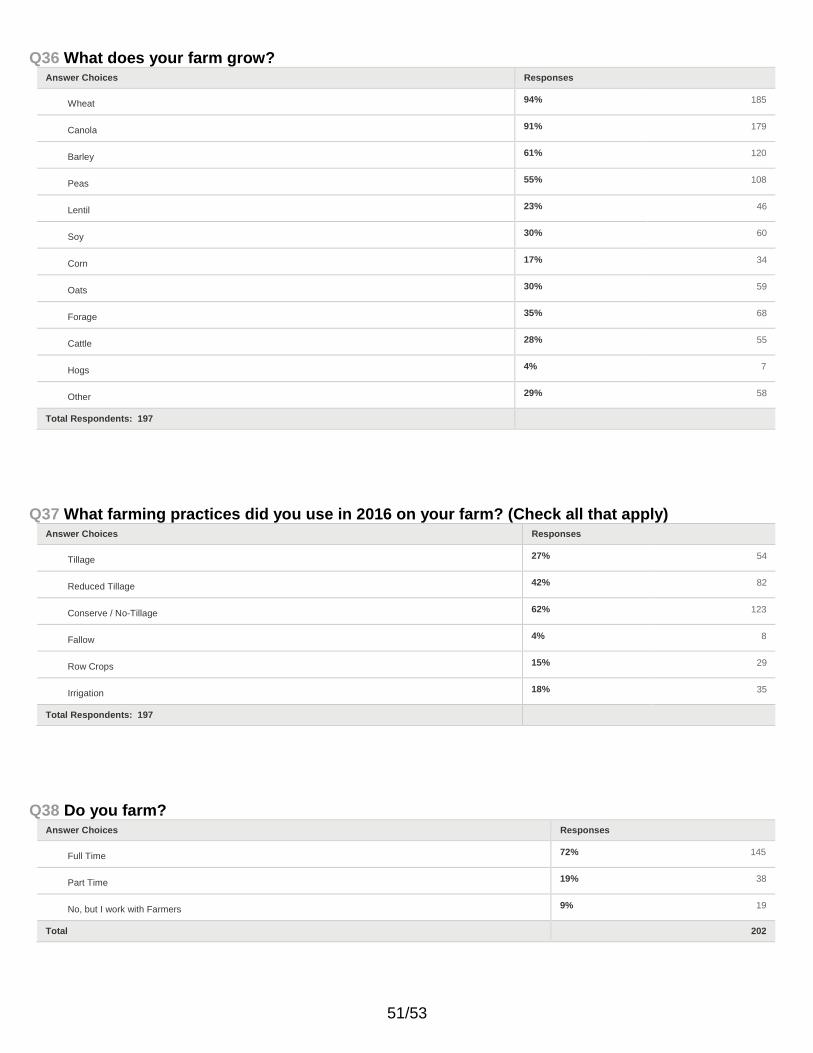
Q36 What does your farm grow? Answer Choices Responses
Wheat 94% 185
Canola 91% 179
Barley 61% 120
Peas 55% 108
Lentil 23% 46
Soy 30% 60
Corn 17% 34
Oats 30% 59
Forage 35% 68
Cattle 28% 55
Hogs 4% 7
Other 29% 58
Total Respondents: 197
Q37 What farming practices did you use in 2016 on your farm? (Check all that apply) Answer Choices Responses
Tillage 27% 54
Reduced Tillage 42% 82
Conserve / No-Tillage 62% 123
Fallow 4% 8
Row Crops 15% 29
Irrigation 18% 35
Total Respondents: 197
Q38 Do you farm? Answer Choices Responses
Full Time 72% 145
Part Time 19% 38
No, but I work with Farmers 9% 19
Total 202
52/53 347
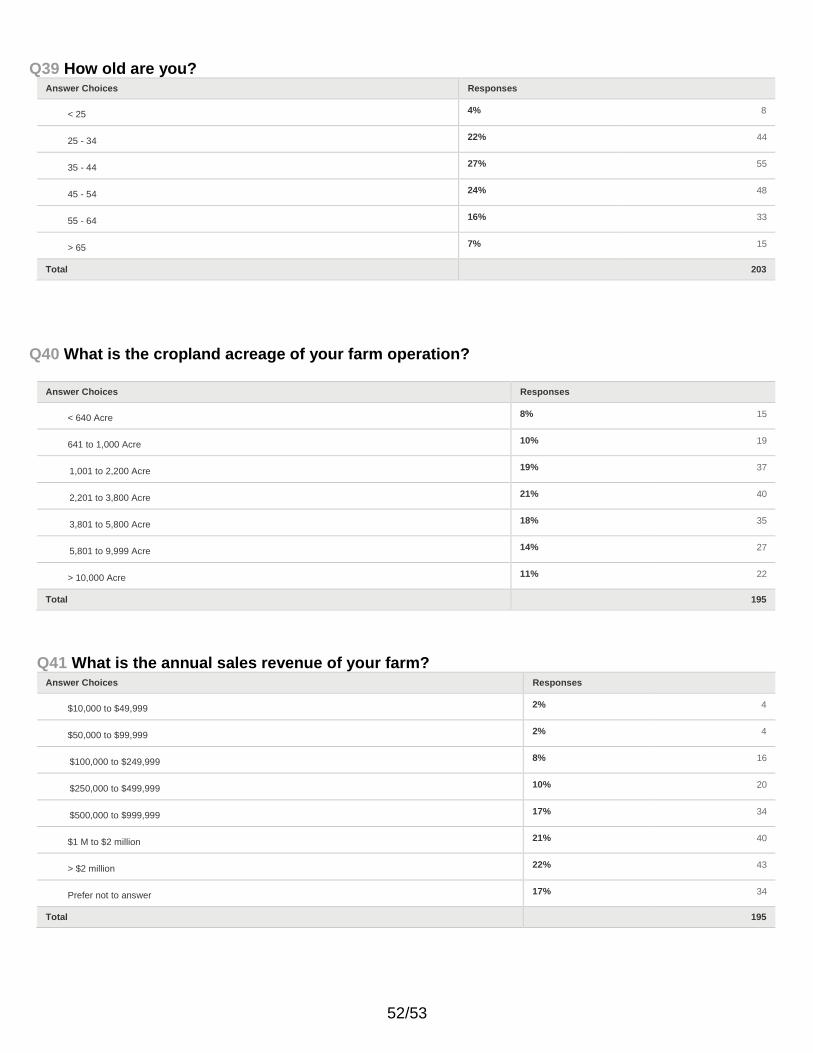
Q39 How old are you? Answer Choices Responses
< 25 4% 8
25 - 34 22% 44
35 - 44 27% 55
45 - 54 24% 48
55 - 64 16% 33
> 65 7% 15
Total 203
Q40 What is the cropland acreage of your farm operation?
Answer Choices Responses
< 640 Acre 8% 15
641 to 1,000 Acre 10% 19
1,001 to 2,200 Acre 19% 37
2,201 to 3,800 Acre 21% 40
3,801 to 5,800 Acre 18% 35
5,801 to 9,999 Acre 14% 27
> 10,000 Acre 11% 22
Total 195
Q41 What is the annual sales revenue of your farm? Answer Choices Responses
$10,000 to $49,999 2% 4
$50,000 to $99,999 2% 4
$100,000 to $249,999 8% 16
$250,000 to $499,999 10% 20
$500,000 to $999,999 17% 34
$1 M to $2 million 21% 40
> $2 million 22% 43
Prefer not to answer 17% 34
Total 195

53/53 347
Q42 What is your farm business structure?
Answer Choices Responses
Sole proprietorship 20% 40
Partnership 20% 39
Joint Venture 5% 9
Communal ownership 3% 5
Incorporated company 53% 103
Total 196