Analysis of Phthalate Migration to Food Simulants in Plastic Containers during Microwave Operations
20
Int. J. Environ. Res. Public Health 2014, 11, 507-526; doi:10.3390/ijerph110100507 International Journal of Environmental Research and Public Health ISSN 1660-4601 www.mdpi.com/journal/ijerph Article Analysis of Phthalate Migration to Food Simulants in Plastic Containers during Microwave Operations Miriany A. Moreira 1 , Leiliane C. André 2 and Zenilda L. Cardeal 1, * 1 Departamento de Química, ICEx, Universidade Federal de Minas Gerais; Av. Antônio Carlos 6627, Pampulha, 31270-901, Belo Horizonte, MG, Brazil; E-Mail: [email protected] 2 Departamento de Análises Clínicas e Toxicológicas, FAFAR, Universidade Federal de Minas Gerais, Av. Antônio Carlos, 6627, Pampulha, 31270-901, Belo Horizonte, MG, Brazil; E-Mail: [email protected] * Author to whom correspondence should be addressed; E-Mail: [email protected]; Tel.: +55-31-3409-5725; Fax: +55-31-3409-5700. Received: 30 September 2013; in revised form: 17 December 2013 / Accepted: 18 December 2013 / Published: 30 December 2013 Abstract: Phthalates used as plasticizers in the manufacture of household containers can potentially be transferred to foods that are stored or heated in these plastic containers. Phthalates are endocrine disruptor compounds (EDC) and are found in very low concentrations in foods, thus, highly sensitive analytical techniques are required for their quantification. This study describes the application of a new method developed for analyzing the migration of dibutylphthalate (DBP) and benzylbutylphthalate (BBP) from plastic food containers into liquid food simulants. This new method employs the technique of solid phase microextraction cooled with liquid nitrogen. The analysis was conducted by gas chromatography/mass spectrometry (GC/MS) using a polyacrylate fiber. Ultrapure water was used as a simulant for liquids foods, and both new and used plastic containers were placed in a domestic microwave oven for different periods of time at different power levels. The limits of detection for DBP and BBP were 0.08 μg/L and 0.31 μg/L, respectively. BBP was not found in the samples that were analyzed. DBP was found in concentrations ranging from <LOQ to 7.5 μg/L. In general, an increase in migration was observed in containers that were used for a prolonged time, which correlated with increasing heating time. OPEN ACCESS
Transcript of Analysis of Phthalate Migration to Food Simulants in Plastic Containers during Microwave Operations

Int. J. Environ. Res. Public Health 2014, 11, 507-526; doi:10.3390/ijerph110100507
International Journal of
Environmental Research and Public Health
ISSN 1660-4601 www.mdpi.com/journal/ijerph
Article
Analysis of Phthalate Migration to Food Simulants in Plastic Containers during Microwave Operations
Miriany A. Moreira 1, Leiliane C. André 2 and Zenilda L. Cardeal 1,*
1 Departamento de Química, ICEx, Universidade Federal de Minas Gerais; Av. Antônio Carlos 6627,
Pampulha, 31270-901, Belo Horizonte, MG, Brazil; E-Mail: [email protected] 2 Departamento de Análises Clínicas e Toxicológicas, FAFAR, Universidade Federal de Minas
Gerais, Av. Antônio Carlos, 6627, Pampulha, 31270-901, Belo Horizonte, MG, Brazil;
E-Mail: [email protected]
* Author to whom correspondence should be addressed; E-Mail: [email protected];
Tel.: +55-31-3409-5725; Fax: +55-31-3409-5700.
Received: 30 September 2013; in revised form: 17 December 2013 / Accepted: 18 December 2013 /
Published: 30 December 2013
Abstract: Phthalates used as plasticizers in the manufacture of household containers can
potentially be transferred to foods that are stored or heated in these plastic containers.
Phthalates are endocrine disruptor compounds (EDC) and are found in very low
concentrations in foods, thus, highly sensitive analytical techniques are required for their
quantification. This study describes the application of a new method developed for
analyzing the migration of dibutylphthalate (DBP) and benzylbutylphthalate (BBP) from
plastic food containers into liquid food simulants. This new method employs the technique
of solid phase microextraction cooled with liquid nitrogen. The analysis was conducted by
gas chromatography/mass spectrometry (GC/MS) using a polyacrylate fiber. Ultrapure water
was used as a simulant for liquids foods, and both new and used plastic containers were
placed in a domestic microwave oven for different periods of time at different power levels.
The limits of detection for DBP and BBP were 0.08 µg/L and 0.31 µg/L, respectively.
BBP was not found in the samples that were analyzed. DBP was found in concentrations
ranging from <LOQ to 7.5 µg/L. In general, an increase in migration was observed in
containers that were used for a prolonged time, which correlated with increasing heating time.
OPEN ACCESS

Int. J. Environ. Res. Public Health 2014, 11 508
Keywords: phthalates migration; cold solid phase microextraction; gas chromatography/
mass spectrometry; food simulant; dibutylphthalate; benzylbutylphthalate
1. Introduction
Phthalate diesters are widely used as plasticizers to increase the flexibility of plastics that are used
in the manufacturing of kitchen utensils and food containers [1]. These phthalates are not chemically
bonded to the polymeric matrix, which may allow the migration of these chemicals into food
substances [2]. Another source of food contamination is through contact with packaging printing inks
that contain phthalates [3]. These compounds are classified as endocrine disruptors (EDC) and can
affect the endocrine system, which consequently affects vital functions in living organisms [4].
Dibutylphthalate (DBP), bis-(2-ethylhexyl) phthalate (DEHP), benzylbutylphthalate (BBP),
and di-n-octylphthalate (DOP), among others, are examples of phthalates [5]. The greatest concern
regarding EDC is chronic exposure. Phthalates such as DBP have been associated with toxicity to the
neural, reproductive and developmental systems [6]. Studies in animals have shown that phthalates can
cause alterations to the kidneys and the liver, fetal malformation and fertility impairments [6–8].
In humans, exposure to phthalates such as DEHP and DBP can alter human sperm motility [9].
Other studies have also shown a correlation between endocrine disruptors and diseases related to the
endocrine system. A study by Kim et al. demonstrated a correlation between the amount of DEHP in
plasma samples and advanced stage endometriosis in women [10]. A study by Meeker and Ferguson
suggested associations between phthalates and altered thyroid hormone levels [11]. The European Food
Safety Authority (EFSA) has established the tolerable daily intake (TDI) for phthalates at 0.01 mg/kg
body weight per day for DBP, 0.5 mg/kg body weight per day for BBP, and 0.05 mg/kg body weight
per day for DEHP based on toxicological studies [12–14]. Phthalates are contaminants found in many
foods, such as olive oil, wine, and milk [15–17]. These compounds are present at low concentrations in
foods, which necessitates the development of highly sensitive analytical techniques for their
quantification. Sample pretreatment is necessary to extract and concentrate phthalates and to improve
analytical sensitivities. Techniques such as solid phase extraction (SPE), single drop microextraction
(SDME), dispersive liquid–liquid microextraction (DLLME), air-assisted liquid–liquid microextraction
(AALLME), liquid phase microextraction (LPME), and solid phase microextraction (SPME) may be
used for sample pretreatment. SPME has many advantages and is applied mainly when gas
chromatography is used. SPME consists of the use of a fiber for the extraction and concentration of an
analyte present in a sample. Various types of fiber materials can be used, such as polydimethylsiloxane
and polyacrylate. The extraction process consists of the adsorption/absorption of the analyte in a fiber.
This process is exothermic, and cooling the fiber accelerates the transfer of the analyte to the fiber.
The cooling of the fiber was initially evaluated by Ghiasvand et al., who used carbon dioxide to cool
the fiber [18]. A new cooling system was developed by Menezes et al. using liquid nitrogen to cool the
fiber [19]. In these cooling systems, there was an increase in the extraction efficiency of the analytes.
The sample can be heated simultaneously with fiber cooling to allow the release of the analyte.
Although they are antagonistic processes, the heating of the sample does not nullify the cooling of the

Int. J. Environ. Res. Public Health 2014, 11 509
fiber. The fiber is subsequently inserted into the GC injector for the desorption of analytes.
Several studies have attempted to determine the migration magnitude of chemical substances present in
food packaging materials. A study conducted by Gonzales-Castro et al. found concentrations of DBP
and DOP that migrated from plastic containers into food simulants of 0.023 µg/L and 0.664 µg/L,
respectively [20]. Kueseng et al. determined that the concentration of DEHP migrating from curry
packaging into curry was 0.61 µg/L [21]. Several studies have been conducted on the migration of
phthalates, but little is known about the migration of these compounds from food packaging when they
are subjected to different heating conditions in a microwave oven. Thus, this study conducted a
quantitative analysis of the migration of dibutylphthalate and benzylbutylphthalate into a food simulant
placed in plastic containers when these were subjected to different heating conditions. Water was used
to simulate liquid foods with a pH value of more than five.
2. Materials and Methods
2.1. Materials
The DBP and BBP standards that were used in this study were obtained from Sigma-Aldrich
(St. Louis, MO, USA). A stock solution at the concentration of 2.00 g/L per compound was prepared
in HPLC grade ethanol purchased from J.T. Baker (Xalostoc, Edo. de Mex., Mexico). The polyacrylate
fiber that was used in the experiment was obtained from Supelco (Bellefonte, PA, USA), and ultrapure
water was generated using an Elga Purifier, model Classic Purelab UVMK2 (High Wycombe, UK).
2.2. Extraction Method
The analytes were extracted by direct immersion extraction using an 85 μm polyacrylate fiber [22].
The extraction was conducted using a cold fiber solid phase microextraction (CF-SPME) [19].
The cryogenic system used in this study was cooling on the outside of the fiber, as shown in Figure 1.
A copper tube with a length of 70 cm, O.D. of 2.4 mm, and I.D. of 1.6 mm was used to transfer liquid
nitrogen from a Dewar flask to the SPME device. One end of the tube was inserted into the Dewar
flask through a rubber stopper, and the other end, composed of a 3 cm- spiral with a 2 mm I.D.,
held the needle of a manual SPME holder containing an 85 μm polyacrylate (PA) fiber. The rubber
stopper (4 mm top diameter and 3 mm bottom diameter) was used to cap the Dewar flask containing
0.5 L of liquid nitrogen. Another copper tube (10 cm length, 6.4 mm O.D. and 4.7 mm I.D.) was used
as a valve to control the nitrogen pressure in the Dewar flask; 0.5 L of liquid nitrogen was sufficient
for 3 h of cooling. By closing the valve, the liquid nitrogen evaporated slowly and passed through the
spiral at a constant rate, absorbing heat from the manual SPME holder and, hence, the fiber.
When the valve was open, the nitrogen was purged from the Dewar flask and no longer passed through
the spiral, thus terminating the cooling process. For the extraction, the cooled fiber was immersed in
22 mL Pyrex vials sealed with silicone/PTFE septa and aluminum caps containing the sample.
The vial was placed in an aluminum block with a controlled temperature and constant stirring.
The fiber was pre-conditioned for 1 h at 280 °C according to the manufacturer’s instructions.
For compound extraction, the sample (20.0 mL) was placed in a 22 mL vial and subjected to
continuous stirring with a magnetic stirring bar placed within the vial. A multivariate optimization of

Int. J. Environ. Res. Public Health 2014, 11 510
the extraction methodology was used to reduce the number of assays. The study of variables considered
significant for the experiment was conducted using a factorial design of 23. For this experiment,
the extraction time, extraction temperature and added salt concentration were varied at two levels
selected for the factorial design: 10 and 30 min, 25 °C and 65 °C, and 0% and 10% (w/v) of NaCl.
The central point was analyzed in triplicate with the following values for the variables: extraction time,
20 min; extraction temperature, 45 °C; and salt concentration, 5%. The standard solutions that were
used in the design of the experiments were at the concentration of 100 µg/L per compound. The fiber
was subsequently placed in the gas chromatograph for compound desorption at 250 °C for 2 min.
Figure 1. Schematic of the CF-SPME device.
2.3. Chromatographic System
The analysis of phthalates in the water that was used as a simulant liquid food was conducted using
a gas chromatographic system coupled to a mass spectrometer equipped with an ion trap analyzer
(Finnigan Trace GC/PolarisQ, Thermo, Austin, TX, USA). Chromatographic analysis was conducted
via injection in splitless mode for 2 min using a HP-5MS Agilent column
(30 m × 0.25 mm × 0.25 µm) with an injector temperature of 250 °C and a helium flow rate of
1.2 mL/min. The temperature ramp began at 105 °C for 1 min, increased to 180 °C at a rate of
3 °C/min, maintained for 4 min, further increased to 290 °C at a rate of 10 °C/min, and then maintained
for 0.5 min. The total running time was 41.5 min. The analysis was conducted in selected ion
monitoring (SIM) mode using electron ionization (EI) with an energy of 70 eV. The mass/charge (m/z)
ratios that were monitored were 149, 150 and 41 for DBP and 206, 149 and 91 for BBP.

Int. J. Environ. Res. Public Health 2014, 11 511
2.4. Analysis Conditions
To evaluate the migration of phthalates into liquid food, ultrapure water was used as a simulant
according to Brazilian legislation. The European legislation EU Regulation 10/2011 [23] considers
ethanol 10% (v/v) to be a simulant for liquid food; however, the Brazilian Health Ministry document
No. 26/MS/SVS was followed and it specifies that water is an adequate simulant for liquid foods
possessing pH values more than 5 [24].
This study tested ten polypropylene (PP) containers of different sizes that were suitable for use in
microwave ovens. All of the containers studied were from different brands. Five of these containers
were newly purchased for this study, and the other five were containers that had been exposed to
long-term use of approximately one year. Plastic containers used in the microwave ovens tend to undergo
small deformations with time due to the repeated heating of the material, hence, the used containers
already contained some small deformations. The containers were filled with ultrapure water to 90% of
their total volumes. Subsequently, they were placed in a domestic microwave oven (700 W power)
where the water was then heated at various powers (high, 700 W; medium, 350 W; and low, 210 W)
and heating durations. The migration of phthalates into the simulant was evaluated at these operating
powers at heating durations of 1, 3, 5, and 7 min. For low power, the migration was evaluated at
heating durations of 10, 15, 20, and 30 min. The power and heating duration conditions were chosen
based on the conditions that are commonly used in everyday life, where the high power level is used
for cooking food, the medium power level is used for heating food, and the low power level is used for
thawing food, which requires a longer heating period. Samples in which the phthalate concentrations
were beyond the range of the calibration curve were diluted to 50% with ultrapure water.
The characteristics of the containers that were used are shown in Table 1.
Table 1. Characteristics of the plastic containers that were used.
Plastic Containers Volume (mL) Characteristics
A 1 750 colorless, size: 10.5 cm (dm) × 11.0 cm (h) B 1 500 red translucent, size: 10.5 cm (dm) × 6.2 cm (h) C 1 600 colorless, size: 13.2 cm × 13.2 cm × 4.8 cm D 1 1,200 colorless, size: 12.6 cm × 12.6 cm × 11.0 cm E 1 480 colorless, size: 12.5 cm × 9.3 cm × 5.3 cm F 2 600 colorless, size: 13.0 cm × 13.0 cm × 4.7 cm G 2 1,000 colorless, size: 13.7 cm × 10.0 cm × 2.7 cm H 2 600 colorless, size: 11.2 cm (dm) × 6.6 cm (h) I 2 1,200 colorless, size: 22.0 cm × 15.0 cm × 4.6 cm J 2 300 colorless, size: 13.8 cm (dm) × 7.9 cm (h)
Notes: 1 new containers; 2 containers that were used for prolonged periods of time.
Phthalates are contaminants that are present in various matrices such as water and air.
Additionally, it is possible that the plastic containers are cross contaminated with DBP from the
laboratory through contact with plastic materials. To avoid contamination, all glassware used was
washed in a special manner using Extran® (Merck, Darmstadt, Germany) followed by ethanol. A
sample blank was prepared and analyzed periodically to determine if there was background
Int. J. Environ. Res. Public Health 2014, 11 512
contamination. A low concentration of DBP was detected in the sample blank. This concentration was
smaller than the limit of quantification (LOQ); nevertheless, it was considered when determining the
compound in the samples and during the validation process.
3. Results and Discussion
3.1. Extraction Method
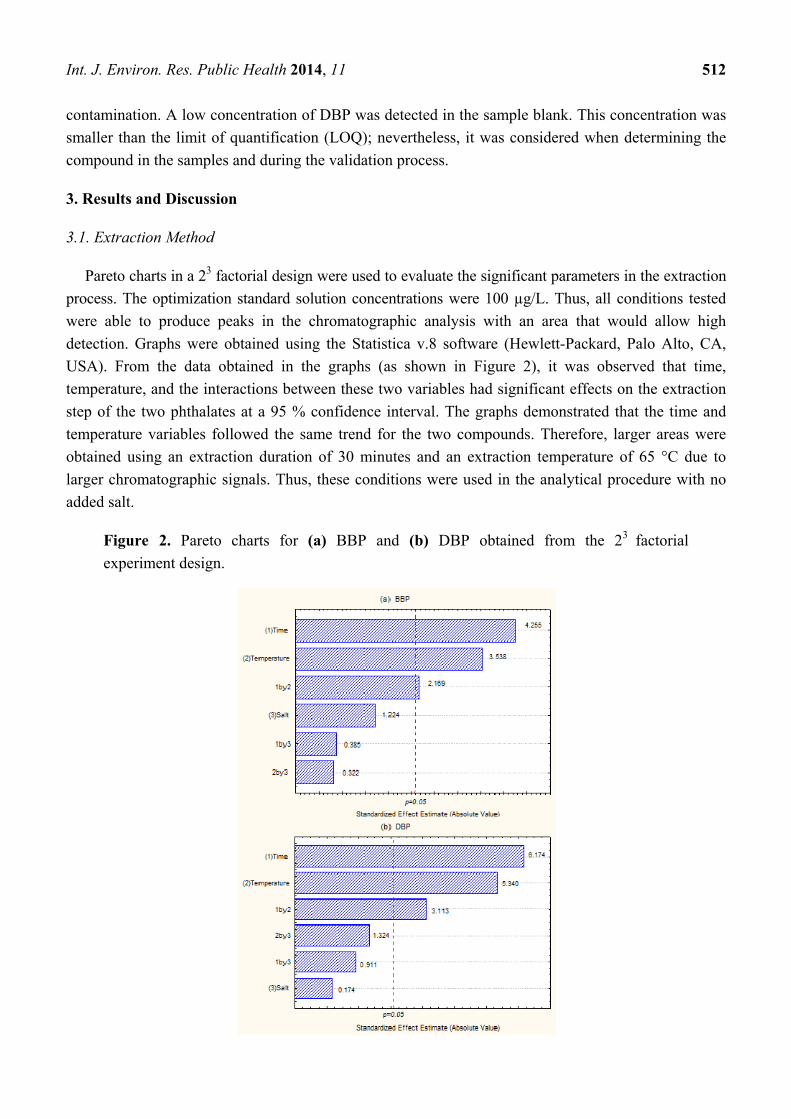
Pareto charts in a 23 factorial design were used to evaluate the significant parameters in the extraction
process. The optimization standard solution concentrations were 100 µg/L. Thus, all conditions tested
were able to produce peaks in the chromatographic analysis with an area that would allow high
detection. Graphs were obtained using the Statistica v.8 software (Hewlett-Packard, Palo Alto, CA,
USA). From the data obtained in the graphs (as shown in Figure 2), it was observed that time,
temperature, and the interactions between these two variables had significant effects on the extraction
step of the two phthalates at a 95 % confidence interval. The graphs demonstrated that the time and
temperature variables followed the same trend for the two compounds. Therefore, larger areas were
obtained using an extraction duration of 30 minutes and an extraction temperature of 65 °C due to
larger chromatographic signals. Thus, these conditions were used in the analytical procedure with no
added salt.
Figure 2. Pareto charts for (a) BBP and (b) DBP obtained from the 23 factorial
experiment design.

Int. J. Environ. Res. Public Health 2014, 11 513
3.2. Analytical Validations
The parameters of merit were evaluated according to EURACHEM guidelines [25]. The limit of
detection (LOD), LOQ, intra- and inter-assay precisions and linearity were determined. The linearity
ranges that were observed were 0.2 to 6.0 µg/L for DBP and 0.5 to 6.0 µg/L for BBP. The calibration
curve was constructed from the analysis of standards at six different concentrations (0.2, 1.0, 2.0, 4.0,
5.0 and 6.0 µg/L for DBP and 0.5, 1.0, 2.0, 4.0, 5.0 and 6.0 µg/L for BBP) in triplicate for each point.
To evaluate the linearity of the curve obtained, the following statistical tests were applied: normality of
residues (Ryan-Joiner Test), independence of residues (Durbin-Watson Test), homoscedasticity of
residues (Brown-Forsythe Test), significance regression, and deviation from linearity based on an
analysis of variance (ANOVA) test [26]. The tests performed demonstrated that the residues followed
a normal distribution were independent, and possessed homoscedasticity. The ANOVA test indicated
that the regression was significant and that there was no deviation from linearity. Therefore, the linear
regression was used for the quantification of phthalates. The equations and the determination
coefficients that were obtained from linear regression are shown in Table 2.
Table 2. Equations and determination coefficients for DBP and BBP.
Compound Linear Range (µg/L)
Equation SD
Intercept SD
Slope
Coefficient of Determination
(R2)
DBP 0.2 to 6.0 y = 55,438x + 14,941 5,007 1,354 0.9905 BBP 0.5 to 6.0 y = 29,500x – 4,882.9 3,322 897 0.9854
The LOQs were determined according to EURACHEM, and were considered the lowest points on
the calibration curves. LOD areas were obtained from the calibration curves according to the mean
blank response plus three times the standard deviation. Accuracy tests were evaluated at two different
concentrations along the curve, which were 1.0 and 5.0 µg/L. Table 3 displays the LODs, the LOQs,
and the accuracies that were obtained using this method. When compared with other studies of food
simulants, the detection limits that were found in this study were similar. Using SDME and GC-FID,
Batlle and Nerín, obtained a DBP detection limit of 0.03 µg/L when distilled water was used as the
food simulant and a detection limit of 0.16 µg/L when a 3% w/v acetic acid solution in distilled water
was used as the food simulant [27]. Jen and Liu, using hollow fiber microdialysis enrichment system
and HPLC/UV, obtained a LOD of 0.4 µg/L in aqueous solutions for DBP when they evaluated the
migration of phthalates from plastic containers under heating conditions [28].
The ANOVA test indicated that the intra- and inter-assay precisions were statistically equal to a
concentration of 5.0 µg/L for both DBP and BBP. At a concentration of 1.0 µg/L, the ANOVA test
indicated that the means and standard deviations of the intra- and inter-assay precisions were different
for the two phthalates, with the analytical curve showing a greater variability at lower concentrations.
The coefficients of variation that were observed in this study were relatively large compared to the
deviations that are reported in the literature, which is also dependent on the concentration range that is
studied, where higher concentrations exhibit lower variations.

Int. J. Environ. Res. Public Health 2014, 11 514
Table 3. Precision, limits of detection, and quantification of DBP and BBP (n = 10).
Compound RSD—Intra-assay RSD—Inter-assay LOD
µg/L LOQ µg/L 1.0 µg/L 5.0 µg/L 1.0 µg/L 5.0 µg/L
% %
DBP 11.7 7.6 11.9 8.2 0.08 0.2 BBP 16.2 11.0 22.3 13.9 0.31 0.5
A study by Cavaliere et al. reported deviations of 9.5% and 3.0% for DBP and BBP, respectively,
in samples of olive oil at concentrations of 0.5 mg/kg [15]. Rios et al. determined accuracies of 4.7%
and 6.1% for DBP and BBP, respectively, in samples of olive oil at concentration of 1.0 mg/kg [29].
A coefficient of variation of up to 20% is considered suitable for food analysis; hence, the deviation
that is obtained should be acceptable [25,30].
3.3. Concentration of Phthalates due to Migration from Plastic Containers Heated in a Microwave Oven
The plastic containers that were used for the migration analysis were divided into two groups:
five new containers (Group I) and five containers that had already been used for a prolonged period of
time (Group II) of approximately one year. The presence of BBP was not observed in any of the
containers that were evaluated. The results that were obtained for DBP are presented below.
3.3.1. GROUP I: New Containers
The concentrations of DBP that migrated into the food simulant at different conditions are displayed
in Figure 3a‒e.
3.3.2. GROUP II: Containers that Were Used for Prolonged Periods of Time
The concentrations of DBP that migrated into the food simulant under different exposure conditions
are shown in Figure 4a‒e.
The results observed for the DBP concentrations in the Group I containers ranged from <LOQ to
2.0 µg/L, while the DBP concentrations in Group II containers ranged from <LOQ to 7.5 µg/L.
The total of all measurements of DBP concentrations that were obtained in the two groups were
compared by ANOVA. The results showed that there was a difference in the average concentration of
the two groups, with the average DBP concentration found in Group II containers being larger than
that found in Group I containers. Therefore, it can be concluded that the release of phthalates from
plastic containers increases with continued use of the containers.
All containers were exposed to the same heating conditions; however, it is known that microwave
irradiation often leads to non-homogeneous heating, which also depends on the shape and size of the
containers. To evaluate the heating the simulant temperature was measured immediately after heating.
A thermometer was placed into the sample, which was shaken to allow for measurement of the mean
temperature. The temperatures obtained for the Group I Group II containers are presented in Figure 5
and Figure 6, respectively.

Int. J. Environ. Res. Public Health 2014, 11 515
Figure 3. Concentrations of DBP that migrated into Group I food simulant (a) container A,
(b) Container B, (c) Container C, (d) Container D, and (e) Container E.

Int. J. Environ. Res. Public Health 2014, 11 516
Figure 4. Migrated DBP concentrations in the Group II food simulant containers (a)
container F, (b) Container G, (c) Container H, (d) Container I, and (e) Container J.

Int. J. Environ. Res. Public Health 2014, 11 517
Figure 5. Temperatures of simulants measured for times and powers studied for
Group I containers (a) Container A, (b) Container B, (c) Container C, (d) Container D,
and (e) Container E.

Int. J. Environ. Res. Public Health 2014, 11 518
Figure 6. Temperatures of simulants measured for times and powers studied for
Group II containers (a) container F, (b) Container G, (c) Container H, (d) Container I,
and (e) Container J.

Int. J. Environ. Res. Public Health 2014, 11 519
An examination of Figures 3 and 4 shows that, in new containers the increase in heating time
influences the increase in temperature; however, there is not a correlation between these factors and
the migration of phthalates. Therefore, the DBP concentrations in the Group I containers were
independent of the heating duration or the power conditions that were used for the containers that were
evaluated. The variation in the concentration of DBP in the simulant was random. The highest
concentration of DBP (2.0 µg/kg) was observed in container D. However, this values is less than the
specific migration limit (SML) for DBP, which is 0.3 mg/kg.
In Group II, different amounts of DBP were observed in the samples. Through the comparison
between the migration of phthalate (Figure 4) and the temperature obtained in each migration assay
(Figure 6), it was observed that the migration of phthalate in the containers that had already been used
for a prolonged period of time depended on the temperature achieved during heating and the exposure
time of the container to this temperature. The temperature reached depended on the time of exposure to
the microwaves, volume and shape of the container and power used. In general, it was observed that,
using 750 W and 350 W powers, the temperature increased abruptly with increasing of time. When heating
at the 210 W power level, the temperature began high and increased slightly with heating time.
Container J had the smallest volume, 300 mL, and consequently a large temperature variation was
observed in the interval from 1 to 3 min at the 700 W power level. Heating at this power for 3 min
resulted in a final temperature of 90 °C. This temperature remained constant for the longest time;
thus the simulant remained in contact with the container at a high temperature for a longer time which
resulted in an increased migration of phthalates to the simulant. At the 350 W power level the
temperature variation occurred more gradually and there was an increase in the migration of DBP with
the increase in temperature. However, the variation in the concentration of DBP in the sample was
lower. At 210 W power, a small variation of temperature was observed for different exposure times,
and thus there was not a linear relationship between exposure time and phthalates migrations.
Containers G and I had large volumes of 1,000 mL and 1,200 mL, respectively. Lower temperatures
were obtained when compared to other containers heated at the same power. Consequently, a small
variation in the concentration of DBP was observed. Containers F and H have the same volume,
600 mL, but different dimensions. In general, it was observed that an increase in temperature caused an
increase in the migration of phthalates into the simulant.
The obtained results suggest that the increase in temperature is the main cause of phthalate
migration. Theoretically, containers used in microwaves are inert; however, studies have shown that
the migration of various chemical substances may occur during microwave heating. A study by Nerin et al.
demonstrated that the release of compounds from plastic containers is temperature-dependent.
According Nerin, the temperature increase leads to an increase in the decomposition of additives and
breakdown of polymer chains which causes the release of chemicals from the hot plastic surface [31].
Other studies indicate that phthalates may be released during microwave heating. Phthalates are not
commonly used as plasticizers in PP. However a study by Jen and Liu determined an average
concentration DBP of 32 µg/L in PP soup bowls when they were heated for 10 minutes in a microwave
oven at a power of 500 W [28]. A study by Gonzales-Castro et al. determined a DBP concentration of
0.001 µg/L in aqueous solutions that were heated in the microwave oven [20]. In these two studies, the
analysis conditions, such as the heating duration and temperature, were not varied. The results of other
studies in which where phthalates were monitored in different types of food are shown in Table 4.

Int. J. Environ. Res. Public Health 2014, 11 520
When evaluating the concentration of phthalates, it is essential to consider the characteristics of the
food. Phthalates are lipophilic and are found in higher concentrations in fatty foods, such as olive and
other oils [15,32]. In this work, DBP concentrations that were similar to the concentrations reported in
the analysis of hydrophilic food samples were obtained [17,20].
The plastic containers that are used in microwave ovens are usually made of polypropylene,
where the use of plasticizers is not essential and its addition should not be intentional. Therefore,
phthalate migration tests are often not required for PP packaging. However, Shen reported the presence
of phthalates at concentrations of 1.44 mg/kg for DBP, 0.10 mg/kg for BBP, and 8.72 mg/kg for DEHP
in plastic containers that were being used in microwave ovens [33]. These results demonstrate that PP
containers can contain plasticizers. A possible source of DBP contamination is the use of the
TiCl4/dibutylphthalate/Mg(OEt)2 catalyst in the manufacturing of polypropylene. During the polymer
manufacturing process, the catalyst may undergo degradation and release this phthalate into the
polymer material [34]. Another possible source of contamination could arise from the contact Group II
containers with food contaminated with phthalates. Frequent contact with contaminated food could
cause contamination of containers over prolonged use. Several studies have shown that many foods are
contaminated with phthalates (Table 4). This hypothesis has been raised, because higher
concentrations of phthalates have been found in containers with long-term use when compared to new
containers. Although the concentrations of DBP in Group II containers were larger than Group I
containers, it was observed that the concentration of DBP was much smaller than 0.3 mg/kg in all
containers, which is the legal specific migration limit. The legislation control for regulating phthalates
in various routes of exposure is not established for all compounds in this class because more studies
are needed for many phthalates. In drinking water, the US EPA stipulates a maximum contamination
level (MCL) of 6.0 µg/L for DEHP [35]. However, the MCL has not been estimated for other
phthalates. In this work, the maximum concentration of DBP found in the water samples that were
heated in a microwave oven was 7.5 µg/L. If the value set by the US EPA for DEHP was extended to
the entire class of phthalates, the value found in this study would exceed the MCL. Legislation for food
is less strict for the migration of phthalates used in plastic packaging. The Brazilian Institution
ANVISA, which has reference guidelines from the Food and Drug Administration and documents
from the European Union, established a specific migration limit of 0.3 mg of DBP per kilogram of
simulant that is in contact with food packaging [36]. The SML of BBP is 30.0 mg/kg.
Hence, following the Brazilian legislation from ANVISA, the concentrations that were found in this
work would be within the allowed amount. With regards to health effects, many types of foods can be
contaminated by phthalates during the manufacturing process, resulting in even higher concentrations
of phthalates in foods. Thus, there is a great need for further studies to evaluate food contamination
by phthalates.

Int. J. Environ. Res. Public Health 2014, 11 521
Table 4. Phthalate concentrations that have been reported in the literature.
Compounds Concentration
(µg/kg)
Samples Method of
Extraction
Instrumental LOD LOQ Reference
DBP
BBP
DEHP
7.30 to 50.3
1.11 to 2.93
15.1 to 27.2
Commercial whole milk SPE (C18) GC/MS 0.09
0.12
0.06
—
[37]
DBP
BBP
DEHP
<LOD to 490
<LOD to 1,750
<LOD to 4,700
Olive oil Gel permeation
chromatography
GC-MS/MS
—
—
[15]
DEHP
DBP
22.8 to 270.3
10.2 to 142.8
Cereals and legumes,
Meat based, fish based,
dairy, vegetables,
condiments, fresh fruit,
bread
LLE
GC-FID
—
—
[38]
DBP
BBP
DEHP
<LOD to 244
(µg/L)
<LOD to 269
(µg/L)
<LOD to 276
(µg/L)
Wines SPE GC/MS 18
(µg/L)
18
(µg/L)
15
(µg/L)
29
(µg/L)
29
(µg/L)
24
(µg/L)
[16]
DBP
BBP
DEHP
4.07 to 9.79
<LOD
8.40 to 282.90
Cow milk HS-SPME GC/MS 0.02 a 072
0.23 a 4.7
0.31 a 3.3
—
[17]
DBP
0.001 to 0.003
Water (food simulant) LLE GC/MS, HPLC/UV-VIS and
HPLC fluorescence
2.0 ×10⁻³
5.0 ×10⁻³
[20]
DBP 32 and 24
(µg/L)
Water released from
disposable PP soup bowl
and PVDC wrap film
Hollow fiber
microdialysis
enrichment system
HPLC/UV 0.40
(µg/L)
— [28]

Int. J. Environ. Res. Public Health 2014, 11 522
Table 4. Cont.
Compounds Concentration
(µg/kg)
Samples Method of extraction Instrumental LOD LOQ Reference
DEHP
DBP
77 to 1643
22 to 360
Commercial vegetable Oils Direct injection of the
diluted oil
GC/MS 10
10
40
40
[32]
DBP
BBP
DEHP
<LOD to 175
87 to 211
198 a 840
Olive oil SPME GC/MS/MS 30
30
30
— [29]
DBP
BBP
DEHP
<LOD to 9,840
<LOD to 9,980
<LOD to 1.76 × 10⁶
Plastic containers Sonication-assisted extraction GC/MS 10 — [33]
DBP
DEHP
<LOD
0.26 to 0.32
(µg/L)
Bottled mineral water AALLME GC-FID 0.37 (µg/L)
0.75 (µg/L)
— [39]
DBP
BBP
DEHP
0.32 to 0.51
(µg/L)
<LOD
0.57 to 0.65
(µg/L)
Bottled mineral water LPME GC/MS 0.005
(µg/L)
0.01 (µg/L)
0.02 (µg/L)
— [40]
DBP
BBP
DEHP
<LOD
<LOD
<LOD
Bottled mineral water DLLME GC/MS 0.005 (µg/L)
0.002 (µg/L)
0.005 (µg/L)
— [41]
DBP
BBP
0.2 to 7.5
<LOD
Water (food simulant) SPME GC/MS 0.08 (µg/L)
0.31 (µg/L)
0.2 (µg/L)
0.5(µg/L)
This study

Int. J. Environ. Res. Public Health 2014, 11 523
4. Conclusions
The method that was developed in this study is suitable for the quantification of phthalates present
at low concentrations in liquid samples. The main advantage of using SPME in comparison with other
extraction techniques is that organic solvents are not required for sample preparation. EDC are toxic
substances even at low concentrations. Therefore, lower quantification limits are required for the
evaluation of phthalates in samples that contain small amounts of them and other EDC. The use of cold
SPME allowed for the quantification of phthalates that were found in low concentrations in the
samples because of increased efficiency in the extraction step. Cold SPME can be used for various
compounds and is a technique that can be potentially applicable for the study of EDC and other
organic compounds that are present in trace concentrations in different matrices. Phthalates were found
in all PP containers. The analyses performed demonstrated that there is a greater migration of
phthalates in containers with a prolonged time of use. After prolonged use containers possess small
deformations and are less resistant to heat, which may allow phthalates to be more easily released.
The values of DBP obtained in this study are in accordance with current legislation for the migration of
this compound; however, additional studies are required to evaluate the toxic effects of human
exposure to these compounds because the microwave oven is just one of several exposure sources.
This study also demonstrates that the developed method could be used for real food samples if they
possess the characteristics of the simulant that was used.
Acknowledgments
Funding for this study was provided by the Fundacão de Amparo a Pesquisa de Minas Gerais
(FAPEMIG) and the Conselho Nacional de Desenvolvimento Científico e Tecnológico (CNPq).
Conflicts of Interest
The authors declare no conflict of interest.
References
1. Toxicity and Exposure Assessment for Children’s Health. Available online: http://www.epa.gov/
teach/chem_summ/phthalates_summary.pdf (accessed on 3 November 2012).
2. Fromme, H.; Kuchler, T.; Otto, T.; Pilz, K.; Muller, J.; Wenzel, A. Occurrence of phthalates and
bisphenol A and F in the environment. Water Res. 2002, 36, 1429–1438.
3. Nerin, C.; Cacho, J.; Gancedo, P. Plasticizers from printing inks in a selection of food packagings
and their migration to food. Food Addit. Contam. 1993, 10, 453–460.
4. International Programme on Chemical Safety. Available online: http://whqlibdoc.who.int/hq/
2002/WHO_PCS_EDC_02.2.pdf (accessed on 3 November 2012).
5. Bila, D.M.; Dezotti, M. Endocrine disrupters in the environment: Part 1—Effects and
consequences. Quim. Nova 2007, 30, 651–666.
6. Xia, H.; Chi, Y.; Qi, X.; Su, M.; Cao, Y.; Song, P.; Li, X.; Chen, T.; Zhao, A.; Zhang, Y.;
Cao, Y.; Ma, X.; Jia, W. Metabolomic evaluation of di-n-butyl phthalate-induced teratogenesis in
mice. Metabolomics 2011, 7, 559–571.

Int. J. Environ. Res. Public Health 2014, 11 524
7. Arcadi, F.A.; Costa, C.; Imperatore, C.; Marchese, A.; Rapisarda, A.; Salemi, M.; Trimarchi, G.R.;
Costa, G. Oral toxicity of bis(2-ethylhexyl) phthalate during pregnancy and suckling in the
long-evans rat. Food Chem. Toxicol. 1998, 36, 963–970.
8. Schmidt, J.S.; Schaedlich, K.; Fiandanese, N.; Pocar, P.; Fischer, B. Effects of Di(2-ethylhexyl)
Phthalate (DEHP) on Female Fertility and Adipogenesis in C3H/N Mice. Environ. Health Perspect.
2012, 120, 1123–1129.
9. Fredricsson, B.; Moller, L.; Pousette, A.; Westerholm, R. Human sperm motility is affected by
plasticizers and diesel particle extracts. Pharmacol. Toxicol. 1993, 72, 128–133.
10. Kim, S.H.; Chun, S.; Jang, J.Y.; Chae, H.D.; Kim, C.H.; Kang, B.M. Increased plasma levels of
phthalate esters in women with advanced-stage endometriosis: A prospective case-control study.
Fertil. Steril. 2011, 95, 357–359.
11. Meeker, J.D.; Ferguson, K.K. Relationship between urinary phthalate and bisphenol a
concentrations and serum thyroid measures in USA adults and adolescents from the national
health and nutrition examination survey (NHANES) 2007–2008. Environ. Health Perspect. 2011,
119, 1396–1402.
12. European Food Safety Authority. Opinion of the Scientific Panel on food additives, flavourings,
processing aids and materials in contact with food (AFC) related to di-Butylphthalate (DBP) for
use in food contact materials. EFSA J. 2005, 242, 1–17.
13. European Food Safety Authority. Opinion of the Scientific Panel on food additives, flavourings,
processing aids and materials in contact with food (AFC) related to Butylbenzylphthalate (BBP)
for use in food contact materials. EFSA J. 2005, 241, 1–14.
14. European Food Safety Authority. Opinion of the Scientific Panel on Food Additives, Flavourings,
Processing Aids and Materials in Contact with Food (AFC) on a request from the Commission
related to Bis(2-ethylhexyl)phthalate (DEHP) for use in food contact materials. EFSA J. 2005, 243,
1–20.
15. Cavaliere, B.; Macchione, B.; Sindona, G.; Tagarelli, A. Tandem mass spectrometry in food
safety assessment: The determination of phthalates in olive oil. J. Chromatogr. A 2008, 1205,
137–143.
16. Del Carlo, M.; Pepe, A.; Sacchetti, G.; Compagnone, D.; Mastrocola, D.; Cichelli, A. Determination
of phthalate esters in wine using solid-phase extraction and gas chromatography-mass spectrometry.
Food Chem. 2008, 111, 771–777.
17. Feng, Y.L.; Zhu, J.P.; Sensenstein, R. Development of a headspace solid-phase microextraction
method combined with gas chromatography mass spectrometry for the determination of phthalate
esters in cow milk. Anal. Chim. Acta 2005, 538, 41–48.
18. Ghiasvand, A.R.; Hosseinzadeh, S.; Pawliszyn, J. New cold-fiber headspace solid-phase
microextraction device for quantitative extraction of polycyclic aromatic hydrocarbons in
sediment. J. Chromatogr. A 2006, 1124, 35–42.
19. Menezes, H.C.; Cardeal, Z.L. Determination of polycyclic aromatic hydrocarbons from ambient
air particulate matter using a cold fiber solid phase microextraction gas chromatography-mass
spectrometry method. J. Chromatogr. A 2011, 1218, 3300–3305.

Int. J. Environ. Res. Public Health 2014, 11 525
20. Gonzalez-Castro, M.I.; Olea-Serrano, M.F.; Rivas-Velasco, A.M.; Medina-Rivero, E.;
Ordonez-Acevedo, L.G.; de Leon-Rodriguez, A. Phthalates and bisphenols migration in Mexican
food cans and plastic food containers. Bull. Environ. Contam. Toxicol. 2011, 86, 627–631.
21. Kueseng, P.; Thavarungkul, P.; Kanatharana, P. Trace phthalate and adipate esters contaminated
in packaged food. J. Environ. Sci. Health B 2007, 42, 569–576.
22. Prokupkova, G.; Holadova, K.; Poustka, J.; Hajslova, J. Development of a solid-phase
microextraction method for the determination of phthalic acid esters in water. Anal. Chim. Acta
2002, 457, 211–223.
23. European Union. Commission Regulation No.10/2011. Available online: http://eur-lex.europa.eu/
LexUriServ/LexUriServ.do?uri=OJ:L: 2011:012:0001:0089:EN:PDF (accessed on 5 September
2012).
24. Brasil, Agência Nacional de Vigilância Sanitária, Ministério da Saúde, in Portaria N 26/MS/SVS
1996. Available online: http://www.anvisa.gov.br/legis/portarias/26_96.htm (accessed on
3 November 2012).
25. EURACHEM Guide to Quality in Analytical Chemistry: An Aid to Accreditation. Available
online: http://www.eurachem.org/images/stories/Guides/pdf/CITAC_EURACHEM_GUIDE.pdf
(accessed on 7 September 2012).
26. De Souza, S.V.C.; Junqueira, R.G. A procedure to assess linearity by ordinary least squares
method. Anal. Chim. Acta 2005, 552, 25–35.
27. Batlle, R.; Nerin, C. Application of single-drop microextraction to the determination of dialkyl
phthalate esters in food simulants. J. Chromatogr. A 2004, 1045, 29–35.
28. Jen, J.F.; Liu, T.C. Determination of phthalate esters from food-contacted materials by on-line
microdialysis and liquid chromatography. J. Chromatogr. A 2006, 1130, 28–33.
29. Rios, J.J.; Morales, A.; Marquez-Ruiz, G. Headspace solid-phase microextraction of oil matrices
heated at high temperature and phthalate esters determination by gas chromatography multistage
mass spectrometry. Talanta 2010, 80, 2076–2082.
30. Guidance for the Validation of Analytical Methodology and Calibration of Equipment used for
Testing of Illicit Drugs in Seized Materials and Biological Specimens. Available online:
http://www.unodc.org/documents/scientific/validation_E.pdf (accessed on 3 November 2012).
31. Nerin, C.; Acosta, D.; Rubio, C. Potential migration release of volatile compounds from plastic
containers destined for food use in microwave ovens. Food Addit. Contam. 2002, 19, 594–601.
32. Nanni, N.; Fiselier, K.; Grob, K.; di Pasquale, M.; Fabrizi, L.; Aureli, P.; Coni, E. Contamination of
vegetable oils marketed in Italy by phthalic acid esters. Food Control 2011, 22, 209–214.
33. Shen, H.Y. Simultaneous screening and determination eight phthalates in plastic products for food
use by sonication-assisted extraction/GC-MS methods. Talanta 2005, 66, 734–739.
34. Ohnishi, R.; Yukimasa, S.; Konakazawa, T. Synthesis of elastomeric poly(propylene) (ELPP) using
the highly active TiCl4/dibutyl phthalate (DBP)/MgCl2-Al(i-C4H9)(3)/1-allyl-3,4-dimethoxybenzene
(ADMB) catalyst. Macromol. Chem. Phys. 2002, 203, 1003–1010.
35. Basic Information about Di(2-ethylhexyl) phthalate in Drinking Water. Available online:
http://water.epa.gov/drink/contaminants/basicinformation/di_2-ethylhexyl_phthalate.cfm (accessed on
5 April 2012).

Int. J. Environ. Res. Public Health 2014, 11 526
36. Brasil, Agência Nacional de Vigilância Sanitária, Ministério da Saúde, in Resolução Anvisa
RDC N17. Available online: http://www.aguaseaguas.com.br/images/stories/pdflegislacaonovas/
036.pdf (accessed on 7 September 2012).
37. Casajuana, N.; Lacorte, S. New methodology for the determination of phthalate esters, bisphenol A,
bisphenol A diglycidyl ether, and nonylphenol in commercial whole milk samples. J. Agric.
Food Chem. 2004, 52, 3702–3707.
38. Cirillo, T.; Fasano, E.; Castaldi, E.; Montuori, P.; Cocchieri, R.A. Children’s Exposure to
Di(2-ethylhexyl)phthalate and Dibutylphthalate Plasticizers from School Meals. J. Agric. Food Chem.
2011, 59, 10532–10538.
39. Farajzadeh, M.A.; Mogaddam, M.R.A. Air-assisted liquid-liquid microextraction method as a
novel microextraction technique. Application in extraction and preconcentration of phthalate
esters in aqueous sample followed by gas chromatography-flame ionization detection.
Anal. Chim. Acta 2012, 728, 31–38.
40. Psillakis, E.; Kalogerakis, N. Hollow-fibre liquid-phase microextraction of phthalate esters from
water. J. Chromatogr. A 2003, 999, 145–153.
41. Farahani, H.; Norouzi, P.; Dinarvand, R.; Ganjali, M.R. Development of dispersive liquid-liquid
microextraction combined with gas chromatography-mass spectrometry as a simple, rapid and
highly sensitive method for the determination of phthalate esters in water samples. J. Chromatogr. A
2007, 1172, 105–112.
© 2013 by the authors; licensee MDPI, Basel, Switzerland. This article is an open access article
distributed under the terms and conditions of the Creative Commons Attribution license
(http://creativecommons.org/licenses/by/3.0/).


![bis 2 ethylhexyl phthalate-eng · Bis(2-ethylhexyl) phthalate [also known as di(2-ethylhexyl) phthalate or DEHP], a branched-chain dioctyl ester of phthalic acid, is the most important](https://static.fdocuments.net/doc/165x107/5ff6bd9cd1b4ca2c50283d75/bis-2-ethylhexyl-phthalate-eng-bis2-ethylhexyl-phthalate-also-known-as-di2-ethylhexyl.jpg)