Analysis of phenolic antioxidants and erucamide slip additives in polypropylene ... · PDF...
8
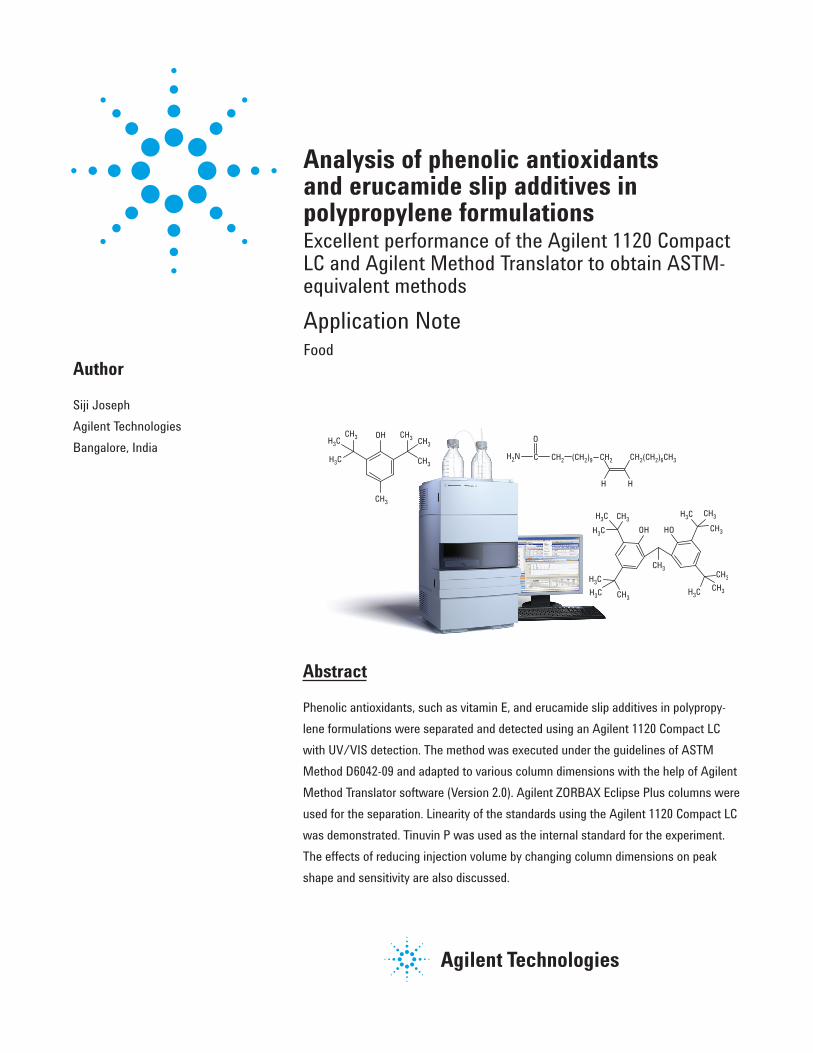
Analysis of phenolic antioxidants and erucamide slip additives in polypropylene formulations Excellent performance of the Agilent 1120 Compact LC and Agilent Method Translator to obtain ASTM- equivalent methods Abstract Phenolic antioxidants, such as vitamin E, and erucamide slip additives in polypropy- lene formulations were separated and detected using an Agilent 1120 Compact LC with UV/VIS detection. The method was executed under the guidelines of ASTM Method D6042-09 and adapted to various column dimensions with the help of Agilent Method Translator software (Version 2.0). Agilent ZORBAX Eclipse Plus columns were used for the separation. Linearity of the standards using the Agilent 1120 Compact LC was demonstrated. Tinuvin P was used as the internal standard for the experiment. The effects of reducing injection volume by changing column dimensions on peak shape and sensitivity are also discussed. Author Siji Joseph Agilent Technologies Bangalore, India Application Note Food OH H 3 C CH 3 CH 3 CH 3 CH 3 CH 3 H 3 C OH HO H 3 C H 3 C H 3 C H 3 C H 3 C H 3 C CH 3 CH 3 CH 3 CH 3 CH 3 CH 3 CH 3 H CH 2 (CH 2 ) 6 CH 3 H C CH 2 CH 2 (CH 2 ) 9 O H 2 N
Transcript of Analysis of phenolic antioxidants and erucamide slip additives in polypropylene ... · PDF...
Analysis of phenolic antioxidants and erucamide slip additives inpolypropylene formulationsExcellent performance of the Agilent 1120 CompactLC and Agilent Method Translator to obtain ASTM-equivalent methods
Abstract
Phenolic antioxidants, such as vitamin E, and erucamide slip additives in polypropy-
lene formulations were separated and detected using an Agilent 1120 Compact LC
with UV/VIS detection. The method was executed under the guidelines of ASTM
Method D6042-09 and adapted to various column dimensions with the help of Agilent
Method Translator software (Version 2.0). Agilent ZORBAX Eclipse Plus columns were
used for the separation. Linearity of the standards using the Agilent 1120 Compact LC
was demonstrated. Tinuvin P was used as the internal standard for the experiment.
The effects of reducing injection volume by changing column dimensions on peak
shape and sensitivity are also discussed.
Author
Siji Joseph
Agilent Technologies
Bangalore, India
Application NoteFood
OHH3C
CH3
CH3
CH3
CH3
CH3
H3C
OH HO
H3C H3C
H3C
H3C
H3C
H3C CH3
CH3CH3
CH3
CH3
CH3
CH3
H
CH2(CH2)6CH3
H
C CH2 CH2(CH2)9
O
H2N
2
OHH3C
CH3
CH3
CH3
CH3
CH3
H3C
Name:
Formula:
Molecular weight:
CAS No:
BHT
C15H24O
220.35
128-37-0
2,6-Di-tert-butyl-p-cresol
OH HO
H3C H3C
H3C
H3C
H3C
H3C CH3
CH3CH3
CH3
CH3
CH3
CH3
Name:
Formula:
Molecular weight:
CAS No:
Isonox 129
C30H46O2
438.69
35958-30-6
2,2 -Ethylidene-bis(4,6-di-tert-butylphenol)
H
CH2(CH2)6CH3
H
C CH2 CH2(CH2)9
O
H2N
Name:
Formula:
Molecular weight:
CAS No:
Erucamide
C22H43NO
337.58
112-84-5
cis-13-Docosenoamide
HO
H3C
H3C
H3C
H3C
COCH2CH2CH2
CH3
CH3
C
O
Name:
Formula:
Molecular weight:
CAS No:
Irganox 1010
C73H108O12
1117.63
6683-19-8
Pentaerythritol tetrakis(3,5-di-tert-butyl-4-hydroxyhydrocinnamate)
H3C
H3C
CH3 CH3 CH3
CH3
CH3
CH3
OH
O
Name:
Formula:
Molecular weight:
CAS No:
Vitamin E
C29H50O2
430.71
10191-41-0
(±)-α-Tocopherol
NN
N
HO
CH3
Name:
Formula:
Molecular weight:
CAS No:
Tinuvin P 2-(2-Hydroxy-5-methylphenyl)benzotriazole
C13H11N3O
225.25
2440-22-4
H3C
H3C
H3C
H3C
CH3
CH3
HO CH2CH2 C
O
OCH2(CH2)16CH3
Octadecyl 3-(3,5-di-tert-butyl-4-hydroxyphenyl)propionateName:
Formula:
Molecular weight:
CAS No:
Irganox 1076
C35H62O3
530.86
2082-79-3
H3C
H3C
H3C
H3C
H3CH3C
H3C
H3C
CH3
CH3
CH3CH3
CH3
CH3
CH3
CH3
CH3CH3
O
PO O
Tris(2,4-di-tert-butylphenyl) phosphateName:
Formula:
Molecular weight:
CAS No:
Irgafos 168
C42H63O3P
646.92
31570-04-4
4
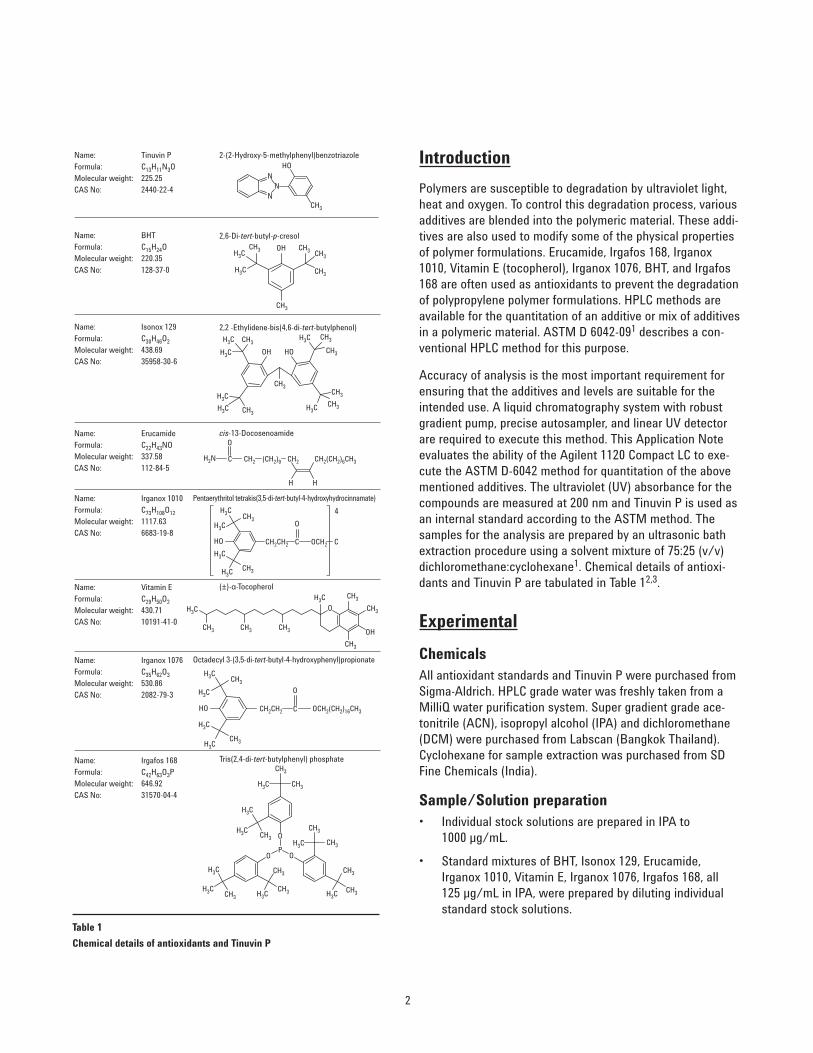
Table 1
Chemical details of antioxidants and Tinuvin P
Introduction
Polymers are susceptible to degradation by ultraviolet light,heat and oxygen. To control this degradation process, variousadditives are blended into the polymeric material. These addi-tives are also used to modify some of the physical propertiesof polymer formulations. Erucamide, Irgafos 168, Irganox1010, Vitamin E (tocopherol), Irganox 1076, BHT, and Irgafos168 are often used as antioxidants to prevent the degradationof polypropylene polymer formulations. HPLC methods areavailable for the quantitation of an additive or mix of additivesin a polymeric material. ASTM D 6042-091 describes a con-ventional HPLC method for this purpose.
Accuracy of analysis is the most important requirement forensuring that the additives and levels are suitable for theintended use. A liquid chromatography system with robustgradient pump, precise autosampler, and linear UV detectorare required to execute this method. This Application Noteevaluates the ability of the Agilent 1120 Compact LC to exe-cute the ASTM D-6042 method for quantitation of the abovementioned additives. The ultraviolet (UV) absorbance for thecompounds are measured at 200 nm and Tinuvin P is used asan internal standard according to the ASTM method. Thesamples for the analysis are prepared by an ultrasonic bathextraction procedure using a solvent mixture of 75:25 (v/v)dichloromethane:cyclohexane1. Chemical details of antioxi-dants and Tinuvin P are tabulated in Table 12,3.
Experimental
Chemicals All antioxidant standards and Tinuvin P were purchased fromSigma-Aldrich. HPLC grade water was freshly taken from aMilliQ water purification system. Super gradient grade ace-tonitrile (ACN), isopropyl alcohol (IPA) and dichloromethane(DCM) were purchased from Labscan (Bangkok Thailand).Cyclohexane for sample extraction was purchased from SDFine Chemicals (India).
Sample/Solution preparation• Individual stock solutions are prepared in IPA to
1000 µg/mL.
• Standard mixtures of BHT, Isonox 129, Erucamide,Irganox 1010, Vitamin E, Irganox 1076, Irgafos 168, all 125 µg/mL in IPA, were prepared by diluting individualstandard stock solutions.
3
• Dichloromethane and cyclohexane were mixed in theratio 75:25. A 7.5 mg amount of Tinuvin P was added to150 mL of the above solvent mixture to prepare an extrac-tion solvent mixture with an internal standard (Tinuvin P)concentration of 50 µg/mL.
• Samples: Three polypropylene formulations (self-preparedfrom polypropylene sample tubes, from poly propylenesyringes, and packaged drinking water bottles) wereextracted by ultrasonication according to Method ASTM-D6042-09. All three polypropylene formulation extractswere spiked with 25 µg/mL standard mix.
• Linearity levels of standard mixtures were prepared at thefollowing concentrations: 4 µg/mL, 8 µg/mL, 16 µg/mL,32 µg/mL, 64 µg/mL, 100 µg/mL. A concentration ofapproximately 50 µg/mL Tinuvin P was maintained in alllinearity levels as an internal standard.
ColumnsAgilent ZORBAX Eclipse Plus C18, 150 × 4.6 mm, 5 µm (p/n 959993-902)
Agilent ZORBAX Eclipse Plus C18, 150 × 3.0 mm, 3.5 µm (p/n 959963-302)
Agilent ZORBAX Eclipse Plus C18, 100 × 3.0 mm, 3.5 µm (p/n 959961-302)
Agilent ZORBAX Eclipse Plus C18, 50 × 4.6 mm, 3.5 µm(p/n 959943-902)
LC system An Agilent 1120 Compact LC, consisting of a gradient pumpwith integrated degasser, autosampler with vial tray, columnoven, variable wavelength detector, and Agilent EZChrom EliteCompact software was used.
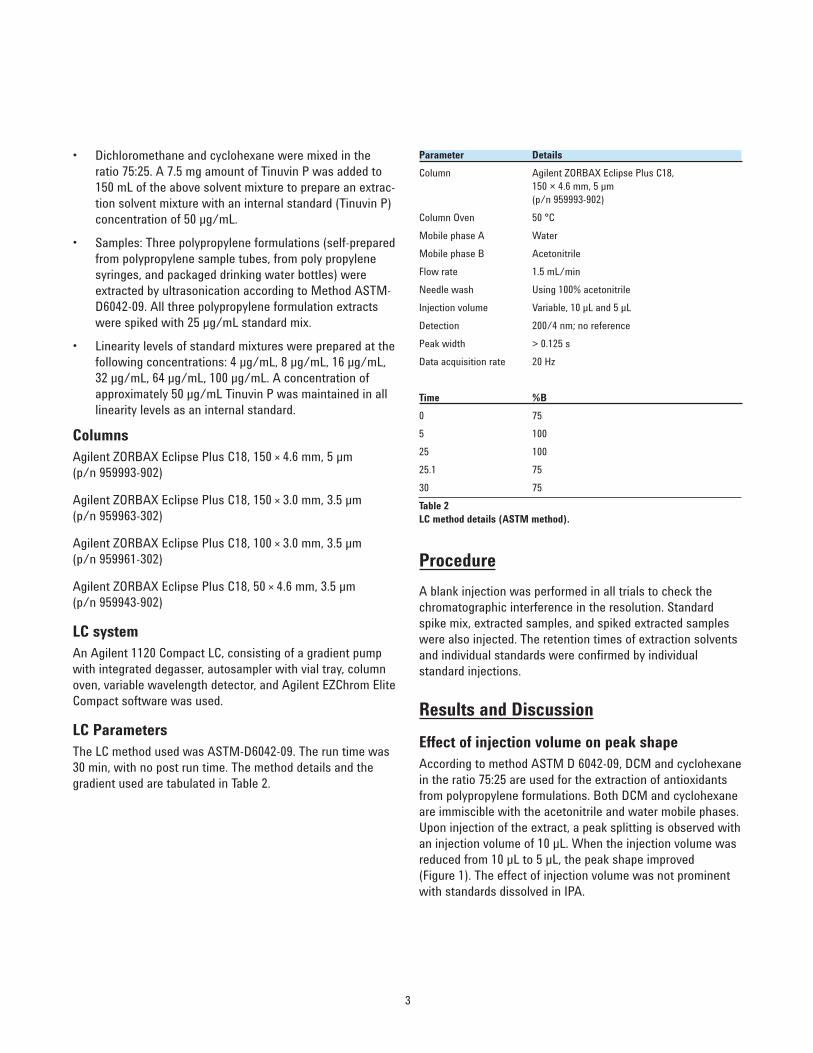
LC ParametersThe LC method used was ASTM-D6042-09. The run time was30 min, with no post run time. The method details and thegradient used are tabulated in Table 2.
Parameter Details
Column Agilent ZORBAX Eclipse Plus C18,150 × 4.6 mm, 5 µm (p/n 959993-902)
Column Oven 50 °C
Mobile phase A Water
Mobile phase B Acetonitrile
Flow rate 1.5 mL/min
Needle wash Using 100% acetonitrile
Injection volume Variable, 10 µL and 5 µL
Detection 200/4 nm; no reference
Peak width > 0.125 s
Data acquisition rate 20 Hz
Time %B
0 75
5 100
25 100
25.1 75
30 75
Table 2LC method details (ASTM method).
Procedure
A blank injection was performed in all trials to check thechromatographic interference in the resolution. Standardspike mix, extracted samples, and spiked extracted sampleswere also injected. The retention times of extraction solventsand individual standards were confirmed by individual standard injections.
Results and Discussion
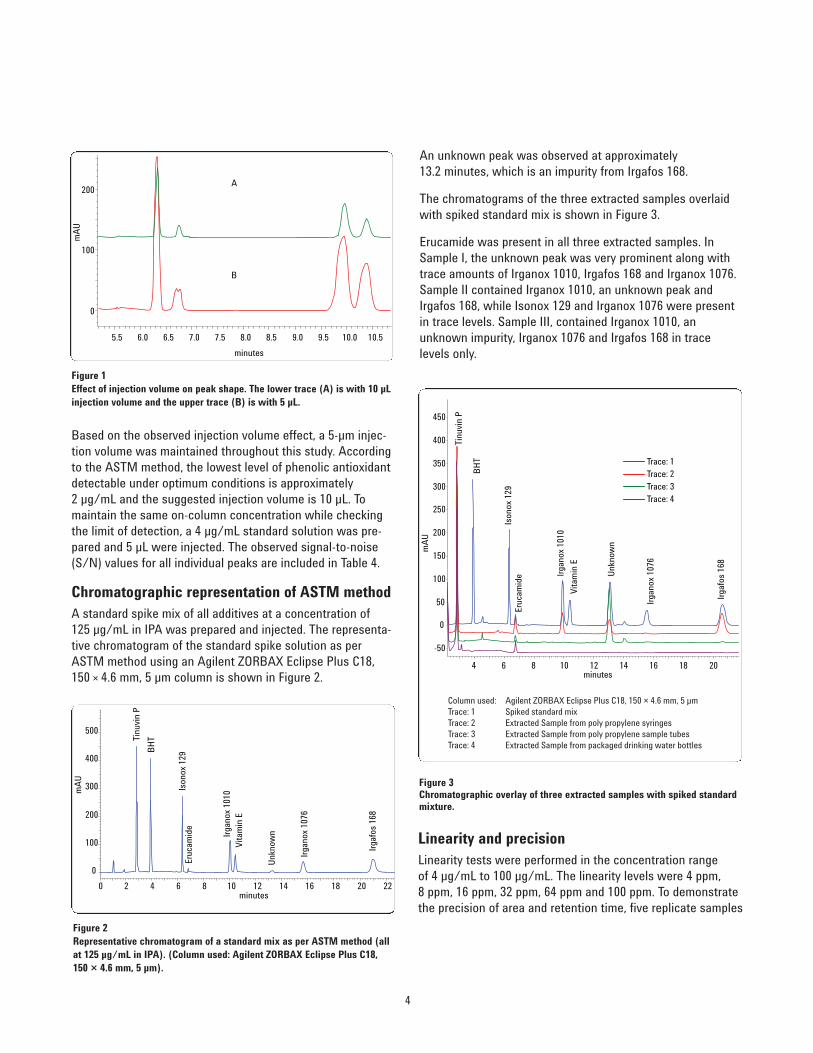
Effect of injection volume on peak shapeAccording to method ASTM D 6042-09, DCM and cyclohexanein the ratio 75:25 are used for the extraction of antioxidantsfrom polypropylene formulations. Both DCM and cyclohexaneare immiscible with the acetonitrile and water mobile phases.Upon injection of the extract, a peak splitting is observed withan injection volume of 10 µL. When the injection volume wasreduced from 10 µL to 5 µL, the peak shape improved (Figure 1). The effect of injection volume was not prominentwith standards dissolved in IPA.
4
Based on the observed injection volume effect, a 5-µm injec-tion volume was maintained throughout this study. Accordingto the ASTM method, the lowest level of phenolic antioxidantdetectable under optimum conditions is approximately 2 µg/mL and the suggested injection volume is 10 µL. Tomaintain the same on-column concentration while checkingthe limit of detection, a 4 µg/mL standard solution was pre-pared and 5 µL were injected. The observed signal-to-noise(S/N) values for all individual peaks are included in Table 4.
Chromatographic representation of ASTM methodA standard spike mix of all additives at a concentration of 125 µg/mL in IPA was prepared and injected. The representa-tive chromatogram of the standard spike solution as perASTM method using an Agilent ZORBAX Eclipse Plus C18,150 × 4.6 mm, 5 µm column is shown in Figure 2.
An unknown peak was observed at approximately 13.2 minutes, which is an impurity from Irgafos 168.
The chromatograms of the three extracted samples overlaidwith spiked standard mix is shown in Figure 3.
Erucamide was present in all three extracted samples. InSample I, the unknown peak was very prominent along withtrace amounts of Irganox 1010, Irgafos 168 and Irganox 1076.Sample II contained Irganox 1010, an unknown peak andIrgafos 168, while Isonox 129 and Irganox 1076 were presentin trace levels. Sample III, contained Irganox 1010, anunknown impurity, Irganox 1076 and Irgafos 168 in trace levels only.
minutes0 2 4 6 8 10 12 14 16 18 20 22
mA
U
0
100
200
300
400
500
Tinu
vin
P
BH
T
Is
onox
129
Eruc
amid
e
Irga
nox
1010
Vita
min
E
Unk
now
n
Irga
nox
1076
Irga
fos
168
Figure 2Representative chromatogram of a standard mix as per ASTM method (allat 125 µg/mL in IPA). (Column used: Agilent ZORBAX Eclipse Plus C18, 150 × 4.6 mm, 5 µm).
minutes4 6 8 10 12 14 16 18 20
mA
U
-50
0
50
100
150
200
250
300
350
400
450
Tinu
vin
P
BH
T
Ison
ox 1
29Er
ucam
ide Ir
gano
x 10
10
Vita
min
E
Unk
now
n
Irga
nox
1076
Irga
fos
168
Trace: 1Trace: 2Trace: 3Trace: 4
Column used: Agilent ZORBAX Eclipse Plus C18, 150 × 4.6 mm, 5 µmTrace: 1 Spiked standard mixTrace: 2 Extracted Sample from poly propylene syringesTrace: 3 Extracted Sample from poly propylene sample tubesTrace: 4 Extracted Sample from packaged drinking water bottles
Figure 3Chromatographic overlay of three extracted samples with spiked standardmixture.
minutes
5.5 6.0 6.5 7.0 7.5 8.0 8.5 9.0 9.5 10.0 10.5
mA
U
A
B
0
100
200
Figure 1Effect of injection volume on peak shape. The lower trace (A) is with 10 µLinjection volume and the upper trace (B) is with 5 µL.
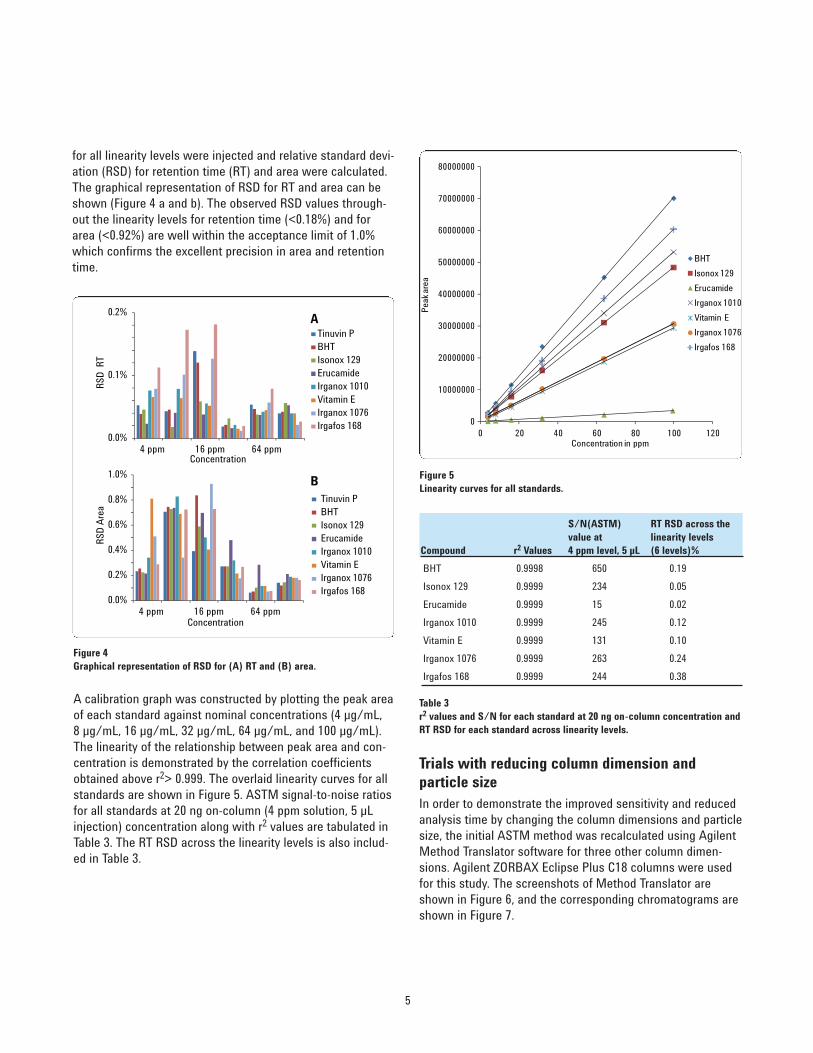
Linearity and precision Linearity tests were performed in the concentration range of 4 µg/mL to 100 µg/mL. The linearity levels were 4 ppm, 8 ppm, 16 ppm, 32 ppm, 64 ppm and 100 ppm. To demonstratethe precision of area and retention time, five replicate samples
5
A calibration graph was constructed by plotting the peak areaof each standard against nominal concentrations (4 µg/mL, 8 µg/mL, 16 µg/mL, 32 µg/mL, 64 µg/mL, and 100 µg/mL).The linearity of the relationship between peak area and con-centration is demonstrated by the correlation coefficientsobtained above r2> 0.999. The overlaid linearity curves for allstandards are shown in Figure 5. ASTM signal-to-noise ratiosfor all standards at 20 ng on-column (4 ppm solution, 5 µLinjection) concentration along with r2 values are tabulated inTable 3. The RT RSD across the linearity levels is also includ-ed in Table 3.
S/N(ASTM) RT RSD across thevalue at linearity levels
Compound r2 Values 4 ppm level, 5 µL (6 levels)%
BHT 0.9998 650 0.19
Isonox 129 0.9999 234 0.05
Erucamide 0.9999 15 0.02
Irganox 1010 0.9999 245 0.12
Vitamin E 0.9999 131 0.10
Irganox 1076 0.9999 263 0.24
Irgafos 168 0.9999 244 0.38
0.0%
0.1%
0.2%
4 ppm 16 ppm 64 ppm
Tinuvin PBHTIsonox 129ErucamideIrganox 1010Vitamin EIrganox 1076Irgafos 168
A
Concentration
RSD
RT
0.0%
0.2%
0.4%
0.6%
0.8%
1.0%
4 ppm 16 ppm 64 ppm
Tinuvin PBHTIsonox 129ErucamideIrganox 1010Vitamin EIrganox 1076Irgafos 168
B
RSD
Are
a
Concentration
Figure 4Graphical representation of RSD for (A) RT and (B) area.
0
10000000
20000000
30000000
40000000
50000000
60000000
70000000
80000000
0 20 40 60 80 100 120
BHT
Isonox 129
Erucamide
Irganox 1010
Vitamin E
Irganox 1076
Irgafos 168
Pea
k ar
ea
Concentration in ppm
Figure 5Linearity curves for all standards.
Table 3r2 values and S/N for each standard at 20 ng on-column concentration andRT RSD for each standard across linearity levels.
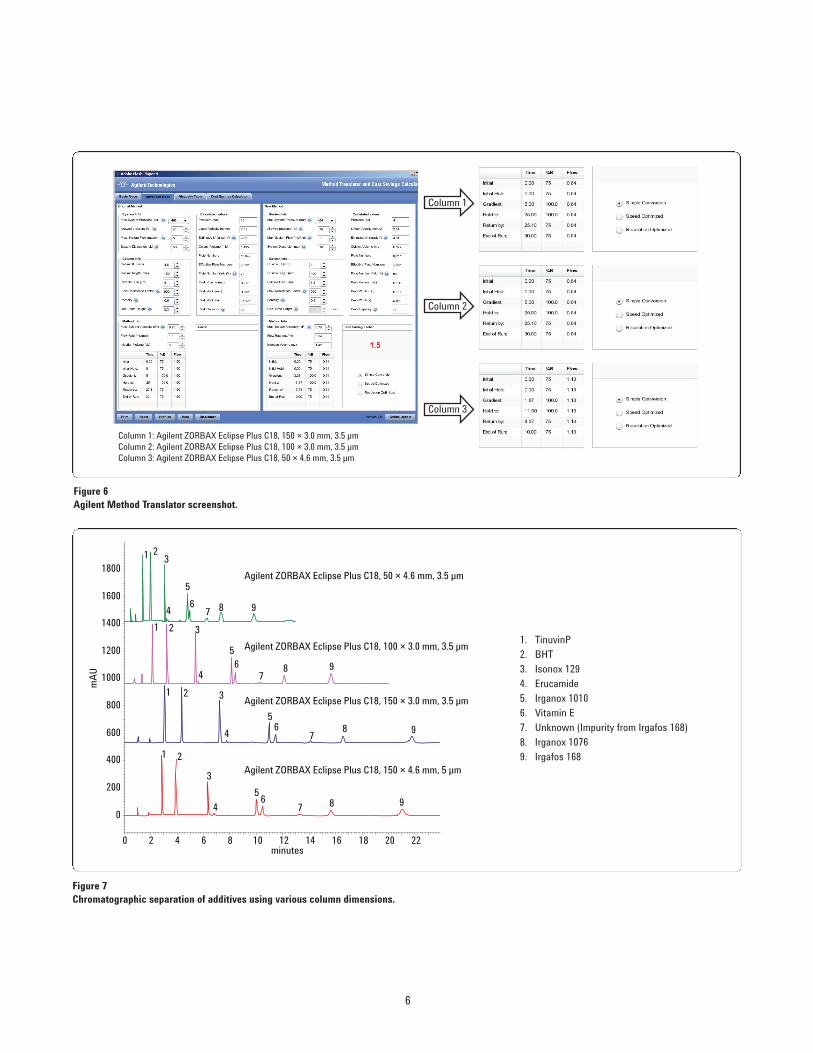
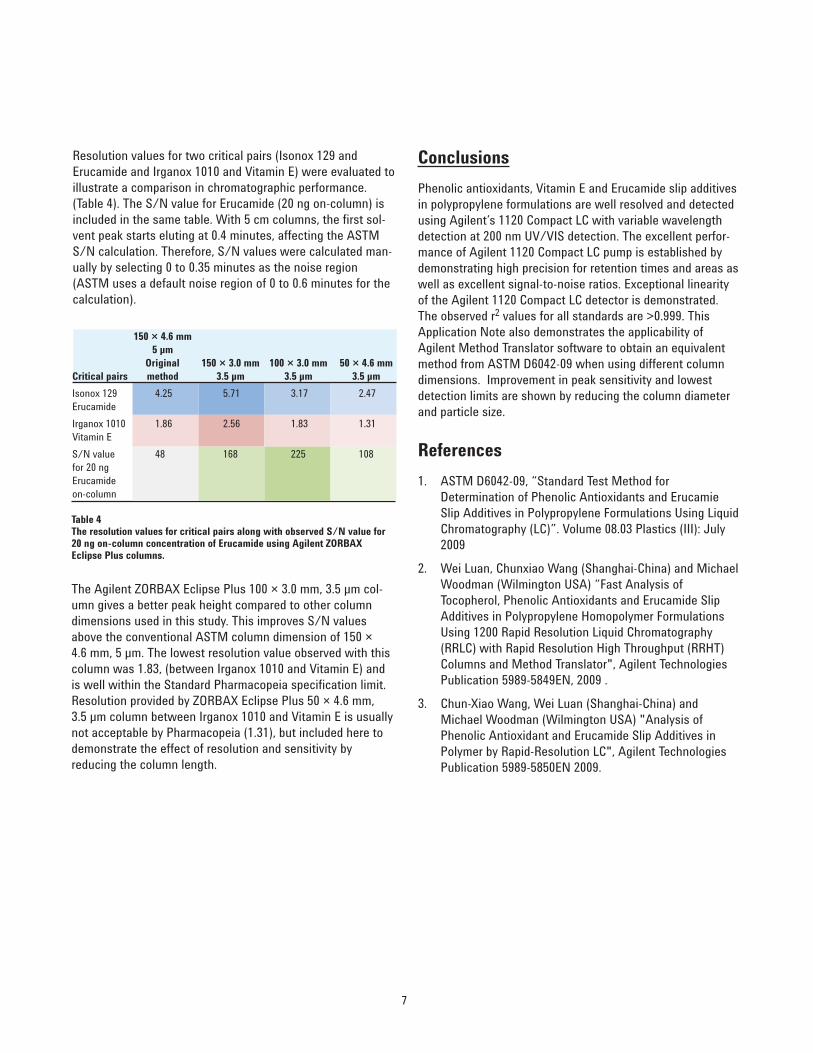
Trials with reducing column dimension and particle sizeIn order to demonstrate the improved sensitivity and reducedanalysis time by changing the column dimensions and particlesize, the initial ASTM method was recalculated using AgilentMethod Translator software for three other column dimen-sions. Agilent ZORBAX Eclipse Plus C18 columns were usedfor this study. The screenshots of Method Translator areshown in Figure 6, and the corresponding chromatograms areshown in Figure 7.
for all linearity levels were injected and relative standard devi-ation (RSD) for retention time (RT) and area were calculated.The graphical representation of RSD for RT and area can beshown (Figure 4 a and b). The observed RSD values through-out the linearity levels for retention time (<0.18%) and forarea (<0.92%) are well within the acceptance limit of 1.0%which confirms the excellent precision in area and retentiontime.
6
minutes0 2 4 6 8 10 12 14 16 18 20 22
mA
U
0
200
400
600
800
1000
1200
1400
1600
1800
1 2
3
4
56
7 8 9
1 2 3
4
56
78 9
1 2 3
4
56
78 9
1 23
4
5
67 8 9
Agilent ZORBAX Eclipse Plus C18, 50 × 4.6 mm, 3.5 µm
Agilent ZORBAX Eclipse Plus C18, 100 × 3.0 mm, 3.5 µm
Agilent ZORBAX Eclipse Plus C18, 150 × 3.0 mm, 3.5 µm
Agilent ZORBAX Eclipse Plus C18, 150 × 4.6 mm, 5 µm
Figure 7Chromatographic separation of additives using various column dimensions.
Column 1
Column 2
Column 3
Column 1: Agilent ZORBAX Eclipse Plus C18, 150 × 3.0 mm, 3.5 µm Column 2: Agilent ZORBAX Eclipse Plus C18, 100 × 3.0 mm, 3.5 µmColumn 3: Agilent ZORBAX Eclipse Plus C18, 50 × 4.6 mm, 3.5 µm
Figure 6Agilent Method Translator screenshot.
1. TinuvinP
2. BHT
3. Isonox 129
4. Erucamide
5. Irganox 1010
6. Vitamin E
7. Unknown (Impurity from Irgafos 168)
8. Irganox 1076
9. Irgafos 168
7
Resolution values for two critical pairs (Isonox 129 andErucamide and Irganox 1010 and Vitamin E) were evaluated toillustrate a comparison in chromatographic performance.(Table 4). The S/N value for Erucamide (20 ng on-column) isincluded in the same table. With 5 cm columns, the first sol-vent peak starts eluting at 0.4 minutes, affecting the ASTMS/N calculation. Therefore, S/N values were calculated man-ually by selecting 0 to 0.35 minutes as the noise region(ASTM uses a default noise region of 0 to 0.6 minutes for thecalculation).
Table 4The resolution values for critical pairs along with observed S/N value for20 ng on-column concentration of Erucamide using Agilent ZORBAXEclipse Plus columns.
150 × 4.6 mm5 µm
Original 150 × 3.0 mm 100 × 3.0 mm 50 × 4.6 mmCritical pairs method 3.5 µm 3.5 µm 3.5 µm
Isonox 129 4.25 5.71 3.17 2.47 Erucamide
Irganox 1010 1.86 2.56 1.83 1.31 Vitamin E
S/N value 48 168 225 108for 20 ng Erucamideon-column
The Agilent ZORBAX Eclipse Plus 100 × 3.0 mm, 3.5 µm col-umn gives a better peak height compared to other columndimensions used in this study. This improves S/N valuesabove the conventional ASTM column dimension of 150 × 4.6 mm, 5 µm. The lowest resolution value observed with thiscolumn was 1.83, (between Irganox 1010 and Vitamin E) andis well within the Standard Pharmacopeia specification limit.Resolution provided by ZORBAX Eclipse Plus 50 × 4.6 mm, 3.5 µm column between Irganox 1010 and Vitamin E is usuallynot acceptable by Pharmacopeia (1.31), but included here todemonstrate the effect of resolution and sensitivity by reducing the column length.
Conclusions
Phenolic antioxidants, Vitamin E and Erucamide slip additivesin polypropylene formulations are well resolved and detectedusing Agilent’s 1120 Compact LC with variable wavelengthdetection at 200 nm UV/VIS detection. The excellent perfor-mance of Agilent 1120 Compact LC pump is established bydemonstrating high precision for retention times and areas aswell as excellent signal-to-noise ratios. Exceptional linearityof the Agilent 1120 Compact LC detector is demonstrated.The observed r2 values for all standards are >0.999. ThisApplication Note also demonstrates the applicability ofAgilent Method Translator software to obtain an equivalentmethod from ASTM D6042-09 when using different columndimensions. Improvement in peak sensitivity and lowestdetection limits are shown by reducing the column diameterand particle size.
References
1. ASTM D6042-09, “Standard Test Method forDetermination of Phenolic Antioxidants and ErucamieSlip Additives in Polypropylene Formulations Using LiquidChromatography (LC)”. Volume 08.03 Plastics (III): July2009
2. Wei Luan, Chunxiao Wang (Shanghai-China) and MichaelWoodman (Wilmington USA) “Fast Analysis ofTocopherol, Phenolic Antioxidants and Erucamide SlipAdditives in Polypropylene Homopolymer FormulationsUsing 1200 Rapid Resolution Liquid Chromatography(RRLC) with Rapid Resolution High Throughput (RRHT)Columns and Method Translator", Agilent TechnologiesPublication 5989-5849EN, 2009 .
3. Chun-Xiao Wang, Wei Luan (Shanghai-China) andMichael Woodman (Wilmington USA) "Analysis ofPhenolic Antioxidant and Erucamide Slip Additives inPolymer by Rapid-Resolution LC", Agilent TechnologiesPublication 5989-5850EN 2009.
www.agilent.com/chem/1120
© Agilent Technologies, Inc., 2010May 1, 2010Publication Number 5990-5630EN