Analysis of Performance of Spaced Piles to Stabilise Embankment and Cutting Slopes
38
Analysis of performance of spaced piles to stabilise embankment and cutting slopes Prepared for Quality Services (CE), Highways Agency D R Carder and M R Easton TRL Report 493
-
Upload
ravisalimath3936 -
Category
Documents
-
view
18 -
download
0
description
g
Transcript of Analysis of Performance of Spaced Piles to Stabilise Embankment and Cutting Slopes

Analysis of performance of spaced piles tostabilise embankment and cutting slopes
Prepared for Quality Services (CE), Highways Agency
D R Carder and M R Easton
TRL Report 493

First Published 2001ISSN 0968-4107Copyright TRL Limited 2001.
This report has been produced by TRL Limited, under/as partof a Contract placed by the Highways Agency. Any viewsexpressed are not necessarily those of the Agency.
TRL is committed to optimising energy efficiency, reducingwaste and promoting recycling and re-use. In support of theseenvironmental goals, this report has been printed on recycledpaper, comprising 100% post-consumer waste, manufacturedusing a TCF (totally chlorine free) process.

CONTENTS
Page
Executive Summary 1
1 Introduction 3
2 Applicability of finite element analysis to slope performance 3
3 Finite element analysis and mesh design 3
4 Construction sequence 5
5 Soil properties and in situ stresses 5
6 Preliminary assessment of slope stability 6
6.1 Cutting slope 66.2 Embankment slope 7
7 Results from analyses of cutting performance 7
7.1 Piles installed at the time of construction 77.1.1 Effect of stiffer stratum at depth 137.1.2 Effect of increasing the slope angle 157.1.3 Effect of further softening of the clay 15
7.2 Piles installed 20 years after construction 16
8 Results from analyses of embankment performance 16
8.1 Piles installed at the time of construction 168.1.1 Effect of increasing the slope angle 178.1.2 Effect of different pore water pressure regimes
and the drainage blanket 208.1.3 Effect of further softening of the clay 21
8.2 Piles installed 20 years after construction 21
9 Discussion 21
10 Summary and conclusions 28
10.1 Cutting slopes 2810.2 Embankment slopes 2910.3 General (cutting and embankment slopes) 29
11Acknowledgements 30
12 References 30
Appendix A: Analyses of performance of cuttingslope – results in stiffer clay 31
Abstract 33
Related publications 33
iii

iv

1
Executive Summary
The use of a single row of spaced piles for stabilisingslopes has been used widely and with success for someconsiderable time primarily elsewhere in Europe and inJapan. On the UK highway network the technique couldprovide a permanent and cost effective method of bothremediating potentially unstable or failed slopes and ofsteepening slopes in a widening situation. However, theavailability of design guidance on the use of thistechnique is limited: this is partly because the soil-structure interaction problem is complex and threedimensional in nature. This report discusses the resultsfrom three dimensional finite element analyses in whichthe performance of untreated cutting and embankmentslopes was compared with those stabilised using a singlerow of piles. The study concentrates on the performance ofclay slopes and discusses the implication of the findingsupon their design.
The finite element evaluation focused on the calculationof ground deformations under working loads, that is pre-failure, although the results provided a useful indicator ofthe potential rupture surface in clay slopes in the longerterm. Particular aspects which received attention includedthe effect of increasing the slope angle, different pilespacings, softening of the clay, and the influence ofdifferent pore water pressure regimes upon the results.
In addition to providing guidance on the variousmechanisms which need consideration in the design of thepiling system, the report compares the lateral stresses actingon and the bending moments developed in the piles withthose predicted using existing semi-empirical methods.
This report on numerical modelling is the third phase ofthe project. A review of the literature has already beenundertaken to establish the state-of-the-art in using spacedpiles to stabilise slopes. This was followed by a series ofcentrifuge model tests on the use of piles to stabilisecutting slopes constructed in clay. A full-scale trial of thetechnique on the highway network is also planned.

2
3
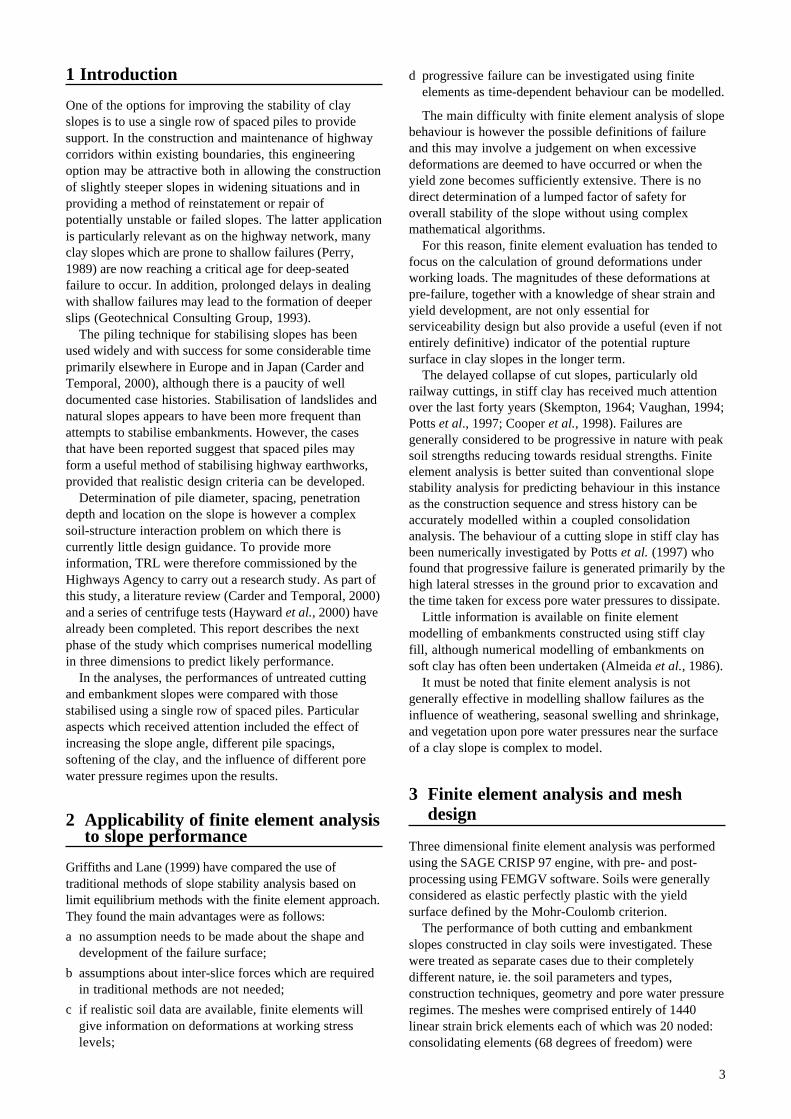
1 Introduction
One of the options for improving the stability of clayslopes is to use a single row of spaced piles to providesupport. In the construction and maintenance of highwaycorridors within existing boundaries, this engineeringoption may be attractive both in allowing the constructionof slightly steeper slopes in widening situations and inproviding a method of reinstatement or repair ofpotentially unstable or failed slopes. The latter applicationis particularly relevant as on the highway network, manyclay slopes which are prone to shallow failures (Perry,1989) are now reaching a critical age for deep-seatedfailure to occur. In addition, prolonged delays in dealingwith shallow failures may lead to the formation of deeperslips (Geotechnical Consulting Group, 1993).
The piling technique for stabilising slopes has beenused widely and with success for some considerable timeprimarily elsewhere in Europe and in Japan (Carder andTemporal, 2000), although there is a paucity of welldocumented case histories. Stabilisation of landslides andnatural slopes appears to have been more frequent thanattempts to stabilise embankments. However, the casesthat have been reported suggest that spaced piles mayform a useful method of stabilising highway earthworks,provided that realistic design criteria can be developed.
Determination of pile diameter, spacing, penetrationdepth and location on the slope is however a complexsoil-structure interaction problem on which there iscurrently little design guidance. To provide moreinformation, TRL were therefore commissioned by theHighways Agency to carry out a research study. As part ofthis study, a literature review (Carder and Temporal, 2000)and a series of centrifuge tests (Hayward et al., 2000) havealready been completed. This report describes the nextphase of the study which comprises numerical modellingin three dimensions to predict likely performance.
In the analyses, the performances of untreated cuttingand embankment slopes were compared with thosestabilised using a single row of spaced piles. Particularaspects which received attention included the effect ofincreasing the slope angle, different pile spacings,softening of the clay, and the influence of different porewater pressure regimes upon the results.
2 Applicability of finite element analysisto slope performance
Griffiths and Lane (1999) have compared the use oftraditional methods of slope stability analysis based onlimit equilibrium methods with the finite element approach.They found the main advantages were as follows:
a no assumption needs to be made about the shape anddevelopment of the failure surface;
b assumptions about inter-slice forces which are requiredin traditional methods are not needed;
c if realistic soil data are available, finite elements willgive information on deformations at working stresslevels;
d progressive failure can be investigated using finiteelements as time-dependent behaviour can be modelled.
The main difficulty with finite element analysis of slopebehaviour is however the possible definitions of failureand this may involve a judgement on when excessivedeformations are deemed to have occurred or when theyield zone becomes sufficiently extensive. There is nodirect determination of a lumped factor of safety foroverall stability of the slope without using complexmathematical algorithms.
For this reason, finite element evaluation has tended tofocus on the calculation of ground deformations underworking loads. The magnitudes of these deformations atpre-failure, together with a knowledge of shear strain andyield development, are not only essential forserviceability design but also provide a useful (even if notentirely definitive) indicator of the potential rupturesurface in clay slopes in the longer term.
The delayed collapse of cut slopes, particularly oldrailway cuttings, in stiff clay has received much attentionover the last forty years (Skempton, 1964; Vaughan, 1994;Potts et al., 1997; Cooper et al., 1998). Failures aregenerally considered to be progressive in nature with peaksoil strengths reducing towards residual strengths. Finiteelement analysis is better suited than conventional slopestability analysis for predicting behaviour in this instanceas the construction sequence and stress history can beaccurately modelled within a coupled consolidationanalysis. The behaviour of a cutting slope in stiff clay hasbeen numerically investigated by Potts et al. (1997) whofound that progressive failure is generated primarily by thehigh lateral stresses in the ground prior to excavation andthe time taken for excess pore water pressures to dissipate.
Little information is available on finite elementmodelling of embankments constructed using stiff clayfill, although numerical modelling of embankments onsoft clay has often been undertaken (Almeida et al., 1986).
It must be noted that finite element analysis is notgenerally effective in modelling shallow failures as theinfluence of weathering, seasonal swelling and shrinkage,and vegetation upon pore water pressures near the surfaceof a clay slope is complex to model.
3 Finite element analysis and meshdesign
Three dimensional finite element analysis was performedusing the SAGE CRISP 97 engine, with pre- and post-processing using FEMGV software. Soils were generallyconsidered as elastic perfectly plastic with the yieldsurface defined by the Mohr-Coulomb criterion.
The performance of both cutting and embankmentslopes constructed in clay soils were investigated. Thesewere treated as separate cases due to their completelydifferent nature, ie. the soil parameters and types,construction techniques, geometry and pore water pressureregimes. The meshes were comprised entirely of 1440linear strain brick elements each of which was 20 noded:consolidating elements (68 degrees of freedom) were

4
employed for the soil strata and non-consolidatingelements (60 degrees of freedom) were employed for thebored piles. The geometry of the slopes was based upon‘typical’ dimensions that would be commonly employedby the Highways Agency in a road scheme.
The initial geometry in the cutting situation, asindicated in Figure 1a, allowed for a 1v:2h slope (ie. aslope angle of about 27o) which was 8m high. Someanalyses were subsequently carried out for a steeper slopeof 1v:1.5h (ie. a slope angle of about 34o) with the slope
height being maintained at 8m. The performance of theslope was investigated with or without the inclusion of0.8m diameter bored piles whose depths could be varied.The mesh was constructed in plan (Figure 1b) to allowconsideration of an unreinforced slope or slopes reinforcedwith piles spaced at centres of 3 or 6 pile diameters. Themesh boundary was 36m away from the crest of the cuttingand this was considered to be sufficiently remote toeliminate edge effects. The centre of the cutting was 15mfrom the toe of the slope so that a motorway could be
21
6 m
Y
X
36 m 15 m16 m
8 m
37.5 m
CL
CL
(a) Section
(b) Plan
(c) Section showing elements
Z
X
9.6 m
Piles can be arranged atcentres of 3 or 6 diameters
Y
X
Figure 1 Details of the finite element mesh (cutting slope)

5
Table 1 Effective stress soil parameters
Soil type A Soil type BDescription (stiff clay) (soft clay)
Elastic modulus, E' (MPa) 6.6 4Rate of increase with depth, mE' (MPa/m) 3.2 0.5Angle of friction, ϕ' (o) 2 0 20Cohesion, c' (kPa) 12 12Poisson’s ratio, ν 0.2 0.2Horizontal permeability, k
x (m/year) 0.015 0.015
Vertical permeability, ky (m/year) 0.003 0.003
accommodated within the cut. Figure 1c shows a view inthe x-y plane of the mesh design and fixities of both thevertical boundaries were such that displacement was onlypermitted in the y-direction. The appropriate fixity for thex-y plane was separately investigated in preliminary runs.These runs were carried out with displacement constraintsin both the x- and z-directions on this plane using a meshwhich had been greatly elongated in the z-direction.However this was found to be onerous in computing timeand a sufficiently good approximation was achieved usingthe reduced mesh size shown in Figure 1b and fixity of thex-y plane boundaries in only the z-direction.
The dimensions of the mesh used to analyse theembankment slope were essentially similar to those givenin Figure 1 for the cutting slope with the followingexceptions. The distance from the mesh boundary to thecrest of the embankment was limited to 15m to allow for amotorway construction on top of the embankment. Alsothe distance to the boundary in front of the toe of the slopewas increased to 36m, so that this boundary was remote.
In all cases, the finite element analysis incorporatedcoupled consolidation. The pore water pressure regimeswere however different for the cutting and embankmentanalyses as follows:
a In the cutting situation, a hydrostatic distribution ofpore water pressure from a water table at 1m depth wasassumed at the boundary remote from the slope crest.The water table at the bottom of the slope was assumedto be at ground level for the long-term consolidationanalysis (although this condition was only applied afterexcavation was complete). No other pore pressurefixities were assumed and the drawdown of the watertable in the slope was that calculated during theconsolidation analysis.
b In the embankment situation, a hydrostatic distributionof pore water pressure with depth from the surface wasassumed in the in situ ground prior to the embankmentconstruction. Following construction, a perched watertable at a depth of 1m was assumed beneath the top-surface of the embankment. Pore pressure fixities werealso applied on the vertical boundary of symmetry at thecentre of the embankment. These allowed for ahydrostatic increase in pore pressure to mid-height of theembankment, below this a reduction in pore pressureoccurred because of the presence of the drainage blanket.Beneath the drainage blanket, pore water pressures againbuilt up hydrostatically. Pore pressures elsewhere in theslope were those calculated as a result of theconsolidation process. For the embankment case, theadverse effect of a build-up in pore pressures in the slopewere also separately investigated as described later.
4 Construction sequence
The performance of highway slopes, both unreinforcedand reinforced, will depend on their method ofconstruction and whether it is a cutting or embankmentwhich is under consideration. The construction techniquewill have a particular influence upon soil parameters such
as strength and stiffness and also on the in situ stress state:these factors are discussed in Section 5.
In both cases, the performance of the highway slopeover its 60 year design life was investigated with thefollowing situations being modelled:
� an unreinforced clay slope;
� a clay slope reinforced by a row of spaced piles at thetime of construction;
� a 20 year old unreinforced clay slope subsequentlyreinforced by a row of spaced piles during remedialworks to improve its stability.
Within the general framework outlined above, the effectof an increased slope angle, different pile spacings, andthe effect of embedment of the pile toe into a stifferstratum were also investigated in specific instances. In thecase of an embankment slope, the effect of a drainageblanket beneath the embankment received some attention.A general sensitivity analysis of all these parameters wasnot however possible because of the heavy demands oncomputing time which would have been required for thisnumber of variables.
Where the slope was reinforced by piles, theirinstallation was modelled by directly interchanging soilelements with pile elements of the same size. In this waytheir installation could be conveniently arranged eitherduring the slope construction phase or after the slope hadbeen in service for 20 years.
5 Soil properties and in situ stresses
Soil parameters were adopted which were typical of those ofan over-consolidated clay, such as London Clay, and theseare shown in Table 1. Peak shear strength parameters of c
p'
from 17kPa to 25kPa and ϕp' of 20o to 29o might be expected
for unweathered clay in such geology (Cripps and Taylor,1986). However, in a slope situation, weathering andsoftening of the clay would occur. For this reason, reducedvalues with a c' of 12kPa and a ϕ' of 20o were adopted formost of the analyses although a limited number were alsocarried with c' of 5kPa and a ϕ' of 18o to simulate furthersoftening. It must be noted that because a strain softening soilmodel was not being employed for this analysis, the resultsmust be viewed as only providing guidance as toperformance pre-failure. After the onset of failure a moresignificant reduction in strength parameters to residual valueswould be expected and a limited investigation of this isincluded by further reducing soil strength parameters.
6
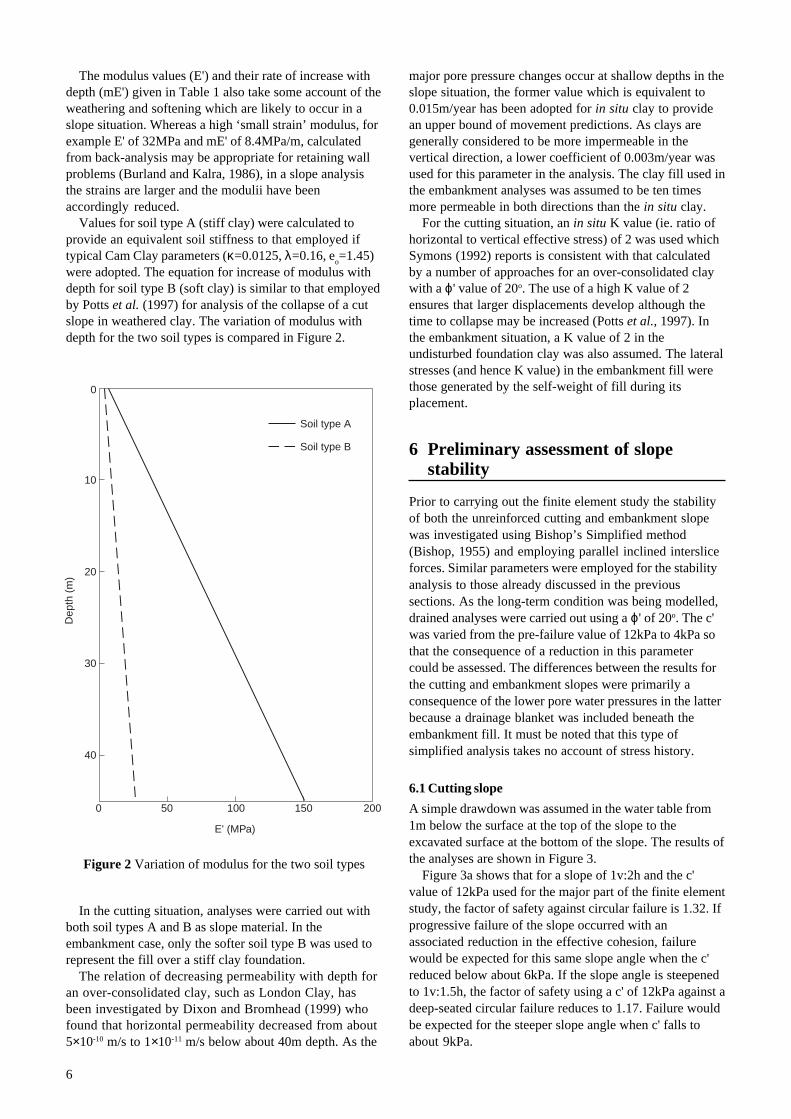
The modulus values (E') and their rate of increase withdepth (mE') given in Table 1 also take some account of theweathering and softening which are likely to occur in aslope situation. Whereas a high ‘small strain’ modulus, forexample E' of 32MPa and mE' of 8.4MPa/m, calculatedfrom back-analysis may be appropriate for retaining wallproblems (Burland and Kalra, 1986), in a slope analysisthe strains are larger and the modulii have beenaccordingly reduced.
Values for soil type A (stiff clay) were calculated toprovide an equivalent soil stiffness to that employed iftypical Cam Clay parameters (κ=0.0125, λ=0.16, e
o=1.45)
were adopted. The equation for increase of modulus withdepth for soil type B (soft clay) is similar to that employedby Potts et al. (1997) for analysis of the collapse of a cutslope in weathered clay. The variation of modulus withdepth for the two soil types is compared in Figure 2.
major pore pressure changes occur at shallow depths in theslope situation, the former value which is equivalent to0.015m/year has been adopted for in situ clay to providean upper bound of movement predictions. As clays aregenerally considered to be more impermeable in thevertical direction, a lower coefficient of 0.003m/year wasused for this parameter in the analysis. The clay fill used inthe embankment analyses was assumed to be ten timesmore permeable in both directions than the in situ clay.
For the cutting situation, an in situ K value (ie. ratio ofhorizontal to vertical effective stress) of 2 was used whichSymons (1992) reports is consistent with that calculatedby a number of approaches for an over-consolidated claywith a ϕ' value of 20o. The use of a high K value of 2ensures that larger displacements develop although thetime to collapse may be increased (Potts et al., 1997). Inthe embankment situation, a K value of 2 in theundisturbed foundation clay was also assumed. The lateralstresses (and hence K value) in the embankment fill werethose generated by the self-weight of fill during itsplacement.
6 Preliminary assessment of slopestability
Prior to carrying out the finite element study the stabilityof both the unreinforced cutting and embankment slopewas investigated using Bishop’s Simplified method(Bishop, 1955) and employing parallel inclined intersliceforces. Similar parameters were employed for the stabilityanalysis to those already discussed in the previoussections. As the long-term condition was being modelled,drained analyses were carried out using a ϕ' of 20o. The c'was varied from the pre-failure value of 12kPa to 4kPa sothat the consequence of a reduction in this parametercould be assessed. The differences between the results forthe cutting and embankment slopes were primarily aconsequence of the lower pore water pressures in the latterbecause a drainage blanket was included beneath theembankment fill. It must be noted that this type ofsimplified analysis takes no account of stress history.
6.1 Cutting slope
A simple drawdown was assumed in the water table from1m below the surface at the top of the slope to theexcavated surface at the bottom of the slope. The results ofthe analyses are shown in Figure 3.
Figure 3a shows that for a slope of 1v:2h and the c'value of 12kPa used for the major part of the finite elementstudy, the factor of safety against circular failure is 1.32. Ifprogressive failure of the slope occurred with anassociated reduction in the effective cohesion, failurewould be expected for this same slope angle when the c'reduced below about 6kPa. If the slope angle is steepenedto 1v:1.5h, the factor of safety using a c' of 12kPa against adeep-seated circular failure reduces to 1.17. Failure wouldbe expected for the steeper slope angle when c' falls toabout 9kPa.
Figure 2 Variation of modulus for the two soil types
In the cutting situation, analyses were carried out withboth soil types A and B as slope material. In theembankment case, only the softer soil type B was used torepresent the fill over a stiff clay foundation.
The relation of decreasing permeability with depth foran over-consolidated clay, such as London Clay, hasbeen investigated by Dixon and Bromhead (1999) whofound that horizontal permeability decreased from about5×10-10 m/s to 1×10-11 m/s below about 40m depth. As the
Dep
th (
m)
0
10
20
30
40
50 100 150 2000
E' (MPa)
Soil type A
Soil type B

7
The location of the critical slip surface for a 1v:2h slopeis shown in Figure 3b for the upper and lower limits of c'which were investigated. When using the higher c' of12kPa, the increased yield stress meant that a slightlydeeper seated failure was obtained which emerged at theground surface just in front of the toe of the slope.
This preliminary assessment, based on typical propertiesfor over-consolidated clays, provided some justification ofthe choice of cutting slope angle for the finite elementstudy. Generally a slope angle of 1v:2h appeared to have areasonable factor of safety against deep-seated failure evenif some softening of the clay occurred. The stability of asteeper slope of 1v:1.5h was more marginal with littlecontingency if any softening occurred.
6.2 Embankment slope
In addition to the simple drawdown of pore water pressuresassumed in the analysis of the cutting slope, theembankment analysis included a 0.5m thick drainageblanket at foundation level comprising (c'=0,ϕ'=30o,E'=100MPa) granular material. This resulted inlower pore water pressures in the slope and generallyimproved factors of safety as shown in Figure 4a. In thisfigure, there are some small discontinuities in the plots asthe slope angle steepens, these tend to occur when thecritical slip surface starts to extend slightly into thedrainage blanket.
For embankment slopes of 1v:2h, the critical slipsurface tends to stop at the drainage blanket and is not asdeep-seated as for a cutting slope (Figure 4b). This is aneffect which is reproduced in the subsequent finiteelement analysis.
On the basis of this preliminary assessment, the factor ofsafety of a 1v:2h embankment slope against circularfailure for a c' value of 12kPa is 1.55 and failure of theslope would be expected after softening had occurred andthe c' was about 4kPa. Failure of a steeper 1v:1.5h slopewould only be expected when the c' falls to about 7kPa, ie.a greater margin of safety than with the same cutting slope.
7 Results from analyses of cuttingperformance
The effect of installing a single row of spaced piles tostabilise a cutting slope was investigated analytically forthe two situations of (i) the piles being installed at thetime of construction and (ii) the piles being installed 20years after slope construction. In both situations, theresults were compared with the predicted performance of asimilar unreinforced slope.
7.1 Piles installed at the time of construction
The long-term development in the overall pattern ofmovement of the unreinforced slope after excavation ofthe cutting is shown in Figure 5. Vectors of movement areshown together with the deformed shape (not to the samescale) of the slope. The vectors indicate that, as aconsequence of the long-term dissipation of negativeexcess pore water pressures (caused by the unloading dueto excavation of the cutting), a significant heave of theground at cutting level develops. The results also indicatethat the potential rupture surface is likely to emerge
Figure 3 Results from drained stability analysis of cuttingslope Figure 4 Results from drained stability analysis of
embankment slope
Fact
or o
f saf
ety 1.5
2
1
0.5
20 30 40 50
Slope angle ( )
c' = 4kPac' = 6kPac' = 8kPac' = 10kPac' = 12kPa
o' = 20 throughout
(a) Variation of factor of safety with slope angle
(b) Location of critical slip surface for a 1v:2h slope
Water table
c' = 12kPa c' = 4kPa
1v:2h1v:1.5h
Fact
or o
f saf
ety 1.5
2
1
0.5
20 30 40 50
Slope angle ( )
c' = 4kPac' = 6kPac' = 8kPac' = 10kPac' = 12kPa
o' = 20 throughout
(a) Variation of factor of safety with slope angle
1v:2h1v:1.5h
(b) Location of critical slip surface for a 1v:2h slope
Water table
c' = 12kPa c' = 4kPa
Drainage blanket

8
further behind the crest of the slope than would bepredicted by conventional slope stability analysis(Section 6). However the latter method takes no account ofthe in situ stress regime and the stress history due toexcavation of the cutting.
The installation of spaced piles does not significantlyconstrain the magnitude of ground heave, but will act tolimit the lateral displacement of the ground. Figures 6aand 6b compare the contours of lateral displacementpredicted for soil type B (soft clay) after 60 years inservice for the natural (unreinforced) slope and a slopeheavily reinforced by piles at 3 diameter centres. A closecomparison of the lateral displacement results shows thatslightly larger values are calculated at the toe of theunreinforced slope, but the main difference is that theaction of the piles restricts the magnitude and extent of thedisplacement contours immediately behind the piles.
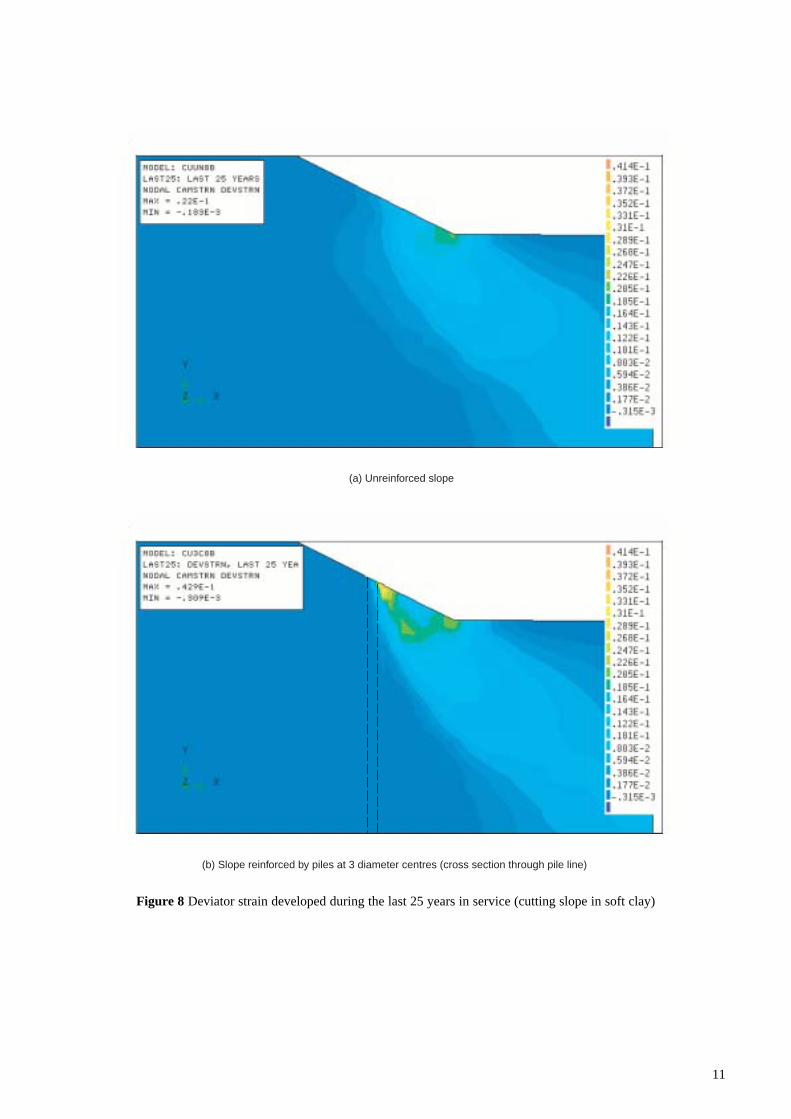
This effect is better demonstrated in Figure 7 whichconsiders the deviator strains (which are about twice themagnitude of the shear strains) for the same analyses. Higherstrains are shown developing beneath the body of theunreinforced slope with some indication of the initialdevelopment of a yield surface. In the case of the reinforcedslope, the piles act to curtail the development of strainbehind the piles although, as might be expected, there isevidence that a smaller slip could still eventually occur infront of the pile. There are early signs of a build-up in strainappearing near the slope surface in front of the piles.
The deviator strains in Figure 7 are predicted after theslope has been in service for 60 years. As discussedpreviously a large component of these strains is caused bythe initial unloading due to excavation of the cutting. Ifonly the strain increment over the last 25 years in serviceis investigated, the results in Figure 8 are obtained. Thistype of contour plot has the advantage of only displaying
areas where shearing is still continuing. In Figure 8b forexample, the zone of likely yielding in front of the piles ismore clearly defined. As before, strain in the unreinforcedslope is slowly developing from the toe of the slope andwould eventually be expected to produce a deep-seatedfailure which encompasses the complete slope.
The results in Figures 6, 7 and 8 are for the lower modulusclay (soil type B). Similar trends in behaviour are shown byanalyses using the stiffer clay (soil type A), although themagnitudes of the displacements and strains developed aresmaller. Figure A1 in Appendix A gives the deviator strainsdeveloped in the stiffer clay after 60 years in service: thesecan be compared with the results in Figure 7.
A summary of the lateral displacements of the piles andground predicted after 60 years in service and for the last25 years in service are shown in Figure 9. In this figure,pile displacements are compared both with that of theground midway between two piles and also with that ofthe ground at the same location in an unreinforced(control) slope. Figures 9a and 9b show the calculateddisplacements with piles at 3 diameter and 6 diametercentres respectively. Inspection of the results indicates alarge lateral movement of the toe of the piles at 19.5mdepth. This is considered a consequence of the unloadingdue to excavation of the cutting and is expected to be lessevident if the piles are founded in a stiffer stratum thanwas used in the analysis: this effect is investigated later. InFigure 9 it is the relative displacements, particularly ataround 3m depth (ie. the depth from the top of the piles tocutting level), which are important rather than the absolutevalues. These analyses are based on a cutting slope in theclay of lower modulus (soil type B), the results for thestiffer clay show smaller displacements and are given inFigure A2 of Appendix A.
Figure 5 Ground movements after 60 years in service (unreinforced cutting slope in soft clay)

9
(a) Unreinforced slope
(b) Slope reinforced by piles at 3 diameter centres (cross section through pile line)
Figure 6 Lateral displacement after 60 years in service (cutting slope in soft clay)

10
(a) Unreinforced slope
(b) Slope reinforced by piles at 3 diameter centres (cross section through pile line)
Figure 7 Deviator strain after 60 years in service (cutting slope in soft clay)
11
(a) Unreinforced slope
(b) Slope reinforced by piles at 3 diameter centres (cross section through pile line)
Figure 8 Deviator strain developed during the last 25 years in service (cutting slope in soft clay)

12
0
5
10
15
20
25
Dep
th (
m)
100 150 200 250
Lateral displacement after 60 years (mm)
0
5
10
15
20
25
Dep
th (
m)
5 10 15 20 25
Lateral displacement over last 25 years (mm)
0
5
10
15
20
25
Dep
th (
m)
100 150 200 250
Lateral displacement after 60 years (mm)
(a) Piles at 3 diameter centres
(b) Piles at 6 diameter centres
0
5
10
15
20
25
Dep
th (
m)
5 10 15 20 25
Lateral displacement over last 25 years (mm)
On line pile Off line pile Control
Figure 9 Displacement plots for cutting slope in soft clay

13
In Figure 9, lateral displacements after 60 years inservice of the unreinforced slope peaked at about 3mdepth and were significantly above those calculated forthe piles at this depth. The ground displacements at thisdepth and midway between piles at 6 diameter centres(Figure 9b) were generally between those calculated onthe pile line and those for the unreinforced slope. Thisindicated that at this pile spacing, soil flow between pileswas starting to develop and was likely to become moresignificant if the piles were spaced further apart. When thepiles were closely spaced at 3 diameter centres (Figure 9a),there was little differential displacement between the pileand adjoining ground. Also shown in Figure 9 are theincremental displacements over the last 25 years whichtend to confirm the same mechanisms although it is moreevident that displacements, particularly at depths of up to10m, are continuing at a faster rate in the unreinforcedthan the reinforced slopes.
It is interesting to note that displacements near thesurface of the slope are generally not a good indicator ofoverall performance in Figures 9 and A2. This is because areversal in curvature occurs at shallow depths in theground displacement plots which is not observed in piledisplacement plots.
Figure 10 summarises the bending moment profile withdepth for the different soil types and spacing betweenpiles. As would be anticipated much higher bendingmoments of the pile are developed in the lower modulusclay as the larger ground movements mean that the pileshave to do more work. The results in Figure 10 also showthat the moment profiles in one particular soil type arevery similar whether the piles are spaced at 3 or 6 diametercentres: this is primarily because the potential failureplane in a cutting slope is relatively deep-seated. Ingeneral the magnitudes of the bending moments are lowand this is because of the pile toe movements discussedabove which act to reduce pile moments. Larger momentsare developed when the piles are founded in a stifferstratum at depth and this situation is now considered.
7.1.1 Effect of stiffer stratum at depthThe magnitude of the heave developed because of theunloading during excavation of the cutting is sensitive tothe stiffness of the ground below cutting level. Figure 11shows the displacement vectors calculated for anunreinforced slope after 60 years in service when a stifferstratum was introduced below a depth of 15.5m from thetop of the slope (10.5m from the top of the pile, wherepresent). This stratum was arbitrarily assigned a modulusof 150MPa which was constant with depth, although itsother properties remained the same as for the overlyinglayer. Little ground movement was predicted in the stifferstratum and vertical movements elsewhere were thengenerally about two thirds of those shown forhomogeneous soil in Figure 5.
The effect of a stiffer stratum at depth was investigatedfor the piled slope where there was most slope movement,ie. for the soft clay with piles at the larger spacing of 6diameters between centres. The various displacement plots
Dep
th (
m)
10
5
0
15
20-200 -100 1000 200-300
Bending moment (kNm)
Soft clay
+ve moment is compression of front face
Stiff clay
Piles at 3 dia centres Piles at 6 dia centres
at the pile and equivalent ground location, with andwithout the stiffer stratum, are compared in Figure 12.Only small lateral movements of either the pile or groundwithin the stiffer stratum were calculated. Overalldisplacements in the soft clay after 60 years in service(Figure 12a) were also significantly reduced with anunderlying stiffer stratum. Once again the pattern ofbehaviour indicated that with piles at 6 diameter centres,some soil flow was starting to develop between the piles.However in general, there was a larger difference indisplacements between the piled and natural slope when astiffer underlying stratum was present in both cases. This isalso demonstrated by the results in Figure 12b where theincremental displacements over the last 25 years indicatethat movement of the unreinforced slope is proceeding at amuch faster rate than that of the piled slope.
The reduction in the magnitude of ground movementsthat results from founding the piles in a stiffer stratum issignificant with more of the perturbing load being borneby the piles and hence a much larger bending momentdevelops in the pile near to the interface between the softclay and the stiffer stratum as shown in Figure 13. Forexample, in the case of piles spaced at 6 diameter centres,the peak bending moment (compression of the front faceof the pile) increases from 140 to 2300kNm when the pileis founded in the stiffer stratum. In design, attention isthen needed to ensure that failure does not occur with thedevelopment of a plastic hinge in the pile.
Figure 10 Pile bending moment in cutting slopes

14
Stiffer stratum
0
5
10
15
20
25
Dep
th (
m)
10050 150 200 250
Lateral displacement after 60 years (mm)
On line pile Off line pile Control
0
(a)
0
5
10
15
20
25
Dep
th (
m)
Lateral displacement over last 25 years (mm)
0 5 10 15 20 25 30 35 40
(b)
stiff stratum
no stiff stratum no stiff stratum
stiff stratum
Figure 11 Ground movements after 60 years in service with a stiff underlying stratum (cutting slope in soft clay)
Figure 12 Effect upon displacement of founding the pile in a stiffer stratum (cutting slope in soft clay; piles at 6 diametercentres)

15
0
5
10
15
20
Dep
th (
m)
500 1000 15000 2000 2500-500
Bending moment (kNm)
Soft clay throughout
+ve moment is compression of front face
Stifferstratum
Piles at 3 dia centres Piles at 6 dia centres
Soft clay
Figure 13 Pile bending moments developed after 60 yearsin service (cutting slope)
Table 2 Peak lateral displacements for soft clay cuttingsof varying angle
Slope 1v:2h Slope 1v:1.5h
Lateral LateralDepth displace- Depth displace-
(m) ment (mm) (m) ment (mm)
Piles at 3 diameter centres 2.00 225 1.65 255Piles at 6 diameter centres 2.40 235 1.75 266Unreinforced slope 2.80 248 1.85 276
Displacements are calculated in the ground midway between piles orat the equivalent location in the unreinforced slope case.
Table 3 Peak pile bending moments for soft clay cuttingsof varying angle
Slope 1v:2h Slope 1v:1.5h
Peak bending Peak bendingDepth moment (kNm) Depth moment (kNm)
(m) +ve -ve (m) +ve -ve
Piles at 3 4.2 – -255 3.8 – -150diameter centres 14.6 125 – 13.2 170 –
Piles at 6 4.1 – -250 3.7 – -130diameter centres 13.5 140 – 12.6 206 –
Positive bending moments are compression of the front face of the pile.
7.1.2 Effect of increasing the slope angleThe sensitivity of the results to slope angle wasinvestigated by repeating selected analyses using a steeperslope angle (about 34o) corresponding to 1v:1.5h. Theseanalyses assume the soil is homogeneous and do not takeinto account the effect of a stiffer stratum at depth. Acomparison of the magnitude and depth of the peak lateraldisplacements of the ground are shown in Table 2. Theactual magnitudes of the displacements are againinfluenced by the unloading effect due to excavation ofthe cutting and it is the relative magnitudes rather theabsolute values which are important.
The trends given in Table 2 indicate that for the twoslope angles, both the depth to the peak movement and themagnitude of the movement decreased as the number ofpiles increased. This in itself is a justification of thereinforcing effect which piles will have on a marginallystable clay slope. The results in Section 6.1 where simpleslope stability analyses were undertaken suggest that thefactor of safety of the natural slope reduces from 1.32 to1.17 with the change in slope angle. The finite elementmodelling confirmed that steepening of the slope angle
induced more lateral displacement of the ground, althoughgenerally more yielding would be anticipated before failure.
The corresponding peak positive and negative bendingmoments calculated in a pile from the analyses using thetwo slope angles are given in Table 3. Generally the peaknegative bending moments (compression of the back faceof the pile) were predicted at about 4m depth, ie. a fewmetres below the depth at which the maximum lateralmovements occurred. Peak positive moments werecalculated at depths ranging between 12.6m to 14.6m. Thelargest peak positive moment of 206kNm was determinedwith the piles at 6 diameter centres for the 1v:1.5h slopewhich tended to confirm that, when the piles were at thelarger spacing in the steeper slope, they were being calledon to provide most bending moment resistance.
7.1.3 Effect of further softening of the clayIt is important to emphasise again that the soil strengthparameters generally used in this report relate to pre-failure behaviour as a strain softening model was not used.For the analyses, the operational strength was reduced byusing a value of ϕ' below its peak. However the extent ofsoftening is not easily quantified and soil parameters areexpected to lie between the peak and residual strength(Potts et al., 2000). The effect of a further reduction instrength was therefore crudely evaluated by assigninglower soil parameters of c'=5kPa and ϕ'=18o to the claywithin the slope area whilst all other parameters were keptthe same. The general trends of behaviour remained thesame as before although the magnitudes of the movementsand pile bending moments increased. For example, with aslope of 1v:2h, the maximum displacements calculated in

16
the ground midway between piles (at both 3 and 6diameter centres) increased by about 25%. The lateraldisplacement of the ground at an equivalent location inthe unreinforced slope increased slightly more, ie. 30%.
It must be pointed out that as the residual strength of theclay is approached, the appropriateness of a continuummodel such as finite elements must be treated with cautionas discontinuities may develop.
7.2 Piles installed 20 years after construction
When piles are installed as a remedial measure some 20years after construction, a considerable part of the heaverelated movement due to the unloading caused byexcavation of the cutting has occurred. Figure 14 showsthe lateral displacement plots at the pile and equivalentground location which occur in the following 40 yearsafter pile installation to reinforce the slope. Movements ofthe natural slope over the same period are largerconfirming that the piles provide a restraint to groundmovement. These values can be compared with those inFigure 9a for the full 60 years life in service which, asexpected, are an order of magnitude larger.
Changes in deviator strain over the last time incrementare similar to those shown in Figure 8 and again show that,although soil strain behind the pile and the possibility ofan overall failure are reduced by installing piles, a smallerslip may develop in front of the piles in the much longerterm. It was concluded that in impermeable clays thedissipation of negative excess pore pressures may takemany decades. For this reason, benefits for cutting slopesof marginal stability will still accrue if reinforcing pilesare installed after construction and well into the 60 yearservice life of the slope.
8 Results from analyses of embankmentperformance
The stabilising effect of a single row of spaced piles on anembankment slope constructed from clay fill wasinvestigated. Throughout the analyses, the soft clay (soiltype B in Table 1) was used for the fill material and theunderlying stiff clay foundation comprised soil type A.The effects of installing the piles at the time ofconstruction and 20 years after slope construction werestudied separately.
8.1 Piles installed at the time of construction
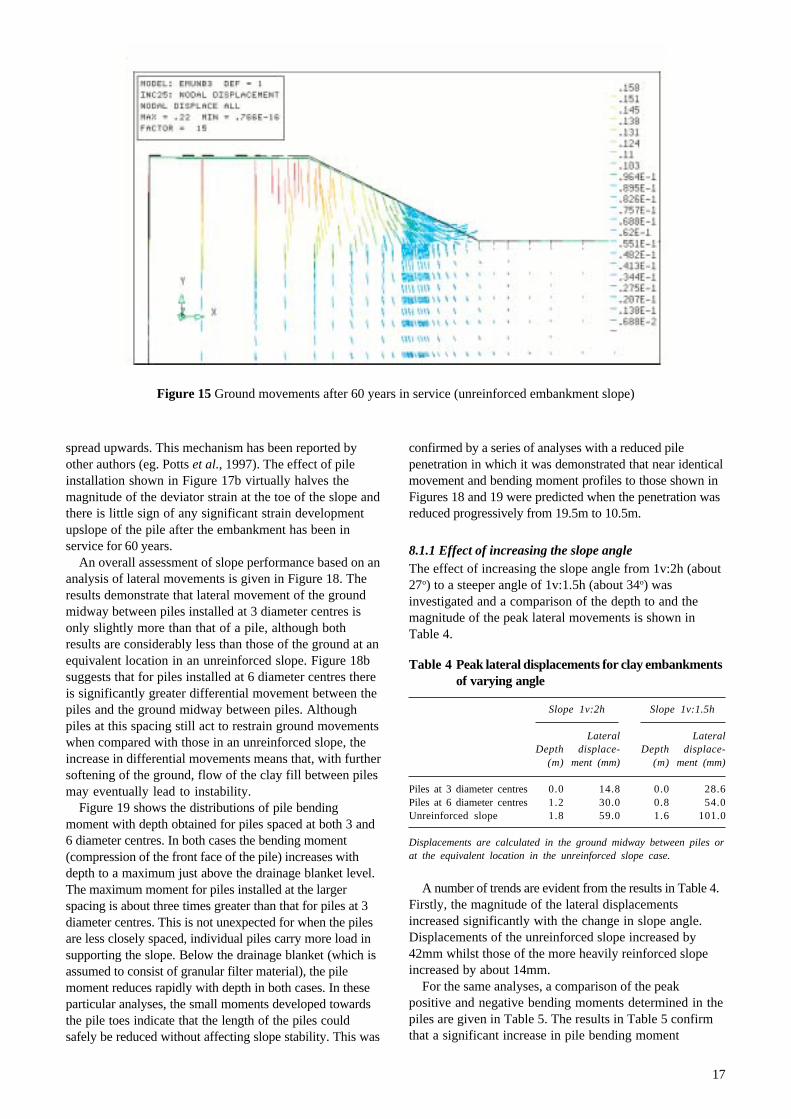
The overall pattern of movement predicted after anunreinforced embankment has been in service for 60 yearsis shown in Figure 15. Whereas with the cutting situationthe development of movement was dominated by arotational heave due to the unloading caused byexcavation, this does not occur in the embankment model.Settlement occurs mainly in the embankment fill withsome in the foundation clay due to the applied surchargeloading. Only very small lateral movements are predictedbeneath the granular drainage blanket with indicationsthat potential rupture is confined to the slope above thedrainage blanket, this correlates with the findings of theslope stability analysis given in Figure 4. The zone ofrupture in the embankment case is generally much smallerthan that predicted for a cutting slope (Figure 5).
A closer examination of the contours of lateralmovement for an unreinforced and reinforced embankmentis given in Figure 16. For the unreinforced embankment(Figure 16a), the cut-off in lateral movement at thedrainage blanket and the potential development of rupturefrom a location near to the toe of the slope are evident. Fora slope with piles at 3 diameter centres, the lateral groundmovement on a cross-section through the line of one of thepiles is shown in Figure 16b. In this case the piles appeareffective in minimising movement of the slope behindthem. Some localised movement still occurs at the toe ofthe slope but it is much reduced in magnitude from thatwhich is determined for the unreinforced slope.
A study of the deviator strains (which are about twicethe magnitude of the shear strains) confirms thisbehaviour. Figure 17a shows the strains in theunreinforced slope and indicates that a potential rupturesurface is likely to initiate at the toe of the slope and
5
0
10
15
20
25
Dep
th (
m)
2010 30 40 50
Lateral displacement over last 40 years (mm)
On line pile Off line pile Control
0
Piles installed at 3 diameter centres, 20 years after cutting excavation
Figure 14 Displacement plot for cutting slope in soft clay(40 years after installing piles)
17
Figure 15 Ground movements after 60 years in service (unreinforced embankment slope)
spread upwards. This mechanism has been reported byother authors (eg. Potts et al., 1997). The effect of pileinstallation shown in Figure 17b virtually halves themagnitude of the deviator strain at the toe of the slope andthere is little sign of any significant strain developmentupslope of the pile after the embankment has been inservice for 60 years.
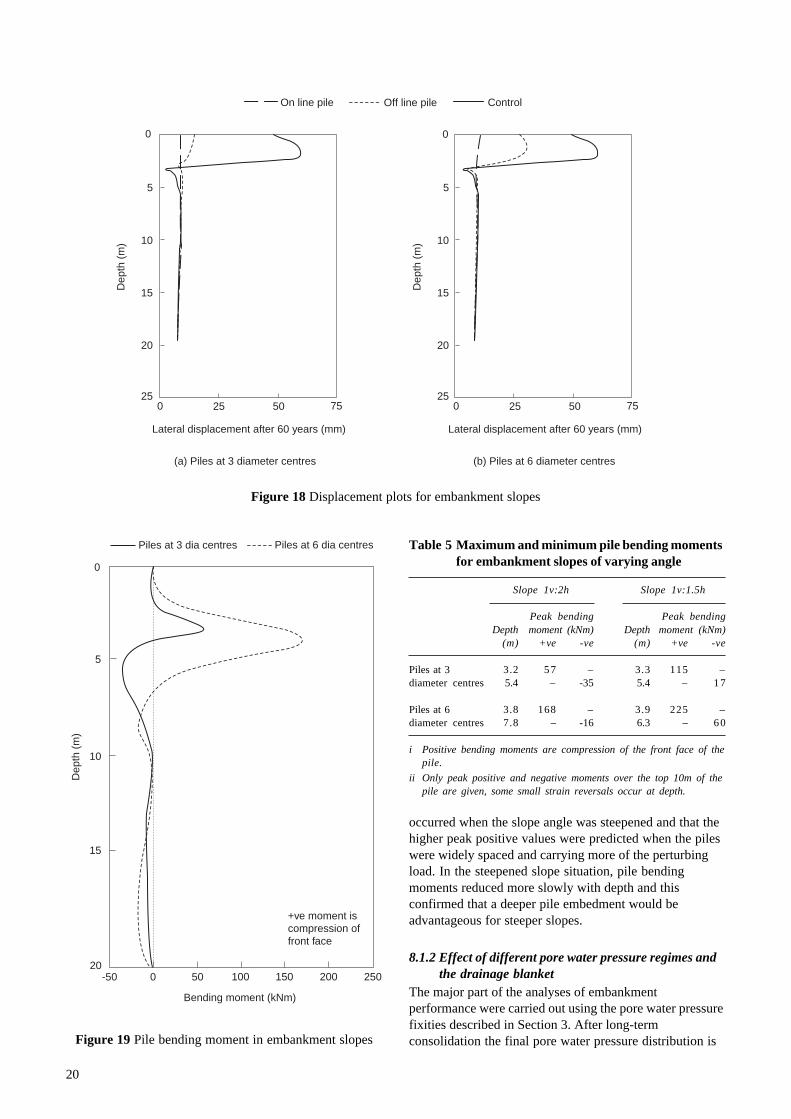
An overall assessment of slope performance based on ananalysis of lateral movements is given in Figure 18. Theresults demonstrate that lateral movement of the groundmidway between piles installed at 3 diameter centres isonly slightly more than that of a pile, although bothresults are considerably less than those of the ground at anequivalent location in an unreinforced slope. Figure 18bsuggests that for piles installed at 6 diameter centres thereis significantly greater differential movement between thepiles and the ground midway between piles. Althoughpiles at this spacing still act to restrain ground movementswhen compared with those in an unreinforced slope, theincrease in differential movements means that, with furthersoftening of the ground, flow of the clay fill between pilesmay eventually lead to instability.
Figure 19 shows the distributions of pile bendingmoment with depth obtained for piles spaced at both 3 and6 diameter centres. In both cases the bending moment(compression of the front face of the pile) increases withdepth to a maximum just above the drainage blanket level.The maximum moment for piles installed at the largerspacing is about three times greater than that for piles at 3diameter centres. This is not unexpected for when the pilesare less closely spaced, individual piles carry more load insupporting the slope. Below the drainage blanket (which isassumed to consist of granular filter material), the pilemoment reduces rapidly with depth in both cases. In theseparticular analyses, the small moments developed towardsthe pile toes indicate that the length of the piles couldsafely be reduced without affecting slope stability. This was
confirmed by a series of analyses with a reduced pilepenetration in which it was demonstrated that near identicalmovement and bending moment profiles to those shown inFigures 18 and 19 were predicted when the penetration wasreduced progressively from 19.5m to 10.5m.
8.1.1 Effect of increasing the slope angleThe effect of increasing the slope angle from 1v:2h (about27o) to a steeper angle of 1v:1.5h (about 34o) wasinvestigated and a comparison of the depth to and themagnitude of the peak lateral movements is shown inTable 4.
Table 4 Peak lateral displacements for clay embankmentsof varying angle
Slope 1v:2h Slope 1v:1.5h
Lateral LateralDepth displace- Depth displace-
(m) ment (mm) (m) ment (mm)
Piles at 3 diameter centres 0.0 14.8 0.0 28.6Piles at 6 diameter centres 1.2 30.0 0.8 54.0Unreinforced slope 1.8 59.0 1.6 101.0
Displacements are calculated in the ground midway between piles orat the equivalent location in the unreinforced slope case.
A number of trends are evident from the results in Table 4.Firstly, the magnitude of the lateral displacementsincreased significantly with the change in slope angle.Displacements of the unreinforced slope increased by42mm whilst those of the more heavily reinforced slopeincreased by about 14mm.
For the same analyses, a comparison of the peakpositive and negative bending moments determined in thepiles are given in Table 5. The results in Table 5 confirmthat a significant increase in pile bending moment

18
(a) Unreinforced slope
(b) Slope reinforced by piles at 3 diameter centres (cross section through pile line)
Figure 16 Lateral displacements after 60 years in service (embankment slope)

19
(a) Unreinforced slope
(b) Slope reinforced by piles at 3 diameter centres (cross section through pile line)
Figure 17 Deviator strain developed after 60 years in service (embankment slope)
20
5
0
10
15
20
25
Dep
th (
m)
25 50 75
Lateral displacement after 60 years (mm)
On line pile Off line pile Control
0
5
0
10
15
20
25
Dep
th (
m)
25 50 75
Lateral displacement after 60 years (mm)
0
(a) Piles at 3 diameter centres (b) Piles at 6 diameter centres
Dep
th (
m)
10
5
0
15
20-50 50 1501000 200 250
Bending moment (kNm)
+ve moment is compression of front face
Piles at 3 dia centres Piles at 6 dia centres Table 5 Maximum and minimum pile bending momentsfor embankment slopes of varying angle
Slope 1v:2h Slope 1v:1.5h
Peak bending Peak bending Depth moment (kNm) Depth moment (kNm)
(m) +ve -ve (m) +ve -ve
Piles at 3 3.2 57 – 3.3 115 –diameter centres 5.4 – -35 5.4 – 17
Piles at 6 3.8 168 – 3.9 225 –diameter centres 7.8 – -16 6.3 – 60
i Positive bending moments are compression of the front face of thepile.
ii Only peak positive and negative moments over the top 10m of thepile are given, some small strain reversals occur at depth.
Figure 18 Displacement plots for embankment slopes
Figure 19 Pile bending moment in embankment slopes
occurred when the slope angle was steepened and that thehigher peak positive values were predicted when the pileswere widely spaced and carrying more of the perturbingload. In the steepened slope situation, pile bendingmoments reduced more slowly with depth and thisconfirmed that a deeper pile embedment would beadvantageous for steeper slopes.
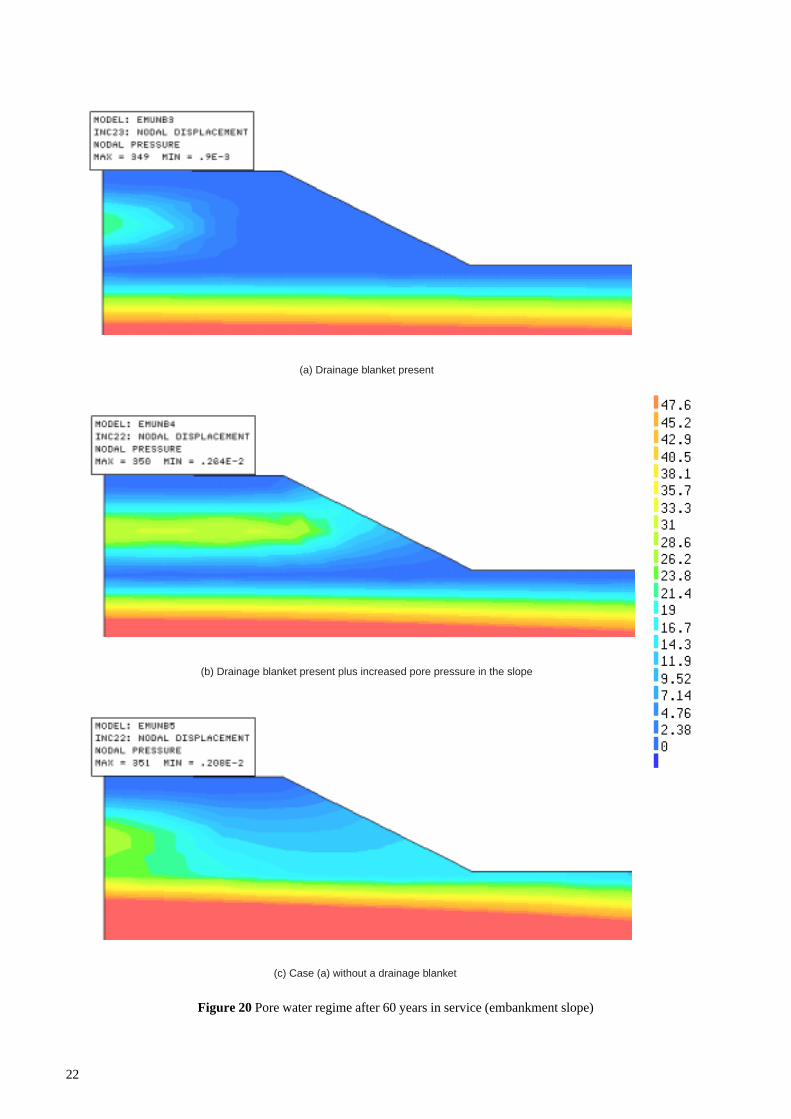
8.1.2 Effect of different pore water pressure regimes andthe drainage blanket
The major part of the analyses of embankmentperformance were carried out using the pore water pressurefixities described in Section 3. After long-termconsolidation the final pore water pressure distribution is

21
then as shown Figure 20a. This illustrates the perchedwater table in the centre of the embankment whichinitially increases with depth and then reduces again at thelevel of the drainage blanket. Although not shown in thefigure, pore water pressures in the foundation clay belowthe drainage blanket then increase hydrostatically withdepth. Under this pore water pressure regime, suctionsdevelop near the slope face as would be expected.
In some situations, vertical ingress of water to theembankment may result in higher pore pressures withinthe clay fill and the pore pressure fixities were thereforemodified to produce the final regime shown in Figure 20b.Analyses using the modified pore pressure fixities showedthe same trends of behaviour as those described earlier forthe regime in Figure 20a. However, because of the higherpore water pressures within the slope, ground movementswere up to 12% greater.
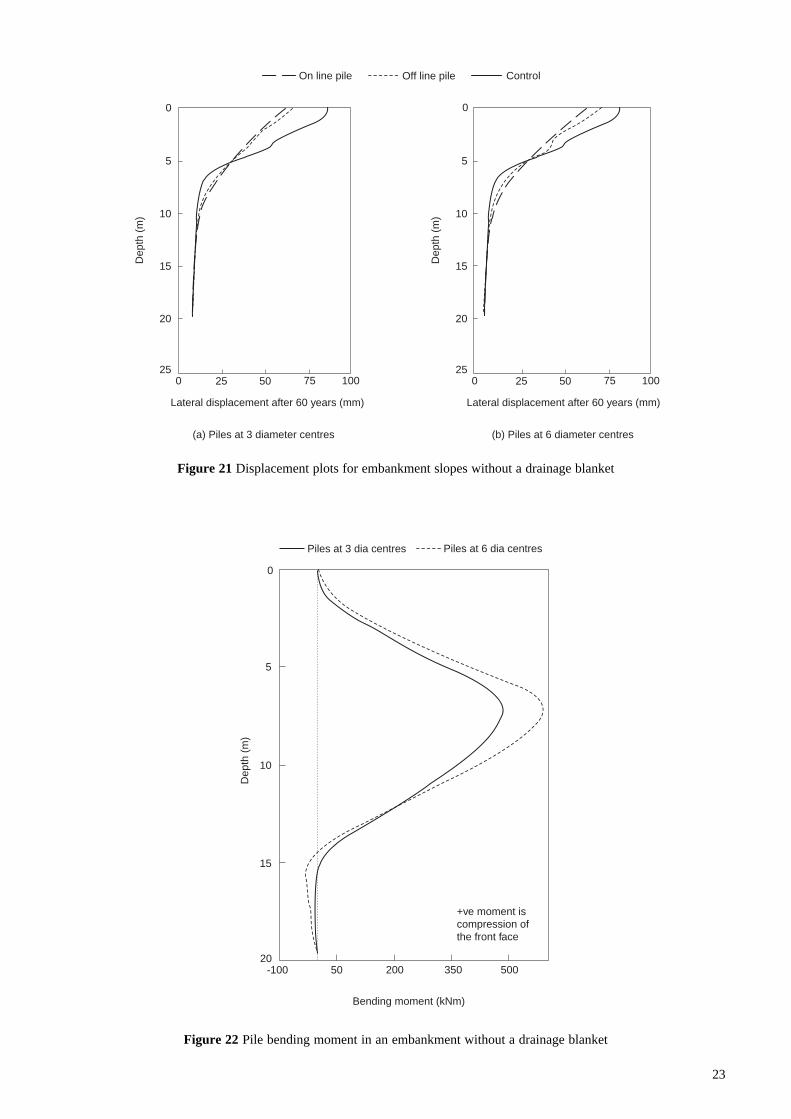
More significant differences in slope behaviour arepredicted if either the embankment is constructed directlyon its soil foundation without using a drainage blanket orfor the cases where the drainage blanket fails to operatesatisfactorily. The final pore water pressure regime thenfollows the pattern shown in Figure 20c with thedrawdown in water pressures near to the drainage blanketnot being observed. The respective displacementscalculated after 60 years in service are shown in Figures21a and 21b when using piles at 3 and 6 diameter centres.The movements in Figure 21 can be compared with thosereported in Figure 18 where a drainage blanket waspresent. In Figure 21, the higher pore water pressures andabsence of the permeable filter material comprising thedrainage blanket mean that the ground movements whichoccur are not only larger but more deep-seated. For thisreason the distributions of pile bending moments withdepth which are shown in Figure 22 demonstrate muchlarger maximum moments developing at a greater depththan those shown in Figure 19 for the case where adrainage layer is present.
The results clearly demonstrate the likely effectivenessof a drainage blanket upon both unreinforced andreinforced slope performance. The reinforcing effect of arow of piles remains similar to before, in so far as piles at 3diameter as opposed to 6 diameter centres limit thepotential for flow of the clay fill between the piles.
8.1.3 Effect of further softening of the clayThe influence of water ingress and strain softening upon thestrength parameters were found to have a major influenceupon embankment performance. When lower strengthparameters of c'=5kPa and ϕ'=18o were assigned to the clayfill, the predicted contours of lateral movement and deviatorstrain for the unreinforced and reinforced slopes were asshown in Figures 23 and 24. These contours can becompared with those given earlier in Figures 16 and 17 forthe higher strength parameters. Maximum lateralmovements with the reduced strengths were generallygreater by up to about three times. In the case of theunreinforced slope, the contours of movement (Figure 23a)and strain (Figure 24a) indicate a much more advanceddevelopment of the potential rupture surface. In the case of
the piled slope there are also some very early signs inFigure 24b of an increase in the deviator (ie. the shear)strain upslope of the piles; this is accompanied by somemovement development as shown in Figure 23b. Onceagain the restraining action of the piles and the enhancedstability of the piled slope are very much in evidence.
8.2 Piles installed 20 years after construction
The effect of installing piles as a remedial measure at 20years after construction of the embankment was alsoseparately investigated. However evaluation of themovements of both the unreinforced and reinforced slopesover the subsequent 40 years showed only maximumsettlements of 4mm and lateral movements of 2mm.
It was concluded that the major part of the movementsshown in Figure 16a for the full 60 year service life of theslope therefore developed in the early part of its service.This is primarily because the permeability adopted for theclay fill, ie. ten times more permeable than in situ clay,was such that excess pore pressures generated by theembankment loading dissipated over the first few decades.
On this basis, any potential instability in clayembankments would be expected to develop more rapidlythan in a cutting situation and installation of bored pilesas a reinforcing measure to restrict movements is likely tobe more effective the earlier it is carried out. However if,for site specific reasons, embankment instability andexcessive movements develop at a later stage, theinstallation of spaced bored piles will still be beneficialbut their performance is not covered by the analyses inthis report. Site specific reasons which may lead todelayed collapse are expected to be mainly related toprogressive softening of the clay fill, causes of whichmight include defects or failure of the drainage systems, orpossibly a change in the pattern of water flow due to newconstruction nearby.
9 Discussion
The finite element analysis of the pre-failure condition hasgiven some guidance on the effect of changes in the spacingbetween piles and the importance of founding the piles in afirm stratum. The predicted magnitudes of pile bendingmoments have also been discussed. However, in order toenhance the understanding of the various, complexmechanisms of behaviour, it is worth briefly reviewing thelateral stresses acting on an individual pile in the row.
Figure 25 contrasts the very different stress distributionsacting on a pile in the cutting and embankment situations.In this figure the contour plots are taken on a cross-sectionthrough one of the piles in a line of piles at 6 diametercentres. In the cutting situation (Figure 25a) the long-termdevelopment of rotational heave of the over-consolidatedclay coupled with the pile action in resisting thedevelopment of a deep-seated rupture surface act in such away that high lateral stresses are developed on thedownslope side near the top of the pile. As would beanticipated lateral stresses on the upslope side of the topof the pile are small.
22
(b) Drainage blanket present plus increased pore pressure in the slope
(c) Case (a) without a drainage blanket
(a) Drainage blanket present
Figure 20 Pore water regime after 60 years in service (embankment slope)
23
5
0
10
15
20
25
Dep
th (
m)
25 50 75 100
Lateral displacement after 60 years (mm)
On line pile Off line pile Control
0
5
0
10
15
20
25
Dep
th (
m)
Lateral displacement after 60 years (mm)
0
(a) Piles at 3 diameter centres (b) Piles at 6 diameter centres
25 50 75 100
Dep
th (
m)
10
5
0
15
20-100 50 350200 500
Bending moment (kNm)
+ve moment is compression of the front face
Piles at 3 dia centres Piles at 6 dia centres
Figure 21 Displacement plots for embankment slopes without a drainage blanket
Figure 22 Pile bending moment in an embankment without a drainage blanket

24
(a) Unreinforced slope
(b) Slope reinforced by piles at 3 diameter centres (cross section through pile line)
Figure 23 Lateral displacement after 60 years in service (embankment slope, softened soil)

25
Figure 24 Deviator strain developed after 60 years in service (embankment slope, softened soil)
(a) Unreinforced slope
(b) Slope reinforced by piles at 3 diameter centres (cross section through pile line)

26
(a) Cutting slope, piles at 6 diameter centres (cross section through pile line)
(b) Embankment slope, piles at 6 diameter centres (cross section through pile line)
Figure 25 Lateral stress developed after 60 years in service
27
The development of passive pressures on the downslopeside of the top of the pile will be limited by the yieldpressure of the soil. If the pile was part of a continuousretaining wall and the ground was level, effective stressdesign would give a passive pressure (p
p') at any depth of
pp' = K
pσ
v' + 2c'√K
p(1)
For a single pile the zone of yielding will be largerbecause of three dimensional effects: for this reason Broms(1964) proposed a limiting soil pressure in non-cohesivesoil and for a single pile of 3K
pσ
v'd where d is its diameter.
Fleming et al. (1994) suggested from the data of Barton(1982) that the limiting pressure was better given byK
pσ
v'd at depths of up to 1.5 diameters, although K
p2σ
v'd
was considered a better approximation at depths beyondthis. As these formulae were derived for a pile installed inand pushing into level ground, it is not clear whether insloping ground it is better to evaluate K
p from (1+sin ϕ')/
(1-sin ϕ') or to attempt to modify Kp by taking account of
the slope angle using tables from Caquot and Kerisel(1948). The latter calculation may not always be possibleanyway because of instabilities which arise when the slopeangle is greater than ϕ'.
In this report, ϕ' for the clay has generally been taken as20o and the corresponding value of K
p is 2.04 if level
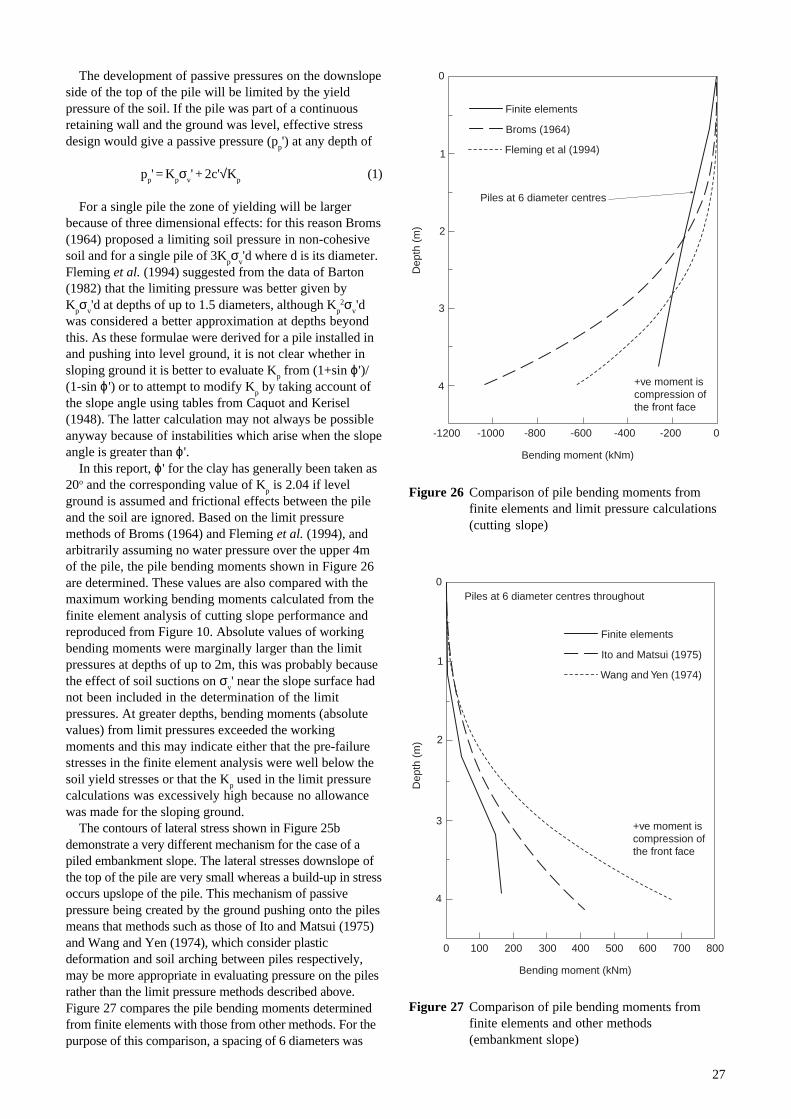
ground is assumed and frictional effects between the pileand the soil are ignored. Based on the limit pressuremethods of Broms (1964) and Fleming et al. (1994), andarbitrarily assuming no water pressure over the upper 4mof the pile, the pile bending moments shown in Figure 26are determined. These values are also compared with themaximum working bending moments calculated from thefinite element analysis of cutting slope performance andreproduced from Figure 10. Absolute values of workingbending moments were marginally larger than the limitpressures at depths of up to 2m, this was probably becausethe effect of soil suctions on σ
v' near the slope surface had
not been included in the determination of the limitpressures. At greater depths, bending moments (absolutevalues) from limit pressures exceeded the workingmoments and this may indicate either that the pre-failurestresses in the finite element analysis were well below thesoil yield stresses or that the K
p used in the limit pressure
calculations was excessively high because no allowancewas made for the sloping ground.
The contours of lateral stress shown in Figure 25bdemonstrate a very different mechanism for the case of apiled embankment slope. The lateral stresses downslope ofthe top of the pile are very small whereas a build-up in stressoccurs upslope of the pile. This mechanism of passivepressure being created by the ground pushing onto the pilesmeans that methods such as those of Ito and Matsui (1975)and Wang and Yen (1974), which consider plasticdeformation and soil arching between piles respectively,may be more appropriate in evaluating pressure on the pilesrather than the limit pressure methods described above.Figure 27 compares the pile bending moments determinedfrom finite elements with those from other methods. For thepurpose of this comparison, a spacing of 6 diameters was
Dep
th (
m) 2
1
0
3
4
-1200 -1000 -600-800 -400 -200 0
Bending moment (kNm)
+ve moment is compression of the front face
Piles at 6 diameter centres
Finite elements
Broms (1964)
Fleming et al (1994)
Dep
th (
m) 2
1
0
3
4
600200 300100 400 700500 8000
Bending moment (kNm)
+ve moment is compression of the front face
Piles at 6 diameter centres throughout
Finite elements
Ito and Matsui (1975)
Wang and Yen (1974)
Figure 26 Comparison of pile bending moments fromfinite elements and limit pressure calculations(cutting slope)
Figure 27 Comparison of pile bending moments fromfinite elements and other methods(embankment slope)

28
assumed between pile centres throughout. The workingbending moments from finite elements were less than themoments calculated using the other methods which may beregarded as the upper limits determined from the maximumpressures acting on the piles.
In the above discussion, emphasis has been placed ondesigning the piles to accommodate the build-up in lateralstress on the downslope side in the cutting case and theconverse in the embankment situation. This accords withthe finite element prediction of pre-failure behaviour,other factors which have not been considered in this reportmay however have a significant impact on behaviour. Forexample, the vegetation on the slope may create soilsuctions near the slope surface and have a stabilisingeffect. Alternatively, soil weathering and desiccation ofthe slope surface coupled with the ingress of water becauseof a badly designed or failed drainage system are expectedto adversely affect slope performance. These and any othersite specific factors need to be considered when designingthe piling system.
10 Summary and conclusions
The stability of clay slopes can be improved by using asingle row of spaced piles to provide support. A series ofthree dimensional finite element analyses were undertakento compare the performances of untreated cutting andembankment slopes with those stabilised by piles. Thefinite element evaluation focused on the calculation ofground deformations under working loads (ie. pre-failure),although the results also provided a useful indicator of thepotential rupture surface in clay slopes in the longer term.Particular design aspects which received attentionincluded the effect of increasing the slope angle, differentpile spacings, softening of the clay, and the influence ofdifferent pore water pressure regimes upon the results. Thefollowing conclusions were reached:
10.1 Cutting slopes
i With over-consolidated clay slopes the in situ lateralstresses are high and negative excess pore waterpressures generated during excavation may take manydecades to dissipate leading to the risk of a delayedcollapse. This behaviour generated a significantrotational heave towards the cutting in the longer termwhich dominated the finite element results. For thisreason it was considered that the relative magnitudesof the movements of the unreinforced and reinforcedslopes were more important than the absolute values.
ii The results of the finite element analysis of theunreinforced slope indicated that the potential rupturesurface is likely to emerge further behind the crest ofthe slope than would be predicted by conventionalslope stability analysis which takes no account of thein situ stress regime and the stress history due toexcavation of the cutting.
iii The analysis indicated that installation of spaced pilesat the time of construction does not significantly
constrain the magnitude of ground heave, but will actto limit the lateral displacement of the ground. Whenpiles were installed at 6 diameter centres, there wasevidence after 60 years in service of differentialdisplacement between the piles and the groundbetween them indicating that soil flow between pileswas starting to develop. When the piles were moreclosely spaced at 3 diameter centres there was littledifferential displacement. At both spacings, the pileswere effective in limiting ground displacements to lessthan those of the unreinforced slope.
iv The magnitude of the long-term rotational heave (andhence the lateral movement of the toe of the piles)developed because of the unloading due to excavation ofthe cutting is sensitive to the stiffness of the groundbelow cutting level. The reduction in the magnitude ofground movements, that results from founding the piles ina stiffer stratum, is significant with more of the perturbingload being borne by the piles and hence a much largerbending moment develops in the pile near to the interfacebetween the clay and the stiffer stratum. Siteinvestigations for the pile installation therefore need toidentify a founding stratum and care is then needed in thedesign to ensure that failure does not occur with thedevelopment of a plastic hinge in the pile.
v The finite element modelling confirmed that eithersteepening of the slope angle or further softening ofthe clay induced more lateral displacement of thereinforced slope and also larger pile bending moments.Of these two effects, softening of the clay parameters tonear residual values increased displacements (in theground midway between piles) by about 25%. Thelateral displacement of the ground at an equivalentlocation in the unreinforced slope increased byslightly more (30%).
vi When piles are installed as a remedial or preventativemeasure after construction, a considerable part of theheave related movement due to the unloading causedby excavation of the cutting has occurred. However,with an impermeable clay, some heave may continuefor many decades until the dissipation of negativeexcess pore pressures is complete. For this reason,benefits for cutting slopes of marginal stability willstill accrue if reinforcing piles are installed afterconstruction and well into the 60 year service life ofthe slope.
vii In the finite element analysis of cutting slope behaviour,a build-up in soil lateral stress was observed as the top ofthe pile pushed downslope although its magnitude willultimately be limited by the yield pressure of the soil.Based on the limit pressure methods of Broms (1964) andFleming et al. (1994), the pile bending moments weredetermined and compared with the maximum workingbending moments calculated from the finite elementanalysis. Absolute values of working moments weremarginally larger than those calculated from the limitpressures at shallow depths (<2m); this was probablybecause the effect of soil suctions on σ
v' near the slope
surface had not been included in the determination of the

29
limit pressures. At greater depths, bending moments(absolute values) from limit pressures exceeded theworking moments and this may indicate either that thepre-failure stresses in the finite element analysis were wellbelow the soil yield stresses or that the K
p used in the
limit pressure calculations was excessively high becauseno allowance was made for the sloping ground.
10.2 Embankment slopes
viii Whereas with the cutting situation the development ofmovement was dominated by a rotational heave due tothe unloading caused by excavation, this does notoccur in the embankment model. Settlement occursmainly in the embankment fill with some in thefoundation clay due to the applied surcharge loading.Only very small lateral movements are predictedbeneath the granular drainage blanket with indicationsthat potential rupture is confined to the slope abovethe drainage blanket: this correlates with the findingsfrom conventional slope stability analysis. The zone ofrupture in the embankment case is generally muchsmaller than that predicted for a cutting slope.
ix When piles are installed at the time of embankmentconstruction, numerical analysis indicates that lateralmovements of the ground midway between pilesspaced at 3 diameter centres are only slightly morethan those of the piles, but still considerably less thanthose of the ground at an equivalent location in anunreinforced slope. When piles are installed at 6diameter centres there is significantly more differentialmovement between the piles and the ground midwaybetween piles. Although piles at this spacing still actto restrain ground movements when compared withthose in an unreinforced slope, the increase indifferential movements means that, with furthersoftening of the ground, flow of the clay fill betweenpiles may possibly lead to instability.
x The analysis showed that increasing the slope anglefrom 1v:2h to 1v:1.5h had a significant effect inapproximately doubling the lateral ground movementsin both unreinforced and reinforced embankmentslopes. In the latter case the pile bending moments(compression of the front face) also increased by asimilar factor.
xi When lower strength parameters approaching residualvalues were used for the clay fill, development of arupture surface was much more pronounced in theunreinforced slope. With the reinforced slope, bothmovements and pile bending moments were increasedalthough the restraining action of the piles and theenhanced stability of the piled slope were very muchin evidence.
xii Significant differences in both unreinforced andreinforced slope behaviour are predicted if either theembankment is constructed directly on its soilfoundation without using a drainage blanket or the casewhere the drainage blanket fails to operate satisfactorily.The higher pore water pressures and absence of the
permeable filter material comprising the drainageblanket mean that the ground movements which occurare not only larger but more deep-seated. For this reasonmuch larger pile bending moments are developed if thedrainage layer is absent. If an effective drainage blanketis present, the depth of penetration of piles installed tostabilise the slope can be much reduced.
xiiiBecause the clay fill was assumed to be ten times morepermeable than in situ clay, the excess pore pressuresgenerated by the embankment loading dissipated overthe first few decades and only small groundmovements were predicted beyond this time. For theadopted clay permeability, the value of installing pilesas a remedial measure at 20 years after construction ofthe embankment was therefore limited and, in general,installation of bored piles as a reinforcing measure ismore effective the earlier it is carried out. However, forsite specific reasons, embankment instability maydevelop at a later stage and subsequent installation ofspaced bored piles is still expected to improve thefactor of safety. Site specific reasons which may lead todelayed collapse are expected to be mainly related toprogressive softening of the clay fill, causes of whichmight include defects or failure of the drainagesystems, or possibly a change in the pattern of waterflow due to new construction nearby.
xiv The contours of lateral stress determined for a piledembankment slope show a build-up in lateral stressupslope of the top of the pile and only small stressesdownslope of the pile, the converse to the cuttingsituation. This mechanism of passive pressure beingcreated by the ground pushing onto the piles means thatmethods such as those of Ito and Matsui (1975) andWang and Yen (1974), which consider plasticdeformation and soil arching between piles respectively,may be more appropriate in evaluating pressure on thepiles rather than the limit pressure methods described in(vii). A comparison shows that the working bendingmoments from finite elements were less than themoments calculated using the other methods which maybe regarded as the upper limits determined from themaximum pressures acting on the piles.
10.3 General (cutting and embankment slopes)
xv The optimum location for the row of piles needs to besuch that the potential for slip development behindand in front of the piles is minimised. In this report, alocation for the piles which was three eighths of theway up the slope was found to be satisfactory.Investigation of the contours of movement and strainafter 60 years in service then indicated that the pilesacted to restrain the ground upslope although, as mightbe expected, there was evidence that a smaller slipmight still eventually occur in front of the piles. If asmall slip of this nature occurs, it can usually betolerated as it will not impinge on the carriageway andcan be easily reinstated. If the piles were located nearerto the toe of the slope, it is anticipated that a moremajor failure would then occur above them.

30
11Acknowledgements
The work described in this report forms part of the researchprogramme of the Structures Department of TRL and wasfunded by Quality Services (Civil Engineering) of theHighways Agency. The HA Project Manager for the studywas Mr R K W Lung.
12 References
Almeida M S S, Britto A M and Parry R H G (1986).Numerical modelling of a centrifuged embankment on softclay. Canadian Geotechnical Journal, Vol 23, pp 103–114.
Barton Y O (1982). Laterally loaded model piles in sand.PhD thesis. Cambridge: University of Cambridge.
Bishop A W (1955). The use of the slip circle in the stabilityanalysis of slopes. Geotechnique, Vol 5, No 1, pp 7–17.
Broms B B (1964). Lateral resistance of piles in cohesivesoils. J Soil Mech Foundn Div, ASCE, Vol 90, No SM2,pp 27–63.
Burland J B and Kalra J C (1986). Queen Elizabeth IIConference Centre: geotechnical aspects. Proc Instn CivilEngrs, Part 1, Vol 80, pp 1479–1503.
Caquot A and Kerisel J (1948). Tables for the calculationof passive pressure, active pressure and bearing capacityof foundations. Paris: Gauthier-Villars.
Carder D R and Temporal J (2000). A review of the useof spaced piles to stabilise embankment and cuttingslopes. TRL Report TRL466. Crowthorne: TRL Limited.
Cooper M R, Bromhead E N , Petley D J and Grant D I(1998). The Selborne cutting stability experiment.Geotechnique, Vol 48, No 1, pp 83–101.
Cripps J C and Taylor R K (1986). Engineeringcharacteristics of British over-consolidated clays andmudrocks, I. Tertiary deposits. Engineering Geology, Vol 22,No 4, pp 349–376.
Dixon N and Bromhead E N (1999). Depth-dependentpermeability in London Clay measured using standpipepiezometer equilibration data. Geotechnique, Vol 49, No 5,pp 651–660.
Fleming W G K, Weltman A J, Randolph M F and ElsonW K (1994). Piling Engineering. Glasgow: Blackie Group.
Geotechnical Consulting Group (1993). The design ofslopes for highway cuttings and embankments. ProjectReport PR/GE/37/93. Crowthorne: TRL Limited.(Unpublished report available on direct personalapplication only)
Griffiths D V and Lane P A (1999). Slope stabilityanalysis by finite elements. Geotechnique, Vol 49, No 3,pp 387–403.
Hayward T, Lees A, Powrie W, Richards D J andSmethurst J (2000). Centrifuge modelling of a cuttingslope stabilised by discrete piles. TRL Report TRL471.Crowthorne: TRL Limited.
Ito T and Matsui T (1975). Methods to estimate lateralforce acting on stabilising piles. Soils and Foundations,Vol 15, No 4, pp 43–59.
Perry J (1989). A survey of slope condition on motorwayearthworks in England and Wales. Research ReportRR199. Crowthorne: TRL Limited.
Potts D M, Kovacevic N and Vaughan P R (1997).Delayed collapse of cut slopes in stiff clay. Geotechnique,Vol 47, No 5, pp 953–982.
Potts D M, Kovacevic N and Vaughan P R (2000).Delayed collapse of cut slopes in stiff clay. Discussion byBromhead and Dixon, and authors’ reply. Geotechnique,Vol 50, No 2, pp 203–205.
Skempton A W (1964). Long-term stability of clay slopes.Geotechnique, Vol 14, No 2, pp 77–101.
Symons I F (1992). Design of embedded retaining wallsin stiff clays. Research Report RR359. Crowthorne: TRLLimited.
Vaughan P R (1994). Assumption, prediction and realityin geotechnical engineering. Geotechnique, Vol 44, No 4,pp 573–609.
Wang W L and Yen B C (1974). Soil arching in slopes.J Geotechnical Engineering Division, ASCE, Vol 100,No GT1, pp 61–78.

31
Appendix A: Analyses of performance of cutting slope – results in stiffer clay
(a) Unreinforced slope
(b) Slope reinforced by piles at 3 diameter centres (cross section through pile line)
Figure A1 Deviator strain after 60 years in service (cutting slope in stiff clay)

32
0
5
10
15
20
25
Dep
th (
m)
40 50 60 70 80 90
Lateral displacement after 60 years (mm)
0
5
10
15
20
25
Dep
th (
m)
5 10 15
Lateral displacement over last 25 years (mm)
(a) Piles at 3 diameter centres
(b) Piles at 6 diameter centres
On line pile Off line pile Control
0
5
10
15
20
25
Dep
th (
m)
40 50 60 70 80 90
Lateral displacement after 60 years (mm)
0
5
10
15
20
25
Dep
th (
m)
5 10 15
Lateral displacement over last 25 years (mm)
Figure A2 Displacement plots for cutting slope in stiff clay

33
Abstract
The use of a single row of spaced piles for stabilising slopes has been used widely and with success for someconsiderable time primarily elsewhere in Europe and in Japan. On the UK highway network the technique couldprovide a permanent and cost effective method of both remediating potentially unstable or failed slopes and ofsteepening slopes in a widening situation. However, the availability of design guidance on the use of thistechnique is limited: this is partly because the soil-structure interaction problem is complex and threedimensional in nature. This report discusses the results from three dimensional finite element analyses in whichthe performance of untreated cutting and embankment slopes was compared with those stabilised using a singlerow of piles. The study concentrates on the performance of clay slopes and discusses the implication of thefindings upon their design.
Related publications
TRL471 Centrifuge modelling of a cutting slope stabilised by discrete piles. Hayward T, Lees A, Powrie W,Richards D J and Smethurst J. 2000 (price £35, code H)
TRL466 A review of the use of spaced piles to stabilise embankment and cutting slopes by D R Carder andJ Temporal. 2000 (price £25, code E)
TRL306 Laboratory trial mixes for lime-stabilised soil columns and lime piles by A H Brookes, G West andD R Carder. 1997 (price £25, code E)
TRL305 Review of lime piles and lime-stabilised soil columns by G West and D R Carder. 1997 (price £25, code E)
RR359 Design of embedded retaining walls in stiff clays by I F Symons. 1993 (price £35, code H)
CR196 The effect of surcharge loading adjacent to piles by S M Springman and M D Bolton.1990 (price £25, code E)
RR199 A survey of slope condition on motorway earthworks in England and Wales by J Perry.1989 (price £20, code C)
Prices current at June 2001
For further details of these and all other TRL publications, telephone Publication Sales on 01344 770783 or770784, or visit TRL on the Internet at www.trl.co.uk.

34