Isolation and Characterization of Soluble Peptidoglycan from ...

Analysis of peptidoglycan degrading amidases in
Mycobacterium smegmatis
Sibusiso Senzani (0603371N)
Dissertation submitted to the Faculty of Health Science, University of the Witwatersrand,
Johannesburg, in fulfilment of the requirements for the degree of Master of Science in
Medicine.
May 2013

i
Declaration
I, Sibusiso Senzani declare that this Dissertation is my own work. It is being submitted for
the Degree of Master in Medicine in the University of the Witwatersrand, Johannesburg. It
has not been submitted before for any degree or examination at this or any other
University.
Sibusiso Senzani
29th
Day of May 2013

ii
Dedication
I dedicate this work to my parents Mr Alpheus Tholisizwe Senzani and Mrs Hellen
Senzani for their complete support of everything I do, and for teaching me to do what
makes me happy and not just what makes me money and I thank them for that.

iii
Presentations from this dissertation
Conference : SASBMB/FASBMB conference
Presentation : Poster
Year : 2012
Conference : Wits Research Day and Postgraduate Expo
Presentation : Poster
Year : 2012
Conference : MRC Early Career Scientists Conference
Presentation : Oral
Year : 2012
Achievement : Second prize in the MRC Early Career
Scientists Conference oral category

iv
Abstract
Tuberculosis (TB) is a worldwide pandemic, which claims approximately 2 million lives
annually. Though treatable through chemotherapy, TB still causes 8-10 million new
infections annually. The problem is further complicated by the emergence of multi-drug
resistant strains of Mycobacterium tuberculosis (Mtb) the causative agent of TB. The
unabated spread of this disease and associated high levels of mortality has prompted the
search for new drugs with novel modes of action. The peptidoglycan (PG) component of
the cell wall of Mtb is an incredibly complex structure and has been the focus of
antimicrobial development in other organisms. In this study, we characterize PG
remodelling N-acetylmuramyl-L-alanine amidases (cell wall amidases) in Mycobacterium
smegmatis (Msm), a model organism for TB research by gene knockout/knockdown. Cell
wall amidases cleave the bond between the stem peptide and the glycan backbone in PG
and have been shown to play an essential role in cell growth, cell signalling and antibiotic
resistance in other organisms. Our bioinformatics analysis revealed that M. smegmatis
encodes three possible amidase homologues designated ami1, ami2 and ami3. Deletion
mutagenesis in Msm resulted in successful deletion of ami1 whilst repeated attempts to
delete ami2 did not yield a knockout mutant, suggesting that ami2 is essential for growth.
Deletion of ami1 results in the formation of long filaments consisting of 3 to 8 cells
attached to each other due to incomplete resolution of the septum. In these filaments,
lateral growth at both the internal septation sites and extreme poles resulted in irregular cell
width, strongly implicating Ami1 in bacterial cell division, the maintenance of bacterial
cell shape and possibly balancing the growth at the cell pole. Since deletion of ami2 was
not possible, a knockdown strain allowing for anhydrotetracycline (ATC)-regulated
conditional gene expression of ami2 was generated. In this system, withdrawal of ATC
results in repression of expression. Expression analysis of ami2 in this strain revealed that
v
whilst significant gene knockdown was achieved, ami2 expression was not completely
abolished in the absence of the inducer ATC, suggesting the presence of basal level ami2
expression. The repression of ami2 expression results in retarded growth, diminished
motility, unusual colony morphology consisting of miniature colonies lacking any form of
serpentine cording and the formation of miniature cells consisting of globular bulges.
These data implicate Ami2 in bacterial growth and maintenance of bacterial cell shape.
Collectively, our data comprise the first demonstration of an important role for
peptidoglycan degrading amidases in mycobacterial growth and cell division. Furthermore,
the phenotypic defects in colony formation due to deletion or depletion of amidases
suggest that these enzymes play an important role in cell-cell communication during
colony formation. These data validate this class of enzymes as an untapped, legitimate
source of novel targets for anti-tubercular drug discovery.

vi
Acknowledgements
I would like to thank my family for the support structure and encouragement throughout
the past two years.
The NRF (National Research Foundation) and the University of the Witwatersrand for the
financial support they offered me allowing me the opportunity to do my MSc.
Thank you to the MMU (Microscopy and Microanalysis Unit) at the University of the
Witwatersrand for affording me the opportunity to work with their Confocal microscope
and the Microscopy unit at the University of Cape Town for giving me the opportunity to
work on their Scanning and Transmission electron microscope at odd hours in the night
I would also like to thank my supervisor Dr Bavesh Kana not only for the guidance and
supervision but also for giving me the freedom to try different unorthodox experiments
throughout the project allowing me to learn how to think ‘out of the box’.
I would like also thank my colleagues and senior staff, at the CBTBR, for assistance,
support and the occasional laugh to lighten the spirit when nothing was working; this
allowed me to surpass many challenges faced throughout my studies.

vii
Table of Contents
Declaration ............................................................................................................................ i
Dedication ............................................................................................................................ ii
Presentations from this dissertation ...................................................................................... iii
Abstract ............................................................................................................................... iv
Acknowledgements .............................................................................................................. vi
List of Figures ....................................................................................................................... x
List of Tables ....................................................................................................................... xi
Nomenclature...................................................................................................................... xii
1. Introduction ................................................................................................................... 1
1.1 Background ............................................................................................................ 1
1.2 Latent TB Infection ................................................................................................. 5
1.3 The Mycobacterial Envelope ................................................................................... 8
1.4 PG ........................................................................................................................ 11
1.4.1 Antibiotics that target PG synthesis ................................................................ 13
1.4.1.1 β-lactam antibiotics .................................................................................... 13
1.4.1.2 Cycloserine ................................................................................................ 14
1.4.1.3 Ramoplanin ................................................................................................ 15
1.4.1.4 Vancomycin ............................................................................................... 15
1.5 PG hydrolases ....................................................................................................... 16
1.5.1 Carboxypeptidases (CPases) .......................................................................... 16
1.5.2 Endopeptidases (EPases) ................................................................................ 17
1.5.3 Lysozymes ..................................................................................................... 17
1.5.4 Lytic transglycosylases .................................................................................. 18
1.5.4.1 Resuscitation promoting factors (Rpfs) ....................................................... 18
1.5.5 N–Acetyl-β-D-glucosaminidases .................................................................... 19
1.6 N-acetylmuramyl-L-alanine amidases ................................................................... 20
1.6.1 Viral and eukaryotic amidases ....................................................................... 20
1.6.2 Bacterial amidases ......................................................................................... 21
1.7 Aims and objectives .............................................................................................. 26
2. Materials and Methods ................................................................................................. 27
2.1 Bacterial strains, plasmids and growth conditions ................................................. 27
2.1.1 Growth of E. coli DH5α and derivative strains ............................................... 28
2.1.2 Growth of Msm strains .................................................................................. 29
2.2 DNA manipulation ................................................................................................ 29
2.2.1 Mycobacterial chromosomal DNA extraction ................................................ 29
2.2.1.1 Cetyltrymethylammonium bromide (CTAB) DNA extraction ..................... 29
2.2.1.2 Small scale DNA extraction for PCR .......................................................... 30
2.2.2 E. coli plasmid extraction ............................................................................... 30
2.2.2.1 Bulk plasmid preparation using Nucleobond plasmid purification kit ......... 30
2.2.2.2 Plasmid miniprep using alkaline lysis method ............................................ 31
2.2.3 Sodium acetate DNA precipitation ................................................................. 32
2.2.4 DNA restriction enzyme digestion ................................................................. 32
2.2.5 Phosphorylation of DNA ............................................................................... 32
2.2.6 Dephosphorylation of 5’ends of plasmid DNA ............................................... 33
2.2.7 DNA ligation ................................................................................................. 33
2.2.8 Agarose gel electrophoresis ........................................................................... 33
viii
2.2.9 Purification of DNA fragments ...................................................................... 34
2.2.10 Nucleic acid quantification ............................................................................ 34
2.2.11 DNA Sequencing ........................................................................................... 35
2.3 Standard Polymerase chain Reaction (PCR) .......................................................... 35
2.3.1 Roche Fast-Start Taq PCR ............................................................................. 35
2.3.2 Phusion High-Fidelity DNA polymerase ........................................................ 36
2.4 Transformation of bacterial cells ........................................................................... 36
2.4.1 Transformation of chemically competent DH5α ............................................. 36
2.4.2 Electroporation into Msm .............................................................................. 37
2.5 Southern Blotting .................................................................................................. 38
2.5.1 Labelling of Probe DNA ................................................................................ 38
2.5.2 Blotting.......................................................................................................... 38
2.6 Assessment of gene expression ............................................................................. 40
2.6.1 RNA extraction from mycobacterial cells ...................................................... 40
2.6.2 Reverse Transcriptase PCR (RT-PCR) ........................................................... 41
2.6.3 Quantitative real-time PCR (qPCR) amplification .......................................... 42
2.7 Analysis of bacteria growth ................................................................................... 42
2.7.1 Growth rate analysis ...................................................................................... 42
2.7.2 Analysis of mycobacterial biofilm formation ................................................. 43
2.7.3 Analysis of mycobacterial sliding motility ..................................................... 43
2.7.4 Bacterial spotting assay .................................................................................. 44
2.8 Microscopic analysis ............................................................................................. 44
2.8.1 Confocal microscopy ..................................................................................... 44
2.8.2 Scanning electron microscopy (SEM) ............................................................ 45
2.8.3 Transmission electron microscopy (TEM) ..................................................... 45
2.8.4 Atomic force microscopy (AFM) ................................................................... 46
2.9 Bio-informatic analysis ......................................................................................... 46
2.10 Construction of knock out strains .......................................................................... 47
2.10.1 Construction of ami1 and ami2 knockout vectors ........................................... 48
2.10.1.1 PCR reactions ......................................................................................... 48
2.10.1.2 Cloning. .................................................................................................. 50
2.10.1.2.1 pGEM cloning ..................................................................................... 50
2.10.1.2.2 Three Way cloning .............................................................................. 51
2.10.1.2.3 Pac cassette cloning ............................................................................. 52
2.10.1.3 Testing for acquired sucrose sensitivity ................................................... 53
2.10.1.4 Two-step homologues recombination ...................................................... 53
2.10.1.5 PCR Screening ....................................................................................... 54
2.11 Complementation of Msm Δami1 strain ................................................................ 54
2.11.1 Construction of the complementation vector .................................................. 56
2.11.2 pMVAmi1 integration into Δami1 strain genomic DNA................................. 57
2.12 Construction of ami2 knockdown strain ................................................................ 58
2.12.1 Construction of ami2 knockdown vector ........................................................ 60
2.13 Msm ami2KDP associated Phenotyping ................................................................ 60
2.13.1 Msm ami2KDP preculture preparation ........................................................... 60
2.13.2 Analysis of regulated gene expression ............................................................ 61
2.13.3 Msm ami2KDP growth kinetics ..................................................................... 62
3. Results ......................................................................................................................... 63
3.1 Bioinformatics analyses and identification of putative amidase-encoding genes in
mycobacteria ....................................................................................................................... 63
3.1.1 Conservation of catalytic residues within the Amidase 3 domain ................... 66

ix
3.1.2 Conservation of catalytic residues within the Amidase 2 domain ................... 68
3.2 Construction of deletion mutants defective in the ami1 and ami2 genes. ............... 69
3.2.1 Construction of vectors for deletion of ami1 and ami2. .................................. 70
3.2.2 Two-step homologues recombination and gene knockout ............................... 75
3.3 Complementation of the Msm Δami1 strain .......................................................... 77
3.3.1 Construction of the ami1 complementation vector .......................................... 79
3.3.2 pMVAmi1 integration into Δami1 strain genomic DNA................................. 80
3.4 Construction of an ami2 knockdown strain ........................................................... 81
3.4.1 Construction of ami2 knockdown vector ........................................................ 82
3.4.2 Incorporation of pSEAmi2P into Msm to create a gene knockdown strain...... 83
3.5 The Role of Ami1 in cell division and structural maintenance ............................... 83
3.5.1 Ami1 does not play a significant role in determining growth rate ................... 85
3.5.2 Ami1 does not play a significant role in biofilm formation ............................. 86
3.5.3 Ami1 does not play a significant role in sliding motility ................................. 87
3.5.4 Ami1 plays an important role in cell division, cell growth and cell shape
maintenance ................................................................................................................. 88
3.6 The Role of Ami2 in cell growth ......................................................................... 100
3.6.1 Confirmation of regulated gene expression in the ami2 knockdown strain .... 100
3.6.2 Ami2 plays a role in determining growth rate ............................................... 102
3.6.3 Ami2 plays role in sliding motility ............................................................... 103
3.6.4 Ami2 plays role in determining colony morphology ..................................... 105
3.6.5 A role for Ami2 in determining cell morphology ......................................... 105
4. Discussion ................................................................................................................. 110
5. Appendices ................................................................................................................ 120
6. Bibliography .............................................................................................................. 126

x
List of Figures
Figure 1.1: Diagrammatic representation of the estimated 2011 global TB
incidents rate………………………………………………………….. 2
Figure 1.2: Diagrammatic representation of the structure of mycobacterial cell
envelope……………………………………………………………….. 8
Figure 1.3: Representation of the structure of PG and cleavage sites for various PG
associated hydrolases…………….………............................................ 12
Figure 1.4: Diagrammatic representation of the PG biosynthetic pathway……….. 13
Figure 1.5: Diagrammatic representation of the proposed mechanism for EnvC
and NlpD mediated amidase activation………………………………. 23
Figure 2.1: Diagrammatic representation of the allelic exchange process………... 48
Figure 2.2: Diagrammatic representation of the construction of knockout vectors.. 51
Figure 2.3: Schematic representation of the PCR screen for deletion mutants…..... 55
Figure 2.4: Schematic representation of the tetracycline operator knockdown
system……………………………………………………………….... 59
Figure 2.5: Schematic representation of the ATC-regulated knockdown strain…... 59
Figure 3.1: Schematic representing the mycobacterial amidases and their E. coli
homologues……………..……………………………………………. 64
Figure 3.2: Diagrammatic representation of the Msm cell wall amidases and their
respective protein domains…….……………………………………... 64
Figure 3.3: ClustalW analysis of amidase_3 domain containing amidases……….. 67
Figure 3.4: ClustalW analysis of amidase_2 domain containing amidases……...... 69
Figure 3.5: Restriction profile of p2NILAmi1…………………...………………... 71
Figure 3.6: Restriction profile of p2NILAmi2…………...………………………... 72
Figure 3.7: Restriction profile of p2ΔAmi1G19………...………………………… 73
Figure 3.8: Restriction profile of p2ΔAmi2G19…………...……………………… 74
Figure 3.9: Confirmation of sucrose sensitivity in strains carrying knockout
constructs……………………………………………………………… 75
Figure 3.10: PCR screen for deletion mutants of ami1 and ami2…….…………… 76
Figure 3.11: Southern Blot analysis of the Msm Δami1 strain……...…………….. 78
Figure 3.12: Restriction profile of pMVami1……...……………………………… 79
Figure 3.13: PCR Screen for integration of pMVami1…...……………………….. 81
Figure 3.14: Restriction profile of pSEAmi2P……………………………………..82
Figure 3.15: Southern Blot analysis of the Msm ami2KDP knockdown strain…… 84
Figure 3.16: Growth kinetics of the Δami1 strain…………………………………. 85
Figure 3.17: Biofilm formation with Δami1 strain…………...…………………… 86
Figure 3.18: Sliding motility of the mc2155 and Δami1 strains on 7H9 and M63
agar..…………………………………………………………………. 88
Figure 3.19: Confocal microscopy comparing mc2155, Δami1 and
Δami1::pMVami1..………………………………………………….. 90
Figure 3.20: SEM images of mc2155, Δami1 and Δami1::pMVami1 strains..…… 93
Figure 3.21: TEM images of the mc2155, Δami1 and Δami1::pMVami1 strains… 97
Figure 3.22: AFM images of the mc2155, Δami1 and Δami1::pMVami1 strains… 99
Figure 3.23: Expression analysis of ATC regulated gene expression...………………... 101
Figure 3.24: Depletion of ami2 results in reduced growth of Msm……………...... 102
Figure 3.25: Sliding motility assays with the ami2 depletion strains………………104
Figure 3.26: The impact of ami2 depletion on colony morphology………………. 105
Figure 3.27: SEM images of the mc2155 and ami2KDP strains………………….. 107
Figure 3.28: Confocal microscopy of the mc2155 and ami2KDP strains…………. 108

xi
List of Tables
Table 2.1: Bacterial strains created and/or used in this study…………………….. 27
Table 2.2: Plasmids created and/or used in this study…………………………….. 27
Table 2.3: Primer3 parameters used when designing primers using the Primer3
tool…………………………………………………………………….. 35
Table 2.4: Primers used for amplification of upstream and downstream regions
of the ami1 and ami2 genes……………………………………………. 49
Table 2.5: Double cross over screening primers…………………………………... 56
Table 2.6: Primer used for expression analysis …………………………………… 61
xii
Nomenclature
(NH4)2SO4 : Ammonium sulphate
µ : Micro
AAP : Antarctic Alkaline Phosphatase
AFM : Atomic force microscopy
AIDS : Acquired Immunodeficiency Syndrome
Ami : Amidase
Amp : Ampicillin
ATC : Anhydrotetracycline
bp : Base pairs
cDNA : Complementary Deoxyribonucleic acid
Cetyltrymethylammonium bromide
CFU : Colony forming unit
CSPD : Chloro-5-substituted adamantyl-1, 2-dioxetane phosphateCTAB
DAP : Diaminopimelic acid
DCO : Double cross over
DDSA : Dodecenyl Succinic Anhydride
DIG : Digoxigenin
DMP : Tris-2,3,6-(dimethylaminomethyl)phenol
DNA : Deoxyribonucleic acid
dNTP : Deoxynucleotide triphosphate
DST : Drug susceptibility testing
EDTA : Ethylenediaminetetraacetic acid
FeSO4.7H2O : Iron sulphate
g : gram
HCl : Hydrochloric acid
HIV : Human I immunodeficiency Virus
Hyg : Hygromycin
hyg : Gene encoding hygromycin B resistance
HygR
: Hygromycin Resistance
Kan : Kanamycin
KanR
: Kanamycin Resistance
kb : Kilo base pair
KH2PO4 : Potassium dihydrogen phosphate
KOH : Potassium hydroxide
LA : Luria-Bertani agar
lacZ : Gene encoding galactosidase
LB : Luria-Bertani broth
LGFP : Leucine, Glycine, Phenyalanine, Proline repeat Domain
LTBI : Latent tuberculosis infection
MDR : Multi-Drug resistant
MDR-TB : Multidrug-Resistant Tuberculosis
min : minutes
ml : Millilitre
mRNA : messenger Ribonucleic acids
Msm : Mycobacterium smegmatis
Mtb : Mycobacterium tuberculosis
NaCl : Sodium chloride
NAG : N-acetylglucosamine mine

xiii
NAM : N-acetylmuramic acid
NaOH : Sodium hydroxide
OD600 : Optical density at 600 nanometre wavelength
PBP : Penicillin Binding Proteins
PCR : Polymerase Chain Reaction
PG : Peptidoglycan
PGRS : Peptidoglycan recognition proteins
PNK : Polynucleotide Kinase
R : Resistant
RBS : Ribosomal Binding Site
RNA : Ribonucleic acids
Rpf : Resuscitation promoting factor
rpm : Revolutions per minute
RT : Reverse Transcriptase
sacB : Gene encoding levansucrase
SCO : Single cross over
sdH2O : Sterile distilled water
SDS : Sodium dodecylsulphate
SEM : Scanning electron microscopy
TB : Tuberculosis
TBE : Tris-Borate-EDTA
TDR : Total-Drug resistant
TE : Tris-EDTA
TEM : Transmission electron microscopy
Tris : Tris (hydroxymethyl) aminomethane
Tween : Polyoxyethylene sorbitan monooleate
TY : Tryptone, Yeast Extract
U : Enzyme Unit
UDP : Uridine diphospate
v/v : Volume per volume
VBNC : Viable but non culturable
w/v : Weight per volume
WHO : World Health Organisation
XDR : Extensively-Drug resistant
XDR-TB : Extensively Drug Resistant Tuberculosis
X-gal : 5-bromo-4-chloro-3-indolyl-D-thiogalactopyranoside
Δ : Delta
η : Nano
1
1. Introduction
1.1 Background
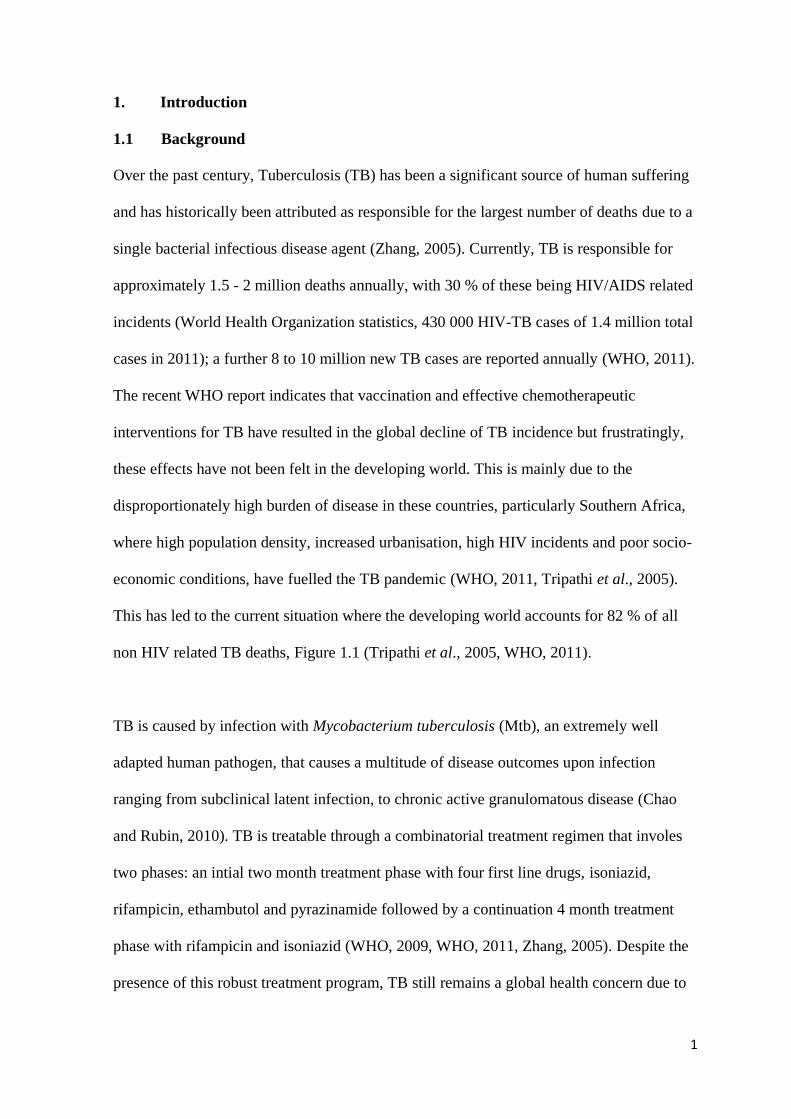
Over the past century, Tuberculosis (TB) has been a significant source of human suffering
and has historically been attributed as responsible for the largest number of deaths due to a
single bacterial infectious disease agent (Zhang, 2005). Currently, TB is responsible for
approximately 1.5 - 2 million deaths annually, with 30 % of these being HIV/AIDS related
incidents (World Health Organization statistics, 430 000 HIV-TB cases of 1.4 million total
cases in 2011); a further 8 to 10 million new TB cases are reported annually (WHO, 2011).
The recent WHO report indicates that vaccination and effective chemotherapeutic
interventions for TB have resulted in the global decline of TB incidence but frustratingly,
these effects have not been felt in the developing world. This is mainly due to the
disproportionately high burden of disease in these countries, particularly Southern Africa,
where high population density, increased urbanisation, high HIV incidents and poor socio-
economic conditions, have fuelled the TB pandemic (WHO, 2011, Tripathi et al., 2005).
This has led to the current situation where the developing world accounts for 82 % of all
non HIV related TB deaths, Figure 1.1 (Tripathi et al., 2005, WHO, 2011).
TB is caused by infection with Mycobacterium tuberculosis (Mtb), an extremely well
adapted human pathogen, that causes a multitude of disease outcomes upon infection
ranging from subclinical latent infection, to chronic active granulomatous disease (Chao
and Rubin, 2010). TB is treatable through a combinatorial treatment regimen that involes
two phases: an intial two month treatment phase with four first line drugs, isoniazid,
rifampicin, ethambutol and pyrazinamide followed by a continuation 4 month treatment
phase with rifampicin and isoniazid (WHO, 2009, WHO, 2011, Zhang, 2005). Despite the
presence of this robust treatment program, TB still remains a global health concern due to

2
Figure 1.1: Diagrammatic representation of the estimated 2011 global TB incidents rates. The
southern and central African regions are representative of the highest global burden with an
estimated greater than 300 new incidents per 100 000 population in 2011. Other high burden
regions include the Far East and South East Asia. Lower burden areas include more developed
regions such as North America, Europe and Australia, averaging 0-24 new TB incidents per 100
000 population in 2011(WHO, 2011).
multiple factors. These include inherent cellular mechanisms in the tubercle bacillus for
resisting host innate and adaptive immunity, the ability to establish latent infection and the
multiple mechanisms of inherent or acquired drug resistance/tolerance (Zhang, 2005, Hett
and Rubin, 2008). Furthermore, the highly impermeable cell envelope, the presence of
numerous multi-drug efflux pumps, the expression of antibiotic degrading ezymes and
most principally, the chromosomal mutation of drug targets resulting in the emergence of
multi-drug (MDR), extensively-drug (XDR), and totally-drug (TDR) resistant strains have
all been contributing factors to the success of TB (Zhang 2005; Hett and Rubin 2008;
Velayati et al., 2009). MDR strains are those disease causing strains that are resistant to
rifampicin and isoniazid, XDR strains represent a further step in the evolution of drug
resistance since in addition to being MDR, they are resistant to aminoglycosides and
flouroquinolones (WHO, 2009). The combination of the above-mentioned facets of Mtb

3
biology makes it quiet resilient to TB treatment protocols and necessitates the protracted
treatment period that is currently used.
The rapid emergence of drug resistant strains is a major cause for concern and further
undermines the national TB treatment programs of many high-burden countries, like India
and South Africa (WHO, 2011, Okeke et al., 2005). The increased prevalence of these
strains has been, in part, attributed to the current treatment protocols and patient non-
compliance (Mitchison, 1998, Yagui et al., 2006), the latter relates to the fact that TB
chemotherapy is a lengthy, intense process, which is toxic to the host. This results in a
reduction in the bio-availability of antibiotic in patients, leading to the evolution of drug
resistance (Zhang, 2005, Velayati et al., 2009, Tripathi et al., 2005, Mitchison, 1998). Out
of the estimated 1.4 million new TB incidents in 2011, an estimated 310 000 of these were
MDR-TB strains of, which approximately 60 % were in India, China and The Russian
Federation (WHO, 2011).
Diagnosis of MDR and XDR TB is a lengthy and costly process involving drug
susceptibility testing (DST), which does not form part of the initial diagnosis protocol due
to the cost and extended time associated with these methods (Yagui et al., 2006). This has
now changed with the advent of nucleic acid-based diagnostic platforms that allow for the
identification of drug resistance alleles rapidly (Van Rie et al., 2010). Previously, DST was
only done when a patient was failing standard therapy due to the lengthy time period
required to collect more sputum material, followed by culturing of Mtb, which takes
weeks. This allows ample time for further propagation of these drug resistant strains in
patients, leading to subsequent spread in the community (WHO, 2009, Kimerling et al.,
1999, Yagui et al., 2006, Storla et al., 2008). Infection with MDR strains is usually treated

4
with the use of less efficient, more toxic, second line drugs such as cycloserine,
ethionamide, pyrazinamide, injectable aminoglycosides (amikacin, cepreomycin or
kanamycin) or fluoroquinolones (ciprofloxin or ofloxicin) (WHO, 2009). The cost and
length (up to two years) of the therapy renders this form of TB control highly impractical
and economically challenging at best.
The chromosomal mutation of drug targets or enzymes required for drug activation is the
most common mechanism of drug resistance in Mtb. A number of drug targets have been
identified wherein chromosomal mutations lead to phenotypic resistance to specific
antibiotics. These include: isoniazid resistance resulting from mutations in either katG,
inhA, aphC, nhd and kasA genes, rifampicin resistance resulting from mutations in the
rpoB gene, ethambutol resistance resulting from mutations in the emb gene, pyrazinamide
resistance resulting from mutations in the pncA gene and fluoroquinolone resistance
resulting from mutation in the gyrA or gyrB genes (Heifets and Cangelosi, 1999, Zhang et
al., 1992, Banerjee et al., 1994, Nachega and Chaisson, 2003). There are other, less
characterized, mechanisms that contribute to the emergence of drug resistance. These
include the presence of cellular processes, which target antibiotics directly such as
antibiotic degrading enzymes like β-lactamases, which are induced by the presence of β-
lactam antibiotics (penicillins) and efflux pumps, which actively remove toxic elements out
of the cytoplasm, including antibiotics (Chambers et al., 1995, McKeegan et al., 2004).
Mtb has an additional, mimetic mechanism for evading antibiotic activity by producing
compounds, which structurally resemble antibiotic targets, thus reducing the efficiency of
antibiotics, which then bind the ‘mimetic’ compound leading to reduced overall drug
potency (Nguyen and Thompson, 2006).

5
1.2 Latent TB Infection
The most significant barrier to the complete eradication of TB from human society is the
large reservoir of individuals that harbour latent TB infection (LTBI). This is defined as a
clinical state where an individual is infected with Mtb but does not present with any
clinical symptoms of disease (Chao and Rubin, 2010, Barry et al., 2009). It is estimated
that one third of the world’s population carries LTBI - all of whom carry a defined lifetime
risk (10 % per averaged lifetime) of progressing to active TB disease (Chao and Rubin,
2010, Barry et al., 2009). Despite significant research effort, very little is known about the
bacterial and host innate factors that allow for the establishment and subsequent control of
LTBI. There are currently two principal hypotheses with regards to LTBI, the first posits
that latency is a result of a distinct transition from active growth to dormancy in the
infecting bacteria and the second is based on the idea that LTBI is the result of a dynamic
bacterial population (of growing and dying organisms) that is kept in control by a robust
immune response. In both cases it has been hypothesized that some of the infecting
organisms enter a metabolically quiescent or dormant-like state.
Dormancy is a complex microbiological phenomenon that is usually attributed to bacteria,
grown in the laboratory, and is defined as a reversible state of low metabolic activity,
which the bacterium enters under conditions of stress such as antimicrobial assault or
nutrient starvation (Driks, 2009, Chao and Rubin, 2010). Current antimicrobial protocols
involve the use of antibiotics, which target cellular processes that are essential for bacterial
growth and survival (Zhang, 2005, Tripathi et al., 2005). The most significant problem
with this approach is that these antibiotics will inherently target actively growing
organisms only, which results in phenotypic drug tolerance with non-replicating dormant
organisms thus allowing these bacteria to resist treatment and the host immune response

6
(Chao and Rubin, 2010, Barry et al., 2009). This ability to enter into a dormant state allows
Mtb to survive in the host for years in the face of robust immunity until conditions become
favourable for growth (host becomes immune-compromised), which results in exit from
this state of metabolic quiescence and the resumption of active growth (Scanga et al.,
1999). The dormant phenomenon, and mechanisms associated with entry and exit from this
phase, have been extensively described in Bacillus species with respect to spore formation
[reviewed in (Higgins and Dworkin, 2011)]. Numerous studies have demonstrated that
several species of pathogenic and non-pathogenic mycobacteria have the ability to enter
into a viable but non culturable (VBNC) state, where the organisms are unable to grow on
solid media but remain viable as demonstrated by the use of live/dead staining systems and
moreover by the fact that they can resume growth when cultured in specialized,
conditioned media (Biketov et al., 2000, Shleeva et al., 2002, Wayne, 1994, Oliver, 2010,
Wayne, 1960, Shleeva et al., 2004). An important point to note here is that mycobacteria
do not possess the canonical genes, required for entry into spore-like dormancy, which are
normally found in Bacillus and other spore forming organisms (Feucht et al., 2003). The
mechanisms, which ultimately result the mycobacterial dormant form, if indeed this form
exists during TB infection, are currently unknown and the search to uncover this, is the
underlying hypothesis of this MSc project.
The hypothesis that LTBI is characterized by a dynamic bacterial population is rapidly
gaining traction in the field since recent data on the immunology associated with LTBI
supports this idea (Barry et al., 2009, Berry et al., 2010). From a microbiological
perspective, it has been shown that in axenic bacterial cultures, there is a subset of
organisms, which are phenotypically tolerant to antibiotic attack, these have been termed
persisters (Bigger, 1944, Gefen and Balaban, 2009). The exact metabolic nature of these

7
cells is currently unknown however; there are a number of theories, which attempt to
explain their presence in culture. The first theory, which was introduced by the researcher
who originally observed these organisms, states that persisters comprise a subpopulation of
dormant cells within an actively growing population (Bigger, 1944), since then a few more
theories have been proposed suggesting these could either be, cells, which are defective in
programmed cell death modules initiated by antibiotic treatment (Sat et al., 2001, Wang
and Wood, 2011), cells in some protective stage in the cell cycle (Miller et al., 2004) or
cells that have adapted rapidly to antibiotic stress (Gefen and Balaban, 2009, Bigger, 1944,
Miller et al., 2004). Regardless of the underlying mechanism of the phenomenon,
persistence provides these cells with a phenotypic advantage against antibiotics, which is
not genetically transmitted. This has been confirmed by the demonstration that cultures
grown from persister cells are still susceptible to attack by the same antibiotic that
induced/unmasked the persister population (Bigger, 1944, Gefen and Balaban, 2009).
Consequently, reactivation from LTBI may simply be a result of the immune system’s
inability to deal with the next wave of actively growing organisms, which spawn from the
persister population.
Both these theories premise a level of communication between bacterial cells and between
bacterial cells and their environment in order to inform them of possible danger,
presumably allowing them to enter a state of dormancy for the ultimate survival of the
population. One structure, which has been shown to possess the capacity to induce
signalling pathways is the bacterial cell wall (Shah et al., 2008, Lee et al., 2012). This is
evidenced by the ability of cell wall breakdown products to act as ligands for the induction
of complex signalling pathways involved in the immune response and reactivation of
dormant bacterial cells (Shah et al., 2008, Lee et al., 2012).
8
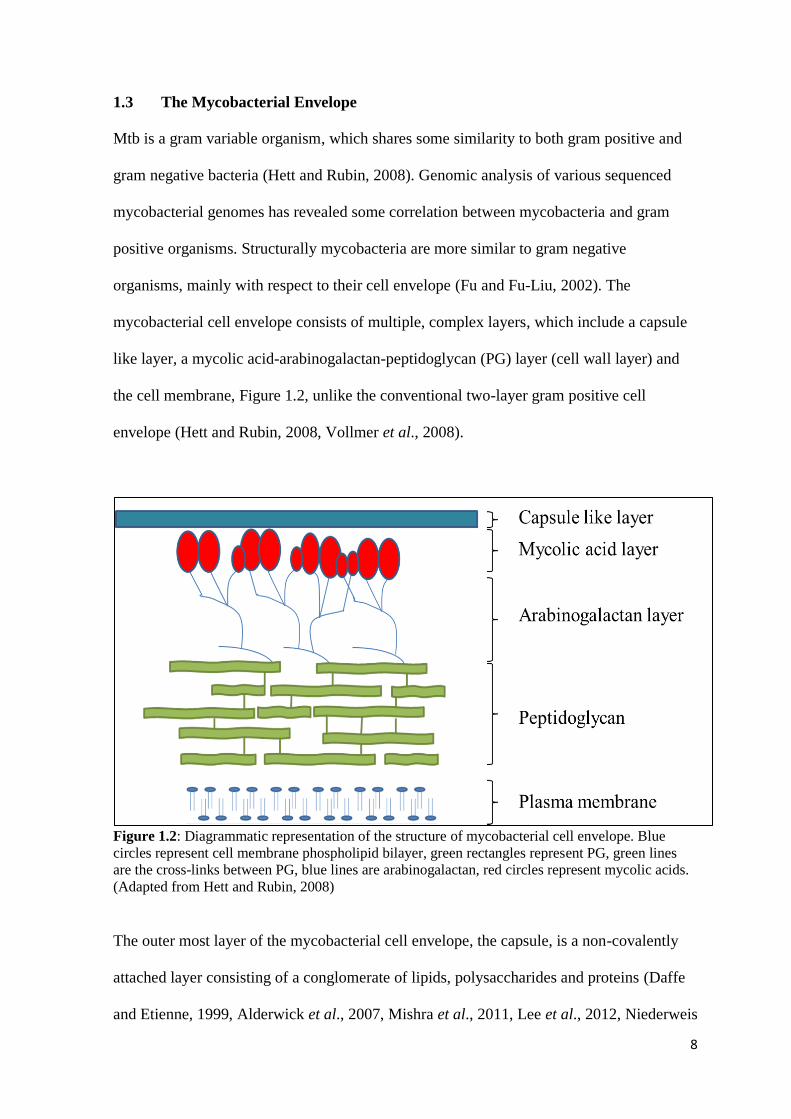
1.3 The Mycobacterial Envelope
Mtb is a gram variable organism, which shares some similarity to both gram positive and
gram negative bacteria (Hett and Rubin, 2008). Genomic analysis of various sequenced
mycobacterial genomes has revealed some correlation between mycobacteria and gram
positive organisms. Structurally mycobacteria are more similar to gram negative
organisms, mainly with respect to their cell envelope (Fu and Fu-Liu, 2002). The
mycobacterial cell envelope consists of multiple, complex layers, which include a capsule
like layer, a mycolic acid-arabinogalactan-peptidoglycan (PG) layer (cell wall layer) and
the cell membrane, Figure 1.2, unlike the conventional two-layer gram positive cell
envelope (Hett and Rubin, 2008, Vollmer et al., 2008).
Figure 1.2: Diagrammatic representation of the structure of mycobacterial cell envelope. Blue
circles represent cell membrane phospholipid bilayer, green rectangles represent PG, green lines
are the cross-links between PG, blue lines are arabinogalactan, red circles represent mycolic acids.
(Adapted from Hett and Rubin, 2008)
The outer most layer of the mycobacterial cell envelope, the capsule, is a non-covalently
attached layer consisting of a conglomerate of lipids, polysaccharides and proteins (Daffe
and Etienne, 1999, Alderwick et al., 2007, Mishra et al., 2011, Lee et al., 2012, Niederweis

9
et al., 2010). The polysaccharide constituent consists mainly of 3 major saccharides, which
are glucan, mannan and arabinomannan saccharides, there is also a range of various sugars,
which have not been characterized as yet (Daffe and Etienne, 1999). The glucan
saccharides are structurally similar to glycogen however, they are 1000-fold smaller. The
mannan constituents are made up of small branched mannose chains and the
arabinomannan is a hetero-polysaccharide, which consists of a mannan component
identical to the capsule mannan and an arabinan component consisting of arabinose and
galactan (Daffe and Etienne, 1999, Mishra et al., 2011, Geurtsen et al., 2009).
The lipid component of the cell envelope is made up of a range of lipids including
lipopolysaccharides (which are a group of highly bioactive lipids thought to be involved in
modulating the host immune responses), phospholipids, lipooligosaccharides, trehalose
dimycolates (which have been associated to the cording phenotype of mycobacterial
colonies) and several other lipids (Daffe and Etienne, 1999, Lee et al., 2012, Neyrolles and
Guilhot, 2011). The protein component consists of a wide range of exported enzymes
involved in the catalysis of diverse substrates. This includes a variety of proteins ranging
from the β-lactamase, involved in β-lactam antibiotic degradation, to superoxide
dismutase, involved in the detoxification of reactive oxygen intermediates (Daffe and
Etienne, 1999, Niederweis et al., 2010).
The second layer of the cell wall is made up 3 distinct components, which are covalently
linked; these are mycolic acids, arabinogalactan and the PG components. The mycolic acid
layer comprises a variety of short α-alkyl and long β-hydroxyl fatty acid chains consisting
of 60 to 90 carbons per chains (Besra and Brennan, 1997). These chains form tetramycolyl-
penta-arabinofuranosyl clusters, which are covalently attached to the arabinogalactan layer

10
by way of an ester bond and have been shown to also associate with capsule lipids and
protein components of the cell wall (Besra and Brennan, 1997, Hett and Rubin, 2008). Due
to their hydrophobic nature, the mycolic acids are postulated to play a central role in the
inherent reduced permeability to small molecules, which is characteristic of mycobacteria
(Besra and Brennan, 1997, Hett and Rubin, 2008). Furthermore, mycolic acids have also
been linked to the reduction of host inflammatory responses induced by Mtb infection (Rao
et al., 2005, Hett and Rubin, 2008). The next component is the arabinogalactan layer,
which is covalently attached to both the mycolic acid and PG layers. The arabinogalactan
consists of branched polysaccharide chains consisting of arabinan and galactan polymers
(Daffe et al., 1990). The galactan polymers consists of approximately 30 galactose
residues, which are linked in an alternate 1-5, 1-6 conformation. The arabinan polymers are
linked at the 5th
position to form branches (Daffe et al., 1990, McNeil et al., 1990). The
arabinogalactan layer contributes to the maintenance of cell envelope integrity and also
plays an important role in modulating cell permeability by serving as an anchor for the
impermeable mycolic acid layer (Hett and Rubin, 2008). The third component of the cell
wall layer is the PG layer. PG is a protective structure, which consists of long glycan
chains linked via peptide stems. The PG layer will be discussed in further detail later.
The complexity of the cell envelope makes Mtb naturally resistant to many antibiotics
(Rastogi et al., 1981, Hett and Rubin, 2008). The cell envelope also plays a role in the
establishment of Mtb infection in the host by providing inherent protection from harmful
host derived elements such as enzymes and bacteriocidal peptides (Daffe and Etienne,
1999). The cell wall has further been implicated in the development of lung granolomas,
which play a vital role in Mtb infection. This is evidenced by the demonstration that
trehalose 6,6’- dimycolates, which are found on the inner coat of the capsule like layer, are

11
released during initial degradation of Mtb during early stages of infection and have been
linked to granuloma induction (Daffe and Etienne, 1999, Rastogi and David, 1988, Lee et
al., 2012).
The critical role that the cell wall plays in Mtb infection underscores the need to develop
new drugs that target cell wall biogenesis and/or remodelling (Boshoff and Barry, 2006).
In this regard, the mycobacterial PG represents a rich area for drug discovery
1.4 PG
PG or murein is a rigid structure surrounding the cell, which is involved in a number of
cellular processes, most importantly, maintenance of cell shape and size (Hett and Rubin,
2008). PG plays a role in a number of other cellular functions including, cell growth,
division, cell to cell signalling, resistance to environmental pressures and maintenance of
osmotic pressure (Hett and Rubin, 2008). It consists of glycan strands composed of
alternating N-acetylglucosamine (NAG) and N-acetylmuramic acid (NAM) carbohydrate
residues (Hett and Rubin, 2008, Vollmer et al., 2008). These glycan strands are cross
linked by stem peptides, which are attached to the NAM residues, Figure 1.3, (Vollmer et
al., 2008, Hett and Rubin, 2008).
PG biosynthesis is a multistep process, which involves a range of enzymes located either in
the cytoplasmic or periplasmic compartments of the cell. PG precursors are produced in the
cytoplasm and transported to the periplasm for incorporation into the growing PG layer
(Hett and Rubin, 2008). Synthesis, shown in Figure 1.4, begins with a NAG residue, which
is first linked to a uridine diphospate (UDP) to form UDP-NAG (Bouhss et al., 2008). The
NAG residue is then converted to NAM by linking enoyl pyruvate at the NAG C5 position
12
(Bouhss et al., 2008). The stem peptide is then attached to the NAM residue sequentially,
beginning with the L-alanine then D-glutamine, diaminopimelic acid (DAP) and finally the
two terminal D-alanine residues are attached simultaneously (Bouhss et al., 2008). The
UDP is removed (to form Lipid I) and UDP-NAG is then linked to the NAM residue and
this compound, referred to as Lipid II, is transported to the plasma membrane where it is
translocated to the periplasm with the possible aid of a flippase (Mahapatra et al., 2005,
Bouhss et al., 2008, Ehlert and Holtje, 1996). The lipid II compound is then incorporated
into the PG where stem peptide crosslinking occurs (Vollmer et al., 2008), Figure 1.4.
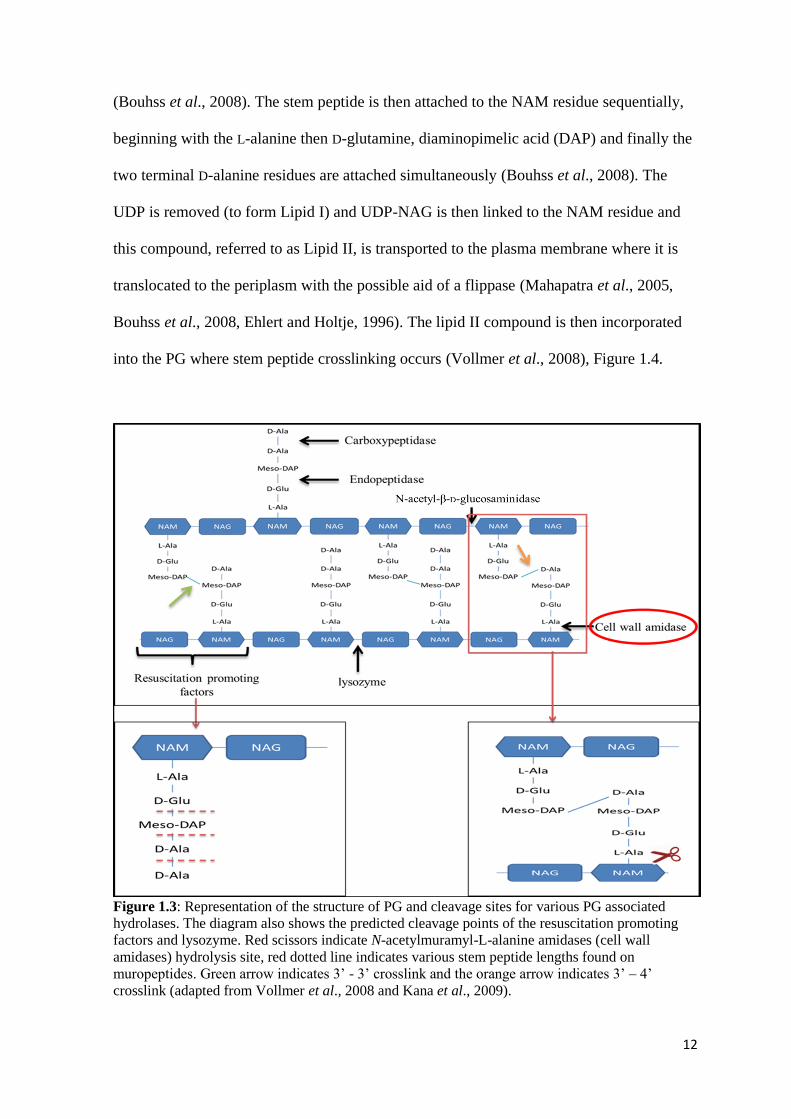
Figure 1.3: Representation of the structure of PG and cleavage sites for various PG associated
hydrolases. The diagram also shows the predicted cleavage points of the resuscitation promoting
factors and lysozyme. Red scissors indicate N-acetylmuramyl-L-alanine amidases (cell wall
amidases) hydrolysis site, red dotted line indicates various stem peptide lengths found on
muropeptides. Green arrow indicates 3’ - 3’ crosslink and the orange arrow indicates 3’ – 4’
crosslink (adapted from Vollmer et al., 2008 and Kana et al., 2009).

13
Figure 1.4: Diagrammatic representation of the PG biosynthetic pathway. The pathway begins with
initiation of PG synthesis by association of UDP with NAG and ends with the incorporation of the
PG precursor into pre-existing bacterial PG.
1.4.1 Antibiotics that target PG synthesis
1.4.1.1 β-lactam antibiotics
β-lactams are a class of antibiotics, which inhibit PG synthesis by preventing stem peptide
crosslinking (Waxman and Strominger, 1983). These drugs contain a β-lactam ring, which
is structurally similar to the terminal D-alanine dimer in the pentapeptide of newly
synthesized PG (Waxman and Strominger, 1983). Consequently, molecules belonging to
this class of antibiotics bind the D, D-transpeptidases (Penicillin Binding Proteins – PBPs),
which are responsible for stem peptide crosslinking, this ultimately inhibits the subsequent
formation of crosslinks between the 4th
D-alanine residue and adjacent meso-DAP residue,
14
Figure 1.4, (Waxman and Strominger, 1983, Hett and Rubin, 2008). These antibiotics are
not efficient in killing mycobacterial strains mainly due expression of a highly active
mycobacterial β-lactamase, which immediately inactivates the antibiotic through cleavage
of the β-lactam ring structure (Flores et al., 2005). One exception is a class of antibiotics
called carbapenems. These are β-lactam antibiotics, which display high tolerance to β-
lactamase induced degradation (Livermore and Woodford, 2000). Recently, it has been
shown that a combination of meropenem (a carbapenem) and clavulanate (β-lactamase
inhibitor) provides potent antitubercular activity against drug susceptible and XDR-TB
(Hugonnet et al., 2009, Hugonnet and Blanchard, 2007).
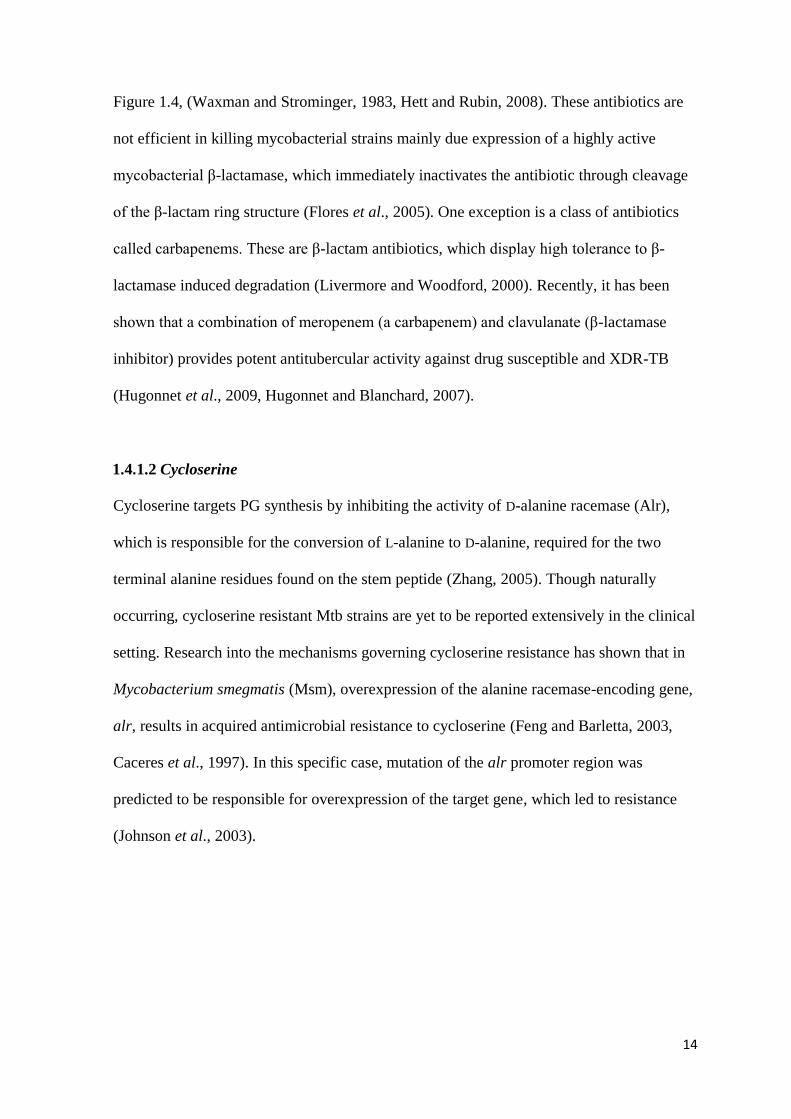
1.4.1.2 Cycloserine
Cycloserine targets PG synthesis by inhibiting the activity of D-alanine racemase (Alr),
which is responsible for the conversion of L-alanine to D-alanine, required for the two
terminal alanine residues found on the stem peptide (Zhang, 2005). Though naturally
occurring, cycloserine resistant Mtb strains are yet to be reported extensively in the clinical
setting. Research into the mechanisms governing cycloserine resistance has shown that in
Mycobacterium smegmatis (Msm), overexpression of the alanine racemase-encoding gene,
alr, results in acquired antimicrobial resistance to cycloserine (Feng and Barletta, 2003,
Caceres et al., 1997). In this specific case, mutation of the alr promoter region was
predicted to be responsible for overexpression of the target gene, which led to resistance
(Johnson et al., 2003).
15
1.4.1.3 Ramoplanin
Ramoplanin is a lipoglycopeptide antibiotic, which inhibits PG synthesis at two distinct
levels. The first is inhibition of the H-acetylglucosaminyltransferase reaction (carried out
by MurG), responsible for linking the NAG residue to the NAM–pentapeptide (Somner
and Reynolds, 1990). The inhibitory effect is achieved by ramoplanin binding to Lipid I
thus preventing MurG association resulting in a halt in the PG biosynthetic pathway
(Somner and Reynolds, 1990). The second level is by association with lipid II, leading to
inhibition of the transglycosylation reaction responsible for the integration of new PG units
into the cell wall (Lo et al., 2000). This antibiotic possesses clinical significance mainly
due to its activity against infectious gram positive bacteria, including methicillin-resistant
Staphylococcus aureus, which cause an estimated 18000 fatalities in the United States of
America annually (Schmidt et al., 2010). Though no naturally occurring resistant strains
have been isolated, a ramoplanin resistant S. aureus strain has been generated in vitro
however the genetic basis of resistance remains unknown (Schmidt et al., 2010).
1.4.1.4 Vancomycin
Vancomycin is a glycopeptide, which inhibits PG synthesis by binding to the two terminal
D-alanine residues thus inhibiting crosslinking between the 4th
D-alanine residue and
adjacent meso-DAP residue (Barna and Williams, 1984). Vancomycin is generally used for
the treatment of gram positive bacterial infections including methicillin-resistant S. aureus
(Weigel et al., 2003). Vancomycin resistant strains have been isolated in S. aureus and
Enterococcus faecium, in both cases resistance is the result of the vanG gene located on a
multi-resistance conjugative plasmid (Weigel et al., 2003). VanG produces a D-alanine, D-
lactate dimer, which is incorporated into the NAM-tripeptide (instead of a D-alanine, D-
alanine dimer) during PG synthesis (Bugg et al., 1991). Incorporation of this dimer has

16
been shown to result in 1000-fold reduction in the binding affinity of vancomycin thus
resulting in diminished potency and subsequent resistance (Weigel et al., 2003, Bugg et al.,
1991).
1.5 PG hydrolases
Though rigid, the PG layer is also a highly dynamic structure, which continuously
undergoes remodelling, required for cell expansion, cell signalling, insertion of new PG
units, insertion of structural features such as flagella and other PG associated processes
(Vollmer et al., 2008). Before any form of remodelling occurs, existing PG needs to be
degraded to create space for the insertion of new PG units. This function is carried out by a
group of enzymes called PG hydrolases. PG hydrolases are a class of enzymes, also
referred to as autolysins, ubiquitously found in bacteria and have the capacity to degrade
bacterial PG at various sites, Figure 1.3 (Vollmer et al., 2008, Hett and Rubin, 2008). PG
hydrolases can be classified into six major groups namely D, D – and L, D -
carboxypeptidases, endopeptidases, lysozymes, lytic transglycosylases, N–Acetyl-β-D-
glucosaminidases and the N-acetylmuramyl-L-alanine amidases (Vollmer et al., 2008).
These are discussed further below.
1.5.1 Carboxypeptidases (CPases)
CPases are a class of PG hydrolases, which are responsible for cleaving the C-terminal
amino acid/s of the stem peptide, Figure 1.3. These enzymes play role in PG synthesis by
removing the terminal D-alanine of the pentapeptide stem peptide thus allowing
transpeptidation between the D-alanine in the 4th
position and the meso-DAP residue of an
adjacent stem peptide (Vollmer et al., 2008, Vollmer, 2012). These enzymes can be
categorised into two main classes, which are the L, D- and D, D- CPases. D, D-CPases
17
hydrolyse the bond between two terminal amino acids, which are both arranged in the D
steric conformation, while L, D-CPases hydrolyse the stem peptide link between the 4th
D-
alanine and the meso-DAP residue, the latter being in the L steric confirmation, Figure 1.3,
(Vollmer et al., 2008, Vollmer, 2012).
1.5.2 Endopeptidases (EPases)
EPases play a similar role to CPases; however this class of enzymes cleaves non-terminal
peptide bonds within the stem peptide, Figure 1.3. There are 2 main types of EPases, which
are the PBP-4 and PBP-7 classes of EPases. The PBP-4 class consists of enzymes that
function in multi-protein complexes consisting of several EPases (Vollmer et al., 2008).
Extensive research done on this class of enzymes has suggested that they possess the
capacity to interact with teichoic acids in addition to PG (Sauvage et al., 2008). Though the
exact role of these enzymes is still unknown they have been indirectly linked to daughter
cell separation and maintenance of cell morphology (Meberg et al., 2004, Sauvage et al.,
2008, Vollmer, 2012). The PBP-7 class consists of membrane associated, β-lactam-
sensitive EPases, which play a role in PG remodelling by cleaving the 4-3 stem peptide
crosslink allowing for insertion new PG and the formation of a meso-DAP to meso-DAP
crosslink, see Figure 1.3 (Vollmer et al., 2008, Vollmer, 2012).
1.5.3 Lysozymes
Lysozymes are a group PG hydrolysing enzymes, which cleave the 1-4 glycosidic bond
between the NAM and NAG residue, Figure 1.3 (Vollmer et al., 2008). Lysozymes are a
class of enzymes whose specific role in bacterial growth is yet to be elucidated mainly due
to the redundancy of glycan degrading enzymes (Vollmer et al., 2008). They are, however,

18
predicted to play some role in septation by hydrolysing septal PG and cell expansion, by
hydrolysing the glycan bond allowing for insertion of new PG (Holtje, 1996).
1.5.4 Lytic transglycosylases
Lytic transglycosylases are similar to lysozymes as they also hydrolyse the β 1-4
glycosidic bond between the NAM and NAG residues, Figure 1.3 (Vollmer et al., 2008).
The difference between these two classes is that lytic transglycosylases further modify the
NAM residue during catalysis resulting in the formation of a 1-6 anhydromuramyl ring on
the NAM residue (Vollmer et al., 2008). The second difference is that while lysozymes are
endo-lytic hydrolases cleaving within the glycan strand, lytic transglycosylases exhibit
exo-lytic activity cleaving the terminal NAM residue, resulting in the production of a 1,6
anhydromuropeptide, which consists of NAG residue attached to the 1,6 anhydro NAM
residue and the stem peptide (Vollmer et al., 2008). Another class of cell wall hydrolases,
which are structurally and functionally similar to the lytic transglycosylases are
resuscitation promoting factors (Keep et al., 2006, Vollmer et al., 2008, Mukamolova et
al., 2006), which are discussed further below.
1.5.4.1 Resuscitation promoting factors (Rpfs)
Rpf is an enzyme, which was discovered in Micrococcus luteus and found to play an
important role in the reactivation of dormant bacteria (Mukamolova et al., 1998). Mtb has
five Rpf homologues (designated RpfA-E), which were shown to be dispensable for
growth in vitro, but are essential for resuscitation from a dormant state in vitro and
important for virulence in mice (Kana et al., 2008). The mechanism of Rpf-mediated
growth stimulation is not fully understood but it has been proposed that Rpfs act as lytic
transglycosylases and cleave the glycan component of the PG backbone (Kana and
19
Mizrahi, 2009, Vollmer et al., 2008, Keep et al., 2006, Mukamolova et al., 2006). How
this catalytic activity relates to resuscitation remains a mystery. The structural differences
between PG found from actively growing bacteria and stationary phase organisms (with
regard to increased level of meso-DAP to meso-DAP crosslinks in stationary phase
organisms, Figure 1.3) have led to the suggestion that the PG structure of dormant bacteria
may be different from that of actively growing bacteria in terms of glycan subunit
composition and/or peptide crosslinks (Lavollay et al., 2008). It has been hypothesized that
Rpfs may be responsible for cleavage of these specialist bonds in PG, which prevail during
dormancy resulting in the release of muropeptides as shown in Figure 1.3 (Keep et al.,
2006). These muropeptides have been linked to the induction of signalling pathways by
association with, and subsequent activation of, a eukaryotic like membrane associated
Ser/Thr kinase (PknB) resulting in signalling cascade, which leads to bacterial reactivation
from dormancy (Kana and Mizrahi, 2010, Vollmer et al., 2008, Kana and Mizrahi, 2009,
Shah et al., 2008). Furthermore, Rpf-mediated hydrolysis of PG could result in the
formation of insertion points for new PG and perhaps activate other essential signalling
pathways involved in growth (Kana and Mizrahi, 2010, Kana and Mizrahi, 2009, Hett and
Rubin, 2008).
1.5.5 N–Acetyl-β-D-glucosaminidases
N–Acetyl-β-D-glucosaminidases are a class of enzymes, which hydrolyse the glycosidic
bond between the NAG and NAM residue, Figure 1.3. This class of enzymes plays a role
in cell wall turnover as it releases components, which can be used for the production of
new PG (Vollmer et al., 2008). Not much research has been done on these enzymes.

20
1.6 N-acetylmuramyl-L-alanine amidases
N-acetylmuramyl-L-alanine amidases or cell wall amidases are a group zinc
metalloenzymes responsible for hydrolysing the bond between the glycan strand and stem
peptide resulting in release of the stem peptide, Figure 1.3 (Heidrich et al., 2001, Uehara
and Park, 2007, McCall et al., 2000). Cell wall amidases can be organized into 2 main
classes determined by the type of amidase domain present in the protein, which can be
either an amidase_2 or amidase_3 - type domain (Vollmer et al., 2008). These enzymes are
found in a wide range of organism including bacteria, viruses and eukaryotic organisms.
1.6.1 Viral and eukaryotic amidases
Cell wall amidases from different organisms catalyse the same reaction but their
fundamental role in various organisms differs, in some cases individual organisms encode
a multiplicity of amidases, each with a discrete function. This adaptability has led to the
amidase being one of the most ubiquitously distributed cell wall hydrolase in existence.
The most extensively researched viral cell wall amidase is the T7 lysozyme. T7 lysozyme
is an amidase_3 domain-containing viral cell wall amidase, which was found to play an
essential role in T7 viral infection (Silberstein and Inouye, 1975, Cheng et al., 1994). The
T7 lysozyme plays two distinct roles during phage infection, however none involve PG
hydrolysis. The first function involves the release of bacterial host DNA from the
associated membrane capsule, possibly mediated by the T7 lysozyme hydrolysis of the
membrane, resulting in subsequent degradation of DNA by alternate enzymes and
utilization of digested DNA in viral DNA replication (Silberstein and Inouye, 1975). Loss
of the T7 lysozyme results in a reduction in viral replication and elevated bacterial
survival, most likely due to reduced availability of bacterial DNA for viral replication
(Silberstein and Inouye, 1975). The second function involves inhibition of T7 gene

21
expression during late infection (Cheng et al., 1994). T7 lysozyme has the ability to
interact with T7 RNA polymerase (Moffatt and Studier, 1987). This interaction results in
inhibition of RNA polymerase activity leading to a halt in gene transcription, this halt in
transcription initiates viral DNA replication resulting in subsequent viral replication
(Cheng et al., 1994, Moffatt and Studier, 1987).
PG recognition proteins (PGRPs) are a group of eukaryotic proteins, which form part of
the innate immune response (Steiner, 2004). They regulate induction of the bacterial
mediated Toll-I immune response. This regulation of immune responses is achieved by
activation of the Toll-I ligand, in response to binding of PGRPs to muropeptides, resulting
in the induction of the Toll-I response (Steiner, 2004). However, PGRPs can also reduce
the levels of Toll-I induction by cleaving the stem peptide thus inactivating the
muropeptide (Steiner, 2004, Mellroth and Steiner, 2006). This function is carried out by a
cell wall amidase-like PGRP found in a variety of organisms including Drosophila and
humans (Steiner, 2004).
1.6.2 Bacterial amidases
In bacteria, investigation of the role of these enzymes in cell growth has been extensively
conducted in E. coli. Thus far, five PG associated amidases have been identified in E. coli;
AmiA, AmiB, AmiC, AmiD (periplasmic) and AmpD (cytoplasmic) (Heidrich et al., 2001,
Korsak et al., 2005). All five amidases hydrolyse the same substrate but their ability to
hydrolyse the substrate is dependent on the conformation of PG. AmiA, AmiB, and AmiC
can only hydrolyse PG in the conformation that is found in the cell wall, consisting of
alternating NAG and NAM subunits bound to the stem peptide. AmpD can only hydrolyse
PG in the form of anhydromuropeptides consisting of an anhydrous NAM subunit bound to

22
the stem peptide (Heidrich et al., 2001). AmiD is able hydrolyse PG regardless of substrate
conformation (Korsak et al., 2005, Heidrich et al., 2001, Uehara and Park, 2007).
Research conducted by Heidrich et al. (2001) has significantly enhanced our understanding
of the role of three periplasmic amidases, AmiA, AmiB and AmiC in E. coli and possibly
other organisms. Their work was predominantly based on the characterisation of amidase
knock-out mutants and demonstrated that a significant percentage of cells in liquid culture
have a tendency of growing in chains when amiA or amiC was deleted individually. This
phenotype was more pronounced in the amiC deletion mutant (Heidrich et al., 2001). The
amiB deletion mutant did not display a similar phenotype. When double and triple mutants,
defective in different combinations of the amiA, amiB and amiC genes were constructed,
the chaining phenotype was more prominent with a greater proportion of cells growing in
this chain conformation and an increase in average chain size (Heidrich et al., 2001). The
presence of miniature cells (which form part of the chains) in amidase triple mutants was
also observed, which led to the hypothesis that these amidase genes are involved in cell
growth and division (Heidrich et al., 2001).
It has also been demonstrated that triple amidase knockouts have increased susceptibility to
certain antibiotics suggesting that these enzymes may play an important role in modulating
the inherent resistance to antibiotics in bacteria (Korsak et al., 2005). These observations
led to the hypothesis that the amiA, amiB and amiC amidase gene products could play a
role in antibiotic resistance through structural maintenance of the cell envelope by
hydrolysis, which could lead to envelope remodelling (Korsak et al., 2005).
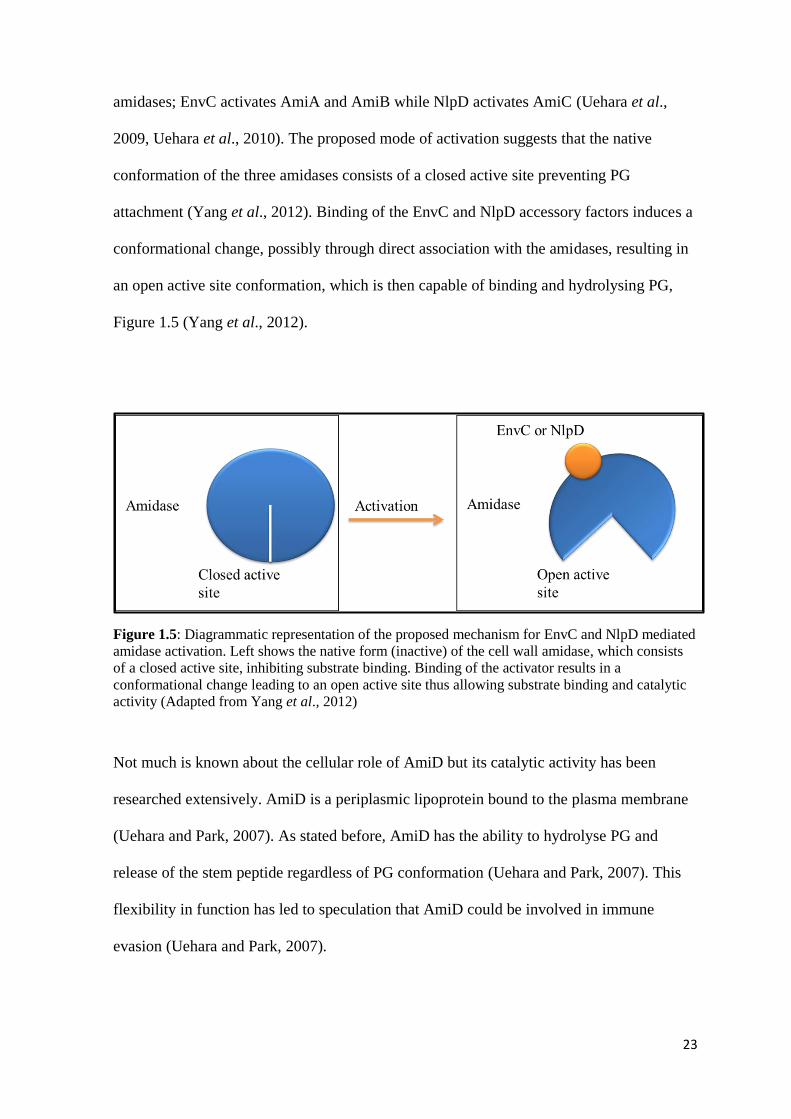
Further studies have led to the discovery of two proteins responsible for activating the
amidase_3 domain-containing family of amidases, these are EnvC and NlpD. These are
LytM containing PG degrading enzymes, which possess the ability to activate specific
23
amidases; EnvC activates AmiA and AmiB while NlpD activates AmiC (Uehara et al.,
2009, Uehara et al., 2010). The proposed mode of activation suggests that the native
conformation of the three amidases consists of a closed active site preventing PG
attachment (Yang et al., 2012). Binding of the EnvC and NlpD accessory factors induces a
conformational change, possibly through direct association with the amidases, resulting in
an open active site conformation, which is then capable of binding and hydrolysing PG,
Figure 1.5 (Yang et al., 2012).
Figure 1.5: Diagrammatic representation of the proposed mechanism for EnvC and NlpD mediated
amidase activation. Left shows the native form (inactive) of the cell wall amidase, which consists
of a closed active site, inhibiting substrate binding. Binding of the activator results in a
conformational change leading to an open active site thus allowing substrate binding and catalytic
activity (Adapted from Yang et al., 2012)
Not much is known about the cellular role of AmiD but its catalytic activity has been
researched extensively. AmiD is a periplasmic lipoprotein bound to the plasma membrane
(Uehara and Park, 2007). As stated before, AmiD has the ability to hydrolyse PG and
release of the stem peptide regardless of PG conformation (Uehara and Park, 2007). This
flexibility in function has led to speculation that AmiD could be involved in immune
evasion (Uehara and Park, 2007).
24
Work conducted on the innate immune response and bacterial reactivation, including
germination of spores, has revealed the importance of muropeptides in the activation of
these processes (Lim et al., 2006, Werner et al., 2000, Shah et al., 2008). Muropeptides
form part of the products released from PG catalysis by the different enzymes shown in
Figure 1.3. These can be in the form of muramyl dipeptides or muramyl tripeptides
consisting of a NAG-NAM disaccharide linked to stem peptides of varying length, or as
anhydromuropeptides, which contain a NAM residue with a 1, 6 anhydromuramoyl ring
(Lim et al., 2006, Werner et al., 2000, Jacobs et al., 1994). Research conducted in
Drosophila melanogaster has revealed that the minimal structural requirement for
induction of PG associated innate immune response is a disaccharide muropeptide
consisting of a stem peptide, which contains a minimal of 3 peptides, the third peptide
being a meso-DAP (Werner et al., 2000). The same result was also observed when
investigating the importance of muropeptides in germination of B. subtilis spores (Lim et
al., 2006, Shah et al., 2008). Due to the importance of the overall structure it is speculated
that AmiD may remove the stem peptide resulting in the release of molecules, which
cannot be detected by the host immune system (Uehara and Park, 2007). This hydrolysis
would also result in the formation of the disaccharide and stem peptide. These cannot
independently induce signalling pathways involved in bacterial growth stimulation and
dormant spore reactivation, thus keeping the cells in their dormant state, which could aid in
the formation and maintenance of the LTBI phenomenon (Shah et al., 2008). Collectively,
these studies demonstrate that cell wall amidases play an important role in bacterial and
host signalling processes that regulate bacterial growth and/or reactivation and activation
of innate immune responses respectively. In this context, we hypothesize that amidases
play a similar role in Mtb infection, thus may also contribute to the reactivation from
dormancy.
25
AmpD is the first extensively studied PG associated amidase. This is mainly due to its role
in the expression of β-lactamase, which degrades β-lactam antibiotics such as penicillin, a
widely used antibiotic for the treatment of bacterial infection (Jacobs et al., 1994). This is
the only cytoplasmic PG-associated amidase identified thus far. This amidase can only
hydrolyse substrates in the form of anhydromuropeptides, which have been linked to β-
lactamase induction (Heidrich et al., 2001). It has been proposed that the hydrolysis of
these muropeptides by AmpD has a negative regulatory effect on the expression of β-
lactamase, and consequently a negative effect on bacterial resistance to β-lactam antibiotics
(Jacobs et al., 1994).
Though different bacteria contain varying numbers of cell wall amidases the general role
of these enzymes remains the same. Research done in B. subtilis also confirmed that cell
wall amidases play a role in septation as seen by the formation of abnormally long chains
in LytC deficient strains (Blackman et al., 1998, Smith et al., 2000). Further research in
Bacillus also revealed additional processes wherein cell wall amidases are utilised
including mother cell lysis during spore formation and formation of the δ-lactam structure
in the spore cortex, indicating their importance in the formation of dormant spores (Smith
et al., 2000, Popham et al., 1996). Cell wall amidases also play a role in bacteria, which are
normally filamentous. In this regard, it has been demonstrated that Cyanobacterium
Anabaena PCC 7120, a photosynthetic prokaryotic organism, requires a cell wall amidase
for cell to cell communication with neighbouring cells and the ultimate formation of
heterocysts from vegetative cells (Berendt et al., 2012). Heterocysts are nitrogenase
containing cells, which are responsible for filamentous nitrogen assimilation (Berendt et
al., 2012). These cells are morphologically different from vegetative cells to allow for
protection of nitrogenases from the O2 produced by photosynthetic cells (Berendt et al.,
2012).
26
The role of amidases in bacterial growth, virulence and resuscitation from dormancy in
mycobacteria has not been investigated. The impact of these amidases on mycobacterial
antibiotic resistance is also unknown.
1.7 Aims and objectives
Aim
In this research, the function of putative amidase-encoding genes will be investigated in
Msm, which serves as a model organism for Mtb research since it is a close relative of Mtb
but easier and faster to work with and is also non-pathogenic. We hypothesize that cell
wall amidases play important roles mycobacterial growth and cell division, which may be
functionally redundant across the class and/or complementary with other cell wall
amidases and/or other classes of cell wall hydrolases
Specific objectives
To identify putative amidase-encoding genes in Msm and Mtb through
bioinformatics analysis
To construct knockout/knockdown mutant strains defective in putative amidase-
encoding genes in Msm
To characterise phenotypic differences between wild type and amidase mutant
strains using the following phenotypic assays:
o Growth kinetics analysis
o Analysis of biofilm formation
o Bacterial motility assays
o Colony morphology analysis
o Bacterial microscopic analysis

27
2. Materials and Methods
A brief summary of the project experimental layout is illustrated as a flow chart in the
appendix section (Appendix E).
2.1 Bacterial strains, plasmids and growth conditions
All bacterial strains and plasmids created and/or used in this study are listed in Table 2.1
and 2.2 respectively. Glycerol stocks of each strain were prepared in media containing
6.6 % (v/v) glycerol and stored at -80 °C.
Table 2.1: Bacterial strains created and/or used in this study
Strain
Genotype
Reference
Escherichia coli DH5α SupE44 ΔlacU169 hsdR17 recA1 endA1
gyrA96 thi-1 relA1
Promega, Madison,
WI
mc2155 High frequency transformation mutant of
Msm ATCC 607
(Snapper et al., 1990)
Δami1 Derivative of mc2155 carrying an unmarked,
out-of-frame deletion in ami1
This study
SRS Derivative of mc2155 carrying pMC1s
integrated at the attB bacterial phage
attachment site, KanR
C. Ealand (CBTBR)
ami2KDP Derivative of SRS carrying pSEAmi2P
integrated in the upstream promoter region of
ami2 to allow for ATC-regulation, KanR,
HygR
This study
Δami1::pMVami1 Derivative of Δami1 carrying pMVami1
integrated at the bacterial attB phage
attachment site, HygR
This study
KanR: Kanamycin Resistance, Hyg
R: Hygromycin Resistance
Table 2.2: Plasmids created and/or used in this study
Plasmids Genotype
Reference
p2NIL E. coli cloning vector; KanR
(Parish and Stoker,
2000)
pSE100 E. coli-Mycobacterium shuttle vector carrying
Pmyc1tetO; HygR
(Ehrt et al., 2005)
pOLYG E. coli-Mycobacterium shuttle vector; HygR (O'Gaora et al., 1997)
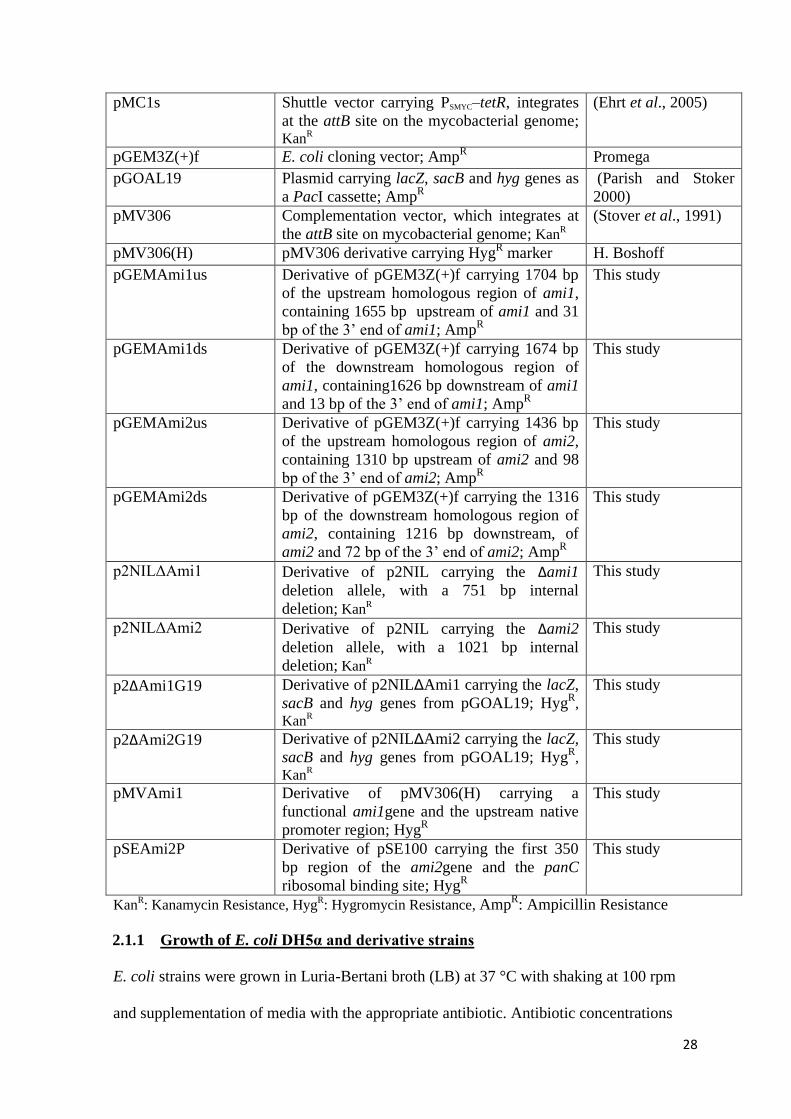
28
pMC1s Shuttle vector carrying PSMYC–tetR, integrates
at the attB site on the mycobacterial genome; Kan
R
(Ehrt et al., 2005)
pGEM3Z(+)f E. coli cloning vector; AmpR Promega
pGOAL19 Plasmid carrying lacZ, sacB and hyg genes as
a PacI cassette; AmpR
(Parish and Stoker
2000)
pMV306 Complementation vector, which integrates at
the attB site on mycobacterial genome; KanR
(Stover et al., 1991)
pMV306(H) pMV306 derivative carrying HygR marker H. Boshoff
pGEMAmi1us Derivative of pGEM3Z(+)f carrying 1704 bp
of the upstream homologous region of ami1,
containing 1655 bp upstream of ami1 and 31
bp of the 3’ end of ami1; AmpR
This study
pGEMAmi1ds Derivative of pGEM3Z(+)f carrying 1674 bp
of the downstream homologous region of
ami1, containing1626 bp downstream of ami1
and 13 bp of the 3’ end of ami1; AmpR
This study
pGEMAmi2us Derivative of pGEM3Z(+)f carrying 1436 bp
of the upstream homologous region of ami2,
containing 1310 bp upstream of ami2 and 98
bp of the 3’ end of ami2; AmpR
This study
pGEMAmi2ds Derivative of pGEM3Z(+)f carrying the 1316
bp of the downstream homologous region of
ami2, containing 1216 bp downstream, of
ami2 and 72 bp of the 3’ end of ami2; AmpR
This study
p2NILΔAmi1 Derivative of p2NIL carrying the Δami1
deletion allele, with a 751 bp internal
deletion; KanR
This study
p2NILΔAmi2 Derivative of p2NIL carrying the Δami2
deletion allele, with a 1021 bp internal
deletion; KanR
This study
p2ΔAmi1G19 Derivative of p2NILΔAmi1 carrying the lacZ,
sacB and hyg genes from pGOAL19; HygR,
KanR
This study
p2ΔAmi2G19 Derivative of p2NILΔAmi2 carrying the lacZ,
sacB and hyg genes from pGOAL19; HygR,
KanR
This study
pMVAmi1 Derivative of pMV306(H) carrying a
functional ami1gene and the upstream native
promoter region; HygR
This study
pSEAmi2P Derivative of pSE100 carrying the first 350
bp region of the ami2gene and the panC
ribosomal binding site; HygR
This study
KanR: Kanamycin Resistance, Hyg
R: Hygromycin Resistance, Amp
R: Ampicillin Resistance
2.1.1 Growth of E. coli DH5α and derivative strains
E. coli strains were grown in Luria-Bertani broth (LB) at 37 °C with shaking at 100 rpm
and supplementation of media with the appropriate antibiotic. Antibiotic concentrations
29
were as follows: Kanamycin (Kan) 50 μg/ml, Hygromycin (Hyg) 200 μg/ml and
Ampicillin (Amp) 100 μg/ml. The strains were also grown on Luria-Bertani agar (LA)
containing the abovementioned concentration of antibiotics, when appropriate, at 37 °C
unless stated otherwise. E. coli strains containing plasmids for bulk plasmid extraction
were grown in LB containing appropriate antibiotic at 37 °C shaking at 250 rpm, unless
stated otherwise.
2.1.2 Growth of Msm strains
Msm strains were grown in Middlebrook 7H9 liquid media supplemented with 0.2 %
glucose, 0.5 % glycerol, 0.085 % NaCl, 0.05 % Tween 80 and appropriate antibiotic at
37 °C (herein referred to as 7H9 media) with shaking at 100 rpm unless stated otherwise.
Antibiotic concentrations used were as follows: Kan 25 μg/ml and Hyg 50 μg/ml. Strains
were also grown on Middlebrook 7H10 solid media supplemented with 0.2 % glucose,
0.5 % glycerol, 0.085 % NaCl and appropriate antibiotics at 37 °C unless stated otherwise
(herein referred to as 7H10 media).
2.2 DNA manipulation
2.2.1 Mycobacterial chromosomal DNA extraction
2.2.1.1 Cetyltrimethylammonium bromide (CTAB) DNA extraction
Bacterial strains were grown on 7H10 agar for 2 days and the resulting cells were
harvested by scraping the surface of the agar plate and resuspending the cells in 500 µl TE
buffer followed by incubation at 65 °C for 35 min. The cells were incubated at room
temperature to cool down. Thereafter, a 50 µl aliquot of lysozyme (10 mg/ml) was added
to the sample and incubated at 37 °C for 1 hour, subsequently 70 µl of 10 % SDS and 6 µl
of proteinase K (10 mg/ml) was added and the sample was incubated at 65 °C for 2 hours.
30
Following incubation, 100 µl 5 M NaCl and 80 µl pre-warmed CTAB/NaCl was added,
mixed and incubated at 65 °C for 10 min. An equal volume of 24:1/Chloroform:Isoamyl
alcohol was added, followed by mixing and centrifugation at maximum speed for 5 min at
room temperature. The aqueous layer was subsequently transferred into a clean Eppendorf
tube followed by addition of 0.6 volume equivalent isopropanol and centrifugation for
20 min at room temperature. The supernatant was discarded; the pellet was washed in 70 %
ethanol and dried using an Eppendorf Concentrator 5301. The DNA pellet was
resuspended in 50 µl sterile distilled water (sdH2O), quantified using NanoDrop and stored
at 4 °C.
2.2.1.2 Small scale DNA extraction for PCR
A single colony was scraped from an agar plate and resuspend in 30 µl sdH2O. Thereafter a
10 µl sample was spotted on 7H10 agar for a sample reference and 40 µl of chloroform
was added to the remaining solution and incubated at 95 °C for 5 min. The sample was
centrifuged at 16 000 × g for 5 min, the resulting aqueous layer was transferred into a fresh
Eppendorf tube and 2 µl was used as template for PCR.
2.2.2 E. coli plasmid extraction
2.2.2.1 Bulk plasmid preparation using Nucleobond plasmid purification kit
Plasmid DNA preparation using the Nucleobond kit was done as per manufacturer’s
instructions (Macherey Nagel). Briefly, a 50 ml E. coli culture was grown in LB containing
appropriate antibiotic at 37 °C with shaking at 250 rpm to an OD600nm of 3 to 5. The culture
was centrifuged at 3 900 × g for 10 min. The supernatant was discarded and the cells were
resuspended in 4 ml of Buffer S1 containing RNAse A. Thereafter 4 ml of the lysis buffer,
Buffer S2, was added to the sample and mixed gently by inverting 8 to 10 times followed
31
by incubation at room temperature for 3 min. Following incubation, 4 ml of Buffer S3 was
added to the sample, which was then mixed gently by inverting the tube 10 times. The
sample was placed on ice for 5 min and thereafter centrifuged at 3 900 × g for 25 min.
During the 25 min centrifugation stage, a new Nucleobond AX100 column was
equilibrated by adding 2.5 ml Buffer N2 and allowing the buffer to flow through by
gravity. After centrifugation, the supernatant was decanted into the column and allowed to
flow through. Thereafter, the column was washed with 10 ml Buffer N3. The DNA was
eluted by addition of 5 ml Buffer N5, the flow-through was collected in a sterile tube. The
DNA was precipitated by adding 3.5 ml of isopropanol into the tube, followed by
centrifugation at 16 000 × g at 4 °C for 30 min. The resulting supernatant was discarded
and the pellet was washed with 70 % ethanol. Thereafter the pellet was dried, resuspended
in 50 µl sdH2O and quantified using the NanoDrop.
2.2.2.2 Plasmid miniprep using alkaline lysis method
A single colony was grown in 2 ml LB containing appropriate antibiotic at 37 °C. A 10 µl
sample was spotted on LA containing appropriate antibiotics for reference. The remaining
culture was centrifuged 9 300 × g and resuspended in 100 µl cold solution I. Thereafter
200 µl of room temperature solution II was added to the sample, which was mixed by
inverting 10 times and placed on ice for 5 min. Following incubation, 150 µl of cold
solution III was added and the sample was placed on ice for a further 10 min. The sample
was centrifuged at room temperature for 10 min and the supernatant was transferred to a
clean Eppendorf tube. A 300 µl aliquot of isopropanol was added, and the mixture was
centrifuged at room temperature for 20 min. The supernatant was discarded; the pellet
washed with 70 % ethanol and dried using an Eppendorf Concentrator 5301. The DNA
32
pellet was then resuspended in 10 µl sdH2O and used for restriction endonuclease
reactions.
2.2.3 Sodium acetate DNA precipitation
A one-tenth volume equivalent of 3 M sodium acetate, pH 5.2, and 2.5 volume equivalent
of cold 100 % ethanol was added to the DNA solution. The sample was mixed and
incubated at -20 °C for 20 min. Thereafter the sample was centrifuged at room temperature
for 20 min, the supernatant was discarded and the pellet washed in 70 % ethanol. The
pellet was dried using the Eppendorf Concentrator 5301 and resuspend in 50 µl sdH2O.
2.2.4 DNA restriction enzyme digestion
Restriction digests were carried out using Roche (Roche Applied Sciences), NEB (New
England Biolab) and Fermentas (Fermentas) enzymes and reactions were set up as per
manufacturer’s instructions. Briefly, 20 µl restriction enzyme reactions containing
1 × appropriate restriction buffer, 1 µg DNA, 1 U restriction enzyme and sdH2O were set
up in an Eppendorf tube and incubated at the appropriate temperature for 1 hour. Bovine
serum albumin (BSA) was added to the reaction when necessary to a final concentration of
10 µg/ml. The reaction was heat inactivated at 65 ºC for 10 min unless advised differently
by supplier.
2.2.5 Phosphorylation of DNA
Phosphorylation of PCR products was carried out using Polynucleotide kinase (PNK)
(Roche Applied Sciences) in 20 µl reactions containing 1 × PNK buffer, 1 µg of PCR
product, 1 U of PNK and sdH2O. This was incubated at 37 ºC for 30 min and then heat
inactivated at 65 ºC for 20 min.
33
2.2.6 Dephosphorylation of 5’ends of plasmid DNA
Dephosphorylation of 5’ ends was carried out using Antarctic Alkaline Phosphotase (AAP)
(Roche Applied Sciences) in 20 µl reactions containing 1 × AAP buffer, 1 µg of digested
DNA, 1 U of AAP and sdH2O. This reaction was incubated at 37 ºC for 1 hour, then heat
inactivated at 65 ºC for 20 min.
2.2.7 DNA ligation
All ligations were carried out using the Fermentas T4 Ligase (Fermentas). For optimal
ligation conditions a molar ratio of 1:1 vector: insert was used in all reactions. A constant
amount of vector, 50 ηg, was used for all ligation reactions and the insert mass required to
make up a molar ratio of 1:1 was calculated using the following equation:
Ligation reactions were set up in 20 µl volumes containing 1 × ligation buffer, 50 g
vector DNA, 1 molar equivalent insert DNA, 5 U T4 ligase and sdH2O, which were
incubated at 22 ºC for 10 min. In the case of blunt end ligations the reaction was
supplemented with one-tenth volume PEG4000 and incubated at 22 ºC for 1 hour. T4
ligase was then heat inactivated at 75 ºC for 10 min.
2.2.8 Agarose gel electrophoresis
DNA was run on agarose gels containing 0.5 µg/ml ethidium bromide. Separation of high
molecular weight DNA was accomplished by using 0.8 – 1 % agarose gels made in
1 × TAE buffer (40 mM Tris-acetate, 1 mM EDTA) and low molecular weight DNA
separation was accomplished by using 2 % agarose gels. Electrophoresis was conducted in
1 × TAE buffer at 80 – 100 V in electrophoresis tanks (Bio-Rab laboratories). In all cases,

34
DNA molecular weight markers for size determination were run on the same gel. Gels
were visualized using a G:Box SYNGENE system in conjunction with the GeneSnap
image acquisition software (Syngene).
2.2.9 Purification of DNA fragments
Fragment purification was carried out for either PCR products or DNA restriction products
for use in subsequent DNA manipulation/cloning steps. In both cases, purification was
conducted using the Nucleospin PCR and Gel purification Kit (Macherey-Nagel) as per
manufacturer’s instructions. In the case of PCR products, a small sample was run on a gel
to make sure the desired product was amplified. Thereafter, a 2 volume equivalent of
binding Buffer was added to the remaining product, which was loaded on the provided
column and spun at 11 000 × g for 30 s. The flow-through was discarded, 700 µl wash
buffer was added and spun at 11 000 × g for 2 min. The DNA was eluted by adding 50 µl
dH2O to the column and centrifuging at 11000 × g for 1 min. The DNA was quantified
using the NanoDrop. In the case of gel extractions, the desired fragment was excised from
the gel and melted in binding buffer at 42 ºC. The product was then loaded on the column
provided and purified as per PCR products.
2.2.10 Nucleic acid quantification
All DNA and RNA was quantified using the NanoDrop ND-1000 Spectrophotometer
(NanoDrop Technologies) used in conjunction with software provided by the manufacturer
(Coleman Technologies).

35
2.2.11 DNA Sequencing
Sequencing, which was outsourced to the DNA Sequencing Facility of Stellenbosch
University, was performed using the Big Dye terminator v3.1 Cycle Sequencing kit and
Bioline Half Dye Mix. Finch TV version 1.4 and the Seqman module of the Lasergene
suite software were used to analyse the sequencing data.
2.3 Standard Polymerase chain Reaction (PCR)
Screening for clones/knockout mutants and optimization of PCR parameters for all primers
was conducted using the Roche Fast-Start kit (Roche Applied Science). Amplification of
products for cloning was done using the Phusion High-Fidelity DNA polymerase
(Finnzymes), which retains DNA proofreading capacity to ensure that no inadvertent
second-site mutations were introduced into the resulting PCR products. Primer design was
carried out using the Primer3 online tool (http://frodo.wi.mit.edu/) using the following
parameters:
Table 2.3: Primer3 parameters used when designing primers using the Primer3 tool
Size (bp) Tm (ºC) % GC
Minimum 18 55 55
Maximum 22 65 65
Optimum 20 60 62
2.3.1 Roche Fast-Start Taq PCR
PCR reactions were set up in a 50 µl volume each containing 1 × PCR buffer, 2 mM
MgCl2, 0.2 mM dNTP, 0.5 mM forward and reverse primers, 1 × GC rich buffer, 50 ηg

36
DNA template, 2 U of Taq polymerase and sdH2O in 200 µl PCR tubes. These reactions
were incubated in a thermo cycler using the following parameters: enzyme activation at
95 ºC for 4 min, then 35 cycles of denaturation at 95 ºC for 30 s, annealing temperature,
which was dependent on the specific primer set for 30 s and elongation at 72 ºC for a time
period dependent on the length of the desired product (Fast start Taq amplifies 1 Kb/min),
then final elongation at 72 ºC for 10 min.
2.3.2 Phusion High-Fidelity DNA polymerase
PCR reactions were set up in 20 µl or 50 µl volumes containing 1 × GC buffer, 0.2 mM
dNTP, 0.5 mM forward and reverse primers, 3 % DMSO, 50 ηg template, 1 U Phusion
polymerase and sdH2O in 200 µl PCR tubes. The reactions were incubated in a thermo
cycler using the following parameters: enzyme activation at 98 ºC for 30 s, then 35 cycles
of denaturation at 98 ºC for 10 s, annealing temperature, which was dependent on the
specific primer set for 30 s and elongation at 72 ºC for a time period dependent on the
length of the desired product (Phusion polymerase amplifies at 1 Kb/30 s), followed by a
final elongation stage of 72 ºC for 10 min.
2.4 Transformation of bacterial cells
2.4.1 Transformation of chemically competent DH5α
Chemically competent cells were prepared using rubidium chloride. For this, 1 ml of a
stationary phase overnight E. coli culture was inoculated in 100 ml LB broth and grown to
an optical density (OD)600nm of between 0.48 - 0.55. The cells were placed on ice for 15
min and centrifuged at 3 900 × g for 5 min at 4 °C to harvest cells. The pellet was then
resuspended in 20 ml TfbI solution (30 mM potassium acetate, 100 mM rubidium chloride,
10 mM calcium chloride, 50 mM manganese chloride, and 15 % v/v glycerol - pH 5.8),
37
and placed on ice for 15 min. The cells were then centrifuged at 3 900 × g for 5 min at
4 °C, resuspended in 2 ml TfbII solution (10 mM MOPS, 75 mM calcium chloride, 10 mM
rubidium chloride and 15 % v/v glycerol-pH 6.5), 500 μl aliquots were flash-frozen in
ethanol and stored at -80 °C until further use.
For transformations, E. coli DH5α competent cells were thawed on ice and 100 μl of the
cell suspension was used per transformation. Up to 1 μg plasmid DNA was incubated with
the cells on ice for 20 min, heat-shocked for 90 s at 42 °C and placed on ice for 2 min.
Thereafter, 750 µl of 2 × TY was added to rescue the cells followed by incubation at 37 °C
for 1 hour. The cells were plated on LA media containing the appropriate antibiotics, and
incubated for 1 - 2 days at 37 °C with the exception of larger plasmids (>8 Kb), which
were incubated at 30 ºC for 2 days.
2.4.2 Electroporation into Msm
Msm was grown to an OD600nm of 0.6 - 0.8 in a final volume of 100 ml 7H9 media, using a
stationary phase preculture as an inoculum. The cells were harvested at 2 630 × g for
10 min at 4 °C and the pellet washed 4 times by gentle resuspension in successive steps of
45 ml, 20 ml, 10 ml and 5 ml of ice-cold 10 % glycerol followed by centrifugation at
2 630 × g for 10 min at 4 °C. The final cell pellet was resuspended in 2 ml ice-cold 10 %
glycerol and these competent cells were used immediately. Up to 5 μg plasmid DNA was
added to a 400 μl aliquot of Msm competent cells. This was transferred to a 0.2 cm
electroporation cuvette (Bio-Rad laboratories) and pulsed using the following conditions:
2.5 kV, 25 μF and 1000 Ω using the Gene PulserX cell (Bio-Rad Laboratories). The cells
were rescued immediately with 800 μl 2 × TY for at least 3 hours at 37 °C and thereafter
38
plated on Middlebrook 7H10 media containing the appropriate supplements and
antibiotics, followed by incubation for 3 - 7 days at 37 °C before scoring CFUs.
2.5 Southern Blotting
2.5.1 Labelling of Probe DNA
Alkali-labile digoxigenin (DIG)-dUTP probes were constructed using a commercially
available kit (PCR DIG Probe Synthesis Kit -Roche Applied Sciences) by PCR as per
manufacturer’s instructions. Briefly two 50 µl reactions (labelled and unlabelled) were set
up containing 1 × PCR buffer, 1 mM forward and reverse primer and 0.75 µl enzyme mix.
The labelling reaction was supplemented with 5 µl PCR DIG labelling mix while the
negative control was supplemented with 5 µl of a dNTP stock solution. The PCR
amplification conditions were first optimized using Roche Fast-start Taq to ensure that a
single, pure product was produced during the labelling reaction. The DIG-labelled and
unlabelled reactions were run on the same agarose gel to confirm labelling since
incorporation of the DIG label results in a molecular weight shift on agarose gels.
2.5.2 Blotting
For restriction digests, 2 µg of chromosomal DNA was digested with 5 U of selected
enzyme overnight. DNA was then separated on 0.8 % agarose gel with either Lambda pUC
mix 4 Marker (Fermentas) or Roche marker IV (Roche) at 80 V for 2 to 3 hours. After
photographing of the gel, using the G-Box SYNGENE system, the DNA was depurinated
by soaking the gel in 0.2 M HCl for 15 min with gentle shaking. The depurination solution
was then removed and the gel was washed with 1 × TBE buffer followed by soaking in a
solution of 0.5 M NaOH and 1.5 M NaCl for 30 min to denature the DNA. The gel was
then washed in 1 × TBE, overlaid with Hybond™ -N nitrocellulose membrane,

39
sandwiched between 4 Whitman filter papers and 2 sponges, and pre-soaked in 1 × TBE
(89 mM Tris-Borate, 2 mM EDTA, pH 8.3). The sandwich was carefully placed in a gel
cassette (Bio-Rad Laboratories) and transferred to an SB10 tank (Bio-Rad Laboratories)
containing 1 × TBE. DNA was transferred to the nitrocellulose membrane at 600 mA for
2 hours. The DNA was cross-linked to the nitrocellulose membrane by UV irradiation
twice, at 2500 mJ/cm3 in a UV Stratalinker 1800 (Stratagene). The membrane was
incubated in 10 ml of DIG-EASY-HYB solution for 30 min at 42 ºC. The DIG labelled
probe was added to the hybridization solution and incubated at 42 ºC overnight. The DIG-
EASY-HYB and probe mixture was decanted into a 50 ml Falcon tube and stored at -20 ºC
for future use. The membrane was washed with a solution containing 2 × SSC (300 mM
NaCl, 30 mM Sodium citrate) and 0.1 % SDS for 5 min at room temperature. This was
followed by two washes in a solution containing 0.5 × SSC and 0.1 % SDS for 15 min at
68 ºC. The membrane was rinsed in wash buffer (0.1 M maleic acid buffer and 0.3 %
Tween 20) for 5 min at room temperature and incubated in 1 × blocking solution (made by
diluting 10 × blocking solution – Roche Applied Sciences - in 0.1 M maleic acid buffer)
for 30 min. Thereafter, the membrane was incubated in 20 ml of antibody solution (20 ml
1 × blocking solution and 2 µl Anti-Digoxigenin-AP [Roche Applied Sciences]) for
30 min, followed by rinsing twice for 15 min in wash buffer. The membrane was placed in
a hybridization bag (Roche Diagnostics; Mannheim, Germany) DNA side facing up and 1
ml chloro-5-substituted adamantyl-1, 2-dioxetane phosphate (CSPD) substrate was
aliquoted on to the DNA side of the membrane and incubated at room temperature for 10
min, the excess CSPD was then removed, the hybridization bag was sealed and incubated
at 37 ºC for 5 min. The membrane was exposed to X-ray film (Kodak Biomax Light or CL-
Xposure™ Film-Thermo Scientific) for 10 min and the film was developed using an
automated Axim developer.

40
2.6 Assessment of gene expression
PCR Primers for gene expression work are listed in Table 2.6. Expression primer sets for
genes of interest were designed to contain a forward and reverse primer pair for
amplification and a second reverse primer (RT primer) for cDNA synthesis. Expression
analysis was conducted in two steps, the first being cDNA synthesis from purified RNA,
using RT primers, followed by real-time amplification of cDNA.
2.6.1 RNA extraction from mycobacterial cells
RNA extraction was carried out using the Nucleospin RNA purification Kit (Macherey-
Nagel) as per manufacturer’s instructions. Cells were grown in Middlebrook 7H9 media
containing the appropriate antibiotics to an OD600nm of 0.3. The cells were harvested at
3 900 × g for 10 min at 4 ºC. Pellets were resuspended in 350 µl lysis buffer and 3.5 µl β-
mercaptoethanol was added to the sample. The suspension was transferred to lysis matrix
B tubes (IEPSA) and ribolysed 3 times using the FastPrep Savant FP-120 Ribolyser for
45 s (Speed = 6) and placing the tubes on ice for 2 min between each ribolysis. Lysates
were transferred to violet ring containing lipid filters, supplied by the manufacturer and
centrifuged at 11 000 × g for 30 s. Thereafter, 350 µl of 70 % ethanol was added to the
flow-through and the solution was transferred to nucleic acid binding blue ring containing
columns, centrifuged at 11 000 × g for 30 s and the flow-through was discarded. A 350 µl
aliquot of Membrane desalting buffer (MBD) was added to the column, which was
centrifuged at 11 000 × g for 30 s and the flow-though was discarded. A 100 µl aliquot of
DNAse reaction mixture containing 10 µl of reconstituted rDNAse (reconstituted as per
manufacturer’s instruction) to 90 µl of Reaction buffer for rDNAse was added to the
column followed by incubation at room temperature for 30 min. Thereafter the column was

41
washed by aliquoting 200 µl of Buffer RA2 into the membrane and centrifuging for 30 s at
11 000 × g. A second and third wash was conducted using 600 µl Buffer RA3 at
11 000 × g for 30 s, followed by 250 µl Buffer RA3 at 11 000 × g for 2 min. Following the
third wash, the column was placed in a fresh Eppendorf tube, 60 µl of RNAse free water
was aliquoted onto the membrane, incubated at room temperature for 10 min and RNA
eluted by centrifugation at 11 000 × g for 1 min. RNA was then quantified using the
NanoDrop.
2.6.2 Reverse Transcriptase PCR (RT-PCR)
RT-PCR was carried out using the Superscript III reverse transcriptase [RT] (Invitrogen).
A 25 µl reaction was set up containing 1 µg of DNA free RNA and 0.2 mM reverse primer
mix consisting of the sigA mRNA conversion primer and the ami2 mRNA conversion
primer. The sigA gene is a housekeeping gene, which is expressed at a consistent level
throughout different growth phases and is used for normalization to standardize for
differential RNA amounts isolated or used in the analysis. Primers were annealed to RNA
by incubation at 94 ºC for 90 s, 65 ºC for 3 min and 57 ºC for 3 min followed by incubation
on ice. The nucleic acid mix was split into two 12.5 µl aliquots, one for the RT reaction
and another to serve as an RT free reaction control to confirm the absence of any
contamination/residual DNA in these samples. To the RT conversion sample, the following
was added: 5 µl 5 × first strand buffer, 4 µl 25 mM MgCl2, 2 µl 0.1 mM Dithiotreitol, 1 µl
10 mM dNTP and 0.5 µl Superscript III reverse transcriptase (SSIII). The RT free control
contained the same components, however the SSIII was substituted by sterile nuclease free
water. These reactions were incubated at 50 ºC for 50 min followed by heat inactivation of
the enzyme at 85 ºC for 5 min. The cDNA was then used for qPCR.
42
2.6.3 Quantitative real-time PCR (qPCR) amplification
qPCR amplification was conducted using the Biorad SsoFast Evergreen Supermix (Bio-
Rad Laboratories). In this case, 20 µl reactions containing 10 µl supermix, 0.25 mM qPCR
forward primer and the qPCR reverse primer, 2 µl template cDNA and sterile distilled
nuclease free water were set up and incubated in the CFX96 Real-Time PCR detection
system (Bio-Rad Laboratories) using the following parameters: enzyme activation step of
95 ºC for 30 s, followed by a ten cycle touchdown stage consisting of 3 steps; denaturation
at 95 ºC for 10 s, annealing beginning at 65 ºC for 10 s and gradually decreasing by 0.5 ºC
after each cycle, elongation at 72 ºC for 10 s followed by SYBR Green quantification at the
end of each cycle. The touchdown was followed by a 35 cycle stage consisting of a 95 ºC
denaturation step for 10 s, a 60 ºC annealing step for 10 s and a 72 ºC elongation step for
10 s followed by SYBR Green quantification at the end of each cycle. Melt curve analysis
was conducted beginning at a temperature of 50 ºC then gradually increasing by 0.5 ºC
every 0.05 s to 95 °C, SYBR Green quantification was conducted continuously throughout
this stage. Raw data was then processed using the Biorad CFX Manager 2.1 software (Bio-
Rad Laboratories).
2.7 Analysis of bacteria growth
2.7.1 Growth rate analysis
Growth rates of wild type and mutant strains were determined by conducting growth curve
experiments. For this, a pre-culture was set up by inoculating either 1 ml of frozen culture
or a single colony into 15 ml 7H9 containing appropriate antibiotics and incubated
overnight at 37 ºC shaking at 100 rpm. The preculture was then diluted to a final OD600nm

43
of 0.05 in 25 ml 7H9 containing appropriate antibiotic, when necessary, and incubated at
37 ºC with shaking at 100 rpm. Growth was determined by recording OD600nm
measurements at 3 hour intervals and data was displayed as a scatter plot.
2.7.2 Analysis of mycobacterial biofilm formation
Biofilm analysis was carried out using the protocol described by Ojha et al. (2008).
Briefly, cells were grown to stationary phase (OD600nm > 2). These cells were then washed
in Sauton’s media twice. The OD600nm was recorded and adjusted to 2, then a ten-fold serial
dilution of the adjusted cultures was conducted ranging from 100 to 10
5 and 100 µl of each
dilution was inoculated into 10 ml Sauton’s media. This was done to determine whether
variation in the starting inoculum may result in a more dramatic phenotypic difference
since the initial bacterial population size would be reduced with each dilution. The plates
were incubated at 37 ºC for five days and images were taken; high magnification images
were also taken using the Stemi 2000-C stereomicroscope (Zeiss). Biofilm formation in
this case was defined as the formation of a pellicle on the surface of the liquid media. The
CFUs were calculated by plating the serial dilutions on 7H10 solid media to determine the
number of bacteria used in each experiment.
2.7.3 Analysis of mycobacterial sliding motility
Sliding motility assays were carried out using the protocol described by Martinez et al.
(1999). Briefly, strains were streaked on 7H10 containing appropriate antibiotics and
incubated at 37 ºC until single colonies could be observed. A colony was then taken and
spotted on 7H9 plates (7H9 media containing 0.3 % agar with 0.5 % glycerol as carbon
source) and M63 minimal media (100 mM KH2PO4, 15 mM (NH4)2 SO4, 1.7 µM
FeSO4.7H2O, containing 0.3 % agar with 0.5 % glycerol as a carbon source) pH to 7.0 with

44
KOH. The plates were sealed with parafilm and incubated at 37 °C for two weeks and
images were taken using the G-Box SYNGENE system
2.7.4 Bacterial spotting assay
Spotting assays were conducted to observe the morphologies of bacterial strains when
grown on solid media. Cultures were grown in 7H9 containing appropriate antibiotics to an
OD600nm of 0.8. A ten-fold serial dilution series from 100– 10
6 was made and 10 µl of each
dilution was spotted on 7H10 media containing appropriate antibiotic and incubated at
37 ºC.
2.8 Microscopic analysis
2.8.1 Confocal microscopy
Cells were grown in 10 ml 7H9 containing appropriate antibiotics to an OD600nm equal 0.8
followed by harvesting and washing twice in PBS. Cells were then resuspended in 1 ml of
7H9 containing appropriate antibiotics. Thereafter, 0.2 µl of 5 mg/ml vancomycin and 1 µl
of 1 mg/ml BODIPY-fluorescent vancomycin (Invitrogen) was added to the culture
followed by incubation at 37 ºC for 1.5 hours. Following this, 2 µl of 5 mg/ml 4',6-
diamidino-2-phenylindole (DAPI) (Sigma-Aldrich) and 1 µl of 500 ηg/µl Cellmask™
Orange (Invitrogen) was added to the culture and incubated at 37 °C for 20 min. Following
incubation, the cells were washed twice in 7H9 and resuspended in 50 µl 7H9. 5 µl was
then spread on a coverslip and allowed to dry. A drop of fluoramount (Sigma) was
deposited on a slide and the cover slip was placed on the fluoramount and allowed to dry.
The slides were then viewed on the Zeiss LSM-780 Confocal microscope and images
processed with ZEN black Ver. 7.0 software (Zeiss).
45
2.8.2 Scanning electron microscopy (SEM)
For cell preparation, 50 ml cultures were grown in 7H9 containing appropriate antibiotic to
an OD600nm of 0.8. The cells were harvested by centrifugation, washed twice with PBS and
resuspended in 2.5 % gluteraldehyde in PBS overnight at 4 °C. The cells were then washed
twice with PBS and resuspended in 100 µl 2 % osmium tetraoxide in PBS and incubated at
room temperature for 1 hour. Cells were then washed twice with PBS and dehydrated by
submerging in a series of ethanol concentrations for 2 min at each concentration beginning
with 30 % then 50 %, 70 % and twice at 100 % ethanol followed by storage in 100 %
ethanol. Cells were spotted on a filter, coated twice with carbon and viewed using the FEI
Nova NenoSEM 230.
2.8.3 Transmission electron microscopy (TEM)
A 50 ml culture was grown in 7H9 containing appropriate antibiotic to an OD600nm equal
0.8. The cells were harvested by centrifugation and washed twice in 1 ml PBS. Cells were
resuspended in fixing solution containing 0.1 mM HEPES, 2 % (v/v) formaldehyde, 2.5 %
(v/v) gluteraldehyde and 0.05 % (w/v) ruthenuim red and incubated at room temperature
for 1 hour. The cells were then harvested and resuspended in 100 µl of 2 % osmium
tetraoxide in PBS and incubated at room temperature for one hour. The samples were then
washed twice in PBS and dehydrated by submerging in a series of ethanol concentrations
for two min at each concentration beginning with 30 % then 50 %, 70 % and twice at
100 % ethanol. The dehydrated samples were then washed in propylene oxide twice and
incubated for one hour in a solution made up of 50 % propylene oxide and 50 % resin
mixture, which consists of 5.62 g araldite, 7.75 g epon 812 and 15 g DDSA. The propylene
oxide resin mixture was then removed and the cells were resuspended in 100 % resin
mixture and incubated at room temperature overnight. Cells were pelleted, the resin

46
mixture was removed and fresh resin mixture containing DMP 30 at a ratio of 1:40 (g: g)
of DMP 30 to resin mixture was added to the cells and these were incubated at 60 °C for
48 hours. The solidified resin was sectioned using a Relchert Ultracut Ultramucrotome
(Circa) and viewed using a Tecnai F20 TEM.
2.8.4 Atomic force microscopy (AFM)
AFM was conducted to analyze the surface structure of individual cells. For cell
preparation, 50 ml cultures were grown in 7H9 containing appropriate antibiotic to an
OD600nm of 0.8. These were then spread on a slide, allowed to dry and viewed using the
Veeco 2000 AFM (Zeiss).
2.9 Bio-informatic analysis
Bioinformatic analysis was carried out using a number of online tools and databases.
E. coli DNA and protein sequences were downloaded from the Biocyc E. coli database
(http://www.biocyc.com/ecocyc/index.shtml). Msm DNA and protein sequences were
downloaded from the Ecole Polytechnique Fédérale de Lausanne Smegmalist database
(http://mycobrowser.epfl.ch/smegmalist.html) and Mtb DNA and protein sequences were
downloaded from the Ecole Polytechnique Fédérale de Lausanne Tuberculist database
(http://tuberculist.epfl.ch/). Protein and DNA sequence BLAST searches were conducted
using the NCBI Blast tool (http://blast.ncbi.nlm.nih.gov/Blast.cgi), Protein domain
determination was conducted using the Sanger institute pfam tool (http://pfam.sanger.ac.uk/),
determination of signal peptides was conducted using the SignalP version 4.1 online tool
(http://www.cbs.dtu.dk/services/SignalP/ ) and protein alignment was conducted using the
EMBL-EBI clustalW tool (http://www.ebi.ac.uk/Tools/msa/clustalw2/) .
47
2.10 Construction of knock out strains
The gene deletion system used in this study was a two-step allelic exchange system, which
involves the substitution of the wild type gene with a truncated/deleted, non-functional
version of the gene, a process driven by homologues recombination, Figure 2.1 (Gordhan
and Parish, 2001). This system takes advantage of the cell’s homologues recombination
machinery. It involves the amplification of the regions directly upstream and downstream
of the gene of interest with a small portion of the 5’ and 3’ ends of the target gene. The
gene fragments are then fused together to create a truncated, non-functional form of the
gene of interest. This deletion allele is inserted into a suicide plasmid, which contains
resistance markers to allow for selection of single-cross over recombinants. This plasmid is
then inserted into wild type cells and grown in presence of antibiotic, since it cannot
replicate and is required for cell survival in the presence of antibiotic (the antibiotic
resistance gene is encoded on the plasmid); the construct is incorporated into the genome
by homologous recombination with either the upstream or downstream region giving rise
to a single-crossover (SCO) strain, Figure 2.1. This results in the presence of both the wild
type and deletion alleles; hence a recombination event in the adjacent region has to occur
for the allelic exchange. The second homologous recombination event is induced by using
a counter selectable marker on the plasmid, the sacB gene, which encodes an enzyme
called Levane Sucrase that converts sucrose to a toxic metabolite, resulting in the death of
bacterial cells (Reyrat et al., 1998). Hence, by plating the SCO strain onto sucrose
containing media, the second cross is facilitated and the vector is expunged, to prevent the
lethality encoded by the sacB gene. The second crossover can occur in the same
homologous region as the first crossover, resulting in the regeneration of the wild type
strain, or it can occur in the opposite homologous region, resulting in the production of a
mutant strain, Figure 2.1.

48
Figure 2.1: Diagrammatic representation of the allelic exchange process. Shown is the initial SCO
event and the subsequent sucrose-induced second cross over resulting in the formation of either a
wild type or mutant strain.
2.10.1 Construction of ami1 and ami2 knockout vectors
2.10.1.1 PCR reactions
Primers were designed using the Primer3 software to amplify the upstream and
downstream regions of homology for ami1 and ami2 genes (Table 2.4). The ami1 primers
Or
Wild type allele
Mutant allele
Plasmid
Chromosome
sacB
Upstream
region
Downstream
region
Mutant
allele
Wild type allele
Or
Upstream single
crossover
Downstream
single crossover
Sucrose counter
selection
Kanamycin
Hygromycin
lacZ
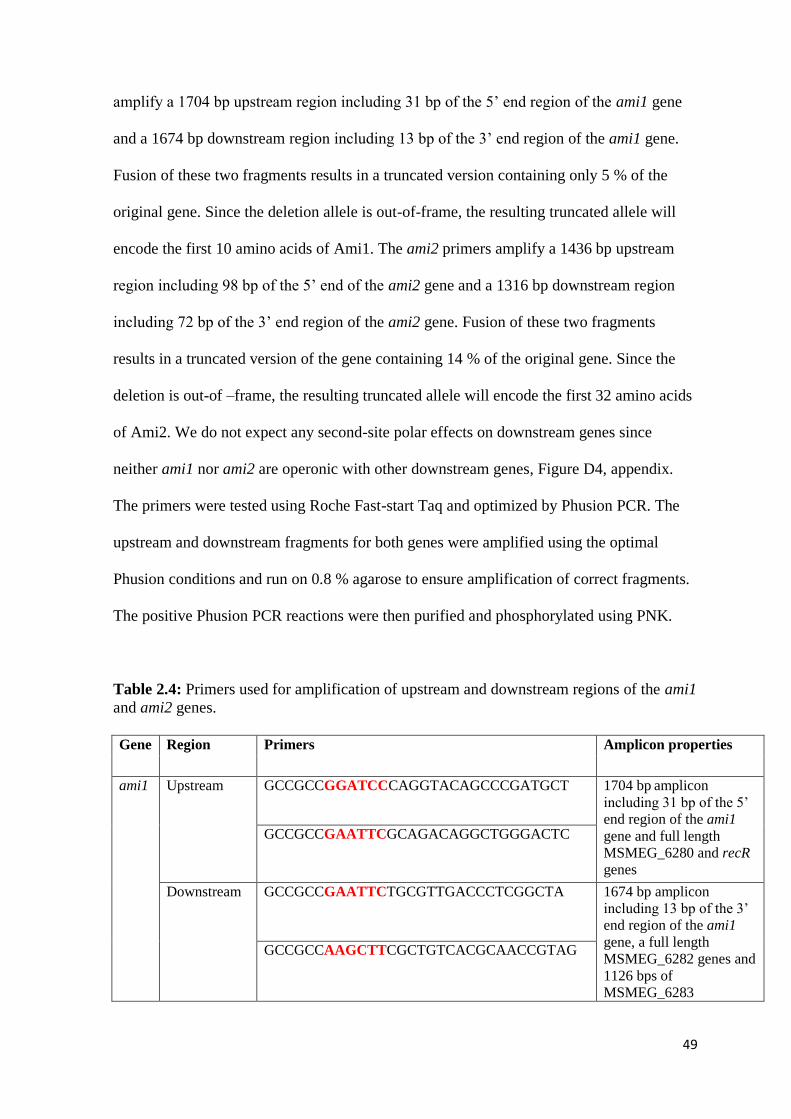
49
amplify a 1704 bp upstream region including 31 bp of the 5’ end region of the ami1 gene
and a 1674 bp downstream region including 13 bp of the 3’ end region of the ami1 gene.
Fusion of these two fragments results in a truncated version containing only 5 % of the
original gene. Since the deletion allele is out-of-frame, the resulting truncated allele will
encode the first 10 amino acids of Ami1. The ami2 primers amplify a 1436 bp upstream
region including 98 bp of the 5’ end of the ami2 gene and a 1316 bp downstream region
including 72 bp of the 3’ end region of the ami2 gene. Fusion of these two fragments
results in a truncated version of the gene containing 14 % of the original gene. Since the
deletion is out-of –frame, the resulting truncated allele will encode the first 32 amino acids
of Ami2. We do not expect any second-site polar effects on downstream genes since
neither ami1 nor ami2 are operonic with other downstream genes, Figure D4, appendix.
The primers were tested using Roche Fast-start Taq and optimized by Phusion PCR. The
upstream and downstream fragments for both genes were amplified using the optimal
Phusion conditions and run on 0.8 % agarose to ensure amplification of correct fragments.
The positive Phusion PCR reactions were then purified and phosphorylated using PNK.
Table 2.4: Primers used for amplification of upstream and downstream regions of the ami1
and ami2 genes.
Gene Region Primers Amplicon properties
ami1 Upstream GCCGCCGGATCCCAGGTACAGCCCGATGCT 1704 bp amplicon
including 31 bp of the 5’
end region of the ami1
gene and full length
MSMEG_6280 and recR
genes
GCCGCCGAATTCGCAGACAGGCTGGGACTC
Downstream GCCGCCGAATTCTGCGTTGACCCTCGGCTA 1674 bp amplicon
including 13 bp of the 3’
end region of the ami1
gene, a full length
MSMEG_6282 genes and
1126 bps of
MSMEG_6283
GCCGCCAAGCTTCGCTGTCACGCAACCGTAG

50
ami2 Upstream GCGCGCGGATCCGTGTTCGAGGGCACACAGTT 1436 bp amplicon
including 98 bp of the 5’
end region of the ami2
gene and full length txr
and txrB genes
GCGCGCGAATTCAGGTCAGTGTCGGGGTTCT
Downstream GCGCGCGAATTCACAGGCACTTTCACGTTCG 1316 bp amplicon
including 72 bp of the 3’
end region of the ami2
gene, a full length
MSMEG_6936 gene and
187 bps of
MSMEG_6938
GCGCGCCATATGGAACCGTGAAGGCAAGACC
Bold: Restriction sites included to facilitate fusion of the upstream and downstream regions during
cloning
2.10.1.2 Cloning.
The various cloning steps are shown in Figure 2.2.
2.10.1.2.1 pGEM cloning
The vector pGEM3Z(+)f was digested at the SmaI site located within the lacZ gene and
dephosphorylated using AAP. Digested DNA was run on 0.8 % agarose and linear vector
was excised from the gel and purified. Upstream and downstream regions were ligated
separately to this vector, transformed into DH5α cells and plated on LA containing Amp
and 0.004 % X-gal followed by incubation at 37 ºC overnight. Following incubation, white
colonies for upstream and downstream clonings were selected, the plasmid DNA
minipreped and screened by restriction digest using the following enzyme sets: (I)BamHI
and EcoRI for the upstream region of ami1 and ami2 (II) EcoRI and HindIII for the
downstream region of ami1 (III) and EcoRI and PstI for the downstream region of ami2.
These restriction digests resulted in the liberation of the cloned PCR products. A single
positive clone per fragment was selected, grown up in 100 ml LB and bulk plasmid
preparations were carried out on these clones. These were then digested with the same
enzymes used for screening, run on agarose and the liberated insert was excised from the
gel and purified.
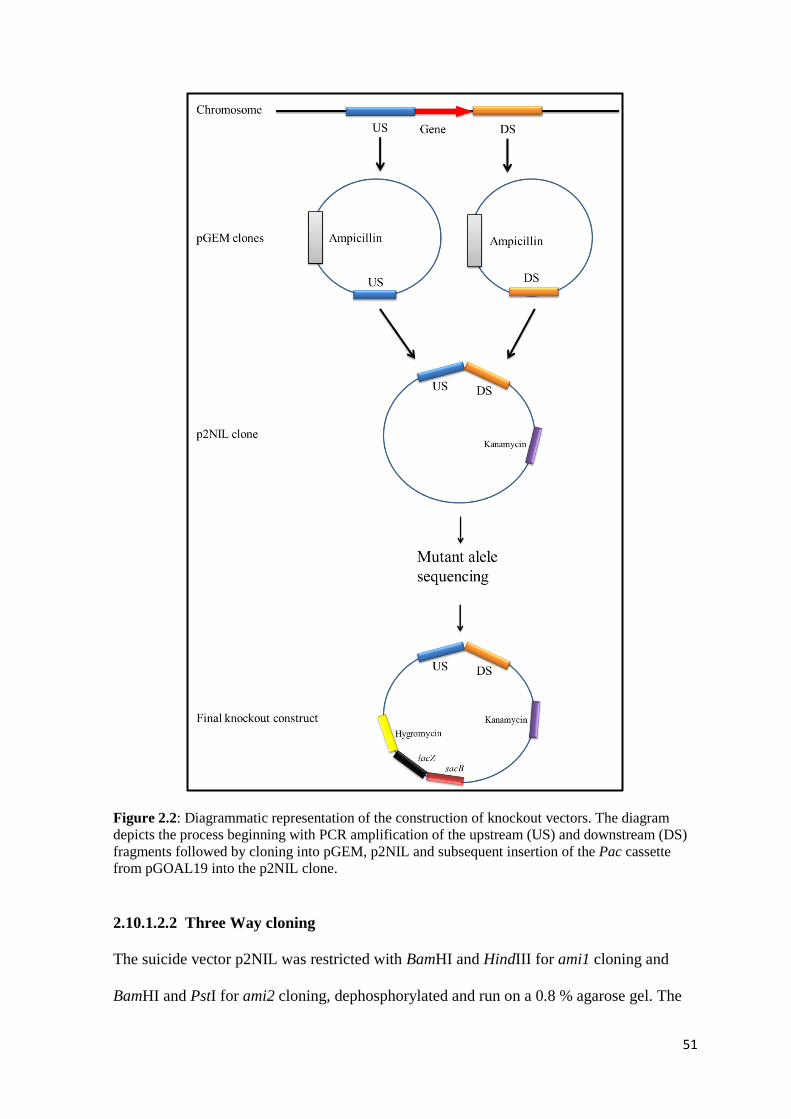
51
Figure 2.2: Diagrammatic representation of the construction of knockout vectors. The diagram
depicts the process beginning with PCR amplification of the upstream (US) and downstream (DS)
fragments followed by cloning into pGEM, p2NIL and subsequent insertion of the Pac cassette
from pGOAL19 into the p2NIL clone.
2.10.1.2.2 Three Way cloning
The suicide vector p2NIL was restricted with BamHI and HindIII for ami1 cloning and
BamHI and PstI for ami2 cloning, dephosphorylated and run on a 0.8 % agarose gel. The

52
linearized vector was excised from the gel and purified. The vector, upstream and
downstream fragments were run on agarose gel to ensure that the fragments were still
intact after purification and present in sufficient quantity for ligation. The upstream and
downstream fragments were simultaneously ligated to the p2NIL vector in 3 way ligations
using ratios of 1:1:1, 1:3:3 and 1:5:5 vector: upstream region: downstream region. These
ligations were transformed into DH5α cells, plated on LA containing Kan and incubated at
30 ºC for 2 days. Colonies were then selected, the plasmid was extracted and screened for
insertion by restriction digest. A single positive clone for each construct (named
p2NILAmi1 and p2NILAmi2) was inoculated in 200 ml LB containing Kan and incubated
at 30 °C overnight. Bulk plasmid extraction was conducted followed by extensive
restriction profiling of the resulting plasmid constructs, using a range of restriction
enzymes.
2.10.1.2.3 Pac cassette cloning
The plasmids pGOAL19, p2NILAmi1 and the p2NILAmi2 were digested with PacI and
the linearized vectors, along with the 7939 bp pGOAL19 PacI cassette (containing the
hygromycin resistance marker, lacZ and sacB genes), were excised from the gel and
purified. The PacI cassette was then ligated to the linearized p2NILAmi1 and p2NILAmi2
fragments followed by transformation into DH5α cells and plating on LA containing Kan,
Hyg and 0.004 % X-gal to select for clones, which contain the kanamycin resistant marker
from the p2NILAmi1 / p2NILAmi2 constructs as well as the hygromycin resistance marker
and functional lacZ gene acquired from the PacI cassette, Figure 2.2. Successful ligation
between the PacI cassette and p2NIL constructs was determined by the presence of blue
colonies on selection plates. These transformations were incubated at 30 ºC for 2 days.
Clones were selected, the plasmid was minipreped and screened by restriction digest with

53
BamHI. A single positive clone was selected for each cloning (named p2ΔAmi1 G19 and
p2ΔAmi2G19), bulk plasmid preparation was then conducted and the constructs were
profiled by restriction digest with a range of enzymes to confirm the integrity of the
constructs.
2.10.1.3 Testing for acquired sucrose sensitivity
As mentioned above, sacB encodes the enzyme Levane Sucrase, which degrades sucrose
producing a toxic element that kills the cells, which retain the gene. The function of this
enzyme is a key component in the induction of the second cross over to produce mutant
strains, Figure 2.1. Thus, the activity of the sacB gene product, and ultimate sucrose
sensitivity of bacteria carrying the knockout vector, is a critical component that requires
validation before continuing with the gene knockout methodology. A spotting assay on LA
containing Kan, Hyg and 0.004 % X-gal and LA containing 5 % sucrose and 0.004 % X-
gal was conducted to test sucrose sensitivity in E. coli; the activity of Levane Sucrase
would result in growth inhibition of the strain on media containing sucrose with no impact
in viability on plates without sucrose.
2.10.1.4 Two-step homologues recombination
The p2ΔAmi1G19 and p2ΔAmi2G19 vectors were electroporated into mc2155 cells using
1, 3 and 5 µg of DNA and plated on 7H10 containing Kan, Hyg and 0.004 % X-gal. The
transformation efficiency of the electro-competent cells was determined by electroporating
1 µg of the pOLYG replicating vector and plating a serial dilution of the transformation on
7H10 supplemented with Hyg. The desired efficiency for the electroporation of mc2155
cells is usually 104 CFU/µg of plasmid DNA. After electroporation, cells were plated onto
solid media and incubated at 37 ºC until blue colonies emerged (SCO). A Single blue
colony per construct was then cultured in 7H9 supplemented with Kan and Hyg at 37 ºC

54
then sub-cultured in 7H9 containing Kan and Hyg. The resulting cells were subjected to
sucrose counter selection by plating 100 µl of a 10-fold serial dilution series onto media
containing sucrose and X-gal. The plates were incubated for 3 - 5 days until blue and white
colonies emerged. White colonies represent strains, which have undergone the second
cross over event to yield either wild type again or a mutant strains and blue colonies
represent and strains, which have incurred a mutation in the sacB to render them resistant
to the toxic effects of sucrose.
2.10.1.5 PCR Screening
White colonies were selected and screened using a PCR method, which takes advantage of
the deleted region in the truncated version of the gene. The SCO strains were also included
in the PCR screen to allow differentiation between mutant strain and a SCO strain. Three
primers per gene were designed, a forward primer, which binds upstream of the
transcriptional start site of the target genes and two reverse primers, one, which binds
downstream of the stop codon and a second, which binds within the deleted region and
hence will not have a binding site in the mutant strain resulting in the amplification a
fragment, which is different from the wild type fragment, Figure 2.3. The primers used are
listed on Table 2.5. The PCR was run using an annealing temperature of 60 ºC and run on
2 % agarose and view using the G-Box.
2.11 Complementation of Msm Δami1 strain
Genetic complementation of mutant strains is important to confirm that any phenotypic
variations observed with the mutant strain is due to loss of a particular gene and not due to
second-site polar effects. In this study, the complementation technique involved the use

55
Figure 2.3: Schematic representation of the PCR screen for deletion mutants. Both reverse
primers are included in the PCR reaction, resulting in amplification from the first reverse
primer in strains containing the wild type allele and amplification from the second reverse
primer product in strains containing the mutant allele as the binding site for the first primer
is deleted. (A) represents the ami1 PCR screen profiles showing both wild type and mutant
alleles and (B) represents the ami2 PCR screen profiles showing both wild type and mutant
alleles.
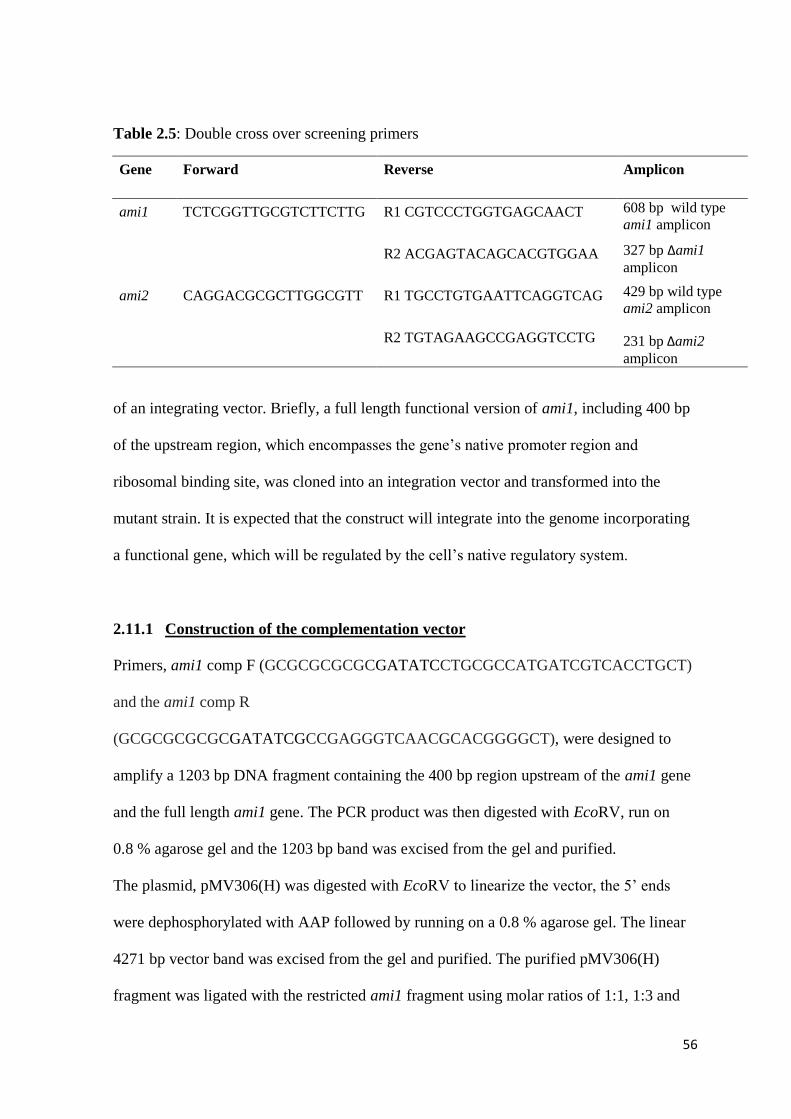
56
Table 2.5: Double cross over screening primers
Gene Forward Reverse Amplicon
ami1 TCTCGGTTGCGTCTTCTTG R1 CGTCCCTGGTGAGCAACT 608 bp wild type
ami1 amplicon
R2 ACGAGTACAGCACGTGGAA 327 bp Δami1
amplicon
ami2 CAGGACGCGCTTGGCGTT R1 TGCCTGTGAATTCAGGTCAG 429 bp wild type
ami2 amplicon
R2 TGTAGAAGCCGAGGTCCTG 231 bp Δami2
amplicon
of an integrating vector. Briefly, a full length functional version of ami1, including 400 bp
of the upstream region, which encompasses the gene’s native promoter region and
ribosomal binding site, was cloned into an integration vector and transformed into the
mutant strain. It is expected that the construct will integrate into the genome incorporating
a functional gene, which will be regulated by the cell’s native regulatory system.
2.11.1 Construction of the complementation vector
Primers, ami1 comp F (GCGCGCGCGCGATATCCTGCGCCATGATCGTCACCTGCT)
and the ami1 comp R
(GCGCGCGCGCGATATCGCCGAGGGTCAACGCACGGGGCT), were designed to
amplify a 1203 bp DNA fragment containing the 400 bp region upstream of the ami1 gene
and the full length ami1 gene. The PCR product was then digested with EcoRV, run on
0.8 % agarose gel and the 1203 bp band was excised from the gel and purified.
The plasmid, pMV306(H) was digested with EcoRV to linearize the vector, the 5’ ends
were dephosphorylated with AAP followed by running on a 0.8 % agarose gel. The linear
4271 bp vector band was excised from the gel and purified. The purified pMV306(H)
fragment was ligated with the restricted ami1 fragment using molar ratios of 1:1, 1:3 and

57
1:5 plasmid to insert, transformed into DH5α cells, spread on LA supplemented with Hyg
and incubated at 37 °C overnight. Clones were then selected and screened by restriction
digest with BamHI, which would yield three bands 4507 bp, 711 bp and 262 bp (positive
orientation) or 3804 bp, 965 bp and 711 bp (negative orientation) depending on the
orientation of the insert in relation to the E. coli origin of replication (oriE) (data not
shown). The resulting plasmid was also sent for sequencing to confirm that the cloned
ami1 region contained no mutations as a result of the Phusion PCR or subsequent cloning
steps.
2.11.2 pMVAmi1 integration into Δami1 strain genomic DNA
The pMVAmi1 construct was electroporated into the Msm Δami1 strain. The
electroporations were carried out using 1, 3 and 5 µg of DNA and a 1 µg pSE100 control
was included to calculate the transformation efficiency of the electro-competent cells. The
desired efficiency for the electroporation of mc2155 cells and the derivatives thereof, in
this case, is usually 104 CFU/µg of plasmid DNA. The pMVAmi1 transformations were
plated on 7H10 supplemented with Hyg and incubated at 37 ºC for four days. Clones were
selected and genomic DNA was extracted by use of colony boil and these colonies were
screened for the presence of a full length ami1 gene by conducting a PCR utilizing the
primers used to amplify the ami1 complementation fragment, as crude method of checking
for plasmid retention and likely integration. The sizes expected were 1203 bp, which
indicates the presence of a full length gene and approximately 418 bp indicating the
truncated version of the gene. Genomic DNA from the Msm Δami1 strain was also
included as a negative control. The PCR products were run on 0.8 % agarose and
visualized to check whether any of the clones contained the full length gene (data not
shown).

58
A positive clone was selected and further PCR analyses were carried out to determine if
the complemented vector was integrated at the correct locus. The underlying principle of
this screen involved the use of 2 primers sets both consisting of a single primer, which bind
plasmid DNA flanking the integration (AP) site on the plasmid and the second binding
primer, which binds to genomic DNA flanking the tRNAGlycine
locus, thus integration at the
correct site will result in PCR amplification while incorrect integration will result in no
amplification, Figure 3.13 A.
2.12 Construction of ami2 knockdown strain
Targeted gene knockdown is usually used to study the function of essential genes, which
cannot be deleted in vitro. The knockdown system used in this study involves the
replacement of the native promoter of the gene in question with a tetracycline-regulated
operator that allows for the regulation of gene expression in the presence/absence of
anhydrotetracycline (ATC), outlined in Figure 2.4 (Ehrt et al., 2005). Briefly the
tetracycline operator is fused, by PCR and cloning, to the first 350 bp of the desired gene
in a non-replicating vector, which is inserted into an Msm strain that carries a plasmid,
integrated at the attB site of the bacterial chromosome, encoding the tetracycline repressor.
Insertion of the non-replicating vector carrying the ATC operator leads to a single cross
over event, at the locus of interest, which results in the incorporation of the ATC operator
upstream of the gene of interest, to allow for ATC regulation, and wild type promoter
drives the expression of a non-functional, truncated gene, Figure 2.5.
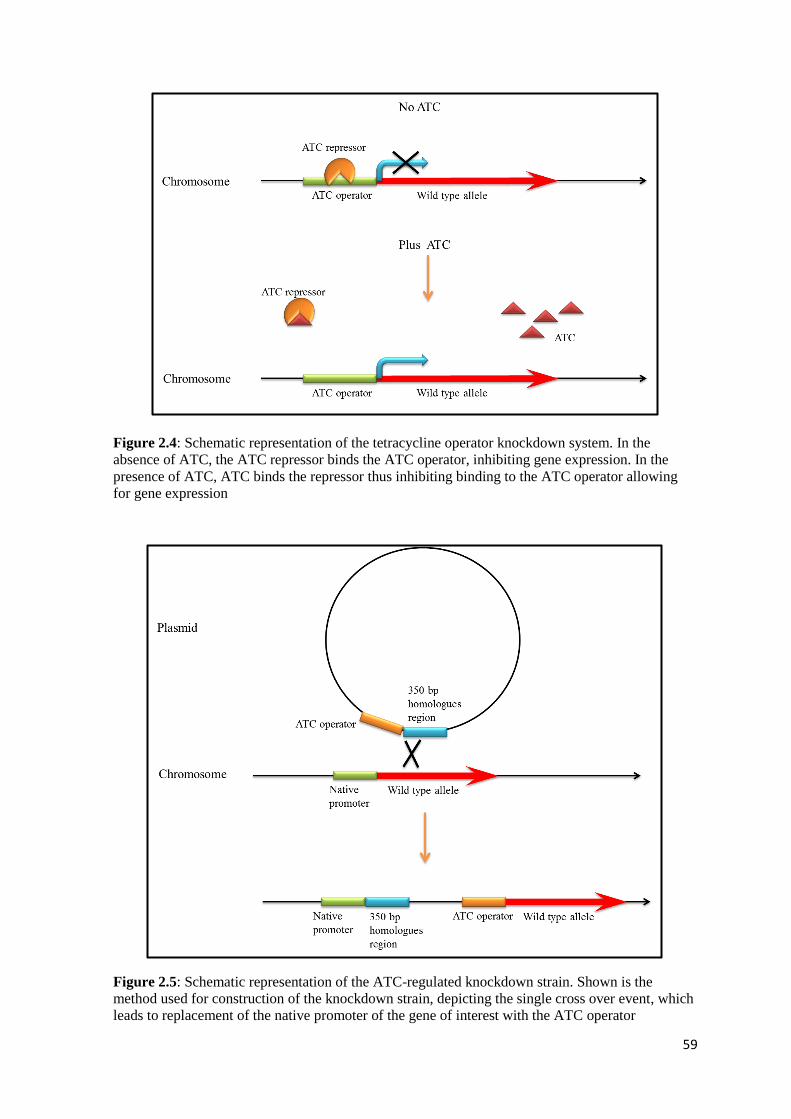
59
Figure 2.4: Schematic representation of the tetracycline operator knockdown system. In the
absence of ATC, the ATC repressor binds the ATC operator, inhibiting gene expression. In the
presence of ATC, ATC binds the repressor thus inhibiting binding to the ATC operator allowing
for gene expression
Figure 2.5: Schematic representation of the ATC-regulated knockdown strain. Shown is the
method used for construction of the knockdown strain, depicting the single cross over event, which
leads to replacement of the native promoter of the gene of interest with the ATC operator

60
2.12.1 Construction of ami2 knockdown vector
Primers, the PanC RBS forward primer
(CGCGCATGCCGTGGAGGTTTTGACGGCATGTCGAGTCTGCGTCGC) containing
the panC ribosomal binding site (underlined) and the reverse primer
(GCGCGCGGCCGCACCAGGCCGGTGTAGAAG), were designed to amplify the first
350 bp (386 bp) of the ami2 gene. The primers included restriction sites for cloning into
the desired vector and a panC ribosomal binding site (CGTGGAGGTTTTGACGGC). This
panC ribosomal binding site was chosen because it displayed efficient regulation of the
mycobacterial panC gene using the same knockdown system (Abrahams et al., 2012). This
fragment was cloned into pSE100, a vector used for ATC-regulation in mycobacteria (Ehrt
et al., 2005). Clones were selected and plasmid DNA screened by restriction digests with
NotI, which would result in the liberation of a 489 bp band. A single positive clone was
then selected for further analysis through more extensive restriction digest to confirm the
genomic integrity of the vector, which was then further confirmed by sequencing of the
cloned region.
2.13 Msm ami2KDP associated Phenotyping
2.13.1 Msm ami2KDP preculture preparation
Msm ami2KDP frozen culture stocks were streaked on 7H10 supplemented with Kan and
Hyg containing no ATC and incubated at 37 °C until single colonies emerged. A single
colony was then cultured in 10 ml 7H9 supplemented with Kan and Hyg without ATC and
grown until the culture began clumping. These stages of culturing were conducted to
remove any residual ATC remaining in the cell when the freezer stocks were made. The
cells were then harvested and washed twice in 7H9 and incubated in 1 ml of 7H9. The

61
OD600nm of the 1 ml culture was recorded and the culture was used to set up bulk cultures
for subsequent experiments.
2.13.2 Analysis of regulated gene expression
A pre-culture was set up as in section 2.13.1 and using this, three 25 ml 7H9 cultures
supplemented with Kan and Hyg were set up, these included: (I) No ATC added (II) Plus
0.05 ηg/ml ATC (III) Plus 50 ηg/ml ATC. These cultures were set up with a starting
OD600nm of 0.15 and incubated at 37 ºC. Samples were taken after 6 and 9 hours of growth
and gene expression analysis was conducted as in section 2.6 using primers listed in Table
2.6. A Student’s t-test was then conducted comparing the no ATC data to the samples
containing ATC to determine significant differences. This experiment was set up 3 times
using different freezer stocks.
Table 2.6: Primer used for expression analysis
Name Primers Region targeted
sigA Gene
qPCR Forward primer GGGCGTGATGTCCATCTCCT Produces a 122 bp
amplicon, which
corresponds to position 367
to 488 of the sigA gene
qPCR and mRNA
conversion primer
GTATCCCGGTGCATGGTC
ami2 Gene
qPCR Forward primer GCTGTACTTCCTCGGCTCAC Produces a 112 bp
amplicon, which
corresponds to position 435
to 564 of the ami2 gene
qPCR Reverse primer ATCGATGATGACCCGCTTAC
mRNA conversion primer AGGATGTCGGCCTCACTGAT Produces a 186 bp
amplicon, which
corresponds to position
435 to 638 of the ami2 gene

62
2.13.3 Msm ami2KDP growth kinetics
This analysis was conducted with growth curves, done in triplicate using different batches
of 7H9 media and different freezers stocks. A pre-culture was set up as in section 2.13.1.
Thereafter five 25 ml cultures (7H9, supplemented with Kan and Hyg) with starting
OD600nm of 0.025, containing the following ATC concentrations were set up: 0 ηg/ml,
0.001 ηg/ml, 0.05 ηg/ml, 1 ηg/ml and 50 ηg/ml ATC followed by incubation at 37 ºC.
Cultures of mc2155 containing no ATC and 50 ηg/ml ATC were included to evaluate the
inhibitory impact of ATC on Msm growth kinetics. The mc2155 culture containing no ATC
was also included to determine the optimal level of ATC required for ami2KDP growth
kinetics that are similar to mc2155. OD600nm readings were taken every 3 hours and the data
was represented using a scatter plot.

63
3. Results
3.1 Bioinformatics analyses and identification of putative amidase-encoding genes
in mycobacteria
Mycobacterial cell wall amidases have not been the subject of extensive study.
Consequently, the genetic annotation for this group of enzymes in mycobacterial genomes
is poor and subject to mis-annotation. The extensive repertoire of other amidase-encoding
genes (not associated with the PG) in mycobacteria further complicates this. To identify
PG-degrading amidases for subsequent analysis, extensive bioinformatic analyses were
conducted. As stated earlier in section 1.6, these enzymes can be classified into two main
groups namely the amidase_2 and amidase_3 domain – containing amidases. These
domains also define these enzymes as PG degrading amidases since they are only found in
PG associated enzymes with cell wall amidase activity (Vollmer et al., 2008, Shida et al.,
2001, Mesnagi and Fouet, 2002). To identify these enzymes in Mtb and Msm, the
amidase_2 and amidase_3 domains of the well-characterized E. coli enzymes were blasted
against these mycobacterial genomes using the NCBI protein blast tool. The enzymes
resulting from this search were further analyzed using the Sanger Pfam tool to identify the
domains contained within these enzymes and the SignalP tool was used to determine the
presence of signal peptides, which would indicate whether the enzyme is exported to the
cell wall, Figure D1 and D2, Appendix. The resulting hits were aligned with the E. coli
homologues using the EBI clustalW tool to determine the presence of conserved domains
between the enzymes in E. coli and mycobacteria, this resulted in the identification of three
PG amidase-encoding genes in Msm, MSMEG_6281, MSMEG_6406 and MSMEG_6935
and in Mtb namely, Rv3717, Rv3811 and Rv3915, Figure 3.1.
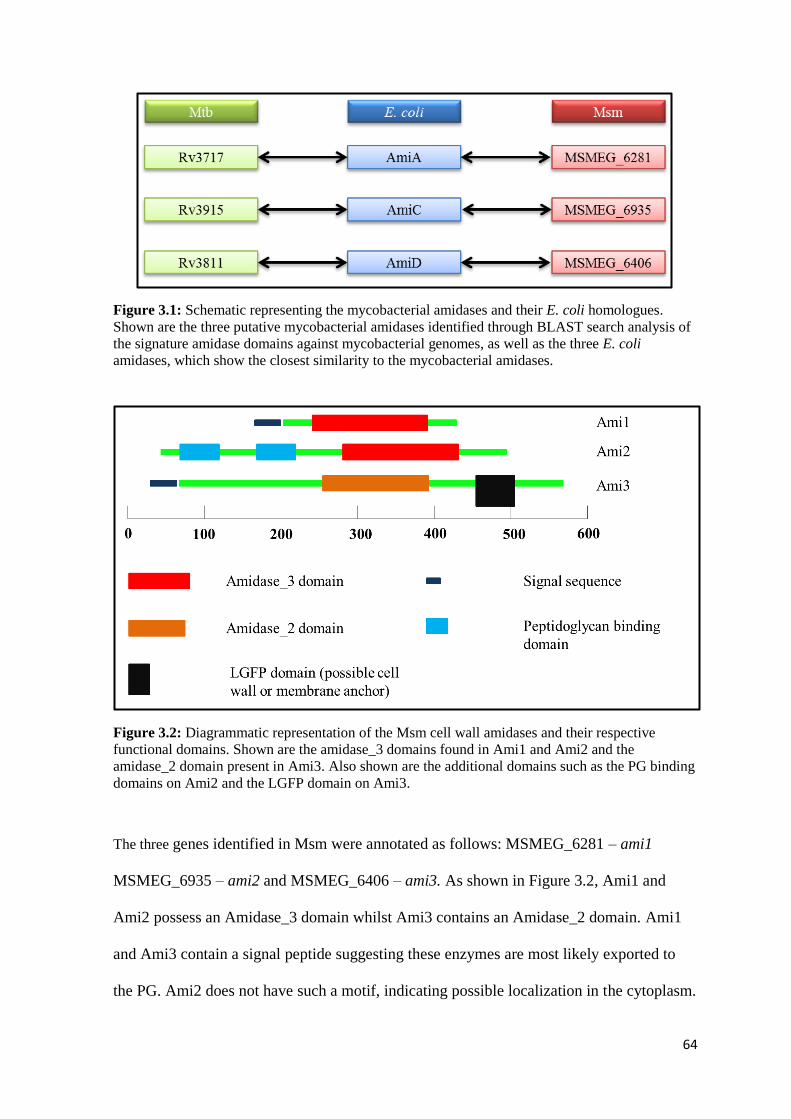
64
Figure 3.1: Schematic representing the mycobacterial amidases and their E. coli homologues.
Shown are the three putative mycobacterial amidases identified through BLAST search analysis of
the signature amidase domains against mycobacterial genomes, as well as the three E. coli
amidases, which show the closest similarity to the mycobacterial amidases.
Figure 3.2: Diagrammatic representation of the Msm cell wall amidases and their respective
functional domains. Shown are the amidase_3 domains found in Ami1 and Ami2 and the
amidase_2 domain present in Ami3. Also shown are the additional domains such as the PG binding
domains on Ami2 and the LGFP domain on Ami3.
The three genes identified in Msm were annotated as follows: MSMEG_6281 – ami1
MSMEG_6935 – ami2 and MSMEG_6406 – ami3. As shown in Figure 3.2, Ami1 and
Ami2 possess an Amidase_3 domain whilst Ami3 contains an Amidase_2 domain. Ami1
and Ami3 contain a signal peptide suggesting these enzymes are most likely exported to
the PG. Ami2 does not have such a motif, indicating possible localization in the cytoplasm.

65
Ami1 contains no PG binding domains suggesting it requires association with other
enzymes in order to interact with PG. Ami2 contains two PG binding domains confirming
that it retains the capacity to bind PG without the aid of additional enzymes. However, this
does not preclude the possibility that Ami2 is activated in a similar way to the E. coli
homologue [section 1.6.2 –(Yang et al., 2012)]. Ami3 contains a LGFP domain, the
function of which is currently unknown. This domain is found in proteins, which are
membrane associated, suggesting it might play a role in anchoring proteins to the cell
membrane (Brand et al., 2003). Ami3 also does not contain any PG binding domains,
which again could indicate association with other proteins for PG interaction.
The pFAM analyses was not only conducted on all three of the Msm and Mtb amidases but
also on all five of the E. coli homologues, Figure D1, appendix, to confirm that this
analysis reliably detected PG amidases and to further differentiate domains contained
within each amidase for comparison to those found in the mycobacterial homologues. The
three E. coli homologues, which displayed the closest similarity to the mycobacterial
amidases were AmiA, AmiC and AmiD. AmiA displayed high similarity to Ami1 as both
were shorter amidases containing only the amidase_3 domain and no additional domains.
From the five E. coli amidases, AmiC was highly similar to Ami2 since they both possess
an amidase_3 domain, AmiC however contains a second domain called the AMIN
(Amidase-N-terminal) domain, which is predicted to be involved in the localization of
AmiC to the septal ring, while Ami2 contains two putative PG binding domains
(PG_binding_1), which have been found to be associated with PG degrading enzymes
(Foster, 1991, Joris et al., 1982, Krogh et al., 1998). AmiD displayed high similarity to
Ami3, they both possess an amidase_2 domain. Ami3 also possesses a predicted membrane
anchoring domain, though the pFAM analyses suggested AmiD did not display the

66
presence of any membrane anchoring domains. It has been shown in E. coli that AmiD is a
membrane associated protein (Uehara and Park, 2007).
3.1.1 Conservation of catalytic residues within the Amidase 3 domain
To identify conserved catalytic residues, clustalW analysis was conducted using the
signature amidase domains from each gene. The crystal structure of the amidase_3 domain
has yet to be resolved however, sequence alignment of the amidase_3 domain-containing
amidases from a wide range of bacterial and viral organisms has identified the residues
essential for catalysis (Shida et al., 2001, Mesnagi and Fouet, 2002). These conserved
residues were then subjected to site directed mutagenesis to identify domains essential for
catalysis using the B. subtilis CwlC amidase as a template. Two essential residues, Glu21
and Glu138
, were identified as highly conserved and essential for catalytic activity (Shida et
al., 2001). A clustalW alignment was conducted using the Bacillus amidases domains
(Shida et al., 2001). The alignment of AmiA and AmiC domains from E. coli and the Ami1
and Ami2 domains of the Msm, Mtb and M. leprea homologues are shown in Figure 3.3.
Alignment of these proteins reveal that the Glu21
is conserved throughout the different
organisms depicted in Figure 3.3, however the second catalytic residue is only conserved
in the Ami1 homologues and not entirely conserved in the Ami2 homologues where, in
some cases, the Glu138
is replaced by Asp, which is slightly different with respect to
structure but possesses the same overall charge, Figure D3, Appendix, and could thus still
function as a catalytic residue (Berg et al., 2007).

67
Paenibacillus polymyxa cwlU VVIDPGHGGKDPGAGSVTGR--------------------HEKEFTLAVA 30
Paenibacillus polymyxa cwlV VVIDAGHGAKDSGAVGISRKN-------------------YEKTFNLAMA 31
Bacillus subtilis CwlC IFIDPGHGGSDPGATGNGLQ---------------------EKTLTLQIA 29
Bacillus licheniformis cwlM IFIDPGHGGSDTGASANGLQ---------------------EKQLTLQTA 29
Escherichia coli AmiC IMLDPGHGGEDSGAVGKYKT--------------------REKDVVLQIA 30
Escherichia coli AmiA VVLDPGHGGIDTGAIGRNGS--------------------KEKHVVLAIA 30
Escherichia coli AmiB IAIDAGHGGQDPGAIGPGGT--------------------REKNVTIAIA 30
Bacillussubtilis cwlB IFIDPGHGDQDSGAIG-NGL--------------------LEKEVNLDIA 29
M. smegmatis MC2155 Ami2
VIIDPGRGGSDHGLIMQGPHGP-----------------ISEADILWDLA 33
M. tuberculosis H37Rv Ami2 IIIDPGRGGVDHGLIAQGPAGP-----------------ISEADLLWDLA 33
Mycobacterium leprae TN Ami2 IIIDPGRGGADRGLITQGPTGP-----------------ISEADVLWDLA 33
Mycobacterium leprae TN Ami1 VFIDPGHNGSNDASISRQVPTGRGGTKDCQASGTSTNSGYPEHTFTWDTA 50
M. tuberculosis H37Rv Ami1 VFIDPGHNGANDASIGRQVPTGRGGTKNCQASGTSTNSGYPEHTFTWETG 50
M. smegmatis MC2 155 Ami1
VFLDPGHNGANDASIGRQVPTGRGGTKNCQESGTATDDGYPEHSFTWDTT 50
: :*.*:. : . * .
Paenibacillus polymyxa cwlU LKVQQLAQNDPD-IQIVLTRNGDTYP--TLDERPQLANNQQASVFVSIHG 77
Paenibacillus polymyxa cwlV LKVESILKQNPK-LEVVLTRSDDTFL--ELKQRVKVAENLKANVFVSIHA 78
Bacillus subtilis CwlC LALRTILTNEYEGVSLLLSRTSDQYV--SLNDRTNAANNWGADFFLSIHV 77
Bacillus licheniformis cwlM LALRNMLLNEYQNVSVLLSRTSDQTV--SLTQRTNAANSWGADYFLSIHM 77
Escherichia coli AmiC RRLRSLIEKEGN-MKVYMTRNEDIFI--PLQVRVAKAQKQRADLFVSIHA 77
Escherichia coli AmiA KNVRSILRNHG--IDARLTRSGDTFI--PLYDRVEIAHKHGADLFMSIHA 76
Escherichia coli AmiB RKLRTLLNDDPM-FKGVLTRDGDYFI--SVMGRSDVARKQNANFLVSIHA 77
Bacillussubtilis cwlB KRVNTKLNASG--ALPVLSRSNDTFY--SLQERVNKAASAQADLFLSIHA 75
M. smegmatis MC2155 Ami2
SRLEGRMTAIG--MDTVLSRPPNRSP--SDAERAQTANGVGADLMISLRC 79
M. tuberculosis H37Rv Ami2 SRLEGRMAAIG--METHLSRPTNRSP--SDAERAATANAVGADLMISLRC 79
Mycobacterium leprae TN Ami2 SRLEGRMAAIG--IETFLSRTTNGSP--SDSERAAIANNVGAELMISLRC 79
Mycobacterium leprae TN Ami1 LQVRAALDGLG--VRTALSRGDDTGLGPCVDARANMANALHPNASVSLHG 98
M. tuberculosis H37Rv Ami1 LRLRAALNALG--VRTALSRGNDNALGPCVDERANMANALRPNAIVSLHA 98
M. smegmatis MC2 155 Ami1
LRVRAALTALG--VRTAMSRGNDNALGPCVDERAAMANSLRPHAIVSIHA 98
:. ::* : * * . :*::
Paenibacillus polymyxa cwlU NSMPTSNNGKANGSETYYARQE---------------------------- 99
Paenibacillus polymyxa cwlV NSSGSS---ASNGTETYYQRSA---------------------------- 97
Bacillus subtilis CwlC NSGGGT------GFESYIYPDVGA-------------------------- 95
Bacillus licheniformis cwlM NAGGGT------GFEDYIYPGVGA-------------------------- 95
Escherichia coli AmiC DAFTSR---QPSGSSVFALSTKGATSTAAKYLAQTQN-ASDLIGGVS--- 120
Escherichia coli AmiA DGFTNP---KAAGASVFALSNRGASSAMAKYLSERENRADEVAGKKA--- 120
Escherichia coli AmiB DAAPNR---SATGASVWVLSNRRANSEMASWLEQHEK-QSELLGGAGDVL 123
Bacillussubtilis cwlB NANDSS---SPNGSETYYDTTYQA-------------------------- 96
M. smegmatis MC2155 Ami2
ATQPSP---AANGVASFYFGNSHG-------------------------- 100
M. tuberculosis H37Rv Ami2 ETQTSL---AANGVASFHFGNSHG-------------------------- 100
Mycobacterium leprae TN Ami2 ETQTSP---AANGVASFHFGNSHG-------------------------- 100
Mycobacterium leprae TN Ami1 DGGPAS----GRGFHVIYSAPPLN-------------------------- 118
M. tuberculosis H37Rv Ami1 DGGPAS----GRGFHVNYSAPPLN-------------------------- 118
M. smegmatis MC2 155 Ami1
DGGPPT----GRGFHVLYSSPPLN-------------------------- 118
*
Paenibacillus polymyxa cwlU ------------------------SLSLATIMHKHLVAATEFKDNGIK-- 123
Paenibacillus polymyxa cwlV ------------------------SKAFANVMHKYFAPATGLTDRGIR-- 121
Bacillus subtilis CwlC -----------------------PTTTYQSTIHSEVIQAVDFADRGKK-- 120
Bacillus licheniformis cwlM -----------------------PTTTYRDIMHEEILKVVDFRDRGKK-- 120
Escherichia coli AmiC --KSGDRYVDHTMFDMVQSLTIADSLKFGKAVLNKLGKINKLHKNQVE-- 166
Escherichia coli AmiA --TDKDHLLQQVLFDLVQTDTIKNSLTLGSHILKKIKPVHKLHSRNTE-- 166
Escherichia coli AmiB ANSQSDPYLSQAVLDLQFGHSQRVGYDVATSMISQLQRIGEIHKRRPE-- 171
Bacillussubtilis cwlB ----------------------ANSKRLAEQIQPKLAANLGTRDRGVK-- 122
M. smegmatis MC2155 Ami2
-------------------SVSTIGRNLADFIQREVVARTGLRDCRTH-- 129
M. tuberculosis H37Rv Ami2 -------------------SVSTIGRNLADFIQREVVARTGLRDCRVH-- 129
Mycobacterium leprae TN Ami2 -------------------SVSTIGRNLADFIQREIVARTGLRDCRTH-- 129
Mycobacterium leprae TN Ami1 ------------------PVQAGPSVQFARIMRDQLQASGIPPANYIGQS 150
M. tuberculosis H37Rv Ami1 ------------------AIQAGPSVQFARIMRDQLQASGIPKANYIGQD 150
M. smegmatis MC2 155 Ami1
------------------AAQSGPSVQFAKVMRDQLAASGIPPATYIGQG 150
: .

68
Figure 3.3: ClustalW analysis of amidase_3 domain containing amidases. Shown is the alignment
of amidase_3 domains from Bacillus, mycobacterial species and E. coli and the conserved catalytic
residues. Yellow highlight indicates conserved catalytic Glu21
and Glu138
residues.
3.1.2 Conservation of catalytic residues within the Amidase 2 domain
The crystal structure of AmiD has been resolved and in this case, the residue essential for
catalysis is Glu89
, residing within the AmiD amidase_2 domain (Kerff et al., 2010). To
further assess this in mycobacteria, the AmiD amidase domain was aligned with the Msm
and Mtb homologues, retaining the amidase – 2 domain, to determine whether this residue
is conserved, Figure 3.4. AmpD and amidase_2 containing amidases were included to
determine whether the catalytic residue is conserved throughout different organisms.
Paenibacillus polymyxa cwlU ----VANHVVTRKSQMPAVLLECGYLSNPSNEAAMFTEETQQKIAEGIVD 169
Paenibacillus polymyxa cwlV ----YGNFHVIRETTMPAVLLEVGYLSNAKEEATLFDEDFQNRVAQGIAD 167
Bacillus subtilis CwlC ----TANFHVLRESAMPALLTENGFIDTVSDANKLKTSSFIQSLARGHAN 166
Bacillus licheniformis cwlM ----TANFHVLRETAMPALLTENGFVDNTNDAEKLKSSAFIQSIARGHAN 166
Escherichia coli AmiC ----QAGFAVLKAPDIPSILVETAFISNVEEERKLKTATFQQEVAESILA 212
Escherichia coli AmiA ----QAAFVVLKSPSVPSVLVETSFITNPEEERLLGTAAFRQKIATAIAE 212
Escherichia coli AmiB ----HASLGVLRSPDIPSVLVETGFISNNSEERLLASDDYQQQLAEAIYK 217
Bacillussubtilis cwlB ----TAAFYVIKYSKMPSVLVETAFITNASDASKLKQAVYKDKAAQAIHD 168
M. smegmatis MC2155 Ami2
----GRTWDLLRLTRMPTVQVDIGYITNPGDRGLLVSPQTRDAIAEGVLA 175
M. tuberculosis H37Rv Ami2 ----GRTWDLLRLTRMPTVQVDIGYITNPHDRGMLVSTQTRDAIAEGILA 175
Mycobacterium leprae TN Ami2 ----GRTWDLLRLTRMPTVQIDIGYITNPRDRGVLIGTQNRDAIAEGILA 175
Mycobacterium leprae TN Ami1 GLCGRSDLAGLNLAQYSSILIELGNMKNPADSALMESSEGRKKYADAVVR 200
M. tuberculosis H37Rv Ami1 GLYGRSDLAGLNLAQYPSILVELGNMKNPADSALMESAEGRQKYANALVR 200
M. smegmatis MC2 155 Ami1
GLNPRSDIAGLNLAQFPSVLVECGNMKNPVDSALMKSPEGRQKYADAIVR 200
. . .:: : . : . : : . * .
Paenibacillus polymyxa cwlU GLK 172
Paenibacillus polymyxa cwlV GIT 170
Bacillus subtilis CwlC GLE 169
Bacillus licheniformis cwlM GLA 169
Escherichia coli AmiC GIK 215
Escherichia coli AmiA GVI 215
Escherichia coli AmiB GLR 220
Bacillussubtilis cwlB GT- 170
M. smegmatis MC2155 Ami2
AVK 178
M. tuberculosis H37Rv Ami2 AVK 178
Mycobacterium leprae TN Ami2 AVK 178
Mycobacterium leprae TN Ami1 GVE 203
M. tuberculosis H37Rv Ami1 GVA 203
M. smegmatis MC2155 Ami1
GIA 203
.
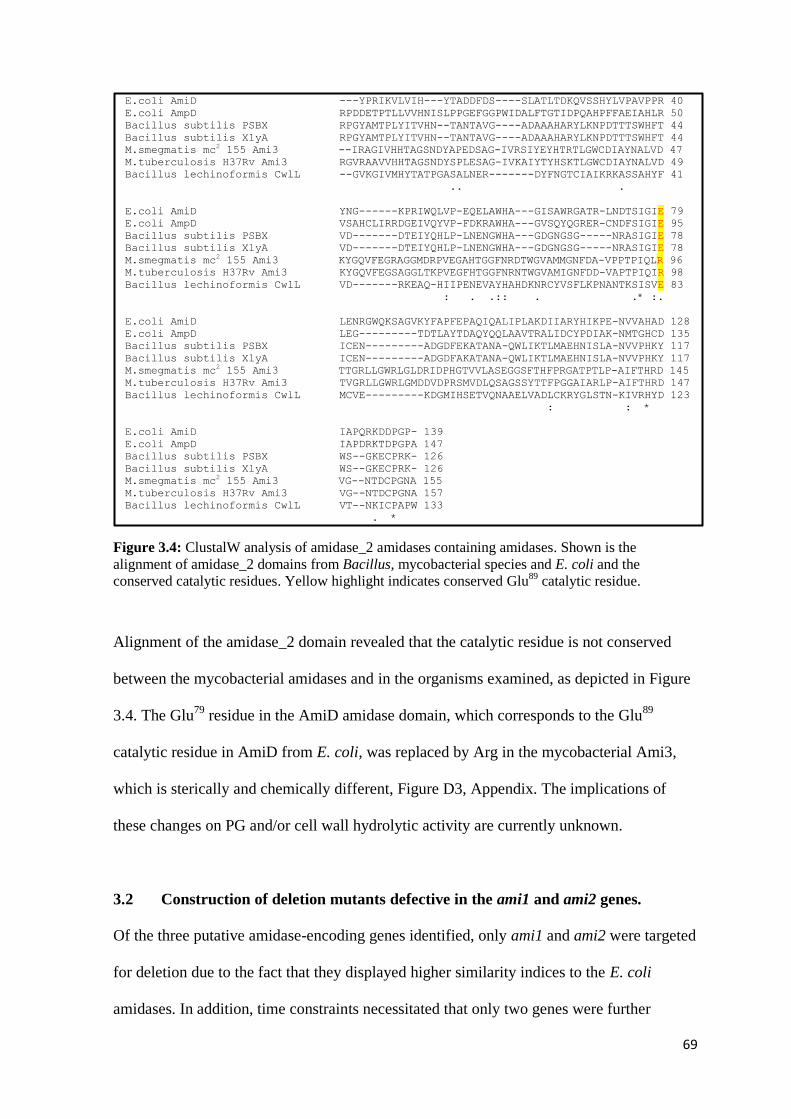
69
Figure 3.4: ClustalW analysis of amidase_2 amidases containing amidases. Shown is the
alignment of amidase_2 domains from Bacillus, mycobacterial species and E. coli and the
conserved catalytic residues. Yellow highlight indicates conserved Glu89
catalytic residue.
Alignment of the amidase_2 domain revealed that the catalytic residue is not conserved
between the mycobacterial amidases and in the organisms examined, as depicted in Figure
3.4. The Glu79
residue in the AmiD amidase domain, which corresponds to the Glu89
catalytic residue in AmiD from E. coli, was replaced by Arg in the mycobacterial Ami3,
which is sterically and chemically different, Figure D3, Appendix. The implications of
these changes on PG and/or cell wall hydrolytic activity are currently unknown.
3.2 Construction of deletion mutants defective in the ami1 and ami2 genes.
Of the three putative amidase-encoding genes identified, only ami1 and ami2 were targeted
for deletion due to the fact that they displayed higher similarity indices to the E. coli
amidases. In addition, time constraints necessitated that only two genes were further
E.coli AmiD ---YPRIKVLVIH---YTADDFDS----SLATLTDKQVSSHYLVPAVPPR 40
E.coli AmpD RPDDETPTLLVVHNISLPPGEFGGPWIDALFTGTIDPQAHPFFAEIAHLR 50
Bacillus subtilis PSBX RPGYAMTPLYITVHN--TANTAVG----ADAAAHARYLKNPDTTTSWHFT 44
Bacillus subtilis XlyA RPGYAMTPLYITVHN--TANTAVG----ADAAAHARYLKNPDTTTSWHFT 44
M.smegmatis mc2 155 Ami3
--IRAGIVHHTAGSNDYAPEDSAG-IVRSIYEYHTRTLGWCDIAYNALVD 47
M.tuberculosis H37Rv Ami3 RGVRAAVVHHTAGSNDYSPLESAG-IVKAIYTYHSKTLGWCDIAYNALVD 49
Bacillus lechinoformis CwlL --GVKGIVMHYTATPGASALNER-------DYFNGTCIAIKRKASSAHYF 41
.. .
E.coli AmiD YNG------KPRIWQLVP-EQELAWHA---GISAWRGATR-LNDTSIGIE 79
E.coli AmpD VSAHCLIRRDGEIVQYVP-FDKRAWHA---GVSQYQGRER-CNDFSIGIE 95
Bacillus subtilis PSBX VD-------DTEIYQHLP-LNENGWHA---GDGNGSG-----NRASIGIE 78
Bacillus subtilis XlyA VD-------DTEIYQHLP-LNENGWHA---GDGNGSG-----NRASIGIE 78
M.smegmatis mc2 155 Ami3
KYGQVFEGRAGGMDRPVEGAHTGGFNRDTWGVAMMGNFDA-VPPTPIQLR 96
M.tuberculosis H37Rv Ami3 KYGQVFEGSAGGLTKPVEGFHTGGFNRNTWGVAMIGNFDD-VAPTPIQIR 98
Bacillus lechinoformis CwlL VD-------RKEAQ-HIIPENEVAYHAHDKNRCYVSFLKPNANTKSISVE 83
: . .:: . .* :.
E.coli AmiD LENRGWQKSAGVKYFAPFEPAQIQALIPLAKDIIARYHIKPE-NVVAHAD 128
E.coli AmpD LEG---------TDTLAYTDAQYQQLAAVTRALIDCYPDIAK-NMTGHCD 135
Bacillus subtilis PSBX ICEN---------ADGDFEKATANA-QWLIKTLMAEHNISLA-NVVPHKY 117
Bacillus subtilis XlyA ICEN---------ADGDFAKATANA-QWLIKTLMAEHNISLA-NVVPHKY 117
M.smegmatis mc2 155 Ami3
TTGRLLGWRLGLDRIDPHGTVVLASEGGSFTHFPRGATPTLP-AIFTHRD 145
M.tuberculosis H37Rv Ami3 TVGRLLGWRLGMDDVDPRSMVDLQSAGSSYTTFPGGAIARLP-AIFTHRD 147
Bacillus lechinoformis CwlL MCVE---------KDGMIHSETVQNAAELVADLCKRYGLSTN-KIVRHYD 123
: : *
E.coli AmiD IAPQRKDDPGP- 139
E.coli AmpD IAPDRKTDPGPA 147
Bacillus subtilis PSBX WS--GKECPRK- 126
Bacillus subtilis XlyA WS--GKECPRK- 126
M.smegmatis mc2 155 Ami3
VG--NTDCPGNA 155
M.tuberculosis H37Rv Ami3 VG--NTDCPGNA 157
Bacillus lechinoformis CwlL VT--NKICPAPW 133
. *
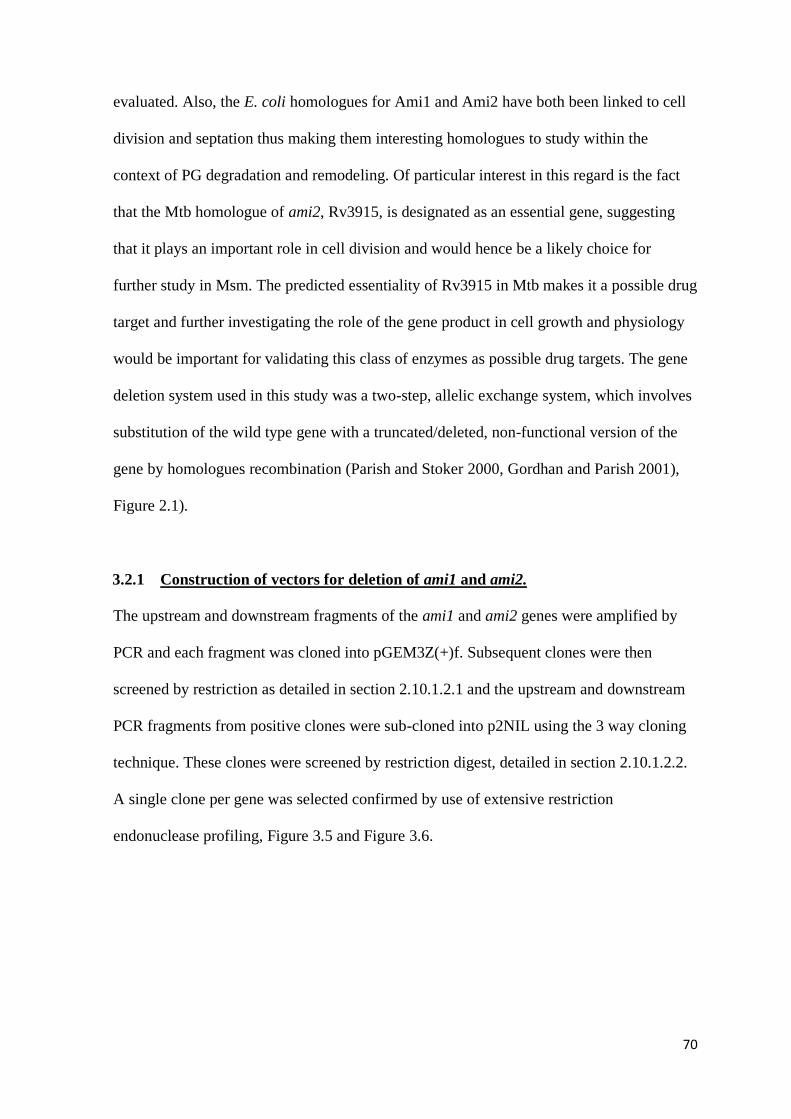
70
evaluated. Also, the E. coli homologues for Ami1 and Ami2 have both been linked to cell
division and septation thus making them interesting homologues to study within the
context of PG degradation and remodeling. Of particular interest in this regard is the fact
that the Mtb homologue of ami2, Rv3915, is designated as an essential gene, suggesting
that it plays an important role in cell division and would hence be a likely choice for
further study in Msm. The predicted essentiality of Rv3915 in Mtb makes it a possible drug
target and further investigating the role of the gene product in cell growth and physiology
would be important for validating this class of enzymes as possible drug targets. The gene
deletion system used in this study was a two-step, allelic exchange system, which involves
substitution of the wild type gene with a truncated/deleted, non-functional version of the
gene by homologues recombination (Parish and Stoker 2000, Gordhan and Parish 2001),
Figure 2.1).
3.2.1 Construction of vectors for deletion of ami1 and ami2.
The upstream and downstream fragments of the ami1 and ami2 genes were amplified by
PCR and each fragment was cloned into pGEM3Z(+)f. Subsequent clones were then
screened by restriction as detailed in section 2.10.1.2.1 and the upstream and downstream
PCR fragments from positive clones were sub-cloned into p2NIL using the 3 way cloning
technique. These clones were screened by restriction digest, detailed in section 2.10.1.2.2.
A single clone per gene was selected confirmed by use of extensive restriction
endonuclease profiling, Figure 3.5 and Figure 3.6.

71
Figure 3.5: Restriction profile of p2NILAmi1. (A) Table displaying the different restriction
endonucleases used and the expected fragment sizes, which result from restriction digest of the
p2NILAmi1 construct. (B) Plasmid map of p2NILAmi1 showing the fused upstream and
downstream fragments (blue), cloned into the p2NIL backbone. (C) Agarose gel showing the result
of restriction enzyme profiling of p2NILAmi1.[Lane 1] Roche marker VI, [Lane 2] Uncut
plasmid, [Lane 3] BamHI, [Lane 4] HindIII, [Lane 5] EcoRI, [Lane 6] BglII, [Lane 7] NruI and
[Lane 8] NdeI
Restriction analysis confirmed that the clones selected displayed the expected restriction
enzyme patterns predicted for the p2NILAmi1 and p2NILAmi2 constructs. Figure 3.5 and
Figure 3.6 show that the restriction profiles obtained by restriction digest of the clones,
with various enzymes, Figure 3.5 C and Figure 3.6 C, corresponded to the predicted
plasmid map and the expected fragment banding patterns. There were no aberrant or
missing bands, thus confirming the genetic integrity of the selected clones. The plasmids
were then further analyzed by sequencing to ensure that the upstream-downstream fusion
fragment, and deletion allele, contained no inadvertent mutations introduced during the
PCR and cloning steps. Sequence data revealed that indeed, no mutations had occurred
Enzyme Expected sizes (bp)
BamHI 8077
HindIII 2202 and 5875
EcoRI 6070 and 2007
BglII 8077
NruI 1230, 2934 and 3913
NdeI 2588 and 54898077 bp
587 5bp 6070 bp
8077 bp
3913 bp
5489 bp
2202 bp2007 bp
2934 bp2588 bp
1230 bp
A
B
C
19329
77435526
42543140269023221882
1489
1150
925
697p2NILAmi1
8077 bps2000
4000
6000
8000
EcoRI 321
NruI 2182
NdeI 2786
dIII 4735Hin
II 5116Bgl
I 5374Nde
I 6095Nru
RI 6391Eco
dIII 6937Hin
I 7325Nru
HI 8077Bam
f1_origin
aph
pBR322_origin
ami1 DS
ami1 US

72
(data not shown), which further confirmed the genetic integrity of the constructs for use in
subsequent cloning and allelic exchange mutagenesis.
Figure 3.6: Restriction profile of p2NILAmi2. (A) Table displaying the different restriction
endonucleases used and the expected fragment sizes, which result from restriction digestion of the
p2NILAmi2 construct. (B) Plasmid map of p2NILAmi2 showing the fused upstream and
downstream fragments (blue), cloned into the p2NIL backbone. (C) Agarose gel showing the result
of restriction enzyme profiling of p2NILAmi2. [Lane 1] Roche marker VI, [Lane 2] Uncut
plasmid, [Lane 3] BamHI, [Lane 4] EcoRI, [Lane 5] MluI, [Lane 6] NotI, [Lane 7] PacI and
[Lane 8] PstI
The pGOAL19 Pac cassette was then cloned into the p2NILAmi1 and p2NILAmi2
constructs, and screened as described in section 2.10.1.2.3, then a single positive clone per
gene was selected and the genetic integrity of the final knockout constructs confirmed by
extensive restriction endonuclease profiling, Figure 3.7 and Figure 3.8.
A
B
C
Enzyme Expected sizes (bp)
BamHI 6712
EcoRI 1785 and 4927
MluI 2482 and 4230
NotI 556 and 6156
PacI 6712
PstI 6712
6712 bp
4927 bp
1785 bp
4230 bp
2482 bp
556 bp
6712 bp6156 bp 6712 bp
p2NILAmi2
6712 bps
1000
2000
30004000
5000
6000
NotI 305PacI 313EcoRI 321
MluI 416
I 4098Pst
I 4646Mlu
RI 5248Eco
I 6461NotHI 6712Bam
f1_origin
aph
pBR322_origin
ami2 DS
ami2 US
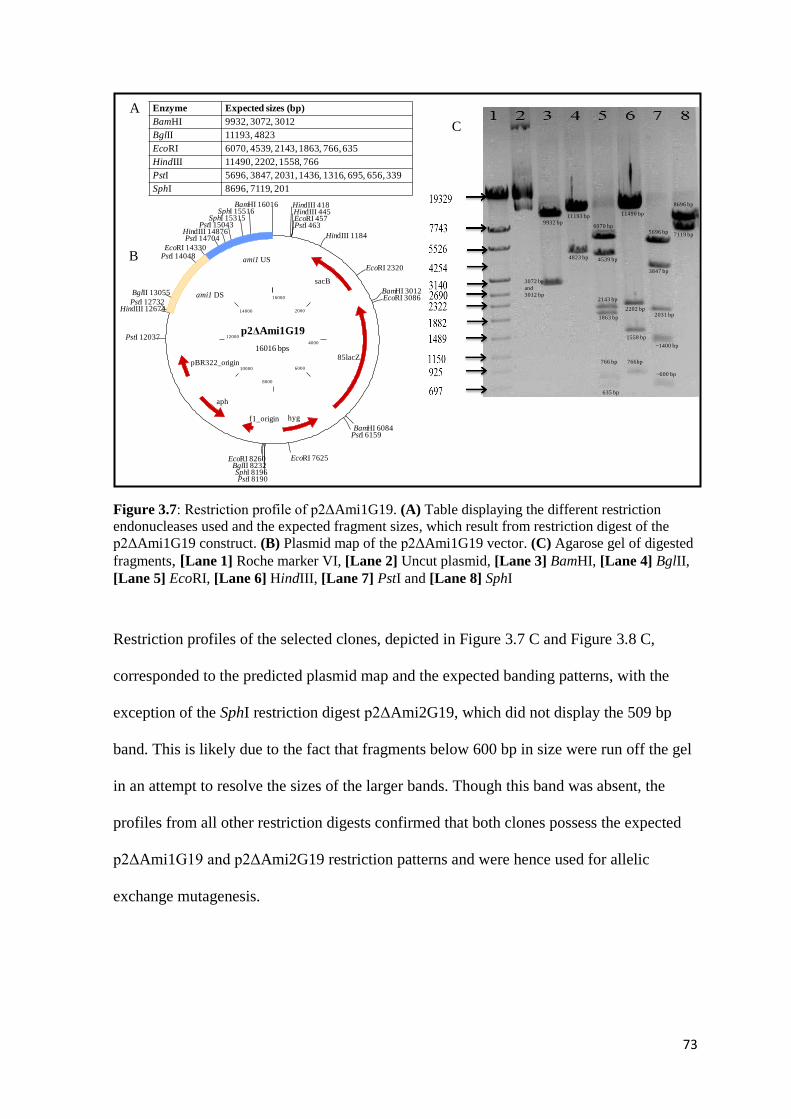
73
Figure 3.7: Restriction profile of p2ΔAmi1G19. (A) Table displaying the different restriction
endonucleases used and the expected fragment sizes, which result from restriction digest of the
p2ΔAmi1G19 construct. (B) Plasmid map of the p2ΔAmi1G19 vector. (C) Agarose gel of digested
fragments, [Lane 1] Roche marker VI, [Lane 2] Uncut plasmid, [Lane 3] BamHI, [Lane 4] BglII,
[Lane 5] EcoRI, [Lane 6] HindIII, [Lane 7] PstI and [Lane 8] SphI
Restriction profiles of the selected clones, depicted in Figure 3.7 C and Figure 3.8 C,
corresponded to the predicted plasmid map and the expected banding patterns, with the
exception of the SphI restriction digest p2ΔAmi2G19, which did not display the 509 bp
band. This is likely due to the fact that fragments below 600 bp in size were run off the gel
in an attempt to resolve the sizes of the larger bands. Though this band was absent, the
profiles from all other restriction digests confirmed that both clones possess the expected
p2ΔAmi1G19 and p2ΔAmi2G19 restriction patterns and were hence used for allelic
exchange mutagenesis.
A
B
C
9932 bp
3072 bp
and
3012 bp
11193 bp
4823 bp
2143 bp
1863 bp
1558 bp
2202 bp
4539 bp
11490 bp
3847 bp
5696 bp6070 bp
766 bp
635 bp
766bp
Enzyme Expected sizes (bp)
BamHI 9932, 3072, 3012
BglII 11193, 4823
EcoRI 6070, 4539, 2143, 1863, 766, 635
HindIII 11490, 2202, 1558, 766
PstI 5696, 3847, 2031, 1436, 1316, 695, 656, 339
SphI 8696, 7119, 201
~1400 bp
2031 bp
8696 bp
7119 bp
~600 bp
p2ΔAmi1G19
16016 bps
2000
4000
6000
8000
10000
12000
14000
16000
HindIII 418HindIII 445EcoRI 457PstI 463
HindIII 1184
EcoRI 2320
BamHI 3012EcoRI 3086
BamHI 6084PstI 6159
EcoRI 7625
I 8190PstI 8196Sph
II 8232BglRI 8260Eco
I 12037Pst
dIII 12674HinI 12732Pst
II 13055Bgl
I 14048PstRI 14330Eco
I 14704PstdIII 14876Hin
I 15043PstI 15315Sph
I 15516SphHI 16016Bam
sacB
85lacZ
hygf1_origin
aph
pBR322_origin
ami1 DS
ami1 US
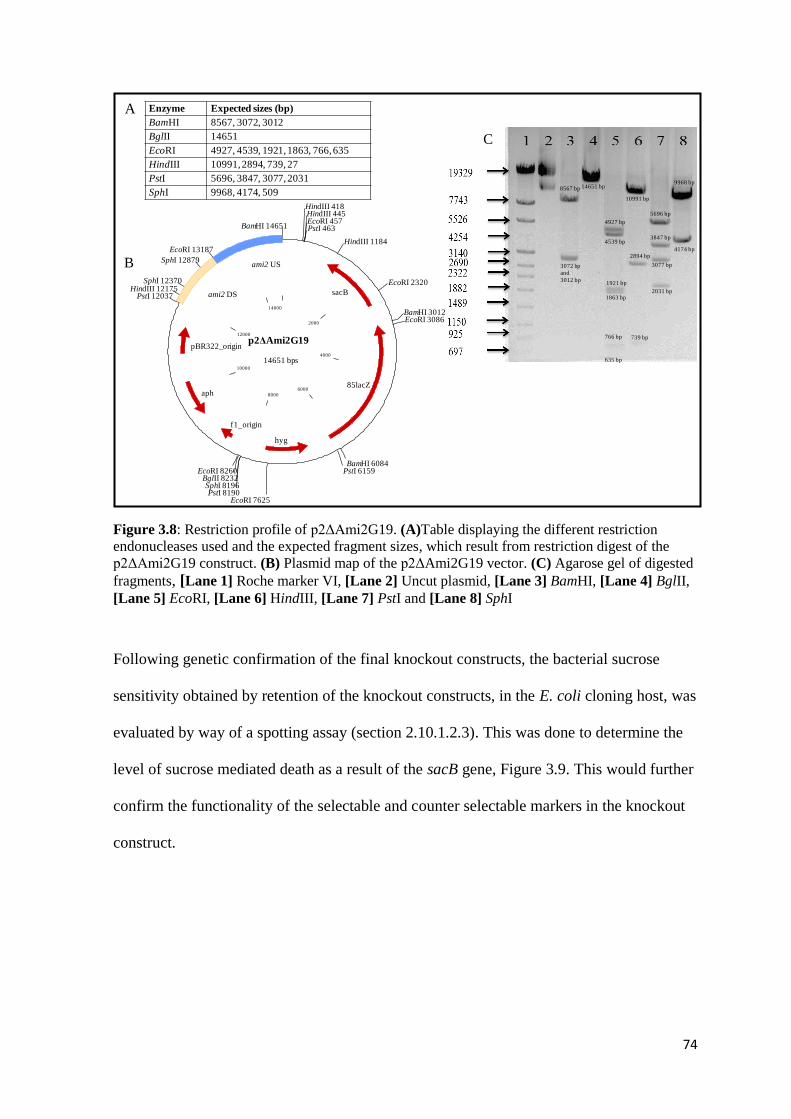
74
Figure 3.8: Restriction profile of p2ΔAmi2G19. (A)Table displaying the different restriction
endonucleases used and the expected fragment sizes, which result from restriction digest of the
p2ΔAmi2G19 construct. (B) Plasmid map of the p2ΔAmi2G19 vector. (C) Agarose gel of digested
fragments, [Lane 1] Roche marker VI, [Lane 2] Uncut plasmid, [Lane 3] BamHI, [Lane 4] BglII,
[Lane 5] EcoRI, [Lane 6] HindIII, [Lane 7] PstI and [Lane 8] SphI
Following genetic confirmation of the final knockout constructs, the bacterial sucrose
sensitivity obtained by retention of the knockout constructs, in the E. coli cloning host, was
evaluated by way of a spotting assay (section 2.10.1.2.3). This was done to determine the
level of sucrose mediated death as a result of the sacB gene, Figure 3.9. This would further
confirm the functionality of the selectable and counter selectable markers in the knockout
construct.
A
B
C
8567 bp
3072 bp
and
3012 bp
14651 bp
1921 bp
4539 bp
2894 bp
1863 bp
3077 bp
2031 bp
3847 bp
5696 bp
4174 bp
9968 bp
10991 bp
766 bp
635 bp
739 bp
Enzyme Expected sizes (bp)
BamHI 8567, 3072, 3012
BglII 14651
EcoRI 4927, 4539, 1921, 1863, 766, 635
HindIII 10991, 2894, 739, 27
PstI 5696, 3847, 3077, 2031
SphI 9968, 4174, 509
4927 bp
p2ΔAmi2G19
14651 bps
2000
4000
6000
8000
10000
12000
14000
HindIII 418HindIII 445EcoRI 457PstI 463
HindIII 1184
EcoRI 2320
BamHI 3012EcoRI 3086
BamHI 6084PstI 6159
RI 7625EcoI 8190PstI 8196Sph
II 8232BglRI 8260Eco
I 12037PstdIII 12175Hin
I 12370Sph
I 12879Sph
RI 13187Eco
HI 14651Bam
sacB
85lacZ
hyg
f1_origin
aph
pBR322_origin
ami2 DS
ami2 US

75
Figure 3.9: Confirmation of sucrose sensitivity in strains carrying knockout constructs. Evaluation
of E. coli DH5α sucrose sensitivity acquired as a result of p2ΔAmi1G19 and p2ΔAmi2G19
construct retention in the cloning host. Spots represent dilution gradient of an OD = 0.5 E. coli
culture with dilution factors of 100, 10
1, 10
2, 10
3, 10
4, 10
5, 10
6, 10
7.
The sucrose sensitivity assay confirmed that retention of the knockout construct leads to
sucrose sensitivity and ultimately growth inhibition. This is evidenced by the reduced
growth of these strains on media containing sucrose when compared to the more robust
growth observed on plates without sucrose, Figure 3.9. An additional observation was the
color of the bacterial colonies on the sucrose containing media; these displayed the
formation of white colonies, which is likely due to plasmid loss or mutation of the
lacZ/sacB gene cassette. This assay confirmed the functionality of both the lacZ and sacB
genes indicating that the constructs could be used for allelic exchange mutagenesis.
3.2.2 Two-step homologues recombination and gene knockout
The p2ΔAmi1G19 and p2ΔAmi2G19 knockout vectors were electroporated into mc2155
(section 2.10.1.4), the transformation efficiency obtained for the electro-competent cells
was 3.5 × 10⁴ CFU/µg plasmid DNA determined using the pOLYG control. The pOLYG
efficiency was sufficient for efficient transformation of the knockout vectors. A single blue
clone per construct (SCO strains) was cultured and subjected to sucrose counter selection
(section 2.10.1.4). White colonies were then screened by PCR to identify clones, which
possess only the deleted allele, Figure 3.10.
LA, Kan, Hyg and
Xgal
LA, Xgal and 5%
sucrose
p2ΔAmi1G19 p2ΔAmi2G19
100 102101 105103 106 107104 100 102101 105103 106 107104
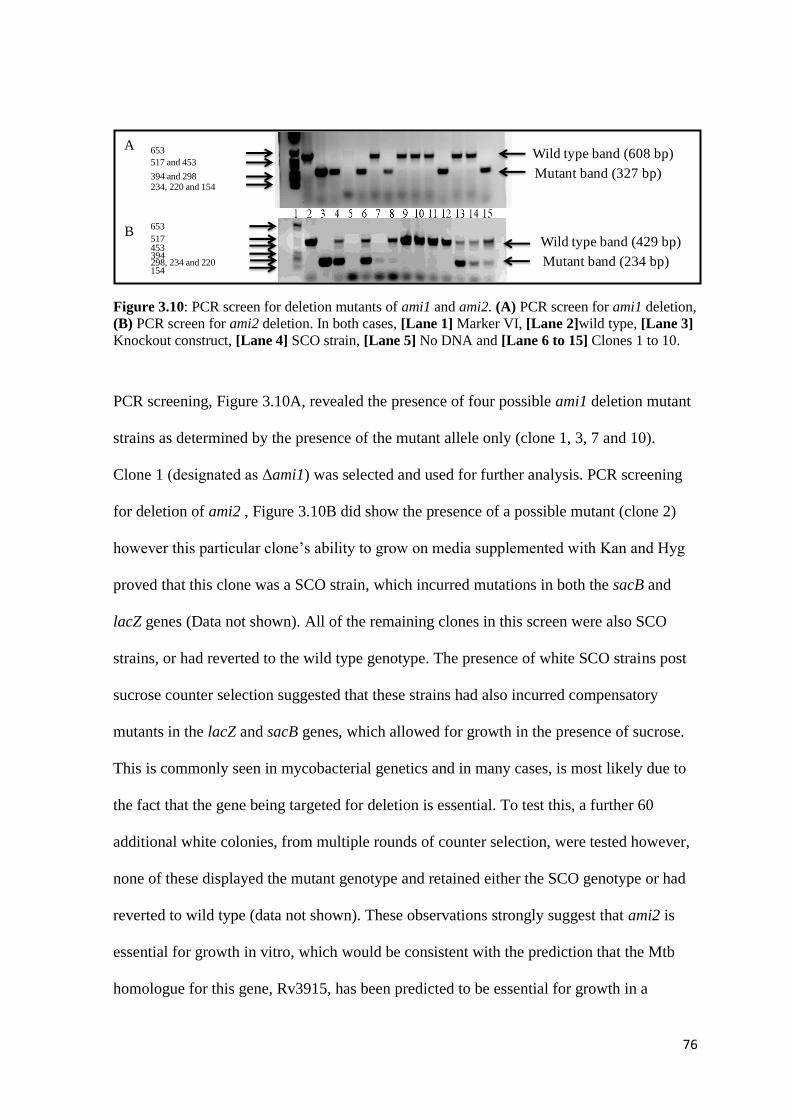
76
Figure 3.10: PCR screen for deletion mutants of ami1 and ami2. (A) PCR screen for ami1 deletion,
(B) PCR screen for ami2 deletion. In both cases, [Lane 1] Marker VI, [Lane 2]wild type, [Lane 3]
Knockout construct, [Lane 4] SCO strain, [Lane 5] No DNA and [Lane 6 to 15] Clones 1 to 10.
PCR screening, Figure 3.10A, revealed the presence of four possible ami1 deletion mutant
strains as determined by the presence of the mutant allele only (clone 1, 3, 7 and 10).
Clone 1 (designated as Δami1) was selected and used for further analysis. PCR screening
for deletion of ami2 , Figure 3.10B did show the presence of a possible mutant (clone 2)
however this particular clone’s ability to grow on media supplemented with Kan and Hyg
proved that this clone was a SCO strain, which incurred mutations in both the sacB and
lacZ genes (Data not shown). All of the remaining clones in this screen were also SCO
strains, or had reverted to the wild type genotype. The presence of white SCO strains post
sucrose counter selection suggested that these strains had also incurred compensatory
mutants in the lacZ and sacB genes, which allowed for growth in the presence of sucrose.
This is commonly seen in mycobacterial genetics and in many cases, is most likely due to
the fact that the gene being targeted for deletion is essential. To test this, a further 60
additional white colonies, from multiple rounds of counter selection, were tested however,
none of these displayed the mutant genotype and retained either the SCO genotype or had
reverted to wild type (data not shown). These observations strongly suggest that ami2 is
essential for growth in vitro, which would be consistent with the prediction that the Mtb
homologue for this gene, Rv3915, has been predicted to be essential for growth in a
A
BWild type band (429 bp)
Wild type band (608 bp)
Mutant band (327 bp)
Mutant band (234 bp)
653
517 and 453
394 and 298234, 220 and 154
653
517453394298, 234 and 220154

77
genome-wide essentiality study (Sassetti et al., 2003). Due to the inability to generate an
ami2 deletion mutant, we further studied the function of this gene by targeted gene
depletion.
Southern blot analysis was conducted to confirm the genotype of the Msm Δami1 strain
and to confirm site-specific integration of the deletion allele without any other inadvertent
genomic rearrangements. The probe for Southern blotting was constructed by PCR and the
primers used to amplify the upstream homologous region, Figure 3.11. Southern blot
analysis using the restriction enzyme BamHI was conducted on the mc2155, the SCO and
Δami1 strains, the observed sizes were compared against the expected sizes shown on
Figure 3.11. The wild type, mc2155 strain displayed the presence of 7303 bp band in lane 1
confirming the wild type genotype. The SCO strain displayed two fragments, one, which
corresponded to the mutant allele and a second band, which corresponded to the fusion of
the vector with the wild type allele. As expected the mutant strain (lane 2) displayed a
10 000 bp band confirming unequivocally that this strain retains the truncated version of
the ami1. This analysis also confirmed that no gross genomic DNA rearrangements
occurred during the allelic exchange mutagenesis.
3.3 Complementation of the Msm Δami1 strain
Complementation of the Δami1 strain with the mc2155 ami1 gene was accomplished by
utilizing an integrating vector. Briefly, the mc2155 ami1 gene and the respective promoter
region was cloned into an integrating vector containing antibiotic resistance markers then
electroporated into the Δami1 strain. This should result in plasmid integration and re-
introduction of the wild type allele into the genome (section 2.11).
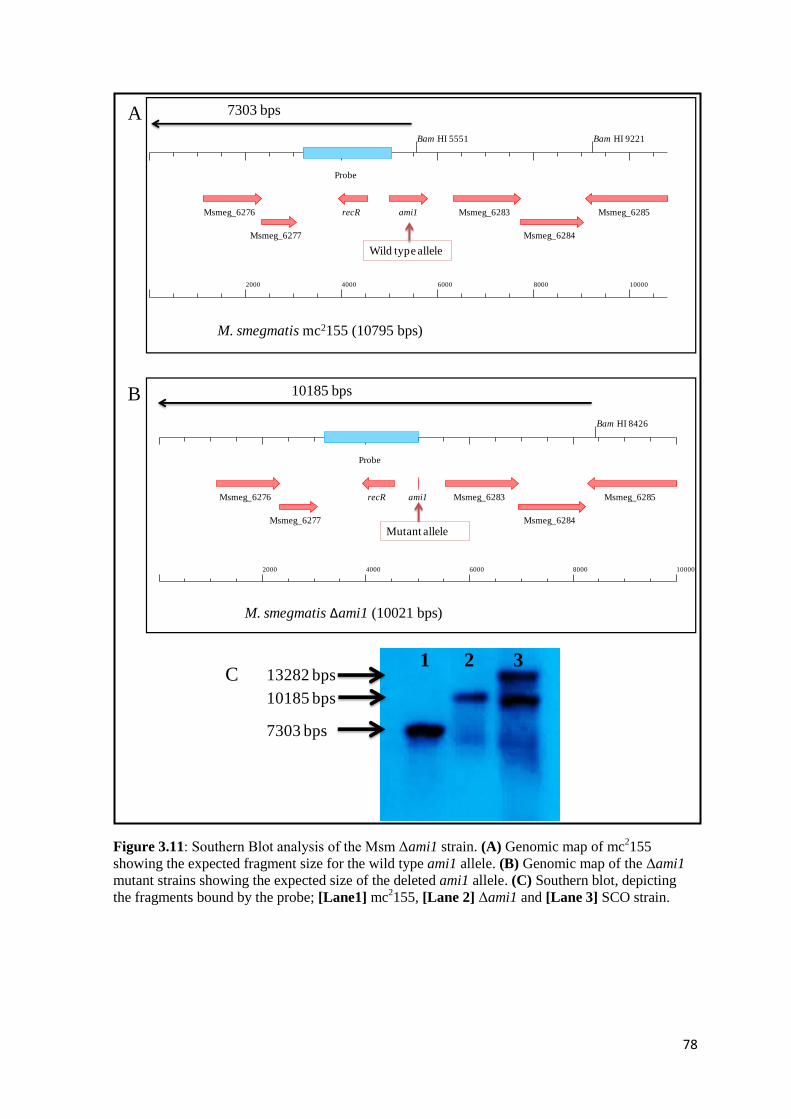
78
Figure 3.11: Southern Blot analysis of the Msm Δami1 strain. (A) Genomic map of mc2155
showing the expected fragment size for the wild type ami1 allele. (B) Genomic map of the Δami1
mutant strains showing the expected size of the deleted ami1 allele. (C) Southern blot, depicting
the fragments bound by the probe; [Lane1] mc2155, [Lane 2] Δami1 and [Lane 3] SCO strain.
A
B
C
7303 bps
M. smegmatis mc2155 (10795 bps)
Wild type allele
10185 bps
Mutant allele
M. smegmatis Δami1 (10021 bps)
2000 4000 6000 8000 10000
Bam HI 8426
Msmeg_6276
Msmeg_6277
Probe
recR ami1 Msmeg_6283
Msmeg_6284
Msmeg_6285
2000 4000 6000 8000 10000
Bam HI 5551 Bam HI 9221
Msmeg_6276
Msmeg_6277
Probe
recR ami1 Msmeg_6283
Msmeg_6284
Msmeg_6285
13282 bps
10185 bps
7303 bps
1 2 3

79
3.3.1 Construction of the ami1 complementation vector
The wild type allele and the native promoter region was amplified by PCR and cloned into
integrating vector pMV306(H). Subsequent clones were screened by restriction digest as
detailed section 2.11.1 (data not shown). Following this, a single positive clone was
selected and the genetic integrity of the plasmid was confirmed by extensive restriction
profiling, Figure 3.12.
Figure 3.12: Restriction profile of pMVAmi1. (A) Table displaying the different restriction
endonucleases used and the expected fragment sizes, which result from restriction digest of the
pMVAmi1 plasmid. (B) Plasmid map of the pMVAmi1 complementation vector. (C) Agarose gel
depicting the fragments that result from restriction digestion of the pMVAmi1 construct. [Lane 1]
Roche marker VI, [Lane 2] Uncut plasmid, [Lane 3] PstI, [Lane 4] MscI, [Lane 5] EcoRI, [Lane
6] PvuII, [Lane 7] MluI, [Lane 8] HindIII
As shown on Figure 3.12, the fragment sizes observed after restriction digest of pMVAmi1
corresponded to expected sizes from the restriction map, confirming that the clone selected
A
B
CEnzyme Expected sizes (bp)
PstI 4647, 753 & 80
MscI 2919, 1344, 617 and 600
EcoRI 2622 & 2858
PvuII 4526 & 954
MluI 4808 & 672
HindIII 5480
4647 bp
753 bp
2919 bp
1344 bp
~ 600 bp
2858 bp
2622 bp
~4200 bp
4526 bp
954 bp
4808 bp
672 bp
5480 bp
pMVAmi1
5480 bps
1000
2000
3000
4000
5000
MscI 266
PstI 607
MscI 1610
EcoRI 2717
I 4073Mlu
II 4377Pvu
I 4529Msc
I 4745Mlu
I 5129MscI 5254Pst
II 5331PvuI 5334Pst
RI 5339EcodIII 5346Hin
int
hyg
'oriE
ami1 fragment
ami1
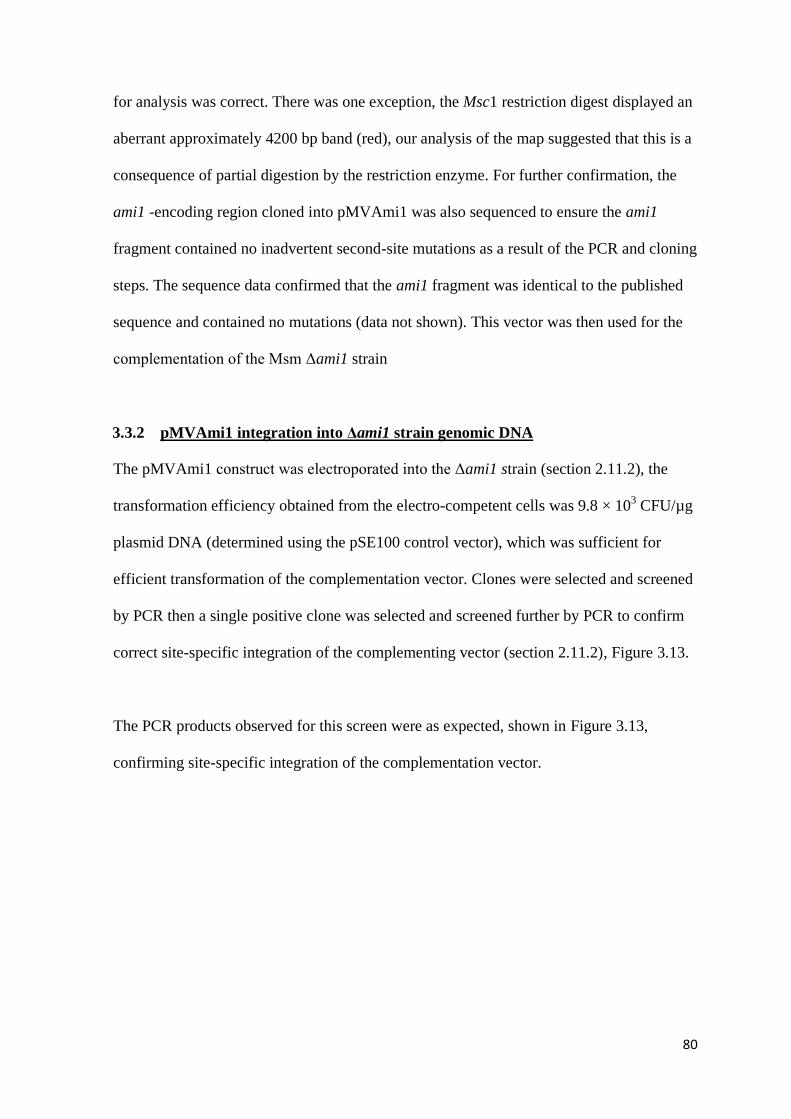
80
for analysis was correct. There was one exception, the Msc1 restriction digest displayed an
aberrant approximately 4200 bp band (red), our analysis of the map suggested that this is a
consequence of partial digestion by the restriction enzyme. For further confirmation, the
ami1 -encoding region cloned into pMVAmi1 was also sequenced to ensure the ami1
fragment contained no inadvertent second-site mutations as a result of the PCR and cloning
steps. The sequence data confirmed that the ami1 fragment was identical to the published
sequence and contained no mutations (data not shown). This vector was then used for the
complementation of the Msm Δami1 strain
3.3.2 pMVAmi1 integration into Δami1 strain genomic DNA
The pMVAmi1 construct was electroporated into the Δami1 strain (section 2.11.2), the
transformation efficiency obtained from the electro-competent cells was 9.8 × 10³ CFU/µg
plasmid DNA (determined using the pSE100 control vector), which was sufficient for
efficient transformation of the complementation vector. Clones were selected and screened
by PCR then a single positive clone was selected and screened further by PCR to confirm
correct site-specific integration of the complementing vector (section 2.11.2), Figure 3.13.
The PCR products observed for this screen were as expected, shown in Figure 3.13,
confirming site-specific integration of the complementation vector.
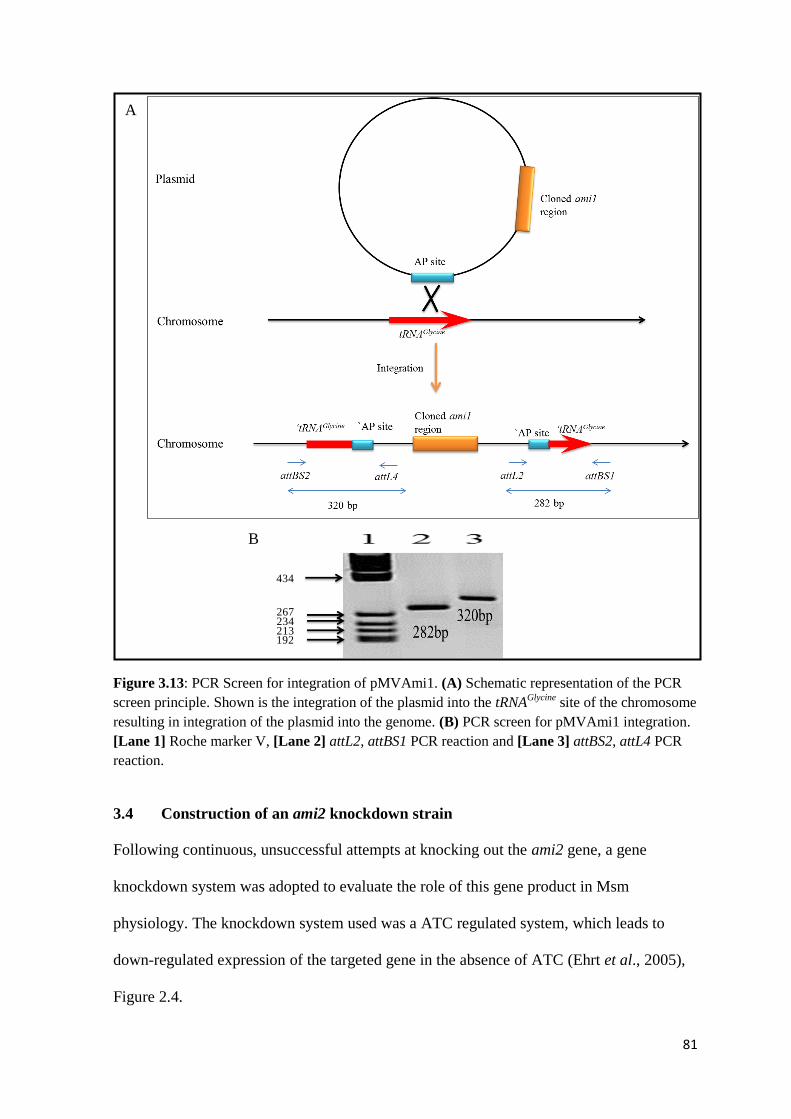
81
Figure 3.13: PCR Screen for integration of pMVAmi1. (A) Schematic representation of the PCR
screen principle. Shown is the integration of the plasmid into the tRNAGlycine
site of the chromosome
resulting in integration of the plasmid into the genome. (B) PCR screen for pMVAmi1 integration.
[Lane 1] Roche marker V, [Lane 2] attL2, attBS1 PCR reaction and [Lane 3] attBS2, attL4 PCR
reaction.
3.4 Construction of an ami2 knockdown strain
Following continuous, unsuccessful attempts at knocking out the ami2 gene, a gene
knockdown system was adopted to evaluate the role of this gene product in Msm
physiology. The knockdown system used was a ATC regulated system, which leads to
down-regulated expression of the targeted gene in the absence of ATC (Ehrt et al., 2005),
Figure 2.4.
434
267234213192
A
B
82
3.4.1 Construction of ami2 knockdown vector
PCR amplification was conducted to amplify a fragment consisting of 386 bp from the 5’
region of the ami2 gene fused to the panC ribosomal binding site. The fragment was then
cloned into pSE100 and clones were screened by restriction with NotI. A single positive
clone was then selected and the genetic integrity of the construct was confirmed by
extensive restriction profiling, Figure 3.14.
Figure 3.14: Restriction profile of pSEAmi2P. (A) Table displaying the different restriction
endonucleases used and the expected fragment sizes, which result from restriction digest of the
pSEAmi2P plasmid. (B) Predicted plasmid map of pSEAmi2P vector. (C) Agarose gel depicting
the products of restriction digest of pSEAmi2P. [Lane 1] Roche marker IV, [Lane 2] Uncut,
[Lane 3] DdeI, [Lane 4] NotI, [Lane 5] SphI, [Lane 6] NotI and SphI, [Lane 7] PstI and [Lane 8]
SacI.
In all cases, all the fragment sizes observed corresponded to the plasmid map and expected
sizes, confirming the genetic integrity of the vector, Figure 3.14. The genomic integrity of
the vector was then further confirmed by sequencing of the cloned region, which revealed
Enzyme Expected sizes (bp)
DdeI 166, 409, 463, 473, 635 and 1306
NotI 468 and 2983
SphI 3451
NotI and SphI 2616, 486 and 371
PstI 3451
SacI 1471 and 1980
2983 bp
463 bp
and
473 bp
468 bp
3451 bp
2616 bp
3451 bp
1306 bp
635 bp
1980bp
1471 bp
409 bp
A
B
C
486 bp
166 bp
371 bp
pSEAmi2P
3451 bps
500
1000
15002000
2500
3000
DdeI 8SacI 159
SphI 372
DdeI 492
PstI 702
Not I 746
DdeI 1106
Not I 1214
I 2139Sac
I 2411Dde
I 2577Dde
I 2986DderrnBT2
UV15tetO
ami2 350 bps
'ori myc
hygR
ColE1

83
that no mutations had occurred during PCR and cloning processes (data not shown). This
construct was then used for construction of an ami2 knockdown strain.
3.4.2 Incorporation of pSEAmi2P into Msm to create a gene knockdown strain
The pSEAmi2P construct was electroporated into the SRS strain and the transformation
efficiency, which was calculated using the pSE100 electroporation control, was determined
to be 2.6 × 10⁴ CFU/µg plasmid DNA. This was sufficient for efficient transformation of
the knockdown vector (section 2.11.2). Clones were then selected and screened for site
specific recombination of the pSEAmi2P into the ami2 gene locus by Southern blot
analysis using genomic DNA digested with PvuI, Figure 3.15. As depicted in Figure 3.15,
clones 2 and 3 displayed the expected hybridization pattern for a knockdown strain,
confirming that they were the product of site-specific recombination of the vector. Clones
1, 4, 5 and 6 displayed the incorrect banding pattern suggesting that the recombination
event did not occur at the correct site, these clones were discarded. Clone 2 was selected
and used for further phenotypic analysis.
3.5 The Role of Ami1 in cell division and structural maintenance
A variety of assays were carried out on the Msm Δami1 strain to evaluate the implications
of deleting the ami1 gene in the growth and development of Msm. These included analysis
of growth kinetics, motility assays and single cell analysis utilizing different forms of
microscopy. The outcome of these experiments is summarized below.

84
Figure 3.15: Southern Blot analysis of the Msm ami2KDP knockdown strain. (A) Genomic map of
the wild type (carrying the ATC repressor – SRS) showing the expected wild type SRS
hybridization pattern. (B) Genomic map of ami2KDP showing the expected mutant hybridization
pattern. (C) Southern blot showing the hybridization pattern detected with the Probe; [Lane 1]
SRS, [Lane 2 to 7] ami2KDP clone 1 to 6.
A
B
C
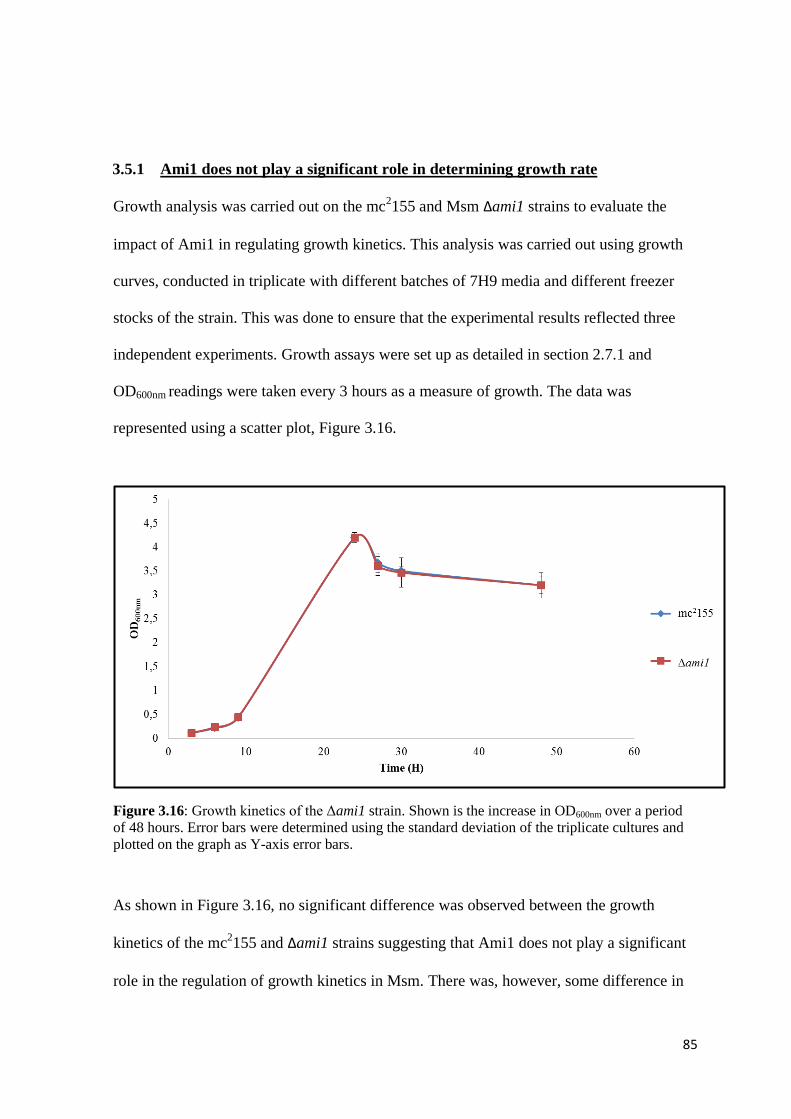
85
3.5.1 Ami1 does not play a significant role in determining growth rate
Growth analysis was carried out on the mc2155 and Msm Δami1 strains to evaluate the
impact of Ami1 in regulating growth kinetics. This analysis was carried out using growth
curves, conducted in triplicate with different batches of 7H9 media and different freezer
stocks of the strain. This was done to ensure that the experimental results reflected three
independent experiments. Growth assays were set up as detailed in section 2.7.1 and
OD600nm readings were taken every 3 hours as a measure of growth. The data was
represented using a scatter plot, Figure 3.16.
Figure 3.16: Growth kinetics of the Δami1 strain. Shown is the increase in OD600nm over a period
of 48 hours. Error bars were determined using the standard deviation of the triplicate cultures and
plotted on the graph as Y-axis error bars.
As shown in Figure 3.16, no significant difference was observed between the growth
kinetics of the mc2155 and Δami1 strains suggesting that Ami1 does not play a significant
role in the regulation of growth kinetics in Msm. There was, however, some difference in

86
the overall appearance of the culture as the Δami1 strain began to form bacterial clumps
after 30 hours of growth and the mc2155 strain did not (data not shown). Since no
significant effects were observed, these experiments did not include the complemented
derivative.
3.5.2 Ami1 does not play a significant role in biofilm formation
Biofilm analysis was conducted on the mc2155 and Δami1 strains to investigate the impact
of deleting ami1 on the ability to form biofilms. Biofilm analysis was conducted as
detailed in section 2.7.2. The initial CFUs for both strains were 2.31 × 10⁶ CFU/ml for the
mc2155 and 2.17 × 10
6 CFU/ml for the Δami1 strain.
Figure 3.17: Biofilm formation with Δami1 strain. (A) Biofilm formation in the mc2155 strain at
1× magnification and (C) Biofilm formation in the mc2155 strain at 45× magnification. (B) Biofilm
formation of the Δami1 strain at 1× magnification and (D) Biofilm formation of the Δami1 strain at
45× magnification. 1 to 6 represents a ten-fold serial dilution of the starting inoculums, [1] 100
(undiluted), [2]101, [3]10
2, [4]10
3, [5]10
4 and [6]10
5. Red circle represents a marginal difference in
the biofilm formation at the 103 dilution after incubation for 5 days.
Biofilm formation in these strains is shown in Figure 3.17. Biofilm formation is measured
as a pellicle on the surface of a liquid culture in 6-well tissue culture plates. The biofilm
does not form at inoculum concentrations below the 103 dilution as these wells did not

87
show pellicle formation and displayed only planktonic growth, Figure 3.17 A and B. At
day five it can also be seen that biofilm formation has initiated in the103 dilution in mc
2155
and has not yet started in the corresponding Δami1 well (red circle). In this case, the
biofilm does however form by day 8 in the Δami1 strain, indicating that there is a slight
delay in formation of biofilms with the mutant, which was not statistically meaningful
(data not shown). These data confirm that deletion of the ami1 does not affect the capacity
of Msm to form a biofilm. Figure 3.17 C and D depict the surface structure of the two
biofilms, no significant structural differences between biofilms from the two strains were
noted. This result suggests that ami1 gene product does play a significant role in
determining the overall structure of the biofilm.
3.5.3 Ami1 does not play a significant role in sliding motility
Mycobacteria have the ability to move on semi-solid media due to the presence of certain
macromolecules and lipids on the outer surface of the cell (Recht et al., 2001). We
reasoned that deletion of ami1 may result in changes in the composition or structure of the
cell wall, which would affect the organism’s ability to slide. We tested sliding motility, on
two types of agar, for both the mc2155 and Δami1 strains to determine whether Ami1 plays
a role in sliding motility (section 2.7.3).
Mycobacterial sliding of both the mc2155 and Δami1 strains on two different semi solid
media is depicted in Figure 3.18. There was no significant difference between sliding
phenotypes of the mc2155 and Δami1 strains on both media suggesting that Ami1 does not
play a significant role in the sliding motility. Bacterial sliding motility appears to be
different when using different types of media supports as seen in Figure 3.18. On 7H9
media, the cells exhibit a branch-like sliding phenotype where the strain forms radiating
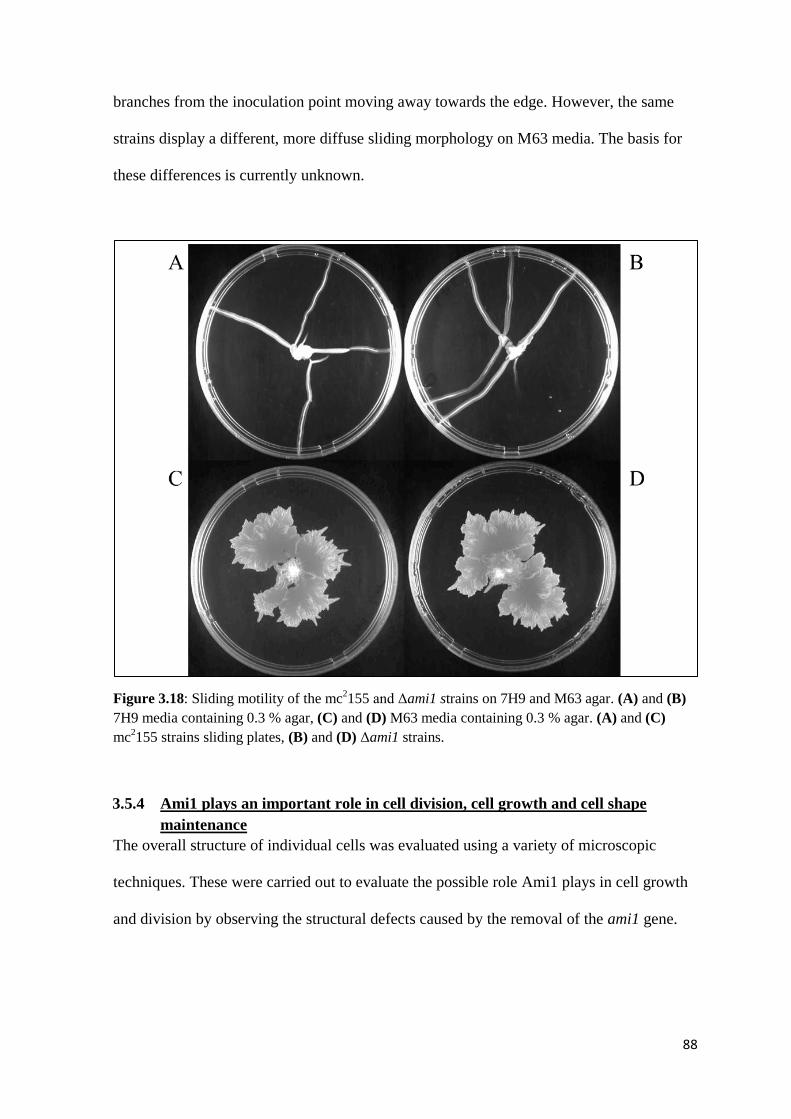
88
branches from the inoculation point moving away towards the edge. However, the same
strains display a different, more diffuse sliding morphology on M63 media. The basis for
these differences is currently unknown.
Figure 3.18: Sliding motility of the mc2155 and Δami1 strains on 7H9 and M63 agar. (A) and (B)
7H9 media containing 0.3 % agar, (C) and (D) M63 media containing 0.3 % agar. (A) and (C)
mc2155 strains sliding plates, (B) and (D) Δami1 strains.
3.5.4 Ami1 plays an important role in cell division, cell growth and cell shape
maintenance
The overall structure of individual cells was evaluated using a variety of microscopic
techniques. These were carried out to evaluate the possible role Ami1 plays in cell growth
and division by observing the structural defects caused by the removal of the ami1 gene.

89
One of the microscopic techniques employed was confocal microscopy. This was
conducted to evaluate two main aspects, (I) The localization of new PG synthesis by
assessing localization of fluorescent vancomycin and (II) Assessment of cell size and
shape. Localization of fluorescent vancomycin is an important and interesting component
because it gives one an indication of possible sites for active PG remodeling and insertion
of new PG units since vancomycin will bind new, unlinked PG (Hett and Rubin, 2008).
Two additional stains used were DAPI-which stains nucleic acids and Cellmask™ orange -
, which stains the phospholipid bilayer. The inclusion of multiple stains was done to allow
the acquisition of composite images. Confocal microscopy was conducted on the mc2155,
Δami1 and Δami1::pMVami1 strains, Figure 3.19.
Confocal microscopy on the mc2155, ami1 deletion mutant and complemented derivative is
shown in Figure 3.19. Polar localization of vancomycin on all three strains is depicted by
the bright green spots at the cellular poles (red arrow), the Δami1 strain appears to have
reduced polar vancomycin staining, Figure 3.19 G [II] and G [IV] (blue arrows), when
compared to both the mc2155 and Δami1::pMVami1 strains, Figure 3.19 G [I] and G [III].
It has been demonstrated that mycobacteria as well as other actimomycetes grow by
extension of and incorporation of new PG at the poles (Thanky et al., 2006). Polar
localization of fluorescent vancomycin was expected due to the active nature of the
mycobacterial poles resulting in an abundance of unlinked PG (Thanky et al., 2006). The
data showing polar localization of fluorescent vancomycin on the mc2155 strain confirms
previous observations that mycobacteria grow by incorporating new PG at the poles. The
diffused vancomycin staining observed on the Δami1 strain suggests a defect in polar
localization of new peptidoglycan and a possible role in the establishment of an active
growth pole. Of note is the observation that there was a difference in size between mc2155

90
A
FE
DC
B
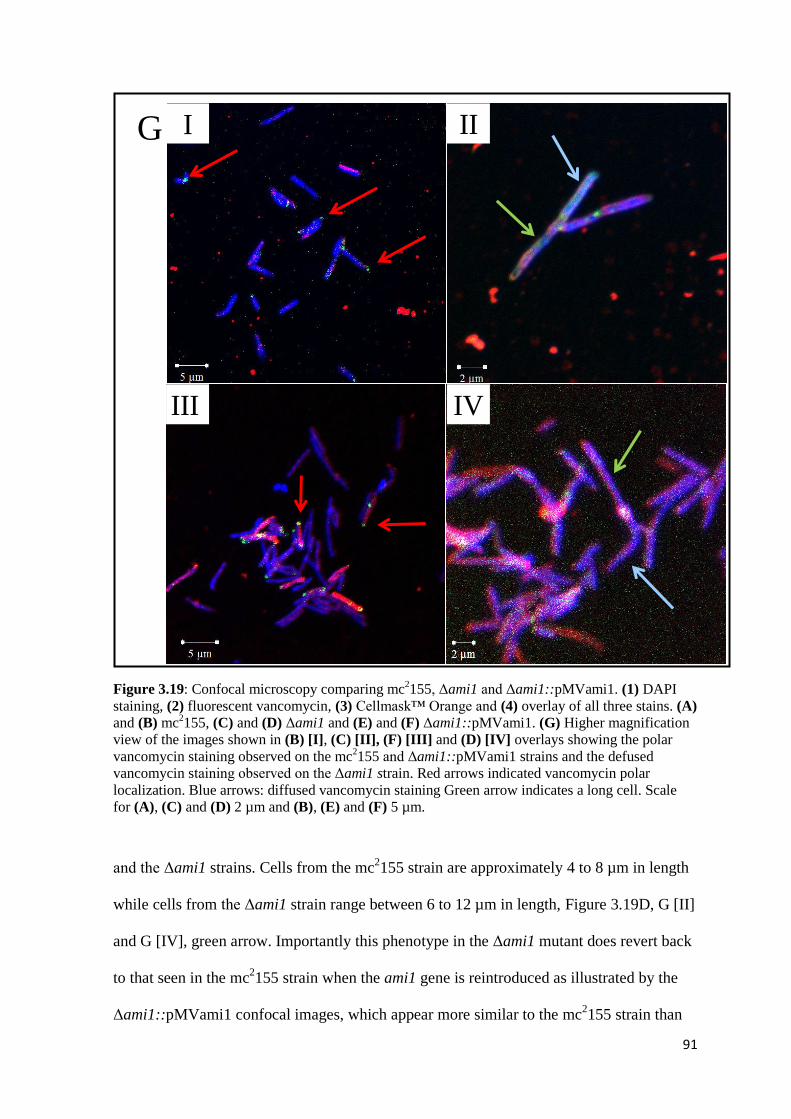
91
Figure 3.19: Confocal microscopy comparing mc2155, Δami1 and Δami1::pMVami1. (1) DAPI
staining, (2) fluorescent vancomycin, (3) Cellmask™ Orange and (4) overlay of all three stains. (A)
and (B) mc2155, (C) and (D) Δami1 and (E) and (F) Δami1::pMVami1. (G) Higher magnification
view of the images shown in (B) [I], (C) [II], (F) [III] and (D) [IV] overlays showing the polar
vancomycin staining observed on the mc2155 and Δami1::pMVami1 strains and the defused
vancomycin staining observed on the Δami1 strain. Red arrows indicated vancomycin polar
localization. Blue arrows: diffused vancomycin staining Green arrow indicates a long cell. Scale
for (A), (C) and (D) 2 µm and (B), (E) and (F) 5 µm.
and the Δami1 strains. Cells from the mc2155 strain are approximately 4 to 8 µm in length
while cells from the Δami1 strain range between 6 to 12 µm in length, Figure 3.19D, G [II]
and G [IV], green arrow. Importantly this phenotype in the Δami1 mutant does revert back
to that seen in the mc2155 strain when the ami1 gene is reintroduced as illustrated by the
Δami1::pMVami1 confocal images, which appear more similar to the mc2155 strain than
I II
III IV
G
92
the Δami1 strain. This confirms that the observed increase in cell length was due to
deletion of ami1.These data reveal two possible roles for Ami1 in Msm namely, the
determination of cell size and correct localization of new PG synthesis.
In addition to confocal microscopy, SEM was also conducted on these strains to acquire a
high resolution image of the cell surface and to confirm the elongated phenotype of the
Δami1 cells. In addition, all three strains mentioned above were also subjected to
imipenem exposure before cells were prepared for SEM (section 2.8.2). Imipenem is a β-
lactam antibiotic, which is impervious to β-lactamase degradation (Livermore and
Woodford, 2000). This antibiotic acts by binding to the terminal D-alanine residues thus
preventing crosslinking leading to inhibition of PG crosslinking and growth (Livermore
and Woodford, 2000). A recent study demonstrated that the addition of sub-lethal levels of
meropenem (β-lactam antibiotic belonging to the same group as imipenem) to Mtb cultures
resulted in polar bulging of cells as a result of inhibited peptide crosslinking (Kumar et al.,
2012). Given the phenotypes observed with confocal microscopy, we reasoned that this
assay would help confirm the role of ami1 in polar PG synthesis in Msm.
SEM revealed a number of robust phenotypes, the first being chaining or filamentation of
cells in the Δami1 strain, see Figure 3.20 E-H, where a number of the cells display
filamentous growth, depicted by long filament consisting of cells joined together by
incomplete division septa, indicated by the blue arrows. These filaments consist of 3 to 8
cells and range from 5 to 20 µm in length. Non-polar bulging, or branching, was also
observed, depicted by the yellow arrow in Figure 3.20 G. Interestingly, there was a

93

94
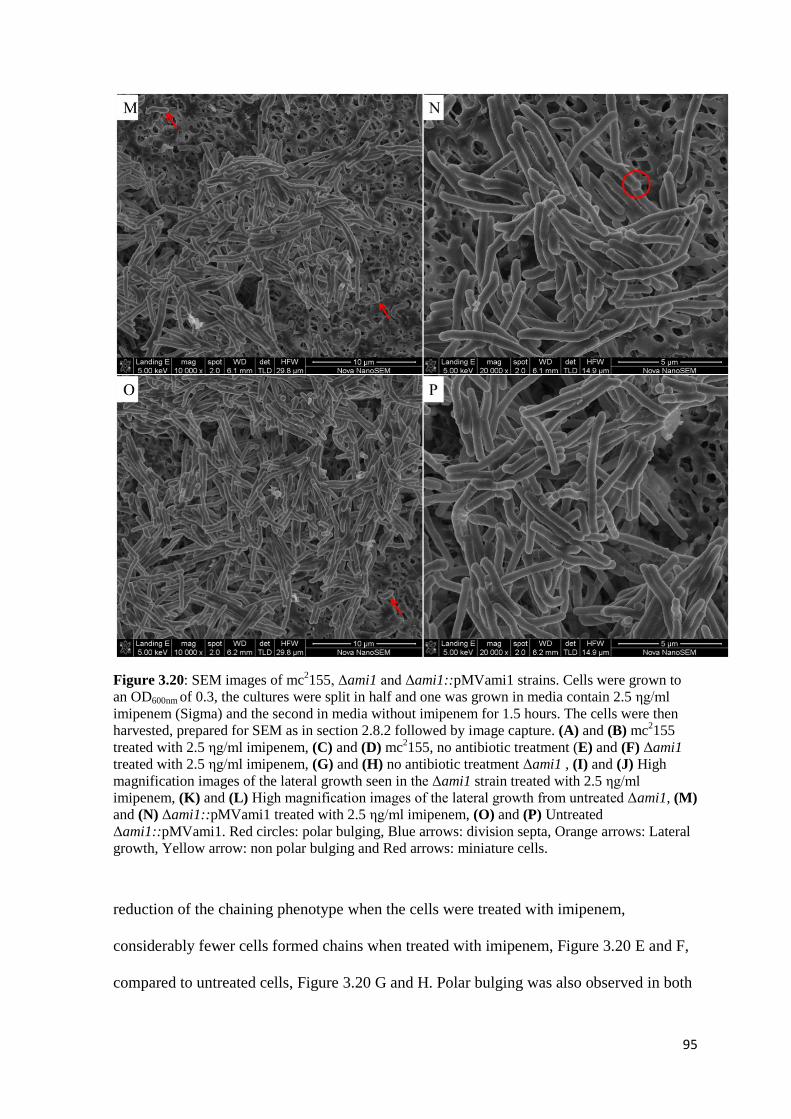
95
Figure 3.20: SEM images of mc2155, Δami1 and Δami1::pMVami1 strains. Cells were grown to
an OD600nm of 0.3, the cultures were split in half and one was grown in media contain 2.5 ηg/ml
imipenem (Sigma) and the second in media without imipenem for 1.5 hours. The cells were then
harvested, prepared for SEM as in section 2.8.2 followed by image capture. (A) and (B) mc2155
treated with 2.5 ηg/ml imipenem, (C) and (D) mc2155, no antibiotic treatment (E) and (F) Δami1
treated with 2.5 ηg/ml imipenem, (G) and (H) no antibiotic treatment Δami1 , (I) and (J) High
magnification images of the lateral growth seen in the Δami1 strain treated with 2.5 ηg/ml
imipenem, (K) and (L) High magnification images of the lateral growth from untreated Δami1, (M)
and (N) Δami1::pMVami1 treated with 2.5 ηg/ml imipenem, (O) and (P) Untreated
Δami1::pMVami1. Red circles: polar bulging, Blue arrows: division septa, Orange arrows: Lateral
growth, Yellow arrow: non polar bulging and Red arrows: miniature cells.
reduction of the chaining phenotype when the cells were treated with imipenem,
considerably fewer cells formed chains when treated with imipenem, Figure 3.20 E and F,
compared to untreated cells, Figure 3.20 G and H. Polar bulging was also observed in both
96
the wild type and Δami1::pMVami1 strains when subjected to imipenem exposure,
depicted by Figure 3.20B and D, consistent with the result observed by Kumar et. al.
(2012) this phenotype however was not evident in the Δami1 strains shown by the lack of
polar bulging depicted in Figure 3.20E and F. A striking phenotype observed in the Δami1
treated and untreated samples was the formation of lateral buds that eventually form lateral
cells shown by the orange arrow in Figure 3.20 E to L. This lateral growth occurs both at
the poles and along the cell suggesting that there is some mis-regulation of cell growth and
placement of active polar growth in the ami1 mutant. All these observed phenotypes revert
back to that seen in the wild type strain when the ami1 gene is reintroduced as illustrated
by the Δami1::pMVami1 phenotype, Figure 3.20 M to P, confirming that these defects
were due to deletion of ami1. Of note, however, is the fact that the complemented strain
displayed the presence of miniature cells depicted by the red arrows, presumably through
aberrant expression or the fact that the complemented ami1 gene was not integrated at the
native locus.
To get better insight into the nature of the chaining phenotype TEM was conducted on
these strains. The main objective for employing this technique was to obtain cross-
sectional images of the cells and the septa. Upon observing the chaining phenotype with
SEM, we reasoned that this may be a result of the inability to form a full septum or
degrade the fully formed septum hence resulting in two distinct cells, which are unable to
detach from each other. Unlike SEM the cells were not subjected to imipenem exposure,
they were grown and prepared for TEM as in section 2.8.3 and images were taken, Figure
3.21.

97
Similar to that observed in the SEM images, the TEM data revealed the presence of
filamentous growth exhibited by the Δami1 strain, Figure 3.21 C and D, these cells appear
Figure 3.21: TEM images of the mc2155, Δami1 and Δami1::pMVami1 strains. (A) and (B)
mc2155, (C) and (D) Δami1, (E) and (F) Δami1::pMVami1. Blue arrows: Division septum, Orange
arrows: Lateral growth, and Red arrows: septation.
98
to contain fully formed septa and display the presence of lateral growth, which appears to
be a result of pressure applied by adjacent cells, preventing longitudinal extension, Figure
3.21 D. These phenotypes revert back to the mc2155 morphology when the ami1 gene is
reintroduced illustrated by the Δami1::pMVami1 phenotype, Figure 3.21 E to F. The
Δami1::pMVami1 strain also appears to divide properly as depicted by the septation event
illustrated by the red arrow, Figure 3.21F. The reversion of the phenotype in the wild type
strain confirms that these effects are due to loss of ami1.
Finally, these strains were also analyzed using AFM. This was conducted to determine
possible variations in surface structure between the strains.
AFM data revealed the surface Δami1 strain was irregular in nature, Figure 3.22 C, D and
E, showing variation in the width of a single cell ranging from 497 nm to 847 nm, a
phenomenon also represented by high peaks and low troughs in the 3 dimensional image.
Both the mc2155 and Δami1::pMVami1 strains are approximately 600 nm to 700 nm in
width, and unlike the mutant strain, the cell width of the cells appears to be the same along
the entire cell, Figure 3.22 A and F.
Collectively, these microscopic data reveal three major phenotypes, (I) Deletion of ami1
led to the formation of long filamentous cells consisting of 3 to 8 cells attached to each
other. (II) Deletion of ami1 resulted in the formation of lateral growth at both the internal
poles possibly as a result of the cell’s inability to grow in a longitudinal manner and at the
extreme poles. (III) Deletion of ami1 resulted in irregular cell width as depicted by AFM
data. In all cases the phenotypes reverted back to that seen in the mc2155 wild type strain
upon reintroduction of the ami1 gene in the complemented derivative. This confirms that
the defects observed, were due to loss of the ami1 gene.
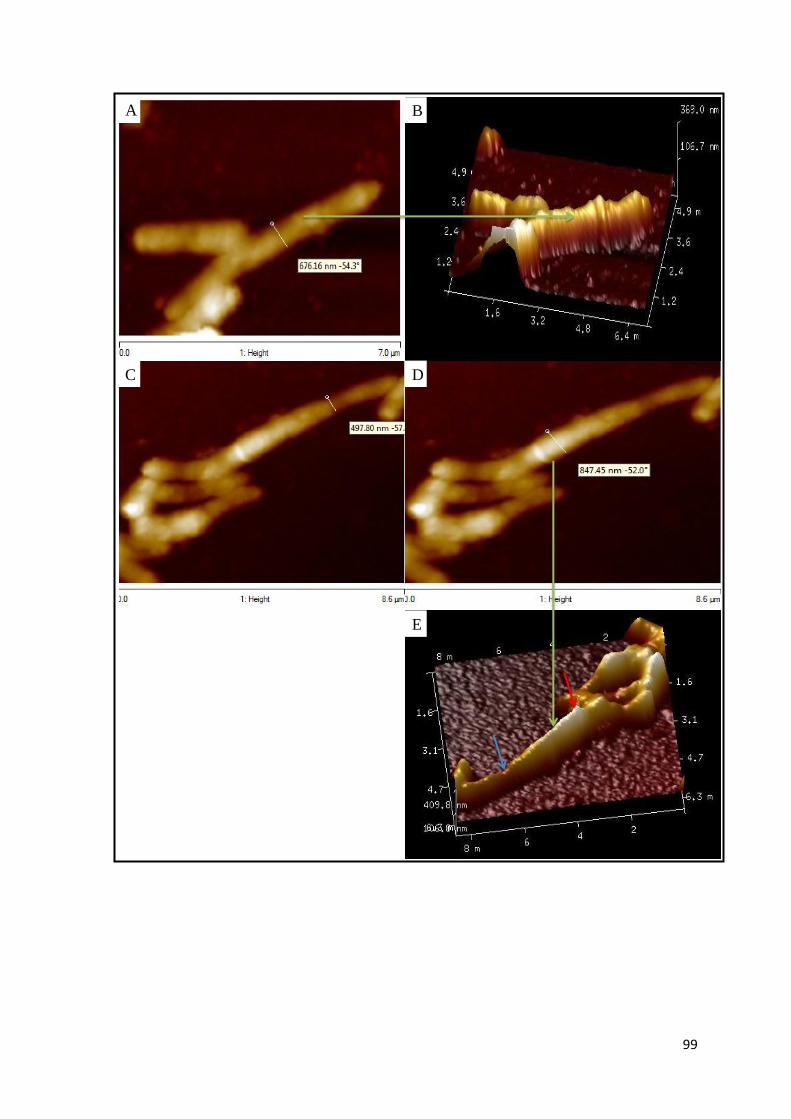
99
A
D
B
C
E

100
Figure 3.22: AFM images of the mc2155, Δami1 and Δami1::pMVami1 strains. (A), (C), (D) and
(F) 2 dimensional AFM height images, (B), (E) and (G) 3 dimensional AFM height images. (A)
and (B) mc2155 strain. (C), (D) and (E) Δami1, (F) and (G) Δami1::pMVami1. Green arrows:
Indicate the orientation of the 3 dimensional image, Blue arrows: low region, and Red arrows: high
peak.
3.6 The Role of Ami2 in cell growth
The second cell wall amidase evaluated in this study was ami2. Attempts to delete this
gene were not successful, suggesting that it was essential for growth. Hence we studied the
function of Ami2 through targeted gene depletion by creating a strain that allowed for
regulated ami2 expression in response to ATC.
3.6.1 Confirmation of regulated gene expression in the ami2 knockdown strain
Gene expression analysis was conducted to evaluate the responsiveness of the ami2
depletion strain to the ATC inducer. This was done to determine whether the absence or
presence of ATC led to significantly depleted or elevated levels of ami2 gene transcription.
The data revealed low level, stable expression of the ami2 gene, in the uninduced state
when the culture contained no ATC, Figure 3. 22. The culture containing 0.05 ηg/ml ATC
contained slightly higher levels of ami2 mRNA, which increased significantly after 9
hours.
F G

101
p<99 %
Figure 3.23: Expression analysis of ATC regulated gene expression. Shown is a bar graph
depicting the level of cellular ami2 mRNA (in relation to the sigA standard level) in the absence
and presence of ATC at 6 and 9 hours post induction. Error bars were determined using standard
deviation and student’s t-test was conducted using a confidence level of 99 % to determine
significance. Red text indicates mRNA fold increase from the respective uninduced state
The culture containing 50 ηg/ml ATC – that is with a higher concentration of inducer -
contained significantly higher ami2 mRNA levels at both 6 and 9 hours after induction,
Figure 3.23. These data confirm that the knockdown strain does allow for regulated gene
expression of ami2 in response to ATC. These data also show that the ami2 mRNA levels
are not completely abolished in the absence of ATC thus basal level expression does occur,
Figure 3.23, and this needs to be considered when assessing the phenotypes. The data also
shows that ami2 expression, 6 hours post induction, responds to ATC concentration
depicted by the ami2 mRNA fold increase relative to the uninduced state, Figure 3.23 (red
text). This regulatory effect appears to be lost 9 hours post induction as both the culture
containing 0.05 ηg/ml and 50 ηg/ml ATC appear to express ami2 mRNA at the same level,
Figure 3.23 (red text), suggesting escape from ATC regulation.
0
0.5
1
1.5
2
2.5
3
No ATC 6H 0.05 ηg/ml ATC 6H
50 ηg/ml ATC 6H No ATC 9H 0.05 ηg/ml ATC 9H
50 ηg/ml ATC 9H
Rel
ati
ve
Gen
e co
py
nu
mb
er
Sample
1.4
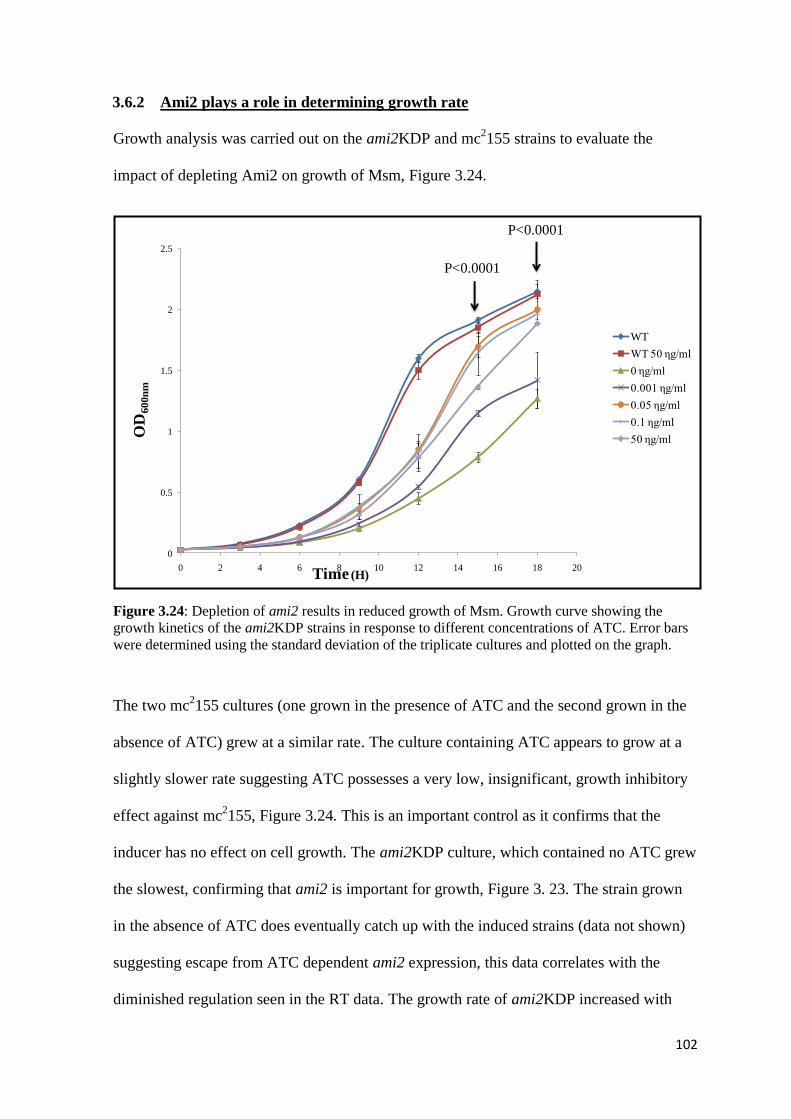
102
3.6.2 Ami2 plays a role in determining growth rate
Growth analysis was carried out on the ami2KDP and mc2155 strains to evaluate the
impact of depleting Ami2 on growth of Msm, Figure 3.24.
Figure 3.24: Depletion of ami2 results in reduced growth of Msm. Growth curve showing the
growth kinetics of the ami2KDP strains in response to different concentrations of ATC. Error bars
were determined using the standard deviation of the triplicate cultures and plotted on the graph.
The two mc2155 cultures (one grown in the presence of ATC and the second grown in the
absence of ATC) grew at a similar rate. The culture containing ATC appears to grow at a
slightly slower rate suggesting ATC possesses a very low, insignificant, growth inhibitory
effect against mc2155, Figure 3.24. This is an important control as it confirms that the
inducer has no effect on cell growth. The ami2KDP culture, which contained no ATC grew
the slowest, confirming that ami2 is important for growth, Figure 3. 23. The strain grown
in the absence of ATC does eventually catch up with the induced strains (data not shown)
suggesting escape from ATC dependent ami2 expression, this data correlates with the
diminished regulation seen in the RT data. The growth rate of ami2KDP increased with
0
0.5
1
1.5
2
2.5
0 2 4 6 8 10 12 14 16 18 20
WT
WT 50 ηg/ml
0 ηg/ml
0.001 ηg/ml
0.05 ηg/ml
0.1 ηg/ml
50 ηg/mlOD
60
0n
m
Time (H)
P<0.0001
P<0.0001
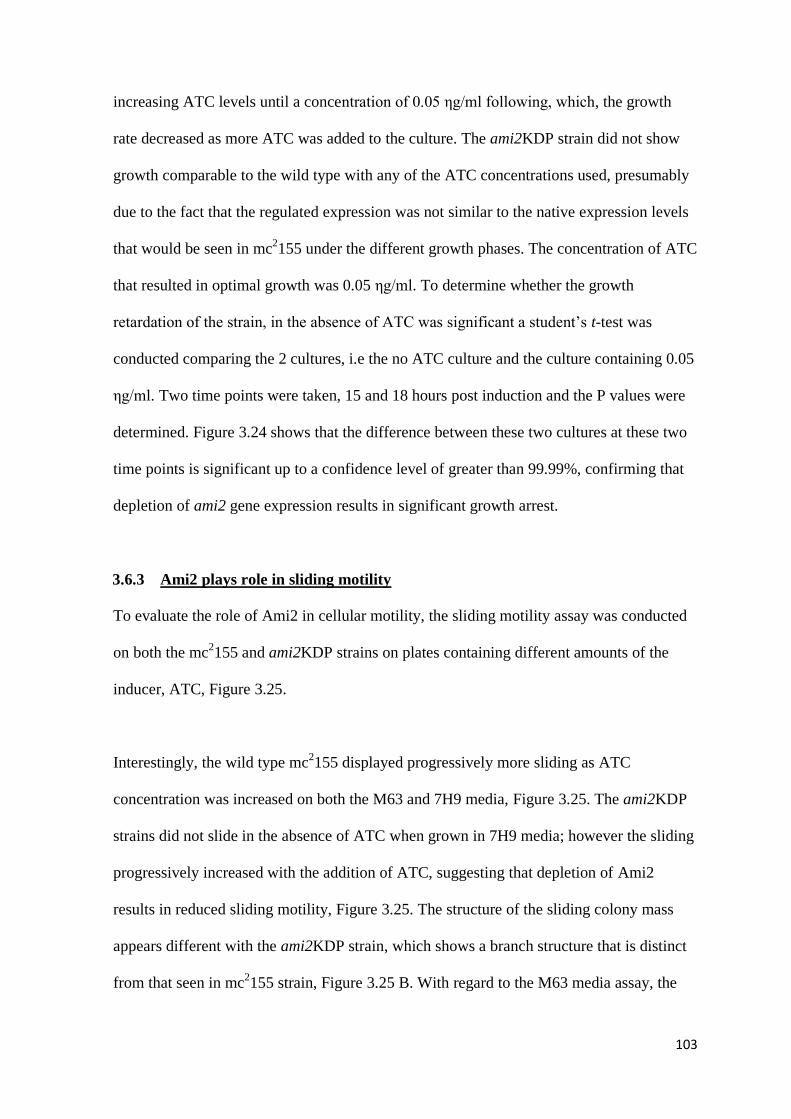
103
increasing ATC levels until a concentration of 0.05 ηg/ml following, which, the growth
rate decreased as more ATC was added to the culture. The ami2KDP strain did not show
growth comparable to the wild type with any of the ATC concentrations used, presumably
due to the fact that the regulated expression was not similar to the native expression levels
that would be seen in mc2155 under the different growth phases. The concentration of ATC
that resulted in optimal growth was 0.05 ηg/ml. To determine whether the growth
retardation of the strain, in the absence of ATC was significant a student’s t-test was
conducted comparing the 2 cultures, i.e the no ATC culture and the culture containing 0.05
ηg/ml. Two time points were taken, 15 and 18 hours post induction and the P values were
determined. Figure 3.24 shows that the difference between these two cultures at these two
time points is significant up to a confidence level of greater than 99.99%, confirming that
depletion of ami2 gene expression results in significant growth arrest.
3.6.3 Ami2 plays role in sliding motility
To evaluate the role of Ami2 in cellular motility, the sliding motility assay was conducted
on both the mc2155 and ami2KDP strains on plates containing different amounts of the
inducer, ATC, Figure 3.25.
Interestingly, the wild type mc2155 displayed progressively more sliding as ATC
concentration was increased on both the M63 and 7H9 media, Figure 3.25. The ami2KDP
strains did not slide in the absence of ATC when grown in 7H9 media; however the sliding
progressively increased with the addition of ATC, suggesting that depletion of Ami2
results in reduced sliding motility, Figure 3.25. The structure of the sliding colony mass
appears different with the ami2KDP strain, which shows a branch structure that is distinct
from that seen in mc2155 strain, Figure 3.25 B. With regard to the M63 media assay, the

104
ami2KDP strain displayed sliding in the absence of ATC however the sliding appeared to
be unstructured. At an ATC concentration of 0.05 ηg/ml the bacterial mass gains structural
integrity but does not slide significantly and at an ATC concentration of 50 ηg/ml the
sliding mass retains both structure and it also slides, Figure 3.25 A, confirming that ami2
gene expression is required for sliding motility.
Figure 3.25: Sliding motility assays with the ami2 depletion strains. Images show mc2155 and
ami2KDP strains sliding motility on 7H9 and M63 agar. (A) M63 media containing 0.3 % agar and
(B) 7H9 media containing 0.3 % agar.
A
0 ηg/ml 50 ηg/ml0.05 ηg/ml
ami2KDP
mc2155
ATC
concentration
B
0 ηg/ml 50 ηg/ml0.05 ηg/ml
ami2KDP
mc2155
ATC
concentration
105
3.6.4 Ami2 plays role in determining colony morphology
Cultures of the ami2 depleted strain were spotted onto solid media to determine if ami2
plays a role in colony morphology; the data are shown in Figure 3.26.
Figure 3.26: The impact of ami2 depletion on colony morphology. Images show ami2KDP
spotting assay on 7H10 agar. Top depicts ami2KDP colony morphology on agar supplemented with
0.05 ηg/ml ATC and bottom shows ami2KDP colony morphology on agar without ATC. Spots
represent dilution gradient of an OD = 0.8 Msm ami2KDP culture with dilution factors of 100, 10
1,
102, 10
3, 10
4, 10
5, 10
6, 10
7.
On solid media, the ami2KDP strain displayed two distinct morphologies in the presence
and absence of ATC. When ATC was removed, resulting in reduced ami2 expression, the
presence of miniature colonies, which appear to lack cording were observed, Figure 3.26.
These colonies were not observed in the presence of ATC and cording was substantially
increased suggesting that ami2 plays an important role in colony formation.
3.6.5 A role for Ami2 in determining cell morphology
SEM was conducted to get high-resolution images of the individual cells and bacterial cell
surface to evaluate the single cell impact of Ami2 depletion on bacterial growth. Cells
were prepared for SEM as in section 2.13.6, Figure 3.27. Reduced ami2 expression in the
absence of inducer resulted in the formation of miniature cells depicted by the blue arrows
in Figure 3.27D, the size range of these cells was between 2 µm and 7 µm as oppose to the
mc2155 cells, which were 4 µm to 8 µm in length. Cells grown in 0.05 ηg/ml (inducer
100 102101 105103 106 107104
0.05 ηg/ml
ATC
No ATC
106
106
concentration, which should relieve these phenotypes) were 3.5 µm to 8 µm long.
Depletion of ami2 (no ATC) results in the presence of large cellular bulges depicted by the
red arrows, Figure 3.27 C, these bulges were also observed in the culture containing
0.05 ηg/ml ATC, however the frequency was lower.
Further microscopic analysis was conducted on the ami2KDP strain utilizing confocal
microscopy, Figure 3.28.
Confocal microscopy with the ami2KDP strain confirmed the formation of miniature cells
in the absence of ATC indicated by the blue arrows on Figure 3.28, which correlates with
the SEM data. When grown in the presence of 50 ηg/ml ATC the strain exhibits the
presence of cells longer than the wild type mc2155 strains depicted by the orange arrows
suggesting that increased expression of ami2 in the presence of high concentrations of
inducer results in aberrant growth. Additionally, elevated expression of ami2 resulted in
loss of polar vancomycin staining, depicted in Figure 3.28 E and F (blue arrow), when
compared to both the wild type and the depleted strains, Figure 3.28 A, B, D and G [II]
(red arrow), which both retained polar vancomycin staining. This data implicates Ami2 in
the localization of new PG units to the growth poles and a possible role in the
determination of an active growth pole.

107
Figure 3.27: SEM images of the mc2155 and ami2KDP strains. (A) and (B) show the mc
2155
strain, (C) and (D) show the ami2KDP strain grown in the absence of ATC, (E) and (F) show the
ami2KDP strain grown in the presence of 0.05 ηg/ml ATC. Blue arrows: miniature cell, green
arrows: thick cells and Red arrows: cellular bulging.
A
D
B
C
E F

108
A
FE
DC
B

109
Figure 3.28: Confocal microscopy of the mc2155 and ami2KDP strains. Cultures were grown in
the absence of ATC and ami2KDP grown in media containing 50 ηg/ml ATC. (1) DAPI staining,
(2) fluorescent vancomycin, (3) Cellmask™ Orange and (4) overlay of all three stains. (A) and (B)
show the mc2155 strain, (C) and (D) show the ami2KDP strain grown in the absence of ATC and
(E) and (F) show the ami2KDP strain grown in media containing 50 ηg/ml. (G) High
magnification view of the images shown in (B) [I], (D) [II], (E) [IV] and (F) [III] overlay showing
reduction in cell size in the absence of ATC and the presence of longer cells when ATC is
reintroduced. Green arrows indicate miniature cells. Orange arrows indicate extended cells. Red
arrows indicate polar vancomycin staining. Blue arrows indicate defused Vancomycin staining.
Scale (A), (B) and (F) 2 µm, (C), (D) and (E) 1 µm
I II
III IV
G
110
4. Discussion
TB continues to threaten global health and has been a consistent source of human mortality
over the past century (Zhang, 2005). Rather than a decline in numbers, we are currently
faced with a staggering epidemic where one third of the world’s population harbours Mtb,
the majority of, which carry LTBI (Chao and Rubin, 2010, Barry et al., 2009). No other
disease today can boast this level of infiltration into its host population. The large reservoir
of latently infected individual stands as a clear and present threat to the future eradication
of TB (WHO, 2011).
Following the isolation of Mtb in the late 1800 s, a plethora of drugs have been evaluated
for anti-tubercular activity however, the highly impervious nature of the cell envelope
coupled with the inherent requirement for cytoplasmic entrance has limited the range of
antimicrobials that can be used against the tubercle bacillus (WHO, 2011, Hett and Rubin,
2008). Despite these restrictions, a number of anti-tubercular drugs were discovered and
used successfully for decades until the emergence of drug resistant Mtb strains (WHO,
2011). These troubling factors have regressed human kind to a point where effective
treatment of TB is an enigma (WHO, 2011).
Under these circumstances, there is a dire need for new TB drugs with novel modes of
action. In this context, mycobacterial PG holds promise for numerous reasons; (I) It is a
bacterial specific structure, which could reduce drug toxicity, (II) It is required for bacterial
survival and disruption of this structure will lead to cell death or increased bacterial
permeability, (III) There are a large number of enzymes associated with PG synthesis and
degradation, which provides a fertile mining ground for drug discovery and (IV) PG is a
periplasmic structure thus drugs that target this structure do not need to traverse an

111
additional layer of the cell wall (Tripathi et al., 2005, Vollmer et al., 2008, Hett and Rubin,
2008). However, like many aspects of Mtb physiology that have potential for drug
development, very little is known about PG synthesis and remodelling. The cytoplasmic
components of PG synthesis have reduced potential for drug development since chemical
agents would still need to traverse the entire cell wall to achieve significant target
vulnerability. The potential of the PG hydrolysing enzymes as possible drug targets is yet
to be thoroughly investigated. This gap in mycobacterial research forms part of the
underlying theme of this MSc, which is aimed at characterizing cell wall amidases in an
attempt to not only understand the importance of these enzymes to mycobacterial
dormancy and physiology, but also to validate them as a legitimate target for drug
discovery.
In this MSc study, we report the characterization of two mycobacterial cell wall amidases
in Msm by assessing the phenotypic variations observed in Msm growth and cell division,
derived from assessing either amidase gene deletion or gene depletion strains. Both Msm
and Mtb encode three cell wall amidases designated Ami1, Ami2 and Ami3.Ami1 and
Ami2 are both amidase_3 domain containing amidases, which show structural homology to
the E. coli AmiA and AmiC respectively. Both these E. coli counterparts are periplasmic
enzymes, exported from the cytoplasm through the use of the Twin-Arginine Translocation
(tat) system (Bernhardt and de Boer, 2003). In Msm, we hypothesize a similar mechanism
of translocation exists since the genome encodes a tat-like transporter system and Ami1
possesses a signal peptide at the N-terminus, suggesting possible translocation of the
enzyme from the cytoplasm to the mycobacterial periplasmic region (McDonough et al.,
2005, McDonough et al., 2008). Ami2 does not possess a signal peptide suggesting its
localization is cytoplasmic in nature. Mycobacteria however, contain multiple exported
112
proteins, which do not have the classic signal peptide sequences, suggesting the presence
of alternate translocation mechanisms, which have not been fully characterized as yet (de
Souza et al., 2011). These data indicate that Ami2 could still function as a periplasmic
amidase. Ami1 and Ami2 both retain the conserved residues shown to be essential for
catalytic activity in the B. subtilis CwlC. This suggests they have the capacity to function
as cell wall amidases (Mesnagi and Fouet, 2002). Furthermore, our bioinformatics analysis
confirms that these two mycobacterial amidases possess all the structural traits necessary
for cell wall amidase activity. Ami3 is an amidase_2 domain containing enzyme, which
shares homology to AmiD. Ami3 also possesses the necessary secondary structures
required for cell wall amidase activity however; our sequence alignments reveal a
substitution of the catalytic residue to an amino acid with different structural and chemical
properties. This calls into question the functionality of Ami3 in PG degradation and based
on this, we did not evaluate Ami3 further in this study and focused our efforts on
characterizing Ami1 and Ami2.
Loss of Ami1 resulted in no significant defects in bacterial growth rate or survival
confirming that this amidase was not essential for bacterial growth and survival in vitro.
This corroborated previous findings from a forward genetic screen that demonstrated that
the Mtb homologue of Ami1 was not essential for growth in vitro (Sassetti et al., 2003).
However, the formation of filamentous/chaining growth indicates a possible role for Ami1
during septation, a role that cannot be substituted by the remaining amidase-gene
complement in the organism. Research conducted in multiple organisms including both rod
and coccus shaped organisms have pointed to the importance of cell wall amidases in
bacterial cell division depicted by the inability to degrade the septum resulting in the
formation of filaments consisting of multiple cells. Deletion of amiA, amiB and amiC in

113
E. coli resulted in the formation of filaments consisting of 6 to 20 cells (Heidrich et al.,
2001). Deletion of one amidase from B. subtilis (which generally forms chains) resulted in
even longer chains (Blackman et al., 1998). The deletion of a single amidase in Neisseria
gonorrhoeae, a coccus shaped organisms, resulted in the formation of bacterial masses
consisting of multiple cells attached to each other by the cell wall due to the inability to
complete septation (Garcia and Dillard, 2006). We observed similar phenotypes with our
ami1 deletion mutant, confirming that just like the other counterparts, Ami1 plays a crucial
role in bacterial cell division. Saturating transposon mutagenesis in Mtb has confirmed that
whilst being dispensable for growth in vitro, Ami1 plays an essential role in Mtb survival
during infection as depicted by the inability of a rv3717 mutant of Mtb to establish an
infection in C57BL_6J mice (Sassetti and Rubin, 2003).
Despite numerous attempts and screening 70 putative knockout clones, an ami2 deletion
strain could not be generated by allelic exchange, suggesting that this gene is essential for
in vitro growth. This result is consistent with the observation that the Mtb ami2 counterpart
(Rv3915) is predicted to be essential for bacterial growth in vitro as determined by
saturating transposon gene disruption (Sassetti et al., 2003). Thus a knockdown strain was
generated to evaluate the effects of ami2 gene depletion on bacterial physiology.
Depletion of ami2 expression resulted in retarded growth rate but this effect is
progressively lost over time in culture, presumably through second-site mutations that
alleviate the repression of the ami2. This phenotype was unanticipated; one would expect
growth inhibition with the repressed strains, which would be consistent with the apparent
essentiality of ami2 for growth in vitro. Most certainly, gene knockdown of other essential
genes studied in our laboratory results in almost complete inhibition of growth such as the

114
effects observed with panC depletion (Abrahams et al., 2012). There are two possible
reasons for these observations: (I) Compensatory mutations in the ATC operator resulting
in abrogation of ATC regulation or (II) Our use of a perfect prokaryotic RBS in depletion
construct, which would result in leaky translation even with a reduced level of transcript.
With regards to the first possibility, it is noteworthy that whilst expression analysis of the
knockdown strain confirmed reduced transcription at 6 hours, this inhibitory effect on
transcription of ami2 was partially abrogated after a further three hours (9 hours post
inoculation). This is shown by the fact that the levels of ami2 mRNA 6 hours post
induction were responsive to the concentration of the inducer. Addition of 50 ηg/ml ATC
resulted in higher levels of mRNA when compared to the 0.05 ηg/ml ATC sample
however, this regulatory effect was lost 9 hours post induction whereby both the 50 ηg/ml
and 0.05 ηg/ml samples contained roughly the same amount of ami2 mRNA suggesting the
strain is no longer responding the level of ATC but rather the presence of ATC, Figure
3.23. This suggests a progressive escape from the ATC regulation over time and may
explain the growth observed with the repressed strain. These data provide further
confirmation of the essentiality of ami2 since reduction in expression levels is not tolerated
well and rapid compensatory mutants occur to alleviate this.
In our study, we used a similar RBS as that used by (Abrahams et al., 2012) since this RBS
provided for efficient knockdown and subsequent depression of the panC gene – hence we
term this the panC RBS. However, if this RBS is significantly more efficient that the
native ami2 RBS, the resulting leaky translation could lead to higher levels of protein
synthesis than that obtained from the wild type level of mRNA transcription, without ATC
regulation. One way to avoid this problem would be to use the native ami2 RBS however,
the RBS is currently unknown and taking a mandatory number of nucleotides upstream the

115
transcriptional start site would not guarantee the inclusion of the native RBS. The native
RBS needs to be determined first. We are currently in the process of doing this.
Other knockdown systems may also be used to bypass the RBS limitation including a
system of mRNA silencing. This involves cloning an antisense copy of the gene of interest
downstream of an inducible transcriptional operator such as the ATC operator, resulting in
the expression of complementary RNA, which would bind to mRNA inhibiting ribosome
binding resulting in inhibition of mRNA translation (Good and Stach, 2011). Another
system recently reported is a merodiploid system, which involves introducing a second
copy of the gene of interest. This not only results in stable knockdown strains but also
conclusively proves gene essentiality (Pecsi et al., 2012).
Microscopic analysis of the Ami2 depletion strain revealed the presence of short, broad
cells, which contained globular bulges, Figure 3.26 and Figure 3.27. This amidase
associated phenotype was not anticipated mainly because amidase deletion in various
organisms lead to the formation of long filaments, this suggests that Ami2 might not be
crucial for cell division but plays an important role in the development of the cell and
correct placement of the pole. Of particular interest in this regard is the report of the
depletion of Wag31 in mycobacteria, which results in the formation of short, broad cells,
that contained globular bulges (Kang et al., 2008).
Wag31 is an essential protein shown to play a role in determining the growth of cell poles
and structural maintenance (Kang et al., 2008, Nguyen et al., 2007). Depletion of this
protein results in the formation of short cells, which contain globular bulges (similar to the
Ami2 depletion phenotype). Over expression lead to the formation of long, branched
filaments, similar to the Δami1 strain phenotype (Kang et al., 2008, Nguyen et al., 2007).
116
The resemblance between the two phenotypes suggests a possible interaction between
these two cell division proteins during growth and implicates Ami2 in structural
maintenance and possibly growth of the cell pole. A similar phenotype has been observed
in the Cyanobacterium glutamicum as a result of DivIVA (a Wag31 homologue) depletion,
in, which case the phenotype was rescued by the introduction of Wag31 (Hempel et al.,
2008).
Depletion of ami2 also resulted in defects in sliding motility and colony morphology.
Sliding motility is a form of passive bacterial motility, which involves pushing of cells at
the extremities as the bacterial population grows on solid media (Harshey, 2003). Though
passive, sliding motility is thought to be an essential part of tissue invasion in some
organisms (Harshey, 2003). Both sliding motility and colony morphology require a level of
communication between bacteria to form complex structures (Harshey, 2003, Ben Jacob et
al., 2004). The ami2 depletion strains displayed sliding in the absence of the inducer
however the morphology was characterized by weak structural integrity, and was very
distinct from that seen with the wild type strain suggesting that the cells could be moving
individually by simple diffusion through the media. Elevated expression of ami2 lead to
the formation of a sliding mass with structural integrity and efficient sliding on the surface
of the media. Colony defects noted with ami2 depletion included the formation of
miniature colonies devoid of any serpentine cording in the absence of the inducer, the
cording phenotype was observed when gene repression was relieved. Research done on the
nature of bacterial communities has shown the importance of regulated bacterial
communication in the formation of complex structures, thus it is worth exploring the
possibility that these phenotypes could be a result of miscommunication between bacteria
rather than bacterial structural defects (Ben Jacob et al., 2004). In this context, the bacterial

117
communication mechanisms discussed in section 1.5.4.1 are worthy of consideration as
amidase would play an important role in these phenomena. This is discussed further below.
PknA and PknB are eukaryotic like membrane associated Ser/Thr kinases, which have
been implicated in a number of bacterial processes. PknA is responsible for the
phosphorylation of a wide range of enzymes including: FtsZ -, which is essential for cell
division, MurC -, which is a D-alanine- D-alanine ligase required for PG synthesis and
Wag31 -, which is essential for cell shape maintenance and correct placement of cell poles
(Kang et al., 2005, Kang et al., 2008, Fiuza et al., 2008, Sureka et al., 2010, Nguyen et al.,
2007). PknB has been shown to play an essential role in the reactivation of dormant
Bacillus spores as a result of muropeptide binding to the outer membrane PASTA domains
leading to activation of the cytoplasmic kinase domain resulting in germination (Kang et
al., 2005, Shah et al., 2008). Overexpression of PknA and PknB result in morphological
defects that resemble the ami1 deletion and ami2 depletion phenotypes respectively (Kang
et al., 2005). Overexpression of the Mtb PknA results in the formation of long filaments,
which consist of multiple cells attached to each other, some of, which possess lateral
branches, whilst overexpression of PknB resulted in the formation of thick cells, which
contain bulges (Kang et al., 2005). However, the link between these related phenotypes
with Ami1 /Ami2 and PknA/PknB has yet to be fully unravelled. It has been shown that a
muropeptide (disaccharide tripeptide) is required PknB-mediated signalling (Shah et al.,
2008). It has also been shown that hydrolysis of the stem peptide results in abolished
signalling capacity (Shah et al., 2008). Consequently, cell wall amidases could act as
regulators of the PknB signalling pathway by hydrolysis of the stem peptide from the
muropeptide resulting in a defective signalling molecule (Shah et al., 2008).

118
Research conducted on the physiological role and activity of muropeptides has revealed the
importance of these molecules in the resuscitation of dormant Msm and Mtb cells
(Nikitushkin et al., 2013). A recent study confirmed that muropeptides have the capacity to
interact with the mycobacterial PknB through the periplasmic PASTA domain likely
resulting in the activation of PknB mediated signalling pathways (Mir et al., 2011). These
data indicate similarities between the Bacillus spore germination initiation mechanism and
resuscitation of dormant mycobacteria. The study conducted by Nikitushkin et al., (2013)
also showed the importance of environmental muropeptide concentration in resuscitation
of dormant mycobacteria, too little or too much muropeptide resulted in inhibition of
growth resumption. This was also observed in another study where excessive amounts of
synthetic muropeptide resulted in significantly less resuscitation of dormant Mtb when
compared to resuscitation of cells incubated in specialized conditioned media (Mir et al.,
2011). The importance of regulating the levels of environmental muropeptides suggests an
important role played by cell wall amidases in the efficient resuscitation of dormant
mycobacteria through the hydrolysis of excess signalling molecules.
Concluding remarks
The study reported in this MSc represents the first extensive characterization of two
mycobacterial cell wall amidases with the purpose of identifying the possible role of these
enzymes in bacterial growth. This study reveals an important role for Ami1 in bacterial cell
division, the determination of cell pole morphology and cell shape maintenance. We
further confirm the essentiality of Ami2 as well as a possible role for this enzyme in
bacterial growth and cell shape maintenance. Our knockdown studies are limited by the
fact that our gene depletion strain displayed notable growth in the absence of inducer,
119
suggesting that the essentiality of ami2 drives the emergence of mutants that have escaped
the gene regulation mechanism.
Future work involves studying these genes in Mtb. This would involve deletion of the ami1
gene in Mtb, proving the essentiality of ami2 and subsequent depletion of ami2 in Mtb
either by use of a different knockdown system or use of the native ribosomal binding site.
The phenotypic analyses conducted in this study will be applied to the Mtb strains to
determine whether the phenotypes remain the same, furthermore the necessity of ami1 for
the establishment of TB infection will be investigated by the infection of mice using the
Mtb Δami1 strain. The role of cell wall amidases in resuscitation of dormant Mtb will be
investigated by subjecting the mutant strain to a dormancy model followed by resuscitation
using different concentrations of muropeptides. Furthermore the purification and
crystallization of these amidases will be helpful to confirm their biochemical functions and
will allow for the rational development of new drugs. The essential nature of Ami2 for
growth and the importance of Ami1 for bacterial cell division identified in this study
introduces a previously unexplored class of mycobacterial enzymes as legitimate targets
for drug development. Furthermore their uncharacterized role in bacterial signalling and
communication offers a field of study, which could offer insight into mechanisms involved
the development of and reactivation from LTBI.

120
5. Appendices
5.1 Appendix A: Culture media
Luria-Bertani Agar (LA)
5g yeast extract, 10g tryptone, 10g NaCl, 1.5g agar, 1000 ml sdH2O
Luria-Bertani Broth (LB)
5g yeast extract, 10g tryptone, 10g NaCl, 1000 ml sdH20
2 × TY
10g yeast extract, 16g tryptone, 5g NaCl, 1000 ml sdH2O
M63
100 mM KH2PO4, 15 mM (NH4)2SO4, 1.7 µM FeSO4.7H2O, pH to 7.0 with KOH
Middlebrook 7H9
4.7 g Difco Middlebrook 7H9 powder, 2 ml glycerol, 900 ml dH2O, 10 ml 100X
glucose-salt, 2 ml Tween80
Middlebrook 7H10
19 g Difco Middlebrook 7H10 powder, 5 ml glycerol, 900 ml dH2O, 10 ml 100X
glucose-salt
Sauton’s minimal media (pH 7.2)
4 g asparagine, 0.5 g magnesium sulphate, 2 g citric acid, 0.5 g potassium
dihydrogenorthophosphate, 0.05 g ammonium ferric citrate, 48ml glycerol then sterilized
by filtration.
100 × Glucose-salt
Glucose salt 10 g glucose, 4.25 g NaCl, 500 ml dH2O
Tween80 (25 %)
10 ml Tween80 dissolved in 40 ml dH2O then sterilized by filtration
Sucrose (75 %)
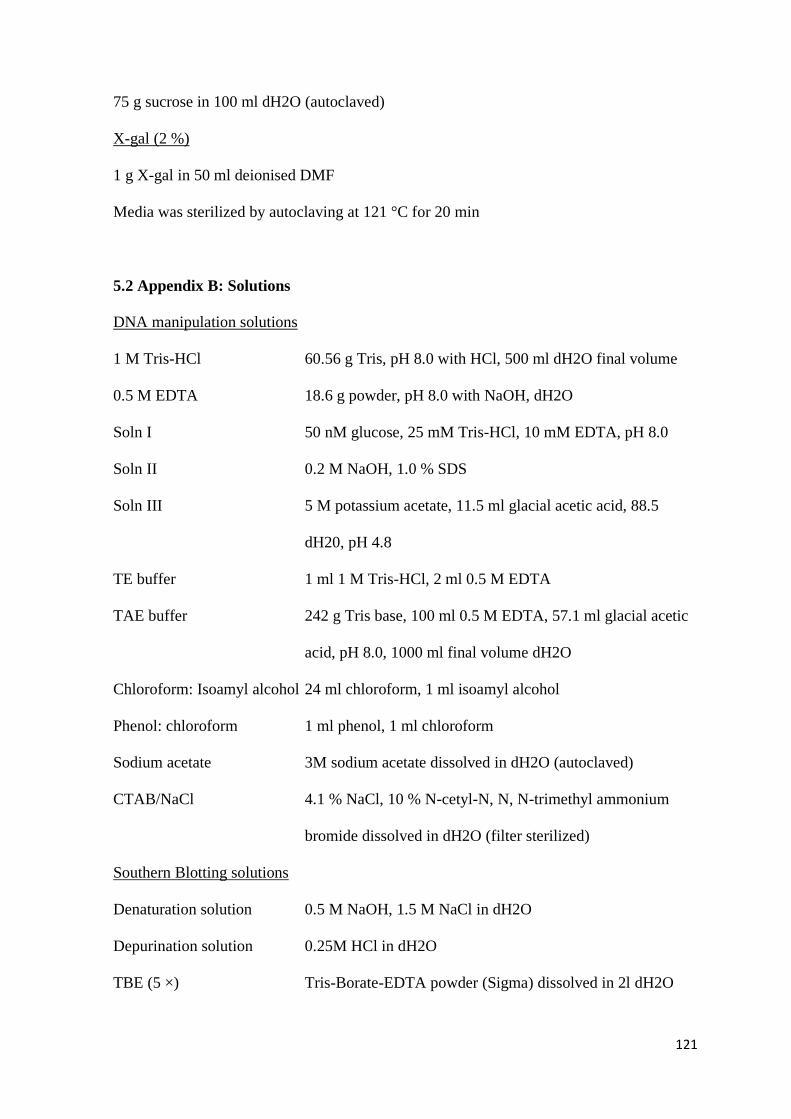
121
75 g sucrose in 100 ml dH2O (autoclaved)
X-gal (2 %)
1 g X-gal in 50 ml deionised DMF
Media was sterilized by autoclaving at 121 °C for 20 min
5.2 Appendix B: Solutions
DNA manipulation solutions
1 M Tris-HCl 60.56 g Tris, pH 8.0 with HCl, 500 ml dH2O final volume
0.5 M EDTA 18.6 g powder, pH 8.0 with NaOH, dH2O
Soln I 50 nM glucose, 25 mM Tris-HCl, 10 mM EDTA, pH 8.0
Soln II 0.2 M NaOH, 1.0 % SDS
Soln III 5 M potassium acetate, 11.5 ml glacial acetic acid, 88.5
dH20, pH 4.8
TE buffer 1 ml 1 M Tris-HCl, 2 ml 0.5 M EDTA
TAE buffer 242 g Tris base, 100 ml 0.5 M EDTA, 57.1 ml glacial acetic
acid, pH 8.0, 1000 ml final volume dH2O
Chloroform: Isoamyl alcohol 24 ml chloroform, 1 ml isoamyl alcohol
Phenol: chloroform 1 ml phenol, 1 ml chloroform
Sodium acetate 3M sodium acetate dissolved in dH2O (autoclaved)
CTAB/NaCl 4.1 % NaCl, 10 % N-cetyl-N, N, N-trimethyl ammonium
bromide dissolved in dH2O (filter sterilized)
Southern Blotting solutions
Denaturation solution 0.5 M NaOH, 1.5 M NaCl in dH2O
Depurination solution 0.25M HCl in dH2O
TBE (5 ×) Tris-Borate-EDTA powder (Sigma) dissolved in 2l dH2O
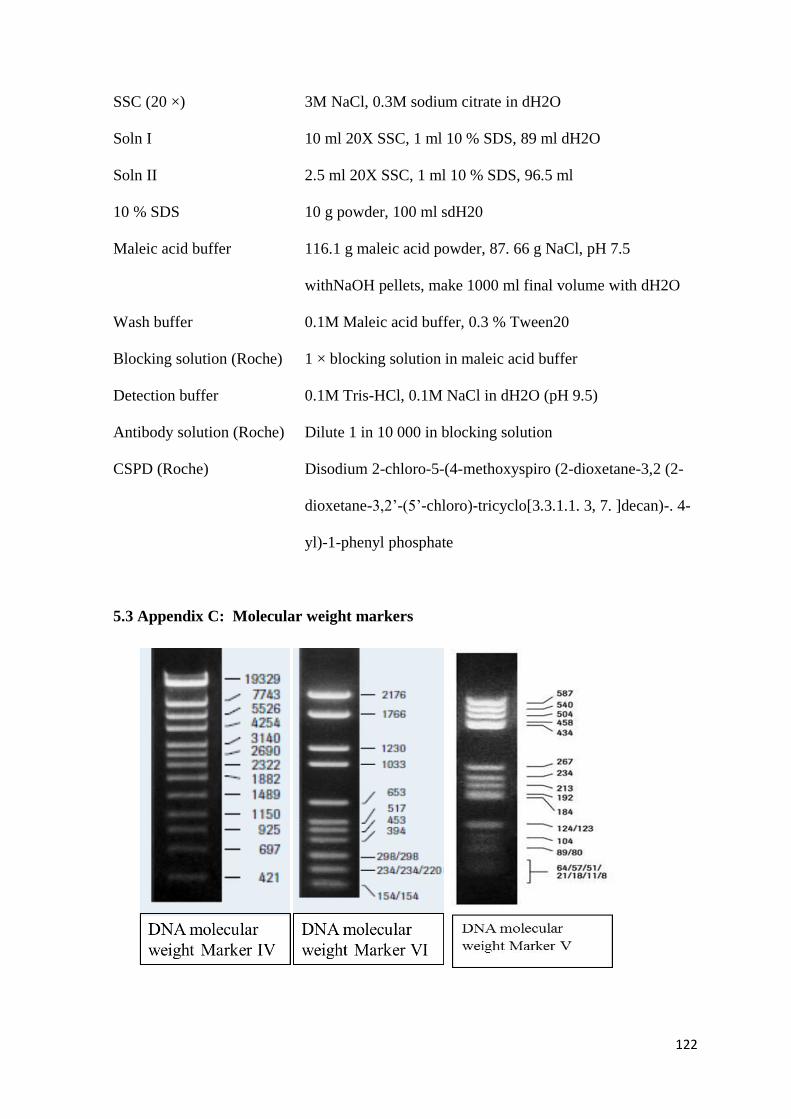
122
SSC (20 ×) 3M NaCl, 0.3M sodium citrate in dH2O
Soln I 10 ml 20X SSC, 1 ml 10 % SDS, 89 ml dH2O
Soln II 2.5 ml 20X SSC, 1 ml 10 % SDS, 96.5 ml
10 % SDS 10 g powder, 100 ml sdH20
Maleic acid buffer 116.1 g maleic acid powder, 87. 66 g NaCl, pH 7.5
withNaOH pellets, make 1000 ml final volume with dH2O
Wash buffer 0.1M Maleic acid buffer, 0.3 % Tween20
Blocking solution (Roche) 1 × blocking solution in maleic acid buffer
Detection buffer 0.1M Tris-HCl, 0.1M NaCl in dH2O (pH 9.5)
Antibody solution (Roche) Dilute 1 in 10 000 in blocking solution
CSPD (Roche) Disodium 2-chloro-5-(4-methoxyspiro (2-dioxetane-3,2 (2-
dioxetane-3,2’-(5’-chloro)-tricyclo[3.3.1.1. 3, 7. ]decan)-. 4-
yl)-1-phenyl phosphate
5.3 Appendix C: Molecular weight markers

123
5.4 Appendix D: Bioinformatic analysis
Figure D1: Pfam analysis of the three Mycobacterial amidases and their prospective E. coli
homologues
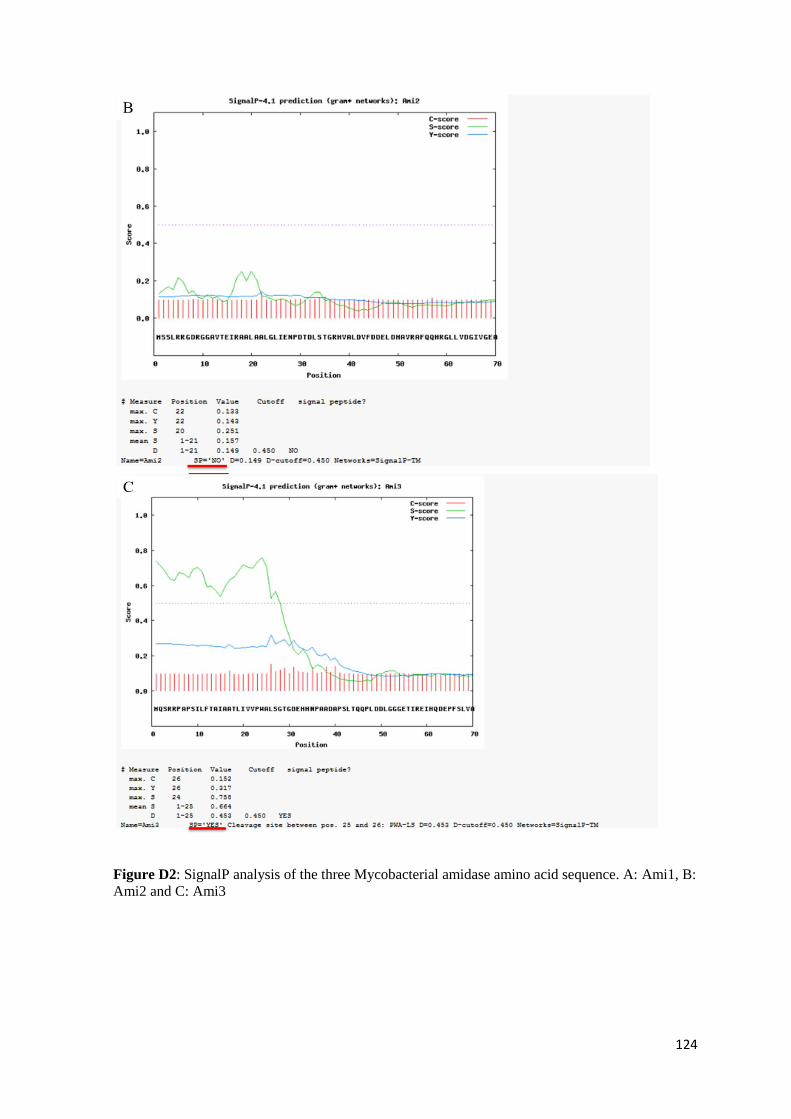
124
Figure D2: SignalP analysis of the three Mycobacterial amidase amino acid sequence. A: Ami1, B:
Ami2 and C: Ami3

125
Figure D3: chart containing amino acids structure and chemical properties.
(https://www.neb.com/tools-and-resources/usage-guidelines/amino-acid-structures).
Figure D4: Diagrammatic representation of the ami1 and ami2 alleles and their predicted
transcripts (www.Biocyc.com)
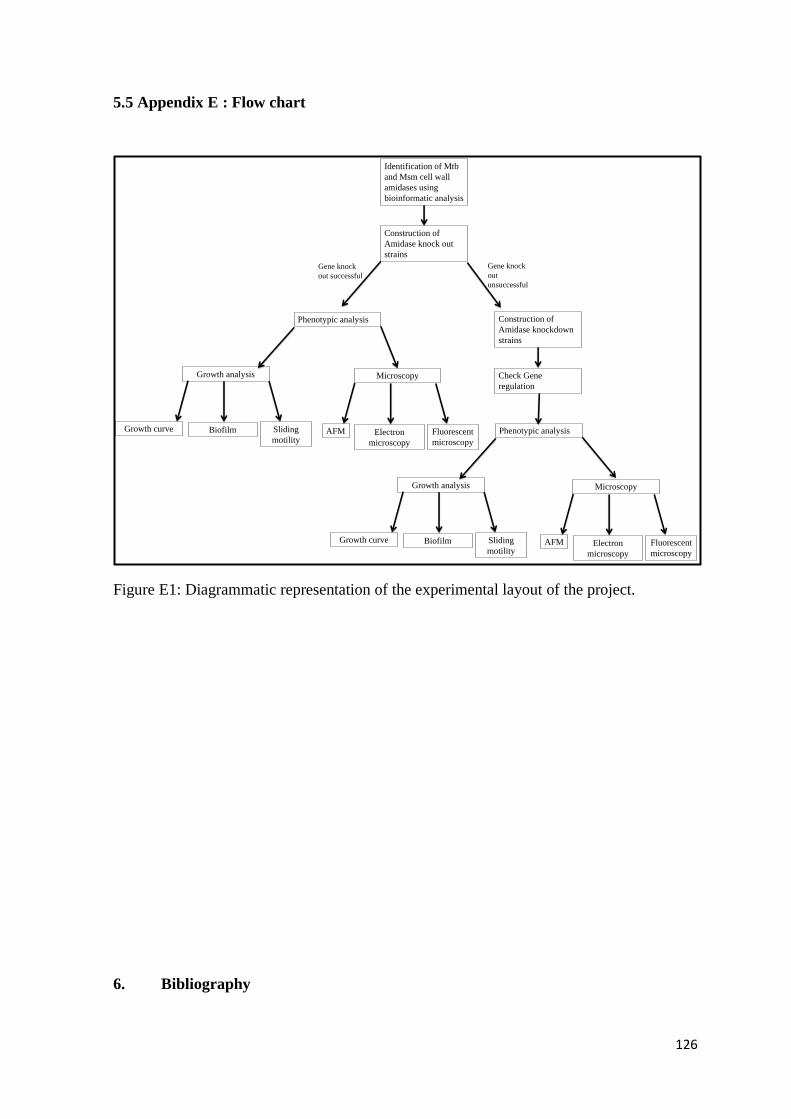
126
5.5 Appendix E : Flow chart
Figure E1: Diagrammatic representation of the experimental layout of the project.
6. Bibliography
Identification of Mtb
and Msm cell wall
amidases using
bioinformatic analysis
Construction of
Amidase knock out
strains
Phenotypic analysis
Gene knock
out successful
Construction of
Amidase knockdown
strains
Gene knock
out
unsuccessful
Growth analysis Microscopy Check Gene
regulation
Growth curve Biofilm Sliding
motilityAFM Electron
microscopy
Fluorescent
microscopy
Phenotypic analysis
Growth analysis Microscopy
Growth curve Biofilm Sliding
motilityAFM Electron
microscopy
Fluorescent
microscopy

127
Prevalence of the 23S rRNA A2058G point mutation and molecular subtypes in Treponema pallidum in the United States, 2007 to 2009. Sex Transm Dis, 39, 794-8.
ABRAHAMS, G. L., KUMAR, A., SAVVI, S., HUNG, A. W., WEN, S., ABELL, C., BARRY, C. E., 3RD, SHERMAN, D. R., BOSHOFF, H. I. & MIZRAHI, V. (2012) Pathway-selective sensitization of Mycobacterium tuberculosis for target-based whole-cell screening. Chem Biol, 19, 844-54.
ALDERWICK, L. J., BIRCH, H. L., MISHRA, A. K., EGGELING, L. & BESRA, G. S. (2007) Structure, function and biosynthesis of the Mycobacterium tuberculosis cell wall: arabinogalactan and lipoarabinomannan assembly with a view to discovering new drug targets. Biochem Soc Trans, 35, 1325-8.
BANERJEE, A., DUBNAU, E., QUEMARD, A., BALASUBRAMANIAN, V., UM, K. S., WILSON, T., COLLINS, D., DE LISLE, G. & JACOBS, W. R., JR. (1994) inhA, a gene encoding a target for isoniazid and ethionamide in Mycobacterium tuberculosis. Science, 263, 227-30.
BARNA, J. C. & WILLIAMS, D. H. (1984) The structure and mode of action of glycopeptide antibiotics of the vancomycin group. Annu Rev Microbiol, 38, 339-57.
BARRY, C. E., 3RD, BOSHOFF, H. I., DARTOIS, V., DICK, T., EHRT, S., FLYNN, J., SCHNAPPINGER, D., WILKINSON, R. J. & YOUNG, D. (2009) The spectrum of latent tuberculosis: rethinking the biology and intervention strategies. Nat Rev Microbiol, 7, 845-55.
BEN JACOB, E., BECKER, I., SHAPIRA, Y. & LEVINE, H. (2004) Bacterial linguistic communication and social intelligence. Trends Microbiol, 12, 366-72.
BERENDT, S., LEHNER, J., ZHANG, Y. V., RASSE, T. M., FORCHHAMMER, K. & MALDENER, I. (2012) Cell wall amidase AmiC1 is required for cellular communication and heterocyst development in the cyanobacterium Anabaena PCC 7120 but not for filament integrity. J Bacteriol, 194, 5218-27.
BERG, J. M., TYMOCZKO, J. L. & STRYER, L. (2007) Biochemistry, United States of America, Sara Tenney.
BERNHARDT, T. G. & DE BOER, P. A. (2003) The Escherichia coli amidase AmiC is a periplasmic septal ring component exported via the twin-arginine transport pathway. Mol Microbiol, 48, 1171-82.
BERRY, M. P., GRAHAM, C. M., MCNAB, F. W., XU, Z., BLOCH, S. A., ONI, T., WILKINSON, K. A., BANCHEREAU, R., SKINNER, J., WILKINSON, R. J., QUINN, C., BLANKENSHIP, D., DHAWAN, R., CUSH, J. J., MEJIAS, A., RAMILO, O., KON, O. M., PASCUAL, V., BANCHEREAU, J., CHAUSSABEL, D. & O'GARRA, A. (2010) An interferon-inducible neutrophil-driven blood transcriptional signature in human tuberculosis. Nature, 466, 973-7.
BESRA, G. S. & BRENNAN, P. J. (1997) The mycobacterial cell wall: biosynthesis of arabinogalactan and lipoarabinomannan. Biochem Soc Trans, 25, 845-50.
BIGGER, J. W. (1944) Treatment of Staphylococcal Innfections with Penicillin By Intermittent Sterilisation. The Lancet, 244, 497-500.
BIKETOV, S., MUKAMOLOVA, G. V., POTAPOV, V., GILENKOV, E., VOSTROKNUTOVA, G., KELL, D. B., YOUNG, M. & KAPRELYANTS, A. S. (2000) Culturability of Mycobacterium tuberculosis cells isolated from murine macrophages: a bacterial growth factor promotes recovery. FEMS Immunol Med Microbiol, 29, 233-40.
BLACKMAN, S. A., SMITH, T. J. & FOSTER, S. J. (1998) The role of autolysins during vegetative growth of Bacillus subtilis 168. Microbiology, 144 ( Pt 1), 73-82.
BOSHOFF, H. I. & BARRY, C. E., 3RD (2006) Is the mycobacterial cell wall a hopeless drug target for latent tuberculosis? Drug Discovery Today: Disease Mechanisms, 3, 237-245.
BOUHSS, A., TRUNKFIELD, A. E., BUGG, T. D. & MENGIN-LECREULX, D. (2008) The biosynthesis of peptidoglycan lipid-linked intermediates. FEMS Microbiol Rev, 32, 208-33.
BRAND, S., NIEHAUS, K., PUHLER, A. & KALINOWSKI, J. (2003) Identification and functional analysis of six mycolyltranferase genes of the Corynebacterium glutamicum ATCC 13032: the genes cop1, cmt1, and cmt2 can replace each other in the synthesis of trehalose dicorynomycolate, a component of the mycolic acid layer of the cell envelope. Arch Microbiol, 180, 33-44.

128
BUGG, T. D. H., WRIGHT, G. D., DUTKA-MALEN, S., ARTHUR, M., COURVALIN, P. & WALSH, C. (1991) Molecular basis of vancomycin resistance in Enterococcus faesium BM4147: biosynthesis of a depsipeptide peptidoglycan precursor by vancomycin resistance proteins VanH and VanA. Biochemistry, 30, 10408-10415.
CACERES, N. E., HARRIS, N. B., WELLEHAN, J. F., FENG, Z., KAPUR, V. & BARLETTA, R. G. (1997) Overexpression of the D-alanine racemase gene confers resistance to D-cycloserine in Mycobacterium smegmatis. Journal of Bacteriology, 179, 5046-5055.
CHAMBERS, H. F., MOREAU, D., YAJKO, D., MIICK, C., WAGNER, C., HACKBARTH, C., KOCAGOZ, S., ROSENBERG, E., HADLEY, W. K. & NIKAIDO, H. (1995) Can penicillins and other beta-lactam antibiotics be used to treat tuberculosis? Antimicrob Agents Chemother, 39, 2620-4.
CHAO, M. C. & RUBIN, E. J. (2010) Letting sleeping dos lie: does dormancy play a role in tuberculosis? Annu Rev Microbiol, 64, 293-311.
CHENG, X., ZHANG, X., PFLUGRATH, J. W. & STUDIER, F. W. (1994) The structure of bacteriophage T7 lysozyme, a zinc amidase and an inhibitor of T7 RNA polymerase. Proc Natl Acad Sci U S A, 91, 4034-8.
DAFFE, M., BRENNAN, P. J. & MCNEIL, M. (1990) Predominant structural features of the cell wall arabinogalactan of Mycobacterium tuberculosis as revealed through characterization of oligoglycosyl alditol fragments by gas chromatography/mass spectrometry and by 1H and 13C NMR analyses. J Biol Chem, 265, 6734-43.
DAFFE, M. & ETIENNE, G. (1999) The capsule of Mycobacterium tuberculosis and its implications for pathogenicity. Tuber Lung Dis, 79, 153-69.
DE SOUZA, G. A., LEVERSEN, N. A., MALEN, H. & WIKER, H. G. (2011) Bacterial proteins with cleaved or uncleaved signal peptides of the general secretory pathway. J Proteomics, 75, 502-10.
DRIKS, A. (2009) The Bacillus anthracis spore. Mol Aspects Med, 30, 368-73. EHLERT, K. & HOLTJE, J. V. (1996) Role of precursor translocation in coordination of murein and
phospholipid synthesis in Escherichia coli. J Bacteriol, 178, 6766-71. EHRT, S., GUO, X. V., HICKEY, C. M., RYOU, M., MONTELEONE, M., RILEY, L. W. & SCHNAPPINGER,
D. (2005) Controllong gene expression in mycobacteria with anhydrotetracycline and Tet repressor. Nucleic Acids Res, 33, e21.
FENG, Z. & BARLETTA, R. G. (2003) Roles of Mycobacterium smegmatis D-alanine:D-alanine ligase and D-alanine racemase in the mechanism of action of and resistance to the peptidoglycan inhibitor D-cycloserine. Antimicrob Agents Chemother, 47, 283-291.
FEUCHT, A., EVANS, L. & ERRINGTON, J. (2003) Identification of sporulation genes by genome-wide analysis of the sigmaE regulon of Bacillus subtilis. Microbiology, 149, 3023-34.
FIUZA, M., CANOVA, M. J., PATIN, D., LETEK, M., ZANELLA-CLEON, I., BECCHI, M., MATEOS, L. M., MENGIN-LECREULX, D., MOLLE, V. & GIL, J. A. (2008) The MurC ligase essential for peptidoglycan biosynthesis is regulated by the serine/threonine protein kinase PknA in Corynebacterium glutamicum. J Biol Chem, 283, 36553-63.
FLORES, A. R., PARSONS, L. M. & PAVELKA, M. S., JR. (2005) Genetic analysis of the beta-lactamases of Mycobacterium tuberculosis and Mycobacterium smegmatis and susceptibility to beta-lactam antibiotics. Microbiology, 151, 521-32.
FOSTER, S. J. (1991) Cloning, expression, sequence analysis and biochemical characterization of an autolytic amidase of Bacillus subtilis 168 trpC2. J Gen Microbiol, 137, 1987-98.
FU, L. M. & FU-LIU, C. S. (2002) Is Mycobacterium tuberculosis a closer relative to Gram-positive or Gram-negative bacterial pathogens? Tuberculosis (Edinb), 82, 85-90.
GARCIA, D. L. & DILLARD, J. P. (2006) AmiC functions as an N-acetylmuramyl-l-alanine amidase necessary for cell separation and can promote autolysis in Neisseria gonorrhoeae. J Bacteriol, 188, 7211-21.
GEFEN, O. & BALABAN, N. Q. (2009) The importance of being persistant: heterogenety of bacterial population under antibiotic stress. FEMS microbiology Reviews, 33, 704-717.
129
GEURTSEN, J., CHEDAMMI, S., MESTERS, J., COT, M., DRIESSEN, N. N., SAMBOU, T., KAKUTANI, R., UMMELS, R., MAASKANT, J., TAKATA, H., BABA, O., TERASHIMA, T., BOVIN, N., VANDENBROUCKE-GRAULS, C. M., NIGOU, J., PUZO, G., LEMASSU, A., DAFFE, M. & APPELMELK, B. J. (2009) Identification of mycobacterial alpha-glucan as a novel ligand for DC-SIGN: involvement of mycobacterial capsular polysaccharides in host immune modulation. J Immunol, 183, 5221-31.
GOOD, L. & STACH, J. E. (2011) Synthetic RNA silencing in bacteria - antimicrobial discovery and resistance breaking. Front Microbiol, 2, 185.
GORDHAN, B. G. & PARISH, T. (2001) Gene replacement using pre-treated DNA. Methods in Molecular Medicine, 54, 77-92.
HARSHEY, R. M. (2003) Bacterial motility on a surface: many ways to a common goal. Annu Rev Microbiol, 57, 249-73.
HEIDRICH, C., TEMPLIN, M. F., URSINUS, A., MERDANOVIC, M., BERGER, J., SCHWARZ, H., DE PEDRO, M. A. & HOLTJE, J. V. (2001) Involvement of N-acetylmuramyl-L-alanine amidases in cell separation and antibiotic-induced autolysis of Escherichia coli. Mol Microbiol, 41, 167-78.
HEIFETS, L. B. & CANGELOSI, G. A. (1999) Drug susceptibility testing of Mycobacterium tuberculosis: a neglected problem at the turn of the century. Int J Tuberc Lung Dis, 3, 564-81.
HEMPEL, A. M., WANG, S. B., LETEK, M., GIL, J. A. & FLARDH, K. (2008) Assemblies of DivIVA mark sites for hyphal branching and can establish new zones of cell wall growth in Streptomyces coelicolor. J Bacteriol, 190, 7579-83.
HETT, E. C. & RUBIN, E. J. (2008) Bacterial growth and cell division: a mycobacterial perspective. Microbiol Mol Biol Rev, 72, 126-56, table of contents.
HIGGINS, D. & DWORKIN, J. (2011) Recent progress in Bacillus subtilis sporulation. FEMS Microbiol Rev, 36, 131-48.
HOLTJE, J. V. (1996) Bacterial Lysozymes. EXS, 75, 65-74. HUGONNET, J. E. & BLANCHARD, J. S. (2007) Irreversible inhibition of the Mycobacterium
tuberculosis beta-lactamase by clavulanate. Biochemistry, 46, 11998-2004. HUGONNET, J. E., TREMBLAY, L. W., BOSHOFF, H. I., BARRY, C. E., 3RD & BLANCHARD, J. S. (2009)
Meropenem-Clavulanate Is Effective Against Extensively Drug-Resistant Mycobacterium tuberculosis. Science, 323, 1215-1218.
JACOBS, C., HUANG, L. J., BARTOWSKY, E., NORMARK, S. & PARK, J. T. (1994) Bacterial cell wall recycling provides cytosolic muropeptides as effectors for beta-lactamase induction. EMBO J, 13, 4684-94.
JOHNSON, R. E., STREICHER, E. M., LOUW, G. E., WARREN, R. M., VAN HELDEN, P. D. & VICTOR, T. C. (2003) Drug resistance in Mycbacterium tuberculosis. Current issues in Molecular Biology, 8, 97-112.
JORIS, B., DIVE, G., DIDEBERG, O., CHARLIER, P., FRERE, J. M. & GHUYSEN, J. M. (1982) Structure of a Zn2+containing D-alanyl-D-alanine cleavage Carboxypeptidase at 2.5 A resolution. Nature, 299, 469-470.
KANA, B. D., GORDHAN, B. G., DOWNING, K. J., SUNG, N., VOSTROKTUNOVA, G., MACHOWSKI, E. E., TSENOVA, L., YOUNG, M., KAPRELYANTS, A., KAPLAN, G. & MIZRAHI, V. (2008) The resuscitation-promoting factors of Mycobacterium tuberculosis are required for virulence and resuscitation from dormancy but are collectively dispensable for growth in vitro. Mol Microbiol, 67, 672-84.
KANA, B. D. & MIZRAHI, V. (2009) Resuscitation-promoting factors as lytic enzymes for bacterial growth and signaling. FEMS Immunol Med Microbiol, 58, 39-50.
KANA, B. D. & MIZRAHI, V. (2010) Resuscitation promoting factors in bacterial population dynamics during TB infection. Drug Discov Today: Dis Mech.
130
KANG, C. M., ABBOTT, D. W., PARK, S. T., DASCHER, C. C., CANTLEY, L. C. & HUSSON, R. N. (2005) The Mycobacterium tuberculosis serine/threonine kinases PknA and PknB: substrate identification and regulation of cell shape. Genes Dev, 19, 1692-704.
KANG, C. M., NYAYAPATHY, S., LEE, J. Y., SUH, J. W. & HUSSON, R. N. (2008) Wag31, a homologue of the cell division protein DivIVA, regulates growth, morphology and polar cell wall synthesis in mycobacteria. Microbiology, 154, 725-35.
KEEP, N. H., WARD, J. M., COHEN-GONSAUD, M. & HENDERSON, B. (2006) Wake up! Peptidoglycan lysis and bacterial non-growth states. Trends Microbiol, 14, 271-6.
KERFF, F., PETRELLA, S., MERCIER, F., SAUVAGE, E., HERMAN, R., PENNARTZ, A., ZERVOSEN, A., LUXEN, A., FRERE, J. M., JORIS, B. & CHARLIER, P. (2010) Specific structural features of the N-acetylmuramoyl-L-alanine amidase AmiD from Escherichia coli and mechanistic implications for enzymes of this family. J Mol Biol, 397, 249-59.
KIMERLING, M. E., KLUGE, H., VEZHNINA, N., IACOVAZZI, T., DEMEULENAERE, T., PORTAELS, F. & MATTHYS, F. (1999) Inadequacy of the current WHO re-treatment regimen in a central Siberian prison: treatment failure and MDR-TB. Int J Tuberc Lung Dis, 3, 451-3.
KORSAK, D., LIEBSCHER, S. & VOLLMER, W. (2005) Susceptibility to antibiotics and beta-lactamase induction in murein hydrolase mutants of Escherichia coli. Antimicrob Agents Chemother, 49, 1404-9.
KROGH, S., JORGENSEN, S. T. & DEVINE, K. M. (1998) Lysis genes of the Bacillus subtilis defective prophage PBSX. J Bacteriol, 180, 2110-2117.
KUMAR, P., ARORA, K., LLOYD, J. R., LEE, I. Y., NAIR, V., FISCHER, E., BOSHOFF, H. I. & BARRY, C. E., 3RD (2012) Meropenem inhibits D,D-carboxypeptidase activity in Mycobacterium tuberculosis. Mol Microbiol, 86, 367-81.
LAVOLLAY, M., ARTHUR, M., FOURGEAUD, M., DUBOST, L., MARIE, A., VEZIRIS, N., BLANOT, D., GUTMANN, L. & MAINARDI, J. L. (2008) The peptidoglycan of stationary-phase Mycobacterium tuberculosis predominantly contains cross-links generated by L,D-transpeptidation. J Bacteriol, 190, 4360-6.
LEE, W. B., KANG, J. S., YAN, J. J., LEE, M. S., JEON, B. Y., CHO, S. N. & KIM, Y. J. (2012) Neutrophils Promote Mycobacterial Trehalose Dimycolate-Induced Lung Inflammation via the Mincle Pathway. PLoS Pathog, 8, e1002614.
LIM, J. H., KIM, M. S., KIM, H. E., YANO, T., OSHIMA, Y., AGGARWAL, K., GOLDMAN, W. E., SILVERMAN, N., KURATA, S. & OH, B. H. (2006) Structural basis for preferential recognition of diaminopimelic acid-type peptidoglycan by a subset of peptidoglycan recognition proteins. J Biol Chem, 281, 8286-95.
LIVERMORE, D. M. & WOODFORD, N. (2000) Carbapenemases: a problem in waiting? Current Opinions in Microbiology, 3, 489-495.
LO, M. C., MEN, H., BRANSTROM, A., HELM, J., YAO, N., GOLDMAN, R. & WALKER, S. (2000) A new mechanism of action proposed for Ramoplanin. J Am Chem Soc, 122, 3540-3541.
MAHAPATRA, S., YAGI, T., BELISLE, J. T., ESPINOSA, B. J., HILL, P. J., MCNEIL, M. R., BRENNAN, P. J. & CRICK, D. C. (2005) Mycobacterial lipid II is composed of a complex mixture of modified muramyl and peptide moieties linked to decaprenyl phosphate. J Bacteriol, 187, 2747-57.
MARTINEZ, A., TORELLO, S. & KOLTER, R. (1999) Sliding Motility in Mycobacteria. J Bacteriol, 181, 7331-7338.
MCCALL, K. A., HUANG, C. & FIERKE, C. A. (2000) Function and mechanism of zinc metalloenzymes. J Nutr, 130, 1437S-46S.
MCDONOUGH, J. A., HACKER, K. E., FLORES, A. R., PAVELKA, M. S., JR. & BRAUNSTEIN, M. (2005) The twin-arginine translocation pathway of Mycobacterium smegmatis is functional and required for the export of mycobacterial beta-lactamases. J Bacteriol, 187, 7667-7679.
MCDONOUGH, J. A., MCCANN, J. R., TEKIPPE, E. M., SILVERMAN, J. S., RIGEL, N. W. & BRAUNSTEIN, M. (2008) Identification of functional Tat signal sequences in Mycobacterium tuberculosis proteins. J Bacteriol, 190, 6428-38.
131
MCKEEGAN, K. S., BORGES-WALMSLEY, M. I. & WALMSLEY, A. R. (2004) Structural understanding of efflux-mediated drug resistance: potential routes to efflux inhibition. Curr Opin Pharmacol, 4, 479-86.
MCNEIL, M., DAFFE, M. & BRENNAN, P. J. (1990) Evidence for the nature of the link between the arabinogalactan and peptidoglycan of mycobacterial cell walls. J Biol Chem, 265, 18200-6.
MEBERG, B. M., PAULSON, A. L., PRIYADARSHINI, R. & YOUNG, K. D. (2004) Endopeptidase penicillin-binding proteins 4 and 7 play auxiliary roles in determining uniform morphology of Escherichia coli. J Bacteriol, 186, 8326-36.
MELLROTH, P. & STEINER, H. (2006) PGRP-SB1: an N-acetylmuramoyl L-alanine amidase with antibacterial activity. Biochem Biophys Res Commun, 350, 994-9.
MESNAGI, S. & FOUET, A. (2002) Plasmid-Encoded Autolysin in Bacillus anthracis: modular structure and catalytic properties. J Bacteriol, 184, 331-334.
MILLER, C., THOMSEN, L. E., GAGGERO, C., MOSSERI, R., INGMER, H. & COHEN, S. N. (2004) SOS response induction by beta-lactams and bacterial defense against antibiotic lethality. Science, 305, 1629-31.
MIR, M., ASONG, J., LI, X., CARDOT, J., BOONS, G. J. & HUSSON, R. N. (2011) The extracytoplasmic domain of the Mycobacterium tuberculosis Ser/Thr kinase PknB binds specific muropeptides and is required for PknB localization. PLoS Pathog, 7, e1002182.
MISHRA, A. K., DRIESSEN, N. N., APPELMELK, B. J. & BESRA, G. S. (2011) Lipoarabinomannan and related glycoconjugates: structure, biogenesis and role in Mycobacterium tuberculosis physiology and host-pathogen interaction. FEMS Microbiol Rev, 35, 1126-57.
MITCHISON, D. A. (1998) How drug resistance emerges as a result of poor compliance during short course chemotherapy for tuberculosis. Int J Tuberc Lung Dis, 2, 10-5.
MOFFATT, B. A. & STUDIER, F. W. (1987) T7 lysozyme inhibits transcription by T7 RNA polymerase. Cell, 49, 221-7.
MUKAMOLOVA, G. V., KAPRELYANTS, A. S., YOUNG, D. I., YOUNG, M. & KELL, D. B. (1998) A bacterial cytokine. Proc Natl Acad Sci U S A, 95, 8916-21.
MUKAMOLOVA, G. V., MURZIN, A. G., SALINA, E. G., DEMINA, G. R., KELL, D. B., KAPRELYANTS, A. S. & YOUNG, M. (2006) Muralytic activity of Micrococcus luteus Rpf and its relationship to physiological activity in promoting bacterial growth and resuscitation. Mol Microbiol, 59, 84-98.
NACHEGA, J. B. & CHAISSON, R. E. (2003) Tuberculosis drug resistance: a global threat. Clin Infect Dis, 36, S24-30.
NEYROLLES, O. & GUILHOT, C. (2011) Recent advances in deciphering the contribution of Mycobacterium tuberculosis lipids to pathogenesis. Tuberculosis (Edinb), 91, 187-95.
NGUYEN, L., SCHERR, N., GATFIELD, J., WALBURGER, A., PIETERS, J. & THOMPSON, C. J. (2007) Antigen 84, an Effector of Pleiomorphism in Mycobacterium smegmatis. J Bacteriol, 189, 7869-7910.
NGUYEN, L. & THOMPSON, C. J. (2006) Foundations of antibiotic resistance in bacterial physiology: the mycobacterial paradigm. Trends Microbiol, 14, 304-12.
NIEDERWEIS, M., DANILCHANKA, O., HUFF, J., HOFFMANN, C. & ENGELHARDT, H. (2010) Mycobacterial outer membranes: in search of proteins. Trends Microbiol, 18, 109-16.
NIKITUSHKIN, V. D., DEMINA, G. R., SHLEEVA, M. O. & KAPRELYANTS, A. S. (2013) Peptidoglycan fragments stimulate resuscitation of "non-culturable" mycobacteria. Antonie Van Leeuwenhoek, 103, 37-46.
O'GAORA, P., BARNIN, S., HAYWARD, C., FILLEY, E., ROOK, G., YOUNG, D. & THOLE, J. (1997) Mycobacteria as immunogens: development of expression vectors for use in multiple mycobacterial species. Medical Principles and Practices 6, 91-96.
OJHA, A. K., BAUGHN, A. D., SAMBANDAN, D., HSU, T., TRIVELLI, X., GUERARDEL, Y., ALAHARI, A., KREMER, L., JACOBS, W. R., JR. & HATFULL, G. F. (2008) Growth of Mycobacterium tuberculosis biofilms containing free mycolic acids and harbouring drug-tolerant bacteria. Mol Microbiol, 69, 164-74.
132
OKEKE, I. N., KLUGMAN, K., P,, BHUTTA, Z. A., DUSE, A. G., JENKINS, P., O'BRIEN, T. F., PABLOS-MENDEZ. A & LAXMINARAYAN, R. (2005) Antimicrobial resistance in developing countries. Part II: strategies for containment. Lancet Infect Dis, 5, 568-580.
OLIVER, J. D. (2010) Recent findings on the viable but nonculturable state in pathogenic bacteria. FEMS Microbiol Rev, 34, 415-25.
PARISH, T. & STOKER, N. G. (2000) Use of a flexible cassette method to generate a double unmarked Mycobacterium tuberculosis tlyA plcABC mutant by gene replacement. Microbiology, 146 ( Pt 8), 1969-75.
PECSI, I., HIRMONDO, R., BROWN, A. C., LOPATA, A., PARISH, T., VERTESSY, B. G. & TOTH, J. (2012) The dUTPase enzyme is essential in Mycobacterium smegmatis. PLoS One, 7, e37461.
POPHAM, D. L., HELIN, J., COSTELLO, C. E. & SETLOW, P. (1996) Muramic lactam in peptidoglycan of Bacillus subtilis spores is required for spore outgrowth but not for spore dehydration or heat resistance. Proc Natl Acad Sci U S A, 93, 15405-10.
RAO, V., FUJIWARA, N., PORCELLI, S. A. & GLICKMAN, M. S. (2005) Mycobacterium tuberculosis controls host innate immune activation through cyclopropane modification of a glycolipid effector molecule. J Exp Med, 201, 535-43.
RASTOGI, N. & DAVID, H. L. (1988) Mechanisms of pathogenicity in mycobacteria. Biochimie, 70, 1101-20.
RASTOGI, N., FREHEL, C., RYTER, A., OHAYON, H., LESOURD, M. & DAVID, H. L. (1981) Multiple drug resistance in Mycobacterium avium: is the wall architecture responsible for exclusion of antimicrobial agents? Antimicrob Agents Chemother, 20, 666-77.
RECHT, J., MARTINEZ, A., TORELLO, S. & KOLLER, R. (2001) Sliding motility and biofilm formation in mycobacteria. Acta Cient Venez, 52, 45-49.
REYRAT, J. M., PELICIC, V., GICQUEL, B. & RAPPUOLI, R. (1998) Counterselectable markers: Untapped tolls for Bacterial Genetics and Pathogenesis. Infect Immun, 66, 4011-4017.
SASSETTI, C. M., BOYD, D. H. & RUBIN, E. J. (2003) gene required for mycobacterial growth defined by high density mutagenesis. Mol Microbiol, 48, 77-84.
SASSETTI, C. M. & RUBIN, E. J. (2003) Genetic requirements for mycobacterial survival during infection. Proc Natl Acad Sci U S A, 100, 12989-94.
SAT, B., HAZAN, R., FISHER, T., KHANER, H., GLASER, G. & ENGELBERG-KULKA, H. (2001) Programmed cell death in Escherichia coli: some antibiotics can trigger mazEF lethality. J Bacteriol, 183, 2041-5.
SAUVAGE, E., POWELL, A. J., HEILEMANN, J., JOSEPHINE, H. R., CHARLIER, P., DAVIES, C. & PRATT, R. F. (2008) Crystal structures of complexes of bacterial DD-peptidases with peptidoglycan-mimetic ligands: the substrate specificity puzzle. J Mol Biol, 381, 383-93.
SCANGA, C. A., MOHAN, V. P., JOSEPH, H., YU, K., CHAN, J. & FLYNN, J. L. (1999) Reactivation of latent tuberculosis: variations on the Cornell murine model. Infect Immun, 67, 4531-8.
SCHMIDT, J. W., GREENOUGH, A., BURNS, M., LUTERAN, A. E. & MCCAFFERTY, D. G. (2010) Generation of ramoplanin-resistant Staphylococcus aureus. FEMS Microbiol Lett, 310, 104-11.
SHAH, I. M., LAABERKI, M. H., POPHAM, D. L. & DWORKIN, J. (2008) A eukaryotic-like Ser/Thr kinase signals bacteria to exit dormancy in response to peptidoglycan fragments. Cell, 135, 486-96.
SHIDA, T., HATTORI, H., ISE, F. & SEKIGUCHI, J. (2001) Mutational analysis of catalytic sites of the cell wall lytic N-acetylmuramoyl-L-alanine amidases CwlC and CwlV. J Biol Chem, 276, 28140-6.
SHLEEVA, M., MUKAMOLOVA, G. V., YOUNG, M., WILLIAMS, H. D. & KAPRELYANTS, A. S. (2004) Formation of 'non-culturable' cells of Mycobacterium smegmatis in stationary phase in response to growth under suboptimal conditions and their Rpf-mediated resuscitation. Microbiology, 150, 1687-97.
SHLEEVA, M. O., BAGRAMYAN, K., TELKOV, M. V., MUKAMOLOVA, G. V., YOUNG, M., KELL, D. B. & KAPRELYANTS, A. S. (2002) Formation and resuscitation of "non-culturable" cells of
133
Rhodococcus rhodochrous and Mycobacterium tuberculosis in prolonged stationary phase. Microbiology, 148, 1581-91.
SILBERSTEIN, S. & INOUYE, M. (1975) Studies on the role of bacteriophage T7 lysozyme during phage infection. J Mol Biol, 96, 1-11.
SMITH, T. J., BLACKMAN, S. A. & FOSTER, S. J. (2000) Autolysins of Bacillus subtilis: multiple enzymes with multiple functions. Microbiology, 146 ( Pt 2), 249-62.
SNAPPER, S. B., MELTON, R. E., MUSTAFA, S., KEISER, T. & JACOBS JR, W. R., JR. (1990) Isolation and Characterization of efficient plasmid transformation mutants of Mycobactrium smegmatis. Mol Microbiol, 4, 1911-1919.
SOMNER, E. A. & REYNOLDS, P. E. (1990) Inhibition of peptidoglycan biosynthesis by ramoplanin. Antimicrob Agents Chemother, 34, 413-9.
STEINER, H. (2004) Peptidoglycan recognition proteins: on and off switches for innate immunity. Immunol Rev, 198, 83-96.
STORLA, D. G., YIMER, S. & BJUNE, G. A. (2008) A systematic review of delay in the diagnosis and treatment of tuberculosis. BMC Public Health, 8, 15.
STOVER, C. K., DE LA CRUZ, V. F., FUERST, T. R., BURLEIN, J. E., BENSON, L. A., BENNETT, L. T., BANSAL, G. P., YOUNG, J. F., LEE, M. H., HATFULL, G. F. & ET AL. (1991) New use of BCG for recombinant vaccines. Nature, 351, 456-60.
SUREKA, K., HOSSAIN, T., MUKHERJEE, P., CHATTERJEE, P., DATTA, P., KUNDU, M. & BASU, J. (2010) Novel role of phosphorylation-dependent interaction between FtsZ and FipA in mycobacterial cell division. PLoS One, 5, e8590.
THANKY, N. R., YOUNG, D. B. & ROBERTSON, B. D. (2006) Unusual features of the cell cycle in mycobacteria: Plar restricted growth and the snapping-model of cell division. Tuberculosis, 87, 231-236.
TRIPATHI, R. P., TEWARI, N., DWIVEDI, N. & TIWARI, V. K. (2005) Fighting tuberculosis: an old disease with new challenges. Med Res Rev, 25, 93-131.
UEHARA, T., DINH, T. & BERNHARDT, T. G. (2009) LytM-domain factors are required for daughter cell separation and rapid ampicillin-induced lysis in Escherichia coli. J Bacteriol, 191, 5094-107.
UEHARA, T. & PARK, J. T. (2007) An anhydro-N-acetylmuramyl-L-alanine amidase with broad specificity tethered to the outer membrane of Escherichia coli. J Bacteriol, 189, 5634-41.
UEHARA, T., PARZYCH, K. R., DINH, T. & BERNHARDT, T. G. (2010) Daughter cell separation is controlled by cytokinetic ring-activated cell wall hydrolysis. EMBO J, 29, 1412-22.
VAN RIE, A., PAGE-SHIPP, L., SCOTT, L., SANNE, I. & STEVENS, W. (2010) Xpert((R)) MTB/RIF for point-of-care diagnosis of TB in high-HIV burden, resource-limited countries: hype or hope? Expert Rev Mol Diagn, 10, 937-46.
VELAYATI, A. A., MASJEDI, M. R., FARNIA, P., TABARSI, P., GHANAVI, J., ZIAZARIFI, A. H. & HOFFNER, S. E. (2009) Emergence of new forms of totally drug-resistant tuberculosis bacilli: super extensively drug-resistant tuberculosis or totally drug-resistant strains in iran. Chest, 136, 420-5.
VOLLMER, W. (2012) Bacterial growth does require peptidoglycan hydrolases. Mol Microbiol, 86, 1031-1035.
VOLLMER, W., JORIS, B., CHARLIER, P. & FOSTER, S. (2008) Bacterial peptidoglycan (murein) hydrolases. FEMS Microbiol Rev, 32, 259-86.
WANG, X. & WOOD, T. K. (2011) Toxin-antitoxin systems influence biofilm and persister cell formation and the general stress response. Appl Environ Microbiol, 77, 5577-83.
WAXMAN, D. J. & STROMINGER, J. L. (1983) Penicillin-binding proteins and the mechanism of action of beta-lactam antibiotics. Annu Rev Biochem, 52, 825-69.
WAYNE, L. G. (1960) The bacteriology of respected tuberculous pulmonary lesions. 2. Observations on bacilli which are stainable but which cannot be cultured. Am Rev Respir Dis, 82, 370-7.
134
WAYNE, L. G. (1994) Dormancy of Mycobacterium tuberculosis and latency of disease. Eur J Clin Microbiol Infect Dis, 13, 908-14.
WEIGEL, L. M., CLEWELL, D. B., GILL, S. R., CLARK, N. C., MCDOUGAL, L. K., FLANNAGAN, S. E., KOLONAY, J. F., SHETTY, J., KILLGORE, G. E. & TENOVER, F. C. (2003) Genetic analysis of high-level Vancomycin-resistant isolate of Staphylococcus aureus. Science, 302, 1569-1571.
WERNER, T., LIU, G., KANG, D., EKENGREN, S., STEINER, H. & HULTMARK, D. (2000) A family of peptidoglycan recognition proteins in the fruit fly Drosophila melanogaster. Proc Natl Acad Sci U S A, 97, 13772-7.
WHO (2009) Global Tuberculosis control. WHO report 2009. WHO (2011) Global Tuberculosis Report. WHO Report 2011. YAGUI, M., PERALES, M. T., ASENCIOS, L., VERGARA, L., SUAREZ, C., YALE, G., SALAZAR, C.,
SAAVEDRA, M., SHIN, S., FERROUSIER, O. & CEGIELSKI, P. (2006) Timely diagnosis of MDR-TB under program conditions: is rapid drug susceptibility testing sufficient? Int J Tuberc Lung Dis, 10, 838-43.
YANG, D. C., TAN, K., JOACHIMIAK, A. & BERNHARDT, T. G. (2012) A conformational switch controls cell wall-remodelling enzymes required for bacterial cell division. Mol Microbiol, 85, 768-81.
ZHANG, Y. (2005) The magic bullets and tuberculosis drug targets. Annu Rev Pharmacol Toxicol, 45, 529-64.
ZHANG, Y., HEYM, B., ALLEN, B., YOUNG, D. & COLE, S. (1992) The catalase-peroxidase gene and isoniazid resistance of Mycobacterium tuberculosis. Nature, 358, 591-3.