Analysis of Multi-service Traffic in UMTS FDD Mode Networks
162
Department of Electrical and Higher Technical School of Computer Engineering Telecommunication Engineering Lisbon, Portugal Valencia, Spain Analysis of Multi-service Traffic in UMTS FDD Mode Networks Miguel Angel Caramés García Lisbon, Portugal May 2000
Transcript of Analysis of Multi-service Traffic in UMTS FDD Mode Networks

Department of Electrical and Higher Technical School of
Computer Engineering Telecommunication Engineering
Lisbon, Portugal Valencia, Spain
Analysis of Multi-service Traffic in UMTS FDD Mode
Networks
Miguel Angel Caramés García
Lisbon, Portugal
May 2000

i
Under the supervision of:
Luis M. Correia
Department of Electrical and Computer Engineering
Instituto Superior Tecnico
Technical University of Lisbon

ii

iii
"Read, every day, something no one else is reading. Think, every day, something
no one else is thinking. Do, every day, something no one else would be silly
enough to do. It is bad for the mind to continually be part of unanimity."
Christopher Morley

iv

v
Acknowledgements
When one is writing the acknowledgements always forgets someone important. I
would like to thank not only to all the persons that follow but also to all the friends that I
forget now but that I always bring in my heart.
Firstly, thanks to Professor Luis Correia for the kindness, for the motivation, for losing
his time making my life easier here in Lisbon, but overall because of the good advices that he
gave me during all this time.
Thanks to Mr. Fernando Velez for his help and for his patient in my bad humour
moments.
Thanks to D. Isabel and D. Olivia, because they always help you with a beautiful
smile.
Thanks to all the incredible people that I have known here in Lisbon: IST's Residence
partners (Cris, Bobs, Andrea, German, Maria, Helder,…), IST's handball team, Italo-Spanish
Community (Ana, Natalia, Francesca, Chiara, Genny, Jeroen, Rafa, Myriam, Mariajo,
Manuel,…), Basalto, Odette, Claudia, and my new two "irmaos": Felice and Manolo. I can't
find words to express how important you are for me.
Thanks to Lab's partners: Rui, Pedro, Zé, Miguel, João, Vitor, Cristina, Luca, Teresa,
Krzysztof, and specially to Hugo.
Thanks to Chiara Bedini, the world needs more Chiaras in order to run better.
Thanks to all of my friends in Spain, the old (Mon, Chiqui, Miguel, Jesus, J.Antonio,
Rocio, Julia, Zoë…) and the new ones (Vicent Miquel, Vanessa, Concha, Ximo, Irene,
Martin, Izaskun…).
Thanks to Zeina, my Javivi, for giving me the treasure of her friendship.
Thanks to Natalia and Christian my "third sister" and "second brother" respectively,
for your patient during 6 years of living together and for all the things we have shared.
Thanks to Lola, the most important person in my life and the best person I have ever
met.
Finally thanks to my family for giving me all the things I have enjoyed during my life
and all the love that one can imagine. I'm nothing without you. Specially thanks to Mª Carmen
and Manuel, my older sister and brother respectively, for sacrifying their own dreams to made
mine possible: this moment belongs more to them than to me.

vi
Agradecimientos
Cuando se escriben los agradecimientos siempre se corre el riesgo de olvidar a alguien
importante, desde aqui me gustaría expresar mi gratitud no sólo a todas las personas que están
aquí sino también a toda la gente que ahora olvido pero que siempre llevo en mi corazón.
En primer lugar gracias al Profesor Luis Correia por su amabilidad, su motivación, por
perder su tiempo facilitando mi vida en Lisboa, pero sobretodo por los valiosos consejos que
me ha dado durante todo este tiempo.
Gracias al Ingeniero Fernando Velez por su paciencia en mis momentos de mal
humor.
Gracias a D. Isabel y D. Olivia por su generosa ayuda.
Gracias a toda la gente increible que he conocido durante el Erasmus: los compañeros
de la residencia del IST (Cris, Bobs, Andrea, German, Maria, Helder,…), al equipo de
balonmano del IST, a la "comunidad italo-española (Ana, Natalia, Francesca, Chiara, Genny,
Jeroen, Rafa, Myriam, Mariajo, Manuel,…), Basalto, Odette, Claudia, and my new two
"irmaos": Felice and Manolo, no puedo encontrar palabras para expresar lo importantes que
sois para mi.
Gracias a los compañeros del laboratorio: Rui, Pedro, Ze, Miguel, João, Vitor,
Cristina, Luca, Teresa, Krzysztof, y especialmente a Hugo.
Gracias a Chiara Bedini, el mundo necesita mas Chiaras para funcionar mejor.
Gracias a todos mis amigos en España, los viejos (Mon, Chiqui, Miguel, Jesus,
J.Antonio, Rocio, Julia, Zoë,…) y los nuevos (Vicent Miquel, Vanessa, Concha, Ximo, Irene,
Martín, Izaskun,…)
Gracias a Zeina, mi Javivi, por brindarme el tesoro de su amistad.
Gracias a Natalia y Christian mi tercera hermana y segundo hermano respectivamente,
por su paciencia durante los 6 años en los que hemos vivido juntos y por todas las cosas que
hemos compartido.
Gracias a Lola, la persona más importante de mi vida y la mejor persona que nunca
conocí.
Finalmente gracias a mi familia por darme todas las cosas de las que he disfrutado
durante mi vida y por todo el amor que uno puede imaginar. Yo no soy nada sin vosotros.
Especialmente gracias a M. Carmen y Manuel, mis hermanos mayores, por sacrificar sus
propios sueños para hacer posibles los mios: estos momentos os pertenecen mas a vosotros
que a mi.

vii
Abstract
This report presents the development of an analytical model for teletraffic in the Universal
Mobile Telecommunications System (UMTS). A detailed study about UMTS is provided, as
well as a review of classical teletraffic models for voice, data, and multimedia networks. The
model was developed for the FDD mode, because it is the one that provides wide area
coverage and allows for terminal mobility, while the TDD mode is dedicated to hot spots and
indoor coverage. The work is focused in the downlink since the shared resource are the code
channels, or equivalently the channelisation codes, and their number is limited by the
interference level, while in the uplink there is no limitation in this sense since different
scrambling codes are used for each user.
The results of a previous system simulation were used in order to guarantee user satisfaction
requirements. Three scenarios were defined with different service mixtures. The first one will
be the most common in the FDD mode, where it is assumed a blocking probability threshold
of 2 %; 33 users can be simultaneously active when one carrier per cell is considered, while
74 users can communicate when 2 carriers are allocated to each cell. When the effect of
mobility is included one concludes that the number of simultaneous users in a cell reduces,
but keeps the same order of magnitude. The second and third scenarios show the impact of
including high bit rate services in the system. In the second one two carriers per cell should be
considered to allow to one user a service with a net rate equal to 320 kbit/s. The third one
shows that the system becomes unstable when 2 Mbit/s services are considered, and leads to
the conclusion that this service only will be possible in the TDD mode.
Finally, a comparison between voice+data services being provided over UMTS and
GSM/HSCSD networks is included. The number of active users being supported by the
UMTS is between 2 and 3 times higher than the one in GSM/HSCSD.
Keywords
UMTS. Traffic. Multirate services. FDD mode. Spectral efficiency.

viii

ix
Table of contents
ACKNOWLEDGEMENTS v
AGRADECIMIENTOS vi
ABSTRACT AND KEYWORDS vii
TABLE OF CONTENTS ix
LIST OF FIGURES xii
LIST OF TABLES xvi
LIST OF ACRONYMS xviii
LIST OF SYMBOLS xxi
1. INTRODUCTION 1
1.1. PERSONAL MOTIVATION 1
1.2. MOBILE COMMUNICATIONS TODAY 1
1.3. STRUCTURE OF THE REPORT 3
2. THE UNIVERSAL MOBILE TELECOMMUNICATIONS SYSTEM 5
2.1. INTRODUCTION 5
2.2. A BRIEF DESCRIPTION 6
2.2.1. Frequency Bands 6
2.2.2. Cell Structure 9
2.2.3. Users 10
2.2.4. Service Classes 11
2.2.5. Service Characteristics 12
2.2.6. Applications 14
2.3. TRAFFIC ASPECTS 15
2.3.1. Assumptions 15
2.3.2. Traffic Calculation 16
2.3.3. Traffic Charactistics 17
2.3.4. Asymmetry 17
2.3.5. Traffic Capacity Requirements 18
2.4. QUALITY OF SERVICE 19
2.4.1. Introduction 19
2.4.2. UMTS QoS Classes 19
2.4.3. UMTS Bearer Service Attributes 21
2.4.4. Ranges of UMTS Bearer Service Attributes 23
2.5. UMTS FORUM RECOMMENDATIONS 24
2.6. SOME CONCLUSIONS 25

x
3. THEORETICAL MODELS 27
3.1. INTRODUCTION 27
3.2. MODELS FOR SPEECH IN FIXED NETWORKS AND ITS APPLICATION TO MOBILE
COMMUNICATIONS 27
3.2.1. Introduction 27
3.2.2. Traffic Fundamentals 28
3.2.3. Lost-calls-cleared-systems 29
3.2.4. Delay systems 35
3.2.5. Application of fixed models in mobile communications 36
3.3. TRAFFIC FROM MOBILITY 37
3.3.1. Introduction 37
3.3.2. Handover prioritized model 37
3.4. MODELS FOR DATA IN FIXED NETWORKS 42
3.4.1. Introduction 42
3.4.2. Basic Concepts 43
3.4.3. Models 44
3.4.4. Other models 48
3.5. MODELS FOR MIXED TRAFFIC (VOICE AND DATA) 49
3.5.1. Introduction 49
3.5.2. The analytical model 50
3.5.3. Model Extensions 57
3.5.4. Other models 59
4. PERFORMANCE EVALUATION 63
4.1. INTRODUCTION 63
4.2. PROCEDURE'S FLOWCHART 63
4.3. DEFINITION OF THE SCENARIOS 66
4.3.1. Introduction 66
4.3.2. Services Description 67
4.3.3. System Simulation Results 68
4.3.4. Considered Scenarios 69
4.4. URBAN1 RESULTS 72
4.4.1. Introduction 72
4.4.2. One Carrier per Cell 72
4.4.3. Two Carriers per Cell 77
4.5. URBAN2 RESULTS 79
4.5.1. Introduction 79
4.5.2. One Carrier per Cell 80
4.5.3. Two Carriers per Cell 82
4.5.4. Three Carriers per Cell 85
4.6. URBAN3 RESULTS 86
4.6.1. Introduction 86
4.8. COMPARISON BETWEEN GSM/HSCSD AND UMTS 92
4.8.1. Introduction 92
4.8.2. Comparing Voice Services 93
4.8.3. Voice + Data Comparison 95
4.9. CONCLUSIONS 96

xi
5. CONCLUSIONS AND FUTURE WORK 99
5.1. INTRODUCTION 99
5.2. MODELS 100
5.3. SYSTEM PERFORMANCE EVALUATION 100
5.4. FUTURE WORK 102
ANNEXES 105
ANNEX A. UTRA-FDD 107
A.1. INTRODUCTION 107
A.2. A BRIEF DESCRIPTION 107
A.3. THE PHYSICAL LAYER 109
A.4. TRANSPORT CHANNELS MAPPING ONTO PHYSICAL CHANNELS 114
A.5. MAC AND RLC LAYERS 115
A.6. CONCLUSIONS 117
ANNEX B. MATHEMATICS AND ALGORITHM TESTS 119
B.1. INTRODUCTION 119
B.2. THE EQUILIBRIUM OCCUPANCY PMF/PDF FOR 1 RESOURCE 119
B.3. THE BLOCKING PROBABILITY RECURSION 120
B.4. TEST SIMULATIONS 120
ANNEX C. PROGRAM CODE 125
C.1. INTRODUCTION 125
C.2. TYPES AND VARIABLES 125
C.3. FUNCTIONS AND PROCEDURES 126
C.4. THE INPUT/OUTPUT PART 126
C.5. THE CODE 127
REFERENCES 135
List of Figures

xii
FIGURE 2.1. UMTS COVERAGE IS UNIVERSAL (EXTRACTED FROM [UMTS98A]). ....................... 6
FIGURE 2.2. FREQUENCY BANDS FOR IMT-2000 (EXTRACTED FROM [UMTS98A]). ................... 7
FIGURE 2.3. FREQUENCY ALLOCATION FOR THE FDD AND TDD MODES……………………....8
FIGURE 2.4. AN EXAMPLE OF HIERARCHICAL CELL STRUCTURE (EXTRACTED FROM
[UMTS98A]). ................................................................................................................... 10
FIGURE 2.5. CALCULATION METHOD FOR UMTS TRAFFIC AND SPECTRUM (EXTRACTED FROM
[UMTS98B]). .................................................................................................................... 16
FIGURE 3.1. BLOCKING PROBABILITY ACCORDING TO THE ERLANG-B MODEL. ......................... 30
FIGURE 3.2. BLOCKING PROBABILITY IN THE RANGE OF INTEREST (PB<10%) ACCORDING TO THE
ERLANG-B MODEL. ........................................................................................................... 30
FIGURE 3.3. BLOCKING PROBABILITY ACCORDING TO THE BERNOULLI MODEL. ........................ 32
FIGURE 3.4. BLOCKING PROBABILITY IN THE RANGE OF INTEREST (PB<10%) ACCORDING TO THE
BERNOULLI MODEL. .......................................................................................................... 32
FIGURE 3.5. ENGSET-B CHART WITH A POPULATION OF 60 SOURCES………………………….34
FIGURE 3.6. ENGSET-B CHART WITH A POPULATION OF 150 SOURCES. ...................................... 34
FIGURE 3.7. DELAY PROBABILITY ACCORDING TO THE ERLANG-C MODEL. ............................... 36
FIGURE 3.8. NEW AND HANDOVER TRAFFIC PROCESSES, TOTAL NUMBER OF CHANNELS (N), AND
GUARD CHANNELS (G) IN A CELL. (EXTRACTED FROM [JABB96]) ....................................... 38
FIGURE 3.9. THE EFFECT OF USING GUARD CHANNELS FOR HANDOVER IN PB. ........................... 40
FIGURE 3.10. THE EFFECT OF USING GUARD CHANNELS FOR HANDOVER IN PHF. ........................ 41
FIGURE 3.11. THE EFFECT OF USING GUARD CHANNELS FOR HANDOVER IN PD. ......................... 41
FIGURE 3.12. EFFECT OF SPEED AND GUARD CHANNELS IN PD. .................................................. 42
FIGURE 3.13. MODEL OF A SINGLE SERVER QUEUE. ................................................................... 44
FIGURE 3.14. AVERAGE WAITING TIME IN A M/M/1 SYSTEM CONSIDERING DIFFERENT UMTS
SERVICE COMPONENT CHARACTERISTICS. .......................................................................... 47
FIGURE 3.15. THE BLOCKING PROBABILITY AS A FUNCTION OF THE BUFFER SIZE IN A M/M/1
SYSTEM, ASSUMING SEVERAL LOAD FACTORS. .................................................................. 48
FIGURE 3.16. MODEL FOR APPLICATIONS ACTIVATION .………..…………………………….. 53
FIGURE 3.17. PROCEDURE TO OBTAIN THE NUMBER OF REQUESTED CODE-CHANNELS FOR EACH
APPLICATION CLASS……………………………………………………………………...53
FIGURE 4.1. SCHEMME OF THE MODEL………………………………………………………...64
FIGURE 4.2. FLOWCHART OF THE SYSTEM CAPACITY BLOCK………………………………….64
FIGURE 4.3. SCHEMME OF THE ALGORITHM MODULE…………………………………………65
FIGURE 4.4. ALGORITHM'S FLOWCHART…………………………...………………………….65

xiii
FIGURE 4.5. BLOCKING PROBABILITY FOR THE URBAN1 SCENARIO IN TERMS OF THE FRACTION
OF ACTIVE USERS ASSUMING 100 EXPECTED USERS……….……………………………...73
FIGURE 4.6. BLOCKING PROBABILITY FOR THE URBAN1 SCENARIO AS A FUNCTION OF THE
SYSTEM LOAD ASSUMING 100 EXPECTED USERS………………………………………….74
FIGURE 4.7. BLOCKING PROBABILITY FOR THE URBAN1 SCENARIO IN TERMS OF THE FRACTION
OF ACTIVE USERS ASSUMING 200 EXPECTED USERS….…………………………………...75
FIGURE 4.8. BLOCKING PROBABILITY FOR THE URBAN1 SCENARIO AS A FUNCTION OF THE
SYSTEM LOAD ASSUMING 200 EXPECTED USERS………………………………………….75
FIGURE 4.9. BLOCKING PROBABILITY FOR THE URBAN1 SCENARIO IN TERMS OF THE FRACTION
OF ACTIVE USERS ASSUMING 200 EXPECTED USERS (POISSON ARRIVALS ARE
CONSIDERED)…………………………………………………………………………….76
FIGURE 4.10. BLOCKING PROBABILITY FOR THE URBAN1 SCENARIO IN TERMS OF THE FRACTION
OF ACTIVE USERS COMPARING POISSON AND BERNOULLI , ASSUMING 200 EXPECTED USERS
…………………………………………………………………………………………...77
FIGURE 4.11. BLOCKING PROBABILITY FOR THE URBAN1 SCENARIO IN TERMS OF THE FRACTION
OF ACTIVE USERS WITH TWO CARRIERS PER CELL, ASSUMING 100 EXPECTED
USERS……………………………………………………………………… .…………..78
FIGURE 4.12. BLOCKING PROBABILITY FOR THE URBAN1 SCENARIO AS A FUNCTION OF THE
SYSTEM LOAD WITH TWO CARRIERS PER CELL, ASSUMING 200 EXPECTED
USERS…………………………………………………………………………………….79
FIGURE 4.13. BLOCKING PROBABILITY FOR THE URBAN2 SCENARIO IN TERMS OF THE FRACTION
OF ACTIVE USERS ASSUMING 100 EXPECTED USERS………………………………………80
FIGURE 4.14. BLOCKING PROBABILITY FOR THE URBAN2 SCENARIO AS A FUNCTION OF THE
SYSTEM LOAD ASSUMING 100 EXPECTED USERS …………………………………………81
FIGURE 4.15. BLOCKING PROBABILITY FOR THE URBAN2 SCENARIO IN TERMS OF THE FRACTION
OF ACTIVE USERS WITH TWO CARRIERS PER CELL ASSUMING 100 EXPECTED USERS…….. 82
FIGURE 4.16. BLOCKING PROBABILITY FOR THE URBAN2 SCENARIO IN TERMS OF THE FRACTION
OF ACTIVE USERS WITH ONE CARRIER ALLOCATED FOR SPEECH USERS ASSUMING A
POPULATION OF 100…..………………………………………………………………… 83
FIGURE 4.17. BLOCKING PROBABILITY FOR THE URBAN2 SCENARIO IN TERMS OF THE FRACTION
OF ACTIVE USERS WITH ONE CARRIER ALLOCATED FOR DATA USERS ASSUMING A
POPULATION OF 100……………………………………………………………………..84

xiv
FIGURE 4.18. BLOCKING PROBABILITY FOR THE URBA2 SCENARIO IN TERMS OF THE FRACTION
OF ACTIVE USERS WITH THREE CARRIERS PER CELL, AND ASSUMING 100 EXPECTED
USERS…………………………………………………………………………………….85
FIGURE 4.CAPUT!'. BLOCKING PROBABILITY FOR THE URBAN2 SCENARIO WITH TWO CARRIERS
ALLOCATED FOR DATA USERS ASSUMING A POPULATION OF 100…..…………………….86
FIGURE 4.20. BLOCKING PROBABILITY IN TERMS OF F FOR THE URBAN3 SCENARIO WITH FOUR
CARRIERS PER CELL ASSUMING 100 EXPECTED USERS.…………………………………...87
FIGURE 4.21. BLOCKING PROBABILITY IN TERMS OF THE SYTEM LOAD FOR THE URBAN3
SCENARIO WITH FOUR CARRIERS PER CELL ASSUMING 100 EXPECTED USERS…………….88
FIGURE 4.22. SUPPORTED FRACTION OF ACTIVE USERS WHEN ONLY LOW MOBILITY IS
CONSIDERED……………………………………………………………………...………91
FIGURE 4.23. COMPARISON AMONG THE SUPPORTED FRACTION OF ACTIVE USERS ASSUMING
SEVERAL MOBILITY SCHEMES…………………………………………………………….92
FIGURE 4.24. BLOCKING PROBABILITY IN GSM AND UMTS WHEN ONLY VOICE IS CONSIDERED
AND 100 EXPECETE USERS ARE ASSUMED………..………………………………………93
FIGURE 4.25. BLOCKING PROBABILITY IN A GSM AND A UMTS SYSTEM WHEN ONLY VOICE IS
CONSIDERED AND 400 EXPECTED USERS ARE ASSUMED ……….……………………….. 94
FIGURE 4.26. BLOCKING PROBABILITY FOR GSM/HSCSD AND UMTS-URBAN1…………….95
FIGURE A.1. SPREADING, MULTIPLEXING AND SCRAMBLING FOR UPLINK DPCCH AND
DPDCHS (EXTRACTED FROM [3GPP99D])…………………………………………… .108
FIGURE A.2. THE UTRA-FDD LAYERED STRUCTURE……………………………………….109
FIGURE A.3. FRAME STRUCTURE FOR UPLINK DPDCH/DPCCH (EXTRACTED FOR [3GPP99C]).
…………………………………………………………………………………………110
FIGURE A.4. CODE-TREE FOR GENERATION OF ORTHOGONAL VARIABLE SPREADING FACTOR
(OVSF) CODES (EXTRACTED FROM [3GPP99D])……………………………………….111
FIGURE A.5. FRAME STRUCTURE FOR DOWNLINK DPCH (EXTRACTED FROM [3GPP99D])…..111
FIGURE A.6. DOWNLINK SLOT FORMAT IN CASE OF MULTI-CODE TRANSMISSION (EXTRACTED
FROM [3GPP99C])…………………………………………………………………….112
FIGURE A.7. TRANSPORT-CHANNEL TO PHYSICAL CHANNEL MAPPING (EXTRACTED FROM
[3GPP99C])…………………………………………………………………………….114
FIGURE B.1. ABSOLUTE ERROR IN THE BLOCKING PROBABILITY IN FUNCTION OF THE FRACTION
OF ACTIVE USERS FOR THE FIRST TEST SCENARIO……………………………………….121
FIGURE B.2. ABSOLUTE ERROR IN THE BLOCKING PROBABILITY IN FUNCTION OF THE FRACTION
OF ACTIVE USERS FOR THE SECOND TEST SCENARIO…………………………………….122

xv
FIGURE B.3. ABSOLUTE ERROR IN THE BLOCKING PROBABILITY IN FUNCTION OF THE FRACTION
OF ACTIVE USERS FOR THE SECOND TEST SCENARIO WITH DIFFERENT Y-AXE MARGINS…123
List of Tables
TABLE 1.1. UMTS LICENSING CONDITIONS AND STATUS (SOURCE UMTS-FORUM)…………..3

xvi
TABLE 2.1. EXAMPLE SPREADING FACTORS AND DATA RATES FOR WCDMA (EXTRACTED FROM
[NABK00])………………………………………………………………………………..8
TABLE 2.2 ASSUMED BASE STATIONS DISTANCES, CELL AREAS AND MAXIMUM AVAILABLE DATA
RATES (EXTRACTED FROM [UMTS98A])……………………………………………………9
TABLE 2.3.POTENTIAL USER DENSITY (EXTRACTED FROM [UMTS98B])……………………..11
TABLE 2.4. SERVICE CHARACTERISTICS (EXTRACTED FROM [UMTS98B])……………………13
TABLE 2.5. BUSY HOUR CALL ATTEMPTS (EXTRACTED FROM [UMTS98B])………………….17
TABLE 2.6. TRAFFIC CALCULATION FOR UMTS SERVICES (EXTRACTED FROM [UMTS98B]).
…………………………………………………………………………………………...18
TABLE 2.7. UMTS QOS CLASSES (EXTRACTED FROM [3GPP99B])…………………………...20
TABLE 2.8. UMTS BEARER ATTRIBUTES DEFINED FOR EACH BEARER CLASS (EXTRACTED FROM
[3GPP99B])……………………………………………………………………………...23
TABLE 2.9. VALUE RANGES FOR UMTS QOS ATTRIBUTES (EXTRACTED FROM [3GPP99B])….24
TABLE 2.10. POSSIBLE TRAFFIC DISTRIBUTION BETWEEN CELL LAYERS (EXTRACTED FROM
[UMTS98A])…………………………………………………………………………….25
TABLE 2.11. PREFERRED DEPLOYMENT SCENARIO (EXTRACTED FROM [UMTS98A])…………25
TABLE 3.1. COMPARISON BETWEEN ERLANG-B AND ENGSET-B (EXTRACTED FROM
[MARTI95])………………………………………………………………………………35
TABLE 3.2. UMTS MULTIMEDIA PACKET-SWITCHED SERVICES CHARACTERISTICS(EXTRACTED
FROM [UMTS98B])………………………………………………………………………47
TABLE 4.1. PENETRATION RATE IN PERCENTAGE PER OPERATION ENVIRONMENT AND SERVICE,
YEAR 2005 (EXTRACTED FROM [UMTS])…………………………………………………66
TABLE 4.2. DESCRIPTION OF THE APPLICATIONS………………………………………………68
TABLE 4.3. SPECTRAL EFFICIENCY IN THE PEDESTRIAN SIMULATIONS………………………...69
TABLE 4.4. MULTISERVICE SCENARIOS DESCRIPTION…………………………………………69
TABLE 4.5. INITIAL SCENARIOS DEFINITION…………………………………………………...70
TABLE 4.6. SCENARIOS CHARACTERISTICS……………………………………………………71
TABLE 4.7. CROSS-OVER RATE AND HANDOVER FAILURE PROBABILITY FOR THE URBAN1
ASSUMING SEVERAL MOBILITY SEVERAL MOBILITY MODELS……………………………..90
TABLE 4.8. RESULTS FOR THE FRACTION OF ACTIVE USERS AND FOR THE NUMBER OF ACTIVE
USERS…………………………………………………………………………………….90
TABLE 4.9. MAXIMUM F [%] IN A CELL IN THE URBAN1 SCENARIO TAKING INTO ACCOUNT THE
MOBILITY………………………………………………………………………………...91
TABLE 4.10. URBAN1 SCENARIO RESULTS…………………………………………………….96

xvii
TABLE 4.11. URBAN1+MOBILITY SCENARIO RESULTS…………………………………………97
TABLE 4.12. URBAN2 SCENARIO RESULTS………………….…………………………………97
TABLE 4.13. GSM VS UMTS RESULTS………………………………………………………..98
TABLE A.1. DPDCH FIELDS (EXTRACTED FROM [3GPP99C]………………………………..110
List of Acronyms
3GPP: 3rd
Generation Partnership Project
AICH: Acquisition Indication Channel

xviii
ARQ: Automatic Repeat Request
ATM: Asynchronous Transmission Mode
BC: Background Class
BCH: Broadcast Channel
BCCH: Broadcast Control Channel
BER: Bit Error Rate
BHCA: Busy Hour Call Attempt
BPP: Bernoulli Poisson Pascal process
CBD: Central Business District
CC: Conversational Class
CCPCH: Common Control Physical Channel
CCTrCH: Composite Code Transport Channel
CD: Compact Disk
CPCH: Common Packet Channel
CPICH: Common Pilot Channel
CS: Circuit Switched
CSD: Circuit Switched Data
DCCH: Dedicated Control Channel
DCH: Dedicated Channel
DPCCH: Dedicated Physical Control Channel
DPDCH: Dedicated Physical Data Channel
DSCH: Downlink Shared Channel
DTCH: Dedicated Traffic Channel
EDGE: Enhanced Data for GSM Evolution
ERC: European Radio Committee
ETSI: European Telecommunications Standards Institute
EU: European Union
FACH: Forward-Access Channel
FCFS: First Come First Served
FDD: Frequency Division Duplex
FDMA: Frequency Division Multiple Access
FIFO: First In First Out
FTP: File Transfer Protocol
GPRS: General Packet Radio Service

xix
GSM: Global System for Mobile communications
HIB: Home (In Building) environment
HIMM: High Interactive MultiMedia
HMM: High MultiMedia
HSCSD: High Speed Circuit Switched Data
IEEE: Institute of Electrical and Electronic Engineering
IC: Interactive Class
IMT-2000: International Mobile Telecommunications 2000
LCD: Long Constraint Data
MAC: Medium Access Control
MBS: Mobile Broadband Systems
MMM: Medium MultiMedia
OVSF: Orthogonal Variable Spreading Factor
PCH: Paging Channel
PCPCH: Physical Common Packet Channel
PDF: Probability Density Function
PDP: Packet Data Protocol
PDSCH: Physical Downlink Shared Channel
PDU: Protocol Data Unit
PICH: Page Indication Channel
PMF: Probability Marginal Function
PRACH: Physical Random Access Channel
PS: Packet Switched
QoS: Quality of Service
RACH: Random Access Channel
RLC: Radio Link Control
RRA: Reservation Random Access
RIO: Rural In- and Outdoor environment
S: Speech
SAP: Service Access Point
SC: Streaming Class
SCD: Short Constraint Delay
SCH: Synchronisation Channel
SD: Switched Data

xx
SDU: Service Data Unit
SF: Spreading Factor
SIM: Subscriber Identity Module
SM: Simple Messaging
SU: SubUrban environment
TD-CDMA: Time Division-Code Division Multiple Access
TDD: Time Division Duplex
TDMA: Time Division Multiple Access
TFCI: Transport Format Combination Indicator
TFCS: Transport Format Combination Set
TPC: Transport Power Control
TV: TeleVision
UDD: Unconstraint Delay Data
UE: User Equipment
UMTS: Universal Mobile Telecommunication System
UP: Urban Pedestrian environment
UTRA: UMTS Terrestrial Radio Access
UTRAN: UMTS Terrestrial Radio Access Network
UV: Urban Vehicular environment
WCDMA: Wideband Code Division Multiple Access
WWW: World Wide Web
List of Symbols
k: BPP process first parameter
k: activation factor of application k

xxi
: velocity standard deviation
Pb: absolute error of the algorithm
: throughput
: call arrival rate
h: handover calls arrival rate
n: new calls arrival rate
a: application a generation rate
a': application a generation rate considering mobility
a*: normalized application a generation rate
j/a: activation of service component j given an application a.
: service rate
c: total rate of departures
: cell cross-over rate
: system loading
: service time standard deviation
2k
: variance of a Poisson process.
: unencumbered call duration
: average service time
c: channel occupancy time in a cell
del : average delay time
h: cell dwell time
: exponential parameter.
A: total traffic in a cell
Ah: handover traffic
An: newly traffic
Bk: set of blocking situations
c: number of shared channels
C: capacity demand vector
ck: service class k demand for channels
Cov: cell coverage area
Cs: arrival rate coefficient of variation
f: fraction of active users

xxii
fi: frequencies used at micro- and pico-cell layers.
Fi : frequencies used at the macro-cell layer.
g: guard channels for handover calls
Ha: application a total service rate
K: number of servers
k : mean of a Poisson process
l: cell boundary length
L: system load
Lb: buffer threshold
M: number of potential users in a cell
N: system number of channels
nj/a: number of times that the application a access to service component j.
P0: probability that there were no packets in the system
p(n): state probability marginal function
pa: probability of an user having an active application
propa: proportion of users of an application
Pb: blocking probability
Pbk: service class k blocking probability
Pd: dropout probability
Pdel: delay probability
Ph: handover probability
Phf: handover failure probability
Pl: loss probability
Poverflow: overflow probability
propa: proportion of times that an application a is requested among all of the
applications
q: unnormalized pmf
Q: occupancy PMF
Q : mean number of packets in a queue
r: circular cell radius
R: linear coverage distance
S: population
U: set of feasible states

xxiii
Ua: number of active users of the application a
V : mean velocity
vk(n): un-normalized marginal probabilities
Y(t): number of used channels in an instant t

1
1. Introduction
1.1. Personal Motivation
This report resumes eight months of work on teletraffic in the third generation of cellular
systems, the Universal Mobile Telecommunications System (UMTS). Since this is the first
system where multimedia applications are being considered since the beginning the traffic
analysis has to cope with different requirements corresponding to different service types and
so on.
The fact of investigating a so recent topic was a huge personal motivation, but at the same
time a lot of problems had to be overcome like for example the continuous changes in the
UMTS drafts and specifications. The results being presented here must be considered in the
appropriate context, it means that some of the numerical values may be inexact (the
information used was that being available at April 14th
of 2000), but nevertheless the
procedure followed can be used in the same way. The final objective of this project was not
only studying a theoretical traffic model for the UMTS, but also to develop a software
analyser to obtain some practical results that help the reader to better understand system
capabilities and behaviour.
1.2. Mobile Communications Today
All over the world, mobile communication systems have recently enjoyed tremendous growth
rates, capturing the imagination of the public and becoming an essential part of our every day
lives. The huge evolution from the analog cellular systems to the 2nd
generation of digital
systems, motivated by the technological change, will be even overcome by new 3rd
generation
systems.
This is the Personal Communications era, dominated by voice, while the new mobile
multimedia systems will start a new time dominated by data. Presently the resulting data
revenues correspond to only 0.5% of the total GSM revenues, while 20 years from now it is
believed that more than 90% of all communications will be in the form of data. Several
systems are growing simultaneously in order to provide voice and data communications

2
[BuCN99], the High Speed Circuit Switched Data (HSCSD) is an evolution of the existing
data transmission service in GSM. The General Packet Radio Service (GPRS) is based on the
transportation and routing of packetised data greatly reducing the time spent setting up and
taking down connections; GPRS will live together with HSCSD providing always-connected
and real-time services respectively. The Enhanced Data Rates for GSM Evolution (EDGE)
will enable higher data rates using the GSM (and GPRS) infrastructure with relatively small
hardware and software upgrades. All this systems are steps driving users from the 2nd
to the
3rd
generation systems: UMTS/IMT-2000.
Obviously, these systems are the response to the increasing need for new services in the
mobile communications. The voice business is almost saturated and operators new trend is
providing users with attractive value-added services. The growing of Internet and of the e-
commerce are a couple of examples of applications that can not keep out of the mobile
communications evolution. Not only Internet, but also Video download or streaming, mobile
office, video conferencing, and so on are applications that will be available over UMTS and
that will satisfy users appetite for innovating services.
By the time this work was being done a huge revolution was occurring in the
telecommunications world: the UMTS standardisation process had not yet been finished, and
the different European countries were starting to assign the licences. One can see the situation
in several European countries in Table 1.1.
One can not forget another important fact, the UMTS Forum was the international organism
where the first steps in the UMTS were made. The UMTS Forum is an association of
telecommunications operators, manufacturers and regulators active both in Europe and other
parts of the world that share the vision of UMTS. During the UMTS evolution the 3rd
Generation Partnership Project (3GPP), a partnership project of national and regional standard
bodies, starts producing technical specifications for a 3rd
generation mobile system based on
the evolved GSM core networks and the radio access technologies that the project partners
support, for example UTRA.

3
Country
Number of Licences
Site Sharing Licensing Process
License Award
Commercial Launch
Finland 4 Beauty contest
Completed Mar. 1999
Jan. 2002
France 4 Not known Beauty contest
Earliest Mar. 2001
Q1 2002
Germany Between 4 and 6 depending on auction outcome.
No
Auction (two-stage)
Q3 2000 2002
Italy 5 Not decided Auction Q3 2000 2002
The Netherlands
5 General rule: sharing is granted
Auction Q3 2000 1.1.2002
Portugal 4 Subject to consultation
Beauty contest
Q1 2001 1.1.2002
Spain 4 Yes Beauty contest
Complete 13.3.2000
1.8.2001
Sweden 4 Not mandatory Beauty contest, with prequalification based on coverage ability
Nov/Dec 2000
2002
UK 5 Unlikely Auction Completed 27.4.2000
1.1.2002
Table 1.1. UMTS licensing conditions and status (Source UMTS-Forum).
1.3. Structure of the Report
Obviously the new system implies a new way of traffic analysis where one has to cope with
circuit and packet switched services using the same network, symmetric and asymmetric
applications, requirements depending on the considered environment, and so on. These
aspects are being treated in this report, which structure is as follows.
In Chapter 2 one can find a description about UMTS dealing with technical aspects,
applications, services, and finally focussing in the key points from the traffic engineering
point of view. After reading this chapter one has a general idea about UMTS as well as the
aspects that will lead to the definition of the traffic model being presented in Chapter 3.
Chapter 3 is devoted to theoretical traffic models. Teletraffic is the technical term identifying
all phenomena of the control and transport of information within telecommunications
networks. Since one of the functions of a teletraffic engineer is to predict the performance of
the network, one must start by studying classical models for fixed voice networks and their
possible application to mobile communications. One step further is studying the impact of

4
including mobility. The next stage consists in working in models for data communications,
since this type of communications will be an important part of over UMTS. This chapter ends
by defining the analytical model for the UMTS-FDD mode; the election of this mode was
done because of the higher amount of available information about FDD compared to the TDD
mode, and because this is the most interesting mode for operators.
In Chapter 4 one can find the system performance evaluation, which represents the most
important part of the work since leads to a better understanding of the UMTS-FDD mode
behaviour. One of the points of interest of this work is the relation with a previous graduation
project developed in the Technical University of Lisbon [DaPi00] where a system simulation
was done. The traffic analysis and system simulations must be considered together in order to
cope with user satisfaction requirements defined for UMTS.
The Chapter 5 provides the reader with the main conclusions extracted from this work, and
some future further research lines are also proposed.

5
2. The Universal Mobile Telecommunications System
2.1. Introduction
Mobile and personal communications are recognised as a major driving force of socio-
economic progress and are crucial for fostering European industrial competitiveness and for
sustained economic growth, as well as balanced social and cultural development. The impact
of telecommunications extends well beyond the industries directly involved, in fact enabling a
totally new way of life and a wealth of new ways of working and doing business [BuCN99].
The success of mobile telephony is in great contrast to the poor market "take-up" of wireless
data products. The main objective for the new generations of mobile communications is to
provide customers a wide range of applications, these applications being a mixture of voice
and data. At present, around 1% of GSM traffic is due to data, while 20 years from now it is
believed that more than 90% of all communications will be in that form [BuCN99]. In this
context UMTS is being the subject of extensive research as a flexible and cost-effective third
generation mobile communications system.
UMTS is the realisation of a new generation of mobile communications technology for a
world where services will be based on a combination of fixed and wireless services to form a
seamless end-to-end service to the user. UMTS is conceived as a multi-function, multi-
service, multi-application digital mobile system that will provide personal communications at
rates ranging from 144 kbit/s up to 2 Mbit/s according to the specific environment [BuCN99].
Figure 2.1 shows the different environments UMTS will cope with.
UMTS is now recognised as the main opportunity to provide mobile broadband multimedia
services for the mass market in the future, emphasising their broadband capacity [UMTS98a].
This section deals with UMTS service characteristics and shows points of interest related to
traffic in the UMTS Forum publications.

6
DOCUMENTTYPE
TypeUnitOrDepartmentHereTypeYourNameHere TypeDateHere
Zone 4:Global
Satellite
Zone 3:Suburban
Zone 2:Urban Zone 1:
In building
Macro cellPico cell
Micro cellWorld cell
2Gs: Satellitenetworks
public mobile &fixed networks
privat residential &fixed networks
Figure 2.1. UMTS coverage is universal (extracted from [UMTS98a]).
2.2. A brief description
2.2.1. Frequency Bands
Figure 2.2 shows the IMT-2000 spectrum situation in some countries and regions. In Europe
155 MHz could be available up to 2005 subject to market demand. The bands for terrestrial
UMTS identified in the ERC Decision are [1900, 1980] MHz, [2010, 2025] MHz, and [2110,
2170] MHz. For the year 2002, the spectrum designations will probably differ from country to
country. The ERC also decided that at least 2 x 40 MHz should be available to operators in
this year. As a consequence different operator scenarios developed in this report may help to
deal with such situations. The UMTS operator may have to be able to work with the allocated
bandwidth for a number of years beyond 2005. There is an uncertainty as to when and if more
spectrum will be available for UMTS [UMTS98a].

7
1850 1900 1950 2000 2050 2100 2150 2200 2250
1850 1900 1950 2000 2050 2100 2150 2200 2250
North
America
MS SPCS
Reserve
Europe UMTSGSM 1800 DE CT MS S
1880 MHz 1980 MHz
Japan
Korea (w/o PHS)
MS SIMT 2000PHS MS SIMT 2000
2160 MHz1895 MHz
1918 MHz1885 MHz
ITU Allocations
1885 MHz 2025 MHz
IMT 2000
2010 MHz
2110 MHz 2170 MHz
China MS SIMT 2000IMT 2000
IMT 2000
MS SUMTS
2170 MHz
MS S
1885 MHz 1980 MHz
AA D B E F C AA D B E F C
MDS
GSM 1800
1850 MHz WLL WLL
Figure 2.2. Frequency bands for IMT-2000 (extracted from [UMTS98a]).
Two different modes of operation are being possible in UMTS: TDD (Time Division Duplex)
and FDD (Frequency Division Duplex). It makes reference to the way the uplink and
downlink are managed: in FDD two frequencies are used at the same time, while in TDD both
forward and reverse link use the same frequency band.
TDD is going to be used with TD-CDMA (Time Division-Code Division Multiple Access) in
unpaired bands and it will be advantageous to handle asymmetric traffic, while for terrestrial
wide-area full-mobility systems the use of paired bands in the FDD mode has proved to be
better. The FDD mode is used with WCDMA (Wideband Code Division Multiple Access).
TDD and FDD modes can be combined to handle the asymmetric traffic in a optimised way
[UMTS98a].
A total of 155 MHz are available, the channel bandwidth being 5 MHz, which leads to 31
channels. In the FDD (paired) mode two channels are needed, while only one is required for
the TDD (unpaired) one, for each link; the separation between the downlink and the uplink in
the FDD mode must be higher than 130 MHz. The spectrum distribution being recommended
by the UMTS Forum can be seen in Figure 2.3.

8
Figure 2.3. Frequency allocation for the FDD and TDD modes.
Despite this report deals with the FDD mode, a brief description of both structures considered
in UMTS is provided; the interested reader can find more information about the FDD mode in
Annex A.
WCDMA is used in the FDD mode in the UMTS, the frame length is 10 ms, each frame is
split into 15 slots [NaBK00]. Another important characteristics of WCDMA in UMTS are:
Speech activity detection is assumed.
Rate adaptation in WCDMA systems is achieved through a combination of variable
spreading, coding, and code aggregation. Table 2.1 shows some spreading factors
and the peak data rate available for each one. The value of 2048 kbit/s is available
using six code channels simultaneously.
A continuum of data rates can be achieved by using rate matching. That is,
repetition or puncturing is used to match the coded bit rates to one of a limited set
of rates on the physical layer.
The MAC operation can be described using two modes: connected and idle. If the
terminal is in an active data transfer mode, it is assigned to a state in which
dedicated channels are assigned.
Spreading Factor Peak Data Rate
[kbit/s]
64 12.2
16 64
8 144
4 384
4 2048
Table 2.1. Example spreading factors and data rates for WCDMA (extracted from [NaBK00]).
TDD FDD Mode TDD FDD Mode
1900 1920 1980 2010 2025 2110 2170
MHz
Paired bands
9
The key service and operational features of the WCDMA radio-interface are listed below:
1. Support for high-data-rate transmission.
2. High service flexibility with support of multiple parallel variable-rate services on
each connection.
3. Efficient packet access.
4. Support of inter-frequency handover for operation with hierarchical cell structures
and handover to other systems.
TD-CDMA is used in the TDD mode, the frame length is 4.615 ms but it allows a flexible
frame structure with 16 or 64 slots per TDMA frame. The logical channel structure is the
same of the WCDMA one. In TDMA Automatic Repeat Request, ARQ, protection is
provided what means that it is possible to operate at higher frame error rates [ETSI97b].
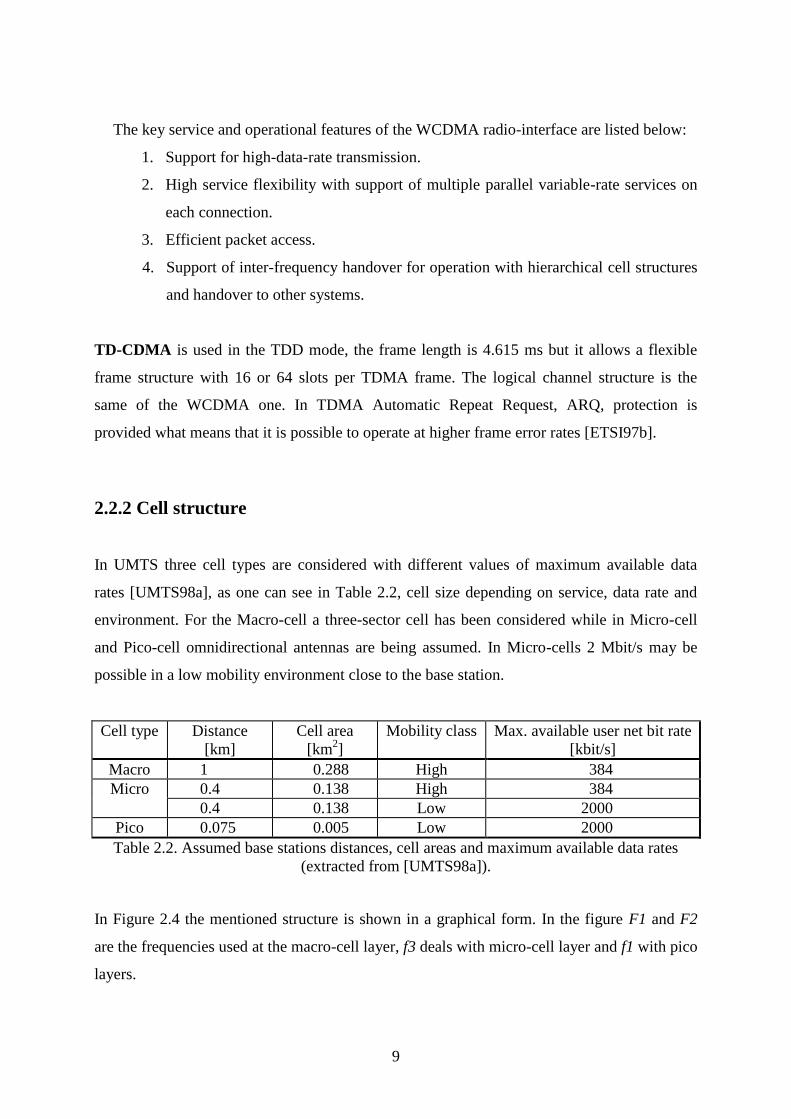
2.2.2 Cell structure
In UMTS three cell types are considered with different values of maximum available data
rates [UMTS98a], as one can see in Table 2.2, cell size depending on service, data rate and
environment. For the Macro-cell a three-sector cell has been considered while in Micro-cell
and Pico-cell omnidirectional antennas are being assumed. In Micro-cells 2 Mbit/s may be
possible in a low mobility environment close to the base station.
Cell type Distance
[km]
Cell area
[km2]
Mobility class Max. available user net bit rate
[kbit/s]
Macro 1 0.288 High 384
Micro 0.4 0.138 High 384
0.4 0.138 Low 2000
Pico
0.075 0.005 Low 2000
Table 2.2. Assumed base stations distances, cell areas and maximum available data rates
(extracted from [UMTS98a]).
In Figure 2.4 the mentioned structure is shown in a graphical form. In the figure F1 and F2
are the frequencies used at the macro-cell layer, f3 deals with micro-cell layer and f1 with pico
layers.

10
Figure 2.4. An example of hierarchical cell structure (extracted from [UMTS98a]).
The macro-cell provides the wide area coverage and is also used for high-speed mobiles. The
micro-cell is used at street level for outdoor coverage to provide extra capacity where macro-
cells can not cope with traffic demands. The pico-cell will be deployed mainly indoors, in
areas where there is a demand for high data rate services [UMTS98a].
2.2.3. Users
Several operational environments are considered with different traffic requirements. Below
one can see a brief description of each one; it should be noted that the model assumes that no
user occupies two operational environments at the same time:
CBD includes the Central Business District and the in building urban communications
where the traffic requirements will be high. The CBD environment is assumed to be the
only environment with offices.
SU is the SubUrban environment and includes both in building and on street
communications.
HIB is the Home (In Building) environment and it is a special case, within which one user
per one home cell is assumed, which allows the use of UMTS terminals and services in the
residential and small office domains.
UP is the Urban Pedestrian situation where low mobility can be assumed and therefore
high data rates can be achieved.

11
UV is the Urban Vehicular environment, high speeds are assumed that will limit the
available data rates.
RIO includes the Rural In and Outdoor areas, typically small cities and places where small
amounts of traffic can be expected.
The potential user density per operational environment can be seen in Table 2.3.
Operational environments Density of
potential
users [km-2
]
CBD 180 000
SU 7 200
HIB 380
UP 108 000
UV 2 780
RIO 36
Table 2.3. Potential user density (extracted from [UMTS98b]).
The user density is a main factor when modelling the traffic because the arrival rate may
depend on its value.
2.2.4. Service Classes
The market for UMTS comprises a wide area of applications which can be seen as a
combination of the following six main service classes (or service components) [UMTS98b],
where examples of applications are also presented:
Speech (S):(symmetric)
Simple one to one and one to many voice (teleconferencing) services
Voicemail
Simple Messaging (SM): (symmetric)
SMS (short message delivery) and paging
Email delivery
Broadcast and public information messaging
Ordering/payment (for simple electronic commerce)
Switched Data (SD):(symmetric)
Low speed dial-up LAN access

12
Internet/Intranet access
Fax
Legacy services - mainly using radio modems such as PCMCIA cards (are not expected
to be very significant by 2005).
Medium Multimedia (MMM): (asymmetric)
Asymmetric services which tend to be ‘bursty’ in nature, require moderate data rates, and
are characterised by a typical file size of 0.5 MByte, with a tolerance to a range of delays.
They are classed as packet switched services.
LAN and Intranet/Internet access
application sharing (collaborative working)
interactive games
lottery and betting services
sophisticated broadcast and public information messaging
simple online shopping and banking (electronic commerce) services
High Multimedia (HMM): (asymmetric)
Asymmetric services which also tend to be ‘bursty’ in nature, require high bit rates. These
are characterised by a typical file size of 10 MByte, with a tolerance to a range of delays.
They are classed as packet switched services. Applications include:
fast LAN and Intranet/Internet access
video clips on demand
audio clips on demand
online shopping
High Interactive Multimedia (HIMM): (symmetric)
Symmetric services which require reasonably continuous and high-speed data rates with a
minimum of delay. Applications include:
video telephony and video conferencing
collaborative working and telepresence
2.2.5. Service Characteristics
Table 2.4 shows the UMTS service characteristics. One must start defining the parameters as
well as some hypotheses:

13
The User Nominal Bit Rate corresponds to the output bit rate from the source without any
kind of error protection.
The Effective Call Duration of a service corresponds to how long, on average, the service
is connected. It is based on the average call duration multiplied by the occupancy factor.
The usage of the occupancy factor (the occupancy indicates if and how much, on average,
the activity of the service will vary) implies that the system should be able to handle the
discontinuous transmission mode.
The User Net Bit Rate is a measure of the bit rate taking in account the packet efficiency
factor, which is based on consideration of practical packet networks and includes the effect
of retransmission of unsuccessful packets.
The Coding Factor is a generalised measure of the degree of coding required to transport
the service to the required quality. This is separate from the signalling requirements.
The Asymmetry Factor is used to show that some services will have a different bandwidth
in the uplink and downlink.
The Service Bandwidth is the product of user nominal bit rate, coding factor and
asymmetry factor.
The Switch Mode defines it the service is Circuit Switched, CS, or Packet Switched, PS;
since the call duration and the occupancy are not suitable to characterise packet switched
services, an estimation of effective call duration is generated.
Services User nominal
bit rate
[kbit/s]
Effective
call
duration
[s]
User net bit
rate
[kbit/s]
Coding
factor
Asymmetry
factor
Service
bandwidt
h [kbit/s]
UMTS
Switch
Mode
HIMM
128 144 128 2 1/1 256/256 CS
HMM
2000 53 1 509 2 0.005/1 15/3200 PS
MMM
384 14 286 2 0.026/1 15/572 PS
SD 14 156 14.4 3 1/1 43/43 CS
SM 14 30 10.67 2 1/1 22/22 PS
S 16 60 16 1.75 1/1 28/28 CS
Table 2.4. Service Characteristics (extracted from [UMTS98b]).
The future application for data users will be based on a mixture of service classes, hence
traffic and spectrum calculations do not depend directly on the various applications the user
may have.

14
The above figures indicate representative delays that might be acceptable for the packet
switched services. In reality a range of delay constraints will be appropriate depending on the
nature of the application being supported over the radio interface [UMTS98b].
2.2.6. Applications
Below one can see some examples of practical applications that will be supported by UMTS.
Unlike the organisation from subsection 2.2.4 (in service classes), applications are organised
here by their purpose. Services on demand will also be common in UMTS. Some of these
services have already been developed in the fixed network or in GSM, but UMTS will offer
significant improvements both in service provision and delivery performance [UMTS98b].
Information
Public information services such as
Browsing the WWW
Interactive shopping
On-line equivalents of printed media
On-line translations
Location based broadcasting services
Intelligent search and filtering facilities
Education
Virtual school
On-line science labs
On-line library
On-line language labs
Training
Entertainment
Audio on demand (as an alternative to CDs, tapes or radio)
Games on demand
Video clips
Virtual sightseeing

15
Community services
Emergency services
Government procedures
Business information
Mobile office
Narrowcast business TV
Virtual work-groups
Communication services
Person-to-person services such as:
Video telephony
Video conferencing
Voice response and recognition
Personal location
Business and financial services
Virtual banking
On-line billing
Universal SlM-card and Credit card
Road transport telematics
Toll ticket
Fleet management
Car security
2.3. Traffic aspects
2.3.1. Assumptions
UMTS will provide both packet and circuit switched services. In light of the uncertainties
associated with the radio interface and the detailed multimedia traffic characteristics, the
following assumptions for packet type traffic are being used by UMTS Forum, although one
is not considering them strictly in this work [UMTS98b]:

16
1. The end user initialises a session and sets up a virtual connection with the server or
viceversa. The session time is not considered in the calculations of spectrum demand, as
long as no data is transferred.
2. Services like HMM and MMM have bursty traffic characteristics. If data in bursts is
transferred during the session over the radio interface, a "call duration" is defined
reflecting the active data transfer time.
3. The HMM traffic is distributed among micro and pico-cells. The HMM traffic predicted
for the urban-vehicular environment will be added to the traffic in MMM service (a user in
this environment will accept a lower data rate if the maximum data rate is not available).
It is assumed also that 90% of the total speech and low speed data will be carried over
existing second generation networks during the first years and that 60% of the indoor traffic
will be carried over licence-exempt networks [UMTS98b].
2.3.2 Traffic calculation
The flowchart of the spectrum calculation methodology used by the UMTS Forum is given in
Figure 2.5, where one can see step by step the process followed to obtain the values that will
be shown later in this section.
Population
density EU
Penetration rates per service/years 2005, 2010
Service types
speech fax/data multimedia
Offered bit quantity / environments
Typical cell types
Pico, Micro, Macro
Potential user / km² per land area
urban suburban rural
Indoor / Outdoor
+ + + + + Overhead
Spectral efficiency
factor kbps/cell/MHz
Required spectrum
years 2005, 2010
Figure 2.5. Calculation Method for UMTS traffic and spectrum (extracted from [UMTS98b]).

17
The first five steps are related to traffic calculations, while the last two have to do with
spectrum calculations.
2.3.3. Traffic Characteristics
The Busy Hour Call Attempt (BHCA) in Table 2.5 defines an important part of the traffic
characteristics. The BHCA is defined as the ratio between the total number of connected calls
and the total number of subscribers in the considered area, measured during the busy hour
[UMTS98b].
The values in Table 2.5 have been obtained assuming a blocking probability of 0.02 for the
circuit switched services and that no additional resources are added to the packet based
services.
Year
2005 2010
Services CBD in
building
Urban
pedestrian
Urban
vehicular
CBD in
building
Urban
pedestrian
Urban
vehicular
HIMM 0.12 0.06 0.004 0.24 0.12 0.008
HMM 0.12 0.06 0.004 0.12 0.06 0.004
MMM 0.12 0.06 0.004 0.12 0.06 0.004
SD 0.06 0.03 0.002 0.06 0.03 0.002
SM 0.06 0.03 0.002 0.06 0.03 0.002
S 1 0.6 0.6 1 0.85 0.85
Table 2.5. Busy Hour Call Attempts (extracted from [UMTS98b]).
2.3.4. Asymmetry
One of the key points about traffic in the Universal Mobile Telecommunications System is the
asymmetry of the applications, specially when considering high bit rate services. Obviously
the asymmetry will vary, depending on the considered timescale [UMTS98b]:
Within quasi-instantaneous timescales (<10 seconds), all traffic, including speech, would
undoubtedly be found to be highly asymmetric.
Over the duration of a multimedia session, the session asymmetry can be very different to
the quasi-instantaneous values.

18
Over a long period of time (day, week or month) and integrated over all customers using
the UMTS network, there will be an overall net degree of asymmetry in the number of bits
flowing in the up-link and down-link channels.
The asymmetry figure can be defined as the ratio of transmitted down-link bits to transmitted
up-link bits in a given integration time. The UMTS Forum figures for Medium Multimedia
and High Multimedia are 40:1 and 200:1 respectively. However, the transmission of this
information over a mobile network requires that additional system information be added in to
cope with packet transmission, error handling and protocol overheads. These additional
overhead signals will have a proportionally greater effect on the low data rate direction of an
asymmetrical traffic flow, and will have the effect of reducing the overall asymmetry
[UMTS98a].
2.3.5. Traffic capacity requirements
The analysis of the population in Europe shows, that 50-60% of the population is in an urban
area. Only urban environments (CBD, pedestrian and vehicular) are considered now, as it is
expected that the highest bandwidth requirements are in dense urban areas. Table 2.6 shows
the aggregate traffic for UMTS services in the considered environments. The aggregate traffic
includes the net bit rate, coding factor, uplink/downlink factor, and a 20% signalling
overhead. One should note that for CBD the cell size is smaller than that for the other
environments, the 40% refers to the fact that 60% of the in-building traffic originates from
licence-exempt networks.
Aggregate traffic in the busy hour (Mbit/s/ km2)
Service class Year 2005
Uplink Downlink
CBD(40%) Urban CBD(40%) Urban
HMM 2 Mbit/s 0.15 0.1 30.6 22
MMM 384 kbit/s 0.06 0.05 2.5 1.8
HIMM 128 kbit/s 1.1 0.4 1.1 0.4
Speech/low speed data 2.5 2.3 2.5 2.3
Sum 3.8 2.85 36.7 26.5
All Environments 6.65 63.2
Table 2.6. Traffic calculation for UMTS Services (extracted from [UMTS98b]).

19
The traffic figures in Table 2.6 show that packet switched services will dominate in the down-
link, while circuit switched traffic will be more important in the up-link.
2.4. Quality of Service
2.4.1. Introduction
The Quality of Service (QoS) in UMTS is an important factor for the system take over. When
UMTS is going to be launched to the mass market, several other mobile telecommunication
services will exist as an alternative for public in general. A high quality experienced by the
user of UMTS is essential in order to promote the idea of UMTS as a global all-purpose
communication tool for millions of people with mass produced low price terminal equipment
[3GPP99a].
The Quality of Service has been defined by the UMTS Forum like the collective effect of
service performance which determines the degree of satisfaction of an user [3GPP99a]. Due
to the multi-service nature of UMTS, different classes must be considered with different
associated considerations for each one.
2.4.2 UMTS QoS Classes
When defining UMTS QoS classes, the restrictions and limitations of the air interface have to
be taken into account. It is not reasonable to define complex mechanisms as it has been
considered in fixed networks due to different error characteristics of the air interface. The
QoS mechanisms provided in the cellular network have to be robust and capable of providing
reasonable QoS resolution. Table 2.7 illustrates the proposed QoS classes for UMTS
[3GPP99b].
The main distinguishing factor between these classes is how delay sensitive the traffic is: CC
is meant for traffic which is very delay sensitive while BC is the most delay insensitive traffic
class [3GPP99b].

20
CC and SC are mainly intended to be used to carry real-time traffic flows. The main divider
between them is how delay sensitive the traffic is. Conversational real-time services, like
video telephony, are the most delay sensitive applications and those data streams should be
carried in CC [3GPP99b].
Traffic class Conversational
class (CC)
conversational
real time
Streaming class
(SC)
streaming real
time
Interactive class
(IC)
Interactive best
effort
Background
(BC)
Background
best effort
Fundamental
characteristics
Preserve time
relation (variation)
between
information
entities of the
stream
Conversational
pattern (stringent
and low delay )
Preserve time
relation
(variation)
between
information
entities of the
stream
Request response
pattern
Preserve payload
content
Destination is
not expecting
the data
within a
certain time
Preserve
payload
content
Example of
the
application
voice streaming video Web browsing background
download of
emails
Table 2.7. UMTS QoS classes (extracted from [3GPP99b]).
IC and BC are mainly meant to be used by traditional Internet applications like WWW,
Email, Telnet, FTP and News. Due to looser delay requirements, compared to CC and SC,
both provide better error rate by means of channel coding and retransmission. The main
difference between IC and BC class is that Interactive class is mainly used by interactive
applications, e.g., interactive E-mail or interactive Web browsing, while Background class is
meant for background traffic, e.g., background download of E-mails or background file
downloading. The responsiveness of interactive applications is ensured by separating
interactive and background applications. Traffic in the IC has higher priority in scheduling
than BC traffic, so background applications use transmission resources only when interactive
applications do not need them. This is very important in wireless environment where the
bandwidth is low compared with fixed networks [3GPP99b].
One can see the UMTS QoS Architecture as a layered structure where each bearer service on
a specific layer offers its individual services using services provided by the layers below. The
end-to-end service is the top layer and is related not only to the UMTS network but also with

21
the mobile terminal. In this section the UMTS Bearer Service is studied; a bearer service
includes all aspects to enable the provision of a contracted QoS [3GPP99b].
2.4.3. UMTS Bearer Service Attributes
In this subsection one can find a list of attributes [3GPP99b] that are used to characterise the
bearer service. In Table 2.8, the defined UMTS bearer service attributes and their relevancy
for each bearer class are summarised.
Traffic class is the type of application for which the UMTS bearer service is optimised:
conversational, streaming, interactive, or background. By including the traffic class itself as
an attribute, UMTS can make assumptions about the traffic source and optimise the transport
for that traffic type.
Maximum bitrate [kbit/s] is the maximum number of bits delivered by UMTS and
to UMTS at a SAP (Service Access Point) within a period of time, divided by the duration of
the period. The traffic is conformant with Maximum bitrate as long as it follows a token
bucket algorithm where token rate equals Maximum bitrate and bucket size equals Maximum
SDU (Service Data Unit) size. The maximum bitrate can be used to make code reservations in
the downlink of the radio interface. Its purpose is 1) to limit the delivered bitrate to
applications or external networks with such limitations 2) to allow maximum wanted user
bitrate to be defined for applications able to operate with different rates (e.g. non transparent
circuit switched data).
Guaranteed bitrate [kbit/s] is the ratio between the guaranteed number of bits
delivered by UMTS at a SAP within a period of time (provided that there is data to deliver)
and the duration of the period. The traffic is conformant with the guaranteed bitrate as long as
it follows a token bucket algorithm where token rate is equal to the guaranteed bitrate and
bucket size is equal to k*(Maximum SDU size). For the release 99, k=1. A value of k greater
than one Maximum SDU size may be specified in future releases to capture burstiness of
sources. Signalling to specify the value of k may be provided in future releases. The
guaranteed bitrate may be used to facilitate admission control based on available resources,
and for resource allocation within UMTS. Quality requirements expressed by, e.g., delay and
reliability attributes only apply to incoming traffic up to the guaranteed bitrate.
Delivery order (y/n) indicates whether the UMTS bearer shall provide in-sequence
SDU delivery or not. The attribute is derived from the user protocol (PDP type) and specifies
if out-of-sequence SDUs are acceptable or not. This information cannot be extracted from the

22
traffic class. Whether out-of-sequence SDUs are dropped or re-ordered depends on the
specified reliability.
Maximum SDU size [bit] is the maximum allowed SDU size and it is used for admission
control and policing.
SDU format information [bit] is the list of possible exact sizes of SDUs. The UTRAN
(UMTS Terrestrial Radio Access Network) needs SDU size information to be able to operate
in transparent RLC (Radio Link Control) protocol mode, which is beneficial to spectral
efficiency and delay when RLC re-transmission is not used. Thus, if the application can
specify SDU sizes, the bearer is less expensive.
SDU error rate indicates the fraction of SDUs lost or detected as erroneous. SDU error
ratio is defined only for conforming traffic. One should note that by reserving resources, SDU
error ratio performance is independent of the loading conditions, whereas without reserved
resources, such as in IC and BC, SDU error ratio is used as target value. It is used to configure
the protocols, algorithms and error detection schemes, primarily within UTRAN.
Residual bit error ratio indicates the undetected bit error ratio in the delivered SDUs. If
no error detection is requested, Residual bit error ratio indicates the bit error ratio in the
delivered SDUs. It is Used to configure radio interface protocols, algorithms and error
detection coding.
Delivery of erroneous SDUs (y/n/-) indicates whether SDUs detected as erroneous
shall be delivered or discarded. 'Yes' implies that error detection is employed and that
erroneous SDUs are delivered together with an error indication, 'No' implies that error
detection is employed and that erroneous SDUs are discarded, and ‘-‘ implies that SDUs are
delivered without considering error detection. It is used to decide whether error detection is
needed and whether frames with detected errors shall be forwarded or not.
Transfer delay [s] indicates the maximum delay for 95th percentile of the distribution
of delay for all delivered SDUs during the lifetime of a bearer service, where delay for an
SDU is defined as the time from a request to transfer an SDU at one SAP to its delivery at the
other SAP. It is used to specify the delay tolerated by the application. It allows UTRAN to set
transport formats and ARQ parameters. One should note that transfer delay of an arbitrary
SDU is not meaningful for a bursty source, since the last SDUs of a burst may have long
delay due to queuing, whereas the meaningful response delay perceived by the user is the
delay of the first SDU of the burst.

23
Traffic handling priority specifies the relative importance for handling of all
SDUs belonging to the UMTS bearer compared to the SDUs of other bearers. Within the
interactive class, there is a definite need to differentiate between bearer qualities. This is
handled by using the traffic handling priority attribute, to allow UMTS to schedule traffic
accordingly. By definition, priority is an alternative to absolute guarantees, and thus these two
attribute types cannot be used together for a single bearer.
Allocation/Retention Priority specifies the relative importance compared to other
UMTS bearers for allocation and retention of the UMTS bearer. Priority is used for
differentiating between bearers when performing allocation and retention of a bearer, and the
value is typically related to the subscription.
Traffic class CC SC IC BC
Maximum bitrate X X X X
Delivery order X X X X
Maximum SDU size X X X X
SDU format information X X
SDU error ratio X X X X
Residual bit error ratio X X X X
Delivery of erroneous SDUs X X X X
Transfer delay X X
Guaranteed bit rate X X
Traffic handling priority X
Allocation/Retention priority X X X X
Table 2.8. UMTS bearer attributes defined for each bearer class (extracted from [3GPP99b]).
2.4.4. Ranges of UMTS Bearer Service Attributes
Table 2.9 lists the value ranges of the UMTS bearer service attributes. The value ranges
reflect the capability of UMTS network. Some considerations must be taken into account
before studying the Table 2.9 contents:
A bitrate of 2000 kbit/s in CC and SC classes requires that UTRAN operates in transparent
RLC (Radio Link Control) protocol model, and then the overhead from layer 2 protocols is
negligible. While in IC and BC classes UTRAN operates in non-transparent RLC protocol
mode and the impact from layer 2 protocols shall be estimated.
The granularity of the bit rate parameters must be studied. Although the UMTS network
has capability to support a large number of different bitrate values, the number of possible

24
values must be limited not to unnecessarily increase the complexity of for example
terminals, charging and interworking functions.
The maximum SDU size shall allow UMTS network to support external PDUs having as
high values as Internet/Ethernet.
The 3GPP is actually working in the definition of possible values of exact SDU sizes for
which UTRAN can support transparent RLC protocol mode. The residual BER values in
Table 2.9 are indicatives.
Traffic class CC SC IC BC
Maximum bitrate
[kbit/s]
<2000 <2000 < 2000 <2000
Delivery order Yes/No Yes/No Yes/No Yes/No
Maximum SDU size
[octets]
<1500 <1500 <1500 <1500
SDU format
information
Delivery of
erroneous SDUs
Yes/No/- Yes/No/- Yes/No/- Yes/No/-
Residual BER 5*10-2
, 10-2
,
10-3
, 10-4
5*10-2
, 10-2
, 10-3
,
10-4
, 10-5
, 10-6
4*10-3
, 10-5
,
6*10-8
4*10-3
, 10-5
,
6*10-8
SDU error ratio 10-2
, 10-3
, 10-4
,
10-5
10-2
, 10-3
, 10-4
,
10-5
10-3
, 10-4
, 10-6
10-3
, 10-4
, 10-6
Maximum Transfer
delay [ms]
100 500
Guaranteed bit rate
[kbit/s]
<2000 <2000
Traffic handling
priority
1,2,3
Allocation/Retentio
n priority
1,2,3 1,2,3 1,2,3 1,2,3
Table 2.9. Value ranges for UMTS QoS attributes (extracted from [3GPP99b]).
2.5. UMTS Forum Recommendations
Several scenarios with different number of operators and various spectrum distributions have
been considered by the UMTS Forum [UMTS98a]. After the ability studies, the scenario
number 6 is the preferred solution. It allows for one macro cell layer, two micro cell layers
and one pico cell layer [UMTS98a]. In Table 2.10 a possible distribution of carriers and of
traffic between carriers is shown, while in Table 2.11 the scenario characteristics can be seen.

25
The final frequency distribution among the operators can be different in each country but it
has been accepted that 12 FDD/WCDMA channels will be available and 256 codes per carrier
are assumed. In the TD-CDMA/TDD mode, 16 time-slots per frequency are assumed with 16
codes per time-slot, the intention has been to keep the TDD mode as similar to the FDD mode
as possible, in order to facilitate the implementation of dual mode systems.
Layer
Service Class Macro-cell Micro-cell Pico-cell
HMM 0% 0% 100%
MMM 5% 70% 25%
HIMM 5% 70% 25%
SD 10% 65% 25%
SM 10% 65% 25%
S 10% 65% 25%
1 FDD
carrier
2 FDD
carriers
1 TDD
carrier
Loading of Downlink 48% 42% 25%
Loading of Uplink 35% 25% 11%
Table 2.10. Possible traffic distribution between cell layers (extracted from [UMTS98a]).
Scenario Paired
freq.
allocated
to one
operator
[MHz]
Unpaired
freq.
allocated
to one
operator
[MHz]
Max.
number of
operators
Traffic per
operator
[Mbit/s/
km2]
uplink
Traffic
per
operator
[Mbit/s/
km2]
downlink
Traffic
per
operator
[Mbit/s/
km2]
Total
Spectrum
not
allocated
[MHz]
6 2x15 5 4 1.6 16 17.6 15
Table 2.11. Preferred deployment scenario (extracted from [UMTS98a]).
2.6. Some conclusions
The traffic calculations that give place to the values showed before have been done with the
Erlang-B formula and considering characteristics of the actual packet switched networks in
order to obtain some practical values.

26
No tele-traffic models are currently available to the Forum for multimedia networks carrying
mixed data rate traffic of both circuit and packet switched services [UMTS98a].
Like it has been said the UMTS Forum defines the QoS as the collective effect of service
performances which determine the degree of satisfaction of a user of a service [UMTS98b].
The Forum believes that a QoS factor of about 3 is sufficient to allow for acceptable blocking
of circuit services and reasonable delay constraints on packet switched services [UMTS98a].
Once the QoS targets for UMTS services are better understood this allowance may need to be
reviewed. The objective of this section is not only to provide some practical values that are
being frequently used in the following sections, but also to justify the need for a statistical
model for networks where inhomogeneous and asymmetric traffic may be usual, and where
applications will be a mixture of circuit and packet switched service components.

27
3. Theoretical Models
3.1. Introduction
Traffic modelling is a key element in simulating communications networks. A clear
understanding of the nature of traffic in the target system and subsequent selection of an
appropriate random traffic model are critical to the success of the modelling enterprise
[FrMe94]. This chapter deals with traffic models for future mobile telecommunication
systems, mainly UMTS (Universal Mobile Telecommunication System).
The organisation of the chapter is as follows. Section 3.2 is devoted to review some traffic
fundamentals as well as classical traffic models and the application of these models in cellular
communication systems. In Section 3.3 the impact of mobility is included, which will imply
new performance measurements. In Section 3.4 one can find the basic models when analysing
a computer network and some references to more complex models are included. Section 3.5
deals with multiservice traffic models, the final objective of this work.
The objective of the chapter is to provide the reader with theoretical tools to understand the
results that will be obtained in the next chapters. At the same time, one can follow in a logical
way (step by step) the process that has been developed in this work.
3.2 Models for Speech in Fixed Networks and its Application to
Mobile Communications
3.2.1. Introduction
A brief description of the different models used in the design of fixed telephony networks is
being presented; considering lost-calls-cleared-systems and delay systems. The final objective
of this section is to conclude about which of these models are being used in Mobile Networks.
Erlang-B, Erlang-C and Engset-B models are going to be considered. One starts by
introducing some traffic fundamentals like blocking probability, loss probability, delay
probability, call congestion, time congestion and Poisson distribution.

28
3.2.2. Traffic Fundamentals
In the literature one can find different words to express the same concept. Here, some
definitions are provided in order to avoid this problem:
Time congestion or Blocking probability: it is the proportion of the busy hour for which
the system is fully occupied.
Call congestion or Loss probability: it is the probability that an arriving call finds the
system fully occupied.
Delay probability: probability that a call has to wait in the queue (only in delay systems).
In the traffic analysis of a mobile radio system it is widely accepted that calls have a Poisson
arrival distribution [Yaco93]. The probability of k arrivals in a time interval t is then given by:
tk
ek
tkP
! (3.1)
where [s-1
] is the call arrival rate.
One can obtain the mean:
tkEk (3.2)
and the variance is:
tkEkE 222k
(3.3)
When Poisson traffic is assumed, the average call arrival rate can be determined taking
measures over a long period.
Some of the Poisson processes main properties are [FrMe94]: the superposition of
independent Poisson processes results in a new Poisson process whose rate is the sum of the
component's rates; memoryless process. Poisson processes are fairly common in traffic
applications that physically comprise a large number of independent traffic streams.
The exponential distribution is the most accepted distribution for call duration in the models
for fixed networks and it will be frequently assumed that call holding times follow this
distribution. The density function is given by:
te)t(h (3.4)

29
where is the exponential parameter. One can obtain that the mean is 1/ , and the variance
1/2.
3.2.3. Lost-calls-cleared-systems
In a lost-calls-cleared-system, arriving calls not having a free channel are blocked, and the
user has to try again. The main models for these systems are Erlang-B and Engset-B
[DuSm94].
Erlang-B
Poisson traffic generated by an infinite population is considered, and the system is assumed to
have N channels. It is also assumed that holding times have a negative exponential
distribution with an appropiate choice of the average value, so one can use the "without
memory" property (the probability that a call arrives during a time interval just depends on its
average time, ).
The call arrival rate is constant:
k= k=0,1,….,N-1 (3.5)
and the call departure rate is k times the service rate, , ( 1 ):
k=k k=1,2,….,N (3.6)
Traffic is defined like:
A[Erlang]= / (3.7)
which means that the traffic is times the average time between call departure. Assuming the
system is in statistical equilibrium, one can easily obtain the blocking probability, which is
given by the Erlang-B formula [Marti95].
N
n
n
N
Bb
n
A
N
A
ANErlP
0 !
!),( (3.8)
An application example is shown in Figure 3.1, with the traffic in the range [10, 100] Erlang.

30
N=20N=30N=40N=50
101
102
10-2
10-1
100
101
102
A[Erlang]
Pb
[%]
Figure 3.1. Blocking probability according to the Erlang-B model.
In mobile communications, one is interested in blocking probabilities under 10%, and usually
a value around 1% is taken; Figure 3.2 shows the blocking probability in different ranges of
traffic and blocking probability.
N=10N=20N=30N=50
100
101
102
10-2
10-1
100
101
A[Erlang]
Pb
[%]
Figure 3.2. Blocking probability in the range of interest (Pb<10%) according to the Erlang-B
model.

31
In a system with infinite population, time congestion is equal to call congestion. However
when the number of sources is greater than the number of devices, but not so large that the
traffic offered is constant, Engset or Bernoulli distribution must be used.
Bernoulli
Bernoulli processes are the discrete-time analog of Poisson processes [FrMe94], i.e., when
time is sloted (packets, time-slots, ATM cells). Bernoulli distribution can only be used when
the number of sources S is lower or equal to the number of devices N (S N). It is also
assumed that holding times have a negative exponential distribution, but one cannot assume
that the traffic intensity is independent of the number of calls in progress [DuSm94].
The call arrival rate is:
k=(S-k) ' , k=0,1,…,N (3.9)
where ' is the average call for free source rate, and the call departure rate is:
k=k , k=1,2,…,N (3.10)
In this case traffic is defined by:
A= '/ (2.11)
Assuming statistical equilibrium, one has:
kSkS
kAA
AkP
1
1
1 (3.12)
which is the classical form of the Bernoulli distribution.
If S<N there will not be time congestion, because there will always be at least N-S free
devices. If S=N the blocking probability is:
NN
bA
AP
1'
' (3.13)
One should note that call congestion never occurs because it is impossible that a new call
arrives when the system is fully occupied.

32
Figure 3.3 shows the graphical form of blocking probability using Bernoulli distribution,
assuming a population equal to number of channels (S=N) and traffic in the range [10, 100]
Erlang.
N=20N=30N=40N=50
100
101
102
10-2
10-1
100
101
102
A [Erlang]
Pb
[%]
Figure 3.3. Blocking probability according to the Bernoulli model.
In Figure 3.4 one can see the blocking probability using Bernoulli distribution in the range of
interest (Pb<10%).
N=10N=20N=30N=50
10-1
100
101
10-2
10-1
100
101
A [Erlang]
Pb
[%]
Figure 3.4 Blocking probability in the range of interest (Pb<10%) according to the Bernoulli
model.

33
The Bernoulli model is always more optimistic than the Erlang-B one when comparing
blocking probability values obtained with the same number of channels and for the same
offered traffic.
Engset-B
The main assumptions for the Engset-B model are: finite population with S sources, Poisson
traffic, service time approximated by a negative exponential distribution with average 1/ ,
and N available channels with S higher or equal to N [DuSm94].
The call arrival rate is:
k=(S-k) ' , k=0,1,…,N (3.14)
where S is the number of sources and ' is the average call for free source rate, and the call
departure rate is:
k=k , k=1,2,…,N (3.15)
Traffic is defined by:
A= '/ (3.16)
Assuming statistical equilibrium, one has for the blocking and the loss probabilities:
N
n
nS
n
NS
NBb
A
A
ANSEngP
0
),,( (3.17)
),,1( ANSEngP Bl (3.18)
Different populations and number of channels have been considerated to obtain the following
charts for the Engset-B model, in Figure 3.5 a population of 60 sources has been considered,
while in Figure 3.6 a population of 150 sources is assumed, so that one can compare the
behaviour of the Engset-B model with several populations. One should note that a different
traffic margin has been considered because higher traffic values with this population give
place to a near 100% blocking probability. When this number is high enough, the Engset-B
formula produces almost the same results that the Erlang-B formula.

34
N=20N=30N=40N=50
10-1
100
101
102
10-2
10-1
100
101
102
A[Erlang]
Pb
(%)
Figure 3.5. Engset-B chart with a population of 60 sources.
N=20N=30N=40N=50
10-1
100
101
10-2
10-1
100
101
102
A[Erlang]
Pb
(%)
Figure 3.6. Engset-B chart with a population of 150 sources.
In this case blocking probability is different from loss probability. As it has been defined
before loss probability means that an arriving call finds the system fully occupied, while
blocking probability is the proportion of the busy hour for which the system is fully occupied.
In Table 3.1 some numerical results are shown, comparing Engset-B and Erlang-B.
Pb [
%]
Pb [
%]

35
Population
S
Traffic A
[Erlang]
Number of
Channels N
Loss Probability [%]
Engset Erlang
40 0.05 5 2.95 3.13
40 0.1 10 0.19 0.30
40 0.15 10 1.85 2.24
Table 3.1. Comparison between Erlang-B and Engset-B (extracted from [Marti95]).
Erlang-B always gives a more pessimistic result than Engset-B, that is why Erlang-B is
usually chosen to design fixed telephony systems. One must consider Bernoulli or Engset
because models correctly the reduction of the call arrival intensity when the number of active
users increases.
3.2.4. Delay systems
In delay systems a queue is provided to hold calls that are blocked. Its measure of Grade of
Service is defined as the probability that a call waits more than a specific length of time in the
queue.
There are two main distributions to characterise delay systems: Erlang-C and Engset-C. Only
Erlang-C will be studied due to its interest, since Engset-C is very similar to Erlang-C. One
can find information about Engset-C model in [Marti95].
Erlang's delay formula gives the delay probability of a system with N channels and with a
given offered traffic A [Erlang]. It is assumed a Poisson traffic generated by an infinite
population, negative exponential service time and an infinite storage queue [Rapp96].
In this case:
k= k=0,1,… (3.19)
,...,1
,,2,1
NkN
Nkkk (3.20)

36
Assuming one more time statistical equilibrium one has:
1N
0n
nN
N
del
!n
A
N
A1!NA
AP0tobPr (3.21)
Figure 3.7 shows results for the Erlang-C model with traffic in the range [10, 100] Erlang.
N=20N=30N=40N=50
101
102
10-2
10-1
100
101
102
A[Erlang]
Pd
el[%
]
Figure 3.7. Delay probability according to the Erlang-C model.
3.2.5. Application of fixed models in mobile communications
Mobile voice communications systems are nearer to lost-calls-cleared-systems than to delay
systems. In delay systems a waiting subscriber may become impatient and leave, or the
system may run out of holding positions.
While designing a cellular system we need a first approach to know how many channels will
be necessary in each cell. Erlang-B use to be chosen for this purpose, because it is more
prudent than Engset-B. Then the design is adjusted to take into account handover, roaming,
etc, which is the objective of the next section, i.e., to study the impact of mobility.

37
In another perspective, delay in data communications is usually accepted, which implies some
storage capacity in the network. While studying multiservice communications both types of
systems have to be considered.
3.3 Traffic from mobility
3.3.1. Introduction
Classical models can be used like a first approach when designing a mobile network.
However the impact of mobility must be included when designing alternative architectures for
the next generation of mobile networks.
The high mobility associated with future systems (MBS & UMTS) yields a teletraffic
analysis, where both the new calls and the handover traffics must be considered
simultaneously [VeCo98].
This section talks about a traffic model where priority is given to handover attempts by
assigning a number of channels exclusively for handover calls among all the channels in a cell
[HoRa86].
3.3.2. Handover prioritized model
Three performance measures should be defined when modelling a mobile cellular system,
instead of just one when working in fixed networks:
Pb: probability of call blocking.
Phf: probability of handover failure.
Pd: probability of call dropout during a call.
In Figure 3.8 the scheme of the considered cellular model is shown.
The cell cross-over rate is given by [Jabb96]:
Cov
lV (3.22)

38
where V is the mobile terminal mean velocity, l is the cell boundary length, Cov is the cell
coverage area.
calls, Pb Handover calls, Blocked
New calls, n
Handover calls, h
Call Completion,
Handover failure, Phf
Figure 3.8. New and handover traffic processes, total number of channels (N), and guard
channels (g) in a cell. (extracted from [Jabb96])
The main model assumptions are [Jabb96]:
mobile terminals and their traffic are uniformly distributed over a given cell.
mobile terminals have a mean velocity of V and their direction of movement is
uniformly distributed over [0,2 ].
unencumbered call duration , channel occupancy time in a cell c and cell dwell time
h can all be modelled by an exponential distribution.
no queuing of new or handover calls is performed.
traffic in a cell is divided into two classes: new calls n and handover ones h.
a total of N channels per cell.
g channels (g 0) exclusively for handover calls.
both newly traffic and handover one are assumed to follow a Poisson process.
One can define the probability of handover as [Jabb96]:
hh PP (3.23)
Using the flow equilibrium property, one can write:
nhfh
bhh
PP
PP
)1(1
)1( (3.24)
N
g G
n

39
which can be approximated for small values of Pb and Phf as follows:
nh (3.25)
Newly and handover traffic can be defined like:
c
nnA [Erlang] (3.26)
c
hhA [Erlang] (3.27)
where c (3.28)
Then the total traffic in a cell is expressed as follows:
hn AAA [Erlang] (3.29)
With all the assumptions one can obtain the steady state blocking and handover failure using a
Markov Chain Model, these probabilities being given by the following expressions:
(3.30)
(3.31)
where c=N-g
One can see that if g=0 then Pb is equal to Phf, and the expression reduces to Erlang-B
formula.
For a call in progress the probability of call dropping can easily be determined as follows:
0 )1(1)1(
k hfh
hfhkhf
khhfhd
PP
PPPPPPP (3.32)
gc
ck
ckhc
hn
c
k
khn
ghc
hn
hf
gc
ck
ckhc
hn
c
k
khn
gc
ck
ckhc
hn
b
k
AAA
k
AA
gc
AAA
P
k
AAA
k
AA
k
AAA
P
!)(
!
)(
)!()(
!)(
!
)(
!)(
1
0
1
0

40
which for small values of Phf can be approximated by:
hfd PP (3.33)
This formula gives us the probability of forced termination during a call.
The study of particular examples allows to clarify the behaviour of these formulas. Typical
GSM values are assigned to the parameters. In the following figures the effect of using guard
channels for handover is shown, using the following values for the parameters:
= 0.00637 s-1
(V =10 m s-1
)
A [10,100] Erlang
Ah 1.134*An
N=40 channels
Ph=53.38% ( =1/180 s-1
)
These occur for example for a circular cell of radius r=1 km. In Figure 3.9 one can see that
when assigning more exclusive channels for handover calls the blocking probability increases
its value.
g=0g=2g=4g=8
101
102
10-5
10-4
10-3
10-2
10-1
100
101
102
A[Erlang]
Pb
[%]
Figure 3.9. The effect of using guard channels for handover in Pb.
In Figure 3.10 the opposite effect is shown: as it could be expected, the handover failure
probability decreases when assigning more channels to handover calls.

41
g=0g=2g=4g=8
101
102
10-8
10-6
10-4
10-2
100
102
A[Erlang]
Phf[%
]
Figure 3.10. The effect of using guard channels for handover in Phf.
One of the most important performance measures is cell dropping probability. One can see in
Figure 3.11 that the dropout probability decreases when assigning more channels exclusively
for handover calls, again as it could be expected.
g=0g=2g=4g=8
101
102
10-8
10-6
10-4
10-2
100
102
A[Erlang]
Pd
[%]
Figure 3.11. The effect of using guard channels for handover in Pd.
In the same way one can study what happens when changing the mobile speed or the cell
coverage range. In Figure 3.12 speed and handover failure are compared with 3 different

42
values for the number of guard channels; a new traffic of 20 Erlang, and a coverage radius of
1 km have been considered.
g=0g=2g=4
0 5 10 15 2010
-2
10-1
100
101
102
Vav[m/s]
Pd
[%]
Figure 3.12. Effect of speed and guard channels in Pd.
When the impact of mobility is taken into account one must cope with two probability
requirements (Pb and Phf), the use of guard channels for handover being the best solution to
cope with them. In [VeCo99] one can see that the use or guard channels for handover only
improves system performance for short duration services, while in long-duration ones the
utilisation of guard channels for handover does not.
3.4. Models for Data in Fixed Networks
3.4.1. Introduction
UMTS is the first cellular system where data is taken into account since the beginning. Third
generation mobile communications will begin to offer services that have traditionally been
provided by fixed networks [BuCN99].
The Erlang theory deals with constant bit rate sources that hold one unit of a resource for the
whole duration of the connection, i.e., circuit switching while in packet switching networks,
traffic is segmented into blocks of data (cells). When cells arrive at a switch, or when they are
ready to leave a switch, if an excess number of cells all need to use the same link at the same
V [m/s]

43
time, cells will have to be stored in a buffer awaiting transmission. This causes random delay
for the cells which may degrade performance of services based on these cells. The decision of
how to set the effective bandwidth (minimal rate which can serve a bursty stream such that
QoS requirements are met) is very much affected by the burstiness of the traffic [AdZN98].
Store-and-forward networks can be viewed as a network of queues, and the most fundamental
component in such networks is the single-server-queue [Klei76]. In this section some basic
data traffic models are shown, over which one can build more complex models by considering
more and more parameters. At the end of this section some references are included where
traffic models for broadband data networks can be found.
3.4.2. Basic Concepts
In evaluating packet-switching networks, one shall emphasise the following network
measures [Marti95]:
Loading ( ): probability that a server is busy.
K (3.34)
where is the arrival rate, is the average service rate, K is the number of servers.
Coefficient of variation (Cs):
Cs=
where is the standard. deviation of the service time.
Throughput ( ): it is a measure of the system productivity.
K (3.35)
Obviously the throughput is equal to the arrival rate if the network does not lose packets.
Average delay time ( del ): the time from the moment a packet arrives until the service is
complete.
Mean number of packets in the queue ( Q ).
Overflow probability (Poverflow): probability that the number of packets in the buffer
exceeds a certain threshold (assuming infinite buffer).
Blocking probability (Pb): probability that the buffer is fully occupied (assuming finite
buffer).
Delay probability (Pdel): probability that a packet has to wait in the queue.

44
3.4.3. Models
Before any progress can be made in considering packet switched networks it is necessary to
describe the statistics of packet arrivals on the network [DuSm94]. In some of the following
models a Poisson distribution will be assumed.
First, one must review some concepts about the Kendall notation for defining a queuing
system. For example G/G/K means:
first G, general inter-arrival time distribution.
second G, general service-time distribution.
K is the number of servers.
This is called the abbreviated Kendall notation and assumes an infinite population and queue,
as well as First Come First Served (FCFS or FIFO) service discipline; in other cases more
parameters must be included in the notation.
Only models with one server will be considered (K=1). In Figure 3.13 the considered model is
shown.
Packet arrivals, Buffer Server, Packets departing
Figure 3.13. Model of a single server queue.
M/G/1
The main assumptions for the M/G/1 are:
infinite population and queue.
FIFO service discipline.
the inter-arrival time is exponential (also called Markov) distributed.
no assumptions are made for the service time distribution.
one server is considered.

45
delQ
Working with the Markov chains one can reach to the following formulas for the average
delay and mean number of cells in the queue [DuSm94]:
(3.36)
(3.37)
These are known as the Pollaczek-Klinchine formulas. The variation coefficient can take the
following values [Marti95]:
Cs2=0, then the arrival rate is deterministic.
Cs2=1, in this case arrivals are random and follow a exponential distribution.
Cs2>1, then arrivals are random and in groups (bursty traffic).
Little's formula
The Little's formula has been used in the Pollaczek-Klinchine formulas. It allows one to
switch from the number of cells in the queue, to the average waiting time assuming stationary
arriving and departing processes; one of the possible formulations is [Marti95]:
(3.38)
The intuitive reading of this formula is that in a delay system in equilibrium, when a cell
leaves the queue after being waiting del seconds, there must be the same number of cells
(Q ) in the queue that when it reached the queue
M/M/1
The M/M/1 systems are especially important because it can be modelled like a Markov
model. The main assumptions are:
infinite population and queue.
2
2
12
11
1)1(
12
s
sdel
CQ
C

46
FIFO service discipline.
the inter-arrival time is exponential (also called Markov) distributed.
the service time distribution is also exponential.
one server is considered.
Following these assumptions Pollaczek-Klinchine formulas can be written like [Marti95]:
(3.39)
(3.40)
One can easily obtain the overflow probability expression and the throughput:
(3.41)
(3.42)
where Lb is the threshold considered for the buffer.
If one considers a finite queue the same expression can be used to obtain the blocking
probability considering that Lb is the buffer capacity. If Lb=0, that means that there is no
buffer and one obtains the Erlang-B expression considering only one server. This is important
because when packet switched multiservice communications are considered some of the
services will be queued, while other applications will be blocked if they do not find a free
path, therefore different models will be used together. Considering K servers, or equivalently
channels, and assuming infinite buffers one achieves the Erlang-C formula.
Usually one is more interested in obtaining the delay probability, since one packet will have
to wait in the buffer if there is another packet in the system, therefore:
0del P1P)0t(P (3.43)
where P0 is the probability that there were no packets in the system. Taking into account that
the service time is approximated by an negative exponential distribution, one can achieve a
formula for the probability that a packet waits in the queue more than a considered time( ):
0,e)t(P )1( (3.44)
)P1(
1
1P
overflow
2L
1L
overflowb
b
1Q
1
1
2
del

47
The study of particular examples will clarify the behaviour of these formulas. In Figure 3.14
one can see the average waiting time in the queue assuming several typical service time
values that can be assumed in UMTS. The values in Table 3.2 have been considered:
Services Effective call duration [s]
Simple messaging 30
High Multimedia 53
Medium Multimedia 14
Table 3.2. UMTS Multimedia packet-switched services characteristics (extracted from
[UMTS98b]).
Only one type of service has been considered each time giving the value in Table 3.2 to in
(3.39) and at last the three curves have been put together in Figure 3.14.
Figure 3.14. Average waiting time in a M/M/1 system considering different UMTS service
component characteristics.
As one can expect the average waiting time is larger for the services which average service
time is larger, because the server needs more time to end the job.
-- MMM
* SM
o HMM

48
In Figure 3.15 one can see the evolution of the blocking probability with the buffer capacity,
several load factors having been considered. The buffer capacity has been measured in
frames, considering that one frame is the capacity needed to storage one packet.
load=0.1 load=0.35load=0.5 load=0.75
0 2 4 6 8 100
5
10
15
20
25
30
35
40
45
Buffer size [frames]
Pb
[%
]
Figure 3.15. The blocking probability as a function of the buffer size in a M/M/1 system,
assuming several load factors.
As one can see, the blocking probability reduces its value with higher buffers, at the same
time one reaches the conclusion that a good study of traffic becomes essential for a good
network planning, in order to optimise the storage capacity available in nodes.
3.4.4. Other models
One can build or find many more complex models, for example providing priority like in to
certain classes of packets or characterising in detail the traffic [Klei76]. One can find in
[FrMe94] a brief description of the main models that can be considered when modelling
communication networks. Nowadays, in broadband data networks, there is no consensus on a
useful traffic model in the form of a simple stochastic process, bursty traffic is expected to
dominate broadband networks, and when offered to a queueing system, it gives rise to much
worse performance as compared to renewal traffic (classical models) [FrMe94].
Buffer size [frame]

49
In [AdZN98] some fundamentals about long-range dependence (or self-similarity) in data
traffic can be found as well as some models for broadband data networks like the M/Pareto
model. In the case of packet traffic, self-similarity is manifested in the absence of a natural
length of a burst: at every time scale ranging from a few milliseconds to minutes and hours,
similar-looking traffic bursts are evident [FrMe94]. In [RoPa99] the M/Pareto model is
considered not only in computer networks, but in mobile networks where data is taken in
account. In [AdZN98] one can also find some important questions when modelling broadband
networks: "what is the proper average utilisation level affected when the traffic is composed
of many traffic streams?" or equivalently, "how much bandwidth is required to serve a bursty
traffic stream such that certain quality of service requirements are met?"
In another way, at the time UMTS reaches service, ATM will be an established transmission
technique; hence UMTS environment should also support ATM-cell transmission up to the
user's terminal [BuCN99]. In an ATM network the main QoS parameter is the cell-loss rate
and it is a function of a set of congestion-control parameters; an ATM network provides some
procedures to keep the QoS between the desired thresholds. Fluid traffic models [FrMe94] are
particularly suitable for modelling ATM networks.
3.5. Models for mixed traffic (voice and data)
3.5.1. Introduction
The UMTS is the first cellular system that has considered heterogeneous traffic from the
beginning. Applications over UMTS are going to be a mixture of several service components,
this allows a big number of new applications, but at the same time implies a different point of
view in traffic modelling. Now, one has to take into account the different characteristics of
service components and one has to manage more parameters and attributes.
For heterogeneous and multimedia traffic or systems the performance measures of QoS
parameters are much more complex, since QoS values depend on the assumptions for the
traffic type. The chosen medium access system (TDMA, FDMA, CDMA) will have a capital
influence in traffic behaviour, e.g., in a TDMA system a feature such as a rearrangement of
slots and packing, may change the results significantly, and the exact analysis [Jabb96]. In

50
this work WCDMA/FDD is being assumed, in Annex A one can find more information about
how it works.
This section deals with a model where customers arrive according to a Bernoulli-Poisson-
Pascal (BPP) process and where ON-OFF sources are considered. At the same time, several
models are briefly described in the way that one can easily find their main assumptions and
conclusions. Some references are also given to the interested reader.
3.5.2. The analytical model
The considered model is being constructed over the main ideas developed in [AwVa96] due
to the stability of the algorithm as well as the assumption of the BPP process that correctly
models the behaviour of mixed traffic arrivals.
Modelling mixed traffic is a hard work, even more if, like in UMTS, we consider circuit
switched and packet switched services, WCDMA and TD-CDMA, a hierarchical cell
structure and so on. The solution should be going step by step, hence this analytical model has
to be considered not alone but with all the assumptions that are being detailed.
In this first stage the chosen transmission technique is WCDMA (FDD mode of the UTRA
proposal), which implies symmetric applications using paired bands. As it was said in Section
2.2, WCDMA –FDD will provide wide area coverage while TD-CDMA will be used in pico-
cells where asymmetric applications will be more important.
Assumptions
Here the main assumptions and hypotheses are detailed, this is a key point since defines the
conditions under which the model is valid:
1. As it was said WCDMA-FDD has been chosen as the transmission technique.
2. The second main assumption is that all service components are circuit switched. Instead of
the differentiation that was done in first sections between packet switched and circuit
switched services. If one considers packet switched services it becomes necessary to study

51
the delay probability, here the packet switched services are assumed to behave like circuit
switched ones. The call occupancy, e.g., is not suitable to characterise packet switched
services, however an estimation of effective call duration will be considered. The blocking
probability will be the considered performance measure parameter. One can find some
information about mixed services models considering delay in [Rebe96], despite of being
developed for ATM networks, mixed traffic is considered and MMPP processes are used
to obtain different performance measurements for packet switched networks.
3. Since blocking probability means that no resources can be allocated to an user, one is
more interested in studying the downlink. In the uplink there is no limitations in the
number of channelisation codes because each active user gets assigned a different
scrambling code.
4. The variable rate services are evaluated using a fix rate bearer, which leads to a simpler
Base Station design. Even in real situations, during the channel setting-up process the
Base Station can avoid the variable rate services, in this situations TFCI is not needed.
5. Only one spreading factor is being considered in each cell, which means that some of the
WCDMA flexibility is lost. Then, only one kind of code channel is available and only
some data rates are available through code aggregation. This situation will be common
during the first years in UMTS and allows the operator to control the complexity of the
Base Station.
6. One will usually assume that 15 kbit/s basic code channels are being used in order not to
loose efficiency in the speech (S) service (one user of the S service needs one 15 kbit/s
channel). This assumption correctly models the multi-spreading factor situation in the
downlink. As one can see in the Annex A, when a lower spreading factor, or equivalently
a basic code channel with a higher bit rate, is being used all the code channels obtained
from this in the code tree are not orthogonal and hence can not be used. For example,
when a spreading factor of 128 is being used the couple of channelisation codes (which
spreading factor is 256) obtained from this becomes unavailable.
7. Different applications can be multiplexed over a code channel if the aggregate data rate is
minor or equal than the considered basic channel data rate. If a UE, User Equipment,
wants to transmit data of different services, it gets assigned a specific output power/rate
threshold. The aggregate rate of all the services must be below this threshold. A more
detailed study of how the different streams share each code channel can be done
considering different source models, but it is out of the interest at this moment
[DBKO98].

52
8. Higher data rates are available through code aggregation.
9. No mobility is assumed in this first stage.
10. Only dedicated channels are considered since common channels are only used to carry
small amounts of traffic.
Definition of the main parameters of the model Here the parameters being used in the model are defined, some of the values that will be used
in the traffic simulations are also given in order to know the order of magnitude.
The considered basic code channels bit rates are: 15, 30, 60, 120, and 240 kbit/s. As it has
been said, one will usually take 15 kbit/s as the basic code channel to achieve the
maximum flexibility in the code channels management.
N available code channels per cell.
M is the number of potential users in a cell.
K is the number of considered applications.
The capacity demand vector is:1
K
c
c...C , and shows the number of code channels that
each application demands.
The number of active users of each application can be seen like: U(t)=[U1(t),…,UK(t)]
Arrivals are assumed to follow a BPP arrival process [AwVa96]. The Pascal distribution is
out of the interest of this work, so only Bernoulli and Poisson distributions are being
considered. Hence we can express the arrival intensity, conditioned on nk customer being
in the system, like follows:
kkkkk n)n( , with k>0 (3.45)
In the Bernoulli case we have: )()nU()n(0 kkkkkk (3.46)
while in Poisson: kkkk )n(0 (3.47)
k and k depends on the applications. k is the activation rate of the application k, and k
is a the part of the arrival intensity that does not depend on the system state.
In the theoretical model the arrival rate ( k(nk)) is used normalized by the service rate ( k),
resulting:
k
kkkk
)n()n(A (3.48)

53
Iddle
1st
applic.
2nd
applic.
Kth
applic.
then Ak is the traffic generated per free user and for each application k.
Applications activation
As it has been said a customer has access to a group of K applications (a [1,K]) with
generation and total service rates, a and Ha ( a, a in the static case), respectively and with a
proportion among all the applications of propa (such that 1propK
1aa ). Each user can be
either in an idle state or using one of the K applications like it can be seen in the Figure 3.16.
1
H1
2
H2
… K
HK
Figure 3.16. Model for applications activation.
As it was said up to K applications are being considered, the number of parameters that an
application requests is one of the parameters that characterises each application, the value of
this parameter is obtained following the process being shown in Figure 3.17.
Figure 3.17. Procedure to obtain the number of requested code-channels for each application
class.
Application
= (service
components)
Requested
data rate
Basic
channel data
rate
Number of
requested
basic
channels

54
The proportion of users of an application among all the available ones can be expressed like:
K
1ii
a
K
1iii
aaa
A
A
H
H/prop (3.49)
The solution being:
aa propAA (3.50)
where the A constant is given by:
K
1iiAA (3.51)
From Figure 3.16 it is straightforward to obtain the probability of an user having an active
application:
aaK
1ii
aa propfprop
A1
A
A1
Ap (3.52)
where f is the fraction of active users given by:
A1
Af (3.53)
Now, the parameters of the BPP arrival process can be particularised. In the Poisson case:
aa AMf and 0a (3.54)
while in the Bernoulli one:
aa A and Maa (3.55)
In teletraffic usually one is interested in obtaining the blocking probability in function of the
average load. The load from each user is obtained by computing the expectation of every
application data rate [Vele99]:
K
1iiiu bpL (3.56)
where bi is the application number i data rate.
Leading to the system average load (multiplying by M):
McfMLL lu (3.57)
where:

55
K
1iiil bpropc (3.58)
the cl gives information about the average resources that will be used by each user, driving to
a better understanding of the system behaviour.
Theoretical model
Now, one has a complete definition of the system as well as of the different parameters that
must be taken into account. The main objective of the model is to obtain an expression for the
blocking probability; usually one is more interested in determining a blocking probability
threshold obtaining the supported fraction of active users that satisfies this requirement. Here
an analytical formula will be obtained, in the Annex B one can find the mathematics to
transform this formula into a recursion in order to facilitate the computation.
One must start identifying the different situations that can occur when a new attempt (the term
attempt is being used for voice and data "calls") achieves the system. The first step is to
obtain the number of used channels in an instant t, being given by:
C)t(U)t(Y (3.59)
where U(t) is the vector with the number of active users of each application, and C is the
capacity demand vector, in number of channels.
Now two situations are possible, the attempt can be admitted or blocked. The set of feasible
states is defined by (and gives the number of active users of each application that can be
served by the system):
NCn/nU K (3.60)
where U is the vector that contains the number of active users of each application, and n is the
vector of users of each application being in the system.
The blocking situations , which means that a new attempt arriving to the system does not find
enough free resources, can be mathematical expressed by:
NCCn/UnB kk (3.61)
where Bk is the blocking probability for the application k, and Ck is the number of channels
that the application k requests. Then, the request will be cleared, and the customer blocked,
which means that the system remains in the same state. Further work should be done in order

56
to investigate the consequences of considering the existence of buffers in the networks for
services which allows delay [Rebe96].
One can obtain the class k Blocking Probability by dividing the situations for which the new
attempt is blocked by the set of feasible states as in the following formula:
Unk
Bnkk
kb )n(p
)n(p)n(
P k (3.62)
The state probability marginal function, p(n), represents the probability of the system being in
the state n or equivalently the probability of n users being in the system; taking into account
the different applications being considered, its value can be obtained using:
Un
K
1kkk
K
1kkk
)n(v
)n(v
)n(p , for n U (3.63)
where the unormalized marginal probabilities, vk(nk), are obtained for each application and
give the probability of having exactly nk users of the application k in the system:
kk
k
nk
U
nkk )()n(v , for the Bernoulli case. (3.64)
!n)n(v
k
nk
kk
k
, for the Poisson case. (3.65)
The formula (3.52) will be computed to obtain practical results in the next sections by
modifying the parameters in order to study the influence of each one in the behaviour of the
system. As it has been said (3.52) is being transformed into a recursion in order to facilitate its
implementation and computation.
Typical Values for the Parameters
Some numerical values for the parameters are given in order to have a better view of its order
of magnitude as well as of its meaning. The values being presented here will be used in the
following chapter to obtain the system performance evaluation.

57
The basic code channel rate being considered is 15 kbit/s, then applications will request a
specific number of basic code channels according to their aggregate bit rate. The number of
basic code channels in a cell depends on the system simulation that considers the effect of
interferences, the maximum number being 256 channels, each of 15 kbit/s.
The number of potential users in a cell depends on the considered scenario, typical values
between 100 and 400 being assumed in micro-cells with R equal to 400 m. Different
applications will be available in each scenario, i.e., one can consider a set of applications like
S, SD and MMM, thus K being equal to 3. The number of code channels that each service
requests can be obtained by dividing its aggregate bit rate by the basic code channel bit rate;
considering the same example and typical UMTS values, one has:
115
15c1 basic code channel
415
60c2 basic code channels
3215
480c3 basic code channels
The fraction of active users (f) is the free parameter and it will be varied in order to obtain the
blocking probability as a function of f. One is interested in obtaining the value of f for a given
blocking probability threshold, e.g., 2%, thus leading to typical values between 10% and 60%.
3.5.3. Model Extensions
Influence of Terminal Mobility
The next step should be to introduce the impact of mobility in the system, which implies some
modifications. One assumes that the flow equilibrium for the traffic equations [Jabb96] valid
for Poisson distributed traffic, can be extended to the Bernoulli case.
It consists in determining the expected number of handovers for each application, a, and then
multiplying a , obtained for the static case, by a factor that reflects the effect of mobility:

58
a
aaaa´ (3.66)
where 'a is the activation rate of each application class a considering mobility.
The blocking probability may not be affected by the mobility for a given fraction of resource
occupancy of an application, while for each application class a the handover failure
probability is:
maxda
a
ahf PP (3.67)
In WCDMA/FDD three different types of handover should be considered:
Intra-Frequency Handover: one user moves from a cell to another that uses the same
frequency (or frequency set) and he only has to change his code. This will be the more
frequent situation.
Inter-Frequency Handover: one user moves to a target cell where the frequency (or
frequency set) is different from the origin one. It occurs for example when a Mobile
Station enters into a micro-cell coming from a macro-cell.
Inter-System Handover: one UMTS user enters in a cell where only GSM services are
provided, for example. This is the less common handover among the three types.
When a handover is near to occur one must study the interferences in the neighbour cells,
obviously when a user is using a high data rate service the handover will not normally be
possible because it would increase a lot the interference level in the rest of the users being in a
cell. At the same time, during the handover process the user is using resources in more than
one cell (usually up to three) due to soft handover.
Another approach can be studies considering the definition of guard channels (this implies
different resource types) or the decoupling of multimedia calls in voice and data parts giving
priority to voice.
Different spread factors
As it has been said, one can consider that different spreading factors are available in a cell.
Hence, the user can access to different combinations of basic code channels. The main

59
difficulty of this process is the estimation of the available number of channels of each class at
each moment, while it leads to a more flexible and efficient use of the spectrum. The use of
more than one spread factor implies a more detailed study of the uplink as well as of the way
the applications are multiplexed over a code channel.
Asymmetry
One of the key points of UMTS is to consider asymmetric applications, for which, like it has
been said, TD-CDMA (TDD mode) copes best. Hence, the next stage of the work should be
to consider the traffic related characteristics of TD-CDMA and to improve the system
analysis.
Another solution can be considered, instead of not being considered in the first UMTS
specifications, so that an operator can decide to use the paired bands to carry asymmetric
connections since it is possible to set uplink and downlink bearer service characteristics
independently.
Packet and Circuit Switched Services
The last step of this work should be to consider both types of services as well as the different
performance measures that this separation implies. Obviously the assumptions here will differ
from the initial ones and the existence of storage capacity in the network and its influence in
the overall system planning must be considered.
3.5.4. Other models
In this subsection a briefly study of other models is done. One can find the main assumptions
that may be done as well as some interesting conclusions. The first one [KeLi99] does not
deal with a UMTS network but with a GSM/GPRS one. The GPRS (General Packet Radio
Service) is an evolution of the second generation systems and it is being implanted now and is
being useful to understand the behaviour of the mixed traffic.
Some models for voice/data integrated in third generation digital cellular networks are also
provided. The second one [NaAc95] of them makes a different study for real-time and non-

60
real-time traffic and ends by mixing the two types considering three different sharing
schemes. Another one [MMMM98] gives the chance to define three types of traffic where the
third one is a mixture of the other two, different priority being given to each kind of traffic. A
fourth model [RoPa99] explores the performance of a Reservation Random Access (RRA)
scheme for transmitting data packets over a common radio broadcast channel considering
voice traffic and data packet traffic .
GPRS Model
A GPRS model is extensively explained in [KeLi99]. The main point of interest is the
reservation of a specific number of channels for data transfers only, while the rest of channels
are shared with strict priority of voice calls over data transfers. As one can expect, a queue is
provided for data calls, while the voice call is blocked if no resources are available. Due to the
voice call priority in the shared channels, a resource reallocation algorithm is provided.
The theoretical analysis is based upon the Erlang-B formula. Results from the analysis show
that while reserving channels for GPRS is beneficial for the GPRS user, the system gain is
minimal. Another important conclusion deals with variance of total delay and shows that it is
difficult to confidently predict what these delays will be, which is important when QoS
guarantees must be given. In overview, it can be concluded that for a best effort service there
seems to be no need to reserve any GPRS channels, while it will be essential when offering
QoS guarantees to GPRS calls.
Class-Based Wireless Call Admission traffic model
A model for class-based wireless call admission traffic is completely defined in [NaAc95]. An
adaptative call admission control mechanism for wireless networks supporting multimedia
traffic is introduced. Here two classes of traffic are considered: real-time and non-real-time
traffic. Each one is separately studied and then three different sharing schemes are shown:
Complete Partitioning: real-time connections have access to a defined number of channels
and non-real-time to the rest of the channels.
Class I Complete Access: real-time connections can use up to the total base station
capacity with preemptive priority over non-real-time connections.

61
Class I Restricted Access: real-time connections can use up to a reserved number of
channels with preemptive priority over non-real-time, and the rest of the channels is
dedicated to non-real-time connections.
For real-time connections the following feature measurements are considered: the new call
blocking probability and the forced call termination probability. The Erlang-B formula is used
to determine the admission blocking probability of new calls and the handover dropping
probability.
For non-real-time connections the same assumptions are made, and in addition it is assumed
that the total base station capacity is shared equally among all active mobile users within its
domain at any given time. A wireless network with call admission control and with a limited
number of calls admitted can be modelled as a truncation of the state-space of an open
queuing network of M/M/ queues.
This model concludes that the combination of call admission and resource sharing enable the
network operator to guarantee a predefined QoS to different traffic classes in the complex
environment of micro-cellular networks supporting multimedia traffic [NaAc95].
Voice/Data/Multimedia model
The analytical model developed in [MMMM98] is based on continuous-time
multidimensional birth-death processes. Three classes of service are considered: basic voice
service, data service and multimedia service, which is composed of a voice component and a
data component. Some channels can be reserved to handovers. The point of interest of this
article is the handover management, multimedia calls that cannot complete a handover being
decoupled, in a way that the voice call continues while the data connection is suspended. New
calls are not accepted while existing a decoupled call, in this way priority is given to resume
the suspended service over new calls.
Situations where the incoming and outgoing handover flows are not balanced are considered,
this can be, e.g., the situation of a cell covering the business district of a city during the
morning rush hour.

62
Burst traffic model applied to Mobile Communications
A burst traffic model is extensively detailed in [RoPa99]. The voice traffic is modelled like an
ON-OFF process (two-state discrete-time Markov) while data traffic is characterised by a
Pareto distribution. A Reservation Random Access scheme for transmitting data packets over
a common radio broadcast channel in a cellular radio environment can also be found.
The main conclusion is that Reservation Random Access schemes originally designed for
Poisson data message arrival process can also efficiently operate under the extremely bursty
traffic arrival process characterised by Pareto message interarrival times [RoPa99].
Many more references to analytical models for mobile networks supporting multimedia
services and for third generation wireless networks are available in the literature, e.g.,
[Vele99] deals with Mobile Broadband System (MBS) but it is included due to its interesting
separation between applications and service components.

63
4. Performance Evaluation
4.1. Introduction
In order to show how the theoretical model can be used to study the performance of the
cellular mobile communication network some results are provided, obtained with different
configurations of the system under study.
Although the maximum number of available code channels per frequency in UMTS-
WCDMA has been set to 256, the fact is that the main limitation in WCDMA systems is not
this maximum number of channels but the interferences among users due to the non
orthogonality of the codes.
The following work is built over several WCDMA system simulations [DaPi00], hence the
obtained results are referred to them. Taking the estimated maximum number of available
basic code channels in a cell from these simulations, the fraction of active users in a cell is
obtained. The performance measure usually being considered by ETSI regarding UMTS is
that 98% of the users are satisfied. A user is satisfied if all three of the following constraints
are fulfilled:
1. The user does not get blocked when arriving to the system.
2. The user has sufficiently good quality more than 95% of the session time.
3. The user does not get dropped due to BER requirements.
The system simulations developed in [DaPi00] copes with the last two requirements while the
traffic analysis deals with the first one. Then combining both results one can obtain the exact
UMTS-FDD performance.
4.2. Procedure's Flowchart
This subsection deals with the complete procedure that will be done to obtain the performance
measurements. In a graphical way one can understand what is occurring at each moment. The
process that is showed in Figure 4.1 can be viewed as a black box obtaining some outputs
from several inputs, and under the appropiate assumptions, the same that were detailed in the
subsection 3.5.2.

64
Environment
Basic Code Channel
Poisson/Bernoulli Pbk
Considered
applications
Figure 4.1 Scheme of the model
The Black Box is composed of several modules; some of them are directly related to the
analytical model, while others are used to convert the inputs into the parameters being used in
the algorithm. The first block is the System Capacity Module, which gives the total number of
basic code channels available in the considered environment, Figure 4.2. This block is being
used when no simulations for mixed services are available.
Spectral efficiency for each
service component[kbit/s]
basic code channel
bit rate [kbit/s]
Figure 4.2. Flowchart of the System Capacity Block.
Another important part is the calculation of the channels that a certain application requests to
the system. One application is composed by one or by more than one service components, the
k k (kbit/s)k
Previous Simulation
% of expected users
of each service
component
Global rate threshold [kbit/s] in
the considered environment
Number of basic code
channels available
Capacity
Block
C
estimation
Algorithm
N
C

65
aggregate traffic of all the components being calculated, and then divided by the basic code
channel bit rate thus obtaining the number of channels that the application requests. A step
further in this implementation deals with the fact that priority is given for voice over data
communications, which means that some resources can be reallocated to voice attempts when
needed.
The most important module of the system is the algorithm. Figure 4.3 shows the inputs
leading to the blocking probability for each application, while in Figure 4.4 a simple
flowchart, explaining the algorithm, can be found
Poisson/Bernoulli N
1
1 Pb1 C1
… …
K
K PbK
CK
Number of Expected Users
Figure 4.3. Scheme of the Algorithm Module.
Figure 4.4. Algorithm's Flowchart.
Algorithm
Inputs Parameters
initialization
free
resources?
Pb
calculation
Update of
Parameters
Distribution
of the
resources
NO
YES

66
The Algorithm block is the only one that really implies difficult operations, and the numerical
stability of the computation must be taken into account. This block basically implements the
algorithm for the computation of the blocking probability in multi-traffic loss systems as
found in [AwVa96], under the assumptions of the theoretical model explained in Subsection
3.5.2. N and Ck are the output of other blocks, while k and the number of expected users are
part of the scenario definition to be addressed next. k is the free parameter that will vary in
order to obtain the blocking probability figures. A more detailed description of the algorithm
can be found in Annex B as well as some aspects related with its validation.
4.3. Definition of the Scenarios
4.3.1. Introduction
The environment definition is a key point in the simulator. One must try to build a complete
definition for each scenario in order to reduce the number of needed input parameters. A
complete definition of the scenario implies:
The number of expected users.
The set of considered applications for each scenario.
The rate threshold per frequency in kbit/s/cell.
The mean service time for each considered application.
Table 4.1 shows the percentage of expected users of each application in each considered
environment after the UMTS Forum market studies.
Penetration [%]
HIMM HMM MMM SD SM S
CBD 1 5 8 10 25 60
Rest of scenarios 0.5 4.7 4.7 10 25 60
Table 4.1. Penetration rate in percentage per Operation Environment and Service, Year 2005
(extracted from [UMTS98b]).
It should be noted that here the use of each service is not exclusive. Each penetration figure
refers to the penetration of this service as a proportion of the total potential user base. Since
users can use more than one service it is possible for the total penetration in an environment

67
to exceed 100% if a high proportion of users are using more than one service. Usually one is
more interested in simpler scenarios where only two or three types of services are considered.
4.3.2. Services Description
In Table 4.2 one can find a description of all the service types defined by the UMTS-Forum,
as well as some new parameters of interest. The new parameters now being defined are:
the description, which informs some of the service attributes, e.g., if the service is
symmetric or asymmetric, and continuous or bursty.
the average service duration, which is a typical concept of circuit switched networks.
Nevertheless, an estimation of effective call duration is used for packet switched services
the typical data rate, which refers to the information source bit rate, and means the real
amount of information.
the physical channel rate, which is the bit rate once considered the control information,
tail bits, CRC bits, etc. One obtains the number of channels that each service requires
dividing the value of the physical channel rate by the basic code channel bit rate (being one
of the following values 15, 30, 60, 120 or 240). In Annex A one can find more information
about the relationship between the channel data rate and the physical channel data rate.
the switch mode, which indicates whether the service is circuit or packet switched.
the service class parameter, which can take the following values:
S: Speech.
UDD: Unconstraint Delay Data.
LCD: Long Constraint Delay.
SCD: Short Constraint Delay.
The grey rows in Table 4.2 correspond to the services being considered in the scenarios that
will be defined later. As it has been said, only circuit switching services are considered, but
MMM is here assumed to have a like circuit-switched behaviour. UDD services are not
considered since they are typical packet switched applications. On the other hand SCD have
been excluded in the system simulations that will be used as a starting point to the traffic
study.

68
Service Description Average
service
duration
[s]
Typical
data rate
[kbit/s]
Physical
channel
rate
[kbit/s]
Switch
mode
Service
Class
S Sym.,
continuous,
minimum
delay
60 8 15 CS S
SM Asym., bursty,
tolerance to a
range of delays
30 14 30 PS UDD
SD Sym., tolerance
to a range of
delays
156 40 60 CS LCD40
MMM Asym., bursty,
tolerance to a
range of delays
14 320 480 PS LCD320
HMM Asym, bursty,
tolerance to a
range of delays
53 1920 2880 PS LCD1920
HIMM Sym,
continuous,
minimum
delay
144 128 240 CS SCD
Table 4.2. Description of the applications.
4.3.3. System Simulation Results
Results from system simulations [DaPi00] concerning the Spectral Efficiency for the
Pedestrian mobility class are shown in Table 4.3; besides the normalized values in
kbit/s/MHz/cell, the overall ones for 1 and 2 carriers are also shown (i.e., taking 5 or 10 MHz
bandwidth).
The number of carriers assigned to an operator will vary in each country, but the preferred
solution leads to three paired carriers for the FDD mode and one unpaired carrier for the TDD
mode. Since different frequencies should be used in the different cell hierarchic levels, the
assignation of three carriers to a cell must be avoided. The results are given by separate
services and for three of situations where multiservice has been considered. The multiservice
situations are described in Table 4.4.

69
Pedestrian
[kbit/s/MHz/cell]
Pedestrian with 1 carrier
[kbit/s/cell]
Pedestrian with 2
carriers
[kbit/s/cell]
Uplink Downlink Uplink Downlink Downlink Uplink
S 132.6 123.2 663.0 616 1326 1232
LCD40 177.9 396.8 889.5 1984 1778 3968
LCD320 107.5 268.8 537.5 1344 1075 2688
Urban1 121.6 272.0 608.0 1360 1216 2720
Urban2 107.4 135.0 536.8 675 1074 1350
Urban3 Not
available
186.4 Not
available
1864 Not
available
2796
Table 4.3. Spectral efficiency in the Pedestrian Simulations.
Proportion of users [%]
Urban1 Urban2 Urban3
S 80 70 70
LCD40 20 20 20
LCD320 - 10 -
LCD1920 - - 10
Table 4.4. Multiservice scenarios description.
Now it is straightforward to obtain the number of available channels in a cell, by dividing the
aforementioned values by the considered code channel bit rate. In this way the starting point
for the traffic analysis is much more realistic, since the maximum available number of code
channels is not considered, but a number which takes into consideration the main limitation in
a CDMA system that, i.e., the interference level.
4.3.4. Considered Scenarios
The definition of the scenarios being considered is now done. Table 4.5 includes all the
required parameters. In all the scenarios the micro-cell structure is chosen, its dimensions
being the ones in Table 2.2. The macro-cell will be used for rural areas where the expected
amount of traffic will be low, while pico-cells will usually be considered in the TDD mode, in

70
order to cope with asymmetric traffic generated by high data rate applications. Each scenario
is characterised as follows:
In Urban1 only voice and switched data up to 60 kbit/s are available. It corresponds to
areas with a moderate density of users where high mobility can be accepted; a typical
situation for the Urban1 scenario is the bounder limits of cities or an area near a
commercial centre. The number of users will be modified in order to analyse the system
response.
In Urban2, only low mobility is considered and a user can has access to voice, switched
data (LCD40) and data services up to 480 kbit/s (LCD320). Typically the downtown or the
central business district (LCD) when a higher number of users is being considered.
The Urban3 is a hypothetical scenario where users can have access to services up to 2
Mbit/s, as it has been said, this service will be available only in the pico-cell environment
and in the TDD mode due to the high asymmetry of the HMM services; the interest of
including this scenario in the analyses is to study the impact of including high data rate
services in the system.
One should note that only the downlink will be examined, since the traffic study in
WCDMA/FDD is referred to the allocation of the channelisation codes. In the uplink each
mobile station in a cell gets assigned a scrambling code and no limitation exists in the number
of channelisation codes; while in the downlink the information destined to each user is
transmitted using one or two scrambling codes, thus being the channelisation codes the
resource being shared.
Scenario Example Max.
avail.
data
rate
[kbit/s]
Max.
number
of
expect.
users
Cell
avail.
rate
(1
band)
[kbit/s]
Services Usage
[%]
Averag
e
service
time
[s]
Service
data
rate
[kbit/s]
Req. bit
rate
[kbit/s]
Urban1 Outer
city
144 500 1360 S 80 60 8 15 LCD40 20 156 40 60
Urban2 CBD 384 500 675 S 70 60 8 15 LCD40 20 156 40 60
LCD320 10 14 320 480
Urban3 Hypot.
case
384 100 932 S 70 60 8 15 LCD40 20 156 40 60
LCD1920 10 53 1920 2880
Table 4.5. Initial Scenarios definition.

71
Now that the definition of the initial scenarios is complete, results from the algorithm are
shown in the next Section, some of the values in the tables will be varied in order to obtain
values for the higher number of combination of applications and scenarios.
One should note the basic code channel that will be used in the evaluations has a bit rate equal
to 15 kbit/s, thus one S user only needs one basic code channel and no efficiency is lost. The
other services rates will be reached through code aggregation. In Table 4.6 one can find the
number of basic code channels being available in each scenario, and the number of channel
being requested by each service, as well another parameters that characterise the scenario like
cl and Lmax. The maximum load (Lmax) corresponds to all users being active; obviously this
situation never occurs, because some of them would be blocked.
Scenario Carriers
per cell
Available
channels per
cell
Number
of users
cl [kbit/s]
Lmax [Mbit/s]
Services Channels
per
service
Urban1 1 90 100 24.0 2.4 S 1
LCD40 4
2 180 200 24.0 4.8 S 1
LCD40 4
Urban2 1 45 100 70.5 7.5 S 1
LCD40 4
LCD320 32
2 90 100 70.5 7.5 S 1
LCD40 4
LCD320 32
3 135 100 70.5 7.5 S 1
LCD40 4
LCD320 32
Urban3 4 248 100 309.0 30.9 S 1
LCD40 4
LCD1920 192
Table 4.6. Scenarios characteristics.

72
4.4. Urban1 Results
4.4.1. Introduction
The Urban1 is the most common of the three considered scenarios and it is applicable to a
great range of situations like, for example, the bounder limits of a city or an area near a
commercial centre. Only speech and low data rate services (up to 60kbit/s) are available, but
in change high mobility can be assumed. The arrivals are assumed to follow a Bernoulli
process. During this first stage mobility is not being considered, its impact in the system being
studied later in this chapter.
4.4.2. One Carrier per Cell
One must start obtaining some values that gives some information a priori, about how the
system behaves. Dividing the available rate in a cell (taken from Table 4.3) by the cl value in
Table 4.6, one obtains that 56 is the maximum number of active users that a cell can assume,
before traffic analyses, each one generating a load of 24 kbit/s.
In Figure 4.5 one can see the blocking probability as a function of the fraction of active users
for both, Speech and LCD40 users. The blocking probability is obtained for both services for
a set of f values, then a blocking threshold is decided and the more restrictive curve
determines the maximum supported fraction of active users; thus leading to the number of
active users in the system, taking into account the usage of each application is straightforward
obtaining the number of active users of each application. The arrivals are being assumed to
follow a Bernoulli process.
One can see that despite only 20% of the users are LCD40 ones, the Data service limits the
system, since its blocking probability is higher than the S one. Now, the objective is to know
the fraction of active users supported by the system when the blocking probability threshold
(2%) is reached. The LCD40 curve is the first one that reaches the 2% value, and it happens
when f is equal to 33, since the population is 100 users one concludes that 33 users can be
active at the same time, which leads to 26 Speech and 7 Data users.

73
10 15 20 25 30 35 40 45 5010
-4
10-3
10-2
10-1
100
101
f [%]
Pb
[%
]
Figure 4.5. Blocking probability for the Urban1 in terms of the fraction of active users
scenario assuming 100 expected users.
One solution to overcome the limitation of the system can be considering different thresholds
for speech and data services, for example 2% can be assumed for speech users, while a
blocking threshold of 10% can become acceptable for data services if the user equipment is
correctly designed, for example implementing automatic repetition of the set-up process or
making use of some kind of cache memory in order to supply the connection when blocking
situations occur. Since the data service is long constraint delay some delay can be assumed
without modifying the system behaviour. When this possibility is taken into account the
system is limited by the Speech service and the system allows for 38 active users, leading to
31 speech users and 7 data users.
The Figure 4.6 shows the blocking probability as a function of the system load in kbit/s,
which is obtained by McfL l . The main interest of this figure is to obtain how many
resources are being used in the limit case, when the blocking probability threshold is being
reached; as one can see this occurs when the system load is 800 kbit/s, hence taking into
account that the total available bit rate in the cell is 1360 kbit/s, then 58% of the resources are
being used in the limit.
-- S
* LCD40

74
Assuming again different blocking probability thresholds for Speech (2%) and Data (10%)
users, one gets the system load in the limit case, leading to 910 kbit/s then the 67% of the
resources are being used, which means that the system is being used in a more efficient way.
300 400 500 600 700 800 900 100010
-4
10-3
10-2
10-1
100
101
L [kbps]
Pb
[%
]
Figure 4.6. Blocking probability for the Urban1 scenario as a function of the system load
assuming 100 expected users.
One modification was made, changing the number of potential users in a cell, 200 being now
the number of expected users. Since the services being considered are the same no
modifications have to be done regarding the load generated by each user, but the maximum
cell load now is 4.8 Mbit/s.
Since the number of expected users is now the double, the supported fraction of active users
being obtained is the same as before but divided by two, as one can see in the Figure 4.7.
Figure 4.8 shows the blocking probability in terms of the system load in kbit/s, where one can
conclude the same things as from the Figure 4.6. The obtained efficiency of the system is the
same (58%) when the same blocking probability threshold is considered.
-- S
* LCD40

75
5 10 15 20 25 3010
-4
10-3
10-2
10-1
100
101
f [%]
Pb
[%
]
Figure 4.7. Blocking probability for the Urban1 scenario in terms of the fraction of active
users assuming 200 expected users.
400 600 800 1000 1200 140010
-4
10-3
10-2
10-1
100
101
L [kbps]
Pb
[%]
Figure 4.8. Blocking probability for the Urban1 scenario as a function of the system load
assuming 200 expected users.
From this situation one can extract some interesting conclusions:
The first one has to do with the fact that when the number of expected users being
considered is much higher than the number of channels the behaviour of the Bernoulli
-- S
* LCD40
-- S
* LCD40

76
distribution becomes more Poisson like, then changing the population has not a direct
influence in the system behaviour. This is an important conclusion since it makes no sense
simulating scenarios where a huge number of expected users is taken into account when
system limitations can be extracted from more accurate situations.
The second one refers to the fact that the number of supported users ( Mf ) does not
depends on the considered population (M), which means that if the number of expected
users is increased the fraction of active users will decrease, thus keeping the number of
supported users constant.
Figure 4.9 is the result of simulating the system with exactly the same conditions as in the
Figure 4.7, but considering that the arrivals follow a Poisson process: as one can see the
results are very similar, and this situation improves when the number of expected users
increases, then leading to the conclusion explained above.
5 10 15 20 25 3010
-4
10-3
10-2
10-1
100
101
f [%]
Pb
[%
]
Figure 4.9. Blocking probability for the Urban1 scenario in terms of the fraction of active
users assuming 200 expected users (Poisson arrivals are considered).
In Figure 4.10 both Poisson and Bernoulli results are drawn together in order to show the
order of magnitude of the differences. One should note that differences between the obtained
curves are almost negligible, in this situation the number of code-channels is 90 and the
population is 200 users. If one increases the number of expected users, the difference
decreases and Bernoulli becomes more Poisson like.
-- S
* LCD40

77
5 10 15 20 25 3010
-4
10-3
10-2
10-1
100
101
f [%]
Pb
[%
]
Figure 4.10. Blocking probability for the Urban1 scenario in terms of the fraction of active
users comparing Poisson and Bernoulli, assuming 200 expected users.
4.4.3 Two Carriers per Cell
An improvement of the system capacity can be done by assigning one more frequency to the
cell. As it was said, in the more usual situation one operator will have 3 frequencies for the
FDD mode in paired bands, which means that then more than one carrier can be allocated to a
cell if it becomes necessary in order to improve the traffic capacity or the system
performance. Figure 4.11 has been obtained allocating a pair of frequencies to a cell while the
number of expected users being considered is 200, arrivals being assumed to follow a
Bernoulli process. One should note that the system performance improves as expected. In
Figure 4.11 one can see that the LCD40 curve changes its form for values of the fraction of
active users between [33%, 37%]: the reason is the resource allocation procedure being
followed by the algorithm. One must study Figure 4.11 as a collection of singular situations,
when f=32%, 4 more channels are allocated to Data users therefore the blocking probability
increases less than in the rest of the considered margin and keeps almost constant. Despite this
effect may occur near the limits where the increase of f implies a new Data user in the system
(one should note that only 20 % of the users are Data ones), it becomes more visible in the
35% neighbourhood due to the logarithmic y-axis. In fact, one can see that the LCD40 curve
-- S (P)
* LCD40 (P)
-- S (Bern.)
* LCD40(Bern.)

78
modifies its slope near the points where one more Data user "enters" in the system (f= 20, 25,
30, 35, 40 %).
20 25 30 35 4010
-4
10-3
10-2
10-1
100
101
f [%]
Pb
[%]
Figure 4.11. Blocking probability for the Urban1 scenario in terms of the fraction of active
users with two carriers per cell assuming 100 expected users.
Assuming one more time that the same blocking probability threshold (2%) is being
considered for both services one can obtain the maximum number of users being active at the
same time in a cell, leading to 74 users: 60 S users and 14 LCD40 users. If one changes the
maximum accepted blocking probability for the data users as it was done before assuming that
the new one is 10% for LCD40, one obtains that 90 users can be active at the same time: 72 S
users and 18 LCD40 ones.
Figure 4.12 shows the blocking probability in terms of the system load in kbit/s. Following
the same procedure being used with Figure 4.6 one can obtain the system efficiency, in this
case when the same threshold is being considered, 66 % of the resources are being used in the
limit, which represents an improvement over the situation when only one frequency is
allocated to a cell. One more time a different threshold for data service will be assumed, thus
leading to 2 Mbit/s being used when the threshold is achieved, which means that the
percentage of resources being used is 73%. The reason of the change in the slope in Figure
4.12 is the same explained before Figure 4.11.
-- S
* LCD40

79
1000 1200 1400 1600 1800 200010
-4
10-3
10-2
10-1
100
101
L [kbps]
Pb
[%]
Figure 4.12. Blocking probability for the Urban1 scenario as a function of the system load
with two carriers per cell, assuming 200 expected users.
4.5. Urban2 Results
4.5.1. Introduction
The Urban2 is a scenario where three services are available: S, LCD40, and LCD320. Hence a
user can have access to data services with data rates up to 320 kbit/s. Since the assumed basic
code channel bit rate is 15 kbit/s, one user of the LCD320 service needs 32 channels. It is easy
to understand that only low mobility can be considered in this situation because if one
LCD320 user moves from a cell to another it can be difficult to allocate 32 free code channels
in the target cell. At the same time a handover of one of these users would imply a high
increase of the interference level in the new cell. These are the main reasons why only low
mobility can be assumed.
This scenario can be considered, for example, in downtown or in the CBD when no pico-cells
have been still implemented. When the traffic level increases in one of these situations a TDD
picocell can be deployed in order to cope with the requirements or to provide the users with
the possibility of accessing to higher data rate services.
-- S
* LCD40

80
4.5.2. One Carrier per Cell
When only one carrier per cell is considered the maximum number of active users before
traffic analyses is 9, being obtained by dividing the available cell rate by cl. Hence, one better
knows the system limitations as well as the order of magnitude of the results that will be
obtained after the traffic study.
In Figure 4.13 one can see the blocking probability as a function of the fraction of active
users. The procedure being followed to obtain Figure 4.13 is the same that was explained for
Figure 4.5. The system is clearly limited by the LCD320 service, taking into account that the
total cell available rate in this scenario is 675 kbit/s and that 480 kbit/s is the required bit rate
for the LCD320 service one can conclude that the system is not available to ensure a stable
response. In this situation one should not wait a linear behaviour and must look at the figure
as a collection of individual situations: in some of these situations resources are allocated to
LCD320 services, which imply a worse system response for the other two services.
0 5 10 15 20 25 3010
-4
10-3
10-2
10-1
100
101
f [%]
Pb
[%
]
Figure 4.13. Blocking probability for the Urban2 scenario in terms of the fraction of active
users assuming 100 expected users.
Obviously if a blocking probability threshold of 2% is assumed no users can be served by the
system since the Pb value for the LCD320 is always higher than 2%; one can obtain the
number of supported users, thus leading to 1 Speech user, 0 LCD40, and 0 LCD320 users.
-- S
-- LCD40
-- LCD320

81
One should note that in this situation, where no LCD320 users can be supported the Urban2
scenario is similar to the Urban1, but with worst performance. Thus one can conclude that
when only one carrier per cell is assumed, it is better to consider the Urban1 scenario. The
other option is assuming a different threshold for the data services, for example equal to 10%
and keeping the 2% for S users, one obtains that 6 users can be active at the same time
distributed as follow: 5 S users, 1 LCD40 user, and no LCD320 users. This problem may be
resolved by implementing some kind of congestion control or admission control, giving
priority to speech and low-speed in the resource allocation, in this way the system may
provide a better response. One can represent like in Figure 4.14, the blocking probability as a
function of the system load in kbit/s.
0 500 1000 1500 200010
-4
10-3
10-2
10-1
100
101
L [kbps]
Pb
[%
]
Figure 4.14. Blocking probability for the Urban2 scenario as a function of the system load
assuming 100 expected users.
In this situation, a theoretical efficiency in the spectrum use of 62% is achieved if one
multiplies the number of active users by cl and then dividing this value by the cell available
rate (680kbit/s); however if one takes into account what really occurs, i.e., that only 135 kbit/s
are being used (5 S users and 1 LCD40 user) a real efficiency of 20% is obtained.
-- S
-- LCD40
-- LCD320

82
4.5.3. Two Carriers per Cell
The best solution to improve the capacity of the system is to allocate more than one carrier
per cell. The main assumptions will be the same that for the case when a cell only gets
assigned one carrier. In this situation one can choose between two options: sharing all the
channels among all the users or allocating voice users to one carrier and data users to the
other one. Both solutions were considered, assuming a population of 100 expected users, and
the results are now being provided.
1st Option: sharing all channels among all users
The user equipment has to be correctly designed in order to receive information from more
than one carrier. Here, when a new user enters in the system he demands some resources and
the system will allocate it equally among both carriers. Figure 4.15 shows the blocking
probability as a function of the f in this situation.
0 10 20 30 40 5010
-4
10-3
10-2
10-1
100
101
f [%]
Pb
[%
]
Figure 4.15. Blocking probability for the Urban2 scenario in terms of the fraction of active
users with two carriers per cell assuming 100 expected users.
If one considers a blocking probability threshold equal to 2% the maximum number of active
users in the system would be 5 (4 S, 1 LCD40, and 0 LCD320 users) which is clearly
-- S
-- LCD40
-- LCD320

83
unacceptable when two carriers are allocated to a cell, hence a different threshold for data
services must be considered. One more time 10% will be used for the data services thus
leading to 15 users: 11 S, 3 LCD40 and 1 LCD320; due to the 2% being maintained for S
users. One can conclude from this situation that the FDD mode is not the optimal solution to
cope with data services requiring high bit rates, even more if one considers that most of this
services are highly asymmetric.
2nd option: allocating one frequency only for voice and sharing the other one among data service users
The teletraffic experience shows that sharing the resources use to be best solution because
when some resources are reserved one can loose some statistical multiplex gain in the air; this
is a common concept in trunking theory and refers to the fact that better practical results use
to be obtained when sharing the resources better than dividing it. There can be situations
where some resources are being reserved while others are being exhausted, thus loosing
efficiency and even getting a worse system performance. Nevertheless, it is useful to show
what happens when different resources are allocated to data and voice users. In Figure 4.16
one can see the blocking probability for S users having access to only one of the carriers. It is
straightforward to conclude that a higher number of Speech users than in 4.15 is guaranteed,
but on the other hand data users will be punished.
30 35 40 45 5010
-4
10-3
10-2
10-1
100
101
f [%]
Pb
[%
]
Figure 4.16. Blocking probability for the Urban2 scenario in terms of the fraction of active
users with one carrier allocated for speech users assuming a population of 100.
-- S

84
Now, in Figure 4.17 the blocking probability is represented for data users assuming they have
access only to one carrier. Comparing these results with the ones shown in 4.15, one
concludes that the system capacity does not improves in terms of supported Data users.
Further work may be done in order to investigate several sharing schemes, for example
allowing the use of both frequencies while only one of them can be accessed by data users.
0 2 4 6 8 1010
-4
10-3
10-2
10-1
100
101
f [%]
Pb
[%
]
Figure 4.17. Blocking probability for the Urban2 scenario in terms of the fraction of active
users with one carrier allocated for data users assuming a population of 100.
Now, one can study what happens considering the resulting situation as a couple of systems in
parallel, hence the blocking requirement of 2 % for speech users allows for 45 users being
active simultaneously in the system, while only 4 data users are allowed, when the blocking
threshold for data is 2 % no data active users are allowed because the LCD320 blocking
probability is always higher than the threshold, while when assuming a threshold of 10% 3
LCD40 users and 1 LCD320 user can be simultaneously in the system. As one can see this
situation ensures a good service for speech users, while data users are penalised.
The other possibility is to consider that in fact both frequencies are part of the same system,
then different conclusions will be extracted. Keeping 10% as the blocking probability
threshold for data services, the one that limits the system is LCD320, allowing for 4 active
users, all of them Speech users. This situation shows the mentioned loose of statistical
multiplex gain in the air.
-- LCD40
-- LCD320

85
4.5.4. Three Carriers per Cell
Due to the low values for spectrum efficiency obtained from the system simulations one must
consider the situation where three frequencies are allocated to one cell. Reviewing some
aspects of the UMTS Forum recommendations one can see that the preferred deployment
scenario gives 3 carriers to each operator in paired bands for the FDD mode, considering that
different carriers must be used in the different levels of the cell hierarchy one can conclude
that it will be difficult in the real world to allocate three frequencies to one cell.
In Figure 4.18 one can see the blocking probability as a function of the fraction of active users
when 100 expected users are being considered. One should note that the blocking probability
highly increases its values when f >40%, which means that all the resources are almost
allocated and new users entering in the system are blocked.
0 10 20 30 40 5010
-4
10-3
10-2
10-1
100
101
f [%]
Pb
[%]
Figure 4.18. Blocking probability for the Urban2 scenario in terms of the fraction of active
users with three carriers per cell, and assuming 100 expected users.
The maximum number of supported users with a maximum value of the blocking probability
equal to 2% is 19: 15 Speech , 3 LCD40, and 1 LCD320 users; while 25, when the threshold
for data is 10%, leading to 18 S, 5 LCD40 and 2 LCD320 users. The other possibility is to
allocate one carrier to voice and share the other two among the data service users. The results
for voice (represented in Figure 4.16) are the same that for the situation when two carriers
-- S
-- LCD40
-- LCD320

86
were considered one of them only for voice and the other for data. Figure 4.19 is the blocking
probability for data users when a pair of carriers are dedicated exclusively for them.
0 5 10 15 20 2510
-4
10-3
10-2
10-1
100
101
f [%]
Pb
[%]
Figure 4.19. Blocking probability for the Urban2 scenario with two carriers allocated for data
users assuming a population of 100.
Some conclusions can be extracted from this situation doing the same study that for the case
where two carriers were considered; a separate study leads to 45 Speech, 6 LCD40, and 3
LCD320 users when the blocking threshold is 2% for all the users being in the system.
Assuming one more time a maximum blocking probability value of 10% for data users, one
achieves 45 S, 12 LCD40 and 5 LCD320 users. While 9 users (7 S, 1 LCD40, and 1 LCD320)
are supported when analysing the whole system, 17 users (13 S, 3 LCD40 and 1 LCD320) if
the blocking probability threshold is 10% for Data services.
4.6. Urban3 Results
4.6.1. Introduction
The Urban3 scenario will not exist in the real world, at least in the FDD mode. The 2 Mbit/s
service is going to be available only in pico-cells and in the TDD mode, where the asymmetry
of the high data rate applications can be managed in a best way. Although of the target points
-- LCD40
-- LCD320

87
of the UMTS promotion is that bit rates up to 2 Mbit/s will be available, the objective of this
section is to show that FDD will not usually cope with the requirements needed by these
applications. The main topic in UMTS should be to develop applications with bit rates up to
60 or 120 kbit/s better than trying to provide higher and higher data rates, as customers are
many times more interested in the quality of the applications rather than in the bit rate.
4.6.2. Four Carriers per Cell
Four carriers are needed to cope with the bit rate requirements for the LCD1920 service since
the bit rate for this service is 2880 kbit/s (192 basic code channels at 15 kbit/s). Studying the
system before taking into account the blocking probability, one concludes that each user
generates an average load of 309 kbit/s, thus leading to a maximum number of active users
equal to 9. In Figure 4.20 one can see the blocking probability as a function of the fraction of
active users. One should note that the solution becomes unstable when high bit rate services
are taken into account: it is impossible that the blocking probability decreases when the
fraction of active users increases. The solution becomes highly unstable between [40%, 50%]
where increasing the fraction of active users leads to important variations in the blocking
probability values. One may consider the system behaviour for values between [0%, 30%],
out of this margin no conclusions should be extracted from Figure 4.20.
0 10 20 30 40 5010
-4
10-3
10-2
10-1
100
101
f [%]
Pb
[%
]
Figure 4.20. Blocking probability in terms of f for the Urban3 scenario with four carriers per
cell assuming 100 expected users.
-- S
-- LCD40
-- LCD1920

88
Calculating one more time the maximum number of users being active at the same time in the
system one achieves 15 users (11 S, 3 LCD40 and 1 LCD1920 users), when 2% is the
considered blocking threshold for S and data users. Figure 4.21 shows the blocking
probability as a function of the system load in Mbit/s, in this way one can extract some
conclusions about how the resources are being used.
2 4 6 8 10 12 14 1610
-4
10-3
10-2
10-1
100
101
L [Mbps]
Pb
[%
]
Figure 4.21. Blocking probability in terms of the system load for the Urban3 scenario with
four carriers per cell assuming 100 expected users.
In the limit situation, when the blocking threshold is achieved, the load is 5 Mbit/s. The
maximum cell capacity in this scenario, when four carriers per cell are considered, is 3.728
Mbit/s. Obviously, the system becomes unstable, because it is impossible to cope with this bit
rate with only four carriers. One should conclude that the 2 Mbit/s data service can not be
provided in the FDD mode.
4.7. The Impact of Mobility
The impact of mobility is considered only in the first scenario, Urban1,. The mobility scheme
being considered here is simple and consists only in increasing the arrival rate, taking into
account that two contributions exist: the new calls and the handover ones. Further work
should be done in order to investigate the importance of each type of handover (intra-
frequency, inter-frequency and intersystem handover) in the final results.
-- S
-- LCD40
-- LCD1920

89
The mobility does not affect the computation of the blocking probability for given density of
users and fraction of active users, determining however the proportion of new/handover calls.
Besides that, for each considered service j, the mobility of terminals has influence on the
handover failure probability threshold given by [Vele98]:
maxdj
j
jhf PP (4.1)
where j and j are the service and cross-over rates for the application j, respectively, j being
inversely proportional to the coverage distance R; (Pd)max is the maximum allowed call
dropping probability. As the generation rate has both the influence of new and handover calls,
the difference consists of multiplying j by j
jj , when mobility is considered.
Since no guard channels are reserved for handover calls, if new and handover traffic were
Poisson distributed, the blocking probability would be numerically equal to handover failure
probability. Despite the consideration of a Bernoulli distribution for the new calls, the
previous equality still stands, as an approximation, which is very useful to have a first insight
on the influence of mobility in the supported traffic.
Now one has to define the desired threshold for the handover failure probability; depending
on the scenario, the system capacity will be limited either by the handover failure probability,
or by the blocking probability. The requirements are usually given for the blocking and
dropout probabilities, being immediate to go from the dropout threshold to the handover
failure one. The system is limited by the LCD40 service as it was shown in the static case,
then the mobility impact is being studied only for this situation, the maximum dropout
probability being assumed to be %5.0P maxd .
The first step is to obtain the value for the cross-over rate which requires a definition of the
mobility model; the one used here is described in [VeCo98] and its main assumption is that
the velocity follows a triangular distribution with a determined average velocity V and a
deviation, both given in m s-1
. The coverage distance has been assumed to be 400 m. Table
4.7 shows the values for the cross-over rate as well as for the mobility model parameters.
Giving the values in the firsts columns of the Table 4.7 to (4.1) and considering that in the
LCD40 is 0.0064 s-1
one can obtain the maximum handover failure probability, Table 4.7.

90
Mobility model V [m s-1
] [m s-1
] [s-1
] (Phf)max[%]
Pedestrian 1 1 0.0009 3.60
Urban 10 10 0.0090 0.36
Main Roads 15 15 0.0135 0.24
Table 4.7. Cross-over rate and handover failure probability for the Urban1 assuming several
mobility models.
As one could expect the system is not limited by the mobility when only low mobility,
pedestrian model, is considered; however handover failure is the main limitation of the system
when high mobility is taken into account, like in the urban and main roads mobility models.
Now it is straightforward to obtain the fraction of active users, f, using the obtained figures for
the blocking probability in Urban1 scenario. Some interesting values are provided in Table
4.8, the number of expected users being 100.
Mobility model f [%] Speech active users Data active users
Pedestrian 33 27 6
Urban 28 23 5
Main Roads 26 21 5
Table 4.8. Results for the fraction of active users and for the number of active users.
In order to analyse the impact of terminal mobility on the results, it is also important to
present results of f as a function of R. The density of users is 725 users/km2, or equivalently
250 users/km if linear coverage is assumed. The maximum f for the more limiting threshold
has been obtained as a function of the coverage distance. In Figure 4.22 only low mobility is
assumed, hence the limitation is the blocking probability with a value of 2%; in this first case
both services have been considered, while only the data service will be assumed in the
medium and high mobility situations. The interest of including the curve for the Speech
service is to show that the LCD40 is the limiting service in this scenario.

91
0 200 400 600 800 10000
10
20
30
40
50
60
70
80
90
R [m]
f [%
]
Figure 4.22. Supported fraction of active users when only low mobility is considered.
In Figure 4.23 one can see the supported fraction of active users when mobility is taken into
account: both curves are very similar since the handover failure threshold obtained for the two
situations is very similar. This means that with the assumed coverage distance (400 m) there
are no important differences between the urban mobility, average of 10 m s-1
, and the main
road mobility, average of 15 m s-1
; as one could wait more new calls can be accepted per
kilometre in environments with lower mobility, leading to a higher system capacity.
Some concrete situations can help to better understand the capacity of the system. In Table
4.9 one can see the maximum fraction of active users in percentage for different coverage
distances and for the three mobile schemes being considered, a density of 250 user/km being
considered.
fmax [%]
R [m]
500 400 600 800 1000
Pedestrian 57 32 21 15 11
Urban 48 27 18 12 8
Main Roads 47 26 17 12 8
Table 4.9. Maximum f [%] in a cell in the Urban1 scenario taking mobility into account.
-- S
* LCD40

92
0 200 400 600 800 10000
10
20
30
40
50
60
70
80
90
R[m]
f [%
]
Figure 4.23. Comparison among the supported fraction of active users assuming several
mobility schemes.
4.8. Comparison between GSM/HSCSD and UMTS
4.8.1. Introduction
The last results deal with the comparison between the existing techniques for data
transmission over GSM and the obtained results for UMTS. When a new system is studied it
becomes necessary to show the differences with respect to the old ones; at this time the only
one available in GSM systems being the High Speed Circuit Switched Data (HSCSD).
HSCSD is an evolution of the Circuit Switched Data (CSD) that was available in the GSM
since the beginning. HSCSD improves the data transmission capacity of GSM in two ways:
1. Increasing the bit rate per slot from 9.6 kbit/s to 14.4 kbit/s.
2. Up to four timeslots can be allocated to a communication simultaneously.
Since the HSCSD is circuit switched it is straightforward to compare the results with the
UMTS ones. The comparison is being done in two steps: the first only has to see with voice,
while the second one takes into account mixed (voice+data) services.
-- Pedestrian
-- Urban
-- Main Roads

93
4.8.2. Comparing voice services
One must start by defining the comparison scenario, in Portugal 40 GSM900 carriers are
allocated to each operator. If a reuse factor of 4 is considered, 10 frequencies per cell are
available, then assuming sectorisation one achieves 4 carrier/sector or equivalently 32
physical channels (each physical channel being defined by a frequency and a timeslot). The
Erlang-B formula has been used for GSM, while the results from the system analysis have
been used for the UMTS case leading to 41 basic code channels at 15kbit/s. The Figure 4.24
shows the blocking probability as a function of the fraction of active users for both systems.
10 15 20 25 30 35 40 45 5010
-4
10-3
10-2
10-1
100
101
102
f [%]
Pb
[%
]
Figure 4.24. Blocking probability in a GSM and a UMTS system when only voice is
considered and 100 expected users are assumed.
One of the most important parameters to compare mobile telecommunication systems is the
maximum number of users being in the system at the same time. Assuming a blocking
probability threshold of 2% one reaches to:
- 24 GSM users.
- 32 UMTS users.
Hence, UMTS allows for 33% more of users in a situation where multipath and fading were
considered in system simulations. A more equitative comparison may lead to 200 or 250%
more users in UMTS than in GSM, for example, if one assumes that only one scrambling
code is used in a Base Station and the same sectorisation, three sectors per cell; without any
fading assumption, the number of available 15 kbit/s code channels per sector is 84 (a
-- GSM
-- UMTS

94
dedicated channel to control traffic). Figure 4.25 represents again the blocking probability for
both systems but under the new assumptions and for a population of 400 users.
0 10 20 30 40 5010
-4
10-3
10-2
10-1
100
101
102
f [%]
Pb
[%
]
Figure 4.25. Blocking probability in a GSM and a UMTS system when only voice is
considered and 400 expected users are assumed.
Assuming one more time the same threshold, one obtains:
- 32 GSM users
- 72 UMTS users
This leads to more than the double number of supported active users which represents an
important improvement of system performance. The change from GSM to UMTS will
represent more than an improvement in the number of users, but it is important to show the
capability of the new system. UMTS can be deployed in two ways, the first is the
development of the whole network, that will occur when a new operator gets assigned a
UMTS license. In the other way UMTS will be an evolution of an existing GSM network,
when the operator already has a GSM license; in this situations it will be common to carry
part of the voice traffic over the existing 2nd
generation network.
-- GSM
-- UMTS

95
4.8.3. Voice+Data Comparison
Symmetric applications are being assumed in order to simplify the modification of the
algorithm to the characteristics of the GSM/HSCSD system. A HSCSD 2+2 configuration is
being used, which means 2 timeslots are being used in the uplink and 2 more in the downlink
for data users (14.4 kbit/s each slot). In the algorithm one must include the modifications to
take into account that one channel will be dedicated for each voice user and two channels will
be needed for each HSCSD user at 28.8 kbit/s. In Figure 4.26 one can find the blocking
probability for the GSM/HSCSD system as well as for the Urban1 scenario (80% S users and
20% LCD40) in the UMTS. One should note that for values near 45% the data curves slopes
increases, which means that data users can not get allocated more resources and all new users
entering in the system are blocked. After 46% more channels are allocated, thus the curve
slope decreases. As one could wait the slope-jump is higher for the UMTS LCD40 curve than
in the GSM/data one, since a new data user needs 4 code channels, while only 2 timeslots in
the GSM case.
0 10 20 30 40 5010
-4
10-3
10-2
10-1
100
101
102
f [%]
Pb
[%
]
Figure 4.26. Blocking probability for GSM/HSCSD and UMTS-Urban1.
One can conclude that the behaviour of UMTS is much better than the GSM one when data
services are introduced. One must take into account that the data service being considered in
HSCSD has a bit rate of 28.8 kbit/s, the effective data rate may be lower than 25 kbit/s, while
the UMTS data service bit rate is 60 kbit/s (equivalently a net data rate of 40 kbit/s).
-- GSM/voice
* GSM/data
-- UMTS-S
* UMTS-LCD40

96
Assuming a blocking probability threshold of 2 % one reaches to the following number of
supported active users:
- GSM/HSCSD: 12 users (10 voice and 2 data users)
- UMTS: 32 users (26 S and 6 LCD40 users)
Hence UMTS becomes more efficient when multiservice is considered, leading to an increase
of 250% in the number of users. At the same time one must take into account that the data rate
being considered in the UMTS is higher than the one in GSM/HSCSD.
4.9. Conclusions
Here the most important results obtained are summarised for each scenario, for the Urban1
the results when mobility is taken into account are also provided, as well as the results
obtained after the comparison between GSM and UMTS.
Urban1 scenario
Urban1 scenario main characteristics are:
80% Speech and 20% LCD40 users.
100 expected users.
Blocking probability threshold equal to 2%.
In Table 4.10 one can find the main obtained results when one and two carriers are allocated
to a cell, the spectral efficiency results from dividing the Lmax(Pb=2%) by the available rate in
a cell.
Number of
carriers per cell
Speech
users
LCD40
users
Lmax(Pb=2%)
[kbit/s]
Spectral
efficiency [%]
1 26 7 800 58
2 60 14 1800 66
Table 4.10. Urban1 scenario results.
Urban1 scenario + mobility
Now, the scenario main characteristics are:
80% Speech and 20% LCD40 users.
100 expected users.

97
1 carrier per cell.
Several mobility models being considered (defined in Table 4.6)
In Table 4.11 one can find the main obtained results.
Mobility
model
Speech
users
LCD40
users
Lmax(Pb=2%)
[kbit/s]
Spectral
efficiency [%]
Pedestrian 26 7 800 58
Urban 23 5 660 46
Main roads 21 5 640 41
Table 4.11. Urban1+mobility scenario results.
Urban2 scenario
Urban2 scenario main characteristics are:
70% Speech, 20% LCD40, and 10% LCD320 users.
100 expected users.
Blocking probability threshold equal to 2%.
In Table 4.12 one can find the main obtained results when one, two, and three carriers are
allocated to a cell.
Number of
carriers per cell
Speech
users
LCD40
users
LCD320
users
Lmax(Pb=2%)
[kbit/s]
Spectral
efficiency [%]
1 1 0 0 100 15
2 4 1 0 352 26
3 15 3 1 1339 66
Table 4.12. Urban2 scenario results.
Urban3 scenario
Urban3 scenario leads to solution unstability, thus the obtained results can not be taken into
account; one concludes that the FDD mode can not support high rate services.

98
GSM vs UMTS
For the GSM/UMTS comparison the following assumptions were made:
100 expected users.
Blocking probability threshold equal to 2%.
4 GSM carrier/sector.
41 UMTS/FDD basic code channels per sector.
GSM data service requests 2 timeslots.
UMTS data service (LCD40) requests 4 code channels.
In Table 4.13 one can find the main obtained results.
Only speech Speech+Data
System Speech users
(after UMTS
system
simulations)
Speech
users
(Only traffic
analyses)
Speech
users
Data
users
GSM 24 32 10 2
UMTS 33 72 20 6
Table 4.13. GSM vs UMTS results.

99
5. Conclusions and Future Work
5.1. Introduction
The objectives of this work were developing a theoretical model for multiservice traffic in
UMTS, and evaluating system performance. During the evolution of the work the objectives
were narrowed, the first choice was to consider the UMTS FDD mode only for the detailed
study; this choice was made due to two main reasons: the higher amount of available
information about the FDD mode compared to the TDD one, and the fact that the FDD mode
is more interesting for operators. One of the points of interest of the work was to combine the
traffic analyses with a previous UMTS/FDD system simulation in order to cope with user
satisfaction requirements defined for UMTS. Another objective was to mix packet and circuit
switched services over the same network, thus evaluating each one by the more accurate
performance measure (blocking probability or delay probability); some approximations were
made in this sense considering only circuit switched services and assuming that maximum
delay is limited. Another objective was to include the impact of mobility in the analysis; this
objective was reached and the impact of mobility was considered in the work. The last
objective was to take the asymmetry of the applications into account, but since UMTS/FDD
was adopted it makes no sense no consider asymmetry due to the use of paired bands for
uplink and downlink.
The main conclusions achieved through this work are summarised here. In the first place one
should note that no tele-traffic models are currently available for multimedia networks
carrying mixed data rate traffic of both circuit and packet switched services. Some classical
models for fixed networks were studied in order to study its application to cellular systems;
one concludes that Erlang-B can be used in voice networks as a first approach in the
dimensioning process, but it can not be taken into account when considering packet switched
services. When the impact of mobility was studied an important conclusion was achieved: the
use of guard channels for handovers only improves the system performance for short duration
services, hence no guard channels for handover were considered. Regarding delay systems
one concludes that a complete study of the delay suffered by a call implies a good network
characterisation which becomes really difficult.

100
5.2. Models
One of the most important part of the report is that related with the models for mixed traffic.
Some references are provided to several mixed traffic models for both fixed and mobile
networks. A whole model taking into account the UMTS FDD-mode main characteristics was
developed, taking a general algorithm [AwVa96]. Some hypotheses were assumed in order to
reduce the total number of parameters being considered, thus leading to a simpler situation:
All services are considered circuit switched, then blocking probability is the performance
measure being considered.
The work is focused in the downlink, since no limitations exist in the uplink regarding the
number of channelisation codes.
Variable rate services are evaluated using a fix rate bearer.
One spreading factor is considered, or equivalently one basic code channel.
Higher data rates are available through code aggregation.
Dedicated channels are considered, since common channels are only used to carry small
amounts of traffic.
As it was shown some of these approximations correctly model the real behaviour of a
WCDMA system and may be used during the first years in UMTS in order to control the
complexity of the base station. The model provides a formula to obtain the blocking
probability for each of the considered applications, it is straightforward to compute this
formula in a efficient way by using a recursive algorithm. Some mathematics are also
explained to go from typical traffic parameters to others more significant, like, e.g., the
fraction of active users, the maximum system load, and the supported number of users.
5.3. System Performance Evaluation
The most interesting conclusions should be extracted from the system performance
evaluation, since this is the most innovative part of the work. Several scenarios were defined
in order to understand the system behaviour under different conditions. The performance
measurement being considered is the blocking probability, but one is usually more interested
in obtaining the number of supported active users when a maximum value for the blocking
probability is reached. Some figures were done of blocking probability in terms of the fraction

101
of active users; as well as others relating the blocking probability with the system load, thus
leading to the spectrum efficiency defined like the system load when the blocking threshold is
achieved divided by the available rate in a cell.
The maximum accepted blocking probability being considered is 2% deriving from UMTS
satisfaction requirements (98% of the users are satisfied). However, in some situations results
considering a blocking probability threshold of 10% for data users are also given.
In the Urban1 scenario an user will have access to voice and low bit rate services (up to
60kbit/s); it will be the most common situation in the FDD mode; the system performance
analyses leads to 26 supported active users when one carrier per cell is considered, thus
achieving a spectral efficiency equal to 58%. In order to improve the system capacity, two
carriers per cell were assumed, hence the number of active users increases up to 60, the
spectral efficiency also increases to 66%. From these results one concludes on the high
capacity of the FDD-mode when voice and low or medium bit rate services are considered,
since it copes with the large area coverage where high mobility may occurs. Afterwards
mobility was taken into account, assuming the thresholds of (Pd)max=0.5% and (Pb)max=2%.
When only low mobility is considered the obtained results do not differ from the ones for the
static situation (33 supported users), since the more restrictive requirement continues being
the maximum blocking probability. On the other hand the results obtained when higher
mobility was taken into account kept in the same order of magnitude of the static case (28
active users for the medium mobility, and 26 for the high mobility model). Then one can
conclude that the Urban1 scenario allows for mobility keeping its performance results within
acceptable margins.
In the Urban2 scenario the distribution of users is as follows: 70% Speech, 20% LCD40, and
10% LCD320 users. It was defined to study the influence of including high bit rate services in
the system, 320 kbit/s being adopted as the maximum data rate available in a micro-cell and
assuming the FDD mode. The obtained values show that the impact of high bit rate services is
dramatic, up to three carriers per cell being considered. The case where a cell gets 3 carriers
allocated will not be common, since operators will be assigned 2 or 3 carriers for the FDD
mode, but it is included in order to study how the system performance improves. No mobility
was included in this scenario, since one user of the LCD320 service requests 32 basic code
channels, each of them with a bit rate of 15 kbit/s; then if one of these users moves from a cell

102
to another the impact would be terrible. Assuming one carrier per cell only one Speech user
can be active, thus leading to a spectral efficiency of 15%, in this situation the system
simulation results does not allow even for one LCD320 user, in this situation it becomes more
efficient to assume the Urban1 scenario. Results are very similar when two carriers are
allocated to a cell, leading to: 4 Speech, 1 LCD40, and 0 LCD320 users; the spectral
efficiency is now 26%. It becomes necessary allocating three carriers per cell to obtain
acceptable values: 15 Speech, 3 LCD40, and 1 LCD320 users; reaching a spectral efficiency
equal to 66%.
The Urban3 is a scenario where an user has access to: Speech (70%), LCD40 (20%), and
LCD1920 (10%) services. It is a typical TDD scenario, but it was included in order to show
the limitations of the FDD mode to cope with so high data rate services. One must consider
that the 2 Mbit/s services will be highly asymmetric, thus the TDD can make use of its
flexibility in order to manage more efficiently the resources. When the LCD1920 was taken
into account the system became unstable.
The last point of the work was a comparison between UMTS and GSM/HSCSD, voice
transmission and voice+data services being considered. In the voice case one reaches an
improvement of 200% more users in the UMTS than in the GSM, while in voice+data
situations UMTS maintains this improvement in the number of supported users. One should
note services with different bit rates were compared, being higher for the UMTS case (which
means that the comparison environment were favourable for the GSM).
Another important conclusion can be extracted after this work being that the main point in
UMTS development should be to manage in an efficient way the capabilities of the system.
As it was said, the system works properly with bit rates up to 120kbit/s, thus more research
should be done in order to develop applications assuming this rate limitation than trying to
provide higher rates when there are no applications requesting it.
5.4. Future Work
Inside the report some future research lines were referred to; here they are summarised and
some more ideas are given to continue this work:

103
A better characterisation of the service components may lead to a better resource
management, thus all the applications could be characterised as a combination of these
service components like in [Vele99].
Further work can be done in order to obtain better mobility models, considering for
example the contributions of each of the existing handover types in UMTS.
One interesting opportunity is to consider a situation where GSM and the first phase of
UMTS are available at the same time, studying how the traffic is distributed between the
two systems.
In this work the packet switched services were assumed to behave as circuit switched
ones, hence some work can be done in this direction in order to mix both kinds of traffic
over the same network.
A similar line of research can be focused in the UMTS TDD mode considering
asymmetric applications and its impact in the overall cellular planning, the use of common
data channels for the uplink should be considered while dedicated channels are reserved
for the downlink.

104

105
Annexes
Annex A. UTRA-FDD
Annex B. Mathematics and Algorithm Tests
Annex C. Program Code

106

107
Annex A. UTRA-FDD
A.1. Introduction
The Wide-band Code-Division Multiple Access (WCDMA) has been chosen as the basic-
radio access technology for UTRA proposal (The terrestrial radio access scheme for
UMTS/IMT-2000) in both Europe and Japan. Main properties of WCDMA include: support
for high data rate services; improved coverage and capacity due to a higher bandwidth and
coherent uplink detection; support of interfrequency handover necessary for high-capacity
hierarchical cell structures; support for capacity-improving technologies such as adaptive
antennas and multi-user detection; and a fast and efficient packet-access protocol [DBKO98].
This Annex starts describing the WCDMA/FDD as well as showing the key points for the
traffic analysis, some indications about how multiservice is supported are also provided.
A.2. A brief description
The information suffers several processes since it is created at higher levels to its final
transmission at the Physical layer. It makes no sense to made a complete description of all the
procedure, but some general ideas can help one to understand the WCDMA/FDD system
behaviour.
The spreading process consist in multiply a sequence with a determinate bit rate by the
adequate code in order to obtain a constant output rate (or equivalently bandwidth) which
is called chip rate, its value is 3.96 Mchips/s. If the input sequence rate is high the spread
will be small and the output power will be high, in the other way small input rates give
place to small output powers Since power is the shared resource services that requires
higher data rates will limit more the system capacity than lower data rate services like
voice and switched data.
WCDMA/FDD allows an user (in the uplink) for multicode transmission, hence all the
resulting code channels will be multiplexed before the scramble process. In the downlink
the process is different, the target user of each code channel will be generally different, so
each code channel will be transmitted after the Scramble Process.

108
The Scramble Process consists in multiplying the input sequence by a Scrambling Code,
after this the output will be modulated and transmitted over the air interface. The
scrambling code identifies the station. Each Mobile Station is assigned with a scrambling
code when the connection is setting up, while each Base Station has a scrambling code that
identifies itself, and that allows the use of the same channelisation code tree by several
Base Stations.
These three processes can be shown in the Figure A.1 for the uplink.
I
j
cd,1 d
Slong,n or Sshort,n
I+jQ
DPDCH1
Q
cd,3 d
DPDCH3
cd,5 d
DPDCH5
cd,2 d
DPDCH2
cd,4 d
DPDCH4
cd,6 d
DPDCH6
cc c
DPCCH
Figure A.1. Spreading, Multiplexing and Scrambling for uplink DPCCH and DPDCHs
(extracted from [3GPP99d]).
In the next subsections some information about the functions assigned to the different levels is
given. Figure A.2 shows, in a simple way, the layered structure being assumed.

109
Figure A.2. The UTRA-FDD layered structure.
A.3 The Physical Layer
In FDD mode, a physical channel is defined not only by the used code and the carrier
frequency, but by the spreading factor and the transmitting power also. The main types of
physical channels are now depicted, WCDMA defines dedicated and common physical
channels, the first type ones are [3GPP99c]:
dedicated physical data channels (DPDCH) used to carry dedicated data generated at layer
2 and above;
dedicated physical control channel (DPCCH) used to carry layer 1 control information.
Each connection is allocated one DPDDH and zero, one, or several DPDCH's. Several
common physical layers are also defined but they are not interesting at this moment.
1. Uplink DPDCH and DPCCH: In the uplink, the DPDCH and DPCCH are code and IQ
multiplexed within each radioframe. The uplink DPDCH and DPCCH are shown in
Figure A.3.
Upper Layers
MAC
Physical Layer
Logical Channels:
traffic or control
Transport Channels
Physical Channels

110
Pilot
Npilot bits
TPC
NTPC bits
Data
Ndata bits
Slot #0 Slot #1 Slot #i Slot #14
Tslot = 2560 chips, 10*2k bits (k=0..6)
1 radio frame: Tf = 10 ms
DPDCH
DPCCHFBI
NFBI bitsTFCI
NTFCI bits
Figure A.3. Frame structure for uplink DPDCH/DPCCH (extracted from [3GPP99c]).
The TFCI field informs the receiver side what transport format is used in the current
data frame in order to simplify detection, decoding, and demultiplexing. There are two
types of Uplink Dedicated Physical Channels; those that include TFCI (e.g. for several
simultaneous services) and those that do not include TFCI(e.g. for fixed-rate services)
[3GPP99c]. The DPDCH fields can be found in Table A.1.
Slot Format #I Channel Bit Rate
[kbit/s]
Channel Symbol
Rate [ksps]
SF Bits/
Frame
Bits/
Slot
Ndata
0 15 15 256 150 10 10
1 30 30 128 300 20 20
2 60 60 64 600 40 40
3 120 120 32 1200 80 80
4 240 240 16 2400 160 160
5 480 480 8 4800 320 320
6 960 960 4 9600 640 640
Table A.1. DPDCH fields (extracted from [3GPP99c]).
The number of available channelisation codes is not fixed, but depends on the rate and
spreading factor of each physical channel, being the UMTS assumed maximum of 256
codes (with a spreading factor of 256) per frequency.
The channelisation codes are obtained following the tree showed in Figure A.4.

111
SF = 1 SF = 2 SF = 4
Cch,1,0 = (1)
Cch,2,0 = (1,1)
Cch,2,1 = (1,-1)
Cch,4,0 =(1,1,1,1)
Cch,4,1 = (1,1,-1,-1)
Cch,4,2 = (1,-1,1,-1)
Cch,4,3 = (1,-1,-1,1)
Figure A.4. Code-tree for generation of Orthogonal Variable Spreading Factor (OVSF) codes
(extracted from [3GPP99d]).
2. Downlink DPCH: There is only one type of downlink dedicated physical channel, the
Downlink Dedicated Physical Channel (downlink DPCH).
Within one downlink DPCH, dedicated data generated at Layer 2 and above, i.e. the
dedicated transport channel (DCH), is transmitted in time-multiplex with control
information generated at Layer 1 (known pilot bits, TPC commands, and an optional
TFCI). The downlink DPCH can thus be seen as a time multiplex of a downlink
DPDCH and a downlink DPCCH, compare section 5.2.1. It is the UTRAN that
determines if a TFCI should be transmitted, hence making it is mandatory for all UEs to
support the use of TFCI in the downlink. Figure A.5 shows the frame structure of the
downlink DPCH. Each frame of length 10 ms is split into 15 slots, each of length Tslot =
2560 chips, corresponding to one power-control period.
One radio frame, Tf = 10 ms
TPC
NTPC bits
Slot #0 Slot #1 Slot #i Slot #14
Tslot = 2560 chips, 10*2k bits (k=0..7)
Data2
Ndata2 bits
DPDCH
TFCI
NTFCI bits
Pilot
Npilot bits
Data1
Ndata1 bits
DPDCH DPCCH DPCCH
Figure A.5. Frame structure for downlink DPCH (extracted from [3GPP99d]).

112
The parameter k in figure 8 determines the total number of bits per downlink DPCH
slot. It is related to the spreading factor SF of the physical channel as SF = 512/2k. The
spreading factor may thus range from 512 down to 4.
There are basically two types of downlink Dedicated Physical Channels; those that
include TFCI (e.g. for several simultaneous services), and those that do not include
TFCI (e.g. for fixed-rate services).
For slot formats using TFCI, the TFCI value in each radio frame corresponds to a
certain combination of bit rates of the DCHs currently in use. This correspondence is
(re-)negotiated at each DCH addition/removal. When the total bit rate to be transmitted
on one downlink CCTrCH exceeds the maximum bit rate for a downlink physical
channel, multicode transmission is employed, i.e. several parallel downlink DPCHs are
transmitted for one CCTrCH using the same spreading factor. In this case, the Layer 1
control information is put on only the first downlink DPCH. The additional downlink
DPCHs belonging to the CCTrCH do not transmit any data during the corresponding
time period, see Figure A.6.
In the case of several CCTrCHs of dedicated type for one UE different spreading factors
can be used for each CCTrCH and only one DPCCH would be transmitted for them in
the downlink.
Transmission
Power Physical Channel 1
Transmission
Power Physical Channel 2
Transmission
Power Physical Channel L
DPDCH
One Slot (2560 chips)
TFCI PilotTPC
DPDCH
Figure A.6. Downlink slot format in case of multi-code transmission (extracted from
[3GPP99c]).

113
3. Control channels.
Transport channels are the services offered by Layer 1 to the higher layers. A transport
channel is defined by how and with what characteristics data is transferred over the air
interface. A general classification of transport channels is into two groups [3GPP99c]:
Dedicated Channels.
There exists only one type of dedicated transport channel, the Dedicated Channel
(DCH). The Dedicated Channel (DCH) is a downlink or uplink transport channel.
The DCH is transmitted over the entire cell or over only a part of the cell using
beam-forming antennas. The Dedicated Channel (DCH) is characterised by the
possibility of fast rate change (every 10ms), fast power control and inherent
addressing of UEs.
Common Channels
There are six types of common transport channels: BCH, FACH, PCH, RACH,
CPCH and DSCH.
BCH – Broadcast Channel
The Broadcast Channel (BCH) is a downlink transport channel that is used to
broadcast system- and cell-specific information. The BCH is always
transmitted over the entire cell with a low fixed bit rate.
FACH – Forward Access Channel
The Forward Access Channel (FACH) is a downlink transport channel. The
FACH is transmitted over the entire cell or over only a part of the cell using
beam-forming antennas. The FACH uses slow power control.
PCH – Paging Channel
The Paging Channel (PCH) is a downlink transport channel. The PCH is
always transmitted over the entire cell. The transmission of the PCH is
associated with the transmission of a physical layer signal, the Paging
Indicator, to support efficient sleep-mode procedures.
RACH – Random Access Channel
The Random Access Channel (RACH) is an uplink transport channel. The
RACH is always received from the entire cell. The RACH is characterised by a
limited size data field, a collision risk and by the use of open loop power
control.
CPCH – Common Packet Channel

114
The Common Packet Channel (CPCH) is an uplink transport channel. The
CPCH is a contention based random access channel used for transmission of
bursty data traffic. CPCH is associated with a dedicated channel on the
downlink which provides power control for the uplink CPCH.
DSCH – Downlink Shared Channel
The downlink shared channel (DSCH) is a downlink transport channel shared
by several UEs The DSCH is associated with a DCH.
A.4. Transport channels mapping onto physical channels
The whole process of coding and transport channel multiplexing is out of interest, but the
mapping one can help one to understand the system, the Figure 7 summarises the mapping of
transport channels onto physical channels.
Transport Channels
DCH
RACH
CPCH
BCH
FACH
PCH
DSCH
Physical Channels
Dedicated Physical Data Channel (DPDCH)
Dedicated Physical Control Channel (DPCCH)
Physical Random Access Channel (PRACH)
Physical Common Packet Channel (PCPCH)
Common Pilot Channel (CPICH)
Primary Common Control Physical Channel (P-CCPCH)
Secondary Common Control Physical Channel (S-CCPCH)
Synchronisation Channel (SCH)
Physical Downlink Shared Channel (PDSCH)
Acquisition Indication Channel (AICH)
Page Indication Channel (PICH)
Figure A.7. Transport-channel to physical-channel mapping (extracted from [3GPP99c]).
The DCHs are coded and multiplexed, and the resulting data stream is mapped sequentially
(first-in-first-mapped) directly to the physical channel(s). The mapping of BCH and
FACH/PCH is equally straightforward, where the data stream after coding and interleaving is
mapped sequentially to the Primary and Secondary CCPCH respectively. Also for the RACH,
the coded and interleaved bits are sequentially mapped to the physical channel, in this case the

115
message part of the random access burst on the PRACH. Every 10 ms, one radio frame from
each TrCH is delivered to the TrCH multiplexing. These radio frames are serially (time)
multiplexed into a Coded Composite Transport Channel (CCTrCH) [3GPP99c].
The last process is rate matching that is applied in order to match the bit rate of the CCTrCH
to one of the limited sets of bit rates of the uplink or downlink physical channels, rate
matching means that bits on a transport channel are repeated or punctured. Higher layers
assign a rate-matching attribute for each transport channel. This attribute is semi-static and
can only be changed through higher layer signalling. The rate-matching attribute is used when
the number of bits to be repeated or punctured is calculated.
The number of bits on a transport channel can vary between different transmission time
intervals. In the downlink the transmission is interrupted if the number of bits is lower than
maximum. When the number of bits between different transmission time intervals in uplink is
changed, bits are repeated or punctured to ensure that the total bit rate after TrCH
multiplexing is identical to the total channel bit rate of the allocated dedicated physical
channels [3GPP99c].
If no bits are input to the rate matching for all TrCHs within a CCTrCH, the rate matching
shall output no bits for all TrCHs within the CCTrCH and no uplink DPDCH will be selected
in the case of uplink rate matching.
A.5. MAC and RLC layers
The MAC layer comprises at least the following functions [DBKO98]:
selection of appropiate Transport Format (basically bit rate), within a predefined set, per
information unit delivered to the physical layer;
service multiplexing on RACH, FACH, and dedicated channels;
priority handling between data flows of one user as well as between data flows from
several users;
access control on RACH;
address control on RACH and FACH;
contention resolution on RACH.

116
The RLC layer comprises at least the following functions [DBKO98]:
segmentation and assembly;
transfer of user data;
error connection by means of retransmission;
sequence integrity;
duplicate detection;
flow control;
The MAC and RLC protocols are responsible for efficiently transferring data of both real-
time and nonreal-time services. In addition, the MAC layer controls the multiplexing of data
streams originating from different services [DBKO98].
Packet Data Services: in the WCDMA system, packet data can be transmitted in three ways:
First one consists in transmit it on the RACH. Typically, this method is chosen if the user
equipment (UE) has only a small amount of data to transmit, thus no reservation scheme is
used, so the overhead necessary to transmit a packet is kept to a minimum.
The second one is used when the packet is large. There is an information exchange
between the user equipment and the network in order to evaluate whether the necessary
resources can be assigned. If that is the case a set of Transport Formats (TF) is transmitted
to the user equipment. Out of this set, the UE will use a TF to transmit its data on the DCH.
Exactly which TF the UE may use and at what time the UE may initiate its transmission
can be transmitted immediately or in a separate message. This method causes overhead
traffic, but this overhead is negligible when the UE has large packets to transmit. Due to
the fact that the UE gets assigned a dedicated channel, data transfer will be more reliable
than when it would have been transmitted on a shared channel, thus no collisions are
possible, and the UE uses closed-loop power control on the dedicated channel. The reason
of having been assigned a set of TF's and not only one is that the TF can be changed during
transmission [DBKO98].
The third method of transmitting packets is when the UE already has a dedicated channel
at its proposal, that can happen when it uses it for another service or when the UE has just
finished transmitting packets on the DCH.
Real-Time Services: the procedure is here very similar to the first case, but the UE can starts
transmitting immediately after using any of the set of TF's. In this way the UE can support

117
variable bit rate services such as speed, but also in this case the network can limit the capacity
of the UE [DBKO98].
Mixed Services: the MAC should also be able to support multiple services. The MAC
protocol controls this process by controlling the data stream delivered to the physical layer
over the transport channels. If a UE wants to transmit data of different services, for example
speech (real-time) and a packet data service, then it has been assigned two sets of TF's. The
UE may use any TF assigned to it for the real-time service, whereas it may only use one of the
TF's of the TF set for the data service. In addition, the UE gets assigned a specific output
power/rate threshold. The aggregate rate of both services must be below this threshold. The
TF's used for the data service are chosen out of the allocated TF set in such a way that the
aggregate output power/rate will never exceed the threshold. Thus, the TF's used for the data
service fluctuate adaptively to the used TF's of the speech service [DBKO98].
A.6. Conclusions
Main conclusions related to traffic analysis are being detailed now:
In CDMA power is the resource to be shared.
Several services with different requirements can be multiplexed over one connection.
The number of available channelisation codes depends on the rate and spreading factor of
each physical layer, it means that the number of service combinations over one physical
channel are limited.
The UE gets assigned a specific output power/rate threshold, the aggregate rate of all the
services being carried for this UE must be below this threshold.
Priority is given to real-time services over data-packet services.
There is a maximum of 256 orthogonal downlink channels available, some of which must
be allocated for downlink control channels. This leaves approximately 250 orthogonal
channels for user traffic. Normally, the cell capacity is interference limited.
Uplink is never limited by number of orthogonal code channels, as the orthogonal code
tree used is user specific in the uplink due to the scrambling code.
In the downlink all users in a cell, or sector, use the same scrambling code. Hence all
users share the available channelisation codes in the OVSF code-tree. This means that the
channelisation codes in the downlink is a much more limited resource than in the uplink.
The possibility of using two scrambling codes in a Base Station gives place to a higher

118
number of available channelisation codes, but the degree of orthogonality decreases and
then the interferences increases.
One of the most important advantages of WCDMA is the statistical multiplexing in the
air, since the shared resource is power one can set up a Dedicated Physical Control
Channel (DPCCH), which is low power, without limiting the resources, hence the user
only uses the established link when is needed.

119
Annex B. Mathematics and Algorithm Tests
B.1. Introduction
This Annex deals with some interesting aspects that one must take into account when
programming an algorithm like, for example, the computing-time efficiency and the
validation of the results being obtained. First subsections are dedicated to the mathematical
process that gives place to the final recursion, as well as to some aspects related with
numerical stability of the algorithm. The last subsection shows the results of some test
simulations, it means that the values obtained with the algorithm are compared with the
theoretical values available in the literature for some simple situations as can be the Erlang-B
and Engset-B formulas for voice networks.
B.2. The Equilibrium Occupancy pmf/PDF for 1 Resource
The blocking probability calculations require the occupancy PDF Q(y) which can be obtained
for the one-dimensional resource as a function of the pmf q(y)[AwVa96]:
)y(q)1y(Q)y(Q (B.1)
The recursion formula for the unnormalized, one dimensional pmf is given by:
kc/y
1jk
1jk
K
1kkk )cjy(qc
y
1)y(q (B.2)
where k and k are the parameters that characterise the BPP arrival process, and ck is the
number of channels that the application k requires.
Choosing as initial value for the recursion q(0)=1. The computation of this recursion is highly
inefficient in computation time. However, if one rewrites (B.2) as follows:
K
1kkk )y(mc
y
1)y(q (B.3)
with
)cy(m)cy(q)y(m kkkkkk (B.4)

120
where mk(y)=0 for y 0. Now, the time efficiency in computing the recursion is much more
better while the additional storage space extra cost is not very important since only some
values for mk and q ought to be memorised. This is the recursion that has been implemented in
the program due to its high computing-time efficiency. A closer inspection of recursion (B.1)
reveals that when a customer class k has a 1k , the process can become unstable. In the
studied situations it has never occurred, since one is interested in blocking probability
thresholds between 1 and 10% and it occurs with typical fractions of active users of less than
50% when a high number of expected users is assumed. Instead of this one should take into
account this situation when using the algorithm in another scenarios.
B.3. The Blocking Probability Recursion
Having found the occupancy PDF one can find blocking probabilities, this subsection deals
with the calculation of the time blocking probability, or equally the blocking probability. The
unormalized PDF of the modified system satisfies [AwVa96]:
)cy(Q)y(Q)y(Q k'kk
'k (B.5)
An intuitive interpretation is that Q'k(y) is the deconvolution of Q(y) and the unnormalized
pmf of an imaginary ON-OFF source with a capacity requirement ck and a transition rate (-
k). One can define:
)c)1i(N(Q)ciN(Q)i(S kkk (B.6)
Using this definition, the class k blocking probability is expressed as:
)N(Q
)0(SP k
b (B.7)
One must note that the blocking probability given by (B.7) can be calculated on-the-fly as the
Q(y) are computed in the same order as they are required by the blocking recursion, what
leads to a fast and efficient algorithm.
B.4. Test Computation
This subsection deals with the test of the used algorithm, the followed method had been to
simulate some theoretical environments which behaviour is well known, in order to compare
the results.

121
First Test Scenario (Poisson)
The Figure B.1 is the result of three computations with the following input parameters:
Poisson arrivals.
Speech is the only available service.
The basic code channel rate is 16 kbps, which leads to one code channel per user. The
channel is fully dedicated to information, it means that control bits has not been considered
in order to make the comparison with Erlang-B tables as easy as possible.
Several number of available channels has been considered.
A population of 100 expected users is being considered.
The objective of this first computation is to test the algorithm comparing the results with the
known values for the Erlang-B formula. Here, the absolute error being given by formula B.1
is being used.
ErlBb
lgabP PP
b (B.8)
In the Figure B.1 one can see the absolute value of Pb assuming different numbers of
channels. The comparison validates the algorithm since the obtained values for the blocking
probability are exact at least in the first eight decimals which is an acceptable resolution.
0 10 20 30 40 5010
-12
10-11
10-10
10-9
10-8
f [%]
Figure B.1. Absolute error in the blocking probability in function of the fraction of active
users for the first test scenario.
Pb
-- N=25 channels
-- N=50 channels
-- N=100 channels

122
Second Test Scenario (Engset-B)
The second test scenario main assumptions are:
Bernoulli arrivals.
Speech is the only available service.
The basic code channel rate is 16 kbps, which leads to one code channel per user. The
channel is fully dedicated to information, it means that control bits has not been considered
in order to make the comparison with Erlang-B tables as easy as possible.
Several number of available channels has been considered.
100 expected users were considered.
The objective of this second computation is to test the algorithm comparing the results with
the known values for the Engset-B formula. The absolute error given by (B.8) is also used.
In the Figure B.2 one can see the absolute value of Pb assuming different numbers of
channels. The comparison validates the algorithm since the obtained values for the blocking
probability are exact at least in the first eight decimals which is an acceptable resolution.
0 10 20 30 40 5010
-200
10-180
10-160
10-140
10-120
10-100
10-80
10-60
10-40
10-20
100
Figure B.2. Absolute error in the blocking probability in function of the fraction of active
users for the second test scenario.
-- N=25 channels
-- N=50 channels
-- N=100 channels
Pb
f [%]

123
The Figure B.3 shows the same results but changing the y-axe margins, one must note that the
precission is even higher when the number of channels increases.
0 10 20 30 40 5010
-12
10-11
10-10
10-9
10-8
f [%]
Figure B.3. Absolute error in the blocking probability in function of the fraction of active
users for the second test scenario with different y-axe margins.
Like in the first scenario, the comparison validates the algorithm since the obtained values for
the blocking probability are exact at least in the first eight decimals which is an acceptable
resolution.
-- N=25 channels
-- N=50 channels
-- N=100 channels
Pb

124

125
Annex C. Program Code
C.1. Introduction
This Annex deals with the program developed in Turbo Pascal in order to compute the analytical
model to obtain the system performance in Chapter 4. The guidelines of this program can be found
in [AvVa96]. The first subsection is a simple description of the code that will be found in the
second section, the objective of this is to provide the reader with some tools to understand the taken
decisions leading to the final version of the Traffic analyser.
Turbo Pascal was chosen due to its easy compilator, as far as programming is not the main topic in
the work, but a tool to achieve some interesting results. In a first stage Matlab was used, but it was
very time inefficient.
C.2. Types & Variables
The first decision was the way to define the different environments being considered, the record
was the chosen type because allows for some flexibility, hence one must indicate:
- the name (a number of the scenario)
- the number of active applications in this scenario, the available cell bit rate (taken from the
system simulations)
- the number of expected users
- each application being considered should be correctly defined. An application is another record
where one must fill the proportion of users that will use this application, the average duration
and the number of channels that this application requests (this will be done by an auxiliar
function).
The other types are correctly depicted in the analyser code. A lot of variables were defined, the
most important ones are now being explained. The text variable called filename will load the name
of the output file where the obtained results will be sent. A couple of global variables q and mj are
the key of the excellent time efficiency of this program, they will be used in the algorithm part
(pmf_algo function) and allows for not doing again each recursion.

126
C.3. Functions & Procedures
The first function being implemented in the program is the one called channel, this function
receives as inputs the bit rate that an application requests as well as the basic code channel being
considered, and gives the number of code channels needed. It takes into account that when an
application requests a bit rate lower than the basic code channel bit rate one channel will also be
needed, in other words, the channel function implements the bit rate matching between transport
and physical channels.
The second one is called auxiliar1 and gives the values for and , thus the parameters needed to
characterise the BPP arrival process. Obviously the input parameters should be the environment
being simulated, if the arrival process is Poisson or Bernoulli, and the arrival rate obtained from the
fraction of active users.
One of the most important functions is the pmf_algo, this function is used as a part of the algorithm
and implements the recursion being used to obtain the blocking probability. The next one is the
algorithm, in this function the blocking probability is obtained, the main tasks are to decide how the
resources are shared among the different services being considered as well as the loop that gives
place to the Pb value using the pmf_algo output.
C.4. The Input & Output Part
In the input part the user are requested to set some of the parameters like the considered scenario,
the statistics being assumed, and the bit rate of the basic code channel. A lot of other parameters
have to be modified when a system performance is being done, then the election of the input
parameters is personal. The other values were modified directly in the code in order not to
managing a lot of data each time that a simulation was run
The output was a text file called results.dat in order to save the different computations and making
easy the comparison between different scenarios. The file structure is the optimal to introduce the
information in the Matlab and then obtaining the different figures included in this report, Matlab
provides some instructions to quickly read input files like for example fread or fopen.

127
C.5. The Code
One should note that the scenario definitions were changed for the different computations, then the
values for the scenarios are not static and belongs to a concrete computation. The code being
included in this section is the final version.
program simul(input,output);
{-----------------------------------------------------------------
This program implements a traffic analyser of a WCDMA-FDD system
using the analytical model developed.
The definition of the considered scenarios will be done here, while
the user will be required to set some input parameters
------------------------------------------------------------------
TFC: Multiservice Traffic in Mobile Multimedia Communications
Author: Miguel Angel Carames Garcia
Version: 2.1 (20/4/2000)}
uses crt;
type
vec=array [1..5] of Longint; {Applic.-S,SD,MMM,HMM,HIMM}
vec2=array [1..5] of real;
env_def=record {general definition of the environment}
name :Longint;
active :Longint;
rate :Longint;
expected_users :real;
applications :record
percentage : vec;
miu_inv : vec;
C : vec;
end; {applications record}
end; {env_def}
var
filename: text;
k, counter, counter2, act: Longint; {counter and number of active
applications}
environment: env_def;
N: Longint;
blocking: array[1..100,1..5] of real; {variables used in the main loop}
fraction: array[1..100] of real;
basic_code_channel: Longint;
pobern,f,lambda: real;
{N is the number of available code channels
basic_code is the data rate in kbps
pobern indicates the statistic being assumed
f is the fraction of active users (input parameter)
lambda is the lambda before the normalisation and
will be obtained from f}
lambda_norm, alfa, beta, p, pb: vec2;
{here one stores the value of normalised lambda, alfa, beta, p (the prob.
or an user having and active application) and pb for each application}

128
q:array [0..256] of real; {q and mj are global variables being}
mj:array [0..256,1..5] of real;{used in the pmf_algo}
function channel(a,b :Longint):Longint;
{This function implements the fact that when the basic code channel
data rate is higher one channel will be used, this implies at the MAC
layer bit repetition for the data rate matching in the transport to physical
channel mapping process}
Var
chan:Longint;
begin
if (a<b) then chan:=1
else chan:=trunc(a/b);
channel:=chan;
end;
function auxiliar1(env: env_def; pobe: real; lambd_norm: vec2; var alfa,beta:
vec2):extended;
{This function gives the values for alfa and beta in two arrays being the
input parameters the environment under simulation, the chosen arrival
process and the normalised lambda value for each application}
var
count: Longint;
begin {of the function}
for count:=1 to env.active do
begin {for}
if pobe=1 {Poisson} then
begin
alfa[count]:=lambd_norm[count]/(1+lambd_norm[count])*env.expected_users;
beta[count]:=0;
end;
if pobe=2 {Bernoulli} then
begin
beta[count]:=-lambd_norm[count];
alfa[count]:=-beta[count]*env.expected_users;
end;
end; {for}
end; {funcion}
function pmf_algo(y:Longint; env: env_def; alf, bet: vec2):real;
var
j:Longint;
qy, myj, sum: real;
begin
if (y=0) then
begin
q[0]:=1; {global variables}
mj[0,1]:=0;
mj[0,2]:=0;
mj[0,3]:=0;
mj[0,4]:=0;
mj[0,5]:=0;{global variables}
pmf_algo:=1;
end

129
else
begin
sum:=0;
for j:=1 to env.active do
begin
if ((y-env.applications.C[j])<0) then
begin
qy:=0;
myj:=0;
end
else
begin
qy:=q[y-env.applications.C[j]];
myj:=mj[y-env.applications.C[j],j];
end;
myj:=alf[j]*qy+bet[j]*myj;
sum:=sum+(1/y)*env.applications.C[j]*myj;
mj[y,j]:=myj;
end;
q[y]:=sum;
pmf_algo:=sum;
end;
end;
function algorithm(Number:Longint; pobe: real; alf, bet:vec2; env:env_def; var
block:vec2):extended;
{This function implements the algorithm block of the system}
var
j, k, y:Longint;
i: vec;
S, S2, Qj:vec2;
qy, myj, sum: extended;
Q: extended;
begin
Q:=0;
for k:=1 to env.active do
begin
i[k]:=trunc(N/env.applications.C[k]);
S[k]:=0.0;
S2[k]:=0.0;
Qj[k]:=0.0;
end;
for y:=0 to Number do
begin
Q:=Q + pmf_algo(y, env, alf, bet);
for k:=1 to env.active do
begin {for}
if (y= (N-i[k]*env.applications.C[k])) then
begin
S[k]:=Q-Qj[k];
Qj[k]:=Q;
S2[k]:=S[k]+bet[k]*S2[k];
i[k]:=i[k]-1;
end;
end; {for}
end;
for k:=1 to env.active do block[k]:=S[k]/Q;
end;

130
begin
{-----------------------------------------------------------------
Definition of the initial scenarios that will be simulated
-----------------------------------------------------------------}
for counter:=0 to 256 do
begin
q[counter]:=0;
for counter2:=1 to 5 do mj[counter, counter2]:=0;
end;
{Inicialization of the global variables to zero}
for counter:=0 to 100 do
begin
fraction[counter]:=0;
for counter2:=1 to 5 do blocking[counter, counter2]:=0;
end;
clrscr;
writeln('Enter the desired code-channel [15,30,60,120,240]:');
readln(basic_code_channel);
{Now we have the basic_code_channel bit rates and we obtain the
number of channels}
writeln('These are the possible scenarios:');
writeln('1 -> Urban1'); {outer city}
writeln('2 -> Urban2'); {commercial centre boundary}
writeln('3 -> Urban3'); {downtown}
writeln('4 -> Urban4'); {CBD}
writeln('5 -> Test');
writeln('Enter the number of the desired environment:');
readln(environment.name);
{Here the scenarios are given the considered values}
with environment do
begin
if name=1 then
begin
rate:=1360;
expected_users:=200;
active:=2;
applications.percentage[1]:=80;
applications.percentage[2]:=20;
applications.percentage[3]:=0;
applications.percentage[4]:=0;
applications.percentage[5]:=0;
applications.miu_inv[1]:=60;
applications.miu_inv[2]:=156;
applications.miu_inv[3]:=0;
applications.miu_inv[4]:=0;
applications.miu_inv[5]:=0;
applications.C[1]:=channel(15,basic_code_channel);
applications.C[2]:=channel(60,basic_code_channel);
applications.C[4]:=0;
applications.C[3]:=0;
applications.C[5]:=0
end; {if}
if name=2 then
begin
rate:=1360;

131
expected_users:=1000;
active:=2;
applications.percentage[1]:=80;
applications.percentage[2]:=20;
applications.percentage[3]:=0;
applications.percentage[4]:=0;
applications.percentage[5]:=0;
applications.miu_inv[1]:=60;
applications.miu_inv[2]:=156;
applications.miu_inv[3]:=0;
applications.miu_inv[4]:=0;
applications.miu_inv[5]:=0;
applications.C[1]:=channel(15,basic_code_channel);
applications.C[2]:=channel(60,basic_code_channel);
applications.C[3]:=0;
applications.C[4]:=0;
applications.C[5]:=0
end; {if}
if name=3 then
begin
rate:=3*675;
expected_users:=200;
active:=3;
applications.percentage[1]:=70;
applications.percentage[2]:=20;
applications.percentage[3]:=10;
applications.percentage[4]:=0;
applications.percentage[5]:=0;
applications.miu_inv[1]:=60;
applications.miu_inv[2]:=156;
applications.miu_inv[4]:=0;
applications.miu_inv[3]:=14;
applications.miu_inv[5]:=0;
applications.C[1]:=channel(15,basic_code_channel);
applications.C[2]:=channel(60,basic_code_channel);
applications.C[4]:=0;
applications.C[3]:=channel(480,basic_code_channel);
applications.C[5]:=0
end; {if}
if name=4 then
begin
rate:=675;
expected_users:=1000;
active:=3;
applications.percentage[1]:=70;
applications.percentage[2]:=20;
applications.percentage[3]:=10;
applications.percentage[4]:=0;
applications.percentage[5]:=0;
applications.miu_inv[1]:=60;
applications.miu_inv[2]:=156;
applications.miu_inv[3]:=14;
applications.miu_inv[4]:=0;
applications.miu_inv[5]:=0;
applications.C[1]:=channel(15,basic_code_channel);
applications.C[2]:=channel(60,basic_code_channel);
applications.C[3]:=channel(480,basic_code_channel);
applications.C[4]:=0;
applications.C[5]:=0
end; {if}

132
if name=5 then
begin
rate:=25*15;
expected_users:=100;
active:=1;
applications.percentage[1]:=100;
applications.percentage[2]:=0;
applications.percentage[3]:=0;
applications.percentage[4]:=0;
applications.percentage[5]:=0;
applications.miu_inv[1]:=60;
applications.miu_inv[2]:=0;
applications.miu_inv[3]:=0;
applications.miu_inv[4]:=0;
applications.miu_inv[5]:=0;
applications.C[1]:=1;
applications.C[2]:=0;
applications.C[3]:=0;
applications.C[4]:=0;
applications.C[5]:=0
end; {if}
end; {with}
N:=trunc(environment.rate/basic_code_channel);
writeln('Select if the process is:');
writeln('1 -> Poisson');
writeln('2 -> Bernoulli');
readln(pobern);
for counter:=0 to 50 do
begin {for of f}
f:=0.01*counter;
lambda:=f/(1-f); {lambda without any normalisation being
f the fraction of active users}
for k:=1 to environment.active do
{this loop gives us the value of normalised lambda for each
application}
begin {for of k}
lambda_norm[k]:=lambda*environment.applications.percentage[k]*1/100;
p[k]:=f*environment.applications.percentage[k];{probability
of an user having an
active application in %}
end; {for of k}
auxiliar1(environment, pobern, lambda_norm, alfa, beta);
{Now we call the function that gives us the values for alfa and beta
that are the parameters being used by the algorithm}
algorithm(N, pobern, alfa, beta, environment, pb);
fraction[counter+1]:=f;
for counter2:=1 to environment.active do
begin
blocking[counter2,(counter+1)]:=abs(pb[counter2]*100);
end;
{now we have a vector with f values, and a matrix with the values
the blocking probability for each application}
end;
Assign(filename,'c:\miguel\matlab\results.dat');
Rewrite(filename);
writeln(filename,'N=',N,' ','Expected Users=',environment.expected_users);
writeln(filename);

133
write(filename,'f=[');
for counter:=1 to 51 do write(filename,(100*fraction[counter]):3:3,' ');
write(filename,'];');
writeln(filename);writeln(filename);
for counter2:=1 to environment.active do
begin
write(filename,'Pb',counter2,'=[');
for counter:=1 to 51 do write(filename,blocking[counter2,counter]:3:8,'
');
write(filename,'];');
writeln(filename);
end;
flush(filename);
close(filename);
writeln('Please push any key to finish.');
readln;
end.

134

135
References
[3GPP99a] 3GPP, Service Aspects: Quality of Service and Network Performance, 3GPP
Technical Specification Group Services and System Aspects Report No.
22.925 version 3.1.1, Valbonne, France, Apr.1999.
[3GPP99b] 3GPP, QoS Concept and Architecture, 3GPP Technical Specification Group
Services and System Aspects Report No. 23.107 version 3.1.1, Valbonne,
France, Dec. 1999.
[3GPP99c] 3GPP, Physical channels and mapping of transport channels onto physical
channels (FDD), 3GPP Technical Specification Group Radio Access Network
Report No. 25.211 version 3.1.0; Valbonne, France, Dec.1999.
[3GPP99d] 3GPP, Spreading and Modulation (FDD), 3GPP Technical Specification
Group Radio Access Network Report No. 25213 version 3.1.1; Valbonne,
France, Dec. 1999.
[AdZN98] R.G. Addie, M. Zukerman and T.D. Neame, "Broadband Traffic Modelling:
Simple Solutions to Hard Problems," IEEE Communications Magazine, Vol.
36, No. 8, Aug. 1998, pp. 88-95.
[AwVa96] G.A.Awater and H.A.van de Vlag, "Exact Computation of Time and Call
Blocking Probabilities in Large, Multi-traffuc, Multi-resource Loss Systems,"
Performance Evaluation, Vol. 25, 1996, pp.41-58.
[BuCN99] D. Bull, N. Canagarajah and A. Nix, Insights into Mobile Multimedia
Communications, Academic Press, New York, NY, USA, 1999.
[DaPi00] J.M. Da Silva, and H.R. Pinto, Capacity Estimation of the FDD Mode of
UMTS Networks, Graduation Thesis, I.S.T., Technical University of Lisbon,
Lisbon, Portugal, Mar. 2000.
[DBKO98] E. Dahlman, P. Beming, J. Knutsson, F. Ovesjö, M. Persson and C. Roobol,
"WCDMA-The Radio Interface for Future Mobile Multimedia
Communications," IEEE Transactions on Vechicular Technology, Vol. 47, No.
4, Nov. 1998, pp. 1105-1118.
[DuSm94] J. Dunlop and D.G. Smith, Telecommunications Engineering, Chapman and
Hall, London, UK, 1994.

136
[ETSI97a] ETSI, Wideband Direct-Sequence CDMA Evaluation Document, ETSI
Concept Group Alpha WDS-CDMA, Version 1.0c, Bad Salzdetfurth,
Germany, Oct. 1997.
[ETSI97b] ETSI, Wideband TDMA Evaluation Document, ETSI Concept Group Alpha
WTDMA, Version 1.0, Bad Salzdetfurth, Germany, Oct. 1997.
[FrMe94] V.S.Frost and B.Melamed, "Traffic Modeling For Telecommunications
Networks," IEEE Communications Magazine, Vol. 32, No. 3, Mar. 1994, pp.
70-81.
[HoRa86] D. Hong and T.S. Rappaport, "Traffic Model and Performance Analysis for
Cellular Mobile Radio Telephone Systems with Prioritized and Non-prioritized
Hand-off Procedures," IEEE Transactions on Vehicular Technology, Vol. VT-
35, No. 3, Aug. 1986, pp.77-92.
[Jabb96] B. Jabbari, "Teletraffic Aspects of Evolving and Next-Generation Wireless
Communication Networks," IEEE Personal Communications Magazine, Vol.
3, No. 6, Dec. 1996, pp. 4-9.
[KeLi99] K.Kennedy and R.Litjens, "Performance Evaluation Of A Hybrid Radio
Resource Allocation Algorithm In A GSM/GPRS Network," in Proc. of
PIMRC'99 – 10th
IEEE International Symposium on Personal Indoor and
Mobile Radio Communications, Osaka, Japan, Sep. 1999.
[Klei76] L. Kleinrock, Queuing Systems, Wiley-Interscience, Chichester, Sussex, UK,
1976.
[Marti95] J. Martínez, Theory of Queues and Teletraffic (in Spanish), SPUPV,
Polytechnical University of Valencia, Valencia, Spain, 1995.
[MMMM98] M.A. Marsan, S. Marano, C.Mastroianni and M.Meo, "Performance Analysis
of Cellular Mobile Communication Networks Supporting Multimedia
Services," in Proc. of 6th
International Symposium on Modeling, Analysis and
Simulation of Computer and Telecommunication Systems, Los Alamitos, CA,
USA, 1998, pp. 274-281.
[NaAc95] M.Naghshined and A.S.Acampora, "QOS Provisioning in Micro-Cellular
Networks Supporting Multimedia Traffic," in Proc. of Infocom'95 – The IEEE
Conference on Computer Communications, Los Alamitos, CA, USA, 1995,
pp.1075-1084.

137
[NaBK00] S.Nanda and K. Balachandran, and S.Kumar, "Adaptation Techniques in
Wireless Packet Data Services," IEEE Communications Magazine, Vol. 38, No
1, Jan 2000, pp.54-65.
[Rapp96] T.S. Rappaport, Wireless Communications, IEEE Press, Piscataway, NJ, USA,
1996.
[Rebe96] J.P.C.Rebelo, Approximation of ON-OFF Processes by an MMPP proccess for
the Analysis of the Average Delay in ATM Networks (in Portuguese), Master
Thesis, I.S.T., Technical University of Lisbon, Lisbon, Portugal, Dec. 1996.
[RoPa99] I. Rombogiannakis and M. Paterakis, "Voice /Data Integrated Wireless
Channel Access in Third Generation Digital Cellular Networks: The
Performance of Bursty Data Generated by Interactive Applications,"
International Journal of Wireless Information Networks, Vol. 5, No. 1, 1998,
pp. 1-12.
[SuDi99] B. Subbiah and S. Dixit, "Low-Bit-Rate Voice and Telephony over ATM in
Cellular/Mobile Networks," IEEE Personal Communications, Dec. 1999, Vol.
6, No.6, Dec. 1999, pp.37-43.
[UMTS98a] UMTS Forum, Minimum spectrum demand per public terrestrial UMTS
operator in the initial phase, UMTS Forum Report No. 5, London, UK,
Dec.1998.
[UMTS98b] UMTS Forum, UMTS/IMT-2000, UMTS Forum Report No. 6, London, UK,
Dec.1998.
[VeCo98] F. Velez and L.M. Correia, "Capacity Trade-offs in Mobile Broadband
Systems using Guard Channels for High Mobility Handover," in Proc. of
PIRC'98 - 9th
IEEE International Symposium on Personal Indoor, and Mobile
Radio Communications, Boston, Massachusetts, USA, Sep. 1998, pp. 749-753.
[VeCo99] F.J.Velez and L.M.Correia, "New Calls Traffic Performance in Micro-cellular
Mobile Broadband Systems with High Mobility Handover," in Proc. of.
ConfTele'99-II Conference on Telecomunications, Sesimbra, Portugal, Apr.
1999.
[Vele99] F.J. Velez, "Multi-service Traffic Analysis in Mobile Broadband Systems," in
Proc. of 4th
ACTS Mobile Communications Summit, Sorrento, Italy, June 1999,
pp.239-244.

138
[Wirt97] P.E.Wirth, "The Role of Teletraffic Modelling in the New Communications
Paradigms," IEEE Communications Magazine, Vol. 35, No. 8, Aug. 1997, pp.
86-92.
[Yaco93] M.D. Yacoub, Foundations of Mobile Radio Engineering, CRC Press, Boca
Raton, FL, USA, 1993.