Analysis of Light Elements in Cement, Slags and Feldspar · • S2 RANGER LE o Overview o XFlash®...
43
1 Analysis of Light Elements in Cement, Slags and Feldspar S2 RANGER LE:
-
Upload
duongthien -
Category
Documents
-
view
213 -
download
0
Transcript of Analysis of Light Elements in Cement, Slags and Feldspar · • S2 RANGER LE o Overview o XFlash®...

1
Analysis of Light Elements in Cement, Slags and Feldspar
S2 RANGER LE:

Welcome
Today’s topics: • S2 RANGER LE
o Overview o XFlash® LE detector o Improved X-ray tube
• Analysis of Light Elements in Cement
o Pressed pellets o Fusion beads
• Analysis of F and Na in Slags
• Analysis of Feldspar • Summary • Q & A
2
Arkady Buman XRF Technical Sales Specialist Bruker AXS Inc. Madison, WI, USA

S2 RANGER LE
Overview
3

X-ray Fluorescence Analysis Wavelength-dispersive XRF (WDX or WDXRF)
An analyzer crystal separates the various wavelengths λ (energies)
The detector records only the number, N, of X-ray photons at a given wavelength (energy)
4
Sample
Detector
Crystal

Energy-dispersive XRF (EDX or EDXRF)
The detector is used to record both: • the energy, E, and • the number, N, of X-ray
photons
5
Sample

Instrumentation – Closer Look
6
FC
SC

S2 RANGER Hardware Advantages
7
Minimum space requirements
“All in one box” rugged system
Single port connection
Integrated Touchscreen
Integrated PC & Printer
Integrated vacuum pump
Integrated sample changer (1 to 28)
Direct excitation – high power (50W)
XFlash® Silicon Drift Detector
S2 RANGER Flexible Sample Handling!
Automated System
Up to 28 different samples can be
loaded
Manual System Single sample
position
8

S2 RANGER EQUA ALL
EQUA ALL is the unique standardless solution that enables you to obtain results without performing a calibration
ELEMENT QUANTIFICATION for ALL Elements from Na – U ALL Ranges from ppm to 100% ALL Materials (Oxides, Metals, Oils, etc…) ALL Preparation (Pellets, Solids, Liquids, Powder, etc…)
Installed on ALL S2 RANGERs NO Standards Needed! Uses a unique mathematical algorithm to calculate sample
composition from a measured energy spectrum ~ 5 minutes for analysis Ability to customize your own Standardless Program
9

S2 RANGER TouchControlTM
Easier through intuitive touch screen operation
More convenient than ever based on an all-in-one instrument

S2 RANGER LE 50 W Power for Direct Excitation
End window X-ray tube • Pd anode • Max power 50 W • Voltage 5-50 kV • Max current 2000 µA
9-position filter changer for primary beam filters
50 W power fast and precise measurements
High transmission window for enhanced light element excitation
11

S2 RANGER XFlash® LE Silicon Drift Detector
XFlash LE • 4th generation Silicon Drift Detector
(SDD) • 10 mm2 active area
Unique light element performance • High transmission window
Unique energy resolution • 129 eV FWHM • @ Mn Kα • @ 100,000 cps
Unmatched count rates • up to 300,000 cps input count rate • up to 100,000 cps output count rate without resolution degradation
Peltier cooled
12

S2 RANGER XFlash® LE
13
More than 8 times sensitivity for Na (compared to standard SDD)
More than 4 times sensitivity for Mg (compared to standard SDD)
Lower background in the energy range up to 12.6 keV
Better resolution in the energy range up to 12.6 keV

Enhanced sensitivity for light elements
Better detection limits for Na and Mg!
Improved energy resolution
Better separation of neighboring peaks!
Increased sensitivity
More counts and better statistics!
Ability to measure higher count rates
Measure faster!
Improved stability
14
S2 RANGER with XFlash® LE Advantages

S2 RANGER with XFlash® LE Key Applications
15
Cement Minerals & Mining Slags Petrochemicals
Pharmaceuticals Geology Metals Chemistry

Analysis of Light Elements in Cement
16

Measurement Method
17
• Measurement Region 1
• 8 kV • No filter • 80 seconds • F - Ca
• Measurement Region 2
• 40 kV • 500 µm aluminum filter • 50 seconds • Ca - Sr
• Total analysis time: 3 minutes per sample! • Sample preparation: pressed powders

Cement Spectra – 8 kV
18
100
200
300
400
500
1000
2000
3000
4000
Cps
Mg
KA
1
Cr K
A1P
KA
1
K K
A1
Cl K
A1
S K
A1
S K
B1
Ca
KA
1
Ca
KB
1
Al K
A1
Ti K
A1
Ti K
B1
Si K
A1
Na
KA
1 Ca
KA
1/E
scap
e
0.9 1 1.1 1.2 1.3 1.4 1.5 1.6 1.7 1.8 1.9 2 3 4 5
KeV

Cement Spectra – 8 kV
19
1020
3050
100
200
300
400
500
600
700
800
900
Cps
Mg
KA
1
Al K
A1
Na
KA
1
SRM 1885A Prep 1 8 KV None
SRM 1886A Prep 1 8 KV None
0.8 0.9 1 1.1 1.2 1.3 1.4 1.5 1.6 1.7 1.8
KeV

Calibration Data for Na2O in Cement
20
• Abridged calibration data for line Na KA1/Cement
• S/N 5899, Mask: 30 mm, Mode: Vacuum, 8 kV, 1.15 mA, Filter: None
• Detector parameter 1: 600 parameter 2: 400 • Intensity evaluation: peak height • Calibration data for compound Na2O in
original sample • Absorption correction: Fixed alphas
(empirically adjusted values) • 16 standards from 0.02% to 1.07% • Standard deviation: 0.0224% • Squared correlation coefficient: 0.995102 • Alpha (Si): 17.8707 (Adjustable by
regression)
Int. corrected
Corre
cted
Inte
nsity
(Cps
)
Concentration (%)
24
30
40
50
60
70
80
90
100
110
120
130
140
150
160
0 0.1 0.2 0.3 0.4 0.5 0.6 0.7 0.8 0.9 1.0
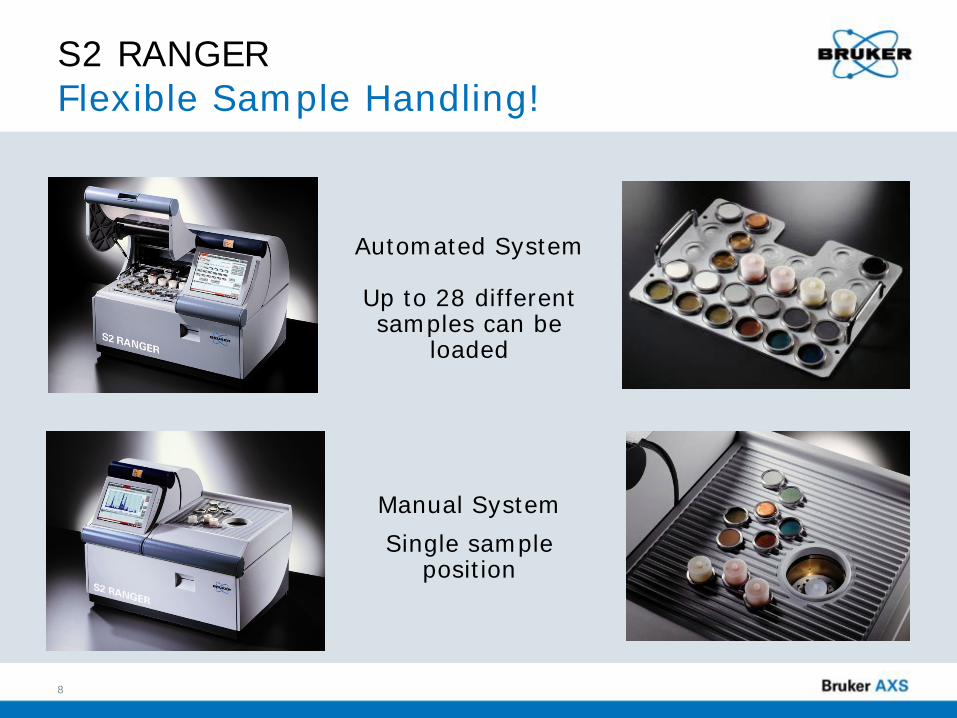
Calibration Data for Na2O in Cement
21
Standard Name Chem Conc (Weight %)
XRF Conc (Weight %)
Absolute Deviation
Gross Int (kcps) LLD (PPM)
SRM 1880A Prep 1 0.190 0.166 -0.024 21.91 119.2 SRM 1880A Prep 2 0.190 0.154 -0.036 21.40 118.6 SRM 1881A Prep 1 0.199 0.222 0.023 23.26 127.5 SRM 1881A Prep 2 0.199 0.214 0.015 22.85 126.8 SRM 1884A Prep 1 0.216 0.222 0.006 23.88 118.2 SRM 1884A Prep 2 0.216 0.213 -0.003 23.64 119.0 SRM 1885A Prep 1 1.068 1.066 -0.002 55.93 113.3 SRM 1885A Prep 2 1.068 1.061 -0.008 55.84 113.8 SRM 1886A Prep 1 0.021 0.031 0.010 19.30 99.0 SRM 1886A Prep 2 0.021 0.058 0.037 20.60 99.1 SRM 1887A Prep 1 0.478 0.495 0.017 34.71 118.7 SRM 1887A Prep 2 0.478 0.495 0.017 34.69 118.6 SRM 1888B Prep 1 0.136 0.142 0.005 20.68 121.0 SRM 1888B Prep 2 0.136 0.150 0.013 20.92 120.8 SRM 1889A Prep 1 0.195 0.164 -0.031 22.74 112.0 SRM 1889A Prep 2 0.195 0.156 -0.039 22.41 111.7
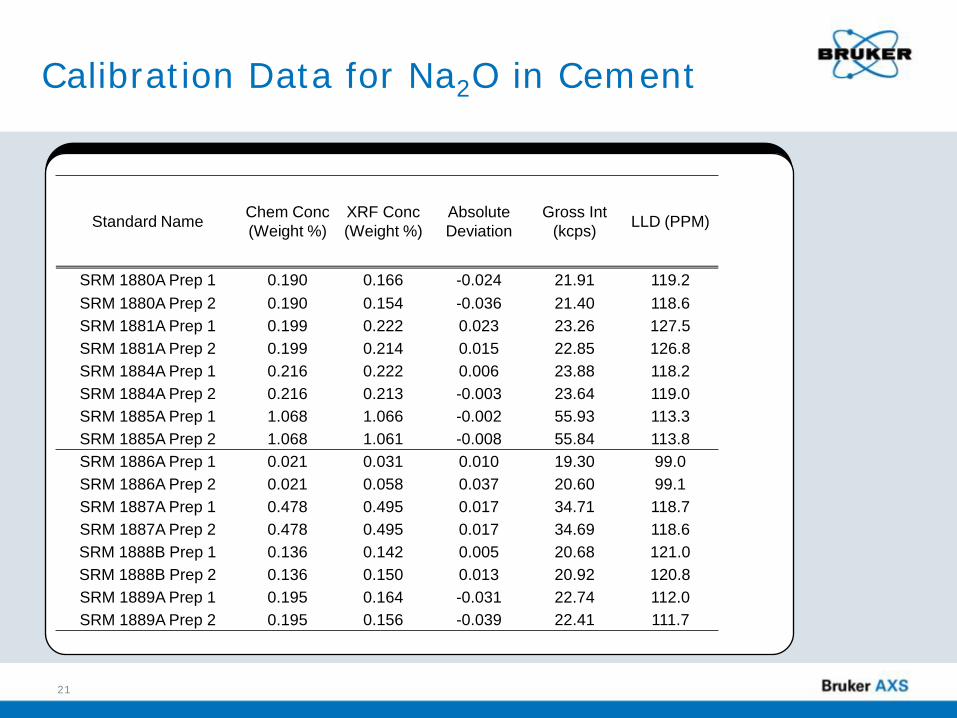
Calibration Data for MgO in Cement
22
• Abridged calibration data for line Mg KA1/Cement
• S/N 5899, Mask: 30 mm, Mode: Vacuum, 8 kV , 1.15 mA, Filter: None
• Detector parameter 1: 600 parameter 2: 400 • Peak Channels[trapeze]: 1.158 - 1.364 keV • Calibration data for compound MgO in
original sample • Absorption correction: Fixed alphas
(empirically adjusted values) • 16 standards from 0.81% to 4.48% • Standard deviation: 0.0529% • Squared correlation coefficient: 0.998056 • Alpha (Fe): 3.3278 (Adjustable by
regression) Int. corrected
Corre
cted
Inte
nsity
(Cps
)
Concentration (%)
23
30
40
50
60
70
80
90
100
110
120
130
140
150
0.6 1 2 3 4

Calibration Data for MgO in Cement
23
Standard Name Chem Conc (Weight %)
XRF Conc (Weight %)
Absolute Deviation
Gross Int (kcps) LLD (PPM)
SRM 1880A Prep 1 1.720 1.795 0.075 67.33 104.4 SRM 1880A Prep 2 1.720 1.784 0.064 66.87 103.8 SRM 1881A Prep 1 2.981 2.876 -0.105 99.53 107.2 SRM 1881A Prep 2 2.981 2.901 -0.080 100.13 106.6 SRM 1884A Prep 1 4.475 4.547 0.072 149.82 103.6 SRM 1884A Prep 2 4.475 4.538 0.063 149.60 104.4 SRM 1885A Prep 1 4.033 4.027 -0.006 136.34 102.7 SRM 1885A Prep 2 4.033 4.016 -0.017 136.12 103.3 SRM 1886A Prep 1 1.932 1.909 -0.023 73.99 95.3 SRM 1886A Prep 2 1.932 1.923 -0.009 74.57 95.5 SRM 1887A Prep 1 2.835 2.791 -0.045 97.60 107.7 SRM 1887A Prep 2 2.835 2.793 -0.042 97.68 107.7 SRM 1888B Prep 1 3.562 3.574 0.012 119.76 104.4 SRM 1888B Prep 2 3.562 3.559 -0.004 119.26 104.2 SRM 1889A Prep 1 0.814 0.833 0.019 38.94 101.7 SRM 1889A Prep 2 0.814 0.838 0.024 39.04 101.3

Stability Data (n=10 of an unknown sample)
24
Stability Test Na2O (Weight %)
MgO (Weight %)
Al2O3 (Weight %)
SiO2 (Weight %)
SO3 (Weight %)
K2O (Weight %)
CaO (Weight %)
Fe2O3 (Weight %)
Total (Weight %)
Rep 01 0.034 1.941 3.897 22.368 2.103 0.133 68.372 0.161 99.10 Rep 02 0.040 1.922 3.892 22.382 2.106 0.129 68.453 0.159 99.13 Rep 03 0.043 1.905 3.899 22.430 2.119 0.130 68.339 0.155 99.12 Rep 04 0.032 1.947 3.899 22.395 2.108 0.131 68.473 0.156 99.23 Rep 05 0.035 1.924 3.913 22.472 2.114 0.128 68.384 0.159 99.22 Rep 06 0.036 1.916 3.921 22.447 2.105 0.133 68.314 0.158 99.12 Rep 07 0.036 1.911 3.899 22.406 2.111 0.128 68.362 0.158 99.1 Rep 08 0.029 1.906 3.903 22.431 2.110 0.131 68.298 0.157 99.05 Rep 09 0.047 1.916 3.907 22.425 2.107 0.132 68.490 0.156 99.27 Rep 10 0.043 1.927 3.898 22.389 2.121 0.133 68.240 0.157 99.01
Na2O (Weight %)
MgO (Weight %)
Al2O3 (Weight %)
SiO2 (Weight %)
SO3 (Weight %)
K2O (Weight %)
CaO (Weight %)
Fe2O3 (Weight %)
Total (Weight %)
Min 0.029 1.905 3.892 22.368 2.103 0.128 68.240 0.155 99.01 Max 0.047 1.947 3.921 22.472 2.121 0.133 68.490 0.161 99.27
Average 0.038 1.922 3.903 22.415 2.110 0.131 68.373 0.158 99.135 Std Dev 0.006 0.014 0.009 0.032 0.006 0.002 0.080 0.002 0.082
Rel Std Dev 14.940 0.726 0.221 0.143 0.283 1.521 0.118 1.127 0.083

S2 RANGER with XFlash® LE Spectrum: Cement as fused bead
25
High sensitivity thanks to direct excitation and vacuum mode
High resolution: clear separation of sodium and magnesium
High dynamic range

S2 RANGER with XFlash LE Cement – Calibration of Na in fused beads
26

Analysis of Fluorine and Sodium in Slags
27

020
6010
020
030
040
050
060
010
0020
0030
0040
00
Cps
W M
A
Pd
LA1
Pd
LB1
F K
A1
0.3 0.5 1 2 3 4 5 6 7 8 9 10 11 12 13 14 15 16 17 18 19 20
KeV
S2 RANGER with XFlash® LE Analysis of Fluorine
Scan from teflon tape
28

Fluorine Slag Spectra – 8 kV
29
23
45
1020
3040
5060
7080
9010
011
012
0
Cps
Fe L
A1
F K
A1
JKS 11 8 KV None
SM 4 8 KV None
0.4 0.5 0.6 0.7 0.8 0.9
KeV
• Note: Fe LA1 must be applied as a overlap correction for
fluorine!

Calibration Data for F in Slag
30
• Abridged calibration data for line F KA1/Slag • S/N 5401, Mask: 30 mm, Mode: Vacuum, 8
kV , 1.42 mA, Filter: None • Detector parameter 1: 600 parameter 2: 400 • Peak Channels[trapeze]: 0.6222 - 0.8059 keV • Calibration data for compound F in original
sample • Absorption correction: Fixed alphas
(empirically adjusted values) • Intensity model: raw peak intensity • Minimization target: absolute error, 8
standards from 0.20 % to 7.90 % • Standard deviation: 0.0872 % • Squared correlation coefficient: 0.999043) • ***Line overlap correction by Intensity (Fe
KA1/LMF Slag) * (-0.002399) (Adjustable by regression)!!!! Int. corrected
Corre
cted
Inte
nsity
(Cps
)
Concentration (PPM)
12131415161718192021222324252627282930313233343536373839
0 1 2 3 4 5 6 7
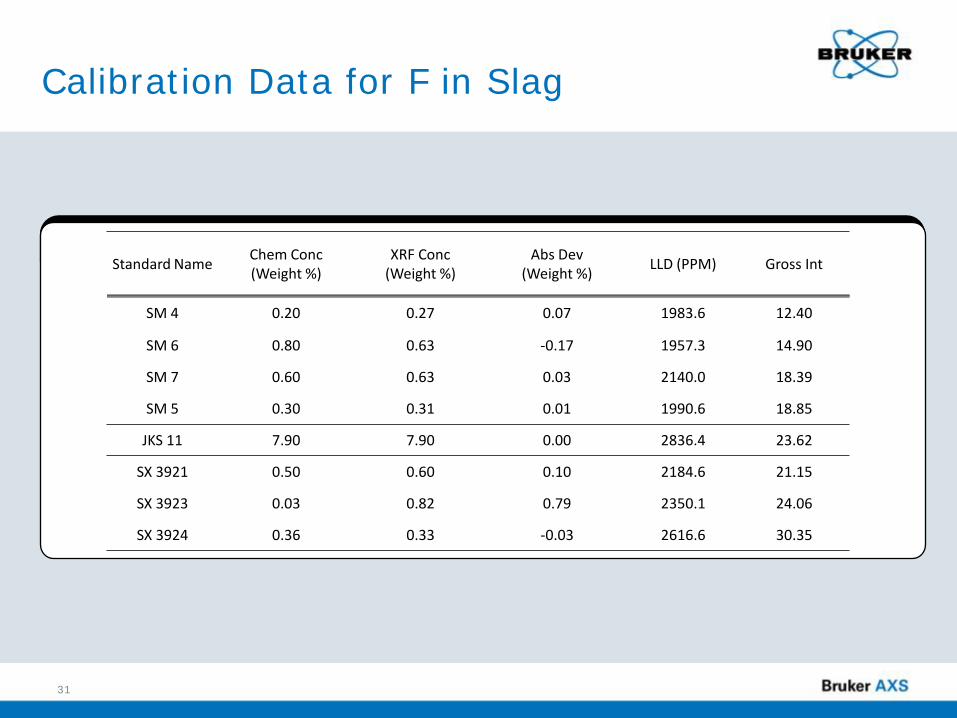
Calibration Data for F in Slag
31
Standard Name Chem Conc (Weight %)
XRF Conc (Weight %)
Abs Dev (Weight %) LLD (PPM) Gross Int
SM 4 0.20 0.27 0.07 1983.6 12.40
SM 6 0.80 0.63 -0.17 1957.3 14.90
SM 7 0.60 0.63 0.03 2140.0 18.39
SM 5 0.30 0.31 0.01 1990.6 18.85
JKS 11 7.90 7.90 0.00 2836.4 23.62
SX 3921 0.50 0.60 0.10 2184.6 21.15
SX 3923 0.03 0.82 0.79 2350.1 24.06
SX 3924 0.36 0.33 -0.03 2616.6 30.35

Analysis of Feldspar
32

Industrial Minerals Feldspars
Analytical requirements: Alkali feldspars are a common raw
material for ceramics and porcelain. Quality control (composition of major
elements) and impurities (trace elements):
Na2O – 10%, Al2O3 – 18%, SiO2 – 70% and trace elements: Fe2O3 – 0.5%, TiO2 – 0.05%
33

S2 RANGER with XFlash® LE Feldspars
Selection of standard materials: SRM available Preparation as pressed pellets: simple, fast, cost effcient 34

S2 RANGER with XFlash® LE Feldspars
Best separation of light elements: Clear identification from Na to P
High sensitivity Direct excitation with 50 W Analysis in vacuum
35

S2 RANGER with XFlash® LE Feldspars
Best separation for trace elements, no severe line overlap Elements of interest: Ca, Mn, Fe, Sr
36

S2 RANGER with XFlash® LE Feldspars
Linear range from 2.4 – 10.4% Calibration standard deviation < 0.05% Detection Limit: 200 ppm
37

S2 RANGER with XFlash® LE Feldspars
Repetitions
Na2O (%)
MgO (%)
Al2O3 (%)
SiO2 (%)
P2O5 (%)
K2O (%)
CaO (%)
TiO2 (%)
Fe2O3 (%)
Ba (ppm)
Sr (ppm)
Zr (ppm)
Rb (ppm)
1 8,82 0,20 18,36 69,40 0,23 1,52 0,83 0,31 0,29 86 103 74 54
2 8,88 0,19 18,35 69,42 0,23 1,49 0,80 0,31 0,29 80 100 73 53
3 8,84 0,19 18,34 69,41 0,23 1,51 0,85 0,31 0,29 63 102 78 54
4 8,88 0,20 18,34 69,36 0,23 1,52 0,84 0,32 0,29 93 103 75 55
5 8,87 0,21 18,31 69,37 0,24 1,55 0,83 0,32 0,29 74 103 74 55
6 8,87 0,19 18,35 69,37 0,23 1,52 0,83 0,32 0,29 90 102 73 54
7 8,84 0,18 18,37 69,45 0,22 1,50 0,81 0,31 0,29 69 104 74 55
8 8,86 0,19 18,32 69,44 0,23 1,51 0,82 0,31 0,29 80 101 79 54
9 8,88 0,19 18,37 69,33 0,24 1,53 0,84 0,31 0,29 69 101 75 55
10 8,84 0,21 18,35 69,39 0,24 1,53 0,81 0,31 0,29 79 102 81 54
Mean Values 8,86 0,20 18,35 69,39 0,23 1,52 0,83 0,31 0,29 78 102 76 54
Abs. Std Dev. 0,02 0,008 0,019 0,038 0,005 0,017 0,014 0,003 0,001 9 1 3 1
Rel. Std. Dev. 0,23% 4,15% 0,11% 0,05% 2,35% 1,09% 1,75% 0,92% 0,40% 12,12% 0,99% 3,70% 1,26%
38
S2 RANGER with XFlash® LE Feldspars
39
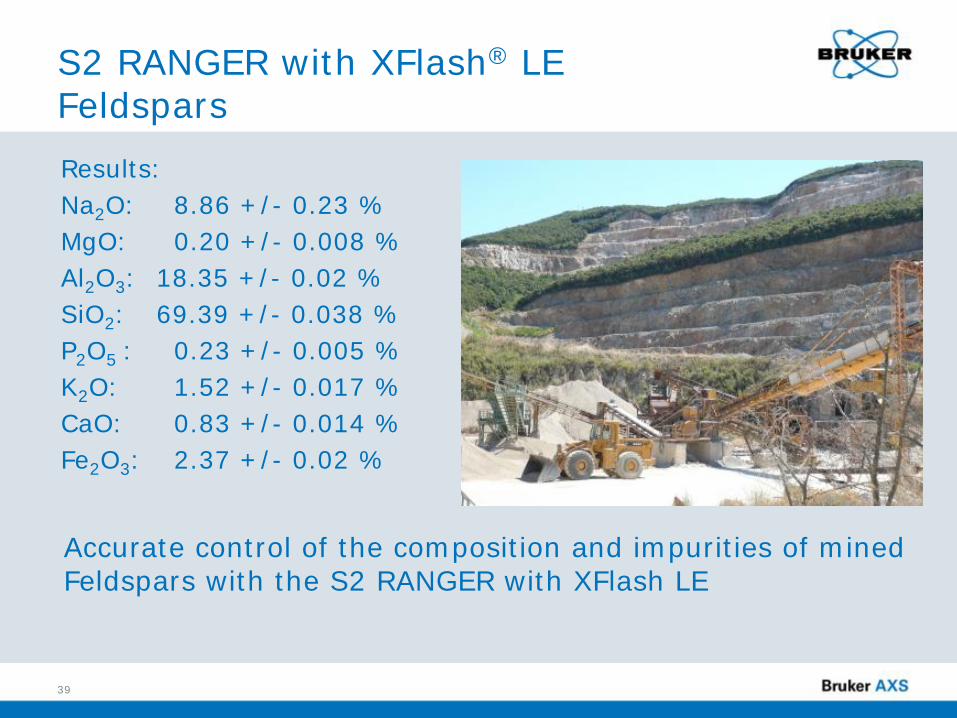
Accurate control of the composition and impurities of mined Feldspars with the S2 RANGER with XFlash LE
Results: Na2O: 8.86 +/- 0.23 % MgO: 0.20 +/- 0.008 % Al2O3: 18.35 +/- 0.02 % SiO2: 69.39 +/- 0.038 % P2O5 : 0.23 +/- 0.005 % K2O: 1.52 +/- 0.017 % CaO: 0.83 +/- 0.014 % Fe2O3: 2.37 +/- 0.02 %
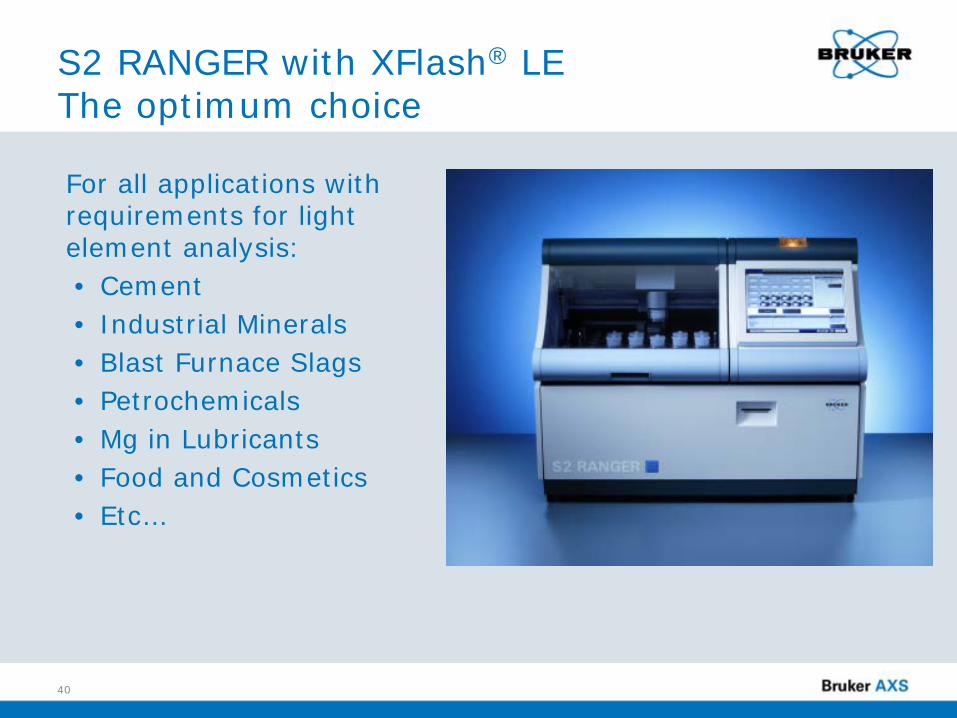
For all applications with requirements for light element analysis: • Cement • Industrial Minerals • Blast Furnace Slags • Petrochemicals • Mg in Lubricants • Food and Cosmetics • Etc…
40
S2 RANGER with XFlash® LE The optimum choice

For S2 RANGER XRF lab reports, visit www.bruker-axs.com/lab_reports_xrf.html
XRF 103 S2 RANGER with XFlash LE and
GEO-QUANT M - Analysis of Gypsum and Carbonate Rocks.pdf
XRF 82 S2 RANGER - Fast Analysis of MgO and Main Components in Limestone.pdf
XRF 81 S2 RANGER - Rapid Analysis of the Main Components in Cement.pdf
41
S2 RANGER with XFlash® LE For More Information
For more Bruker XRF webinars, visit
www.bruker-axs.com/webinars_xrf.html

Q & A
42
Please type any questions you may have for our speakers in the Q&A panel and click Send.
Cement Slags Minerals & Mining

43
www.bruker-axs.com