Analysis of Landslide Hazards and Risks in Yosemite Valley ...Geologic History of Yosemite Valley...
18
1 Volcanoes of the Eastern Sierra Nevada Analysis of Landslide Hazards and Risks in Yosemite Valley, Yosemite National Park, California June 13, 2015 Madison Rocco Ferrara
Transcript of Analysis of Landslide Hazards and Risks in Yosemite Valley ...Geologic History of Yosemite Valley...

1
Volcanoes of the Eastern Sierra Nevada
Analysis of Landslide Hazards and Risks in
Yosemite Valley, Yosemite National Park,
California
June 13, 2015
Madison Rocco Ferrara

2
TABLE OF CONTENTS
Abstract………………………………………………………………………………………….. 3
Introduction……………………………………………………………………………………... 4
Geological History of Yosemite Valley………………………………………………………… 4
Causes of Landslides……………………………………………………………………………. 6
Hazards………………………………………………………………………………………….. 8
Risks………………………………………………………………………………………….… 11
Mitigation…………………………………………………………………………………….… 13
Conclusions…………………………………………………………………………………….. 15
References……………………………………………………………………...………………. 17

3
Abstract
Landslides, rapid downslope movement of rock or soil, pose a risk to the nearly 4 million
tourists (USGS, n.d.) that visit Yosemite Valley in Yosemite National Park, California every
year. The National Park Service has made efforts to reduce the risks associated with landslide
hazards by calculating a risk metric (risk level) for locations within Yosemite Valley. The
National Park Service first mapped a rock fall hazard line by mapping boulders outlying the talus
slope. The 90th
-percentile distances, the distances at which there is a 10% probability that
boulders will fall past this point, were then calculated and scaled for frequency using cosmogenic
Be 10 exposure dating and STONE rock fall simulations. Using these components a rock fall
hazard line was obtained and used to quantify a risk metric (risk level) at locations within
Yosemite Valley. The risk metric was calculated by first identifying structures within the rock
fall hazard zone and then assigning each location a numerical value based on the expected
number of occupants and frequency of outlying boulder impacts in the area. The risk metric for
locations within Yosemite Valley range from 0.1 (low risk) to 32.6 (high risk). This information
has been used by the National Park Service to employ various mitigation techniques to reduce
the risks associated with landslide hazards in Yosemite Valley. Over 200 buildings in Curry
Village, Yosemite Valley have been closed and 3 buildings have been restructured in light of the
calculated risk metric (Stock, Luco, Collins, Harp, Reichenback, and Frankel, 2012a). The risks
associated with landslide hazards in Yosemite Valley have been calculated to be reduced by 95%
due to the efforts set forth by the National Park Service (“Rockfall”, n.d.)

4
Introduction
Landslides are a natural phenomenon that cause a large number of casualties and
economic losses worldwide. In the United States, approximately 25 to 50 casualties are attributed
to landslides annually and approximately 3.5 billion dollars (year 2001 dollars) worth of
damages are reported each year. Worldwide, the number of annual casualties is over 1000 and
economic losses are in the multiple billions of dollars (USGS, n.d.).
A landslide is defined as a rapid downslope movement of rock or soil (or artificial fill) as
a more or less coherent mass. The mass movement of rock or soil occurs when the resisting force
of the material to stay in place is overcome by the driving force applied to pull the material
downslope (primary driving force being gravity) (Keller, 2000). Factors affecting the driving and
resisting forces on a material include topography, material strength, seismic activity, water, and
vegetation. Primary regions of landslide occurrence in the United States are in the mountainous
and coastal regions of California, Oregon, and Washington, however, landslides occur in all 50
U.S. states (USGS, n.d.).
Geologic History of Yosemite Valley
Yosemite National Park in eastern California was declared a national park in 1890
(“History & Culture”, n.d.) due to the hard work and determination of John Muir to have the area
preserved in its natural setting. Yosemite National Park is composed of large granitic rocks that
were formed from the Sierra Nevada batholith during the Late Cretaceous (99-65 million years
ago) geological period (Bateman, 1992; Calkins, Huber, Roller, 1985). Rivers and cycles of
glaciation since the orogeny of the mountains within Yosemite National Park have carved a
5
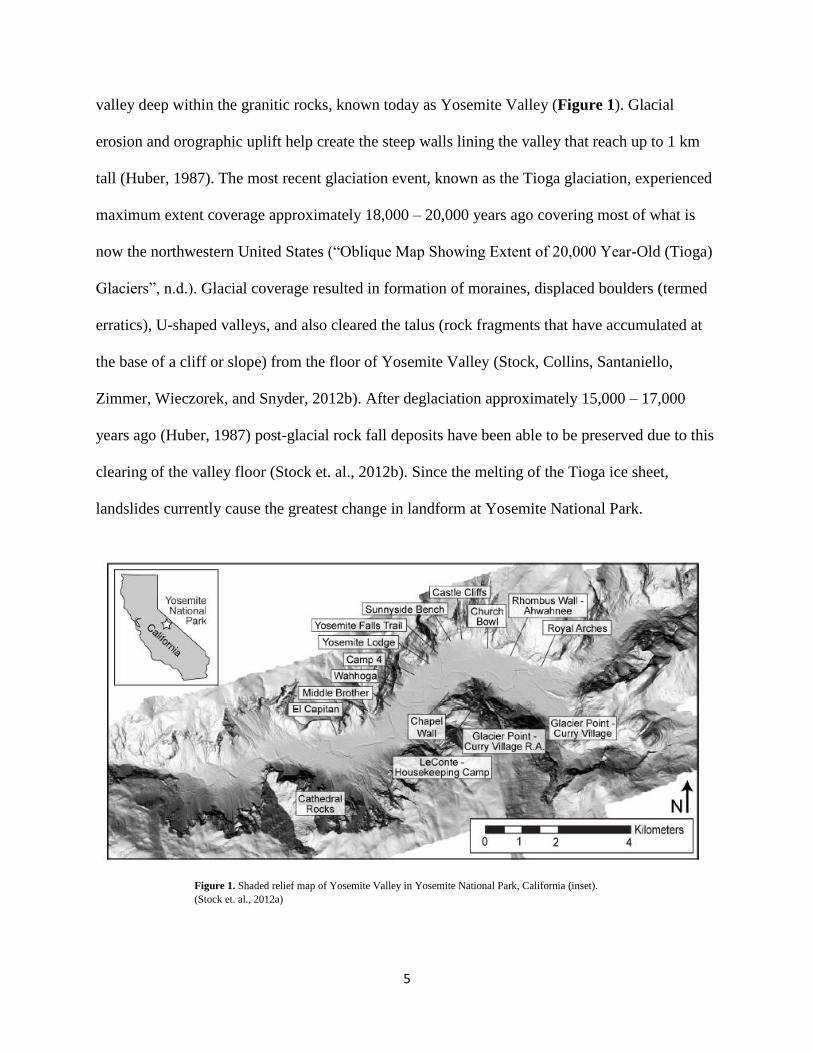
valley deep within the granitic rocks, known today as Yosemite Valley (Figure 1). Glacial
erosion and orographic uplift help create the steep walls lining the valley that reach up to 1 km
tall (Huber, 1987). The most recent glaciation event, known as the Tioga glaciation, experienced
maximum extent coverage approximately 18,000 – 20,000 years ago covering most of what is
now the northwestern United States (“Oblique Map Showing Extent of 20,000 Year-Old (Tioga)
Glaciers”, n.d.). Glacial coverage resulted in formation of moraines, displaced boulders (termed
erratics), U-shaped valleys, and also cleared the talus (rock fragments that have accumulated at
the base of a cliff or slope) from the floor of Yosemite Valley (Stock, Collins, Santaniello,
Zimmer, Wieczorek, and Snyder, 2012b). After deglaciation approximately 15,000 – 17,000
years ago (Huber, 1987) post-glacial rock fall deposits have been able to be preserved due to this
clearing of the valley floor (Stock et. al., 2012b). Since the melting of the Tioga ice sheet,
landslides currently cause the greatest change in landform at Yosemite National Park.
Figure 1. Shaded relief map of Yosemite Valley in Yosemite National Park, California (inset).
(Stock et. al., 2012a)

6
Causes of Landslides
Landslides, rapid downslope movements of rock or soil, are result from unstable slopes.
Slope stability is determined by the interrelation of several factors including topography (i.e.
slope angle), material strength (i.e. type of material), seismic activity, water, and vegetation.
Slope stability can be expressed in terms of the relationship between the driving forces and
resisting forces applied to a slope. Driving forces are forces which tend to move earth materials
down a slope. The primary driving force responsible for landslides is the weight of the material
being pulled downslope by gravity. Resisting forces are forces which tend to oppose movement.
The primary resisting force in terms of landslides is the strength of the material acting parallel to
a slip plane, known as shear strength (Keller, 2000).
Topography relates to potential landslide occurrence steep slope angles create greater
relative potential energy for a material. Yosemite Valley has great potential for landslide
occurrence due to the valley’s steep walls that can be angled as steep as 90 degrees (Figure 2).
The shear strength of slope material is the most significant factor in determining the resistance of
downslope movement of materials. The factors that contribute to shear strength of a material are
cohesion and internal friction (“Landslides, Slope Failure, & other Mass Wasting Processes”,
n.d.). Although granite of Yosemite National Park has a high shear strength, events such as
seismic activity, tectonic stresses, and erosion can cause granitic rock to fracture. Fractures that
develop parallel to the surface of the rock face (termed sheeting joints) ultimately cause large
slabs of rock to fall downslope in a process called exfoliation (“Rockfall”, n.d.). Exfoliation is a
common phenomenon in granitic rocks and can be observed in most exposed rock faces at
Yosemite National Park.

7
Water, ice, earthquakes, and vegetation are able to transfer energy into rock fractures and
provide the necessary forces needed to overcome the resistive strength of slope material.
Landslides can be triggered by water seeping into cracks followed by expansion upon freezing
into ice. The outward pressure applied on cracks from the expanded ice is possible to provide
sufficient energy to overcome the shear strength of the material resulting in a downslope
movement of rock. This process is known as frost wedging or freeze-thaw mechanics. Similarly,
the roots of vegetation (most notably firs and pines in the Yosemite region) can infiltrate cracks
and expand as the plant matures which can create a driving force that is possible of being strong
enough to trigger a landslide (“Rockfall”, n.d.). Commonly, landslides are triggered by seismic
activity resulting from earthquakes due to the large amount of energy and ground shaking
Figure 2. Surface slope map for Yosemite Valley. Very steep valley walls
(red) are easily distinguished from the nearly flat valley floor (blue).
(Stock et. al., 2012a)

8
associated with these events (Keller, 2000). Correlations have been found showing an increasing
area coverage of landslide debris with increasing magnitude of earthquakes (Figure 3) (Keefer,
1984). However, there is a large degree of uncertainty regarding what exactly triggers a landslide
for any given event (“Rockfall”, n.d.). In Yosemite Valley, more than half of all documented
landslides are not able to be associated with a recognizable trigger (Stock, Luco, Collins, Harp,
Reichenback, and Frankel, 2012a).
Hazards
Assessing hazards associated with landslides in Yosemite Valley has been used to help
aid in enhancing park safety. With respect to landslides, hazard has been defined as “the
probability of occurrence within a specified period of time and within a given area of a
potentially damaging phenomenon” (Varnes, 1984). Information about past landslides can be
Figure 3. Correlation between magnitude of earthquake and area
affected by landslides (km2). (Keefer, 1984)

9
obtained through observations of talus slopes in Yosemite Valley. Talus is the accumulation of
rock fall generated boulders at the base of steep cliffs (Stock et. al., 2012a). Rock fall
accumulates in a characteristic profile known as a talus slope in rock fall dominated regions
(Evans, Hungr, 1993). Efforts have been made by the National Park Service to identify and map
the base of talus slopes in order to access where past rock falls have occurred (Stock et. al.,
2012b).
The National Park Service used several factors based on observable and measurable
evidence of past landslides to create a rock fall hazard line. The rock fall hazard line is scaled to
represent the same level of hazard everywhere within the line and a 0.2% annual probability that
a boulder will be deposited beyond this line. In order to develop the rock fall hazard line outlying
boulders (any boulders that travel beyond the limits of the talus deposits) were mapped to
determine the maximum extent of previous landslides. However, as more talus accumulates from
landslides with time the angle of the talus slope also increases. For this, the maximum extent of
outlying boulders will increase with time. To adjust for this process the National Park Service
calculated what is known as the 90th
-percentile distance. The 90th
-percentile distance is the
distance at which there is a 10% probability that an outlying boulder from a future rock fall will
exceed this distance (Stock et. al., 2012a). Because information on rock fall frequency is critical
to fully evaluate hazard (Varnes, 1984) the National Park Service scaled the 90th
-percentile
distances for frequency. This was done by age dating the outlying boulders using cosmogenic
Be 10 exposure dating and computer generated rock fall simulations (known as STONE). This
information was then used to calculate the position at which there is a 0.2% annual probability
that a boulder will be deposited beyond this line (Stock et. al., 2012a). A flow chart illustrating
the various components on assessing the rock fall hazard line is shown in Figure 4.

10
An example of the mapped rock fall hazard line in one of the locations in Yosemite Valley is
shown in Figure 5.
Figure 4. Flow chart illustrating the key components of the hazard assessment methodology used
to determine the final rock-fall hazard line. (Stock et. al., 2012a).
Figure 5. The final adjusted rock-fall hazard line for the Wahhoga and Camp 4 study regions
within Yosemite Valley. (Stock et. al., 2012a).

11
Risks
Risk, in regards to landslides, has been defined as a measure of “the probability and
severity of an adverse effect to health, property, or the environment” (Fell, Corominas, Bonnard,
Cascini, Leroi, Savage, 2008). Landslides pose risk to the nearly four million annual visitors of
Yosemite National Park. (Stock et. al., 2012a). Between 1857 and 2011 there were 15 fatalities
and at least 85 injuries from rock falls and other forms of slope movement in Yosemite (Stock et.
al., 2012b). Trails, roads, parking lots, tent cabins, wooden cabins, residences and other
structures in Yosemite Valley have also been damaged by landslides. (Stock et. al., 2012a). Due
to the steep valley walls (~1 km tall) and the relatively narrow width of the valley there is no
region that is absolutely safe from extremely large rock falls within Yosemite Valley
(Wieczorek, Morrissey, Jovine, and Godt, 1998). In order to access the risk of rock falls and
other forms of landslides at each area within Yosemite National Park the National Park Service
has quantified a risk metric in order to identify locations that are most at risk of landslide
hazards.
Risks from landslide hazards were quantified into a risk metric by determining the
likelihood of persons being struck by falling boulders within the hazard line. The risk assessment
focused on areas in Yosemite Valley where large groups of people accumulate such as
campsites, lodges, amphitheaters, and other facilities. All structures were assumed to be equally
penetrable by rock fall boulders (Stock et. al., 2012a) because the large amount of energy carried
by these falling boulders is likely to knock down any structure in its path. A risk metric (risk
level) was quantified for each structure or facility by using a combination of the distance from
the hazard line to assess the likelihood of being struck with a boulder and the expected
occupancy during any given time. The calculation of the risk metric is the product of the
12
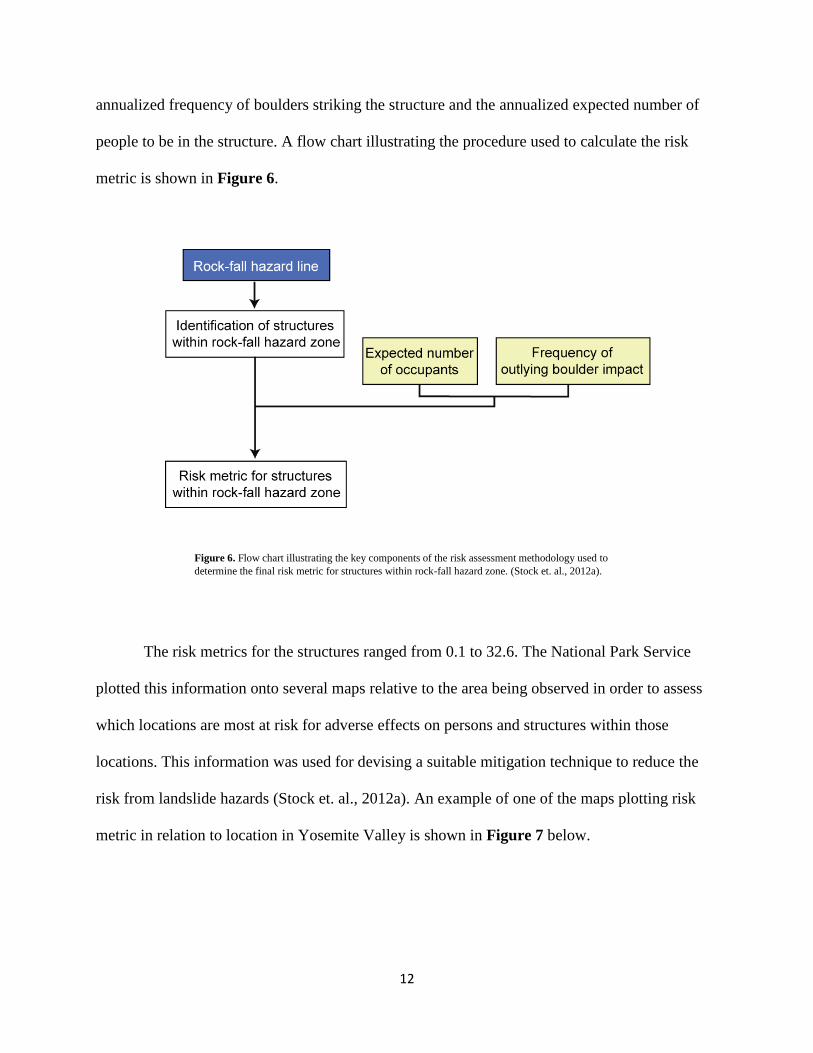
annualized frequency of boulders striking the structure and the annualized expected number of
people to be in the structure. A flow chart illustrating the procedure used to calculate the risk
metric is shown in Figure 6.
The risk metrics for the structures ranged from 0.1 to 32.6. The National Park Service
plotted this information onto several maps relative to the area being observed in order to assess
which locations are most at risk for adverse effects on persons and structures within those
locations. This information was used for devising a suitable mitigation technique to reduce the
risk from landslide hazards (Stock et. al., 2012a). An example of one of the maps plotting risk
metric in relation to location in Yosemite Valley is shown in Figure 7 below.
Figure 6. Flow chart illustrating the key components of the risk assessment methodology used to
determine the final risk metric for structures within rock-fall hazard zone. (Stock et. al., 2012a).

13
Mitigation
Mitigation techniques such as scaling or stabilizing loose rocks and installing ditches,
fences, or netting to slow or stop falling are generally considered unfeasible due to the National
Park Services duty to conserve the natural scenery and processes of Yosemite Valley.
Furthermore, even these methods cannot stop high energy rock falls in Yosemite Valley.
Because it is not feasible to reduce hazard (probability of occurrence) of landslides in Yosemite
Valley the most effective way to reduce the risk of injury to persons is to limit the exposure of
people to the most hazardous areas. For this, the National Park Service has removed or
Figure 7. Risk metrics for structures within the Wahhoga and Camp 4 study regions within
Yosemite Valley. (Stock et. al., 2012a).
14
repurposed various structures and buildings to reduce the occupancy of the locations at any given
time (“Reducing Rockfall Risk in Yosemite National Park”, n.d.).
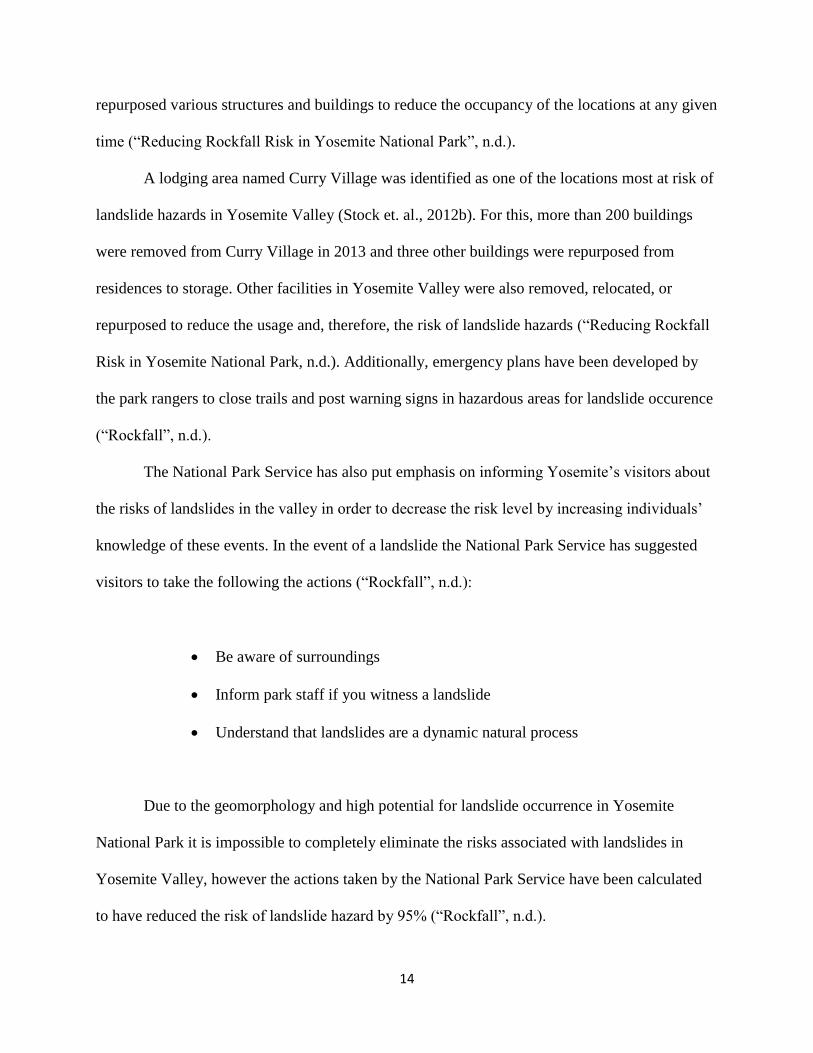
A lodging area named Curry Village was identified as one of the locations most at risk of
landslide hazards in Yosemite Valley (Stock et. al., 2012b). For this, more than 200 buildings
were removed from Curry Village in 2013 and three other buildings were repurposed from
residences to storage. Other facilities in Yosemite Valley were also removed, relocated, or
repurposed to reduce the usage and, therefore, the risk of landslide hazards (“Reducing Rockfall
Risk in Yosemite National Park, n.d.). Additionally, emergency plans have been developed by
the park rangers to close trails and post warning signs in hazardous areas for landslide occurence
(“Rockfall”, n.d.).
The National Park Service has also put emphasis on informing Yosemite’s visitors about
the risks of landslides in the valley in order to decrease the risk level by increasing individuals’
knowledge of these events. In the event of a landslide the National Park Service has suggested
visitors to take the following the actions (“Rockfall”, n.d.):
Be aware of surroundings
Inform park staff if you witness a landslide
Understand that landslides are a dynamic natural process
Due to the geomorphology and high potential for landslide occurrence in Yosemite
National Park it is impossible to completely eliminate the risks associated with landslides in
Yosemite Valley, however the actions taken by the National Park Service have been calculated
to have reduced the risk of landslide hazard by 95% (“Rockfall”, n.d.).
15
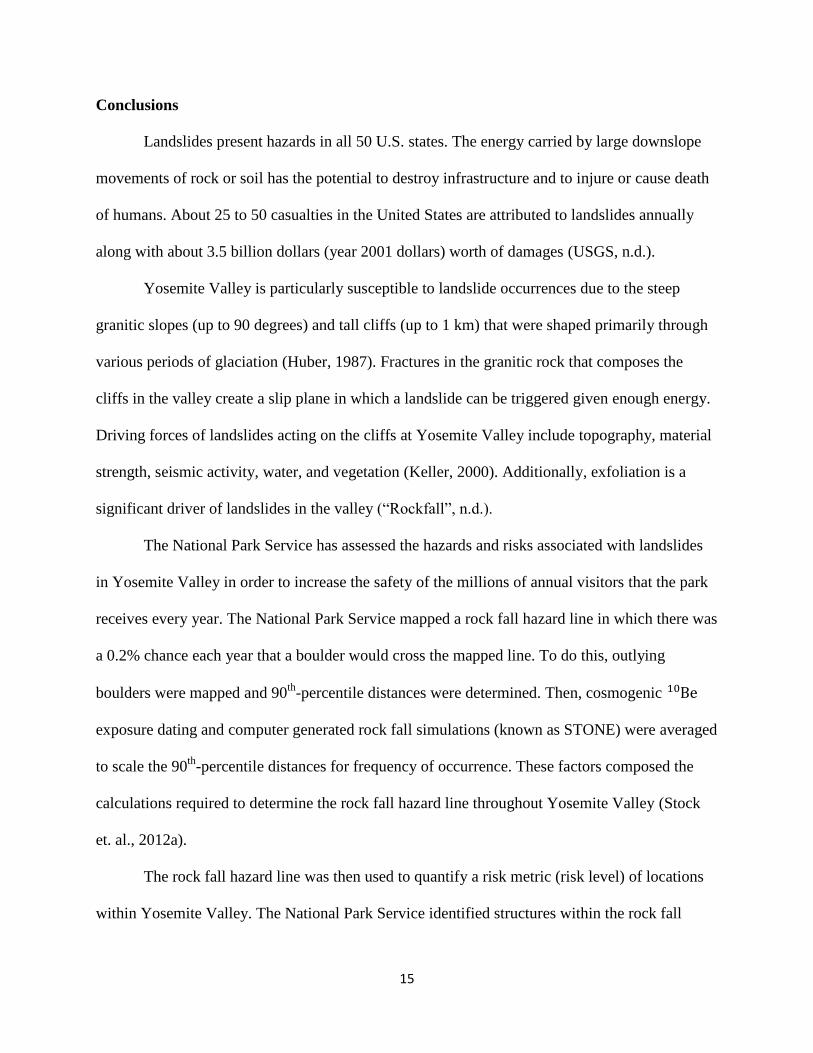
Conclusions
Landslides present hazards in all 50 U.S. states. The energy carried by large downslope
movements of rock or soil has the potential to destroy infrastructure and to injure or cause death
of humans. About 25 to 50 casualties in the United States are attributed to landslides annually
along with about 3.5 billion dollars (year 2001 dollars) worth of damages (USGS, n.d.).
Yosemite Valley is particularly susceptible to landslide occurrences due to the steep
granitic slopes (up to 90 degrees) and tall cliffs (up to 1 km) that were shaped primarily through
various periods of glaciation (Huber, 1987). Fractures in the granitic rock that composes the
cliffs in the valley create a slip plane in which a landslide can be triggered given enough energy.
Driving forces of landslides acting on the cliffs at Yosemite Valley include topography, material
strength, seismic activity, water, and vegetation (Keller, 2000). Additionally, exfoliation is a
significant driver of landslides in the valley (“Rockfall”, n.d.).
The National Park Service has assessed the hazards and risks associated with landslides
in Yosemite Valley in order to increase the safety of the millions of annual visitors that the park
receives every year. The National Park Service mapped a rock fall hazard line in which there was
a 0.2% chance each year that a boulder would cross the mapped line. To do this, outlying
boulders were mapped and 90th
-percentile distances were determined. Then, cosmogenic Be 10
exposure dating and computer generated rock fall simulations (known as STONE) were averaged
to scale the 90th
-percentile distances for frequency of occurrence. These factors composed the
calculations required to determine the rock fall hazard line throughout Yosemite Valley (Stock
et. al., 2012a).
The rock fall hazard line was then used to quantify a risk metric (risk level) of locations
within Yosemite Valley. The National Park Service identified structures within the rock fall
16
hazard zone (areas behind the rock fall hazard line) in conjunction with the expected number of
occupants at each site and the frequency of outlying boulder impact to calculate a numerical
value for the risk metric of structures within the rock fall hazard zone. Values ranged from 0.1
(low risk) to 32.6 (high risk).
The risk metric was used to determine relative safety of areas within the valley and to
help with landslide mitigation techniques. In order to reduce the risk of injury or death the
National Park Service removed 200 buildings from Curry Village (campsite within Yosemite
Valley) and repurposed three buildings from residences to storage (“Reducing Rockfall Risk in
Yosemite National Park”, n.d.). The National Park Service have established emergency plans for
closing trails. Additionally, the National Park Service is continually working on increasing
visitor knowledge about landslides within Yosemite National Park. The efforts made by the
National Park Service have been calculated to reduce the risk associated with landslide hazards
in Yosemite Valley by 95% (“Rockfall, n.d.). Yosemite Valley in Yosemite National Park,
California, despite its hazards, is continually a popular vacation spot for millions of tourists
worldwide.
17
References
Bateman, P.C., 1992, Plutonism in the central part of the Sierra Nevada Batholith, California:
U.S. Geological Survey Professional Paper 1483, 186 p.
Calkins, F.C., Huber, N.K., and Roller, J.A., 1985, Geologic bedrock map of Yosemite Valley,
Yosemite National Park, California: U.S. Geological Survey Map I-1639.
Evans, S.G., and Hungr O., 1993, The assessment of rockfall hazard at the base of talus slopes,
Canadian Geotechnical Journal, v. 30, p. 620-636.
Fell, R., Corominas, J., Bonnard, C., Cascini L., Leroi, E., and Savage, W.Z., 2008, Guidelines
for landslide susceptibility, hazard and risk zoning for land use planning: Engineering
Geology, v. 102, p. 85-98.
History & Culture - Yosemite National Park (U.S. National Park Service). (n.d.). Retrieved June 13,
2015, from http://www.nps.gov/yose/learn/historyculture/index.htm
Huber, N.K., 1987, The Geologic Story of Yosemite National Park: U.S. Geological Survey
Bulletin 1595.
Keefer, D.K., Landslides caused by earthquakes. 1984. Retrieved June 13, 2015, from
http://gsabulletin.gsapubs.org/content/95/4/406.full.pdf+html
Keller, E. A. (2000). Environmental Geology (8th ed.). Prentice-Hall, Inc.
Landslides, Slope Failure, & other Mass Wasting Processes Module 4 Environmental Geology. (n.d.).
Retrieved June 13, 2015, from
http://geology.isu.edu/wapi/envgeo/EG4_mass_wasting/EG_module_4.htm

18
Oblique Map Showing Maximum Extent of 20,000-Year-Old (Tiioga) Glaciers, Yosemite National
Park, Central Sierra Nevada, California. (n.d.). Retrieved June 13, 2015, from
http://pubs.usgs.gov/imap/i1885/
Reducing Rockfall Risk in Yosemite National Park - Eos. (n.d.). Retrieved June 13, 2015, from
https://eos.org/project-updates/reducing-rockfall-risk-yosemite-national-park
Rockfall - Yosemite National Park (U.S. National Park Service). (n.d.). Retrieved June 13, 2015, from
http://www.nps.gov/yose/learn/nature/rockfall.htm
Stock, G.M., Collins, B.D., Santaniello, D.J., Zimmer, V.L., Wieczorek, G.F., and Snyder, J.B.,
2012b, Historical rock falls in Yosemite National Park (1857-2011): U.S. Geological Survey
Open-File Report (in review).
Stock, G.M., Luco, N, Collins, B.D., Harp, E.L., Reichenback, P., and Frankel, K.L., 2012a,
Quantitative rock-fall hazard and risk assessment for Yosemite Valley, Yosemite National Park,
California: U.S. Geological Survey
USGS. Types of landslides.indd - fs2004-3072.pdf. (n.d.). Retrieved from
http://pubs.usgs.gov/fs/2004/3072/pdf/fs2004-3072.pdf
Varnes, D.J., 1984, Landslide hazard zonation: A review of principles and practice: Natural
Hazards, v. 3, UNESCO, Paris.
Wieczorek, G.F., Morrissey, M.M., Iovine, G., and Godt, J., 1998, Rock-fall hazards in Yosemite
Valley: U.S. Geological Survey Open-File Report 98-467.