Analysis of incentives and disincentives for cotton in Kenya

ANALYSIS OF INCENTIVES AND DISINCENTIVES FOR COCOA IN NIGERIA
FEBRUARY 2013

This technical note is a product of the Monitoring African Food and Agricultural Policies project (MAFAP). It is a technical document intended primarily for internal use as background for the eventual MAFAP Country Report. This technical note may be updated as new data becomes available.
MAFAP is implemented by the Food and Agriculture Organization of the United Nations (FAO) in collaboration with the Organisation for Economic Co-operation and Development (OECD) and national partners in participating countries. It is financially supported by the Bill and Melinda Gates Foundation, the United States Agency for International Development (USAID), and FAO.
The analysis presented in this document is the result of the partnerships established in the context of the MAFAP project with governments of participating countries and a variety of national institutions.
For more information: www.fao.org/mafap
Suggested citation: Cadoni P., 2013. Analysis of incentives and disincentives for cocoa in Nigeria. Technical notes series, MAFAP, FAO, Rome. © FAO 2013 FAO encourages the use, reproduction and dissemination of material in this information product. Except where otherwise indicated, material may be copied, downloaded and printed for private study, research and teaching purposes, or for use in non-commercial products or services, provided that appropriate acknowledgement of FAO as the source and copyright holder is given and that FAO’s endorsement of users’ views, products or services is not implied in any way. All requests for translation and adaptation rights, and for resale and other commercial use rights should be made via www.fao.org/contact-us/licence-request or addressed to [email protected]. FAO information products are available on the FAO website (www.fao.org/publications) and can be purchased through [email protected].
2

SUMMARY OF THE NOTE Product: Cocoa Period analyzed: 2006 – 2010 Trade status: Export in all years
• Nigeria is the fourth leading exporter of cocoa in the world. Cocoa is mainly exported as beans, processing activities being limited within the country. Cocoa is the main agricultural export in Nigeria.
• Low and declining yields are observed due to inconsistent production patterns, disease incidence, pest attack and little agricultural mechanization. The main challenges faced by the cocoa sector are the decreasing level of labor force and the ageing of trees resulting in low yields.
• The cocoa market liberalization (1986) resulted in the numerous traders and marketers involved in the value chain. However, few companies export most of the production.
The observed Nominal Rate of Protection (NRP, green line) indicates that producers received price incentives only in 2006 and then they received prices lower than the reference international prices from 2007 to 2010. Therefore, cocoa-supporting policies did not have the expected results namely providing incentives to producers in order to increase production by increasing productivity.
• The poor price transmission between export markets and producers level prevented producers from receiving prices reflecting international price trends. The export market is characterized by a high concentration of export companies benefiting from high market power compared to producers.
• The numerous intermediaries involved in the value chain create inefficiencies and also affect prices received by producers.
-100%
-80%
-60%
-40%
-20%
0%
20%
40%
60%
80%
100%
2006 2007 2008 2009 2010
Observed nominal rate of protection at farm gate
3

TABLE OF CONTENTS
SUMMARY OF THE NOTE ......................................................................................................................... 3
TABLE OF CONTENTS ............................................................................................................................... 4
1. PURPOSE OF THE NOTE ................................................................................................................... 5
2. COMMODITY CONTEXT ................................................................................................................... 6
PRODUCTION ....................................................................................................................................... 6
CONSUMPTION/UTILIZATION ............................................................................................................. 8
MARKETING AND TRADE ..................................................................................................................... 9
DESCRIPTION OF THE VALUE CHAIN AND PROCESSING .................................................................... 11
POLICY DECISIONS AND MEASURES .................................................................................................. 14
3. DATA REQUIREMENTS, DESCRIPTION AND CALCULATION OF INDICATORS ................................. 18
TRADE STATUS OF THE PRODUCTS ................................................................................................... 18
BENCHMARK PRICES .......................................................................................................................... 18
DOMESTIC PRICES ............................................................................................................................. 19
EXCHANGE RATES .............................................................................................................................. 20
ACCESS COSTS ................................................................................................................................... 20
EXTERNALITIES .................................................................................................................................. 20
BUDGET AND OTHER TRANSFERS ..................................................................................................... 20
QUALITY AND QUANTITY ADJUSTMENTS .......................................................................................... 21
DATA OVERVIEW ............................................................................................................................... 21
CALCULATION OF INDICATORS .......................................................................................................... 23
4. INTERPRETATION OF THE INDICATORS ......................................................................................... 25
5. PRELIMINARY CONCLUSIONS AND RECOMMENDATIONS ............................................................ 28
MAIN MESSAGE ................................................................................................................................. 28
PRELIMINARY RECOMMENDATIONS ................................................................................................. 28
Despite the availability of certain data, the MAFAP analysis suggests to:........................................ 28
LIMITATIONS ..................................................................................................................................... 28
FURTHER INVESTIGATION AND RESEARCH ....................................................................................... 29
BIBLIOGRAPHY ....................................................................................................................................... 30
ANNEX I: Methodology Used ................................................................................................................. 32
ANNEX II: Data and calculations used in the analysis ........................................................................... 33
4

1. PURPOSE OF THE NOTE This technical note aims to describe the market incentives and disincentives for Cocoa in Nigeria.
For this purpose, yearly averages of price at farm-gate and point of competition will be compared with reference prices calculated on the basis of the price of the commodity in the international market. The price gaps between the reference prices and the prices along the value chain indicate to which extent incentives (positive gaps) or disincentives (negative gaps) are present at farm-gate and wholesale level. In relative terms, the price gaps are expressed as Nominal Rates of Protection. These key indicators are used by MAFAP to highlight the effects of policy and market development gaps on prices.
The note starts with a brief review of the production, consumption, trade and policies affecting the commodity and then provides a detailed description of how the key components of the price analysis have been obtained. The MAFAP indicators are then calculated with these data and interpreted in the light of existing policies and market characteristics. The analysis that has been carried out is commodity and country specific and covers the period 2006 - 2010. The indicators have been calculated using available data from different sources for this period and are described in Part 3, and covers the period 2006-2009.
The outcomes of this analysis can be used by those stakeholders involved in policy-making for the food and agricultural sector. They can also serve as input for evidence-based policy dialogue at country or regional level.
This technical note is not to be interpreted as an analysis of the value chain or detailed description of production, consumption or trade patterns. All information related to these areas is presented merely to provide background on the commodity under review, help understand major trends and facilitate the interpretation of the indicators.
All information is preliminary and still subject to review and validation.
5
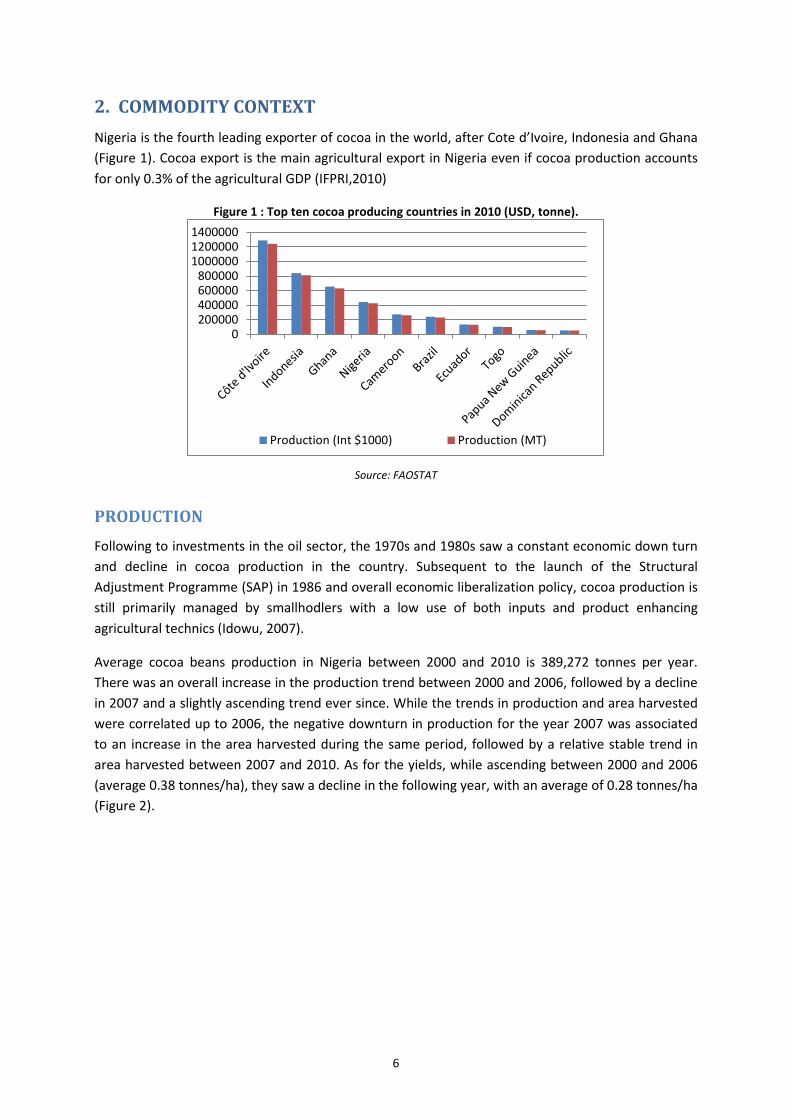
2. COMMODITY CONTEXT Nigeria is the fourth leading exporter of cocoa in the world, after Cote d’Ivoire, Indonesia and Ghana (Figure 1). Cocoa export is the main agricultural export in Nigeria even if cocoa production accounts for only 0.3% of the agricultural GDP (IFPRI,2010)
Figure 1 : Top ten cocoa producing countries in 2010 (USD, tonne).
Source: FAOSTAT
PRODUCTION Following to investments in the oil sector, the 1970s and 1980s saw a constant economic down turn and decline in cocoa production in the country. Subsequent to the launch of the Structural Adjustment Programme (SAP) in 1986 and overall economic liberalization policy, cocoa production is still primarily managed by smallhodlers with a low use of both inputs and product enhancing agricultural technics (Idowu, 2007).
Average cocoa beans production in Nigeria between 2000 and 2010 is 389,272 tonnes per year. There was an overall increase in the production trend between 2000 and 2006, followed by a decline in 2007 and a slightly ascending trend ever since. While the trends in production and area harvested were correlated up to 2006, the negative downturn in production for the year 2007 was associated to an increase in the area harvested during the same period, followed by a relative stable trend in area harvested between 2007 and 2010. As for the yields, while ascending between 2000 and 2006 (average 0.38 tonnes/ha), they saw a decline in the following year, with an average of 0.28 tonnes/ha (Figure 2).
0200000400000600000800000
100000012000001400000
Production (Int $1000) Production (MT)
6

Figure 2 : Cocoa Harvested Area (Hectares), Production (tonnes) and yields (tonnes/ha) 2000-2010.
Source: FAOSTAT
Nwachukwu et al. (2010), identify low yields, inconsistent production patterns, disease incidence, pest attack and little agricultural mechanization as key factors leading to decreasing cocoa production in Nigeria. Additionally, the ageing of cocoa producing trees also plays a role in the decrease of productivity. Particularly, 60 percent of cocoa farms are over 40 years old, thus hampering productivity. Overall, farms in Southern/southern Eastern Nigeria tend to be younger and generally more productive (Nwachukwu et Al. 2010). When compared to other cocoa producing countries, Nigeria presents yields among the lowest, together with Ghana and Cameroon, while Cote d’Ivoire is the best performing country in West Africa in terms of yields, and Indonesia is the best performer in terms of yield at the global level (Figure 3).
Figure 3 : Cocoa yields by country: 1990 – 2010, kg/ha.
Source: FAOSTAT (2012)
Alomnado cocoa is the main variety grown in Nigeria, which is one of the highest quality cocoa varieties often associated to a premium price in the international market. However, while Nigerian cocoa used to receive a premium in the average of USD 75 per ton when compared to that of Cote
0.00
0.05
0.10
0.15
0.20
0.25
0.30
0.35
0.40
0.45
0.50
0
200,000
400,000
600,000
800,000
1,000,000
1,200,000
1,400,000
1,600,000
2000 2001 2002 2003 2004 2005 2006 2007 2008 2009 2010Yield (ton/Ha) Area Harvested (Ha) Production (tonnes)
0
2000
4000
6000
8000
10000
12000
Cameroon
Côte d'Ivoire
Ghana
Indonesia
Nigeria
7

d’Ivoire (the major international producer), such premium disappeared since the 1990s, following the dismantling of the Nigerian Cocoa Board and the relaxation in quality control (Oxfam, 2002).
Although cocoa is mostly grown in fourteen of the Thirty-six Nigerian States, the main producing states (aside from Cross River, in the South East) are located in the South West of the country, with most production areas located in: Edo, Ekiti, Ogun, Ondo, Osun, Oyo (Figure 4).
Figure 4 : Main Cocoa Producing areas, Average 2006/2007-2009/2010 production (‘000MT).
Source: National Bureau of Statistics, 2012
According to FAOSTAT commodity balance, only 3 percent of the cocoa beans produced in Nigeria are used as food within the Nigerian borders, while the remaining are either exported (52 percent) or classified as “other utility”, most likely undergoing first processing in country and then exported as different cocoa-derived commodity (Table 1).
Table 1 : Cocoa Commodity Balance for Nigeria, 2000-2007. 2000 2001 2002 2003 2004 2005 2006 2007
Production (tonne) (I) 338,000
340,000
362,000
385,000
412,000
441,000
485,000
500,000
Import Quantity (tonne) (II) 551 980 5,020 3,764 1,215 785 352 560
Stock Variation (tonne) (III) -155 258 207 -181 258 0 -129 129
Export Quantity (tonne) (IV) 152,636
182,580
187,178
235,743
263,110
278,592
199,610
190,323
Domestic supply quantity (tonne) (V: I + II + III - IV)
185,760
158,658
180,049
152,841
150,363
163,193
285,613
310,366
Food (tonnes) (VII: V-VI) 8,758 15,928 15,806 13,101 11,963 11,893 18,113 15,266
Other Utility (tonnes (VI) 177,000
142,728
164,243
139,740
138,400
151,300
267,500
295,100
Source: FAOSTAT 2012
CONSUMPTION/UTILIZATION Cocoa consumption within the country is negligible since only three percent of the product is consumed as food (FAOSTAT, 2012). According to projections, cocoa consumption will increase by 35 percent by the year 2016 (Business Monitor International, 2012). However, although the projected growth of Nigerian GDP per capita and population will increase the demand of cocoa-based products,
0
20
40
60
80
100
CrossRiver
Edo Ekiti Ogun Ondo Osun Oyo
8

a strong performance in cocoa consumption will most likely be hampered by an inadequate cocoa processing industry (Business Monitor International, 2012).
MARKETING AND TRADE Prior to the oil boom era in Nigeria, cocoa, cotton, groundnut, palm oil products and rubber were the principal export crops. With export re-orientation, only cocoa remained of any importance after 1975. With assistance from the World Bank, the government restored cocoa production in the late 1970s and 1980s through replanting programs and producer price supports (Nwachukwu et al, 2010).
Structural adjustment policies have resulted into market liberalization, resulting into the abolition of commodity Boards, the introduction of free market pricing policies, and the fluctuation in cocoa prices. Historically, Nigerian cocoa was marketed through monopoly-monopsony market boards, as in Ghana, differently from other West African countries, such as Cameroon and Côte d’Ivoire, where it was marketed through caisses de stabilization. Marketing boards are parastatal agencies with the monopoly for internal and external crop marketing. Caisses de stabilization, instead, determine internal prices and have the ownership of the crop along the marketing chain, while the physical handling of the crop, from the farmer to the export points, is carried out by private agents designated by the Caisse.
Nigeria was the first African country to liberalize cocoa trade in 1986. Following the World Bank indication that agricultural marketing boards in the country were ineffective, and the suggestion to liberalize agriculture following to the liberalization of foreign exchange, the Nigerian Government unilaterally abolished marketing boards (Gilbert, 2002).
Overall, export crop liberalization, and cocoa liberalization in particular, has led to a declining use of agricultural inputs, as well as to declining quality of cocoa beans. Specifically, the switch to private trade lead to lesser quality control and declining export coordination, with lesser opportunities for forward selling, sales by tender and sales on CIF basis.
Specifically, exports of cocoa beans represented close to 60 percent of total production between 2006 and 2010 with the exception of 2006 and 2008. Data on export quantities are conflicted between sources (FAOSTAT, UNCOMTRADE and national sources) (Table 2). UNCOMTRADE and the Nigeria Custom Service reported very limited export amounts in 2006.
Table 2 : Cocoa beans trade flows, 2005-2010. 2005 2006 2007 2008 2009 2010
Production (tonnes) 441,000 485,000 360,570 367,020 363,610 399,200
Import Quantity (tonnes) 0 0 0 55 55 499
Export Quantity FAOSTAT (tonnes) 267,700 189,500 174,900 227,303 247,000 226,634
Export Quantity UNCOMTRADE (tonnes)
4,441
246,797
272,621
240,992
588,438
Export Quantity National (tonnes) 4,441
228,972
523,547
222,175
237,781
Export as a % of Production (National sources) 1% 64% 143% 61% 60%
Source: FAOSTAT, UNCOMTRADE, Nigeria Custom Service
9

Beans are also used for primary processing of other cocoa derivate products, such as shells, butter, paste, powder and chocolate, which are then also exported (Table 3). Cocoa Butter is the second most exported cocoa product in Nigeria, followed by shells.
Table 3 : Exports of different cocoa products in Nigeria (2006-2010, tonne).
COCOA BEANS
COCOA SHELLS
Exports (USD) Exports (MT) Exports
(USD) Exports
(MT)
2005 N/A N/A N/A N/A
2006 5,038,000 4,441 N/A N/A
2007 377,324,620 246,797 1,087,460 N/A
2008 510,312,088 272,621 9,425,741 6,851
2009 1,250,868,139 240,992 21,952,352 44,700
2010 1,048,003,766 588,438 38,739,754 23,331
COCOA PASTE COCOA BUTTER
Exports (USD) Exports (MT) Exports (USD)
Exports (MT)
2005 N/A N/A N/A N/A
2006 7,644,825 3,089 3,617,218 2,854
2007 23,301,098 9,363 67,880,991 17,270
2008 2,488,091 875 76,077,676 15,812
2009 1,146,042 575 152,455,192 37,856
2010 5,427,083 3,144 184,861,031 16,118
COCOA
POWDER CHOCOLATE
Exports (USD) Exports (MT) Exports (USD)
Exports (MT)
2005
N/A N/A N/A N/A
2006 45,618 280 1,324,429 849
2007 645,506 517 3,909,919 1,496
2008 1,493,331 1,090 1,455,048 N/A
2009 726,533 126 2,256,235 355
2010 430,888 60 5,548,053 415
Source: UNComtrade, 2012 – information on absolute quantities exported are not comprehensive (2005 is missing) and they do not match FAOSTAT information (reported in Table 2). However, UNComtrade was used to provide an estimate of the share of the different cocoa derived products exported by Nigeria, and to confirm Nigeria as a net exporter.
Nigeria is currently a net exporter of cocoa beans (FAOSTAT, 2012) (Figure 5). Net trade ranges between a minimum of 174,900 exported tonnes in 2009 to a maximum of 267,700 tonnes in 2005, with an average 221,259 tonnes of exported cocoa beans for the period 2005-2009.
10

Figure 5 : Net Trade, Cocoa Beans 2005-2009.
Source: FAOSTAT, 2012
Main trading partners importing cocoa beans from Nigeria are European Union Countries (Figure 6). Among all, The Netherlands hold the biggest share of quantity imported from Nigeria between 2005 and 2010, with an average of 30 percent of total quantity exported during those years. With 13 percent and 12 percent respectively of share Belgium and France follow the Netherlands, while the UK and USA both imported 5 percent of cocoa beans from Nigeria during the same timeframe.
Figure 6: Main cocoa beans trade partners by volume (tonnes), average 2005-2010.
Source : UNComtrade, 2012
Producer prices in Nigeria are determined by market conditions in both the internal and international cocoa markets (Traoré, 2009).
DESCRIPTION OF THE VALUE CHAIN AND PROCESSING About 30.000 farmers grow cocoa in the country and in general cocoa production in Nigeria is left to smallholders. The shortage in rural labour is a major constraint to production expansion as well as the relatively old workforce (Ogunleye and al., 2007). About 57% of the cocoa farming households in Ondo state are food insecure (Oxfam, 2012).
0
50,000
100,000
150,000
200,000
250,000
300,000
2005 2006 2007 2008 2009
Net Trade (X-M)
Belgium 13%
France 12%
Germany 18% Netherlands
30%
United Kingdom
5%
USA 5%
Other 17%
11

The size of cultivated area vary across states but an average cocoa farmer in Nigeria has a farm size of 2.5ha (Oguntade). On the whole, the average deliver per farmer is less than 5 bags per season (roughly 300Kg per hectare of cocoa) (Nwachukwu et al.,2010). Cocoa beans harvest is most intensive between December and June. The sector is not mechanized, and beans are normally harvested by hand. Seeds are fermented at ground level for a week, and then dried for three weeks. The product is then bagged and exported (WB, 2007).
While the majority of cocoa is exported as beans, first processing of other cocoa-derived products also takes place in Nigeria. Cocoa processing consists in the conversion of beans into cocoa butter and cocoa powder, two intermediary products and such conversion is operated by grinders (or converters). The quantity of butter obtained from the beans depends on the fat content of the beans, while powder is normally considered as a by-product of processing, as shells and paste. Butter and powder are subsequently recombined in different shares to obtain chocolate, with the addition mainly of milk and sugar. Cocoa powder is also used as a component in other confectionary products (Gilbert, 2006). Although Nigeria has the capacity to process locally some quantities of other cocoa-derived products, such as butter, the local product is often of a low quality, both when exported and/or sold locally.
In the export value chain, normally Local Area Agents (LAAs) or Local Buying Agents (LBAs) purchase cocoa beans at farm gate, and then cocoa merchants operate the grading, involving quality inspection by grading agents (Figure 7). The LBA could either be companies, individuals, or cooperative societies. Graded beans are then sold to exporters and/or local processors.(USDA, 2007).
12

Figure 7 : Cocoa beans supply chain in Nigeria.
Source: Oguntade
The orderly marketing of the cocoa almost stopped with the abolition of the Nigerian Cocoa Marketing Board (NCMB). A study conducted in Cross River State (3rd producing state) and more especially in the market of IKom and in peripheral rural markets shows that the markets are fully integrated and the speed of price transmission from the central market to the satellite or rural market is very high (Nkang and al., 2007). The city of Ikom in Cross River State is a popular central destination for movement of cocoa beans to other parts of the country for either industrial or domestic use or export.
The abolition of the commodity board also led to an increasing number of people buying and marketing cocoa which results in numerous channels for producers to market their production. The channel is chosen according criteria of time of payment, mode of payment, price of product, distance from farm, transportation costs, and grading of product (Nkang and al., 2007). A study conducted in the state of Osun (2nd producing state) shows that farmers prefer to sell their production to itinerant buyers because transports costs are high due to their poor infrastructure condition. Moreover, uncertainties are attached to grading of product since production can be rejected or the price reduced. As a result, producers prefer to not face this two consequences and sell production to intermediaries (Nkang and al., 2007).
13

The cocoa exporters can be either multinational converters or local companies managed by the converters. About 123 cocoa exporting firms are registered with Nigeria Export Promotion Council (NEPC) (Ajetombi, 2011) but few of them account for about 60% of cocoa exports, the cocoa export market being dominated by 3 export companies. These companies face challenges namely the unregulated market structure, taxation and levies imposed by Federal, State, Local governments and unions. The lack of infrastructure facilities and the inadequate trade information also hamper cocoa exports.
On the whole, the marketing channel between farmers and exporters include at least two middlemen : small traders and wholesalers. In some occasion, cocoa can be sold directly to exporters by farmer’s cooperatives.
The market prices are characterized by high volatility and an increasing divergence between prices received by cocoa producers and cocoa firms (Figure 8). During the post-liberalization period, transport costs, export handling costs and taxes increased and firms may have attempted to pass on the costs to farmers. A price transmission analysis conducted in 3 producing states in Nigeria reveals that cocoa market is potentially anti-competitive and especially the pricing behavior of the exporting cocoa firms (Ajetomobi, 2011).
Figure 8 : Cocoa price at farm gate level and at the exporting firms (agrotrader), 2000-2009 (Naira/ tonnes).
Source: Ajetomobi, 2011
POLICY DECISIONS AND MEASURES Subsequently to the relatively low agriculture expenditure in the post-structural adjustment period, different government initiatives lead to the revision of the National Agricultural Policy in 2005. The new policy initiatives include the Special Programme for Food Security (SPFS, 2001), the Fadama II
14

Programme (2003-2009) and the recapitalization of the Nigerian Agricultural, Cooperative and Rural Development Bank (NACRDB, 2004). The National Food Security Programme (NFSP) includes trade policies such as import substitution, marketing/price policies, and the promotion of modern agricultural practices. General agricultural policies build on the regional New Partnership for Africa's Development (NEPAD, 2001) and the Comprehensive Africa Agriculture Development Programme (CAADP, 2003). The overall thrust of Nigerian policy decisions and measures is to increase food production, commercialization, and develop the agribusiness sector. The National Investment Plan (NAIP, 2011-2014), includes cocoa among the commodities selected for special focus (along with cassava, millet, sorghum, wheat, maize, sugar, cow peas, soya beans, tomato cotton, rice, and oil palm).
According to the WTO Trade Policy Review, three main initiatives impact on the overall agricultural sector through current public expenditure: Fertilizer policy (procurement and distribution); the National Special Program for Food Security (NSPFS); and the buyer-of-last-resort grain purchase. They represent respectively 43, 22 and 26 percent of current spending in 2008. Of these three initiatives only the first has an impact on the cocoa sector, although comprehensive information on fertilizer expenditure specific to the cocoa sector is not available (WTO Review 2011).
The specific policy measures and initiatives below have an impact on the cocoa sector, and include a mixture of input and price support.
National Cocoa Development Programmes and the National Cocoa Development Committee (2000)
The National Cocoa Development Committee was inaugurated in 2000 to coordinate the Cocoa Development Programme in 14 producing states. The long term target of the programme was to achieve annual production level of one million metric by 2010 by facilitating the rehabilitation of 15.000 hectares of cocoa plantation annually. Improved/disease resistant varieties, assorted agro-chemicals and other inputs were thus distributed to encourage producers to replant with the aim to offset the effects of ageing cocoa plantations in the country. The specific objective include: improve cocoa farmer’s income and diversify the foreign exchange earnings by increasing the cocoa production.
Cross-commodity Input Support: Fertilizer Policy
Aside from cocoa-specific input support policies, there are initiatives that influence cocoa production, although their specific impact cannot be quantified. Both state and federal governments can provide fertilizer to farmers as input support. However, contribution varies consistently between one state to the other, and between one year to the other. The Federal Market Stabilization Programme (FMSP) allows companies to produce and import fertilizer and allocate it to state governments with a 25 percent subsidy. Additionally, state governments can further add to the subsidy. However, this arrangement led to abuse by the government official and contractors who hoard or divert the product (Onyeri, 2013). Hence, in spite of government’s annual investment, it was considered that fertilizer received only around 10 percent subsidy.
Moreover, the National Investment Plan (NAIP) sets a target of 30 percent increase of fertilizer use in the period 2010-2015, with an overall demand expected to grow from 2.6 to 3.4 tonnes by 2015. There are three main initiatives within the NAIP actively targeted towards the increase in fertilizer use: (1) the Organic Fertilizer Development Programme (OFDP) promotes the use of organic fertilizer
15

though a Public Private Partnership (PPP) approach; (2) the Fertilizer Quality Control (FQC) project aims at increasing the quality of fertilizer used and distributed; and (3) the National Foundation Seed Multiplication aims at releasing high quality foundation seeds to certified producers.
Regional Cocoa Initiatives
As for regional policies, during the Abuja meeting of regional cocoa policies, in 2006, main regional cocoa producing countries representatives decided to increase local consumption of cocoa in their respective countries, through national campaign of consumers’ sensibilization, and the development of alternative cocoa products. In the case of Nigeria, the Cocoa Research Institute has worked on the development of cocoa products including cocoa cream, liquor, bread, cakes and biscuits, together with the development of relative patent rights and resource mobilization to boost private investment in the sector and in the new products specifically. Up to 2007, the Cocoa Association of Nigeria (CAN), whose strategy draws heavily on increasing local cocoa consumption, was the only West African country member of the International Cocoa Organization (ICCO).
Presidential Transformation Agenda (2011)
The overall goal of the Agenda is to define agriculture as a business, promote private sector investment in agriculture along with the development of private sector driven marketing organizations and the promotion of Incentive-based Risk Sharing for Agricultural Lending (NIRSAL). Cocoa is among the commodities (together with cassava, sorghum, rice, and cotton) for which a country-wide commodity-specific transformation plan is envisaged, particularly in the Southern States. The specific goal of the cocoa transformation agenda is to rapidly increase Nigeria’s production of cocoa beans through a combined strategy of increased productivity and planting newer (and producing) trees. Particularly, the strategy envisages to expand existing cocoa plantations by 30 percent, a seeds multiplication program, and the establishment of new plantations through a Cocoa Development Fund. Additionally, the Transformation Agenda Development calls for tailored cocoa fertilizer blends to be used for rapid yield improvement, up to 600 kg per ha
Trade Policy measures
Nigerian trade policy has been partially implementing the Common External Tariff Regime (CET) in ECOWAS countries since 2005. Nigeria is currently applying the 35 percent tariff line on 167 tariff line items (none of these items has non-zero import value) (World Bank, 2010). The country’s average MFN (Most Favorite Nation) tariff stands at 12 percent, while the average import tariff for agricultural products is 16.5 percent. Building on its restrictive regional trade policy approach, Nigeria adopted a protectionist stand with its other international counterparts. The country rejected in 2008 an economic partnership agreement (EPA) with the European Union (ECOWAS Commission, 2008) (WB, 2010). Although the adoption of the CET shows the political will to adopt trade and investment reform to harmonize policies within the sub region, there is still resistance in embarking on further reform (USTR, 2009). The Federal Government of Nigeria prohibited the importation of a number of agricultural commodities in 2004, as an incentive to the development of local production, and items such as poultry and eggs are still facing import prohibition (Nigeria Customs, 2011). Nigeria declared no domestic support or export subsidies to the WTO Committee on Agriculture during the 1995-2009 periods (WTO 2011), with agriculture contributing an average of 40 percent to the national GDP (WTO Review, 2011).
16

Overall, exporting goods into Nigeria remains subject to multiple difficulties, such as frequent policy changes in tariffs, duties and procedures, along with often unclear and inconsistent interpretation of rules by the Nigerian Customs Service (NCS).
As for cocoa-specific trade policies, local processors of cocoa-derived products benefit of Export Processing Factory status policy, to support domestic industries. Such status exempts local processors from payment of all taxes and other levies imposed by federal, state and local governments. Also, the export tariff for cocoa beans, called Export Expansion Grant (EEG) was 5 percent in 2007, the export tariff for other processed cocoa products was 30 percent, although we don’t have comprehensive information on the export tariff for all the years under revision (USDA, 2007). According to a study on optimal export tariff levels for cocoa exporting countries in the region, ICCO established 5 percent to be the optimal export tariff for cocoa beans in Nigeria (ICCO 2007).
As for the import tariff on cocoa beans, according national custom tariff, it is set at 5 percent in all available years from 2008 to 2012. WITS database also indicate a 5% tariff in 2007.
Moreover, individual states impose taxes on cocoa leaving their territory. They inspect beans at state borders before bags are sealed in order to check the quantities and taxes depend on quantity shipped (Traoré, 2009).
17

3. DATA REQUIREMENTS, DESCRIPTION AND CALCULATION OF INDICATORS
In order to calculate the indicators necessary for estimating market incentives and disincentives (NRP, NRA) and the market development gap, data on prices and access costs are required. These have been collected and are presented and analyzed below.
The analysis will be based on prices of cocoa beans, since they are the most traded cocoa-derived commodities in Nigeria. Particularly, as shown in Figure 9, below, among exports of all cocoa-derived products, the share of exports of other cocoa products combined - shells, paste, butter, powder, chocolate– is considerably lesser when compared to exports of cocoa beans.
Figure 9 : Export of Cocoa beans and cocoa products 2006-2010 (tonnes).
Source: UNComtrade, 2012 – information on absolute quantities exported are not comprehensive (2005 is missing) and they do not match FAOSTAT information (reported in Table 2). However, UNComtrade was used to provide an estimate of the share of the different cocoa derived products exported by Nigeria, and to confirm Nigeria as a net exporter.
TRADE STATUS OF THE PRODUCTS Nigeria is a net exporter of cocoa beans for the whole period under review, between the years 2005 and 2010.
BENCHMARK PRICES Observed
MAFAP analysis normally considers CIF prices as benchmark prices when the commodity is mainly imported, and FOB prices when the commodity is mainly exported. In the case of cocoa in Nigeria, since the country is a net exporter, FOB prices were selected for the analysis.
0
100,000
200,000
300,000
400,000
500,000
600,000
700,000
2006 2007 2008 2009 2010
other cocoa products cocoa beans
18

Quantity and value of all type of exports are registered by the Nigeria Custom Service (NCS). Thus, exports cocoa beans, whole or broken, raw or roasted were reported per country destination and per year from 2006 to 2010.
Figure 10 : Export prices of cocoa beans in Nigeria, from 2006 to 2010 (Naira/tone). 2006 2007 2008 2009 2010 FOB prices (Naira/ tonnes) 109,009 235,864 292,072 772,451 457,939
FOB prices (US$ /tonnes) 1592 1952 2577 2889 3133
Source: NCS, 2012
Adjusted
No adjustments to the benchmark price have been made.
DOMESTIC PRICES Price at point of competition
There is no wholesale market for cocoa beans since a large part of the production is marketed through the LBAs, wholesale prices were not included in the analysis. As a result, the incentives and disincentives analysis at wholesale level was not conducted.
Farm Gate Prices
Farm gate prices are only available at national level and they are provided by the National Bureau of Statistics (NBS) for the years 2005-2010. Average prices at federal level were also collected by the Produce Departments of Ondo, Oyo and Ogun states’ ministries of Agriculture which are among the largest producer states. Prices at state level (Ondo, Oyo and Ogun States) were selected for the analysis owing to their accuracy and consistency with international trends.
Figure 11: National average farm fate prices for cocoa beans and regional average, Naira/tonne, 2005-2010.
Source: National Bureau of Statistics, 2012 and Ajetomobi, 2011
0
50000
100000
150000
200000
250000
300000
350000
400000
2005 2006 2007 2008 2009 2010
Average producer prices in Ondo, Oyo and Ogun States
Avergae producer price NBS
19

Table 4 : Average Farm Gate Prices collected in Ondo, Oyo and Ogun States, cocoa beans, Naira/tonne, 2005-2009.
2005 2006 2007 2008 2009 2010 Farm gate prices (Naira/tonnes) 182500 182083 179166 191250 230833 340416
Source: Ajetomobi, 2011
EXCHANGE RATES No exchange rate was used in this analysis because the border prices were already collected in local currency. Although there is a possibility that the exchange rate might be overvalued (WTO Trade review and IMF, 2011), more information would be required to adjust the exchange rate accordingly.
ACCESS COSTS Observed access costs from farm gate to the border
Access costs between farm gate and border were calculated on the basis of a study on agents’ margins along the cocoa value chain in Nigeria. Such study is not related to cocoa originated in any specific state, since no specific reference is made (Folayan 2007). This is particularly fitting, considering that the only information on farm gate available is on average terms rather than recorded at state level. The margins indicated in the study were applied in percentage terms to all years for which farm gate prices were available (2005-2010). Specific margins taken into consideration in the calculation of observed access costs are: Local Area Agent Profit and Exporters’ Profits, as shown in Table 5, below.
Table 5 : Observed Access Costs from Farm gate to Point of Competition, Naira/tonne. 2005 2006 2007 2007 2009 2010
Local Area Agent Profit (3% of farm gate) 54750 54625 53750 57375 69250
102125
Exporters’ Profit (7% of farm gate) 127750
127458.3
125416
133875
161583
238291
Total (?) Access Costs Farm Gate-Border 182500 182083
179166
191250
230833
340416
Source: own calculations, based on Folayan, 2007
Adjusted
No adjustment was made. Additional information on market inefficiencies would be required to calculate adjusted costs in future analysis.
EXTERNALITIES No specific externality is recorded.
BUDGET AND OTHER TRANSFERS Although input support (mainly fertilizer) policies are in place, we are not aware of their specific disaggregation and impact on the cocoa sector.
20

QUALITY AND QUANTITY ADJUSTMENTS No specific quality and quality adjustments required, based on available literature.
DATA OVERVIEW Following the discussions above here is a summary of the main sources and methodological decisions taken for the analysis of price incentives and disincentives for cocoa in Nigeria.
Table 6 : Summary table for data description in MAFAP technical notes. Description
Concept Observed Adjusted Benchmark price Nigeria Custom Services N.A. Domestic price at point of competition N.A N.A.
Domestic price at farm gate Average states prices (Ondo, Oyo and Ogun) N.A.
Exchange rate Annual average of exchange rate as reported by IMF N.A.
Access cost between border point of competition N.A.
N.A.
Access costs farm gate points of competition
Includes: Local Area Agent’s and Exporters’ margins up to 2009
N.A.
QT adjustment Bor-Wh N.A. N.A. Wh-FG N.A. N.A.
QL adjustment Bor-Wh N.A. N.A. Wh-FG N.A. N.A.
21
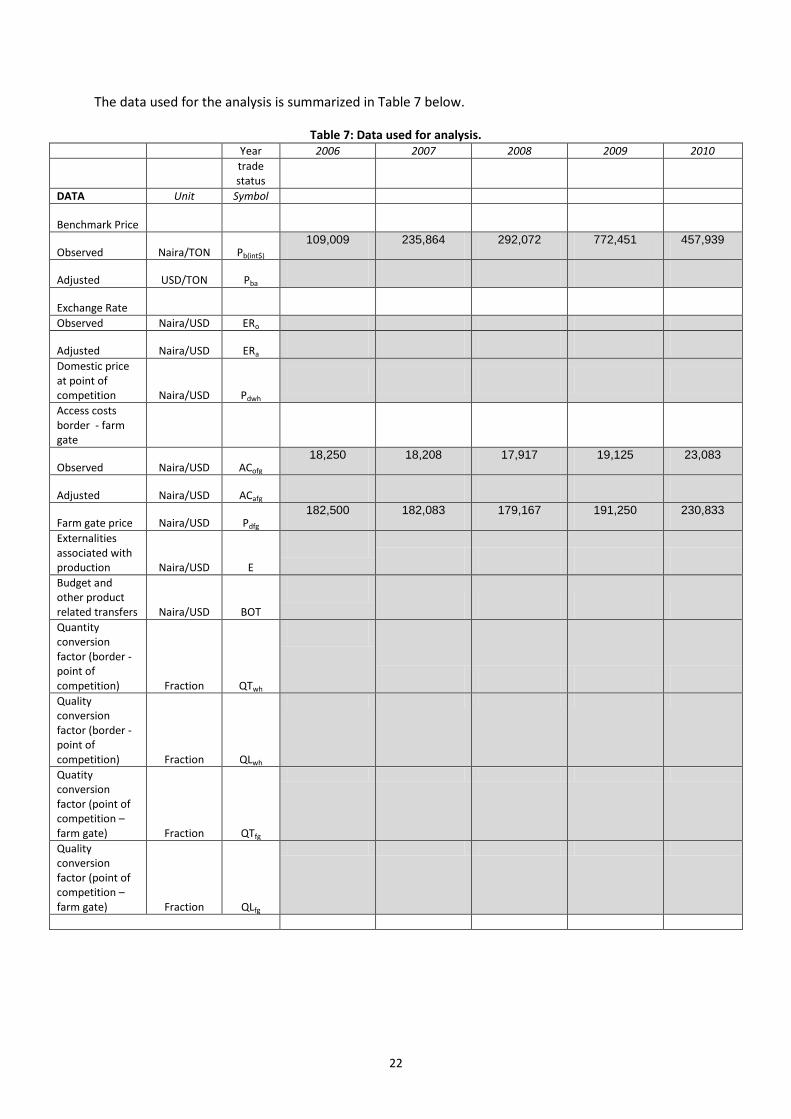
The data used for the analysis is summarized in Table 7 below.
Table 7: Data used for analysis. Year 2006 2007 2008 2009 2010
trade status
DATA Unit Symbol
Benchmark Price
Observed Naira/TON Pb(int$) 109,009 235,864 292,072 772,451 457,939
Adjusted USD/TON Pba
Exchange Rate
Observed Naira/USD ERo
Adjusted Naira/USD ERa
Domestic price at point of competition Naira/USD Pdwh
Access costs border - farm gate
Observed Naira/USD ACofg 18,250 18,208 17,917 19,125 23,083
Adjusted Naira/USD ACafg
Farm gate price Naira/USD Pdfg 182,500 182,083 179,167 191,250 230,833
Externalities associated with production Naira/USD E
Budget and other product related transfers Naira/USD BOT
Quantity conversion factor (border - point of competition) Fraction QTwh
Quality conversion factor (border - point of competition) Fraction QLwh
Quatity conversion factor (point of competition – farm gate) Fraction QTfg
Quality conversion factor (point of competition – farm gate) Fraction QLfg
22

CALCULATION OF INDICATORS The indicators and the calculation methodology used is described in Box 1. A detailed description of the calculations and data requirements is available on the MAFAP website or by clicking here.
Box 1: MAFAP POLICY INDICATORS
MAFAP analysis uses four measures of market price incentives or disincentives. First, are the two observed nominal rates of protection one each at the wholesale and farm level. These compare observed prices to reference prices free from domestic policy interventions.
Reference prices are calculated from a benchmark price such as an import or export price expressed in local currency and brought to the wholesale and farm levels with adjustments for quality, shrinkage and loss, and market access costs.
The Nominal Rates of Protection - observed (NRPo) is the price gap between the domestic market price and the reference price divided by the reference price at both the farm and wholesale levels:
𝑁𝑅𝑃𝑜𝑓𝑔 = (𝑃𝑓𝑔 − 𝑅𝑃𝑜𝑓𝑔) 𝑅𝑃𝑜𝑓𝑔; ⁄ 𝑁𝑅𝑃𝑜𝑤ℎ = (𝑃𝑤ℎ − 𝑅𝑃𝑜𝑤ℎ) 𝑅𝑃𝑜𝑤ℎ; ⁄
The NRPofg captures all trade and domestic policies, as well as other factors which impact on the incentive or disincentive for the farmer. The NRPowh helps identify where incentives and disincentives may be distributed in the commodity market chain.
Second are the Nominal Rates of Protection - adjusted (NRPa) in which the reference prices are adjusted to eliminate distortions found in developing country market supply chains. The equations to estimate the adjusted rates of protection, however, follow the same general pattern:
𝑁𝑅𝑃𝑎𝑓𝑔 = (𝑃𝑓𝑔 − 𝑅𝑃𝑎𝑓𝑔) 𝑅𝑃𝑎𝑓𝑔; ⁄ 𝑁𝑅𝑃𝑎𝑤ℎ = (𝑃𝑤ℎ − 𝑅𝑃𝑎𝑤ℎ) 𝑅𝑃𝑎𝑤ℎ; ⁄
MAFAP analyzes market development gaps caused by market power, exchange rate misalignments, and excessive domestic market costs which added to the NRPo generate the NRPa indicators. Comparison of the different rates of protection identifies where market development gaps can be found and reduced.
With the data described above we obtain the price gaps summarized in Table 8, and nominal rates of protection in Table 10, for the period 2006-2010.
Table 8 : MAFAP price gaps for cocoa in Nigeria 2005-2009 (Naira per Mt).
2006 2007 2008 2009 2010 Trade status for the year x x x x x
Observed price gap at farm gate 91,282 (38,780) (81,697) (518,534) (83,480)
Adjusted price gap at farm gate 91,282 (38,780) (81,697) (518,534) (83,480)
Source: Own calculations using data as described above
23

Table 9 : MAFAP nominal rates of protection (NRP) for Cocoa in Nigeria 2005-2009 (%). 2006 2007 2008 2009 2010 Trade status for the year x x x x x
Observed Nominal rate of protection at farm gate 101% -18% -30% -69% -20%
Adjusted Nominal rate of protection at farm gate 101% -18% -30% -69% -20%
Source: Own calculations using data as described above
24

4. INTERPRETATION OF THE INDICATORS Figure 12 and Figure 13 show the observed price gaps at production level, as well as observed nominal rates of protection. Based on these indicators, MAFAP methodology observes the price incentives and disincentives for producers, depending on national policies and domestic and international prices. The analysis covers the years 2006-2010 because the border prices for 2005 were not available.
Adjusted price gaps and adjusted nominal rates of protection (NRPs) were not calculated due to a lack of data capturing the market inefficiencies. Moreover, price gap and NRPs at point of competition were not analyzed because the access costs collected were not disaggregated and they corresponded to the segment producer- border.
Figure 12 : Observed price gaps at production levels (Naira), 2006-2010.
Source: authors’ calculations using data as described above
After receiving strong incentives in 2006, cocoa producers in Nigeria received increasing disincentives from 2007 to 2009. In 2010, producer prices moved closer to the international reference prices, disincentives decreasing. NRP indicators are greater than the export tariff on cocoa beans (5 percent), indicating that additional factors and externalities are playing a role in the creation of disincentives for farmers.
(600,000)
(500,000)
(400,000)
(300,000)
(200,000)
(100,000)
-
100,000
200,000
2006 2007 2008 2009 2010
25

Figure 13 : Observed nominal rates of protection at farm levels (%), 2006-2010.
Source: authors’ calculations using data as described above
A more in-depth analysis needs to be conducted to understand the shift between strong incentives in 2006 to disincentives in 2007 but some driving factors can already be identified from our analysis. Yields strongly decreased between 2006 and 2007 (Figure 2) because of disease incidence and pest attack and this could have led to lower quality of production and therefore lower producer prices (Figure 11). On the other hand, international prices were particularly low in 2006 compared to the following years (GEM Commodities- WB, 2012) and they strongly increased from 2007. As a result, lower producer prices and increasing international prices contributed to this prices gap. Moreover, there was an important shift in export quantity between 2006 and 2007, reported exports being particularly limited in 2006 which could indicate that a large part of production was stored this year. This could result in disconnection between local and international markets.
Consistent with international prices, border prices gradually increased from 2006 with a peak in 2009. When looking at the export company prices, we also note an increasing trend and a peak in 2009 (Figure 8). However, the comparison between company prices and farm gate prices (Figure 8) shows an increasing gap between the two trends. This gap is also reflected in the MAFAP analysis showing an increasing gap at farm gate level from 2007. This means that the growth of international prices was captured by the export firms but not by producers, average farm gate prices remaining unchanged from 2006 to 2009.
In 2010, s export prices strongly decreased compared to 2009 and producers prices slightly increased. Therefore producer prices were closer to international prices, disincentives decreasing this year.
The weak price transmission between producers and export firms can be explained by the lack of competition between export companies. Indeed, 3 companies market 60% of total cocoa exports. Thus, the concentrated market power could have prevented producers from receiving prices following international price trends. Moreover, a case-study presented above shows that farmers are
-80%
-60%
-40%
-20%
0%
20%
40%
60%
80%
100%
120%
2006 2007 2008 2009 2010
26

not used to market their production through cooperative which also prevents producers from having stronger market power. Moreover, it is more likely that producers also bear the costs of the local taxes (national, federal and local) along the value chain owing to the strong market power of export companies.
The large number of intermediaries between producers and export companies could also have led to disincentives for producers. This is especially true owing to the uncertainty of the producers regarding the grading activities. The lack of quality prevents producers from selling directly their production to local agents to not bear the cost of non-compliance of the production.
Since the analysis could not provide results at wholesale level, the repartition of disincentives cannot be assessed. However, a case study mentioned earlier in the technical note shows an efficient price transmission between peripheral markets in rural areas and major regional markets. This suggests that incentives are mainly captured by export firms.
Despite targeted policies to support cocoa, such as for example the National Cocoa Development Committee and other general supportive policies, producers received disincentives and the low incomes remain a major issue for the cocoa sector in Nigeria owing to the low yields, the shortage of rural labor force and the food insecurity situation experienced by a large amount of producers.
27

5. PRELIMINARY CONCLUSIONS AND RECOMMENDATIONS
MAIN MESSAGE Despite the policies in place to support the cocoa production, producers faced disincentives from 2007 to 2010.
The rising international cocoa prices was reflected in export prices which strongly increased while producers prices barely increased.
Price disincentives received by producers are explained by the poor price transmission between export market and production level. The high concentration of export companies results in strong market power in price fixation at the expense of producers. Moreover, it is more likely that producers bear the costs of taxes and additional inefficiencies instead of processors and export companies.
Since the market has been liberalized, numerous intermediaries are involved in the value chain which negatively affect prices received by producers. Moreover, the uncertainty of producers regarding the grading of production encourage them not to sell directly their production to the local agent increasing the number of intermediaries.
Aside from the policy and market environment, agricultural issues (low yields) might be contributory factors to growing disincentives in the Nigerian cocoa sector affecting the quality of production and thus prices.
PRELIMINARY RECOMMENDATIONS
Despite the availability of certain data, the MAFAP analysis suggests to:
Ensure a more balanced market power between producers, processors and export companies;
Improve the value chain organization and efficiency;
Revise the level of national, federal and local taxes and assess their impact on producers prices.
Increasing the cocoa bean productivity would also ensure a higher quality level of production and increase producer prices. Moreover, improving the value- added of production by increasing the process activities would be profitable for the whole sector.
LIMITATIONS Lack of information on:
• wholesale prices at state level for the period 2005-2010; • farm gate prices at state level for the years 2005-2010; • detailed information on the cocoa value chain in Nigeria, and how pathways vary at state
level as well as detailed access costs
28

• Comprehensive information on taxes along the value chain
FURTHER INVESTIGATION AND RESEARCH Considering the data gaps on prices at state level (farm gate and wholesale), and partial information on the value chain functioning and access costs, more accurate data could provide a better understanding of incentives and disincentives both at farm gate and wholesale level.
29

BIBLIOGRAPHY Ajetomonbi JO, 2007. Market power in Nigerian domestic market cocoa supply chains. Department of agricultural economics and extension. Ladoke Akintola University of Technology. Ogbomso, Nigeria.
Business Monitor International, Nigeria Agribusiness Report Q2 2012, March 6, 2012
CGI (Corporate Guides International) Corporate Nigeria: The Business, Trade, and Investment Guide 2010/2011, 2011
Christopher L. Gilbert, Panos Varangis, Globalization and International Commodity Trade with Specific Reference to the West African Cocoa Producers, April 2002, International Seminar on International Trade (ISIT)
Christopher Gilbert, Value Chain Analysis and Market Power in commodity processing with application to the cocoa and coffee sectors, Universitá degli Studi di Trento, Facoltá di Economia, 2006
Christopher L. Gilbert, Value chain analysis and market power in commodity processing with application to the cocoa and coffee sectors, in “Commodity Market Review, 2007-2008”, FAO 2008
Christopher L. Gilbert and Panos Varangis, Globalization and International Commodity Trade with Specific Reference to the West African Cocoa Producers, paper prepared for International Seminar on International Trade (ISIT), Stockholm, 24-25 May 2002 2002
Doussou Traoré Cocoa and Coffee Value Chains in West and Central Africa:, Constraints and Options for Revenue-Raising Diversification, FAO 2009
Esbern Friis-Hansen Agricultural Policy in Africa after Adjustment, CDR Policy Paper Centre for Development Research September 2000
Global Economic Monitor Commodities, World Bank, http://data.worldbank.org/data-catalog/commodity-price-data, 2013
Guido Porto, Nicolas Depetris Chauvin and Marcelo Olarreaga, Supply Chains in Export Agriculture, Competition, and Poverty in Sub-Saharan Africa, World Bank, 2011
Hans H. Bass, Structural Problems of West African Cocoa Exports and Options for Improvements, First published in: African Development Perspectives Yearbook, Volume 11, 2005/06: Escaping the Primary Commodities Dilemma, Münster: Lit-Verlag 2006, pp. 245-263.
Idowu, E. O., Osuntogun, D. A. and Oluwasola, O., Effects of market deregulation on cocoa (Theobroma cacao) production in Southwest Nigeria, African Journal of Agricultural Research Vol. 2 (9), pp. 429-434, September 2007
IFPRI, 2010. A 2006 Social Accounting Matrix of Nigeria: Methodology and results.
Irfan ul Haque UNCTAD G-24 Discussion Paper Series, Commodities under Neoliberalism: The Case of Cocoa, UNCTAD 2004
30

J. A. Folayan, A. E. Oguntade and K. Ogundari, Analysis of Profitability and Operational Efficiencies of Cocoa Marketing: Empirical Evidence from Nigeria, J. Soc. Sci., 15(2): 197-199 (2007)
Kehinde Ajao, Cocoa Development in Nigeria: the strategic role of (Past, Present, Future), 2010
K.Y. Ogunleye and J.O. Oladeji, Choice of Cocoa Market Channels among Cocoa Farmers in ILA Local Government Area of Osun State, Nigeria, Middle-East Journal of Scientific Research 2 (1): 14-20, 2007
Michael D. Wilcox, Jr. and Philip C. Abbott, Market Power and Structural Adjustment, The Case of West African Cocoa Market Liberalization, Selected Paper prepared for presentation at the American Agricultural Economics Association Annual Meeting, Denver, Colorado, August 1-4, 2004
Nkang M. Nkang, Henry M. Ndifon and gariel N. Odok Price Transmission and Integration of cocoa and Palm Oil Markets in Cross River State, Nigeria: Implications for Rural Development, Agricultural Journal 2(4), 457-463, 2007
Nwachukwu, Ifeanyi Ndubuto, Nnanna Agwu, Jude Nwaru and George Imonikhe, competitiviness and Determinants of Cocoa Export from Nigeria, 2010
Oguntade AE. Cocoa value chain in Nigeria- past and present. Dept of agricultural and resources Economics, Federal University of Technology, Akure.
Oxfam, The Cocoa Market, a background study, draft, 2002
Oxfam, Cocoa Case Studies, Behind the brand, 2012
31

ANNEX I: Methodology Used
A guide to the methodology used by MAFAP can be downloaded from the MAFAP website or by clicking here.
32

ANNEX II: Data and calculations used in the analysis
33