ANALYSIS OF HOSPITAL COSTS: A MANUAL FOR MANAGERS
85
ANALYSIS OF HOSPITAL COSTS: A MANUAL FOR MANAGERS by Donald S. Shepard, Ph.D. Dominic Hodgkin, Ph.D. Yvonne Anthony, Ph.D. September 29, 1998 Institute for Health Policy Heller School Brandeis University Waltham, MA 02254-9110 USA Telephone: 617-736-3975 Fax 617-716-3965 E-mail: [email protected] Prepared for the Health Systems Development Program World Health Organization Geneva, Switzerland
Transcript of ANALYSIS OF HOSPITAL COSTS: A MANUAL FOR MANAGERS

ANALYSIS OF HOSPITAL COSTS:A MANUAL FOR MANAGERS
by
Donald S. Shepard, Ph.D.
Dominic Hodgkin, Ph.D.
Yvonne Anthony, Ph.D.
September 29, 1998
Institute for Health PolicyHeller School
Brandeis UniversityWaltham, MA 02254-9110 USA
Telephone: 617-736-3975Fax 617-716-3965
E-mail: [email protected]
Prepared for theHealth Systems Development Program
World Health OrganizationGeneva, Switzerland

ii
Table of Contents
ACKNOWLEDGMENTS IV
CHAPTER 1: INTRODUCTION 5
1.1 Purpose of the Manual 5
1.2 Cost Finding and Analysis as Management Tools 5
CHAPTER 2: COMPUTATION OF UNIT COSTS USING LINE-ITEM EXPENDITUREDATA 7
2.1. Define the Final Product of the Cost Analysis 7
2.2. Define Cost Centers 10
2.3. Identify the Full Cost for Each Input 11
2.4 Assignment of Inputs to Cost Centers 18
2.5. Allocation of All Costs to Final Cost Centers 21
2.6. Computing Unit Cost for Each Cost Center 32
2.7. Reporting Results 33
CHAPTER 3: USING COST DATA TO IMPROVE MANAGEMENT OF ANINDIVIDUAL HOSPITAL 34
3.1 Introduction 34
3.2 Cost Center or Department Level 34
3.3 Hospital Level 40
3.4 Hospital Revenues 43
CHAPTER 4: USING COST DATA TO IMPROVE MANAGEMENT OF A HOSPITALSYSTEM 45
4.1 Introduction 45
4.2 Estimating Volumes in a Hospital System 45
4.3 Allocation of a Budget among Hospitals 51
4.4 Applications to Improve Hospital Efficiency 52
iii
4.5 Refining the Hospital’s Role in the Health System 55
REFERENCES 58
1. Methodology of cost analysis 58
2. Country studies 58
3. Other Studies 60
APPENDIX I: TABLES FOR COMPUTING UNIT COST AT 'HOSPITAL X' 62
APPENDIX II: STEP-DOWN ALLOCATION USING DIRECT COST 66
APPENDIX III: EXAMPLES OF STUDY SUMMARY SHEETS 69
APPENDIX IV. TABLE OF ANNUALIZATION FACTORS 73
APPENDIX V. EXERCISES 74

iv
ACKNOWLEDGMENTS
We are indebted to many people for their generosity in providing us time, advice, knowledgeand relevant background documents. We particularly thank Joseph Kutzin, the WHO official whocommissioned this work, who gave us copies or leads on numerous relevant studies and invaluablefeedback on an earlier draft. We also thank Andrew Creese, Guy Carrin and Claudio Politi, both fromWHO/CIO, for their helpful comments on an earlier draft. We are grateful to the authors of severalstudies referenced throughout the document for making their work available to us. Finally, we wish togratefully acknowledge financial support from the World Health Organization and contributors to itsspecial programs, namely the Danish International Development Agency (DANDIDA) and the U.S.Agency for International Development (USAID).
We benefited from field tests in Bangladesh and Zimbabwe coordinated by JamesKillingsworth and Tom Zigora and supported by WHO and the British Department of Finance forInternational Development.
5
CHAPTER 1: INTRODUCTION
1.1 Purpose of the ManualAccording to a major World Bank study of public hospitals (Barnum and Kutzin, 1993), the
share of public sector health resources in developing countries consumed by hospitals ranges from 50to 80 percent. This manual seeks to help managers make the best use of these resources. By betterunderstanding the costs of various activities, managers can improve the efficiency of various hospitaldepartments, as well as hospital systems as a whole. Finally, the data can help national policy makersdecide which curative care is best delivered in hospitals, and to examine the tradeoffs among variouspreventive, primary curative, and secondary curative services.
This manual is written for all officials involved with the management and funding of hospitals indeveloping and transitional economics. Thus, our target audience includes hospital managers (bothfinancial and programmatic), public sector managers at the district, regional and national levels of thehealth system, and persons responsible for non-profit and private hospital systems.
The type of information available for cost analysis varies substantially across countries andhospitals, from extensive to rudimentary. Hospitals vary in the extent to which costs are allocated tospecific hospital departments, and the accuracy with which such allocations are recorded. In light ofthis, we spell out alternative approaches wherever possible, and suggest what approaches can be takenwhen information is incomplete
This manual provides a framework for both deriving and analyzing hospital costs. Chapter 2shows how to compute unit costs. Since often times data may be incomplete, the chapter also showshow cost allocations among cost centers can be imputed from staffing data or approximated from otheravailable information. Complementary information from each department can be obtained frominterviewing hospital personnel (e.g., staff time, wages, allowances, supplies, space occupied, andactivities performed), or from extracting data from management information systems or medicalrecords (e.g., amounts of care provided). Chapters 3 and 4 apply knowledge gained from the previouschapters by discussing ways in which cost data can be utilized at the level of the individual hospital(chapter 3) or the hospital system (chapter 4). In many hospitals in developing countries, particularlysmaller ones, costs may not be reported at all by individual departments, or that reporting may be veryincomplete or arbitrary. Thus, chapter 4 shows how to compute unit costs when line item data arecompletely missing or not usable. Since managers of various units of the health system are concernedwith different parts of the health system, we expect that many readers will consult this manualselectively and concentrate only on the components that apply to them. The manual has been used inand benefited from workshops in Bangladesh and Harare. Appendix V contains case studies based onthose workshops. We found that the workshop manual proved a stimulating format for introducing thetopics in this manual, and encouraging managers to think more broadly about strengthening theirinstitutions. These case studies can be used to facilitate that process.
1.2 Cost Finding and Analysis as Management ToolsIn both developing and industrialized countries, hospitals are viewed as vital and necessary
community resources that should be managed for the benefit of the community (Institute for HealthPolicy Studies, 1996; World Health Organization 1987, 1992; Van Lerberghe and Lafort 1990). As

6
such, hospital management has a responsibility to the community--to provide health care services thatthe community needs, at an acceptable level of quality, and at the least possible cost. Cost finding andanalysis can help departmental managers, hospital administrators, and policymakers to determine howwell their institutions meet these public needs.
Cost finding and cost analysis are the technique of allocating direct and indirect costs asexplained in this manual. They are also the process of manipulating or rearranging the data orinformation in existing accounts in order to obtain the costs of services rendered by the hospital. Asfinancial management techniques, cost finding and analysis help to furnish the necessary data formaking more informed decisions concerning operations and infrastructure investments. If structuredaccurately, cost data can provide information on operational performance by cost center. Thisinformation can be compared to budgeted performance expectations in order to identify problem areasthat require immediate attention. These data give management the material to evaluate and modifyoperations if necessary. Moreover, knowledge of costs (both unit and total) can assists in planning forfuture budgets (as an indicator of efficiency) and to establish a schedule of charges for patient services. A hospital cannot set rates and charges which are realistically related to costs unless the cost findingsystem accurately allocates both direct and indirect costs to the appropriate cost center.
Finally, cost finding and analysis are also of value to management in ensuring that costs do notexceed available revenues and subsidies. It is the best available technique for accomplishing this.

7
CHAPTER 2: COMPUTATION OF UNIT COSTS USING LINE-ITEMEXPENDITURE DATA
Two fundamental items of financial data needed by a hospital manager are allocated costs bycost center (a program or department within a hospital) and the unit cost of hospital services. A unit ofhospital services may be as small as one meal, or as broad as an entire inpatient stay. This chapterexplains how to allocate costs by cost center and how to compute unit costs. To perform thesecalculations precisely, the hospital needs an accurate and comprehensive financial accounting system. In many hospitals, however, existing accounting systems have gaps, such as excluding some costs orlacking the data to relate the costs to specific cost centers. In these cases, estimates are needed. Thischapter provides a number of suggestions for generating such approximations. It is organized based onseven steps for computing unit costs, a framework built on the procedures of the UNICEF manual foranalysis of district health service costs and financing (Hanson and Gilson, 1996)1. The steps are:
1. Define the final product.
2. Define cost centers.
3. Identify the full cost for each input.
4. Assign inputs to cost centers.
5. Allocate all costs to final cost centers.
6. Compute total and unit cost for each final cost center.
7. Report results.
In leading the reader through this framework, we explain what data elements are needed, howdifferent cost items can be treated, and how costs can be computed in certain situations or cases. Ineach case, we discuss a set of problems that have been identified in various studies of specific countries(see Table 2.1).2 In addition, we work through examples of certain highlighted points (see Boxes 2.2to 2.5 and Tables A-1 through A-5).
2.1. Define the Final Product2.1. Define the Final Product of the Cost AnalysisWhat are the services or departments for which you are interested in computing unit costs?
For example, do you want to know the unit cost for all inpatient services, or a separate unit cost figurefor each ward or service? The decision will depend on two key questions:
1 The presentation of the steps in this manual differs slightly from the nine steps presented byHanson and Gilson for costing district hospitals, but the concepts and methodologies areconsistent with each other.2 The principal studies are listed in Table 2.1 in alphabetical order by country. Full citations areprovided in the references section of this manual. For a review of the findings of some of these studies,see Barnum and Kutzin (1993).

8
• Purpose of the Analysis3. If you want to do a comparison of costs of certain hospital departments,you will want to compute unit costs for each department separately. If you want to comparemultiple hospitals with similar caseloads (e.g., all district hospitals within a particular state orregion), it may be sufficient to compute a single unit cost for all inpatient care for each hospital.
• Type of Data Available. Your ability to compute unit costs will be constrained by how aggregate
or disaggregate the available data are for both costs and utilization. For example, in order tocompute unit costs by ward, you would need to have at minimum utilization data by ward (e.g.,actual total patient days for each ward for a particular budget year). If these data cannot be brokenout by ward, it will make more sense to compute unit costs at the next higher level (e.g. allinpatient wards or units that house internal medicine patients or surgery patients).
In some cases, it may be unclear whether to compute a separate unit cost for a certain activity,or allocate its costs to some other output. For example, some studies have computed separate unitcosts for lab and radiology departments, thereby excluding those costs from the cost per inpatient dayor discharge. Others have treated lab and radiology as intermediate outputs, and fully allocated theircosts to the inpatient cost centers. Again, the desirability of each approach depends on the purpose ofthe analysis, but it is important to be consistent. It may even be desirable to report results in both forms(as was done in the Lesotho study).
Units of Output. For each final cost center (see Section 2.2 for descriptions of types of costcenters), one must define the unit of output (e.g., inpatient day, admission, visit). For inpatient care,the usual choices are inpatient days or admissions. For outpatient care, number of visits is the unit ofoutput. A variety of other output units have been used for other cost centers. Examples include thenumber of tests or exams (for laboratory and x-ray departments), the number of operations (foroperating theaters), and the number of prescriptions (for pharmacy departments).
Data Period. One can analyze unit cost based on data for a single month, a quarter, or a year.The data period chosen will depend first upon how the available data are organized. Sometimesimportant data such as utility costs are only available on an annual basis, and to do a quarterly analysis,one would have to make assumptions about use patterns within the year. In such situations, it maymake more sense to analyze data for a whole year rather than for each quarter.
A second consideration in the choice of the data period is the purpose of the analysis. Ifmanagers are trying to understand a rapid recent change in costs, then quarterly or monthly analysismay be appropriate. However, if the aim is to compare a particular hospital's costs to other hospitals,or fees paid by patients treated at similar health care settings, it may make more sense to use a longertime-period. Using annual data may help to "equalize seasonal variations" since each hospital isaffected by these factors differently.
3See Chapter 4 for a fuller discussion of the purposes of unit costing.

9
Table 2.1 Selected Studies of Hospital CostsCountry Authors Title YearAlgeria Djelloul, Berrached Hôpital specialis’e en maladies infectieuses d'EI- no date
Kettar (Alger)Belize Raymond, Susan et al. Financing and costs of health services in Belize 1987Bhutan (I) Huff-Rousselle, Maggie Financial study of Thimphu General Hospital 1992Bhutan(II) Huff-Rousselle Maggie Dzongkhag costing study for Tashigang Dzongkhag 1992Bolivia Olave, Manuel and Zuhma Unit cost and financial analysis for the Hospital 12 1993
Montano de abril in BoliviaColombia Robertson, Robert et al. Hospital cost accounting and analysis: the case of 1977
CandelariaDominica Gill, Llewelyn Hospital costing study: Princess Margaret Hospital 1994Dominican Lewis et al. Measuring public hospital costs: empirical evidence 1995Republic from the Dominican RepublicEcuador LaForgia, Gerald and Cost recovery in public sector hospitals in Ecuador 1993
Mercy BalarezoEgypt(I) Zaman, Samir Cost analysis for hospital care 1993 Egypt(II) Salah, Hassan Cost Analysis for Hospital care: Summary Output 1996 Gambia Ministry of Health/WHO Cost analysis of the health care sector in the 1995
GambiaGuinea Carrin, Guy and Kodjo A methodology for the calculation of health care 1995
Evlo costs and their recoveryIndonesia RAND Corporation Unit cost analysis: a manual for facility 1992
administrators and policy makers Jamaica Kutzin, Joseph Jamaican Hospital restoration project: final report 1989Lesotho Puglisi, Robert and Functional expenditure analysis: final report for 1990
William J. Bicknell Queen Elizabeth 11 HospitalMalawi Mills, Ann The cost of the district hospital: a case study from 1991
MalawiMontserrat Gill, Llewellyn Hospital costing study: Glendon Hospital Montserat 1994
and Alison PercyNamibia Bamako Initiative Cost, resource use and financing of district health 1994
Management Unit servicesNiger Wong, Holly Cost analysis of Niamey Hospital 1989Papua John Snow, Inc. Papua New Guinea: health sector financing study 1990New Guinea projectRussia Teliukov, Alexander A guide to methodology: Integrated system of cost 1995
accounting and analysis for inpatient care providersRwanda Shepard, Donald S. Analysis and recommendations on health financing 1988
in RwandaSt. Lucia Russell, Sharon et al. Victoria Hospital 1988Sierra Ojo, K., et al. Cost analysis of health services in Sierra Leone 1995 LeoneTuvalu Wong, Holly Health financing in Tuvalu 1993Zimbabwe Bijlmakers, Leon and District health service costs, resource 1996
Simon Chihanga adequacy and efficiency: a comparisonof three districts
10
2.2. Define Cost Centers 2.2. Define Cost CentersThe next step for computing unit costs is to determine the centers of activity in the hospital to
which direct and/or indirect costs will be assigned. The major direct cost categories of mostdepartments include salaries, supplies, and other (purchased services such as dues, travel, and rents). Indirect cost categories include depreciation and allocated costs of other departments.
The rationale for choosing centers of activity that correspond with the hospital's organizationaland/or accounting structure is managerial. Hospitals are organized into departments and, since wewant to strengthen the management of these departments, it is useful to have cost centers thatcorrespond to the existing organizational structure of the hospital. This provides: (1) the road map bywhich costs can be routed, through the process of cost finding, to final cost centers; and (2) aframework for costing the distinct functions of each center. Following this road map shows individualmanagers how they are using available resources in relation to what has been budgeted and the servicesthat they are providing.
From an administrative standpoint, cost centers can be distinguished based on the nature oftheir work---patient care, intermediate clinical care and overhead centers. As explained below, somecosts centers represent patient-centered activities (i.e., final or intermediate cost centers), while othersare primarily for general services (i.e., overhead cost centers) such as housekeeping, laundry,maintenance, and the many other tasks necessary for the satisfactory operation of a complexorganization like a hospital.
Patient Care: These cost centers are responsible for direct patient services, for example, wardsor inpatient care units as a whole, or the ambulatory care center.
Intermediate: These cost centers provide ancillary services to support inpatient units but areorganized as separate departments. Examples include laboratory, pharmacy, and radiology.
Overhead: These cost centers provide overhead support services to both patient care andintermediate cost centers. Examples of departments are finance (accounts receivable, accountspayable, payroll, etc.), dietetics, and security.
Within each of the above groups, there are also decisions about how many cost centers todefine. For example, if you are planning to analyze unit costs by ward, then you would need to treateach ward as a separate cost center. Or, if you want to distinguish ancillary costs by (type (e.g., x-rayvs. clinical laboratory), then establish separate cost centers for each.
The aim of unit cost analysis is to allocate hospital costs (direct and indirect) to centers whosecosts are to be measured. Typically, you will be computing the unit cost mainly for patient care centers(e.g. maternity wards, outpatient clinics, or pediatric units). However, in some instances, you mayneed to know the cost per lab test or drug prescription, in which case unit costs are computed forintermediate departments such as laboratory and pharmacy. On occasion, you may even need to knowthe unit cost of an overhead service, like dietetics, if, for example, you are considering opening acompetitive bidding process to contract food services rather than keeping it in-house, or you wish tocompare the performance of dietetic departments across different hospitals.
In order to see the extent to which user charges (e.g., fees for room, board, and nursing [a dailyrate inclusive of diagnostic and therapeutic services], drugs and dressings, x-ray, laboratory, andphysical therapy) cover their associated costs, it may be necessary to have a cost analysis system thatidentifies (1) cost centers which produce revenue (i.e., patient care and intermediate cost centers) and

11
(2) general cost centers that do not produce revenue (e.g. security, housekeeping and payroll). Thisidentification is necessary when it is desirable to allocate all direct or indirect expenses incurred by thegeneral cost center (non-revenue-producing centers) to revenue-producing centers which could be thefinal cost centers.
Finally, one may eventually want to compute two types of unit costs: with or without allocatedancillary amounts. For example, if calculating the cost per admission or inpatient stay, one figure couldinclude laboratory and x-ray costs and one excluding them (see the Lesotho study by Puglisi andBicknell, 1990, for a discussion of both types of unit cost).
2.3. Identify the Full Cost for Each InputAn important part of computing unit costs is to make sure that you have cost data which
are as complete as possible. Two issues are involved: (1) the conceptual issue of determiningwhich expenditures should be counted as costs based on an economic sense of resources used upduring production of health care, and (2) the actual measurement of true costs using available data(which may be incomplete or untrustworthy). Various studies have developed ways to impute orapproximate cost when existing data are problematic, and we describe some of these. Since theproblems and responses often differ according to the line item, our discussion is partly organizedby line item (e.g. drugs and salaries).
Salaries: To calculate the full or total cost of salaries, one should ideally use actual salaryamounts paid to hospital employees. Sometimes these data may not be available such as in cases whereemployees are paid by the Ministry of Health and therefore the hospital cannot access this payroll data. However, as some studies have shown, individual salaries can be approximated by using the midpointof the salary range of the employee's classification level. In the Mills' study on hospitals in Malawi, themidpoint estimation approach appeared reasonable given that the estimated total wage costs wassimilar to the hospital's true wage costs. On the other hand, another study has shown that using themidpoint estimation approach may not accurately reflect true salaries. Researchers in Nigeria obtaineddata on the mean salary for each job classification across all hospitals and found it was consistentlylower than the midpoint often by as much as 30%. Reanalyzing their data, we determined that usingthe midpoint in this study would have overstated true payroll cost by around 35%.
In some hospitals, salary information on certain expatriate staff may be hard to obtain sincethey are paid by foreign donor agencies with salaries denominated in foreign currency. However, somestudies have costed these staff using local physician wages, arguing that, if the expatriate staff leave,they would be replaced by local physicians. The validity of this approach depends on the purpose ofthe costing analysis. If the aim is to project future budget/resource needs after the expatriates leave,then using local wage rates is appropriate. However, if the goal is to estimate current unit costs, localwages may understate the true cost of resources used depending on the currency rate and differentialsbetween expatriate and local wages. Thus, the rationale behind the costing analysis will drive whichmeasure is most appropriate.
In some cases, individuals may be employed and paid by more than one hospital. In each case,the proportion of their time spent in each hospital must be determined and applied accordingly. Forexample, if an employee spends four days working in your hospital and one day a week elsewhere, thenyou should be only paying 80% of his/her salary and the other facility paying the remaining 20%. Thesame rationale should be applied to fringe benefits.
12
Fringe Benefits: In principle, fringe benefits (e.g. health care insurance, vacation and sickpay, dental care, etc.) received by personnel as part of their employment should be included as part oftotal payroll costs. This is true whether these benefits are paid by the hospital and/or public sector fundsmanaged by the Ministry of Health. Examples of such benefits are "gratuities" to physicians (the St.Lucia study) and employees' share of hospital fees or revenues (the Niger study).
To obtain a full, accurate picture of personnel costs of a hospital, one may need to know notonly the cost of paid salaries and fringe benefits but, for planning purposes, may be interested in “in-kind costs” (like unpaid work time or volunteer time). In a hospital study in Colombia, Robertson andcolleagues measured unpaid work time along with fringe benefits and determined that both accountedfor 40% of true personnel costs (or 30% of total direct costs). They measured unpaid work time byusing outside observers to monitor staff activities and record time-study measurements for eachemployee. An example of unpaid work is time spent treating patients beyond normal clinic hoursbecause of physician or nursing inefficiencies, overbookings and/or missed appointments. By notincluding unpaid labor when determining levels of productivity or efficiency, program managers orplanners may make an erroneous conclusion.
Donated Items: Typically, when materials and equipment have been provided by foreigndonors, they will not appear in hospital spending records. However, since the hospital is using thesedonated items, they should be included in calculations of hospital unit cost. This is especially relevantfor regional or national level health authorities responsible for comparing the performance of differenthospitals. If the value of donated inputs is not included in the cost analysis, hospitals or wards withmore donated items may appear more efficient than their peers, even though their actual efficiency maybe the same. Such items can account for a substantial share of hospital resources. In a study in Niger,for example, donated drugs were 19% of total drug spending and donated food was 20% of total foodspending.
The treatment of donated capital items is discussed later. In this section we consider donatedrecurrent items, that is, those used up within the analysis period. Examples of these would bebandages, and syringes. The correct costing procedure is to prepare a list of these items and find outthe replacement cost of each (i.e., what it now would cost to purchase each).
It is worth explaining the reasons to cost donated items, since in some situations, they may notapply. First, donated items may have an “opportunity cost,” that is, one may want to consider howproductive they would be if transferred to a different ward or hospital than the one where theycurrently happen to be used. This issue is less relevant if the donation cannot be transferred (e.g. dueto restrictions imposed by the donor) and the ministry cannot reallocate funds toward hospitals whichreceive fewer donations (e.g. due to 'maintenance of effort' restrictions imposed by donors). Thesecond reason to cost donated items is that, at some point, donations may dry up or a long-liveddonated good may need replacing. The hospital needs to anticipate these possibilities. As mentionedpreviously, the third reason is to avoid penalizing hospitals which look inefficient compared to othersmerely because they receive fewer donations.
Ministry of Health Spending. In many countries, the Ministry of Health pays directly forsome resources used by hospitals, for example, stationery, vehicle maintenance and even salaries. Thisarrangement poses no special problem if the ministry keeps records on how funding was allocatedamong hospitals. When this is the case, you need only to add allocations to the appropriate expenditureline items.
13
However, sometimes the ministry cannot determine specific spending levels by hospital. In thiscase, you will need to estimate the allocated amounts by line item yourself, preferably in consultationwith officials at your hospital and the ministry. For example, in Tuvalu, most spending on the singlehospital came from the ministry's budget and was not distinguished from spending on other healthcenters. The study authors estimated the hospital's share for each line item after discussion with thoseinvolved. These discussions suggested that, for example, the hospital accounted for 100% of lab costs,90% of electricity, and 80% of medical supplies. These suggested percentages were applied to thenational expenditure data, and the resulting figures were assigned to the hospital.
Drugs. Sometimes spending data on drugs and other consumable medical supplies are notavailable from the hospital's own accounts or those of the central ministry. For example, in somecountries, drugs are purchased by a centralized government agency, which then supplies the drugs tohospitals without this appearing in the Ministry of Health or hospital budget. In such cases, it isnecessary to access the agency's records, and determine the value of drugs shipped to the hospital(s) ofinterest. Sometimes (as in the Papua New Guinea study) the central agency can provide a printout ofthe value of shipments. Othertimes, only quantities are reported, in which case the value of the drugscan be computed by obtaining the price paid for each drug item and multiplying this figure by therespective quantity.
If the agency recorded which departments within each hospital ordered or received the drugs,this information is important for later stages of the cost analysis, and should be included in any transferof data.
The large volume of drug data may make it impractical to analyze a full year experience. Insome studies, consultants analyzed a sample of pharmacy records rather than a full year of data. Infact, to estimate one year's use, the St. Lucia study used a two-month sample of pharmacy requisitionsfrom the Central Medical Stores. If this approach is taken, one should try to sample various points inthe year to account for seasonal variations in drug utilization.
As in the case of Mills’ Malawi study, the hospital pharmacy can have information on drugdeliveries to each ward but may not know the value or price of the drugs. If this is due to drugsbeing paid by a centralized government agency, then one can ask the agency the price it pays foreach of the drugs concerned and evaluate drug consumption using those prices.
Fuel. If actual records of spending on fuel are not available, it may be possible to estimatespending indirectly. Some hospitals keep logbooks for personnel to record vehicle mileage for alltrips. By estimating the number of miles-per-gallon performance, one can convert these mileagetotals into estimates of total petrol (gasoline) consumed over a given period. In turn, petrolspending can be estimated by valuing the petrol consumption at the local retail price per gallon orlitre.
Similarly, spending figures may be unavailable for generators and other hospitalequipment. As in the case of the WHO Gambia study, spending can be estimated usinginformation about how often the equipment is used, the rate at which it consumes fuel, and theprice per unit of fuel.
Maintenance. In some countries, personnel who maintain public hospitals are employedby the ministry of health rather than the individual hospital. Ignoring this practice might lead oneto understate the true cost of operating the hospital. As with other centrally supplied inputs (such

14
as drugs), the question is whether the central agency can report how much service it provided toeach hospital. If not, one must devise a rule to allocate some portion of the central maintenancebudget to each hospital being studied. The simplest way would be to assume that the hospital'sshare of maintenance costs is proportional to its area (square feet or metres). A more accurateapproach might then be to weigh older hospitals more heavily, assuming they need more intensivemaintenance.
Spending From User Fee Revenue. A common component of many cost recoveryprograms is to allow the hospital to retain a portion of fees charged for its discretion. Forexample, in the Jamaican hospitals studied by Kutzin, hospitals were allowed to keep 50% ofrevenues generated. Spending of retained revenues may be hard to measure especially if financialcontrols are poor. Yet, it is important to try, given the growing importance of this revenue sourcein many poor countries.
In some countries the amount of revenues retained (or costs recovered) is not well-documented. If this is the case, one can estimate retained revenues by applying the fee scheduleto available utilization data. For example, if the hospital charges 10 francs per outpatient visit and50 francs per inpatient day, and provided 1000 outpatient visits and 1000 inpatient days on amonthly basis, then the total fee revenue for that time period would be 60,000 francs ([10 x 1000]+ [50 x 1000]). If some patients received free care due to their inability to pay or incompletecollection, total cost recovery would be overstated if not taken into account.
Having estimated total cost recovery, one can determine how the money was spent by lineitem or cost center. Even if hospital records do not indicate uses of fee revenues, interviews withstaff may shed light on this question. For example, through staff interviews, Kutzin concludedthat the Jamaican hospitals were spending much of their revenue fees on “breakdown”maintenance.
A further complication exists in hospitals where staff are practicing 'unofficial' costrecovery without transmitting the proceeds to the hospital accounts. Ojo and colleaguesestimated these amounts to be substantial in the Sierra Leone hospitals which they studied. Evenif one can measure these amounts, their treatment depends on how one thinks they are being spentand the purpose of the analysis. If staff are spending the money to buy supplies, then these arecosts of the hospital and should be included in a cost analysis (if measurable). If the unofficialfees are being treated as private income by staff, and spent outside the hospital, then they shouldnot be included in a hospital cost analysis. On the other hand, the amounts collected may berelevant to a cost recovery analysis, as they indicate patients' willingness to pay which might bebetter tapped by the hospital itself.
Delayed Payments. As in conventional accounting analysis, cost measures may be misstatedwhen services are paid in a different accounting period from when they are used. The Jamaica study byKutzin found large fluctuations in utility payments which did not reflect real resource use even within afiscal year. This occurred because some hospitals were able to delay payment for months, then latermake large settlements. The study author corrected for this by using actual kilowatt-hours whenavailable, and otherwise using hospitals' budget requests for utilities. Without the correction, the samefacility would have shown variations over time in calculated unit cost which would be difficult toexplain.

15
Capital items. Capital assets are assets having an economic useful life exceeding one year andnot acquired primarily for resale. A unit cost analysis which ignores capital is essentially assuming thatthe present physical assets will be available forever. In reality, assets are being worn down by thehospital's daily activities, and this depreciation is an expense. Unlike drug purchases or salaries,depreciation is not an expenditure, it does not require an actual cost outlay. However, depreciationmay be hard to measure, if certain information is not available (such as purchase price and the usefullife of its equipment). If this is the case, then determining the depreciation expense becomes moresensitive to the analyst's assumptions.
For the present analysis, we are not necessarily trying to compute a “depreciationallowance,” or how much to save up for equipment replacement. Rather, the aim is to estimatethe opportunity cost of the capital being used up, in a way that is consistent across periods. Reflecting this, the methodology we present here differs somewhat from more accounting-basedapproaches with which you may be familiar.
If one decides to measure the cost of eventually replacing capital, then several questions mustbe answered for each asset (see Box 2.1 for an example calculation of annual capital costs):
1. What is the asset's total life?
A typical assumption for a building is a total life of 30 years. Other studies have assumed thatbeds and furniture last 10 years, and vehicles last five years. The assumption matters most for itemswith a large share of cost, for example, buildings, vehicles and major medical equipment.
2. What will be the cost of replacing it at the end of the year?
Financial accounts often calculate depreciation based on an asset's original purchase price('historic cost'). However, if there is inflation (as in most countries), historic cost will understate theamount required to replace a given asset. Replacement cost is the more relevant measure for thoseplanning resource use.
From this viewpoint, the original purchase cost is really only useful as a starting point forfiguring out the cost of replacing the asset. Of course, even the original cost may not be available, if itwas purchased by a donor or the ministry of health. Assuming some estimate of original cost is made,this must then be updated to this year and each future year in which replacement could occur. In otherwords, one must forecast the inflation which is likely to occur from now until the year of replacement. Estimates of local inflation are often available from governments or aid agencies for a number of yearsahead, but become increasingly unavailable (and unreliable) beyond five years.
If the replacement must be paid with foreign currency, one should also predict how the cost offoreign currency (i.e., the exchange rate) will change over the period in question. Sometimes exchangerate forecasts are available from the central bank, or otherwise one can extrapolate from recentexperience. In the Gambia study, the authors assumed an annual exchange rate deterioration of27%.
3. What interest rate should be applied to money saved now for future replacement?
Calculations of a 'capital cost' typically apply some kind of interest rate, based on the localreturn to a savings account. This is often justified by imagining that the hospital is saving up toreplace its equipment, and can deposit the savings in an interest-bearing account. This approach

16
has been criticized by Carrin and others, as unrealistic in many developing countries where publichospitals lack authority to save in this way.
The method we propose here continues to use the real (inflation free) interest rate, but wejustify it by imagining that the hospital could rent medical equipment instead of buying it. To findthe maximum rental payment the hospital should be willing to make, one would use this sameapproach (assuming perfect capital markets).
Box 2.1. provides an example of these calculations for two assets, one which can be purchasedwith local currency and one which must be imported.
Finally, given the uncertainty associated with measurements of capital costs, it may be advisableto present two sets of results, one including capital cost and one excluding it. This approach was takenby Ojo and colleagues in Sierra Leone. Their results show that including capital costs substantiallyincreases unit costs on inpatient wards (30 to 50%) but has little effect on unit costs of the operatingroom. This appears to be because the wards had more valuable equipment and, in most cases, morefloor space than the operating theatre.
In general, we suggest using a real interest rate of 3%. This rate has been found in manyindustrialized and developing economies. As this rate was used in a comprehensive set of costeffectiveness studies for the health sector (Jamison et al 1993) its use makes hospital costing consistentwith the international literature.

17
Box 2.1 Example of how to compute the annual capital cost
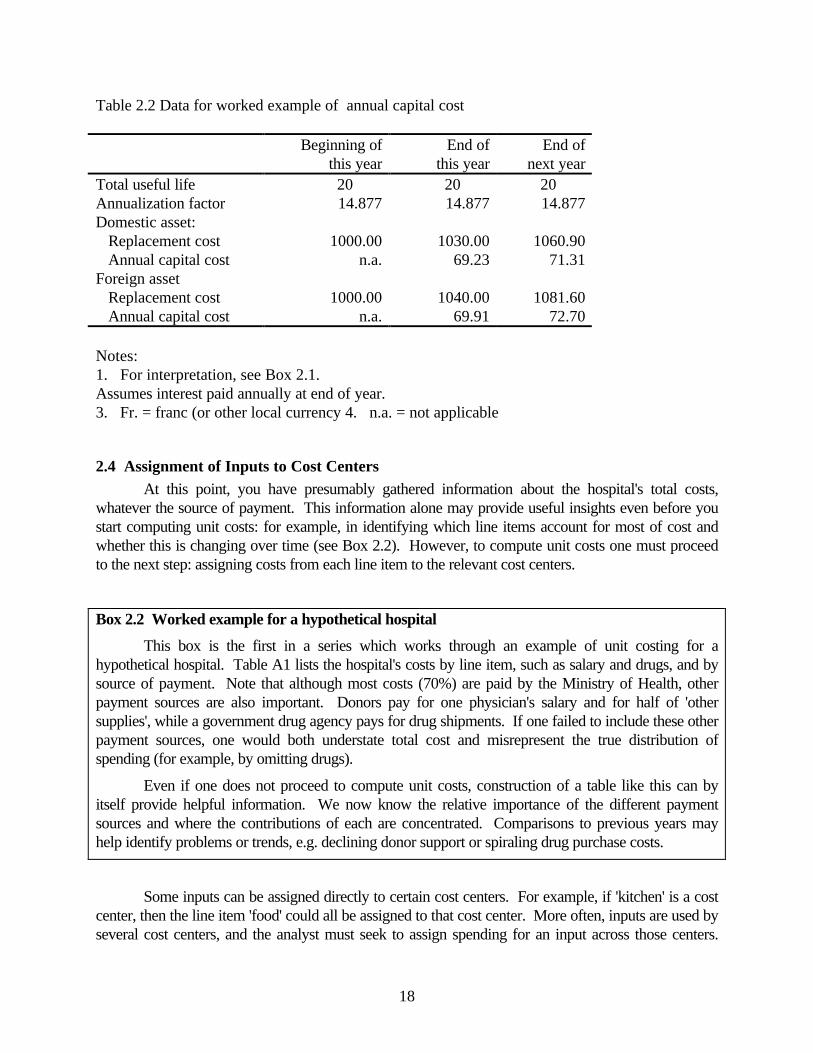
Table 2.2 provides data for this example of how to compute annual capital cost on two assets, oneavailable locally and one which must be imported. Each was purchased 10 years ago and has 10 years ofuseful life remaining. The answers to the standard questions are as follows:
1. Total life of the asset: 20 years.
2. Replacement cost: to replace each asset at today’s prices would cost 1,000 francs (the local currency). The price of locally produced items is increasing at 3% per year. However, the gradual devaluation of thelocal currency means that prices of imported goods rise at a faster rate, namely 4% per year.
3. Real interest rate: This depends on the nominal interest rate and the inflation rate. Therefore, in ourexample, the real interest rate differs for the two assets, as we show below.
Using these assumptions, the hospital can compute a reasonable measure of its annual capital cost usingthe following formula:
Capital cost in year k = Replacement cost in year k/annualization factor
The annualization factor is defined based on the real interest rate and the total life of the asset. Values areprovided in Appendix IV.
For the first asset, the real interest rate is computed as
(1 + nominal interest rate)real r = --------------------------- - 1
(1 + annual inflation)
= (1.06/1.03) – 1= .0291
So the real interest rate is 2.9%. We will round it to 3% for this example. Indeed a real interest rate of 3%has been applied to a range of countries.
In Appendix IV, we find the annualization factor for a 3% real interest rate and a life of twenty years. Theannualization factor is 14.877.
The replacement cost next year will be 1030 francs, since 3% inflation will have occurred. Dividing by theannualization factor, the capital cost for next year is therefore 69.23 francs. The following year's capital costis similarly computed as 71 francs (=1060.90/14.877). The capital cost therefore increases from year to yearat the rate of inflation. (Equivalently, capital cost computed in this way stays constant in real terms).
If you need to consider a discount rate or time period which is not provided in Table q, you can computethe annualization factor using the formula:
Factor = (1/r)*[1 - 1/(1+r)n]
where r is the real interest rate and n is the number of years of life.
So the capital cost this year is 69 francs, and this becomes part of the hospital's costs to be allocated acrosscost centers in a full step-down analysis.
For the second asset, the annual inflation is higher (4%). In the first year, replacement would cost 1040francs (1000*1.04), so the capital cost in that year is 69.90 francs (1040/14.877), and it increases insubsequent years at the rate of inflation in the foreign asset's price. Note: If you instead used the first asset’s original purchase cost of 744 francs and depreciated it over 20years on a straight-line basis, the annual depreciation for each asset would be 37 francs (i.e., 744 divided by20). This approach would understate the true opportunity cost of the capital being used up, since it ignoresinflation in the purchase price.
18
Table 2.2 Data for worked example of annual capital cost
Beginning ofthis year
End ofthis year
End ofnext year
Total useful life 20 20 20 Annualization factor 14.877 14.877 14.877Domestic asset: Replacement cost 1000.00 1030.00 1060.90 Annual capital cost n.a. 69.23 71.31Foreign asset Replacement cost 1000.00 1040.00 1081.60 Annual capital cost n.a. 69.91 72.70
Notes:1. For interpretation, see Box 2.1.Assumes interest paid annually at end of year.3. Fr. = franc (or other local currency 4. n.a. = not applicable
2.4 Assignment of Inputs to Cost CentersAt this point, you have presumably gathered information about the hospital's total costs,
whatever the source of payment. This information alone may provide useful insights even before youstart computing unit costs: for example, in identifying which line items account for most of cost andwhether this is changing over time (see Box 2.2). However, to compute unit costs one must proceedto the next step: assigning costs from each line item to the relevant cost centers.
Box 2.2 Worked example for a hypothetical hospital
This box is the first in a series which works through an example of unit costing for ahypothetical hospital. Table A1 lists the hospital's costs by line item, such as salary and drugs, and bysource of payment. Note that although most costs (70%) are paid by the Ministry of Health, otherpayment sources are also important. Donors pay for one physician's salary and for half of 'othersupplies', while a government drug agency pays for drug shipments. If one failed to include these otherpayment sources, one would both understate total cost and misrepresent the true distribution ofspending (for example, by omitting drugs).
Even if one does not proceed to compute unit costs, construction of a table like this can byitself provide helpful information. We now know the relative importance of the different paymentsources and where the contributions of each are concentrated. Comparisons to previous years mayhelp identify problems or trends, e.g. declining donor support or spiraling drug purchase costs.
Some inputs can be assigned directly to certain cost centers. For example, if 'kitchen' is a costcenter, then the line item 'food' could all be assigned to that cost center. More often, inputs are used byseveral cost centers, and the analyst must seek to assign spending for an input across those centers.

19
Correct assignment is most important for those inputs which account for a larger share of costs, suchas staff time and drugs. For an illustration, see Box 2.3.
Box 2.3 Cost assignment in the worked example
Table A2 takes the cost data for the hypothetical Hospital X (from Table A1), and showshow the line items can be assigned to cost centers. We are trying to obtain unit costs for the threewards: medical, surgical and maternity. We start with data on salaries, drugs and supplies whichmust be assigned to the wards and to the three intermediate cost centers: administration, cleaningand pharmacy. (Note that this simplified, hypothetical hospital does not even have a kitchen!)
The first column of Table A2 shows the total cost for each line item, includingcontributions from government, donors and elsewhere. The remaining columns show how thistotal cost is attributed to different cost centers. There are examples where an item is onlyassigned to one cost center (e.g. cleaner's wages and cleaning supplies to 'cleaning'). There areother examples where an item is attributed to several cost centers: for example, some staff workon more than one ward. Also, some drugs are shipped direct to wards while most are shipped tothe pharmacy.
From Table A2, we see that the three wards incur 44% of the total costs. More than halfof total costs cannot be directly linked to a specific final cost center, a proportion similar to whatis found in many real hospital studies. The indirect costs must now be allocated using accountingrules, a task which is taken up in Section 2.5 and Box 2.4 below.
Staff Time. A variety of methods have been used to assign staff time among cost centers,ranging from simple (using administrative data) to elaborate (direct measurement).
Administrative data. Many hospitals have duty rosters showing which staff are assigned towhich departments. Since many staff typically work in only one department, the roster can be used toallocate these staff. For the remainder who work in multiple departments, you can interview themindividually, which may be time-consuming if they are numerous. Alternatively, you could ask theirmanager how many hours they work in each department, and prorate their salary (and fringe benefits)accordingly.
Direct measurement. The Dominican Republic study by Lewis and colleagues used the mostcomprehensive approach to allocating staff time. They employed data collectors who followed medicalstaff over a period of weeks and recorded the time spent with each patient. This was supplemented byinterviews with patients. The study authors found that physicians only worked 12% of the time forwhich they were paid. This is an example of how the process of cost analysis can generate importantinformation, even without computing unit costs. The information they gained was that the hospital waspaying for labor it did not obtain.)
Comparison of approaches. The direct measurement approach has the advantage of givingdirect information about the sources of inefficiency, where other approaches merely identify to whichcost center expenditures should be assigned. The disadvantage of the direct-measurement approach isthe high cost of implementing it, at least in the way defined by Lewis and colleagues. Analysts maywant to consider a more limited implementation, perhaps in the second phase of a hospital cost study
20
after getting other systems working. The simplest method is to examine duty rosters for staff (ifavailable), and allocate their time and associated salaries and fringes accordingly.
Excluded Activities. At some hospitals, certain activities generate costs which need to beexcluded from the unit cost computation. There are several possible reasons for such exclusion:
Non-patient care. The prime example is teaching. Suppose you plan to compare unit costsbetween some hospitals which do a lot of teaching and others which do not. The teaching hospitalswill naturally appear to have higher costs, even if they provide patient care very efficiently. In thissituation, it is desirable to identify and exclude teaching costs to the extent possible. Some costs maybe identifiable using job rosters which identify how many hours were spent teaching. However,teaching and patient care often occur simultaneously. Robertson and colleagues developed anapproach to this in their Colombia study, which tracked physicians with time-and-motion methods. When care was being provided by a resident, the resident's time was charged to patient care while thesupervisor's time was charged to teaching. When the resident and physician-supervisor conferred afterseeing a patient, the time of both was charged to teaching.
Not under hospital control. Sometimes the central government operates some directlycontrolled programs on the hospital premises: for example, immunization campaigns. If theseprograms are not under the hospital's control, it would be unreasonable to include them in the hospital'sunit costs.
In both cases, the excluded activities should be treated as final cost centers, in the sense thatoverhead will be allocated to them, and they will not be reallocated to other centers. However, unitcosts will not be computed for them (unless you are interested and can identify outputs to measure).
Drugs. Drugs usually account for a substantial share of hospital resources, so it matters howtheir costs are treated in your analysis. If you are hoping to compute a unit cost per prescription, thenyou will definitely need to create a separate cost center for drugs (say, 'pharmacy'). If you are nottreating drugs as an 'output', then you can choose between two approaches:
• Create a separate 'pharmacy' cost center but allocate its costs to final cost centers during the step-down process
• Assign drug costs to the cost centers (intermediate and final) before the step-down process.
Each approach has different advantages. The first approach is simpler, in that pharmacy costswill eventually be allocated based on a single statistic (e.g., each ward's share of prescriptions written). The second approach has value if you have better information, and know you can do better thanallocating drugs based on a single statistic. For example, if you have data on the value of eachdepartment's actual drug purchases, you could assign the currency amounts to each department at thisstage. However, against this, there is a managerial issue: the pharmacy is usually a separate hospitaldepartment run by a manager or responsible person, who should be able to track (and account for) useof the resources provided. The pharmacy manager will be better able to manage resources if thepharmacy is treated as a separate cost center. In addition, identifying Pharmacy as a separate costcenter in all hospitals would help regional and national managers to monitor and compare the relativeperformance of pharmacy departments in different hospitals. Therefore, we would regard this as thepreferred option, barring exceptional circumstances.

21
2.5. Allocation of All Costs to Final Cost Centers The next step is to reallocate all indirect costs to the final cost centers. In this way, theunit cost will include overhead costs incurred in producing an admission, day or visit, not justdirect costs. Indirect costs will include all costs which could not be allocated directly to final costcenters at an earlier stage. In some hospitals, this will only comprise services such asadministration and laundry. In others, intermediate services such as pharmacy and radiology mayalso need allocating at this point, with little or no information about how much of their workloadwas generated by each of the medical departments. Allocation Basis. Where each department's use of an indirect cost center is unknown, onemust devise some rule to allocate the indirect costs across departments. The rule is called an 'allocationbasis', and is intended to reflect whatever factors determine each department's use of the indirect (i.e.,overhead, intermediate, or general) cost center. These factors may differ depending on the center. Forexample, most studies allocate laundry costs among wards based on the percentage distribution of totalpatient-days in each ward, since patients who stay longer use more laundry services. On the otherhand, cleaning services are often allocated according to each department's floor area, since morespacious departments cost more to clean. (Of course, this may involve measuring the floor area ofeach department if such information is not readily available from sources such as building plans).
Knowledge of your own hospital may lead you to devise an allocation basis which predictscosts accurately, even if it has not been used elsewhere. For example, Weaver et al., the authors of theNiger study, decided that the number of air-conditioning units would be a good predictor of water andelectricity costs, so they used that basis to allocate utility costs across wards (i.e., percentagedistribution of air-conditioning units). They also learned that patients in private wards received wereserved better food, so that it would be incorrect to allocate kitchen cost simply based on the number ofbed-days. Instead, they used a weighting scheme in which one day in a private room was equivalent toseveral days in the general ward. This example shows the importance of the judgment and creativitythat the person doing costing may bring from specific knowledge of the hospital or the local situation.
Table 2.3 presents a summary of the bases for allocating various types of overhead costs inprevious studies (in those cases where methods were described). For some services, a clear consensusis apparent, for example in the use of inpatient days to allocate laundry. For others, more variation isapparent, with four different methods being used to allocate maintenance. The large number of emptycells (denoted by dashes) results from the very different ways cost centers were defined across thesestudies (e.g. electricity and water appear separately in some studies, but are combined as 'utilities' inother studies).

22
Table 2.3 Bases used for allocating overhead cost centers to output centers: Overview of prior studies by cost center
Study Laun-
dry Kit.food
Maint
Dom-estic
Trans
Clean-ing
Admin
Utils
Water
Elec.
Phone
Fuel
Secur -ity
Algeria P P P P - - P - - - - - - Bhutan (I) - D - - A - PC - - - - - - Bhutan (II) - - F - A - P - - - - - - Dominica F D F F - - PC - - - - - F Dominican R. A D F - - F DC - - - - - - Ecuador A D/P P - - P P - - - - - - Egypt (II) A DC - DC - - - - - T - DC Gambia D D F - - - P - F F - - - Jamaica D D DC DC DC DC DC DC - - - - - Lesotho D PC PC - PC - PC - - - - - PC Malawi D D F F A - DC - - - - - - Montserrat - D F F - - PC - - - - - - Niger - - - - - - P - AC AC P P - Papua D D DC - - F DC - - - - - - Russia D D F - DC F P - - - - - - Sierra Leone D D F - - - DC - - - - - F St. Lucia D D F F - - DC - - - - - - Tuvalu NS NS NS NS NS NS PC NS NS NS P P NS KEY: A = estimated actual use P = personnel numbers AC = air conditioning units PC = personnel cost B = beds T = telephones D = days of care NS = not specified DC = direct cost = not identified as a separate cost center F = floor area Note: Some authors contributed more than one study.
Allocation Using Direct Cost. A more rough-and-ready approach is to allocate all indirectcosts based on a department's percentage share of direct costs. We discuss this approach in AppendixII, and would recommend it only when other data are not available for allocating direct costs.
Step-Down Sequence. The order in which centers are allocated may affect final results, andtherefore deserves some consideration. Step-down analysis basically assumes that resource flows are'one-way', and that one can therefore make use of this in choosing the step-down sequence. Table 2.4illustrates this by showing flows among overhead cost centers at our hypothetical hospital. The firstrow shows that the administration cost center serves all others, so it should be allocated first. The nexttwo rows show that the Cleaning cost center serves the Pharmacy, but does not receive drugs in return. The Cleaning cost center should therefore be allocated before the Pharmacy cost center. The order ofthe remaining rows does not matter since they will not be allocated (they are final output centers).

23
Table 2.4. Resource flows in a hypothetical hospital
Department receiving service Department providing service Administration Cleaning Kitchen Administration -------- X X Cleaning -------- X Kitchen -------- Note: X denotes flow of resources from 'provider' to 'recipient' department. It may help you to draw up a similar grid for overhead cost centers at your hospital. (Youneed not include the final cost centers since their costs will not be allocated anyway, but it may beuseful to include them anyway because this will help your to see clearly which are the ‘receiving’departments). Notice the shaded cells in Table 2.4, which have no X's in them. If you find theequivalent area on your grid has many X's, you should try to reduce the number of X's by swappingrows (i.e., changing the order in which you list the departments in the column and row headings). Thereason is that X's below the diagonal introduce inaccuracy into the step-down, because you would beforced to ignore some resource flows where the receiving center would have already had all its costsallocated. It is possible that even after swapping rows, some X's will remain below the diagonal of cellswith dashes in them. This is because in reality, most hospitals do have some two-way resource flows(for example, the administrative cost center does receive services from cleaning, when its offices arecleaned). This is an unavoidable source of inaccuracy in simple step-down analysis, but probably smallin magnitude and deserving of less attention compared to more basic issues of cost measurement. (Ifabsolutely necessary, techniques to handle two-way flows can be found in accounting texts such asBerman and Weeks, 1974). Table 2.5 presents the cost centers used in the Lesotho study, in reverse order. Allocationstarted with 'all other administration' (number 29) and finished with pharmacy (number 11).
Inpatient/outpatient split. In some studies, the authors choose this point to separate inpatientfrom outpatient costs at certain cost centers. For example, some make the assumption that it coststhree times as much to perform a surgical procedure on an inpatient basis, compared to outpatient. This allows them to allocate costs at the operating-theater cost center between inpatient and outpatient.
The intention of this practice is worthwhile: since inpatient and outpatient care are measured indifferent units (days vs. visits), they should be costed separately. However, we would argue that theinpatient/outpatient distinction should be made earlier in the step-down process, by defining inpatientand outpatient surgery as separate cost centers. This allows the analyst to use information about howspecific overhead items are used differently for inpatient versus outpatient care. For example,outpatients may generate very few costs for kitchen and laundry, but a disproportionately high share ofdrug costs. These differences should be tracked cost center by cost center, rather than using an across-the-board rule of thumb at the last stage. (Of course, the rule of thumb may be the only option if thereis no better information available).
24
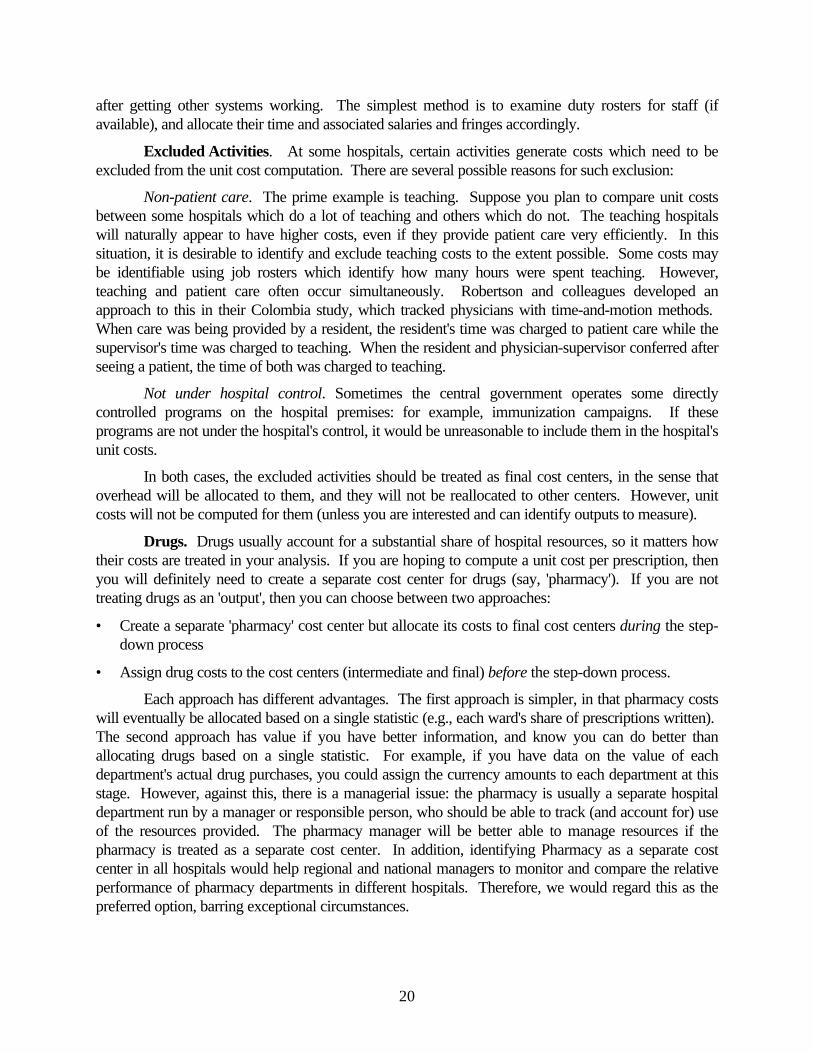
Table 2.5. List of cost centers in Lesotho study A. Direct patient care 1. Adult medical/surgical wards 2. Theater 3. Obstetric wards 4. Pediatric wards 5. Satellite clinics 6. Public health 7. Dental 8. Casualty 9. Clinics 10. Nursing B. Ancillary clinical services 11. Pharmacy 12. Laboratory and blood bank 13. Radiology 14. Physiotherapy 15. Orthopedic workshop C. Support services 16. Sterile supply 17. Maintenance 18. Security 19. Food service 20. Laundry 21. Portering 22. Transport 23. Mortuary D. Administration 24. Medical records 25. Accounts 26. Personnel 27. Stores 28. Registry 29. All other administration Source: Puglisi, Robert and Bicknell, William 1990. Functional Expenditure Analysis: Final Report forQueen Elizabeth II Hospital, Maseru, Lesotho. Health Policy Institute, Boston University: Boston,Massachusetts.
Allocation of Ancillary Services. The allocation of costs of ancillary services is an importantstep, as they represent a substantial proportion of hospital costs. For X-ray and lab, most analysts tryto estimate actual use. In the Papua New Guinea study, however, the number of admissions proved tobe a good approximation (John Snow Inc. 1990).
Estimation of actual use involves gathering data on each department's share of utilizationat the ancillary cost center, during a sample period. If one assumes that the sample period is

25
typical of the whole year, one can then apply the proportion from the sample to the full year'sdata. For example, if during the sample period, the surgical ward used 20% of total x-raysperformed by the radiology department, one can assume it also used 20% of the x-ray volumeperformed annually.
There are two main ways to obtain the sample data needed for this approach. One isretrospective: review of past records kept by the ancillary department, for one or several months. For example, the Papua study found that the local hospitals radiology and lab departments keptlogbooks for recording which departments had ordered each test. To avoid processing a wholeyear's logbooks, the authors sampled a 15-day period at each hospital and assumed that would berepresentative of the whole year.
Another way to obtain sample data is to ask staff at the ancillary cost center to trackutilization by department over a short period of time. This approach has been used in theDominican Republic (Lewis 1990, 1995) and Jamaica (Kutzin 1989). Typically, hospital staff inthe x-ray, physiotherapy and lab cost centers are surveyed about the source of patients seenduring one week (inpatient, outpatient etc.) and the number and type (e.g. basic/special) of examsperformed. The information is then used to allocate ancillary costs between inpatient andoutpatient care.
Finally, if no data can be obtained, interviews with staff may provide an approximate ideaof utilization patterns. For example, in Kutzin's Jamaica study, the national laboratory did notrecord its supplies to individual hospitals, but staff there were able to estimate rough shares foreach hospital.
One concern with these approaches arises if an ancillary department produces variousoutputs of differing value, and the some departments are more likely to use the higher-costoutputs. For example, suppose that the medical ward uses more complex lab tests than anobstetric ward. In this case, the medical ward's share of lab tests will understate its true share ofcost.
Various studies have dealt with this by assigning a 'relative value' to each type of test,before computing departments' shares of volume. In some cases, there may be information inlogbooks or ledgers about the relative value of different outputs. For example, some hospitals inFrancophone countries assign a 'B-value' to each ancillary test, indicating its relative complexity(on a scale from 4 to 80). This value has been used to adjust for relative costliness of tests instudies of Niger (Wong) and Algeria (Djelloul).
Table 2.6 provides a comparison of how frequently these various methods were used insome of the studies we reviewed. It may be noted that many studies used one basis to allocateancillary costs between inpatient and outpatient care, followed by a different basis to allocateinpatient costs among wards or departments.

26
Table 2.6. Bases used for allocating ancillary cost centers to output centers: Overview of prior studies by cost center
Study
Lab
Pharmacy
X-ray
Medicalrecords
Operatingtheater
Physio-therapy
Dominican R. - - - - - Ecuador N M N - - N Egypt (II) E/AD M AD - S N Gambia E/AD M E/AD AD A - Jamaica A/D D A/D AD S/A A/D Lesotho E/D E/D E/D D N E/D Malawi AD A M - S - Niger M A M - - - Papua A D A - S D Sierra Leone N N N A N N St. Lucia N A N AD N N Tuvalu M M M - - -
EY: A = estimated actual use from sample S = number of surgeries AD = admissions N = not allocated (final cost center D = days of care NS= not specified E = estimates by employees - = not identified as a separate cost center Note: Two-item cells (e.g. E/AD) denote 2-stage allocation, with first item (e.g. E) denotingbasis for allocating between inpatient and outpatient, and second item (e.g. AD) denoting basis forallocating among inpatient services.
Centers Not Allocated to Patient Care. Although the aim is to allocate most of the hospital'scosts to final output centers, some costs may not be relevant to production of admissions or days. Forexample, several studies computed the costs of teaching medical students or nurses, but did notallocate those costs to any of the final cost centers for patient care. The idea is that resources used forteaching were not 'necessary' for the production of medical care, so they should be excluded from itscost. However, exclusion of these costs is equivalent to creating a separate final cost center forteaching (or whatever the other excluded activities are). Eventually, you may want to find outputmeasures for these other final cost centers too, in order to know whether productive resources arebeing allocated reasonably - for example, between teaching and patient care.
Box 2.4 and Table A3 continue our worked example, by applying step-down cost analysis tothe hypothetical hospital analyzed in earlier boxes.
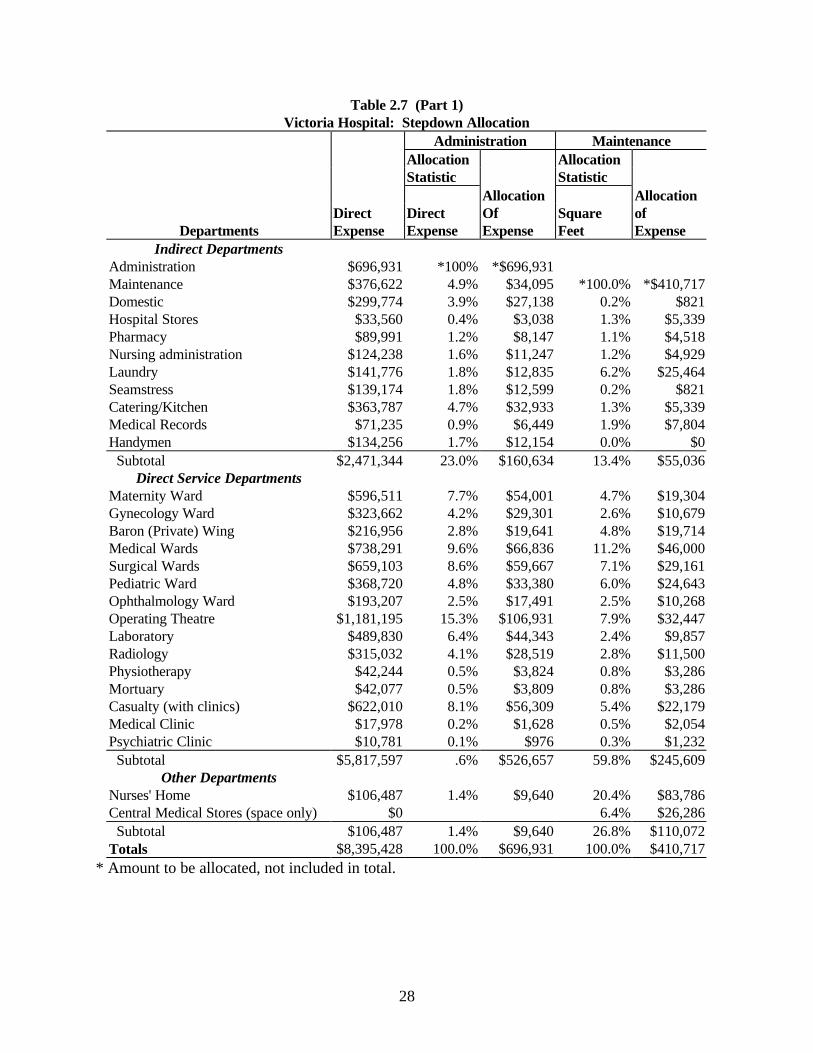
The stepdown for the hypothetical example is simpler than will be encountered in realapplications. We therefore also reproduce a real-life stepdown analysis from the St. Lucia study,as Tables 2.7 and 2.8. Amounts are in Eastern Caribbean dollars, when one US$1 equals 2.3Eastern Caribbean dollars (EC$). Table 2.8 presents the stepdown itself (slightly adapted fromthe original study), starting with direct cost figures for 11 indirect and 15 direct cost centers. (In
27
this study, the ancillary departments were not allocated, but treated as final cost centers.) Thesecond column shows each department's share of direct expense other than administration, andthose shares are used to allocate the Administration cost (EC$696,931) across the other costcenters. The remainder of the stepdown proceeds across subsequent pages until all indirect costcenters have been allocated. Table 2.8 then computes unit costs for the direct cost centers, usingservice units provided and the fully allocated cost from the stepdown.
This more realistic example yields several additional insights. First, if the stepdown isdone by hand, there is some possibility of rounding errors. For example, the exact share ofmaintenance in non-administrative direct cost is 4.89214% (computed as 376,622/(8,395,428-696,931)). Using this share, one would allocate $34,094.91 of the administrative cost tomaintenance. However, if one had rounded the share to 5%, the amount allocated to maintenancewould be $34,846.55. This latter figure is 2.2% higher than the earlier, more exact allocation. The error will then be carried forward to subsequent stages. To the extent possible, one shouldtherefore avoid rounding during the stepdown process.
Box 2.4 Cost allocation in the worked example
Table A3 shows a simplified step-down allocation for our hypothetical hospital X. The firstcolumn shows the direct cost for each of the six cost centers, which was obtained earlier, in Table A2. The first general cost center to be reallocated is administration, since it services all the other centers. The costs of administration are allocated to each of the other centers based on their share of theremaining direct cost (which is $72,000, after subtracting the direct cost of administration from totalcost). For example, the cleaning cost center accounts for 15% of this remaining cost, and is thereforeallocated 15% of $28,000, which is $4,728. When this $4,728 is combined with the $11,000 in directcosts at the cleaning cost center, this center now has costs of $15,278. The other cost centers are allassigned a share of the administrative cost, in the same fashion, proceeding down the same columns.
The next center to be reallocated is cleaning. The fifth column shows that $15,278 in costs areto be reallocated from cleaning. These costs are allocated to each remaining department in proportionto its floor space. Since the pharmacy occupies 10% of the hospital's floor space, it is allocated 10% of$15,278, which is $1,528. Note that no costs are allocated to administration, since it preceded cleaningin the step-down sequence.
The final reallocation is that of pharmacy. The only remaining cost centers are the three patientcare wards. Pharmacy costs are allocated based on each ward's share of the value of direct drugshipments (recalling that some drugs were shipped direct to the wards). The medical ward has thehighest proportion of such shipments and is assigned a correspondingly high share of the costs at thepharmacy cost center.
The final column of Table A3 depicts the total, fully allocated costs at each ward, at the end ofthe step-down process. Note that the total costs add up to $100,000: all the hospital's costs have beenattributed to the three wards. Costs are highest at the medical ward, which also had the highest totaldirect cost. In the next stage, we will see how the costs compare to utilization in each ward.
28
Table 2.7 (Part 1) Victoria Hospital: Stepdown Allocation
Administration Maintenance Allocation Allocation Statistic Statistic Allocation Allocation Direct Direct Of Square of
Departments Expense Expense Expense Feet Expense Indirect Departments
Administration $696,931 *100% *$696,931 Maintenance $376,622 4.9% $34,095 *100.0% *$410,717 Domestic $299,774 3.9% $27,138 0.2% $821 Hospital Stores $33,560 0.4% $3,038 1.3% $5,339 Pharmacy $89,991 1.2% $8,147 1.1% $4,518 Nursing administration $124,238 1.6% $11,247 1.2% $4,929 Laundry $141,776 1.8% $12,835 6.2% $25,464 Seamstress $139,174 1.8% $12,599 0.2% $821 Catering/Kitchen $363,787 4.7% $32,933 1.3% $5,339 Medical Records $71,235 0.9% $6,449 1.9% $7,804 Handymen $134,256 1.7% $12,154 0.0% $0 Subtotal $2,471,344 23.0% $160,634 13.4% $55,036
Direct Service Departments Maternity Ward $596,511 7.7% $54,001 4.7% $19,304 Gynecology Ward $323,662 4.2% $29,301 2.6% $10,679 Baron (Private) Wing $216,956 2.8% $19,641 4.8% $19,714 Medical Wards $738,291 9.6% $66,836 11.2% $46,000 Surgical Wards $659,103 8.6% $59,667 7.1% $29,161 Pediatric Ward $368,720 4.8% $33,380 6.0% $24,643 Ophthalmology Ward $193,207 2.5% $17,491 2.5% $10,268 Operating Theatre $1,181,195 15.3% $106,931 7.9% $32,447 Laboratory $489,830 6.4% $44,343 2.4% $9,857 Radiology $315,032 4.1% $28,519 2.8% $11,500 Physiotherapy $42,244 0.5% $3,824 0.8% $3,286 Mortuary $42,077 0.5% $3,809 0.8% $3,286 Casualty (with clinics) $622,010 8.1% $56,309 5.4% $22,179 Medical Clinic $17,978 0.2% $1,628 0.5% $2,054 Psychiatric Clinic $10,781 0.1% $976 0.3% $1,232 Subtotal $5,817,597 .6% $526,657 59.8% $245,609
Other Departments Nurses' Home $106,487 1.4% $9,640 20.4% $83,786 Central Medical Stores (space only) $0 6.4% $26,286 Subtotal $106,487 1.4% $9,640 26.8% $110,072 Totals $8,395,428 100.0% $696,931 100.0% $410,717
* Amount to be allocated, not included in total.

29
Table 2.7 (Part 2) Victoria Hospital: Stepdown Allocation Domestic Hospital Stores Pharmacy Allocation Allocation Allocation Statistic Statistic Statistic Allocation Allocation Allocation Square of Direct of Direct of
Departments Feet Expense Expense Expense Expense Expense Indirect Departments
Administration Maintenance Domestic *100.0% *$327,733 Hospital Stores 1.2% $3,933 *100.0% *$45,870 Pharmacy 1.1% $3,605 0.1% $46 *100.0% *$106,307 Nursing administration 1.3% $4,261 0.1% $46 Laundry 6.1% $19,992 5.2% $2,385 Seamstress 0.2% $655 9.3% $4,266 Catering/Kitchen 1.3% $4,261 22.8% $10,458 Medical Records 1.9% $6,227 0.4% $183 Handymen
13.1% $42,933 37.9% $17,385 0.0% $0 Direct Service Departments
Maternity Ward 4.7% $15,403 6.1% $2,798 16.0% $17,009 Gynecology Ward 2.7% $8,849 1.8% $826 10.9% $11,587 Baron (Private) Wing 4.8% $15,731 1.0% $459 4.0% $4,252 Medical Wards 11.3% $37,034 5.0% $2,294 18.2% $19,348 Surgical Wards 7.1% $23,269 4.3% $1,972 15.8% $16,796 Pediatric Ward 6.0% $19,664 1.6% $734 9.1% $9,674 Ophthalmology Ward 2.5% $8,193 1.0% $459 4.0% $4,252 Operating Theatre 7.9% $25,891 14.3% $6,559 8.9% $9,461 Laboratory 2.4% $7,866 10.8% $4,954 $0 Radiology 2.8% $9,177 10.9% $5,000 $0 Physiotherapy 0.8% $2,622 0.1% $46 $0 Mortuary 0.8% $2,622 0.1% $46 $0 Casualty (with clinics) 5.5% $18,025 0.9% $413 12.5% $13,288 Medical Clinic 0.5% $1,639 0.0% $0 0.5% $532 Psychiatric Clinic 0.3% $983 0.0% $0 0.1% $106
60.1% $196,968 57.9% $26,559 100.0% $106,307 Other Departments
Nurses' Home 20.4% $66,858 4.2% $1,927 0.0% $0 Central Medical Stores (space only) 6.4% $20,975 0.0% $0 0.0% $0
26.8% $87,833 4.2% $1,927 0.0% $0 Totals 100.0% $327,733 100.0% $45,870 100.0% $106,307
* Amount to be allocated, not included in total.

30
Table 2.7 (Part 3) Victoria Hospital: Stepdown Allocation Nursing Administration Laundry Seamstress Allocation Allocation Allocation Statistic Statistic Statistic Allocation Allocation Allocation Nursing of Patient of Nurse of
Departments Staff Expense Days Expense Staffing Expense Indirect Departments
Administration Maintenance Domestic Hospital Stores Pharmacy Nursing administration *100.0% *$144,720 Laundry *100.0% $202,452 Seamstress *100.0% *$157,516 Catering/Kitchen Medical Records Handymen
Direct Service Departments Maternity Ward 13.9% $20,116 17.2% $34,822 13.9% $21,895 Gynecology Ward 6.6% $9,552 11.0% $22,270 6.6% $10,396 Baron (Private) Wing 7.3% $10,565 5.5% $11,135 7.3% $11,499 Medical Wards 16.5% $23,879 24.9% $50,411 16.5% $25,990 Surgical Wards 16.8% $24,313 22.6% $45,754 16.8% $26,463 Pediatric Ward 10.2% $14,761 15.3% $30,975 10.2% $16,067 Ophthalmology Ward 6.6% $9,552 3.5% $7,086 6.6% $10,396 Operating Theatre 13.1% $18,958 $0 13.1% $20,635 Laboratory 0.0% $0 $0 0.0% $0 Radiology 0.0% $0 $0 0.0% $0 Physiotherapy 0.0% $0 $0 0.0% $0 Mortuary 0.0% $0 $0 0.0% $0 Casualty (with clinics) 8.7% $12,591 $0 8.7% $13,704 Medical Clinic 0.2% $289 $0 0.2% $315 Psychiatric Clinic 0.1% $145 $0 0.1% $158
100.0% $144,720 100.0% $202,452 100.0% $157,516 Other Departments
Nurses’ Home 0.0% $0 0.0% $0 0.0% $0 Central Medical Stores (space only) 0.0% $0 0.0% $0 0.0% $0
0.0% $0 0.0% $0 0.0% $0 Totals 100.0% $144,720 100.0% $202,452 100.0% $157,516
* Amount to be allocated, not included in total.

31
Table 2.7 (Part 4) Victoria Hospital: Stepdown Allocation
Catering/Kitchen Medical Records Handymen Allocation Allocation Allocation Statistic Statistic Statistic Allocation Allocation Allocation Total Nursing Of Patient of Nurse of (Allocated
Departments Staff Expense Days Expense Staffing Expense cost) Indirect Departments
Administration Maintenance Domestic Hospital Stores Pharmacy Nursing administration Laundry Seamstress Catering/Kitchen *100.0% *$416,778 Medical Records *100.0% *$91,898 Handymen *100.0% *$146,410
Direct Service Total cost Departments
Maternity Ward 17.2% $71,686 12.6% $11,579 17.2% $25,183 $890,306 Gynecology Ward 11.0% $45,846 4.7% $4,319 11.0% $16,105 $493,390 Baron (Private) Wing 5.5% $22,923 1.4% $1,287 5.5% $8,053 $342,213 Medical Wards 24.9% $103,778 5.5% $5,054 24.9% $36,456 $1,155,370 Surgical Wards 22.6% $94,192 6.6% $6,065 22.6% $33,089 $1,019,845 Pediatric Ward 15.3% $63,767 8.7% $7,995 15.3% $22,401 $612,781 Ophthalmology Ward 3.5% $14,587 1.4% $1,287 3.5% $5,124 $281,901 Operating Theatre $1,402,078 Laboratory $556,850 Radiology $369,228 Physiotherapy $52,022 Mortuary $51,840 Casualty (with clinics) 56.6% $52,014 $810,533 Medical Clinic 2.2% $2,022 $26,456 Psychiatric Clinic 0.3% $276 $14,657
100.0% $416,778 100.0% $91,898 100.0% $146,410 $8,079,470 Other Departments
Nurses' Home $268,697 Central Medical Stores $47,261 Subtotal $0 $0 0.00% $0 0.00% $0 $315,958 Total 100% $416,778 100.00% $91,898 100.00% $146,410 $8,395,428
* Amount to be allocated, not included in total.

32
Table 2.8 Unit cost calculation
Total Units of
Department cost service Units Unit cost
Maternity Ward $890,306 Day 9866 $90 Gynecology Ward $493,390 Day 6295 $78 Baron (Private) Wing $342,213 Day 3148 $109 Medical Wards $1,155,370 Day 14228 $81 Surgical Wards $1,019,845 Day 12946 $79 Pediatric Ward $612,781 Day 8745 $70 Ophthalmology Ward $281,901 Day 2009 $140 Operating Theatre $1,402,078 Operation 2642 $531 Laboratory $556,850 Test 60823 $9 Radiology $369,228 X-Ray 8964 $41 Physiotherapy $52,022 Treatment 5561 $9
Casualty (with clinics) $810,533 Visit 34052 $24 Medical Clinic $26,456 Visit 1327 $20
Source: Russell et al., 1988. (Slightly modified).
2.6. Computing Unit Cost for Each Cost Center At this point you know the total costs that were incurred at each of the final cost centers. What is the output of each center, in days, discharges, lab tests etc.? This requires incorporatingutilization data into the analysis.
In reality, you will have used the utilization data already by this point, for example in order toallocate laundry costs across wards in proportion to bed-days. However, this is the point at which anyproblems with the utilization data become particularly important, because they directly alter the unitcosts.
Several studies encountered problems with utilization data. In some cases, the number ofadmissions seemed accurate, but admission and discharge dates had not been carefully recorded,causing measurement of bed-days to be inaccurate. Correct measurement of bed-days requires thatstaff count how many beds are occupied in every ward, every 24 hours at the same time of day. Theauthors of the Lesotho study recommend that this should be done at midnight. A recent report on aZambian hospital gives details on one way to conduct a bed census (Buve and Foster,1995).
Once you have obtained the utilization data, the unit cost can be computed. For each of thefinal cost centers, divide its fully allocated cost (from step 5) by its units of service (see Box 2.5).
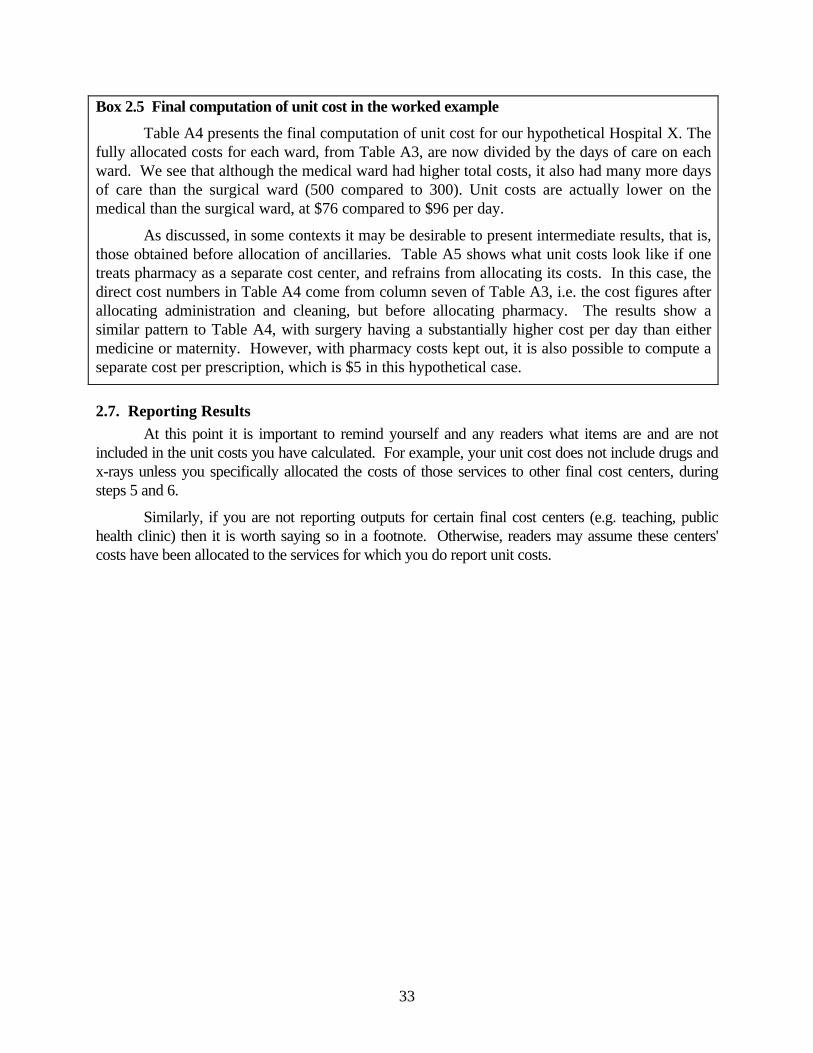
33
Box 2.5 Final computation of unit cost in the worked example
Table A4 presents the final computation of unit cost for our hypothetical Hospital X. Thefully allocated costs for each ward, from Table A3, are now divided by the days of care on eachward. We see that although the medical ward had higher total costs, it also had many more daysof care than the surgical ward (500 compared to 300). Unit costs are actually lower on themedical than the surgical ward, at $76 compared to $96 per day.
As discussed, in some contexts it may be desirable to present intermediate results, that is,those obtained before allocation of ancillaries. Table A5 shows what unit costs look like if onetreats pharmacy as a separate cost center, and refrains from allocating its costs. In this case, thedirect cost numbers in Table A4 come from column seven of Table A3, i.e. the cost figures afterallocating administration and cleaning, but before allocating pharmacy. The results show asimilar pattern to Table A4, with surgery having a substantially higher cost per day than eithermedicine or maternity. However, with pharmacy costs kept out, it is also possible to compute aseparate cost per prescription, which is $5 in this hypothetical case.
2.7. Reporting Results At this point it is important to remind yourself and any readers what items are and are notincluded in the unit costs you have calculated. For example, your unit cost does not include drugs andx-rays unless you specifically allocated the costs of those services to other final cost centers, duringsteps 5 and 6.
Similarly, if you are not reporting outputs for certain final cost centers (e.g. teaching, publichealth clinic) then it is worth saying so in a footnote. Otherwise, readers may assume these centers'costs have been allocated to the services for which you do report unit costs.

34
CHAPTER 3: USING COST DATA TO IMPROVE MANAGEMENT OFAN INDIVIDUAL HOSPITAL
3.1 Introduction This chapter discusses uses of cost data within a hospital; it therefore aims to showprogram managers and hospital administrators how costing can help improve their performance. This chapter is structured around two levels of decision-making:
Cost center level: Cost center and/or department management
Hospital level: Financial and hospital management
At each level of decision-making, uses of cost data will be drawn from seven categories oftasks: (1) budgeting, (2) variance assessment, (3) profitability, (4) efficiency improvement (bothallocative and technical efficiency), that is, identifying areas of waste that can be corrected, pricingpolicy, and other health financing and policy concerns (e.g., insurance, contracting services vs. in-house services, and projecting future costs), (5) expansion or contraction of services, (6)contracting outside services or producing in-house, and (7) enhancing cost-effectiveness ofprograms and hospitals at the national level (e.g. comparing alternative approaches such asambulatory vs. inpatient surgery to controlling a given medical condition).
The first section of this chapter discusses the various uses of cost data at the cost centerlevel which tend to be in the areas of budgeting, variance assessment, profitability, efficiency(allocative and technical), expansion or contraction of services, and contracting outsidevendors/providers versus using in-house staff in service provision. Examples in this section willfocus on analysis of cost variance at the department level as well as the usefulness of cost analysiswhen considering whether to purchase contractual services or use in-house staff.
The second section applies cost analysis at the hospital level for budget development andmonitoring, determining profitability status, pricing services, and identifying waste and technicalinefficiencies in the hospital. Other issues facing managers of large tertiary hospitals as well assmaller district hospitals will also be discussed. Examples in this section will focus on issues ofprofitability and budgeting.
3.2 Cost Center or Department Level By creating cost centers, assigning costs to them, and allocating them to final patientservice departments, the hospital director and/or financial officer learn the quantity of resourcesused to produce each hospital service. Departmental directors and/or cost center managers alsolearn the amount of resources they are responsible for managing. There are other benefits tohaving this information: improved management, more financial accountability amongdepartmental managers, and benchmarks developed for measuring departmental performance overtime (e.g., number of meals served, cost of a radiological exam, total personnel cost of eye care,etc.). Perhaps the foremost reason for examining levels and determinants of costs is that itprovides useful insight into the relative efficiency of hospital operations.
At the cost center/department level, the major uses of cost analysis are the calculation ofcost variances and unit costs as measures of efficiency. Cost variances, which are differences of
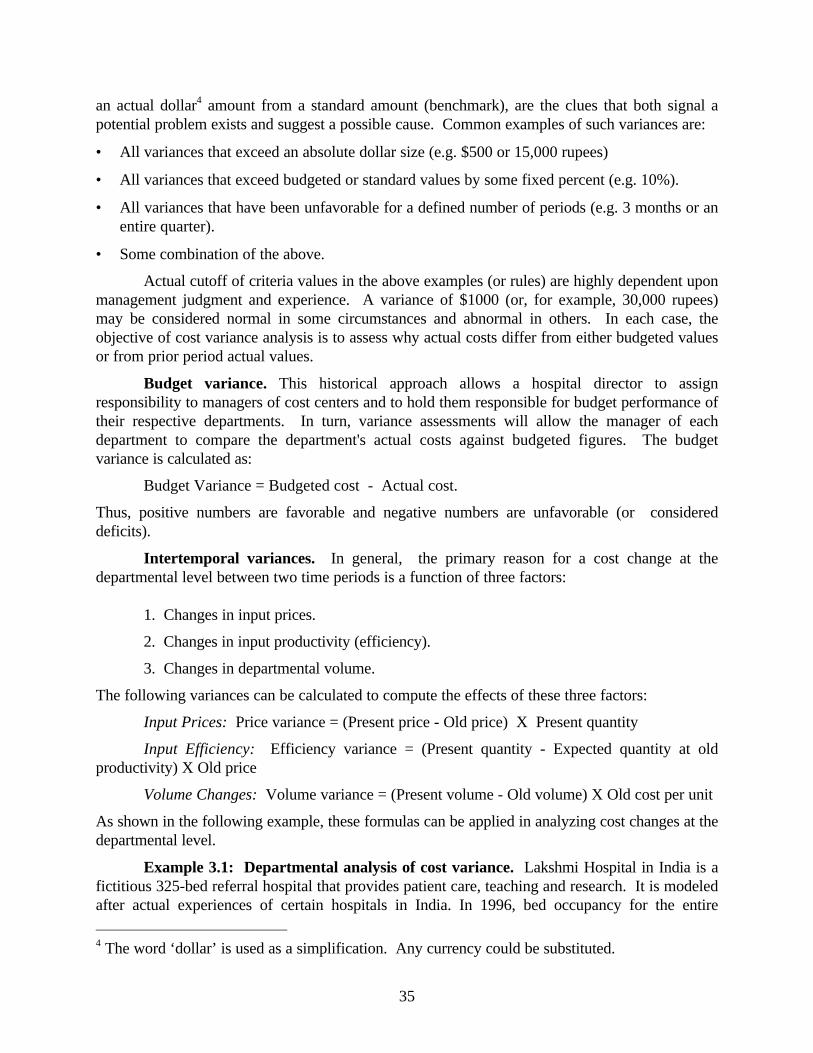
35
an actual dollar4 amount from a standard amount (benchmark), are the clues that both signal apotential problem exists and suggest a possible cause. Common examples of such variances are:
• All variances that exceed an absolute dollar size (e.g. $500 or 15,000 rupees)
• All variances that exceed budgeted or standard values by some fixed percent (e.g. 10%).
• All variances that have been unfavorable for a defined number of periods (e.g. 3 months or anentire quarter).
• Some combination of the above.
Actual cutoff of criteria values in the above examples (or rules) are highly dependent uponmanagement judgment and experience. A variance of $1000 (or, for example, 30,000 rupees)may be considered normal in some circumstances and abnormal in others. In each case, theobjective of cost variance analysis is to assess why actual costs differ from either budgeted valuesor from prior period actual values.
Budget variance. This historical approach allows a hospital director to assignresponsibility to managers of cost centers and to hold them responsible for budget performance oftheir respective departments. In turn, variance assessments will allow the manager of eachdepartment to compare the department's actual costs against budgeted figures. The budgetvariance is calculated as:
Budget Variance = Budgeted cost - Actual cost.
Thus, positive numbers are favorable and negative numbers are unfavorable (or considereddeficits).
Intertemporal variances. In general, the primary reason for a cost change at thedepartmental level between two time periods is a function of three factors:
1. Changes in input prices.
2. Changes in input productivity (efficiency).
3. Changes in departmental volume.
The following variances can be calculated to compute the effects of these three factors:
Input Prices: Price variance = (Present price - Old price) X Present quantity
Input Efficiency: Efficiency variance = (Present quantity - Expected quantity at oldproductivity) X Old price
Volume Changes: Volume variance = (Present volume - Old volume) X Old cost per unit
As shown in the following example, these formulas can be applied in analyzing cost changes at thedepartmental level.
Example 3.1: Departmental analysis of cost variance. Lakshmi Hospital in India is afictitious 325-bed referral hospital that provides patient care, teaching and research. It is modeledafter actual experiences of certain hospitals in India. In 1996, bed occupancy for the entire
4 The word ‘dollar’ is used as a simplification. Any currency could be substituted.
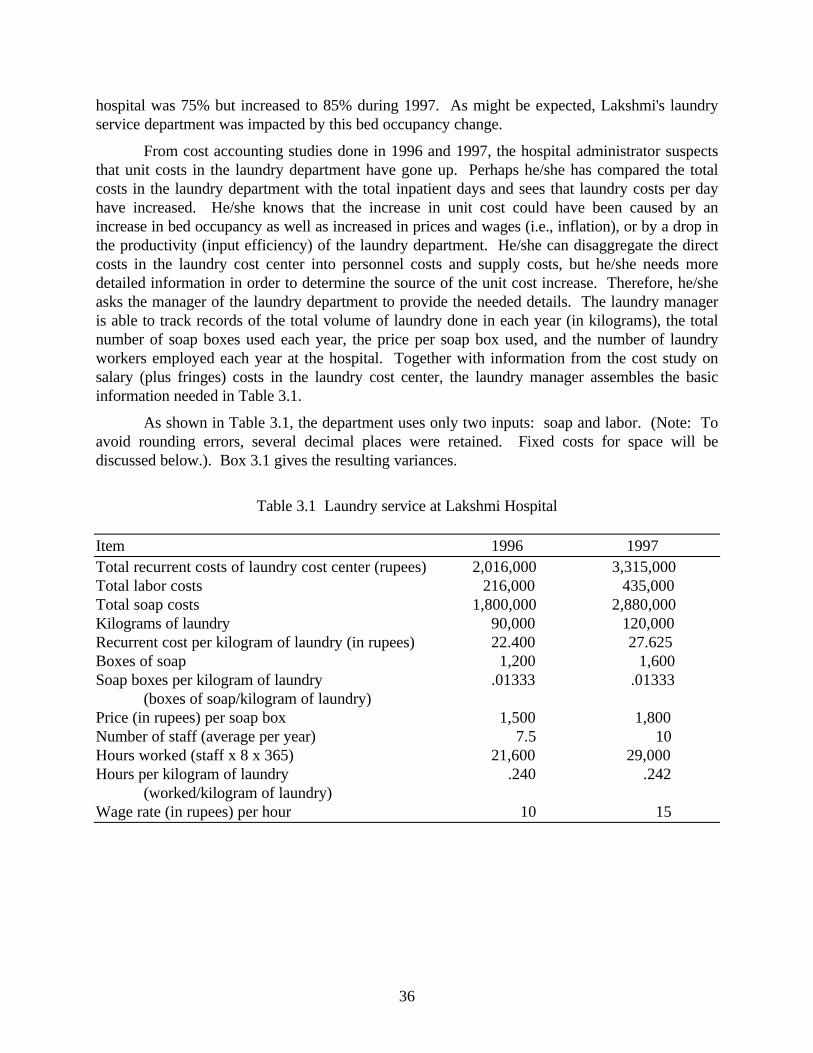
36
hospital was 75% but increased to 85% during 1997. As might be expected, Lakshmi's laundryservice department was impacted by this bed occupancy change.
From cost accounting studies done in 1996 and 1997, the hospital administrator suspectsthat unit costs in the laundry department have gone up. Perhaps he/she has compared the totalcosts in the laundry department with the total inpatient days and sees that laundry costs per dayhave increased. He/she knows that the increase in unit cost could have been caused by anincrease in bed occupancy as well as increased in prices and wages (i.e., inflation), or by a drop inthe productivity (input efficiency) of the laundry department. He/she can disaggregate the directcosts in the laundry cost center into personnel costs and supply costs, but he/she needs moredetailed information in order to determine the source of the unit cost increase. Therefore, he/sheasks the manager of the laundry department to provide the needed details. The laundry manageris able to track records of the total volume of laundry done in each year (in kilograms), the totalnumber of soap boxes used each year, the price per soap box used, and the number of laundryworkers employed each year at the hospital. Together with information from the cost study onsalary (plus fringes) costs in the laundry cost center, the laundry manager assembles the basicinformation needed in Table 3.1.
As shown in Table 3.1, the department uses only two inputs: soap and labor. (Note: Toavoid rounding errors, several decimal places were retained. Fixed costs for space will bediscussed below.). Box 3.1 gives the resulting variances.
Table 3.1 Laundry service at Lakshmi Hospital
Item 1996 1997 Total recurrent costs of laundry cost center (rupees) 2,016,000 3,315,000 Total labor costs 216,000 435,000 Total soap costs 1,800,000 2,880,000 Kilograms of laundry 90,000 120,000 Recurrent cost per kilogram of laundry (in rupees) 22.400 27.625 Boxes of soap 1,200 1,600 Soap boxes per kilogram of laundry .01333 .01333 (boxes of soap/kilogram of laundry) Price (in rupees) per soap box 1,500 1,800 Number of staff (average per year) 7.5 10 Hours worked (staff x 8 x 365) 21,600 29,000 Hours per kilogram of laundry .240 .242 (worked/kilogram of laundry) Wage rate (in rupees) per hour 10 15

37
Box 3.1 Variance components for Lakshmi Hospital
Price variances:
Soap = (1,800 rupees - 1,500 rupees) X 1,600 boxes of soap = 480,000 rupees (Unfavorable) Labor = (15 rupees - 10 rupees) X 29,000 hours worked = 145,000 rupees (Unfavorable)
Efficiency variances
Soap = (1,600 boxes of soap - [.01333 soap boxes per kilogram of laundry X 120,000 kilograms of laundry] X 1,500 rupees = 0 rupees
Labor = (29,000 productive hours worked - [.24 productive hours per kilogram of laundry X 120,000 kilograms of laundry] X 10 rupees = 2,000 rupees (Unfavorable)
Volume variances:
Volume variances = (120,000 kilograms of laundry produced in 1997- 90,000 kilograms of laundryproduced in 1996) X 22.400 rupees = 672,000 rupees (Favorable) With these calculations, Table 3.2 summarizes the factors that created cost changes in thelaundry department:
Table 3.2 Causes of Lakshmi Hospital's Laundry Department Cost Changes - 1996 to 1997
Cause Rupees Percent Change Increase in soap prices 480,000 37.0% Increase in wages 145,000 11.1% Change in soap efficiency 0 0.0% Decline in labor efficiency 2,000 0.2% Increase in volume 672,000 51.7% Total Change in Cost 1,299,000 100.0%
In the above example, the increased volume (or output) was the largest source (51.7%) ofthe total change in cost and a decline in labor efficiency being the smallest source (0.2%).However, all inputs combined (soap and labor prices and efficiencies) contributed to 48.3% oftotal cost changes in comparison to 51.7% for volume output.
However, the key managerial issue is identifying the extent and causes of a change in inputefficiency. The results of the analysis show that there was virtually no change in input efficiency. Thus, the laundry manager can reasonably claim that the increase in unit and total costs was notthe fault of the laundry department because of the general inflation effect (and not poorprocurement practices.
Input cost variance: Example 3.2 below shows how input prices and efficiency can becombined into input costs. If there are a number of inputs, it may be impractical to measure thequantities used for each. In that case, it is possible to partition cost changes between inputs
38
(which combine prices and efficiency of all inputs) and outputs. In the following formula, inputcost variance can be computed for all inputs combined, for a group of inputs, or for each inputseparately.
Input cost variance is computed as:
Input cost variance = Present input cost - old input costs X (present volume/old volume).
Example 3.2: Calculating input cost at the departmental level. Using the laundrydepartment as an example, input cost variances of component inputs are given in Box 4.2:
Box 3.2 Input cost variances of components
Input 1: Soap
Soap = [(1,600 boxes of soap X 1800 Rs. per soap box) - (1200 boxes X 1500 Rs. per soap box)] X (120,000 kilograms of laundry/90,000 kilograms of laundry) = (2,880,000 Rs. - 1,800,000 Rs.) X 1.33333 = 480,000 Rs. (total cost variance for soap)
Input 2: Labor
Labor = [(29,000 productive hours worked X 15 Rs. Per hour) - (21,600 hours X 10 Rs. per hour)] X (120,000 kilograms of laundry/90,000 kilograms of laundry) = (435,000 Rs. - 216,000 Rs.) X 1.33333 = 147,000 Rs. (total cost variance for labor)
Box 3.3 presents the combined input costs in this example.
Box 3.3 Combined input costs
Combined cost variance = 3,315,000 - [2,016,000 x (120,000 kg / 90,000 kg)] = 3,315,000 Rs. - 2,688,000 Rs. = 627,000 Rs. We can verify that this sum is correct by showing that it equals the sum of the components of the
two inputs.
Input 1 (soap) cost variance + input 2 (labor) cost variance = combined input cost variance; 480,000 Rs. + 147,000 Rs. = 627,000 Rs.
The system of cost variance analysis described above is a useful framework for analyzingthe sources of changes in departmental costs. It is recommended that this approach be limited toexamining major supply categories; there may be little utility in calculating price and efficiencyvariances for each of a hundred or more supply items. For smaller areas of supply or materialcosts (e.g. pencils, sheets of paper, and boxes of paper clips), a simple change in cost per unit ofdepartmental output may be just as informative as detailed price and efficiency variances.
Contracting services vs. in-house production. Analysis of unit costs also allowsmanagers to examine the economic advantages of contracting services versus using in-house staff,a type of privatization. Private contractors may have better access to capital for new vehicles and
39
equipment, access to cash for buying parts, flexibility in hiring staffing with the needed skills, andadjusting staffing to workload by season, day of week, and time of day.
The measure of unit costs for an internally (or in-house) produced ancillary or supportservice can be compared to the cost of purchasing the same service from a private contractor. Inaddition to cost, numerous aspects of “quality” complicate examining contracting options. Qualityincludes not only the service itself (how well and how promptly the service is performed), butother administrative, political, and personnel dimensions. Important elements are the employmentsecurity of workers in the support service, and the nature of the infrastructure provided. Workersmay oppose the contract option, particularly if their job security is not guaranteed. Yet privatecontractors may be reluctant to manage a public service at an advantageous price if they have nocontrol over the workforce. A compromise is usually possible that gives hiring preference to theformer public workers.
Contracting support services is becoming more common in developing countries. Forinstance, the Ministry of Health contracts with a vendor for catering services at all provincialhospitals in Sierra Leone. Spanishtown and other hospitals in Jamaica contracted for supportservices, such a portering and catering, with managerial support from USAID.
Both long run as well as short run costs need to be considered, which factor in equipmentand use of space as well as operating costs. Example 3.3, again based on the laundry service atLakshmi Hospital, illustrates these tradeoffs.
Example 3.3 Decision to replace laundry equipment or contract out. In 1997,Lakshmi Hospital’s laundry manager determined that all of the hospital’s current laundrymachinery would no longer be serviceable in 1998. New equipment, which is produceddomestically, would cost $63,700 (1,911,000 Rs.) He is faced with the decision to either replacethe equipment or close the laundry and contract with a private contractor who has adequatecapacity to handle the 132,000 kgs. of laundry. Using the assumption of 3% inflation fordomestic equipment and methods from Box 2.1, the annual depreciation for the new equipmentwould be $10,000 (300,000 Rs.) per year. The fixed cost per kilogram of laundry for the newequipment would be 2.2727 Rs. based on 132,000 kg. of laundry per year. Added to the existingfixed cost (for space), the overall fixed cost would be 6.2500 Rs. per kg. After requesting bidsfrom local vendors, the best quote was a price of 32.0000 Rs. per kilogram of laundry for threeyears. The resulting cost comparison (in Rs.) is as follows:
Contract Use in-house Services Staff Variable cost per kilogram 32.0000 30.3875 Fixed cost per kilogram included 6.2500 Total cost per kilogram 32.0000 36.6375
Based on the above cost comparisons, we recommend that the laundry departmentcontract with the local vendor provided that: (1) the quality of services is maintained or increased,(2) current in-house laundry personnel can be hired by the private contractor and/or employedelsewhere in the hospital, other costs (such as inventory or replacements) do not increase, and (4)current space can be used by the hospital for other purposes. If these conditions are satisfied, thehospital will save 4.6375 Rs. per kilogram (calculated as 36.6375 less 32.0000) or 612,000 Rs.($20,400) per year.
40
3.3 Hospital Level Cost variance analysis. Cost variance analysis is also of great importance to the hospitaldirector or administrator. He or she is interested in analyzing the institution’s overallperformance, or in analyzing how changes in one department affect another. The unit of analysisat the hospital level is a single cost center or combined cost centers within a particulardepartment. As mentioned, the occupancy of Lakshmi Hospital’s inpatient clinical units rose from75% in 1996 to 85% in 1997. Again considering the laundry department, the hospital directormay be interested in knowing to what extent both intensity of services and "pure volume"contributed to the 51.7% volume increase from 1996 to 1997 (see Example 3.4 below).
Example 3.4: Analysis of cost variance at the hospital level. For the hospital director,the next step is to determine whether the 51.7% volume variance was due to intensity of services(e.g. increase in pounds of laundry per patient day) or change in volume due to change in overallservice (e.g. increase in total patient days). These two factors are computed as follows;
Intensity = (Change in volume due to intensity difference) X Old cost per unit
Pure Volume = (Change in volume due to change in overall service) X Old cost per unit
Using previous information, 1.01159 kilograms of laundry were provided per patient day in 1996and 1.19011 kilograms of laundry per patient day in 1997:
Fiscal Year 1996: 325 beds X 75% occupancy rate X 365 days = 88,969 total patient days; 90,000 kilograms of laundry/88,969 total patient days = 1.01159 kg of laundry per patient day in1996. Fiscal Year 1997: 325 beds X 85% occupancy rate X 365 days = 100,831 total patient days; 100,831 total patient days /120,000 kilograms of laundry = 1.19011 kg of laundry per patient dayin 1997.
Box 3.4 presents the volume variances in this example.
Budgeting. Hospitals can use cost information to (1) establish rates and comply withboth internal and external reporting requirements, (2) determine whether departments areoperating within budget, (3) construct a budget for a department (or new initiative), and (4)allocate budgets among departments or cost centers.
Box 3.4 Volume variances
Based on the above information, the two volume variances are: Intensity variance = [(1.19011 - 1.01159) X 88,969 total patient days in 1996] X 22.400 rupees= 355,775 Rs. Pure volume = 1.19011 X (100,831 total patient days in 1997 - 88,969 total patient days
in 1996) X 22.400 Rs. = 316,225 Rs.
We can verify that the two volume variances are correct by showing that they equal the totalvolume variance of 672,000 Rs: Volume variance = Intensity variance + pure volume variance =355,775 Rs. + 316,225 Rs. = 672,000 Rs.

41
As shown in Box 3.5, variance analysis can be applied in constructing the next year’sbudget for a department. To do this, hospital management of Lakshmi Hospital has identifiedthose elements of cost that are presumed to be fixed and those that are presumed to be variable. Fixed costs do not change with respect to changes in volume whereas variable costs do change. We assume that variable costs change in direct proportion to changes in output or volume. Thatis, if output increases by 10 percent, these variable costs may also increase by 10 percent, that is,there is some constant cost increment per unit of output. In the following example, output in thelaundry department is expected to increase by 10% due to an increase in be occupancy from 85%to 93.5%. Variable cost is expected to increase due to 10% annual inflation and the outputincrease. Fixed cost is expected to increase by only 5% as only some components (e.g., utilitiesand maintenance) rise in cost while others (e.g. depreciation) remain constant.
Box 3.5: Constructing the 1998 budget for the laundry department of Lakshmi Hospital The cost equation may be represented as follows:
Total 1998 budget = (fixed cost + variable costs)
1998 variable costs = (120,000 kilograms of laundry X 1.10 output growth factor) X (27.625 X 1.10 inflation factor) = 132,000 kilograms of laundry X 30.3875 Rs. per kilogram of laundry = 4,011,150 Rs.
1998 fixed costs = 500,000 Rs. X 1.05 inflation factor = 525,000 Rs.
1998 total budget = 4,011,150 Rs. + 525,000 = 4,536,150 Rs.
Example 3.5: 1998 Budget variance for the laundry department of LakshmiHospital. As part of the annual financial review process, the administrator of the hospital isexamining the laundry department's 1998 budget in relation to actual experience. Table 3.3presents the relevant data. Overall, the laundry department has a favorable budget variance of66,150 Rs.
Table 3.3 Budgetary Data for Lakshmi Hospital
Item 1998 Actual 1998 Budget Variance Interpretation
Volume of laundry (kgs.) 125,000 132,000 7,000 (Unfavorable) Variable costs (rupees) 3,945,000 4,011,150 66,150 (Favorable) Fixed Costs (rupees) 525,000 525,000 0 (Neutral) Total Costs (rupees) 4,470,000 4,536,150 66,150 (Favorable)*
Note: This favorable interpretation is of underspending relative to the budgeted level. However, the hospital manager could most likely be dissatisfied since this is primarily due tovolume being less than anticipated.
Fiscal solvency. On a macro level, hospital administrators use cost data to assess the“break-evenness” of the hospital overall; that is, to what extent revenues were equal to totalexpenses for a particular fiscal year. “Break-evenness” is also relevant for revenue-producingdepartments like food services for visitors and families or clinical departments like internalmedicine, surgery, or physical medicine and rehabilitation. The favorable difference between totalrevenues and total expenses (or costs) is called a profit or surplus. The unfavorable variance iscalled a deficit or loss. Determining and attaining a level of profitability that is both acceptableand sufficient is not an easy task. If profits are too low, quality of care can be impaired seriously
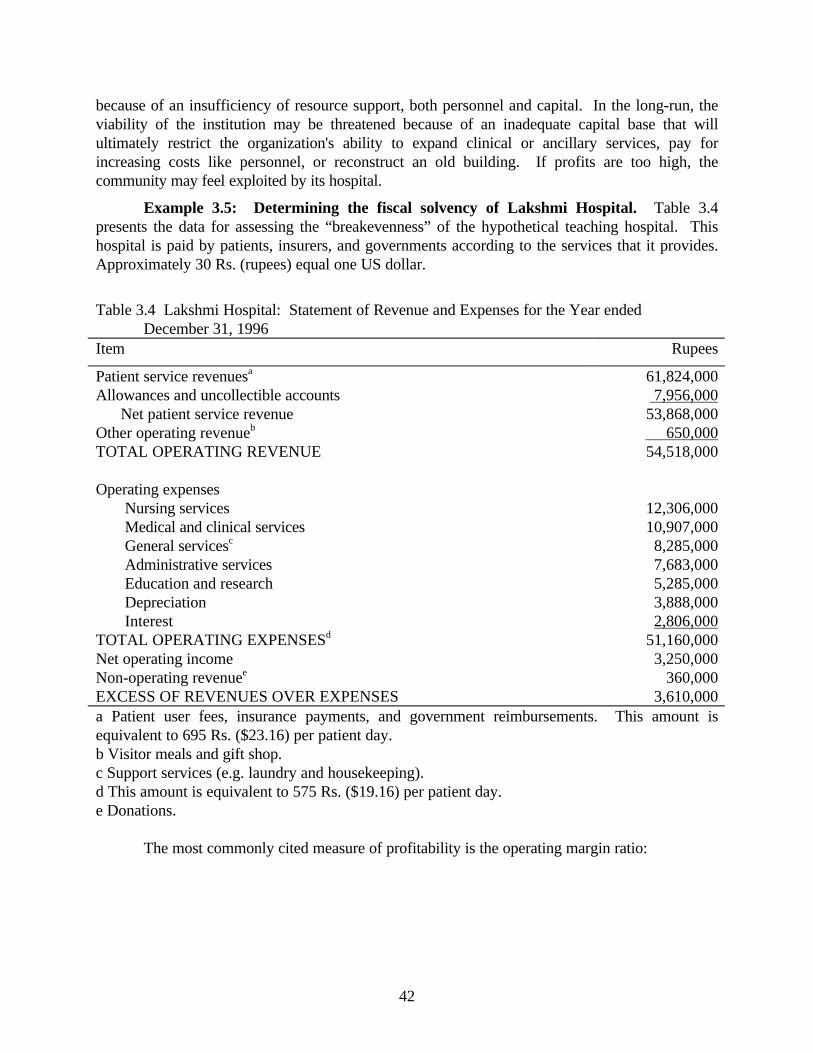
42
because of an insufficiency of resource support, both personnel and capital. In the long-run, theviability of the institution may be threatened because of an inadequate capital base that willultimately restrict the organization's ability to expand clinical or ancillary services, pay forincreasing costs like personnel, or reconstruct an old building. If profits are too high, thecommunity may feel exploited by its hospital.
Example 3.5: Determining the fiscal solvency of Lakshmi Hospital. Table 3.4presents the data for assessing the “breakevenness” of the hypothetical teaching hospital. Thishospital is paid by patients, insurers, and governments according to the services that it provides.Approximately 30 Rs. (rupees) equal one US dollar.
Table 3.4 Lakshmi Hospital: Statement of Revenue and Expenses for the Year ended December 31, 1996 Item Rupees
Patient service revenuesa 61,824,000 Allowances and uncollectible accounts 7,956,000 Net patient service revenue 53,868,000 Other operating revenueb 650,000 TOTAL OPERATING REVENUE 54,518,000 Operating expenses Nursing services Medical and clinical services General servicesc
Administrative services Education and research Depreciation Interest TOTAL OPERATING EXPENSESd
12,306,000 10,907,000 8,285,000
7,683,000 5,285,000 3,888,000 2,806,000
51,160,000 Net operating income 3,250,000 Non-operating revenuee 360,000 EXCESS OF REVENUES OVER EXPENSES 3,610,000 a Patient user fees, insurance payments, and government reimbursements. This amount isequivalent to 695 Rs. ($23.16) per patient day. b Visitor meals and gift shop. c Support services (e.g. laundry and housekeeping). d This amount is equivalent to 575 Rs. ($19.16) per patient day. e Donations. The most commonly cited measure of profitability is the operating margin ratio:

43
Net Operating Income Total Operating Revenues
For Lakshmi Hospital, the value of this ratio in 1996 is:
3,250,000 = .0596
54,518,000
The higher the value of the ratio, the better the hospital’s financial condition. A singleway to understand this ratio is to think of it as a measure of profit retained per dollar of sales. Forexample, in 1996 Lakshmi Hospital retained 6 cents of every revenue dollar (or 6 rupees per 100rupees of revenue) as profit. Given this relatively low operating margin, Lakshmi Hospital mayneed to examine its rate structure, increase its bed occupancy rate, and examine its cost structureto find items that could be contained.
3.4 Hospital Revenues The revenue generated by a hospital, expressed as a proportion of its costs, is the productof three factors: the fee level (average fee as a proportion of average unit cost), the proportion ofservices which are paying (not exempted), and the collection efficiency (proportion of fees owedwhich are actually collected and remitted to the hospital’s account). Generally, only a share ofpatients are actually charged the set fee, with the remaining ones being exempted due to povertyor other privileged categories (e.g. school children, or disabled war veterans). The first twofactors are policy variables set by the hospital. A high degree of acceptability and a high degreeof affordability for the service favor setting these percentages high, while a high level of cost-effectiveness and a high elasticity of demand favor lower fees and proportion paying. The lastfactor is a measure of administrative capacity. The efficiency of collection is greatest when only afew providers can dispense a given service in a limited location, and when the service is generallyprovided on an elective basis. The three factors are summarized in Table 3.5. The “current situation” represents theauthors’ impression of fee collections in government hospitals in Bangladesh and Zimbabwe,where the manual was discussed in workshops. The fee level is currently low overall because feesfor inpatient services and drugs generally cover only a small share of the costs involved, and thesecosts represent the majority of the operating costs of the country’s hospitals. The proportionpaying is also low because of broadly defined policies of indigence. As hospitals do not retain thefees they collect, they have every reason to be generous in interpreting the need for an exemption.Finally, the collection factor reflects the absence of specific programs to enhance collection.

44
Table 3.5. Factors explaining rate of cost recovery
Factor Interpretation Currentsituation
Highfee
Moderatefee
Fee Full fee for paying patients as proportion ofunit costs
20% 100% 85%
Proportionpaying
Proportion of patients exempted from fee 50% 50% 50%
Collection Proportion of fees not exempted actuallycollected
40% 60% 70%
Recovery Proportion of costs recovered 4% 30% 30%
In Jamaica, where a comparable collection rate previously existed, efforts of the HealthSector Initiatives Program substantially increased revenues. There, hospitals were given theliquidity and flexibility of spending their revenues, even though their government subsidies wereoften reduced as revenues rose. Collectors were trained, building modifications were made ifneeded to create a cashier’s window, and additional positions were created to ensure that cashierswere on duty during evenings and weekends, in addition to normal government hours. The “high fee” scenario below shows what would happen if nominal prices were set withno subsidies (i.e., 100% of costs). With only a moderate proportion of patients asked to pay(50%), and a low level of collections (40%), the overall level of cost recovery is 30%. Bycontrast, the same revenue is raised with a more moderate level of fees (15% lower on average),the same level of exemptions (50%), but better collections (70% enforcement). In some hospitals,“leakage” in collections occurs between the patient and the hospital account. While the patientmay pay an “informal” fee, it may be retained by a gatekeeper, personal attendant, aide, nurse,physician, or deposited in a location other than the official hospital account. To improvecollection, administrators may consider establishing policies to ensure that at least part of officialfees are retained by the hospital that collects them and used to visibly benefit the institution, thepatients, and the staff.
45
CHAPTER 4: USING COST DATA TO IMPROVE MANAGEMENT OF AHOSPITAL SYSTEM
4.1 Introduction This chapter discusses cost analysis at the level of a hospital system. It spans the levelsfrom the simplest hospital system, a district or province, up to the national level.
At the district level, managers often have the authority to set prices and allocate budgetsto district health services in systems where such decisions are decentralized to the district level. Discussions will focus on issues relating to improving the referral system within the district andappropriate use of different providers of services.
At the national level, the manual suggests ways to identify relative inefficiencies amongdifferent but similar types of hospitals nationally or within a specified geographic area (i.e.,province, state or region). It focuses on improving the referral system among hospitals andappropriate use of different providers of services. This section also focuses on the cost-effectiveness of programs, that is, what kinds of medical conditions should the hospital treat (e.g.,high-level curative care vs. primary care prevention).
4.2 Estimating Volumes in a Hospital System
In some hospitals, data are so limited that costs cannot be analyzed using the techniquesdescribed Chapter 2. Nonetheless, it is still possible to draw some conclusions even if decision-makers only have aggregate cost data and some limited service or activity data. This sectiondiscusses what analyses can usefully be performed in such situations, and the limitations of theseanalyses. Projections from Very Limited Data. The most limited situation occurs when only twovery limited types of data are available for an individual hospital or a system of similar hospitals:the total operating costs and some measure(s) of size or activities. The preferable measure of sizeor activities is the number of services performed during a given period (such as the last year). Ausable proxy, however, is the number of beds.
Shepard and Gonzales (1982) used this approximation to project the cost impact of amajor expansion in hospitals underway in Honduras from 1980 to 1983. With data on thenumbers of beds and recurrent costs for general public hospitals, they calculated that the annualoperating cost per bed had grown at a 6.9% real annual rate of growth from 1976 to 1980because of increasing intensity of services (or simply because of increasing budget allocations). They used this trend to project the future cost per bed. They multiplied it times the projectedfuture number of beds (computed by adding beds under construction/planned to current bedcapacity). As shown in Table 4.1, real costs were projected to rise by 53% in just 3 years. Theincrease would have represented more than the entire budget for ambulatory care in the country’shealth system.

46
Table 4.1 Projecting Costs of Hospital Services in Honduras (in constant 1980 US dollars)
Item Actual, 1980 Projected, 1983
Number of beds 3,579 4,490 Annual operating cost per bed ($) 5,708 6,973 Total cost of hospital system ($ million) 20.4 31.3 Projected real increase over 1980 n/a 53%
To the consternation of financial officials, the results proved realistic. With theconstruction and planning processes well underway, the Ministry and donors added the bedsessentially as scheduled. Financial constraints delayed the opening of several hospitals, however,until years after they were completed.
Similar approaches could be applied to an individual hospital, or to various types ofhospital systems, such as:
• all government district hospitals in a given region, or in the country as a whole;
• all provincial hospitals in the country;
• all multi-purpose referral or teaching hospitals in a given region, or in the country as a whole;
• all specialty hospitals with a given purpose, such as mental health, tuberculosis.
Estimating Costs From Relative Values. A more accurate approach is feasible if dataare available on the volume of services produced (activities) for a hospital over a defined period(generally one year), as well as on the annual operating costs. This approach differs from that inthe preceding chapter, however, because it does not require operating costs to be assigned toindividual departments or cost centers. Deriving unit costs from these data entails the followingfive steps.
1. Identify the output-producing centers.
As in the preceding chapter, the question is: for which services will unit costs becomputed? This choice depends primarily on the level of detail for which activity data areavailable. For most hospitals, data are available on at least the aggregate number of ambulatoryvisits and the aggregate number of inpatient bed-days per year. In this case, one can estimatetotal cost of inpatient versus outpatient care and the unit costs of a bed day and ambulatory visit.
In some cases, the number of bed-days is reported by clinical department or ward (e.g.,medicine, surgery, and maternity). In that case, one can estimate the unit costs per bed-day byward.
2. Define units of output.
For each patient care cost center, one must define a unit of output. Within each costcenter, the unit of output must be readily counted and reasonably homogeneous. In most cases,inpatient services are best expressed in terms of days, and ambulatory services in terms of visits.Inpatient admissions represents an alternative, though less homogeneous, measure. Costs willthen be expressed in terms of per day or per visit. If data are also available on admissions as well

47
as patient days, this will allow for a calculation of average length of stay (ALOS). Average costper admission could then be calculated by multiplying the estimate of average cost per day timesALOS.
3. Define the data period.
Data can be analyzed on a per-year, per-quarter or other basis. The crucial issue is tomake sure that the same time period applies both to your aggregate cost figure and yourutilization data.
4. Identify the full costs of the facility
Financial statements for the hospital may be a useful starting point, although as previouslynoted they may understate cost. Where possible you should try to add in costs of resources usedby the hospital but paid for by others, e.g.
• donated items
• drugs purchased by a central state agency
• employees' time paid for out of other budgets
See Section 2.3 for a full discussion of how to develop complete cost data.
5. Obtain external data on relative costliness of services
To implement this approach, you will need estimates of the relative costliness of differenttypes of care. These are rules of thumb, such as:
• One day of inpatient care costs three times as much as one outpatient visit.
• One surgical admission costs 10% more than the average inpatient admission overall.
We call these data 'external' because they will have to come from outside your hospital. (If you had such data internally, you could probably use the techniques in the previous chapter,instead of this one.)
Possible sources for these estimates could include:
• Other hospitals in your country for which step-down cost accounting studies (asdescribed in Chapter 2) have been done
• Judgment of clinical experts or hospital staff on the relative amounts of resources usedfor the different services
• Studies from other countries you are familiar with
• Table 4.2 in this chapter of the manual (derived from step-down studies for which unitcosts were available).
However, you will generate more useful information if you use estimates from hospitalswhich are similar to your own (e.g. in the same country, same level of hospital).
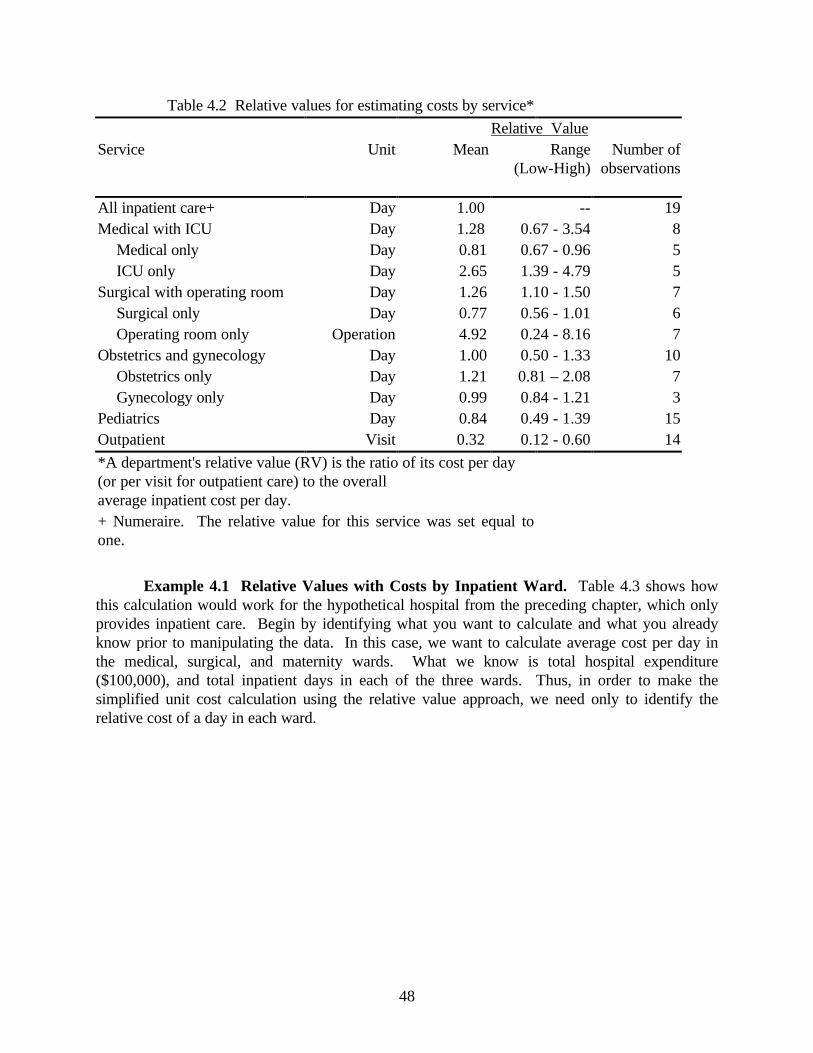
48
Table 4.2 Relative values for estimating costs by service*
Relative ValueService Unit Mean Range
(Low-High)Number of
observations
All inpatient care+ Day 1.00 -- 19Medical with ICU Day 1.28 0.67 - 3.54 8
Medical only Day 0.81 0.67 - 0.96 5ICU only Day 2.65 1.39 - 4.79 5
Surgical with operating room Day 1.26 1.10 - 1.50 7Surgical only Day 0.77 0.56 - 1.01 6Operating room only Operation 4.92 0.24 - 8.16 7
Obstetrics and gynecology Day 1.00 0.50 - 1.33 10Obstetrics only Day 1.21 0.81 – 2.08 7Gynecology only Day 0.99 0.84 - 1.21 3
Pediatrics Day 0.84 0.49 - 1.39 15Outpatient Visit 0.32 0.12 - 0.60 14
*A department's relative value (RV) is the ratio of its cost per day(or per visit for outpatient care) to the overallaverage inpatient cost per day.+ Numeraire. The relative value for this service was set equal toone.
Example 4.1 Relative Values with Costs by Inpatient Ward. Table 4.3 shows howthis calculation would work for the hypothetical hospital from the preceding chapter, which onlyprovides inpatient care. Begin by identifying what you want to calculate and what you alreadyknow prior to manipulating the data. In this case, we want to calculate average cost per day inthe medical, surgical, and maternity wards. What we know is total hospital expenditure($100,000), and total inpatient days in each of the three wards. Thus, in order to make thesimplified unit cost calculation using the relative value approach, we need only to identify therelative cost of a day in each ward.

49
Table 4.3 Unit cost calculation from relative values for Hospital X
Reported Items Calculated Items
WardTotalCost
Inpatientdays
RelativeValue(RV)
RVUnits
% ofRV
Units
Cost ofeach
service
Cost perInpatient
day
Medical (no ICU) 500 0.81 405 32.8% $32,847 $66Surgical withoperating room
300 1.26 378 30.7% $30,657 $102
Obstetrics &gynecology 450 1.00 450 36.5% $36,496 $81ALL INPATIENT $100,000 1,250 1.00 1,233 100.0% $100,000 $80
Steps. The steps in this example were performed as follows:
Patient care cost centers: as before, we are distinguishing medical, surgical and maternity(but not pharmacy). The results will therefore be comparable to Table A4.
Unit of analysis: we have chosen the day as the unit of analysis, because the 'rules ofthumb' about relative costliness are more readily available on a per-day basis than per-discharge.
Time period: although monthly utilization data are available, the financial data are annualso we compute unit cost on an annual basis.
Relative values: we take the ones from the analysis presented in Table 4.2.
Calculations: The first column reports the total cost to be apportioned. The secondcolumn repeats the inpatient days by ward, from Table A4. The third column introduces the'relative value weights' from other studies, as presented in Table 4.2. Use of these weights impliesthat we are assuming that compared to the average inpatient day, a surgical day is 26% morecostly and a medical day is 19% less costly. The fourth column uses these weights to convertdays into relative value units (RVUs). It may be noted that although the medical ward providesmore days than maternity, it provides fewer RVUs because each medical day has a lower relativevalue.
The fifth column computes each ward's share of total RVUs. The sixth column appliesthat share to the total hospital cost of $100,000 (from Table A1). For example, the surgical wardhas 30.7% of the RVUs, so we assume it is responsible for 30.7% of the hospital's cost, or around$30,657.
Finally, we divide each ward's total cost by the inpatient days (first column) and obtain theunit cost by ward. The surgical ward has a cost of $102 per day, compared to $81 per day on thematernity ward and $66 per day on the medical ward.
Uses. How can these figures be used? We can use them to compare surgical costs acrosshospitals, or to see whether it would be cheaper to transfer some surgical patients elsewhere. Wecan not use the results to conclude that surgery days are costlier than obstetrics and gynecology

50
days, because this was an assumption we used in the analysis, not something we learned fromdoing the analysis.
Comparison to Step-Down Results. In the present case, we can return to the results ofstep-down analysis in chapter 2, and see whether the 'relative value' approach gave differentresults. (This would not be possible if you were unable to do step-down analysis in the first place,due to poor data). How different are the results?
Comparing Tables A4 and 4.3, we see that the 'relative value' method understates unitcosts by 14% for medical care and overstates unit cost for obstetrics and gynecology (maternity)by 10%. Unit cost for surgery is the same for both approaches. (The overall cost per day is thesame in both tables, since we have only changed the way total costs are allocated across wards,not the amount of total cost or days of care).
From the comparison, we can conclude that our rules of thumb were somewhat inaccuratefor two of this hospital’s wards. Using the findings from our step down analysis, the correct rulesof thumb would have specified that a medical day costs only 1% less than the average inpatientday, not 19% less. Also, maternity days are less costly than the overall inpatient average, notequally costly as specified by our rule of thumb.
Example of Approach with Costs by Inpatient/Outpatient Visit. Table 4.4 providesanother worked example, for a different hospital which only knows total cost and the totalnumber of inpatient days and outpatient visits, but not the allocation of costs between inpatientand outpatient settings. This hospital can still estimate separate unit costs for inpatient andoutpatient care, by applying our relative values from Table 4.2 to its utilization data.
Table 4.4 Unit cost calculation from relative values: Inpatient versus outpatient
ServiceTotalCost Units RV
RVUnits
% ofRV
UnitsTotalCost
Unitcost
Inpatient 100 days 1.00 100 21% $2,066 $20.66/dayOutpatient 1200 visits 0.32 384 79% $7,934 $6.61/visitTotal $10,000 - - 484 100% $10,000 -
The first two columns show that this hospital incurred a cost of $10,000 and provided 100inpatient days and 1200 outpatient visits during the period studied. The third column gives therelative value weights from Table 4.2, which assume that one inpatient day costs the same asabout 3 outpatient visits. Column 4 uses the weights to convert days and visits into RVUs, andColumn 5 shows the share of RVUs provided in each setting. Since inpatient care accounts for20.66% of RVUs, we assume it also accounts for 20.66% of total cost, that is $2,066. This givesan inpatient cost per day of $20.66. Similarly, the outpatient cost per visit is $6.61.
The above example shows that the relative value approach can be applied even if differentdepartments use different units. Even though the inpatient department provides days andoutpatient provides visits, the two can be compared by converting dissimilar units to a commonstandard (the relative value).
51
Strengths and Limitations of these Approaches. The strength of the approachesdescribed is their simplicity. The requirements in data are few; the analytic computations areeasily done with a calculator. It is easy to explain the derivations. Also, results are likely to beless susceptible to misunderstanding when only approximate data are available.
The limitation of these approaches is the potential for inaccuracy, if the rules of thumbused are not appropriate for the hospital being studied.
4.3 Allocation of a Budget among Hospitals
Bed-day equivalents provide a useful statistic to allocate a central budget equitably amongpublic hospitals. If this statistic were the only one used, then each hospital would receive abudget proportional to its share of total bed-day equivalents. That is, if a hospital generated 10%of the country’s bed-day equivalents in the latest year with full data, it would be awarded 10% ofthe country’s hospital budget next year. This statistic is one of the terms in the formula used bythe Zimbabwe Ministry of Health to allocate funds to its central hospitals and provinces.
While not perfect, this type of system has several advantages. It is more objective andrational than the allocations based on past budgets and political influence seemingly practiced insome countries. It rewards productivity and efficiency, so each hospital receives the same budgetper inpatient day and per outpatient visit. By contrast, budgets based on historical costsperpetuate, and may even encourage, overspending and inefficiency.
Limitations of a system based on bed day equivalents are its exclusion of several important factors, and its possible perverse incentives. A system based solely on bed-dayequivalents would fail to account for needs for preventive and promotive services (which are notmeasured by inpatient and outpatient services), for differences in the sophistication of services, forother factors affecting the costs of services (e.g., distance and scale), for varying abilities ofhospitals to raise revenue (based on the capacity to pay of the populations they serve), and for thetime and central support required for a hospital to adjust to a different budget (i.e., to transferpersonnel in or out, trim costs responsibly, or use additional funds productively). Perverseincentives can arise because such a system would reward provider-induced utilization (i.e.,excessive admissions, lengths of say, or follow up visits to boost activity statistics).
These limitations can be addressed by incorporating other factors in the allocationformula, and using a blended formula based on a combination of bed-day equivalents and historicbudgets. The Zimbabwe Ministry of Health has addressed many of these concerns by using 13parameters (including bed-day equivalents) in its allocations of resources. Other factors includepopulation (a proxy for the needs of preventive services), area (a proxy for distance amongfacilities), numbers of health facilities and of rural health clinics (measures of scale), total beds,number of vehicles, dental ratios, laboratory units (all measures of sophistication), staff salariesand allowances (measures of past budgets), and outpatient attendances, patient days, andoccupied beds (all additional measures of volume of activities). Each hospital’s allocation is aweighted average of its share of the national total on each of these factors. While the Zimbabwesystem does not explicitly incorporate relative income of catchment populations in its formula,

52
this term could be included in a final adjustment allowed by its system--“manual moderationtaking into account practical factors” (Zimbabwe Ministry of Health, 1994).
4.4 Applications to Improve Hospital EfficiencyOverall efficiency. The manager of a hospital system should calculate the unit costs of
final outputs for each of the hospitals in the system, and compare the results for the same unit ofservice in hospitals of the same type (e.g., district, provincial, and referral). For example, costsper patient-day and per outpatient visit can be compared.
For hospitals of comparable sophistication and quality, a low cost per patient-day is anindication of good efficiency, while a high cost per patient-day may suggest poor efficiency. Amanager will first want to examine the data to rule out three spurious factors. First, if unit costsare excessively high in one hospital, resources may have been over-allocated to that hospital andunder-allocated to another. For example, suppose two institutions share some important service,such as a pharmacy but all, or almost all, the cost were allocated to just one institution. Then thecosts of that institution would be inappropriately high, while those of the other would beinordinately low. The manager should examine the unit costs of hospitals that might shareservices to see if they are inordinately low. If so, he or she should consider revising the basis ofallocating the shared resource to see if results change substantially.
Second, the share of resources allocated to a particular service may have beeninappropriately high. For example, if a hospital’s cost for an outpatient visit were high, perhapsan excessive share of personnel or pharmacy costs was allocated to that service. To determinewhether this spurious factor is responsible, the manager should examine possible reallocations ofthat resource. A service which represents a small share of a hospital’s total costs is especiallyprone to errors in allocation. A small absolute difference in allocation will then make a bigrelative change in unit costs. For example, suppose a manager were unsure whether anemergency (casualty) ward represented 5 or 10 percent of hospital personnel. The total personnelcosts, and thus the unit personnel costs, will be twice as high under the 10 percent allocation. Fora large service, however, a 5 percentage point difference is much less crucial. The difference of 5percentage points between, say a 50 versus a 55 percent share of personnel for medical/surgicalinpatient stays would change unit costs by only a tenth. If unit costs for a given hospital tend tobe very high for some services and very low for others, then it is possible that the basis ofallocation is in appropriate. On the other hand, if a hospital's unit cost is consistently aboveaverage for different services, then that hospital is probably less efficient.
Third, an especially low unit cost may indicate that important resources are not beingcounted, or an estimate for a resource is particularly high. Results from Connaught Hospital inSierra Leone may indicate this type of result. Many drugs and supplies were not bought officiallythrough the hospital pharmacy (which had limited stock), but were purchased by patients, eitherthrough commercial pharmacies in the city, or through semi-formal drug sales at the hospitalpharmacy. A knowledge of the hospital’s operations facilitates these interpretations.
Once these spurious factors have been ruled out, it is instructive to examine the mostefficient hospitals. Characteristics worth noting are: occupancy rate, staffing per bed, and perpatient day, the proportion of staff at each of several levels of skill:
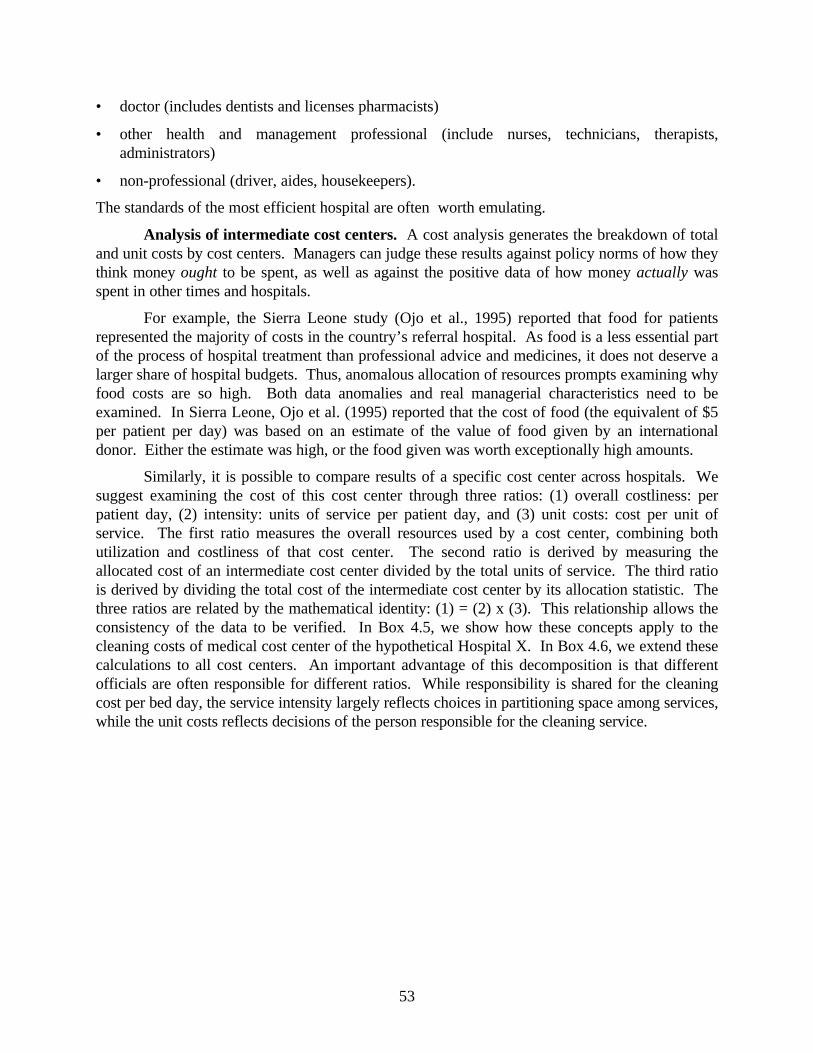
53
• doctor (includes dentists and licenses pharmacists)
• other health and management professional (include nurses, technicians, therapists,administrators)
• non-professional (driver, aides, housekeepers).
The standards of the most efficient hospital are often worth emulating.
Analysis of intermediate cost centers. A cost analysis generates the breakdown of totaland unit costs by cost centers. Managers can judge these results against policy norms of how theythink money ought to be spent, as well as against the positive data of how money actually wasspent in other times and hospitals.
For example, the Sierra Leone study (Ojo et al., 1995) reported that food for patientsrepresented the majority of costs in the country’s referral hospital. As food is a less essential partof the process of hospital treatment than professional advice and medicines, it does not deserve alarger share of hospital budgets. Thus, anomalous allocation of resources prompts examining whyfood costs are so high. Both data anomalies and real managerial characteristics need to beexamined. In Sierra Leone, Ojo et al. (1995) reported that the cost of food (the equivalent of $5per patient per day) was based on an estimate of the value of food given by an internationaldonor. Either the estimate was high, or the food given was worth exceptionally high amounts.
Similarly, it is possible to compare results of a specific cost center across hospitals. Wesuggest examining the cost of this cost center through three ratios: (1) overall costliness: perpatient day, (2) intensity: units of service per patient day, and (3) unit costs: cost per unit ofservice. The first ratio measures the overall resources used by a cost center, combining bothutilization and costliness of that cost center. The second ratio is derived by measuring theallocated cost of an intermediate cost center divided by the total units of service. The third ratiois derived by dividing the total cost of the intermediate cost center by its allocation statistic. Thethree ratios are related by the mathematical identity: (1) = (2) x (3). This relationship allows theconsistency of the data to be verified. In Box 4.5, we show how these concepts apply to thecleaning costs of medical cost center of the hypothetical Hospital X. In Box 4.6, we extend thesecalculations to all cost centers. An important advantage of this decomposition is that differentofficials are often responsible for different ratios. While responsibility is shared for the cleaningcost per bed day, the service intensity largely reflects choices in partitioning space among services,while the unit costs reflects decisions of the person responsible for the cleaning service.
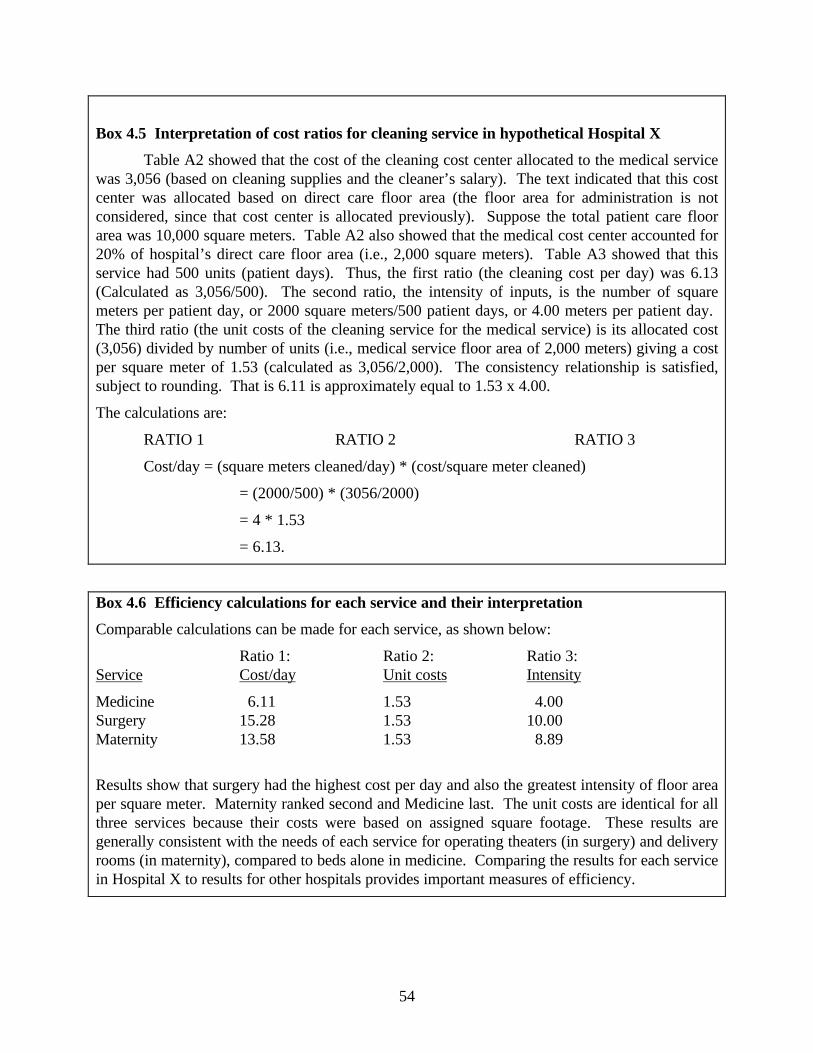
54
Box 4.5 Interpretation of cost ratios for cleaning service in hypothetical Hospital X
Table A2 showed that the cost of the cleaning cost center allocated to the medical servicewas 3,056 (based on cleaning supplies and the cleaner’s salary). The text indicated that this costcenter was allocated based on direct care floor area (the floor area for administration is notconsidered, since that cost center is allocated previously). Suppose the total patient care floorarea was 10,000 square meters. Table A2 also showed that the medical cost center accounted for20% of hospital’s direct care floor area (i.e., 2,000 square meters). Table A3 showed that thisservice had 500 units (patient days). Thus, the first ratio (the cleaning cost per day) was 6.13(Calculated as 3,056/500). The second ratio, the intensity of inputs, is the number of squaremeters per patient day, or 2000 square meters/500 patient days, or 4.00 meters per patient day. The third ratio (the unit costs of the cleaning service for the medical service) is its allocated cost(3,056) divided by number of units (i.e., medical service floor area of 2,000 meters) giving a costper square meter of 1.53 (calculated as 3,056/2,000). The consistency relationship is satisfied,subject to rounding. That is 6.11 is approximately equal to 1.53 x 4.00.
The calculations are:
RATIO 1 RATIO 2 RATIO 3
Cost/day = (square meters cleaned/day) * (cost/square meter cleaned)
= (2000/500) * (3056/2000)
= 4 * 1.53
= 6.13.
Box 4.6 Efficiency calculations for each service and their interpretation
Comparable calculations can be made for each service, as shown below:
Ratio 1: Ratio 2: Ratio 3:Service Cost/day Unit costs Intensity
Medicine 6.11 1.53 4.00Surgery 15.28 1.53 10.00Maternity 13.58 1.53 8.89
Results show that surgery had the highest cost per day and also the greatest intensity of floor areaper square meter. Maternity ranked second and Medicine last. The unit costs are identical for allthree services because their costs were based on assigned square footage. These results aregenerally consistent with the needs of each service for operating theaters (in surgery) and deliveryrooms (in maternity), compared to beds alone in medicine. Comparing the results for each servicein Hospital X to results for other hospitals provides important measures of efficiency.

55
4.5 Refining the Hospital’s Role in the Health SystemThe unit of analysis at the hospital system level are hospitals within a particular district,
province, region or state, or the country as a whole.
Appropriate type of hospital. One of the principles of health planning is that patientsshould be treated in the least complex and least costly type of health facility which is adequate fortheir needs. This rule would generally ensure that patients are treated more conveniently, at lessercost to the family (because they save travel expenses), and often at lower cost to the health system(as lower level facilities are thought to be less costly). Unit cost analysis allows the economicrationale behind this policy to be examined. For example, are tertiary hospitals really producingcare more expensively than lower-level hospitals? If the tertiary hospitals have unit costs threetimes higher for the same services, should their fees also be three times higher?
As with other “real world” policies, cost alone is not a sufficient factor. Importantdimensions of quality need examination. Quality entails not only the excellence of the staff, thedepth of their training, and the sophistication of their infrastructure. Promptness and courtesy ofservice are also highly valued by patients. Nevertheless, there are potential economic gains from amore rigorous management of referral procedures.
Disease specific costs. Among adults, the prevalence of HIV infection in developingcountries (1.5%) is 13 times as high as in industrialized countries (0.12%) (Mann and Tarantola,1996). To better plan responses for prevention and control both donors and nationalgovernments needed data on current levels of health expenditures related to HIV/AIDS, theirallocations and sources. Hospital costs represent a critical component of overall costs. In a studysponsored by the World Bank, the European Commission, and UNAIDS, Shepard (1996) selectedfive countries of varying economic levels for case studies. Only the one with the highest percapita GDP, Brazil, had existing data on hospital expenditures for AIDS. These were derivedfrom reimbursements through its government run social security system.
For the other countries, several sources of data needed to be assembled. The Côted’Ivoire (CI), a country of 14.3 million persons severely affected by this condition, illustrates thisprocess (Shepard, 1996). Estimates for the CI were based on both objective data and Delphiestimates by AIDS experts from government, voluntary hospitals, and traditional medicine (Konéet al., 1996). Table 4.5 shows the process used to infer hospital costs. First, the overall number ofAIDS patients was derived from reported cases and expanded for underreporting. Second, theexperts classified the estimated annual number of new HIV/AIDS clinical cases (18,122) into fivegroups based on the expected type and amount of care that they typically received. Third, thelength of stay and setting for each group was based on clinical data. Fourth, unit costs in eachtype of hospital were based on available unit cost studies, derived from step-down analyses orrelative value approaches. For example, patients with private insurance coverage were estimatedto receive care at private clinics, costing on average 52,500 West African Francs (F CFA,equivalent to US $105) per day. At the other extreme, the hospitals used by rural patients (largelypublic, district hospitals) cost 5,000 F CFA ($10) per day. Finally, totals were computed.
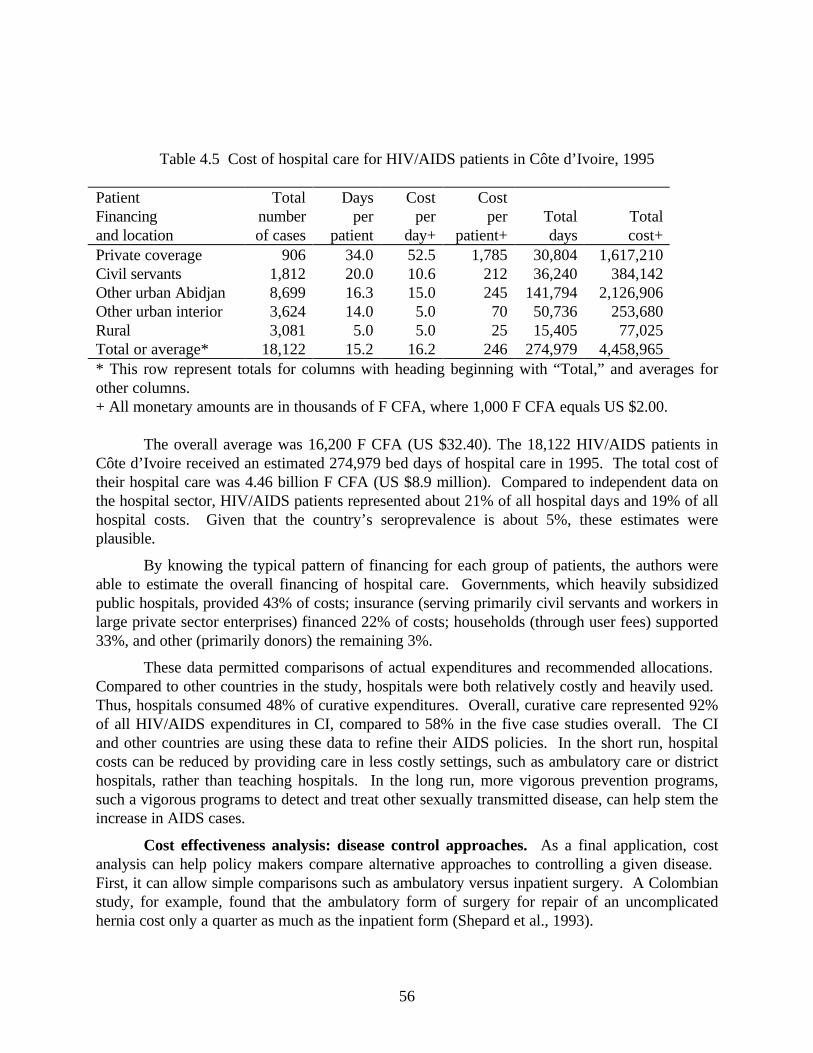
56
Table 4.5 Cost of hospital care for HIV/AIDS patients in Côte d’Ivoire, 1995
PatientFinancingand location
Totalnumberof cases
Daysper
patient
Costper
day+
Costper
patient+Totaldays
Totalcost+
Private coverage 906 34.0 52.5 1,785 30,804 1,617,210Civil servants 1,812 20.0 10.6 212 36,240 384,142Other urban Abidjan 8,699 16.3 15.0 245 141,794 2,126,906Other urban interior 3,624 14.0 5.0 70 50,736 253,680Rural 3,081 5.0 5.0 25 15,405 77,025Total or average* 18,122 15.2 16.2 246 274,979 4,458,965* This row represent totals for columns with heading beginning with “Total,” and averages forother columns.+ All monetary amounts are in thousands of F CFA, where 1,000 F CFA equals US $2.00.
The overall average was 16,200 F CFA (US $32.40). The 18,122 HIV/AIDS patients inCôte d’Ivoire received an estimated 274,979 bed days of hospital care in 1995. The total cost oftheir hospital care was 4.46 billion F CFA (US $8.9 million). Compared to independent data onthe hospital sector, HIV/AIDS patients represented about 21% of all hospital days and 19% of allhospital costs. Given that the country’s seroprevalence is about 5%, these estimates wereplausible.
By knowing the typical pattern of financing for each group of patients, the authors wereable to estimate the overall financing of hospital care. Governments, which heavily subsidizedpublic hospitals, provided 43% of costs; insurance (serving primarily civil servants and workers inlarge private sector enterprises) financed 22% of costs; households (through user fees) supported33%, and other (primarily donors) the remaining 3%.
These data permitted comparisons of actual expenditures and recommended allocations. Compared to other countries in the study, hospitals were both relatively costly and heavily used. Thus, hospitals consumed 48% of curative expenditures. Overall, curative care represented 92%of all HIV/AIDS expenditures in CI, compared to 58% in the five case studies overall. The CIand other countries are using these data to refine their AIDS policies. In the short run, hospitalcosts can be reduced by providing care in less costly settings, such as ambulatory care or districthospitals, rather than teaching hospitals. In the long run, more vigorous prevention programs,such a vigorous programs to detect and treat other sexually transmitted disease, can help stem theincrease in AIDS cases.
Cost effectiveness analysis: disease control approaches. As a final application, costanalysis can help policy makers compare alternative approaches to controlling a given disease. First, it can allow simple comparisons such as ambulatory versus inpatient surgery. A Colombianstudy, for example, found that the ambulatory form of surgery for repair of an uncomplicatedhernia cost only a quarter as much as the inpatient form (Shepard et al., 1993).

57
Finally, cost analysis can allow approaches based on very different approaches to becompared. For example, for two important health problems in many tropical countries,prevention is difficult. Respiratory infections are airborne. Dengue viruses are carried bymosquitoes that breed quickly, even when spraying has reduced their number. Cost-effectivenessanalysis of control programs for both diseases showed that except for vaccination, casemanagement was generally the most cost-effective control procedure (Stansfield and Shepard,1993; Shepard and Halstead, 1993). An analysis of hospital costs helped derive the costs of thecase management approach.
Hospital financing: User fees. Cost analysis is an important ingredient in setting levelsof user fees.
In practice, user fees are guided by additional considerations. Currently, hospital servicesin the public sector are heavily subsidized in almost every country. User fees commonly recoveronly a tenth of hospital costs.
Governments can, and often should, continue to subsidize care at public hospitals. Nevertheless, the calculation of unit costs allows that subsidy to be allocated more rationally. Principles of social welfare policy indicate that subsidies should be granted under the followingconditions. First, if the consumers of a service are poor, so that the subsidy is a kind of in-kindincome transfer to them. Second, if the service is a merit good or public good, so that thegovernment wants consumers to use it. Many primary care services, and especially immunization,fit this second criterion.
The above analysis suggests that there is little rationale for subsidizing amenity servicesprimarily consumed by the well off. Analysis of unit costs will indicate how much they should becharged over the long run.
Hospital Financing: Insurance. A number of developing countries are considering, orstarting to implement systems of national health insurance. For example, Colombia passed ahealth reform law in 1994. Trinidad and Tobago completed a major study, and Ivory Coast isplanning pilot programs. Typically, these systems entail payment by the insurance system to theprovider of care (a hospital or doctor). Unit cost analysis allows an appropriate rate of paymentto be developed.
In countries which allow multiple insurers to emerge, there is some risk that each insurerwill try to pay less than its share of the hospital's overhead. This has been a problem in the UnitedStates, where some insurers have allegedly 'shifted costs' onto others by setting low paymentrates. Measuring unit costs can help sort out these issues, by distinguishing direct costs of anadmission (to be paid by the insurer responsible) from overhead costs (to be prorated acrossinsurers). In principle, the government could prevent cost-shifting by requiring every insurer topay the unit cost of a discharge. In practice, this may be undesirable, as hospitals might lose theirincentive to restrain overhead costs (Ma and McGuire, 1993).

58
REFERENCES
1. Methodology of cost analysisBarnum, Howard and Joseph Kutzin (1993). Public hospitals in developing countries: resourceuse, cost financing. Johns Hopkins University Press: Baltimore, Maryland.
Berman, Howard J. and Lewis Weeks (1974). Financial management of hospitals. HealthAdministration Press: Ann Arbor, Michigan.
Creese, Andrew and David Parker (199x). Cost analysis in primary health care: A training manualfor programme managers. World Health Organization. Publ. no. WHO/SHS/NHP/90.5.
Hanson, Kara and Lucy Gilson (1993). Cost, resource use and financing methodology for basichealth services: a practical manual. UNICEF Bamako Initiative Technical Report Series No. 16.UNICEF: New York.
Over, Mead (1991). Economics for health sector analysis: concepts and cases. World Bank:Washington DC.
RAND Corporation (1992). Unit cost analysis: a manual for facility administrators andpolicymakers. Working draft. Ref: WD-6282-MOH/RI. RAND: Santa Monica.
Young, David W. (1984). Financial control in health care: a managerial perspective. Dow-Jones-Irwin: Homewood, Illinois.
2. Country studies2. Country studiesBamako Initiative Management Unit (1994). Cost, resource use and financing of district healthservices: a study of Otjiwarongo district, Namibia. Bamako Initiative Technical Report Series,No. 22. UNICEF: New York.
Bijlmakers, Leon and Simon Chihanga (1996). District health service costs, resource adequacyand efficiency: a comparison of three districts. UNICEF/ Minsitry of Child Health and Welfare,Government of Zimbabwe.Carrin, Guy and Kodjo Evlo (1995). A methodology for the calculation of health care costs andtheir recovery. World Health Organization: Geneva, Switzerland.Djelloul, Berrached (no date). Hospital specialise en maladies infectieuses d'El-Kettar (Alger). Ministere de la Sante et des Affaires Sociales: Algiers.
Foley, George; Guy Carrin; C. Politi and A. Renner (1995). Financial management and budgetingof health services at Connaught Hospital: A further analysis. World Health Organization: Geneva.[Sierra Leone].
Gambia Ministry of Health/WHO (1995). Cost analysis of the health care sector in the Gambia. WHO: Geneva.
Gill, Llewellyn (1994). Hospital costing study: Princess Margaret Hospital. Health Policy andManagement Unit, Organization of Eastern Caribbean States.

59
Gill, Llewellyn and Alison Percy (1994). Hospital costing study: Glendon Hospital - Montserrat. Health Policy and Management Unit, Organization of Eastern Caribbean States.
Huff-Rousselle, Maggie (1992). Dzongkhag costing study for Tashigang Dzongkhag. Department of Health Services, Ministry of Social Services, Royal Government of Bhutan.
Huff-Rousselle, Maggie (1992). Financial study of Thimphu General Hospital: recurrent costanalysis and selected options for privatization and user fees. Department of Health Services,Ministry of Social Services, Royal Government of Bhutan.
John Snow, Inc. (1990). Papua New Guinea: health sector financing study project. Final Report:Volume II. Hospital cost study. John Snow Inc.: Boston, Massachusetts.
Kutzin, Joseph (1989). Jamaican Hospital restoration project: final report. Project HOPE: ChevyChase, Maryland.
LaForgia, Gerald and Mercy Balarezo (1993). Cost recovery in public sector hospitals inEcuador. Health Financing and Sustainability Technical Note No. 28. Abt Associates: Bethesda,Maryland.
Lewis, Maureen A. (1990). Estimating public hospital costs by measuring resource use: aDominican case. Urban Institute, Washington D.C.
Lewis, Maureen et al. (1995). Measuring public hospital costs: empirical evidence from theDominican Republic. World Bank: Washington, D.C.
Mills, Ann J. (1991). The cost of the district hospital: a case study from Malawi. Population andHuman Resources Dept., World Bank: Washington DC.
Mills, Ann J. (1993). The cost of the district hospital: a case study in Malawi. Bulletin of theWorld Health Organization 71(3-4): 329-339.
Ojo, Kenneth; J. Foley; A. Renner and F.M. Kamara (1995). Cost analysis of health services inSierra Leone. Annex III: A case study of Connaught Hospital and Waterloo Community HealthCenter. World Health Organization: Geneva.
Olave, Manuel and Zulma Montano (1993). Unit cost and financial analysis for the Hospital 12de abril, Bolivia. Health Financing and Sustainability Small Applied Research Report No. 11. Management Sciences for Health: Boston, Massachusetts.
Puglisi, Robert and William J. Bicknell (1990). Functional expenditure analysis: final report forQueen Elizabeth II Hospital, Maseru, Lesotho. Health Policy Institute, Boston University:Boston, Massachusetts. [Includes two diskettes with their step-down analysis: one can beadapted by reader, one is write-protected.]
RAND Corporation (1992). Unit cost analysis: a manual for facility administrators and policymakers. Working draft. Ref: WD-6282-MOH/RI. RAND: Santa Monica. [Indonesia].
Raymond, Susan et al. (1987). Financing and costs of health services in Belize. InternationalResources Group Ltd: Setauket, New York. January.

60
Robertson, Robert; Bernardo Barona and Ricardo Pabon (1977). Hospital cost accounting andanalysis: the case of Candelaria. Journal of Community Health 3(1): 61-79. [Colombia].
Russell, Sharon; Gretchen Gwynne and Michael Trisolini (1988). Health care financing in St.Lucia and costs of Victoria Hospital. State University of New York at Stony Brook: StonyBrook, New York.
Salah, Hassan (1995). Cost analysis for hospital care: Summary output of Alexandria, Suez andBani Suef General Hospitals. Preliminary results 1993-94. Harvard University School of PublicHealth: Boston, Massachusetts. [Egypt].
Shepard, Donald S. (1988). Analysis and recommendations on health financing in Rwanda. Harvard Institute for International Development: Cambridge, Massachusetts.
Telyukov, Alexander (1995). A guide to methodology: Integrated system of cost accounting andanalysis for inpatient care providers, developed and implemented at the Tomsk Oblast TeachingHospital. Abt Associates Inc.: Bethesda, Maryland. [Russia].
Trisolini, Michael G.; Sharon Stanton Russell; Gretchen Gwynne and Dieter K. Zschock (1992). Methods for cost analysis, cost recovery and cost control for a public hospital in a developingcountry: Victoria Hospital, St. Lucia. International Journal of Health Planning andManagement 7: 103-132.
Weaver, Marcia; Holly Wong; Amadou S. Sako et al. (1994). Prospects for reform of hospitalfees in sub-Saharan Africa: A case study of Niamey National Hospital in Niger. Social Scienceand Medicine 38(4): 565-574.
Wong, Holly (1989). Cost analysis of Niamey Hospital. Abt Associates: Bethesda, Maryland. [Niger].
Wong, Holly (1993). Health financing in Tuvalu. Health Financing and Sustainability Project,Technical Report No. 11. Abt Associates: Bethesda, Maryland.
Zaman, Samir (1993). Cost analysis for hospital care: The case of Embaba Hospital, Cairo,Egypt. Health Financing and Sustainability Project, Technical Note No. 32. Abt Associates:Bethesda, Maryland.
3. Other StudiesBuve, A. and Foster, S. (1995). Carrying out a bed census at a district hospital in Zambia. HeathPolicy and Planning 10(4):441-445.
Institute for Health Policy Studies (1996). “The proper function of teaching hospitals withinhealth systems.” WHO/SHS/DHS/96.1. Geneva: World Health Organization and Paris:Flammarion Médecine-Sciences (French version).
Koné, Tiécoura; Silué, Adèle; Agness-Soumahoro, Justine; Bail, Richard N.; Shepard, Donald S. Expenditures on AIDS in Côte d’Ivoire. Presented at: AIDS and Development: the Role of Government. Limelette, Belgium, June 17-19, 1996.
Jamison, D.T., Mosley, W.H., Measham, A.R., Bobadilla J.L., editors. Disease ControlPriorities in Developing Countries. New York: Oxford University Press for the World Bank,1993.

61
Ma, Ching-To Albert and Thomas G. McGuire (1993). Paying for joint costs in health care. Journal of Economics and Management Strategy 2(1): 71-95.
Mann, Jonathan; Tarantola, Daniel, editors. AIDS in the World II. New York: Oxford UniversityPress, 1996.
Shepard, Donald S. Expenditures on HIV/AIDS: levels and determinants – lessons from fivecountries. Presented at: AIDS and Development: the Role of Government. Limelette, Belgium,June 17-19, 1996.
Shepard, Donald S; and Maribel C. Gonzales. A procedure for projecting hospital recurrent costs.Boston: Harvard School of Public Health, Department of Health Policy and Management. Mimeo, 1982.
Shepard, Donald S.; Walsh, J.; Munar, W.; Rose, L.; Guerrero, R.; Cruz, L.F.; Reyes, G.; Price,G.; Solarte, C. “Cost-effectiveness of ambulatory surgery in Cali, Colombia”. Health Policy andPlanning 8(2):136-142, 1993a.
Shepard, Donald S.; Halstead, Scott B. Dengue (with notes on yellow fever and Japaneseencephalitis). In: Disease Control Priorities for Developing Countries, Jamison, D.T.; Mosley,W.H.; and Measham, A.R.., eds. Bobadilla J.L. New York: Oxford University Press for theWorld Bank, pp. 303-320, 1993.
Stansfield, Sally; Shepard; Donald.S. “Acute respiratory infection”. In: Disease Control Prioritiesfor Developing Countries, Jamison, D.T.; Mosley, W.H.; Measham, A.R.; and Bobadilla, J.L.;eds. New York: Oxford University Press for the World Bank, pp. 67-90, 1993.
Stryckman, Benoit and Abdelmajid Tibouti (no date). A comparative analysis of cost, resourceuse and financing of basic health services in sub-Saharan Africa and Asia. UNICEF.
Van Lerberghe, W. and Y. Lafort (1990). “The role of the hospital in the district: delivering orsupporting primary health care?” Current Concerns, SHS Paper No.2. WHO/SHS/CC/90.2.Geneva: World Health Organization.
World Health Organization (1987). Hospitals and health for all. Report of a WHO ExpertCommittee on the Role of Hospitals at the First Referral Level. Technical Report Series No.744. Geneva.
World Health Organization (1992). The hospital in rural and urban districts. Report of a WHOStudy Group on the functions of hospitals at the first referral level. Technical Report SeriesNo.819.Geneva.
Zimbabwe Ministry of Health and Child Welfare. Allocations to provinces and central hospitals. Unpublished. Harare, Zimbabwe, 1994.

62
APPENDIX I: TABLES FOR COMPUTING UNIT COST AT 'HOSPITAL X'
Table A1 Costs by Line Item and Source of Payment
Payment SourceMinistry Drug Total
Line item of Health Donor Agency Cost
Salary Director 10,000 10,000Secretary 5,000 5,000Handyman 1,000 1,000Cleaner 1,000 1,000Pharmacist 5,000 5,000Physician 1 6,000 6,000Physician 2 6,000 6,000Physician 3 6,000 6,000Nurse 1 5,000 5,000Nurse 2 5,000 5,000Nurse 3 5,000 5,000Auxiliary 3,000 3,000
Drugs 20,000 20,000Cleaning supplies 10,000 10,000Other supplies 8,000 4,000 12,000
Total 70,000 10,000 20,000 100,000
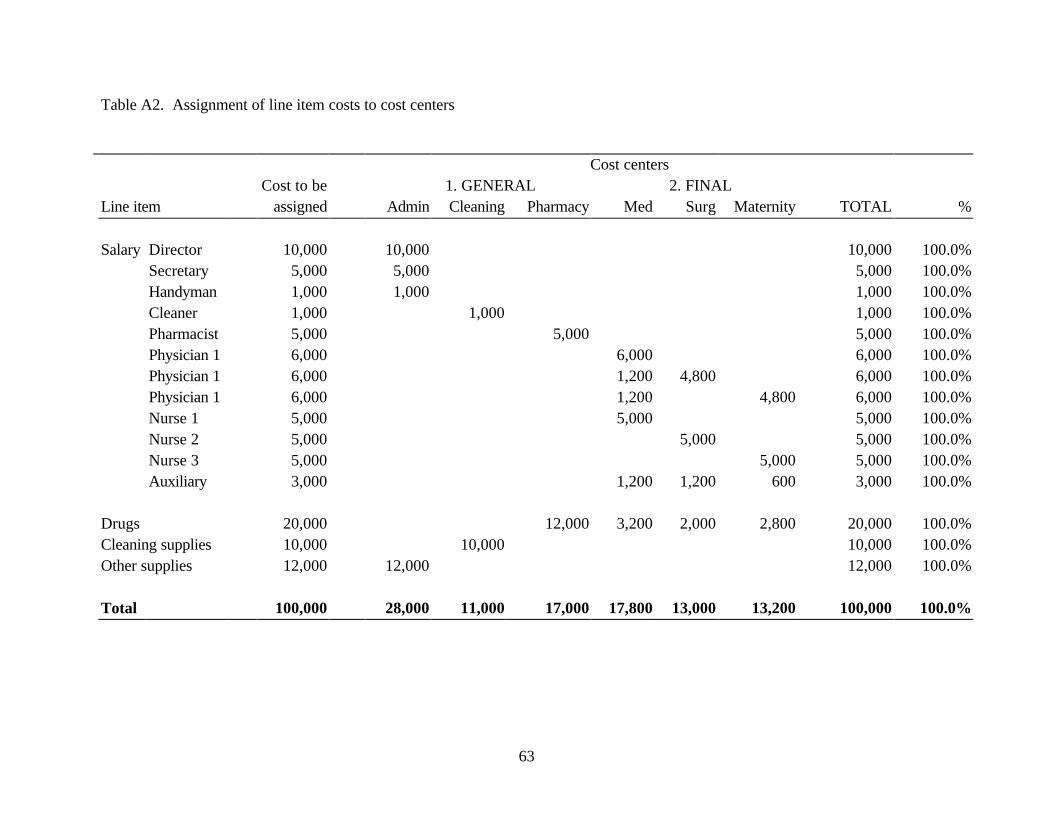
63
Table A2. Assignment of line item costs to cost centers
Cost centersCost to be 1. GENERAL 2. FINAL
Line item assigned Admin Cleaning Pharmacy Med Surg Maternity TOTAL %
Salary Director 10,000 10,000 10,000 100.0%Secretary 5,000 5,000 5,000 100.0%Handyman 1,000 1,000 1,000 100.0%Cleaner 1,000 1,000 1,000 100.0%Pharmacist 5,000 5,000 5,000 100.0%Physician 1 6,000 6,000 6,000 100.0%Physician 1 6,000 1,200 4,800 6,000 100.0%Physician 1 6,000 1,200 4,800 6,000 100.0%Nurse 1 5,000 5,000 5,000 100.0%Nurse 2 5,000 5,000 5,000 100.0%Nurse 3 5,000 5,000 5,000 100.0%Auxiliary 3,000 1,200 1,200 600 3,000 100.0%
Drugs 20,000 12,000 3,200 2,000 2,800 20,000 100.0%Cleaning supplies 10,000 10,000 10,000 100.0%Other supplies 12,000 12,000 12,000 100.0%
Total 100,000 28,000 11,000 17,000 17,800 13,000 13,200 100,000 100.0%
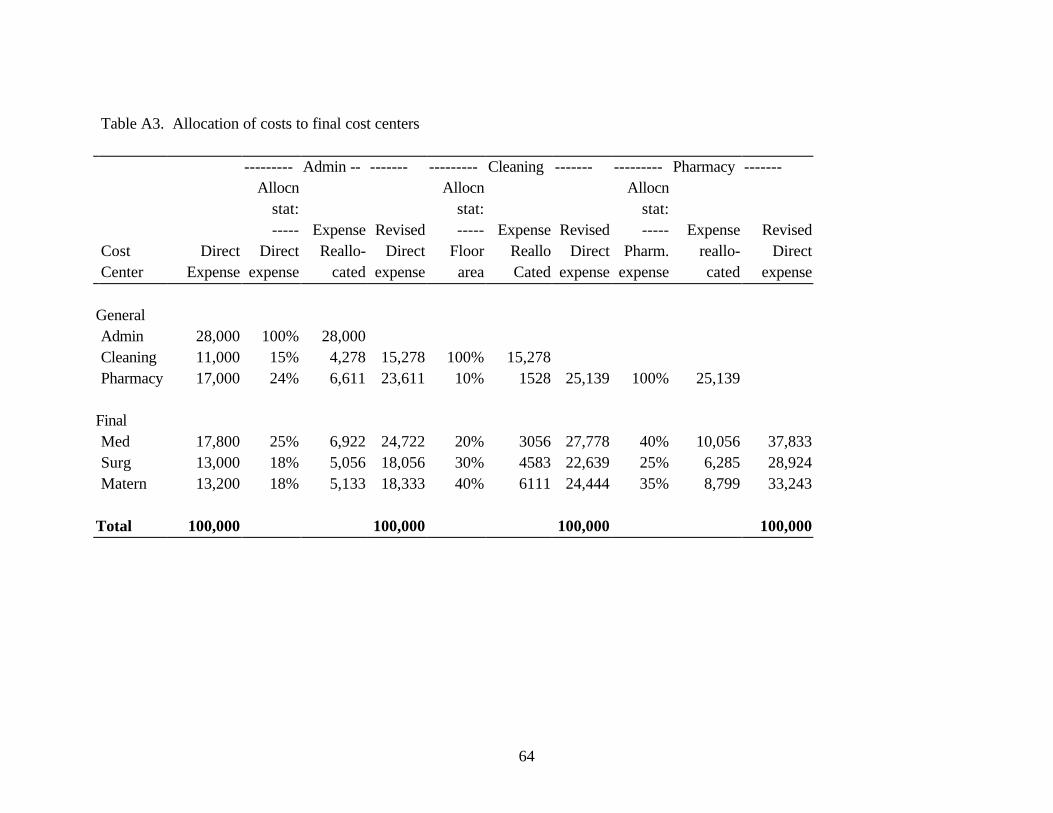
64
Table A3. Allocation of costs to final cost centers
--------- Admin -- ------- --------- Cleaning ------- --------- Pharmacy -------Allocn Allocn Allocn
stat: stat: stat:----- Expense Revised ----- Expense Revised ----- Expense Revised
Cost Direct Direct Reallo- Direct Floor Reallo Direct Pharm. reallo- DirectCenter Expense expense cated expense area Cated expense expense cated expense
GeneralAdmin 28,000 100% 28,000Cleaning 11,000 15% 4,278 15,278 100% 15,278Pharmacy 17,000 24% 6,611 23,611 10% 1528 25,139 100% 25,139
FinalMed 17,800 25% 6,922 24,722 20% 3056 27,778 40% 10,056 37,833Surg 13,000 18% 5,056 18,056 30% 4583 22,639 25% 6,285 28,924Matern 13,200 18% 5,133 18,333 40% 6111 24,444 35% 8,799 33,243
Total 100,000 100,000 100,000 100,000
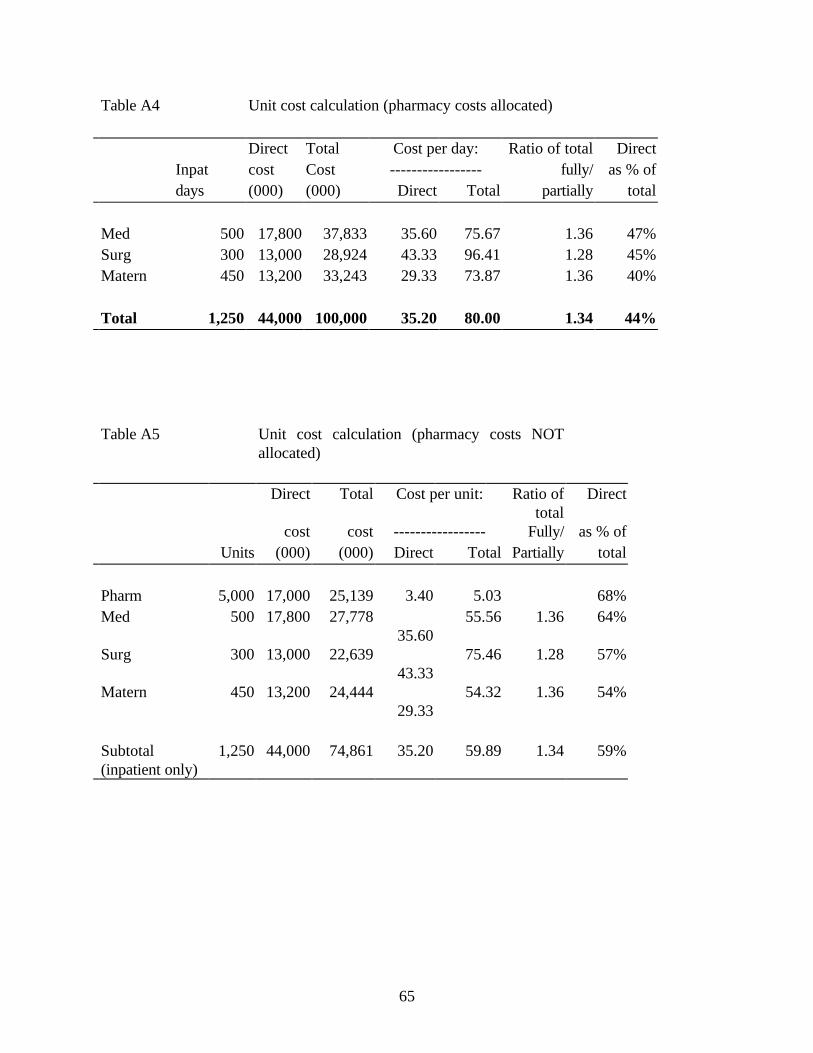
65
Table A4 Unit cost calculation (pharmacy costs allocated)
Direct Total Cost per day: Ratio of total DirectInpat cost Cost ----------------- fully/ as % ofdays (000) (000) Direct Total partially total
Med 500 17,800 37,833 35.60 75.67 1.36 47%Surg 300 13,000 28,924 43.33 96.41 1.28 45%Matern 450 13,200 33,243 29.33 73.87 1.36 40%
Total 1,250 44,000 100,000 35.20 80.00 1.34 44%
Table A5 Unit cost calculation (pharmacy costs NOTallocated)
Direct Total Cost per unit: Ratio oftotal
Direct
cost cost ----------------- Fully/ as % ofUnits (000) (000) Direct Total Partially total
Pharm 5,000 17,000 25,139 3.40 5.03 68%Med 500 17,800 27,778
35.60 55.56 1.36 64%
Surg 300 13,000 22,639 43.33
75.46 1.28 57%
Matern 450 13,200 24,444 29.33
54.32 1.36 54%
Subtotal(inpatient only)
1,250 44,000 74,861 35.20 59.89 1.34 59%

66
APPENDIX II: STEP-DOWN ALLOCATION USING DIRECT COST
A more rough-and-ready approach to cost analysis is to allocate indirect costs based oneach department's percentage share of direct costs. This approach is commonly taken forassigning costs of the hospital's administration, and occasionally used for most overhead costs (forexample, in Kutzin's Jamaica study). This approach is substantially simpler than the detailed step-down, and does not require information about floor area, bed days etc. One can thereforelegitimately ask: how inaccurate is a 'crude' allocation based on direct costs only? Does itintroduce systematic biases which can be offset by the use of 'fudge' (or adjustment) factors? Forexample, if prior studies show that the direct-cost approach typically overstates unit cost ofinpatient wards by 20%, one would know to deflate unit costs by that amount when using themethod.
To compare the direct-cost method with more sophisticated approaches, we reanalyzeddata from previous step-down studies. In those studies where it was possible to do so, wecomputed a revised unit cost using the direct-cost method. We then compared the results weobtained with those reported in each original study. Table 3 presents the comparison of the twomethods, by study and by department. The comparison is expressed as a ratio of unit costs bymethod. For example, an entry of 1.4 indicates that unit costs appear 40% higher using thedirect-cost method, compared to the method used by the study authors.
Table 4 summaries results across the 12 studies we reanalyzed. The results confirm thatthe direct-cost method tends to understate unit costs for inpatient care (in 10 out of 12 studies)and overstate costs for outpatient care (at least in studies where ancillary costs centers wereallocated). The discrepancy occurs because inpatient wards use a lot of certain costly indirectresources such as kitchen and laundry, beyond the share one would predict based on direct cost. Equivalently, outpatient services use a relatively low share of these resources. An exception tothe pattern is the operating theater, where the direct-cost method overstates unit costs(presumably because most of the theater's costs were easy to assign before the step-downallocation, leaving it a small share of indirect cost).
However, the results across studies differ substantially, especially at the level of individualwards. It is not clear what would be a reasonable adjustment factor for pediatrics, when thedirect-cost method can lead one to a unit cost which is 30% too high or 36% too low, dependingon the study. This variation may be because the studies differed in many respects which could notbe controlled for, including the specific step-down approach that they used originally and the typeof costs allocated. As a method for allocating costs, this approach should probably be a lastresort, to use only when other data are not available for allocating indirect costs. On the otherhand, it is a useful exercise to compute allocation using both methods and compare the results. Suppose one ward has much higher costs using the direct-cost approach than using step-down. Investigating the reason for this may help you understand the sources of cost differences acrosswards, e.g. which wards use a lot of kitchen or laundry services.
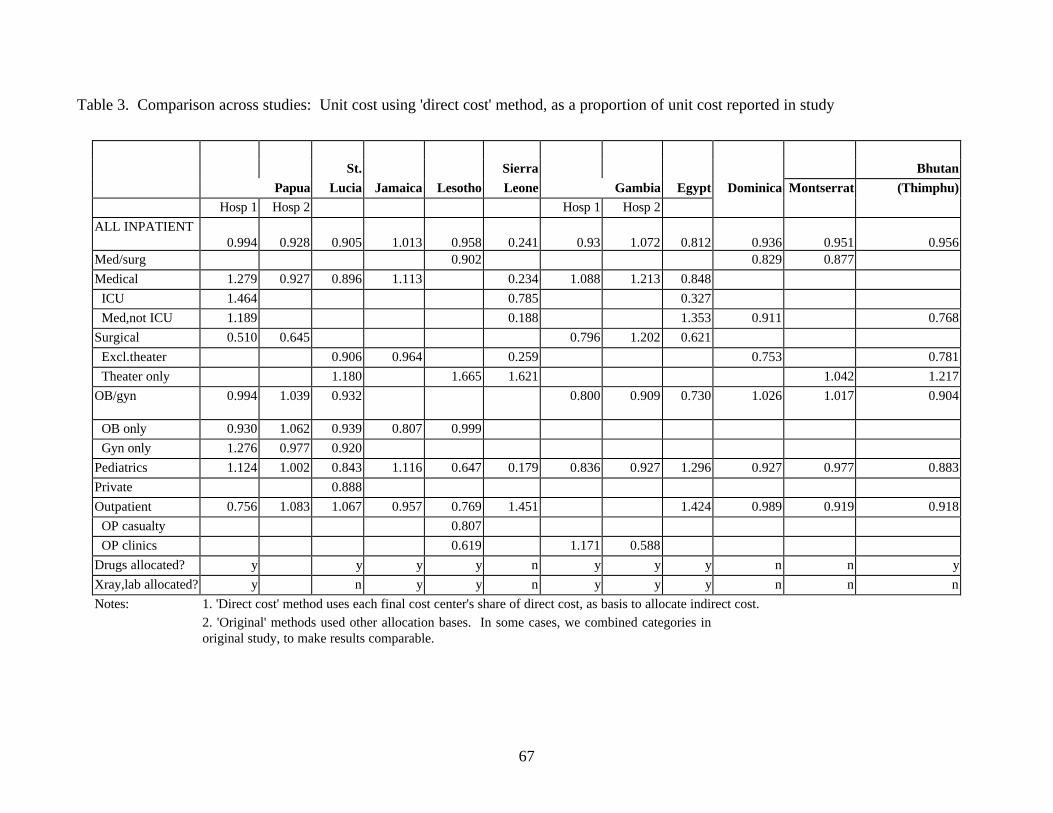
67
Table 3. Comparison across studies: Unit cost using 'direct cost' method, as a proportion of unit cost reported in study
St. Sierra Bhutan
Papua Lucia Jamaica Lesotho Leone Gambia Egypt Dominica Montserrat (Thimphu)Hosp 1 Hosp 2 Hosp 1 Hosp 2
ALL INPATIENT0.994 0.928 0.905 1.013 0.958 0.241 0.93 1.072 0.812 0.936 0.951 0.956
Med/surg 0.902 0.829 0.877
Medical 1.279 0.927 0.896 1.113 0.234 1.088 1.213 0.848
ICU 1.464 0.785 0.327
Med,not ICU 1.189 0.188 1.353 0.911 0.768
Surgical 0.510 0.645 0.796 1.202 0.621
Excl.theater 0.906 0.964 0.259 0.753 0.781
Theater only 1.180 1.665 1.621 1.042 1.217
OB/gyn 0.994 1.039 0.932 0.800 0.909 0.730 1.026 1.017 0.904
OB only 0.930 1.062 0.939 0.807 0.999
Gyn only 1.276 0.977 0.920
Pediatrics 1.124 1.002 0.843 1.116 0.647 0.179 0.836 0.927 1.296 0.927 0.977 0.883
Private 0.888
Outpatient 0.756 1.083 1.067 0.957 0.769 1.451 1.424 0.989 0.919 0.918
OP casualty 0.807
OP clinics 0.619 1.171 0.588
Drugs allocated? y y y y n y y y n n y
Xray,lab allocated? y n y y n y y y n n n
Notes: 1. 'Direct cost' method uses each final cost center's share of direct cost, as basis to allocate indirect cost.2. 'Original' methods used other allocation bases. In some cases, we combined categories inoriginal study, to make results comparable.
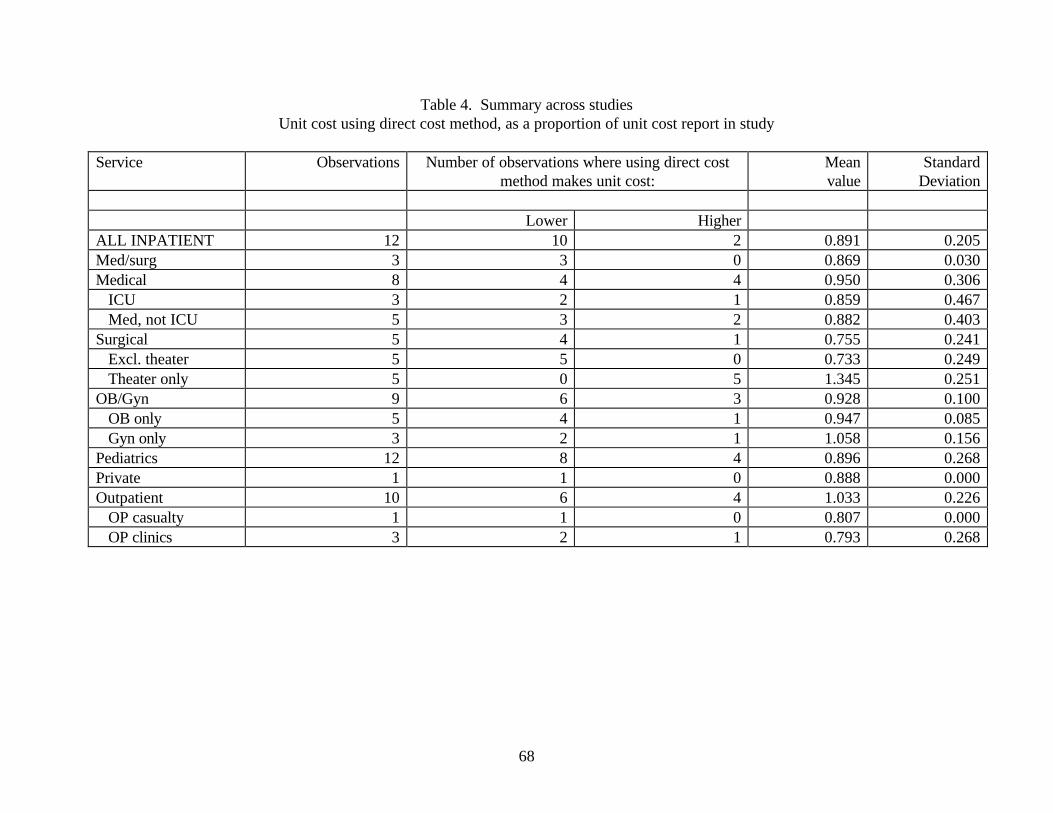
68
Table 4. Summary across studiesUnit cost using direct cost method, as a proportion of unit cost report in study
Service Observations Number of observations where using direct costmethod makes unit cost:
Meanvalue
StandardDeviation
Lower HigherALL INPATIENT 12 10 2 0.891 0.205Med/surg 3 3 0 0.869 0.030Medical 8 4 4 0.950 0.306 ICU 3 2 1 0.859 0.467 Med, not ICU 5 3 2 0.882 0.403Surgical 5 4 1 0.755 0.241 Excl. theater 5 5 0 0.733 0.249 Theater only 5 0 5 1.345 0.251OB/Gyn 9 6 3 0.928 0.100 OB only 5 4 1 0.947 0.085 Gyn only 3 2 1 1.058 0.156Pediatrics 12 8 4 0.896 0.268Private 1 1 0 0.888 0.000Outpatient 10 6 4 1.033 0.226 OP casualty 1 1 0 0.807 0.000 OP clinics 3 2 1 0.793 0.268

69
APPENDIX III: EXAMPLES OF STUDY SUMMARY SHEETSCountry: LesothoCode: 24Study: Functional expenditure analysis: Final report for Queen Elizabeth II Hospital, Maseru,Lesotho, 2 volumes: Final report, and Manual for usersAuthors: Puglisi, Robert and William J. BicknellYear: 1990Hospitals studied: 1 hospital: the national referral hospital.
1. Choice of final cost centers Unit of output:Medical/surgical, B. pediatric wards DayTheater (major/ intermediate/ minor) CaseClinics (onsite/satellite), dental, casualty VisitAggregate inpatient DayAggregate outpatient Visit
2. Choice of cost centers 29 (10 direct, 5 ancillary, 8 support, 6 administrative) (p. 8) Criteria:identified in discussions with officials (p.2)
3. Identification of full cost for each inputStarted with budgetary allocations from ministry of health. Where possible, subtracted spendingon public health functions. Travel: had to subtract travel costs for patients from line item: onlywanted staff travel costs (p.2). Lab: National Lab does 97 % of its work for this hospital, but isnot in budget. It was added in. Salaries: The authors could not get individual salary data, so theyused 'personnel emoluments' list. I.e., looks like they assumed each person was paid according tothe government pay scale for that position (p.5). Capital: not discussed.
4. Allocation of inputs to cost centersCommunication, printing, overhead: allocated to administration.Staff: allocated based on asking each department head about staffers' time allocations (p.5).Travel: vehicle hire, mileage allocated among satellite clinics/ public health/ administration basedon estimates by department head.Power, maintenance: allocated based on % of personnel costsDrugs: all allocated to pharmacyDressings: 60% to inpatient, then within that, based on % of patient daysFurniture, equipment: allocated to the service using the equipment.
5. Allocation of cost centers to output centers5(a): allocation of support services, administration to ancillaries, patient care: (p.8-10)Personnel costs: used to allocate accounts, personnel, stores, other administrationInpatient days: used to allocate laundry, portering among inpatient departments after allocating10% to OP5(b): allocation of ancillaries to direct patient care (p.11) Pharmacy: 60% to inpatient, thenallocated among wards based on patient days. X-ray, lab: 40% to inpatient, then allocated among

70
wards based on patient days. Physiotherapy, orthopedics similar approach. All based ondiscussion with department heads.
6. Computing total and unit cost for each final cost centerProblem with utilization data: patient day statistics not kept (p.R10). Instead, assumed 100%utilization of capacity (430 beds: p. 10). Need to do midnight census. Also no data on number ofprescriptions filled (p. 10).
7. FindingsResults presented with and without allocation of ancillaries.

71
Country: EcuadorCode: 28Study: Cost recovery in public sector hospitals in EcuadorAuthors: Gerard M. La Forgia, Mercy BalarezoYear 1993Hospitals studied: 6 hospitals (4 government, 2 'charity')
1. Choice of final output centers Unit of output:Inpatient daySurgery operation?Lab/path/ xray/ sonography examCardiology cardiogram, encephalogramOutpatient, emergency, physiotherapy visit
2. Choice of cost centers study names 12 indirect and 10 final, implying 22
3. Identification of full cost for each input
Salaries: Each facility's payroll department provided number of employees, actual salaries (p.87).This study did not count personnel vacancies as a cost, so subtracted them from hospital accounts(which did) Drugs/ supplies: Facilities didn't keep records of spending. Instead, used recordskept by central stores and pharmacies. These were quantities, so had to obtain prices frompurchasing departments. Services: taken from accounting ledgers - included utilities and servicecontracts (p.88) Capital: Excluded. Recurrent cost only, due to lack of information on capitalspending (p.18) Other: The authors discuss why their cost estimates differ from budgetedspending (p. 20)
4. Allocation of inputs to cost centersStaff: Assigned based on information supplied by personnel departments, and interviews withstaff from each department (p.87).Drugs, supplies: The records kept by central stores and pharmacies identified the receivingdepartment/ward at eachfacility. Six-month samples of these were used to estimate distribution overall. (p.88)
5. Allocation of cost centers to output centersNB: allocation done using double apportionment, not step-down (p.19,89). Allocation roles onp.88.Floor area: was not available, otherwise would have used this to allocate plant operations,cleaning + maintenance (p.89).Inpatient days: used to allocate kitchen, but so was staffing. Reason: employees get free meals.Inpatient admissions:Staff: used to allocate general administration, maintenance, plant operations, cleaningKilos washed: used to allocate laundryestimated actual use: Used to allocate pharmacy, central stores

72
6. Computing total and unit cost for each output center No mention of problems withutilization data.
7. FindingsUnit costs are not discussed specifically in the text - only in relation to the percent recovered.Data show more than a twofold variation in unit costs of inpatient care (from $925 to $2253).

73
APPENDIX IV. TABLE OF ANNUALIZATION FACTORS
UsefulLife
Discount rate
(years) 0% 1% 2% 3% 4% 5% 6% 7% 8% 9% 10% 11% 12% 13% 14% 15% 16% 17% 18% 19% 20%
1 1 0.990 0.980 0.971 0.962 0.952 0.943 0.935 0.926 0.917 0.909 0.901 0.893 0.885 0.877 0.870 0.862 0.855 0.847 0.840 0.8332 2 1.970 1.942 1.913 1.886 1.859 1.833 1.808 1.783 1.759 1.736 1.713 1.690 1.668 1.647 1.626 1.605 1.585 1.566 1.547 1.5283 3 2.941 2.884 2.829 2.775 2.723 2.673 2.624 2.577 2.531 2.487 2.444 2.402 2.361 2.322 2.283 2.246 2.210 2.174 2.140 2.1064 4 3.902 3.808 3.717 3.630 3.546 3.465 3.387 3.312 3.240 3.170 3.102 3.037 2.974 2.914 2.855 2.798 2.743 2.690 2.639 2.5895 5 4.853 4.713 4.580 4.452 4.329 4.212 4.100 3.993 3.890 3.791 3.696 3.605 3.517 3.433 3.352 3.274 3.199 3.127 3.058 2.9916 6 5.795 5.601 5.417 5.242 5.076 4.917 4.767 4.623 4.486 4.355 4.231 4.111 3.998 3.889 3.784 3.685 3.589 3.498 3.410 3.3267 7 6.728 6.472 6.230 6.002 5.786 5.582 5.389 5.206 5.033 4.868 4.712 4.564 4.423 4.288 4.160 4.039 3.922 3.812 3.706 3.6058 8 7.652 7.325 7.020 6.733 6.463 6.210 5.971 5.747 5.535 5.335 5.146 4.968 4.799 4.639 4.487 4.344 4.207 4.078 3.954 3.8379 9 8.566 8.162 7.786 7.435 7.108 6.802 6.515 6.247 5.995 5.759 5.537 5.328 5.132 4.946 4.772 4.607 4.451 4.303 4.163 4.03110 10 9.471 8.983 8.530 8.111 7.722 7.360 7.024 6.710 6.418 6.145 5.889 5.650 5.426 5.216 5.019 4.833 4.659 4.494 4.339 4.19211 11 10.368 9.787 9.253 8.760 8.306 7.887 7.499 7.139 6.805 6.495 6.207 5.938 5.687 5.453 5.234 5.029 4.836 4.656 4.486 4.32712 12 11.255 10.575 9.954 9.385 8.863 8.384 7.943 7.536 7.161 6.814 6.492 6.194 5.918 5.660 5.421 5.197 4.988 4.793 4.611 4.43913 13 12.134 11.348 10.635 9.986 9.394 8.853 8.358 7.904 7.487 7.103 6.750 6.424 6.122 5.842 5.583 5.342 5.118 4.910 4.715 4.53314 14 13.004 12.106 11.296 10.563 9.899 9.295 8.745 8.244 7.786 7.367 6.982 6.628 6.302 6.002 5.724 5.468 5.229 5.008 4.802 4.61115 15 13.865 12.849 11.938 11.118 10.380 9.712 9.108 8.559 8.061 7.606 7.191 6.811 6.462 6.142 5.847 5.575 5.324 5.092 4.876 4.67516 16 14.718 13.578 12.561 11.652 10.838 10.106 9.447 8.851 8.313 7.824 7.379 6.974 6.604 6.265 5.954 5.668 5.405 5.162 4.938 4.73017 17 15.562 14.292 13.166 12.166 11.274 10.477 9.763 9.122 8.544 8.022 7.549 7.120 6.729 6.373 6.047 5.749 5.475 5.222 4.990 4.77518 18 16.398 14.992 13.754 12.659 11.690 10.828 10.059 9.372 8.756 8.201 7.702 7.250 6.840 6.467 6.128 5.818 5.534 5.273 5.033 4.81219 19 17.226 15.678 14.324 13.134 12.085 11.158 10.336 9.604 8.950 8.365 7.839 7.366 6.938 6.550 6.198 5.877 5.584 5.316 5.070 4.84320 20 18.046 16.351 14.877 13.590 12.462 11.470 10.594 9.818 9.129 8.514 7.963 7.469 7.025 6.623 6.259 5.929 5.628 5.353 5.101 4.87021 21 18.857 17.011 15.415 14.029 12.821 11.764 10.836 10.017 9.292 8.649 8.075 7.562 7.102 6.687 6.312 5.973 5.665 5.384 5.127 4.89122 22 19.660 17.658 15.937 14.451 13.163 12.042 11.061 10.201 9.442 8.772 8.176 7.645 7.170 6.743 6.359 6.011 5.696 5.410 5.149 4.90923 23 20.456 18.292 16.444 14.857 13.489 12.303 11.272 10.371 9.580 8.883 8.266 7.718 7.230 6.792 6.399 6.044 5.723 5.432 5.167 4.92524 24 21.243 18.914 16.936 15.247 13.799 12.550 11.469 10.529 9.707 8.985 8.348 7.784 7.283 6.835 6.434 6.073 5.746 5.451 5.182 4.93725 25 22.023 19.523 17.413 15.622 14.094 12.783 11.654 10.675 9.823 9.077 8.422 7.843 7.330 6.873 6.464 6.097 5.766 5.467 5.195 4.94826 26 22.795 20.121 17.877 15.983 14.375 13.003 11.826 10.810 9.929 9.161 8.488 7.896 7.372 6.906 6.491 6.118 5.783 5.480 5.206 4.95627 27 23.560 20.707 18.327 16.330 14.643 13.211 11.987 10.935 10.027 9.237 8.548 7.943 7.409 6.935 6.514 6.136 5.798 5.492 5.215 4.96428 28 24.316 21.281 18.764 16.663 14.898 13.406 12.137 11.051 10.116 9.307 8.602 7.984 7.441 6.961 6.534 6.152 5.810 5.502 5.223 4.97029 29 25.066 21.844 19.188 16.984 15.141 13.591 12.278 11.158 10.198 9.370 8.650 8.022 7.470 6.983 6.551 6.166 5.820 5.510 5.229 4.97530 30 25.808 22.396 19.600 17.292 15.372 13.765 12.409 11.258 10.274 9.427 8.694 8.055 7.496 7.003 6.566 6.177 5.829 5.517 5.235 4.979
74
APPENDIX V. EXERCISES*
PART 1. A DISTRICT HOSPITAL IN BANGLADESH
Note: This exercise applies the principles of cost analysis and income analysis at the levelof an individual hospital, providing the reader with an opportunity to calculate unit costs andpractice other skills in chapters 2 and 3.
A typical district hospital in Bangladesh has 50 beds and 74 staff (14 physicians, 26 nurses,15 technicians and skilled staff, and 19 unskilled support staff). This type of hospital has threepatient care cost centers -- Inpatient Wards, Theatre (for surgical operations), and the OutpatientDepartment (for both clinics and casualty services). Four intermediate cost centers were used –Ambulance, X-ray, Pharmacy, and Laboratory. Because of the simplicity of the hospital, only oneoverhead cost center was defined – administration; it subsumes other support functions such assecurity, cleaning, and maintenance.
Exhibit 1 shows how the cost of hospital personnel by cost center based on how theyspent their time. The average annual 1996 salary for each staff position and benefits, rather thanthe individual salaries at a specific hospital, were used to estimate personnel costs. The exchangerate was 40 Taka (Tk) equal to US $1.00. The average annual cost (including benefits amountingto 60% of base salaries) per staff are: 89,000 Tk ($2,225) per physician, 46,000 Tk ($1150) pernurse, 44,000 Tk ($1100) per technician or administrative staff, 23,000 Tk ($575) per unskilledsupport staff member, and 48,000 Tk ($1,200) per staff member overall. Non personnel andcapital costs incurred in a patient care or intermediate cost center were assigned to that costcenter, while all other costs (general maintenance and the annualized capital cost of the buildingsand furnishings) were assigned to administration. Exhibit 1 shows the annual costs of this hospitalby cost center. The total of about 5.2 million Taka is equivalent to US $131,222. Ambulanceoperations and “other” expenses, including utilities, are high shares of expenses because of theirhigh import content in relation to patient care cost centers.
Exercise 1. Compute the total cost of each cost center, by completing all of the blankcells in Exhibit 1.
Hint: As overhead costs represent only about a quarter of the total hospital’s cost andcomprise a range of overhead services, administrators felt that overhead costs could be assigned
* The authors gratefully acknowledge assistance from Prof. James Killingsworth, Mr. Kawnineand Ms. Tahmina Begum of the Bangladesh Health Economics Unit, feedback from facilitatorsand participants in the Workshops on Hospital Costing in Dhaka, Bangladesh on May 26-28,1997. They also benefited from feedback from Tom Zigora, Freckson Ropi, and Ashley Ghiseweand participants at a workshop on hospital costing in Harare, Zimbabwe, on October 23-24, 1997.They also appreciated the financial support from the British Department of Finance forInternational Development, the WHO representatives in Bangladesh and Zimbabwe, and WHOheadquarters, Geneva, in the development and testing of these exercises.

75
proportional to the direct costs of the final (intermediate and patient care) cost centers. Thus, usethe direct cost of each final cost center as the allocation statistic. The total of the allocationstatistics is all costs except overhead. The allocation percentages are based on this total. Thetotal costs of each final cost center are the sum of its direct and allocated costs. As a check, thetotal costs should equal (except for possible rounding error) the sum of the overhead costs plusthe direct costs of each cost center.
Exercise 2. Compute the unit cost of each final cost center, a target fee for a typical unitof service by that cost center, and the potential revenue generated by that cost center bycompleting the blank cells in Exhibit 2. Note: Based on section 3.4, the target fee is thepercentage of the average unit cost met by the fee in a paying patient. The percentage ofpatients charged (or paying) is the share of patients not exempted. The collection efficiency isthe share of fees imposed that are actually collected from patients and officially remitted to thehospital.
Hint: The hospital administration sets the fee in each cost center equal to the target feepercentage of the unit cost. However, only a share of patients is actually charged the set fee, withthe remaining ones being exempted due to poverty or other privileged categories (e.g. schoolchildren, or disabled war veterans). These two sets of percentages were based on relativeimportance, elasticity of demand, affordability, and acceptability of each type of fee. Theefficiency of collection is greatest when only a few providers can dispense a given service in alimited location, and when the service is generally provided on an elective basis. The unit cost isthe total cost divided by the volume. The target fee is the unit cost times the target feepercentage. The total revenue from each cost center is the product of the volume for servicetimes its target fee times the percentage of patients charged times the collection efficiency.
Exercise 3. The hospital needs to recover a quarter of its total costs from user fees. Determine whether the assumptions above will meet this target, or if not, suggest an alternativeset of values that will. Hint: add the revenues from each final cost center in exhibit 2 andcompare the sum to the total costs of the hospital. Raising any of the percentages will raise thetotal; lowering any will lower the total. The impact will be greater by changing the percentageson the larger sources of revenue.
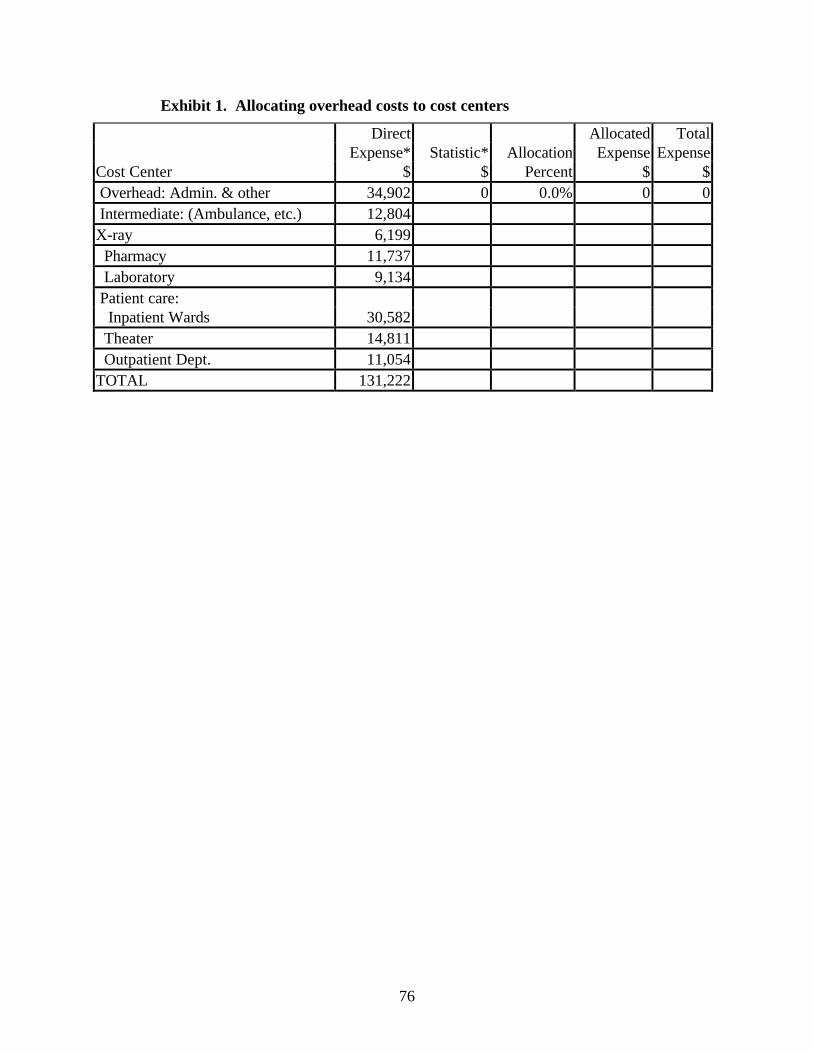
76
Exhibit 1. Allocating overhead costs to cost centers
Direct Allocated TotalExpense* Statistic* Allocation Expense Expense
Cost Center $ $ Percent $ $ Overhead: Admin. & other 34,902 0 0.0% 0 0 Intermediate: (Ambulance, etc.) 12,804X-ray 6,199 Pharmacy 11,737 Laboratory 9,134 Patient care: Inpatient Wards 30,582 Theater 14,811 Outpatient Dept. 11,054TOTAL 131,222

77
Exhibit 2. Calculating unit costs and potential cost recoveryTotal Vol- Unit Target Target Patients Collection Potential
Final expense ume Cost Fee fee charged Efficiency RevenueCost Center $ 000 Units $ (%) $ % % Tk 000Intermediate Ambulance 17,443 20 Kilometers 60% 90% 80% X-ray 8,445 4 Films 60% 80% 90% Pharmacy 15,989 30 Scripts 75% 60% 90% Laboratory 12,444 50 Tests 50% 80% 90%Patient care: Inpatient Wards 41,663 15 Days 30% 70% 70% Theater 20,178 2 Operations 20% 80% 80%Outpatient Dept. 15,060 20 Visits 60% 70% 80%TOTAL 131,222

78
PART 2: BUY OR MAKE LAUNDRY SERVICES
Note: This case compares internal production (with either owned or leased equipment) andoutsourcing of laundry services.
As a hospital administrator, you are constantly challenged to deliver quality servicesefficiently. This objective includes deciding when to make a capital expenditure (i.e., oneexpected to provide benefits for longer than one year). Such a situation has arisen in the laundrydepartment.
Your major piece of equipment in this department has become more and more obsolete tothe point that you never know when it will be working. Linen is often not clean as it should be. Employee uniforms are embarrassing. Working conditions are deplorable, and current space istoo small to house new or old equipment. Laundry employees are disgruntled because of theseconditions; they take great pride in their work. You know that some neighboring hospitals havecontracted out their laundry services. Some hospitals have been pleased while others are doubtfulof the long-term benefits.
The current equipment is completely depreciated and outmoded. The capital cost ofrefurbishing the laundry would be as follows:
Refurbish Area $30,000New Equipment 65,000Total Capital Cost $95,000
The expected life of the equipment and renovation is assumed to be twenty years. The inflationrate is 7%, the real interest rate is 3%, and the nominal interest rate is about 10%. In addition, arural hospital in the next town is willing to buy the outmoded equipment for $2,000 as a back upto its washing machine.
Currently, the variable cost per kilogram (for soap, water, utilities, and direct labor) is US$ 0.03 per kilogram, and your hospital processes 300,000 kilograms of laundry per year. Yourannual fixed operating costs are:
Maintenance $1,400Administrative Salaries 8,000
Total Fixed Costs $9,400
A company with 3 years of experience has indicated that it would collect the laundry,wash at its own off-site facility, and return it for $.06 per kilogram (rising annually with inflation),if it were to get the contract. In-house administrative oversight of a contract would cost yourhospital $2,000. Alternatively, the company is willing to refurbish the space and lease theequipment to the hospital at $10,000 per year--renewable annually for up to 20 years with theannual lease payment rising at the rate of inflation. The hospital would be responsible for allvariable costs and maintenance.

79
Exercise 4:a. Given this information, identify the three options contained in the description above.b. For each option, estimate the capital, operating (both fixed and variable), and total costs.c. Choose the “best option” in terms of the lowest annualized costs.d. Discuss other features of the best option (e.g. flexibility, future cost expectations, and
reliability).e. Identify at least one more option, not mentioned above, which could also be considered.
Answer:a. Failure to make the needed investment would mean a discontinued service. Care shouldbe exercised in identifying the alternatives. In this case, the three options for the hospitaladministrator are to maintain the laundry department as an in-house service with purchased newequipment, to contract an outside company to perform this service, or to lease the equipment.
b. First, we note that all three of the options involve a one-time income of $2000 from thesale of the depreciated laundry equipment. We then examine the costs of each these alternativesin the order above. We present below the first year costs, recognizing that they will rise by therate of inflation.
i. The capital cost of refurbishing and equipping a new laundry facility is estimated tobe $95,000. We annualize this amount using the procedures in Box 2.1. Using 3% as thereal interest rate, the annualization factor is 14.877. With an inflation rate of 7 %, thereplacement capital cost of the project at the end of the first year would be $101,650(derived as $95,000 x 1.07). The annualized capital cost is $6,833 (derived as $101,650÷14.877). Using the information above, total variable and fixed costs are:
Variable costs $ 9,000Fixed costs/year
Annualized capital cost 6,833Maintenance and space costs 1,400Administrative salaries 8,000
Total Fixed and Variable Costs $25,233The net first year cost of the in-house option is $23,233 ($25,233 less the one-time
income of $2,000 from selling the equipment). The second year cost is $26,999 (derivedas $25,233 x 1.07). We assume that operating costs rise with inflation, and our method ofannualizing the capital costs gives values that also rise with inflation.
ii. The next step in the analysis is to determine the cost of the second option, that is,to outsource or contract a company to do the laundry services for the hospital. Using theprice quote from a company of $.06 per kilogram, the cost of the second option is:Contract fee: $0.06 x 300,000 kilograms of laundry $18,000Plus: In-house administrative oversight of contract 2,000Total cost of contract $20,000

80
The net first year cost of the contract option is $18,000 ($20,000 less the one-timeincome of $2,000 from selling the equipment). The second year cost is $21,400 (derivedas $20,000 x 1.07), as the price in the renewable contract will rise with inflation.
iii. The leased equipment would entail:Variable costs $ 9,000Fixed costs/year
Lease payment 10,000Maintenance and space costs 1,400Administrative salaries 8,000
Total Fixed and Variable Costs $28,400
The net first year cost of the lease option is $26,400 ($28,400 less the one-timeincome of $2,000 from selling the equipment). The second year cost is $30,388 (derivedas $28,400 x 1.07), as the lease fee and other costs will rise with inflation.
c. The first-year costs of the three options can now be compared: $23,233 (in-houseoption), $18,000 (contract option), and $26,400 (lease option). The second costs have the samerelationship, without the one-time income. The hospital administrator would then choose theleast cost option of contracting ($18,000). The lease option is most expensive in this example. The private contractor might face higher costs of capital, or be more risk averse, than the hospital. The cost of each of these options, as we have computed it, would rise at the annual rate ofinflation (7% per year).
d. The contract option provides flexibility for the hospital in the case that laundry or spaceneeds change. A contract laundry might achieve efficiencies through more productive staff, bettermanagement, economies of scale through larger equipment, better use of plant and equipmentthrough multiple shifts, or lower labor costs. One liability with this approach is the risk iftransport were interrupted, whether by vehicle malfunction, weather, civil disturbance, or war. Ifthis were a significant risk, the in-house option might be necessary (as it so proved to a hospitaladministrator in wartime Beruit who analyzed this same situation). Alternatively, additionalinventory and storage might provide an alternative way of ensuring adequate laundry even iftransportation were disrupted. Financing the in-house option might pose a significant challengefor the hospital. Although the hospital might have some capital reserves, public hospitals wouldusually need special approval for this type of capital expenditures.
e. Other options are to share laundry services with one or more hospitals, based either atyour hospital or another, to buy used equipment, or to see whether some limited refurbishmentcould keep the laundry functional for a few more years.
81
PART 3: A MISSED OPPORTUNITY
Note: This case addresses constructing a cost analysis at the level of a hospital, identifyingall the departments affected, and interpreting the results for hospital policy.
As the administrator of a crowded but respected public provincial hospital, you havecalculated that by the end of this fiscal year, your hospital expects to be operating at a surplus. Ifyou made no changes, your hospital’s costs would be $15,000 less than its budget from thenational government and it would need to return this balance to the government. As anexperienced administrator, you know that if you return the funds, you would have missed anopportunity to improve services.
Dr. Vivek, Chief Surgeon at your hospital, has just heard the good news about theMinistry’s windfall from outside political sources. He approaches you before you could draft thememo to other department heads informing them of this opportunity and requesting theirimmediate input. With a tone of urgency, Dr. Vivek wants the hospital to purchase newendoscopy equipment that detects and replaces surgical treatment of colon cancer. Theequipment is estimated to cost $10,000. Dr. Vivek tells you that this cost is “minimal” and seesno reason why this request should not be approved for funding.
After discussing this matter with Dr. Vivek for two hours and after talking to a friend whois a financial analyst at a nearby hospital, you realize that there are other costs attached topurchasing this new piece of equipment. Dr. Vivek could only give you “soft numbers” when youasked him (1) how many patients who were treated on an inpatient and outpatient basis in thehospital who had colon cancer within each of the last three years, and (2) of those, how manycould have benefited by the proposed equipment. According to Dr. Vivek, approximately 500patients a year could benefit from the new equipment--about half now patients receiving onlyother diagnostic procedures and half receiving both diagnostic procedures and surgical treatment. Without the new equipment, each of the surgical cases would have spent a week in the hospital. If they do not need to be admitted, their place would be taken by other elective surgical patients,who usually wait several weeks for admission.
With your friend’s help and Dr. Vivek’s information, you estimate the full capital costs asfollows:
New Endoscopy Equipment (10 year life) $10,000Expand Outpatient Treatment Room (20 year life) 5,000Total Capital Costs $15,000
Your friend advises you that the necessary approvals to apply the $15,000 anticipated surplus tothese capital costs could be obtained if you make an adequate case.
The inflation rate is 7% and the real interest rate is 3% per year. Variable costs are:physician (0.25 of annual salary of $10,000), technician (0.5 of annual salary of $3,000), nurse(0.5 of annual salary of $5,000), and supplies ($4,500 per year). Fixed annual operating costs are:maintenance ($500), and salaries ($1,000).
82
Dr. Vivek envisions a charge of $25 for patients receiving diagnosis only, and $50 perpatient receiving diagnosis and treatment. Because of free care and incomplete collections, netincome will be half of these amounts.
Exercise 5:a. Determine the annualized costs of Dr. Vivek’s proposal, counting all fixed and variable
costs, and compare them to his original $10,000 estimate.b. Discuss how this project might affect costs in other patient care units.c. Estimate the net income from the new procedure. Compare net income and costs and
indicate the impact on the hospital’s finances.d. Discuss whether benefits to the health of the hospital’s patients justify these costs. se. If the capital costs of the new service are financed through the surplus, would the annualized
costs be zero?
Answera. We first derive the annualized capital costs. Using a life of ten years, the annualizationfactor for the new endoscopy equipment is 8.530. The annualized capital cost for the endoscopyequipment in year 1 is $1254 (calculated as $10,000 x 1.07 = $10,700; $10,700 ÷ 8.530). Using alife of twenty years, the annualization factor for the treatment room is 14.877, and its annualizedcapital cost in year 1 is $360 ($5,000 X 1.07=$5,350; $5,350 ÷ 14.877). Together, theannualized capital costs in the first year are $1,614.
The variable and fixed costs are as follows:
Variable Costs:Physician (.25 of annual salary of $10,000) $ 2,500Technician (.5 of annual salary of $3,000) 1,500Nurse (.5 of annual salary of $5,000) 2,500Supplies 4,500
Total Variable Costs $11,000
Fixed Costs:Annualized Capital Costs $ 1,614Maintenance 500Administrative Salaries 1,000
Total Fixed Costs $ 3,114
Total Fixed and Variable Costs $14,114
b. The new endoscopy procedure will forestall the admission of 250 surgical patients whowould each have spent about a week in the hospital. Thus, the procedure will relinquish the bedsthat would have been occupied by these patients. As the hospital is crowded, it is likely thatdoctors would use the capacity in the surgical ward, operating and recovery rooms to admit 250“replacement” patients who, on balance, would not otherwise have been accommodated at the

83
hospital. (The number of replacement patients assumes that they would have had the same lengthof stay as the former surgery patients now receiving endoscopy.) The impact on the surgicaldepartment is two offsetting effects: saving the cost of the patients whose surgery was averted,but adding the cost of the replacement patients. If the hospital did not have a long waiting list ofeligible patients, then overall surgical admissions might decline.
c. The anticipated gross revenues for new program would be $6,250 (250 diagnostic patientsat $25) plus $12,500 (250 surgical patients at $50) or $18,750. The net revenues are half of thisamount, or $9,375. Thus, the net revenues would cover about two thirds of the costs of thisprogram. Several options need to be considered to cover this shortfall. First, the charge fordiagnosis could be raised to $38 and that for treatment (which forestalls a week of hospitalizationcould be raised to $75). Second, collections could be increased and free care reduced. Third, itmight be possible to improve collections overall for the hospital. Finally, additional subsidy fromthe Ministry of Health could be sought.
d. The project produces three types of health benefits. First, both types of endoscopypatients benefit. The patients receiving diagnosis only may obtain a more reliable diagnosis. Some patients may be spared from what would have been unnecessary surgery. Others willreceive treatment earlier. Second, the patients receiving treatment would benefit from a fasterrecovery and, perhaps, a lower complication risk. Finally, replacement patients admitted to thehospital through the beds made available enjoy an improvement in health. On balance, the newservice would allow the hospital to treat 250 additional surgical patients at an annual cost of$14,114, or $56 per patient or $8 per day. This is commensurate with or lower than the costs ofmany secondary hospitals in developing countries (Barnum and Kutzin, 1993). This servicejustifies its costs at least as much as that of other hospital services. Dr. Vivek’s proposalrepresents a reasonable, though not extraordinary, program.
e. The annualized capital of $1614 would not be reduced to zero from an economicviewpoint. It represents the one-year value of money invested in the capital asset of theequipment and the room renovation. The depreciation, computed by accountants, is less. Usingstraight-line depreciation it would be $1,250 ($10,000/(10 years) plus $5,000/(20 years). Thedifference between these amounts is the opportunity cost of the money invested in the project.

84
PART 4: THE WISH LIST
Note: This case addresses thinking quantitatively about the costs of a new service, andqualitatively about its contribution to the facilities goals.
The Ministry of Health has asked each hospital to submit a “Wish List” of one capitalimprovement project its administration wishes to be funded. These improvement projects canrange from beautifying one or all wards to adding a new medical service to the current bedcomplement, or opening a new operating theatre. No dollar limit has been given, but instructionsthat you are to: (1) submit a financial feasibility statement showing all projected costs andrevenues within a three-year time frame, and (2) not exceed an allowable net increase in operatingcost limit of 1% of the hospital’s operating budget, including annualized capital costs. It is notedthat funds from the Ministry are a “one time only” windfall, implying that costs beyond the 1%guideline would need to be self-financed.
Exercise 6:Think of a capital improvement project for your hospital. Describe the types of data you wouldobtain to determine whether the impact is worth the cost of achieving it.
AnswerMaking decisions on which capital projects will be undertaken is not an easy task for the
Ministry of Health. The Ministry’s challenge is to allocate limited resources to a small number ofprojects. Your challenge is to present the best project information possible to enable it to make adecision. Your part is extremely important because inadequate or inaccurate project informationcan lead to bad decision-making by the Ministry of Health.
Ideally, there are five major categories of information that should be presented as part ofyour analysis:
(1) Identifying the Alternatives Available: Too many times, capital expenditures arepresented on a “take it or leave it” basis; yet there usually are alternatives. For example, you maywant to select different companies in the purchasing process to acquire the highest quality and thelowest cost. Also, you may want to define different boundaries in the scope of the project over acertain time period.
(2) Coherence with Hospital and Ministry Goals: This is the whole rationale behind theMinistry’s decision-making: scarce resources are to be allocated among a virtually unlimitednumber of investment opportunities. The Ministry’s limitation on allowable operating cost is anencouragement for you to submit only those projects that are in the hospital’s best interests, andto submit those that are not in conflict with the broader goals and objectives of the Ministry as awhole.
(3) Cost Data: It is clear from this manual that cost information is an important variable inthe capital project decision-making process. The life cycle costs of your proposed project should

85
be presented. Limiting cost information just to capital costs or operating costs can becounterproductive.
(4) Benefit Data: Benefit data can be divided into two categories: quantitative andqualitative. Quantitative information is not only synonymous with financial data but it alsoencompasses service utilization data. Thus, it is important that your proposal includes an impactanalysis discussing the “pre and post” effects of implementing a program.
For example, let’s say that your hospital is located in the Tansa Valley of India, a veryrural area of many villages and towns. The nearest hospital that provides inpatient Ob-gyn care islocated thirty miles in Bombay in a tertiary medical setting. One of the stated goals of yourproposed project is to open twelve inpatient beds for Ob-gyn care, using a phased-in approachbased on demonstrated demand. A realistic and quantifiable benefit of this project would be anumerical increase in patient days for your institution and an associated increase in revenue (insome small way from paying patients). To show these benefits, you would need to providedemographic data on your catchment area including the proportion of women by certain agecategories you expect to admit to your new inpatient unit. A qualitative benefit of the project isthat it will allow local residents access to Ob-gyn care without traveling long distances.
(5) Data Regarding Prior Performance: Information on prior operating results of projectsfunded by the Ministry and/or the hospital can lend insight as to the hospital’s performance andreliability in forecasting.