Analysis of Ferromagnetic-Multiferroic Interfaces in ... final... · multiferroic materials,...
15
Midterm Report Peter Knapp 1 Analysis of Ferromagnetic-Multiferroic Interfaces in Epitaxial Multilayers of LSMO and BFO Author: Peter Knapp Department of Mechanical Engineering, Northwestern University, Chicago, IL 60201 Advisor: Professor Jeremiah Abiade Department of Mechanical Engineering, University of Illinois at Chicago, Chicago, IL 60607
Transcript of Analysis of Ferromagnetic-Multiferroic Interfaces in ... final... · multiferroic materials,...

Midterm Report Peter Knapp
1
Analysis of Ferromagnetic-Multiferroic Interfaces in
Epitaxial Multilayers of LSMO and BFO
Author: Peter Knapp Department of Mechanical Engineering, Northwestern University, Chicago, IL 60201
Advisor: Professor Jeremiah Abiade
Department of Mechanical Engineering, University of Illinois at Chicago, Chicago, IL 60607

Midterm Report Peter Knapp
2
Abstract – Bilayers were fabricated from ferromagnetic LSMO (Lanthanum Strontium Manganate Oxide,
La0.7Sr0.3MnO3) and ferroelectric BFO (Bismuth Ferrite, BiFeO3) using pulsed laser deposition in the
presence of O2 on LaAlO3 and SrTiO3 substrates. The layer thickness and the layer order were varied
among 16 samples. The bilayers were analyzed using TEM, XRD, XRR, and XPS to determine the
stoichiometry, interlayer diffusion, roughness, and other structural features. TEM imaging showed that
portions of the bilayers were highly crystalline. However, XRD analysis demonstrated that the majority
of films were amorphous, with some polycrystalline and nanocrystalline samples. XRR data indicated a
high roughness but did not yield good thickness values. Finally, XPS confirmed that material
stoichiometry was preserved. It appears that the deposition process still needs optimization. This
research will serve as the basis for future experiments on the magnetic properties of LSMO/BFO
bilayers.
Keywords – Pulsed Laser Deposition, X-Ray Diffraction, LSMO, BFO, Multiferroic Heterostructures,
Perovskite
Introduction – Traditionally, ferroelectric and ferromagnetic materials have been used for actuators,
optoelectronic devices, capacitors, information storage devices, and sensors.1 However, recently,
multiferroic materials, materials which demonstrate both magnetic and ferroelectric properties, have
piqued great interest. This unique combination of ferromagnetic and ferroelectric ordering means these
materials have a wide range of potential uses for which standard ferromagnetic and ferroelectric
materials are not ideally suited.2 In multiferroic materials, electric polarization can be used to influence
ferromagnetic polarization, thereby manipulating magnetization and ferromagnetic ordering.1
Multilayer heterostructures of these materials are of particular interest, because they allow for control
of electron spin polarization which has a number of applications in the area of magnetic sensors and
devices. Further research into and development of these novel heterostructures could demonstrate
unusual uses only appropriate for these materials.1,2 It is believed that the end result of this research

Midterm Report Peter Knapp
3
will be the realization of multicomponent multiferroic systems which afford electrical control of
magnetism.
Contemporary research in this area has focused on thin film, hetero-epitaxial bilayers, of
ferromagnetic (FM) and antiferromagnetic (AFM) materials.3 These bilayers exhibit three distinctive
phenomena which merit further research: exchange bias (EB), exchange enhancement (EE), and
exchange coupling (EC). Exchange bias is a shift of the hysteresis loop of a material along the field axis,
in the case of FM/AFM, specifically La0.67Sr0.33MnO3 /SrRuO3 bilayers in the positive direction. EB is a
result of the alignment and coupling of the interfacial spin states between the antiferromagnetic and
ferromagnetic layers of the system.3 Exchange enhancement is an augmentation of the coercive field of
the ferromagnetic layer as a result of exchange interaction.4,5 Finally, exchange coupling is an
interaction between the spin states of the atoms in between the ferromagnetic and anti-ferromagnetic
layers; it is the base effect that allows for EB and EE.2 These phenomena are extremely important in the
development of multiferroic bilayers.
The pairing of ferromagnetic lanthanum strontium manganite oxide (La0.7Sr0.3MnO3, LSMO), with
multiferroic, ferroelectric bismuth ferrite (BiFeO3, BFO) has merited considerable study.1-3,5 On its own
LSMO possesses a high Curie Temperature of 370 K and interesting colossal magneto resistance
properties which are active at and above room temperature making it an ideal candidate for research.1
LSMO is a rare earth manganite which, with hole doping, becomes a member of an intriguing family of
conductive and ferromagnetic materials which have potential uses as memory materials, sensors, and as
electrodes in ferroelectric films.1,5 Similarly, BFO has been the subject of research because it is
ferroelectric and anti-ferromagnetic with a high Curie temperature of 537 K and a high Néel
temperature of 107 K.5 The combination of a high Curie and Néel temperature allows for coupling of
magnetic and electrical orders at high temperatures making BFO a promising material for the
development of multiferroic technologies; the most prominent being tunnel junction devices based on

Midterm Report Peter Knapp
4
thin films of BFO.1,5 Studies on bilayers of BFO and LSMO are advantageous, especially when compared
to earlier studies focusing on bilayers of transition metal anti-ferromagnetic alloys and metallic
ferromagnets, because they are both perovskites and have similar lattice parameters, 0.396 nm for BFO
and 0.387 nm for LSMO.1,3 This allows for very close control of film growth, ensuring the multilayers are
epitaxial which is integral to the investigation of the exchange effects between the ferromagnetic and
anti-ferromagnetic layers. Additionally, bilayers are grown on substrates that possess a perovskite
structure to further insure uniform crystalline structure throughout. The most commonly used
substrates are Lanthanum Aluminate (LaAlO3) and Strontium Titanate (SrTiO3).3
As of yet, researchers know very little about how complex interfacial phenomena between
layers of the film affect magnetic properties.1,6-7 It is necessary to understand how local types of
interference at layer boundaries including diffusion of chemical species, deviations from stoichiometry,
and lattice mismatch resulting from different lattice parameter between the FM and AFM layer effect
bilayer properties in order to fully characterize these heterostructures and utilize them in novel
technologies.6,7 This paper reports on experiments to determine how varying bilayer parameters effect
interfacial interactions. First, the substrate on which the bilayers are grown will be varied between
LaAlO3 and SrTiO3. Second, the thickness of the BFO and LSMO layers will be varied to determine which
components of the bilayer dominate in interfacial interaction. Finally the order in which the layers are
deposited will be varied in order to fully characterize component interaction. These experiments will
hopefully serve as the basis for future research into the magnetic interaction of LSMO and BFO bilayers.
Films will be grown using Pulsed Laser Deposition and will be characterized by transmission
electron microscopy (TEM), x-ray reflectivity (XRR) and diffraction (XRD) techniques, and x-ray
photoelectron spectroscopy (XPS). Pulsed laser deposition is used because it is inexpensive and ideal for
the deposition of complex oxides as it preserves stoichiometry and can be performed in the presence of
a background gas such as O2, insuring proper film growth.8 Transmission electron microscopy probes the

Midterm Report Peter Knapp
5
local crystal structure, and provides evidence about the crystalline phase of the film and alignment
between layers of the film. X-ray reflectivity and diffraction techniques are used for analysis as they
provide a detailed electron density profile which can be used to judge film characteristics, the most
important being the crystallinity of the whole film, the thickness of the FM and AFM layers, lattice
mismatch, and diffusion of one component into another. Finally, XPS probes the composition of certain
areas of the surface of the film, and can be used to determine the changes in stoichiometry between the
target material and the deposited layer.
Materials and Methods – 5mmx5mmx0.5mm silicon, quartz, LaAlO3 (100)k, and SrTiO3 (100)k
substrates with one side polished, and a miscut of 0o manufactured by CrysTec were used in all
experiments. BiFeO3 and La0.7Sr0.3MnO3 rotating rod targets, manufactured by Kurt J. Lesker, were used
in all experiments. These targets were constructed from pre-synthesized oxide powders using a low
stress powder compression technique. Pulsed laser deposition was carried out using a pulsed KrF
excimer laser with an output wavelength of 248 nm and a pulse duration of 15 ns.
Before beginning film deposition, the growth rate of perovskite films on a perovskite substrate
in the available PLD setup was determined. LaAlO3, Silicon, and Quartz substrates were layered on one
another so as to form steps. Layering substrates on top of on another means portions of the substrate
surface are protected from depositing material and no film forms there, and at the boundary between
the protected and unprotected surface a plateau forms, which can be measured in order to determine
the thickness of the deposited film. The substrates were them mounted on the deposition stage. A
sanded and polished LSMO target was mounted in the vacuum chamber. The chamber was sealed and
vacuum pumped until the pressure reached 5*10-4 Torr. The substrates were heated to 650o C over a
period of 30 minutes and the target was pre-ablated for 500 pulses. Once the substrate reached the
target temperature background O2 gas was introduced at a pressure of 10-2 Torr and 12,000 pulses of
LSMO were deposited with a shot frequency of 5 Hz and a laser fluence of 1.5 Jcm-2. The distance
Midterm Report Peter Knapp
6
between target and substrate was 4.5 cm. Following the deposition, vacuum was reestablished and the
substrate was allowed to cool to room temperature over 1.5 hours. The substrates were removed,
separated, and sonicated in acetone and methanol to wash off any adhesive. Film thickness was
measured using a stylus profilometer and divided by the number of pulses to determine the growth
rate, which was 0.014 nm/pulse. This growth rate can be applied to all substrates and targets as only
perovskite type materials are used and all deposition parameters are held constant.
For the actual depositions, targets were sanded and polished at room temperature and
substrates were sonicated for 5 minutes in acetone, then 5 minutes in methanol. Substrates were
affixed with silver paint glue either directly to the deposition stage, or on a rotating sample mount that
allowed for deposition on multiple substrates without breaking vacuum. Targets were pre-ablated for
500 pulses at a pressure of 5*10-4 Torr. Substrates were heated to 650o Celsius over a thirty minute
period. High temperatures insure epitaxial film growth; the slow heating prevents the buildup of
thermal stresses which could damage the substrate. The substrate was held at 650o Celsius for the
entire deposition process. Once the ablation temperature was reacted O2 gas was introduced at a
pressure of 10-2 Torr, this pressure that was maintained throughout deposition. The laser was pulsed at
a frequency of 5Hz with a laser fluence of 1.5 J*cm-2. The distance between target and substrate was
4.5 cm. Following deposition, the O2 supply was removed and pressure lowered to 5*10-4 Torr. The
substrate was then cooled to room temperature over a period on 1.5 hours, again to insure no damage
due to thermal stressing. Substrates were removed from the setup, excess glue was sanded away and
the samples were cleaned and stored for future analysis. For a detailed listing of the films deposited see
Table 1.

Midterm Report Peter Knapp
7
Table 1. Listing of films Deposited. Two sets of the following films were deposited one on LaAlO3 and one on SrTiO3
Thickness LSM0 (nm)
Pulses for LSMO
Deposition
Thickness BFO (nm) Pulses for BFO Deposition
Order of layers on substrate
(bottom/top)
0 0 150 10,580 BFO
150 10,580 150 10,580 BFO/LSMO
200 14,100 150 10,580 BFO/LSMO
250 17,630 150 10,580 BFO/LSMO
150 10,580 0 0 LSMO
150 10,580 150 10,580 LSMO/BFO
150 10,580 200 14,100 LSMO/BFO
150 10,580 250 17,630 LSMO/BFO
X-ray diffraction and reflectivity measurements were performed on the manufactured samples
using the Rigaku-ATXG diffractometer at the NU X-Ray Facility. For XRD analysis the diffractometer was
in the slit collimation geometry with S1 set to 0.5 mm (h) 2 mm (v) and S2 set to 0.01 mm (h) 2 mm
(v) S3 and R were replaced with a soller slit so only peaks from the film, not the substrate, were seen.
Omega was locked at 0.5o and 2Theta was scanned from 20o to 60o. For XRR The diffractometer was in
the GE111 Crystal geometry with S1 set to 0.5 mm (h) 2 mm (v), S2 set to 0.01 mm (h) 2 mm (v), S3 set
to 0.2 mm (h) 5 mm (v), and R = 0.2 mm (h). The incident beam flux was 2.1106 photons/sec. The
step size for our scans was 0.001o. Data was fit using the Motofit package available within IGOR thin
film analysis software.
TEM imaging and XPS analysis were performed by outside technicians. A TEM sample was made
from the 150nm_BFO_LaAlO3, and was analyzed by Riad Alzghier of the Laboratory for Oxide Research
and Education (LORE). XPS analysis was performed on 150nm_BFO_SrTiO3 films by Ke-Bin Low of the
Electron Microscopy Service at the University of Illinois at Chicago.
Results –

Midterm Report Peter Knapp
8
The TEM images in Fig 1A demonstrate that BFO films deposited by PLD are highly crystalline.
The structure of the BFO film and the LaAlO3 substrates is highly ordered. There are no visible grain
boundaries in the film or substrate so it is possible that this is a single crystal film. This observation is
supported by the electron diffraction pattern shown in Fig 1B which indicates that there is only one
crystalline phase in the BFO layer. Additional TEM analysis indicates that the BFO layer is approximately
300 nm thick, twice the anticipated thickness. This may be a result of measuring growth rate only with
LSMO, it was assumed that this value could be applied to BFO as BFO and LSMO have the same
perovskite structure however TEM data demonstrates otherwise. It is important to note that TEM data
is highly localized, and only samples a small portion of the surface, therefore, on the whole, film
characteristics may deviate from the results pictured here.

Midterm Report Peter Knapp
9
XRD analysis indicates that 9 of the 16 films deposited are amorphous as is the case for the
150nm_LSMO_150nm_BFI_LaAlO3 film in Fig 2B , and five are nanocrystalline as with the
150nm_BFO_SrTiO3 film shown in figure 2D. Nanocrystalline films have very small crystalline domains,
on the order of 5 nm to 10 nm. There were two films that demonstrated crystalline order however. Fig
2C shows that the 150nm_BFO_LaAlO3 film is polycrystalline in agreement with the TEM data for that
film (Figs. 1). Finally, the 150nm_BFO_150nm_LSMO_SrTiO3 film, XRD data shown in Fig 2A, is the
highest quality film deposited. There is a sharp diffraction peak centered on 22.5o and two minor peaks
centerd around 27.8o and 57.0o respectively, which implies the film is approaching single crystal order.
The 150nm_BFO_150nm_LSMO_SrTiO3 film is a multilayer so the small peaks at high angles could be a
result of the lower layer of the film not multiple crystalline phases.

Midterm Report Peter Knapp
10
Table 2. Size of crystallites in nanocrystalline films
Film (radians) B(2)
(radians)
Crystallite Width
(nm)
150nm_BFO_SrTiO3 0.263 0.111 5
150nm_LSMO_SrTiO3 0.256 0.0803 8
150nm_BFO_150nm_LSMO_LaAlO3 0.265 0.111 5
200nm_BFO_150nm_LSMO_SrTiO3 0.259 0.0986 6
250nm_LSMO_150nm_BFO_SrTiO3 0.254 0.116 5
To further analyze the nanocrystalline the Scherrer Equation, shown below, was used to determine the
size of the crystallites.
B(2) = Peak Width (radians)
λ = 0.1542 nm
L = Crystallite Width (nm)
= d-spacing (radians)
K = Scherrer Constant (Assumed to be 1)
The Scherrer Equation relates peak width, B(2), to crystallite size, L. After analyzing the data in Table 2,
it was determined that the crystallites in the nanocrystalline samples range in size from 5 nm to 8 nm

Midterm Report Peter Knapp
11
approximately. The average crystallite size is 5.8 nm, rather large crystallites for nanocrystalline films.
However, these values are tentative estimates, as the data has not been corrected to account for peak
widening resulting from instrumentation, and not the film itself.
To determine if the poor structure of the films was a result of the deposition process a new
150nm_BFO_SrTiO3 sample was deposited using an alternate deposition process. The deposition
temperature and pressure and the cooling/annealing temperature and pressure were changed. In this
case the substrate was held at 670o C during deposition, and the O2 background pressure was held at
2*10-2 Torr. When deposition finished the oxygen background pressure was increased to 700 Torr. The
sample was then cooled to 390o C and held at that temperature for 1 hour to anneal, an additional step
to ensure oxygen was not diffusing out of the film. Following annealing the film was removed from the
PLD setup and analyzed via XRD as shown in Fig 3. The resulting data had no clear features indicating it
Midterm Report Peter Knapp
12
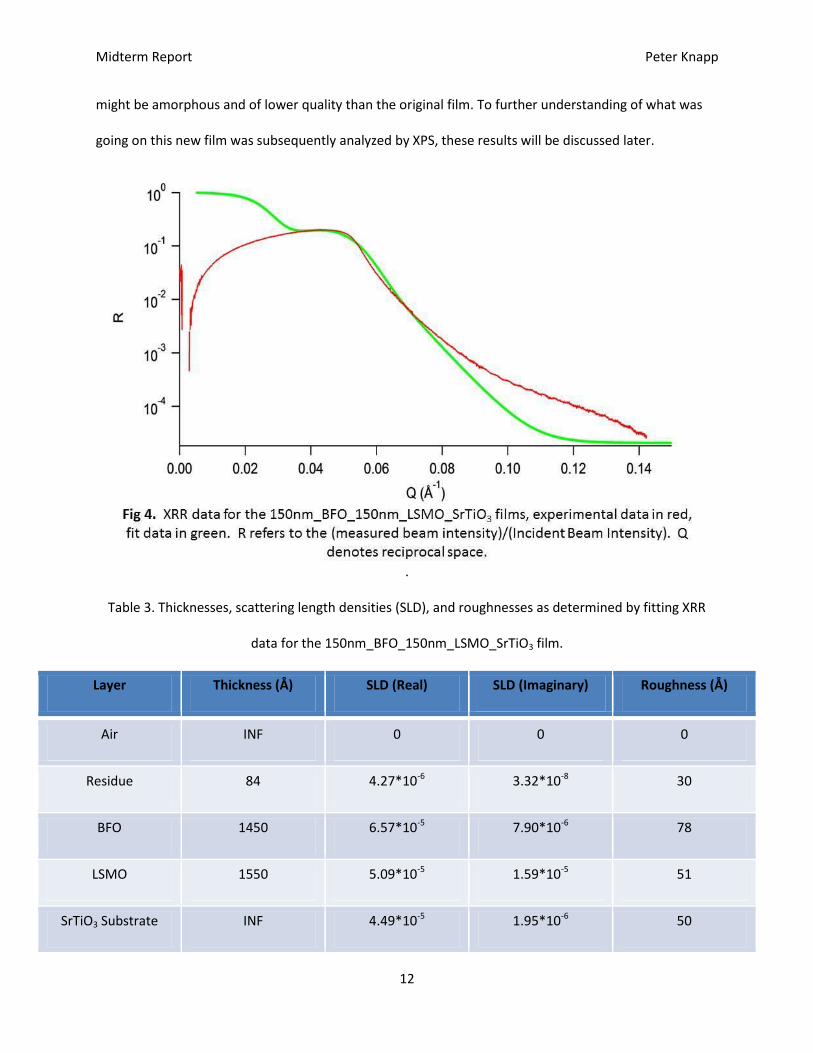
might be amorphous and of lower quality than the original film. To further understanding of what was
going on this new film was subsequently analyzed by XPS, these results will be discussed later.
.
Table 3. Thicknesses, scattering length densities (SLD), and roughnesses as determined by fitting XRR
data for the 150nm_BFO_150nm_LSMO_SrTiO3 film.
Layer Thickness (Å) SLD (Real) SLD (Imaginary) Roughness (Å)
Air INF 0 0 0
Residue 84 4.27*10-6 3.32*10-8 30
BFO 1450 6.57*10-5 7.90*10-6 78
LSMO 1550 5.09*10-5 1.59*10-5 51
SrTiO3 Substrate INF 4.49*10-5 1.95*10-6 50

Midterm Report Peter Knapp
13
XRR did not afford much valuable information. The films were too rough to accurately model
the extremely fine oscillations at high Q values seen in Fig 4. Of particular interest is the gradual decline
in R which is very indicative of a high roughness film. Additionally the intensity of the X-rays used for
XRR analysis was particularly low washing out R oscillations which are usually very prominent, but are
barely visible in the XRR data. As a result this model does not provide accurate thickness information
since the roughness was too high and the films were possibly too thick. Finally the most accurate model
includes a high density, high roughness surface layer. This is not unphysical as the samples could not be
fully cleaned before analysis as washing might have damaged the films. The upper layer is likely a
combination of organic residue and possibly silver particles from the adhesive used to attach the
substrate to the deposition stage which remained on the surface after sonication. However, as of yet
the fit is not of sufficient quality to draw specific conclusions.
Table 4. XPS Results for original 150nm_BFO_SrTiO3: Proper Stoichiometry Observed
Peak Position
BE (eV)
FWHM
(eV)
Raw Area
(CPS)
RSF Atomic
Mass
Atomic
Conc. (%)
Mass
Conc. (%)
Bi 4f 156 2.767 1302850 9.140 208.98 21 68
Fe 2p 708 4.572 378805.0 2.957 55.846 19 17
O 1s 527 3.162 318230.0 0.780 15.99 60 15
XPS analysis confirmed shown in Table 4 confirms that using the original deposition procedure, the
stoichiometry of the deposited film roughly matched the stoichiometry of the starting target material.
In spite of this, there is an observed Iron deficiency in the sample prepared using the new technique

Midterm Report Peter Knapp
14
described earlier. This discrepancy needs to be studied further to realize stoichiometric films. It is
possible this deficiency caused the new sample to appear amorphous in the XRD data in Fig 21. XPS is a
surface sensitive technique, only sampling the top several nanometers of a film so it is possible that
stoichiometry deviations may not persist as the sampling depth is increased.
Conclusion/Discussion – In conclusion, while the films deposited were not epitaxial there is evidence
that several of the films are highly crystalline. However there were a number of amorphous and
nanocrystalline samples indicating problems during deposition. In order to identify the problem, an
alternative experimental procedure was used to deposit a film to test this hypothesis, but the resulting
film had abnormal stoichiometry deviations and no conclusions could be drawn. It was observed that
PLD in an O2 background preserves stoichiometry when depositing complex oxides. Finally, XRR data
indicated films have high roughness and the model is incapable of providing accurate thickness data.
It is clear that the deposition process for LSMO and BFO has to be optimized to realize epitaxial
growth. It is believed that low film quality is a result of the diffusion of oxygen out of LSMO and BFO
during cooling. The formation of oxygen vacancies in the film results in the creation of multiple
crystalline phases and may even result in metal precipitates like iron or bismuth. It would be
advantageous, in the future, to experiment with raising oxygen pressure during cooling. This new
procedure was attempted, but the resulting film was not suitable for use due to an iron deficiency. It
may also be worthwhile to check the stoichiometry of the targets used as they are old and have been
used multiple times. It is possible there are defects in the targets which are affecting the structure of
the deposited films.
To close, while epitaxial multilayers of BFO and LSMO were not successfully deposited several
key points were confirmed. Pulsed Laser deposition is capable of preserving stoichiometry and
producing crystalline growth when depositing complex oxides. In the future it will be possible to refine
deposition parameters to ensure epitaxial growth. One just needs to continue manipulating the O2

Midterm Report Peter Knapp
15
background pressure and deposition and annealing temperatures and times. Additionally, in the future
the targets used for deposition should be examined to ensure damage to the starting material is not
affecting the deposited films. This study will provide guidance for future experiments on multilayers of
BFO and LSMO.
Acknowledgements – The financial support from the National Science Foundation, EEC-NSF Grant #
1062943 is gratefully acknowledged. I would like to thank Professors Jursich and Takoudis for organizing
the REU Program. I would also like to thank the LORE lab in general and Professor Jeremiah Abiade
specifically for providing me with the opportunity to work in their lab.
Sources –
1P.S. Sankara Rama Krishnan, M. Arredondo, M. Saunders, Q. M. Ramase, M. Valanoor: ‘Microstructural analysis of interfaces in a ferromagnetic-multiferroic epitaxial heterostructure’, J. Appl. Phys., 2011, 109 034103 (2011), 1-7. 2L. W. Martin, Y-H. Chu, M. b. Holcomb, M. Huijben. P. Yu, S-J. Han, D. Lee, S. X. Wang, R. Ramesh: ‘Nanoscale Control of Exchange Bias with BiFeO3 Thin Films’, Nano Letters, 2008, Vol. 8, No. 7, 2050-2055. 3X. Ke, L. J. Belenkey, C. B. Eom, M. S. Rzchowski: ‘Antiferromagnetic exchange-bias in epitaxial
ferromagnetic La0.67Sr0.33MnO3 /SrRuO3 bilayers’, J. Appl. Phys., 2005, 97 10k115 (2005), 1-3.
4M. Kharrasov, I. Kyzyrgulov, F. Iskahkov: ‘Exchange enhancement of the magnetoelastic interaction in a LaMnO<sub>3</sub> crystal’, Doklady Physics, 2003, Vol. 48, No. 9, 499-500. 5S. Habouti, R. K. Shiva, C-H. Solterbeck, M. Es-Souni, V. Zaporojtcheko: ‘La0.8Sr0.2MnO3 buffer layer effects on microstructure, leakage current, polarization, and magnetic properties of BiFeO3 thin films’, J. Appl. Phys., 2007, 102 044113 (2007), 1-6. 6Esteve, D., Postava, K., Gogol, P., Niu, G., Vilquin, B. and Lecoeur, P. (2010), In situ monitoring of La0.67Sr0.33MnO3 monolayers grown by pulsed laser deposition. Phys. Status Solidi B, 247: 1956–1959. doi: 10.1002/pssb.200983960 7G-Z. Liu, C. Wang, C-C. Wang, J. Qiu, M. He, J. Xing, K-J Jin, H-B Lu, G-Z. Yang: ‘Effects of interfacial polarization on the dielectric properties of BiFeO3 thin film capacitors’, Appl. Phys Lett., 2008. 92 122903 (2008), 1-3 8D. B. Chrisey, G.K. Hubbler: ‘Pulsed Laser Deposition of Thin Films’, 13-56; 1994, New York, John Wiley & Sons.


![Intra- and intersite electronic excitations in multiferroic TbMnO3 …jeng/paper/10/RIXS-PhysRevB[1].82... · 2010-11-16 · field. Of all known multiferroic materials, RMnO 3 rare-earth](https://static.fdocuments.net/doc/165x107/5f5002f8b5c2900dbf1785e3/intra-and-intersite-electronic-excitations-in-multiferroic-tbmno3-jengpaper10rixs-physrevb182.jpg)