Analysis of Demand on Shared Mobility Packages in ...
128
Analysis of Demand on Shared Mobility Packages in University Campus Miss Sandar Win A Thesis Submitted in Partial Fulfillment of the Requirements for the Degree of Master of Engineering in Civil Engineering Department of Civil Engineering FACULTY OF ENGINEERING Chulalongkorn University Academic Year 2019 Copyright of Chulalongkorn University
Transcript of Analysis of Demand on Shared Mobility Packages in ...

Analysis of Demand on Shared Mobility Packages in University
Campus
Miss Sandar Win
A Thesis Submitted in Partial Fulfillment of the Requirements
for the Degree of Master of Engineering in Civil Engineering
Department of Civil Engineering
FACULTY OF ENGINEERING
Chulalongkorn University
Academic Year 2019
Copyright of Chulalongkorn University
การวิเคราะห์อุปสงคชุ์ดทางเลือกส าหรับการเดินทางร่วมในเขตมหาวิทยาลยั
น.ส.แซนดาร์ วิน
วิทยานิพนธ์น้ีเป็นส่วนหน่ึงของการศึกษาตามหลกัสูตรปริญญาวิศวกรรมศาสตรมหาบณัฑิต
สาขาวิชาวิศวกรรมโยธา ภาควิชาวิศวกรรมโยธา คณะวิศวกรรมศาสตร์ จุฬาลงกรณ์มหาวิทยาลยั
ปีการศึกษา 2562
ลิขสิทธ์ิของจุฬาลงกรณ์มหาวิทยาลยั

Thesis Title Analysis of Demand on Shared Mobility Packages in
University Campus
By Miss Sandar Win
Field of Study Civil Engineering
Thesis Advisor Associate Professor SORAWIT NARUPITI, Ph.D.
Thesis Co Advisor PONGSUN BUNDITSAKULCHAI, Ph.D.
Accepted by the FACULTY OF ENGINEERING, Chulalongkorn University
in Partial Fulfillment of the Requirement for the Master of Engineering
Dean of the FACULTY OF
ENGINEERING
(Professor SUPOT TEACHAVORASINSKUN, D.Eng.)
THESIS COMMITTEE
Chairman
(Associate Professor SAKSITH CHALERMPONG,
Ph.D.)
Thesis Advisor
(Associate Professor SORAWIT NARUPITI, Ph.D.)
Thesis Co-Advisor
(PONGSUN BUNDITSAKULCHAI, Ph.D.)
External Examiner
(Associate Professor Varameth Vichiensan, Ph.D.)

iii
ABST RACT (THAI) แซนดาร์ วิน : การวิเคราะห์อุปสงคชุ์ดทางเลือกส าหรับการเดินทางร่วมในเขต
มหาวิทยาลยั. ( Analysis of Demand on Shared Mobility
Packages in University Campus) อ.ท่ีปรึกษาหลกั : รศ. ดร.สรวิศ นฤปิติ, อ.ท่ีปรึกษาร่วม : ดร.พงษส์ันธ์ บณัฑิตสกุลชยั
การเดินทางโดยการใช้พาหนะร่วมกันเป็นวิธีการเดินทางรูปแบบใหม่ท่ีมีความหลากหลายในการให้บริการ
จุฬาลงกรณ์มหาวิทยาลยัได้มีการน าหลายรูปแบบการบริการเขา้มาให้บริการแก่นิสิต และบุคลากร เช่น จกัรยานเช่า (CU
Bike), รถยนต์ไฟฟ้าขนาดเล็ก (Ha:mo), รถสามลอ้ไฟฟ้า (Muvmi), และรถโดยสารไฟฟ้าปรับอากาศขนาดเล็ก
(CU POP Bus) ท่ีให้บริการฟรีและมีเส้นทางครอบคลุมทั้งภายในมหาวิทยาลัยและเช่ือมต่อกับระบบขนส่งอ่ืน ๆ ในบริเวณใกล้เคียง การศึกษาน้ีมีวตัถุประสงค์เพ่ือศึกษาปัจจยัท่ีส่งผลต่อการตัดสินใจเลือกใช้รูปแบบการบริการของนิสิตในจุฬาลงกรณ์มหาวิทยาลยัโดยการน าเสนอบริการการเดินทางต่าง ๆ แบบผสมผสาน การศึกษาเก็บรวบรวมขอ้มูล 2 คร้ังเพ่ือสอบถามความพึงพอใจในการใช้บริการและปัญหาท่ีพบจากการใช้บริการท่ีผ่านมา และศึกษาเก่ียวกับปัจจยัท่ีมีผลต่อการตดัสินใจเลือกใชบ้ริการท่ีมีการออกแบบลกัษณะการให้บริการต่าง ๆ แบบผสมผสานหรือเป็นชุดทางเลือก (Package) และให้กลุ่มตัวอย่างท าการเปรียบเทียบตัดสินใจเลือกชุดทางเลือกบริการ โดยกระจายแบบสอบถามให้แก่นิสิตจุฬาลงกรณ์มหาวิทยาลยัจ านวน 370 คนในการรวบรวมขอ้มูลคร้ังแรก และ 326 คนในการรวบรวมขอ้มูลคร้ังท่ีสอง การวิเคราะห์การถดถอยพหุคูณ (Multiple linear regression) เพ่ือแสดงความสัมพนัธ์ระหว่างอุปสงค์ของบริการกบัราคาค่าบริการ และ พบว่าค่าบริการรถสามลอ้ไฟฟ้า (Muvmi) มีความอ่อนไหวมากกว่าค่าบริการของรถไฟฟ้าขนาดเลก็ (Ha:mo) และยงัพบว่า เพศหญิงมีแนวโนม้ท่ีจะใชบ้ริการรถสามลอ้ไฟฟ้า (Muvmi) มากกว่าเพศชาย นอกจากน้ีประสบการณ์ของผูใ้ชเ้ป็นปัจจยัส าคญัท่ีส่งผลต่อความตอ้งการใชบ้ริการในอนาคตอย่างมาก ในการวิเคราะห์ความพึงพอใจในชุดทางเลือกบริการแบบรายเดือนดว้ยแบบจ าลองการถดถอยโลจิสติกส์ พบว่า คุณลกัษณะในการสามารถทบยอดค่าบริการไวใ้ชใ้นอนาคตได้ เป็นปัจจยัท่ีส าคญัท่ีสุดต่อการตดัสินใจเลือกชุดทางเลือกบริการของกลุ่มตวัอยา่ง ผูใ้ห้บริการควรพิจารณาคุณลกัษณะน้ีร่วมในการเสนอการบริการดว้ย จากผลการศึกษาทั้งหมดสามารถช่วยให้ผูใ้ห้บริการเขา้ใจถึงความพึงพอใจของผูใ้ชบ้ริการและออกแบบรูปแบบการบริการและชุดทางเลือกบริการไดอ้ยา่งเหมาะสม
สาขาวิชา วิศวกรรมโยธา ลายมือช่ือนิสิต ................................................
ปีการศึกษา 2562 ลายมือช่ือ อ.ท่ีปรึกษาหลกั ..............................
ลายมือช่ือ อ.ท่ีปรึกษาร่วม
...............................

iv
ABST RACT (ENGLISH) # # 6170362421 : MAJOR CIVIL ENGINEERING
KEYWOR
D:
Shared Mobility, Mobility on Campus, Integrated Service,
Willingness to pay
Sandar Win : Analysis of Demand on Shared Mobility Packages in
University Campus. Advisor: Assoc. Prof. SORAWIT NARUPITI, Ph.D.
Co-advisor: PONGSUN BUNDITSAKULCHAI, Ph.D.
Shared mobility is the emerging service and comes in various forms. In
Chulalongkorn University, innovative shared mobility services such as shared
bicycle (CU Bike), small electric vehicle sharing (Ha:mo) and ride sharing tricycle
(Muvmi) are offered along with conventional free bus (Pop bus) circulation. This
study aimed to explore the attributes of the monthly mobility package which have
effect on student’s decision while offering the integrated service package for CU
students. Two phases of questionnaire surveys were conducted to find out the
satisfaction on existing mobility services quality, barriers that discourage students
from using shared mobilities, and factors that influence their decision for buying
package with improved service qualities. The questionnaire was randomly
distributed to 370 students in the first phase and to 326 students in Chulalongkorn
university in the second phase. Multiple linear regression analyses display that the
demand for shared mobility is dependent on the price. Gender is also correlated
with Muvmi demand. Moreover, user experience is the most important factor that
highly affects user demand in the future. The logistic regression model was used to
analyze the preference of the monthly mobility packages. The most important
service attribute to users is the carry-over feature, the remaining trips of service can
be transferred to the next consecutive month. The service operator should consider
carry-over feature. The results of the analyses could help the operators to
understand the users’ preferences and to design their service packages
appropriately.
Field of Study: Civil Engineering Student's Signature
...............................
Academic
Year:
2019 Advisor's Signature
..............................
Co-advisor's Signature
.........................

v
ACKNOWLEDGEMENT S
ACKNOWLEDGEMENTS
Firstly, I would like to express my gratitude to my advisors, Associate
Professor Dr. Sorawit Narupiti, Ph.D (advisor) and Dr. Pongsun Bunditsakulchai, Ph.D
(co-advisor) for their supportive guidance and encouragement throughout the process of
this thesis and studying in Chulalongkorn University. Thank you for your helping hand
and guidance whenever I have questions or difficulties related with my research.
Secondly, I would like to take this opportunity to thank to my exam committee
members: Associate Professor Dr. Saksith Chalermpong,Ph.D (committee chairman)
and Associate Professor Dr. Varameth Vichiensan, Ph.D (external examiner) as well for
their evaluation and feedback for this thesis. Moreover, I would like to express my
gratitude to Chulalongkorn University for financial support throughout these two years.
Without this grant, it would not be possible to pursue master program in Thailand. Last
but not least, I would like to say to my family and all my classmates who are being with
me through thick and thin for their care and support. Special thanks to who actively
contribute to this work during data collection and translation. Thank you very much.
Sandar Win

TABLE OF CONTENTS
Page
...................................................................................................................................... iii
ABSTRACT (THAI) ................................................................................................... iii
....................................................................................................................................... iv
ABSTRACT (ENGLISH) ............................................................................................. iv
ACKNOWLEDGEMENTS ........................................................................................... v
TABLE OF CONTENTS .............................................................................................. vi
List of Tables ................................................................................................................ ix
List of Figures ................................................................................................................ x
CHAPTER 1 INTRODUCTION .................................................................... 12
1.1 Background of Study ......................................................................................... 12
1.2 Problem Statement ............................................................................................. 13
1.3 Objectives .......................................................................................................... 15
1.4 Scope of work .................................................................................................... 16
1.5 Structure of Report ............................................................................................ 16
CHAPTER 2 LITERATURE REVIEW ........................................................... 18
2.1 What is Mobility-as-a-Service (MaaS)? ........................................................... 18
2.2 MaaS as a System Integration Service .............................................................. 23
2.2.1 Ticket and Payment Integration ............................................................... 23
2.2.2 ICT Integration ......................................................................................... 24
2.2.3 The challenges and issues of implementing MaaS service ...................... 26
2.3 Bundling of the Mobility Service Package ........................................................ 26
2.4 International studies about MaaS ...................................................................... 28
2.4.1 Case Study in Helsinki, Finland ............................................................... 28
2.4.2 Case Study in Landon ............................................................................... 29
2.4.3 Case Study in Sydney, Australia .............................................................. 31

vii
2.5 Chapter Summary .............................................................................................. 32
CHAPTER 3 RESEARCH METHODOLOGY .............................................. 34
3.1 Stated Preference ............................................................................................... 34
3.1.1 Contingent Valuation ............................................................................... 34
3.1.2 Discrete Choice Modelling ....................................................................... 35
3.2 Structure of Questionnaire ................................................................................ 35
3.3 Survey Method .................................................................................................. 38
3.3.1 Instruments for Data Collection ............................................................... 38
3.3.2 Determination of Sample Size .................................................................. 38
3.3.3 Study Area ................................................................................................ 40
3.4 Statistical Treatment of Data ............................................................................. 41
3.4.1 Multiple Linear Regression Analysis ....................................................... 41
3.4.2 Logistics Regression ................................................................................. 43
3.4.3 Mixed Logit .............................................................................................. 43
3.4.4 Validation and Significance of Data ........................................................ 45
3.5 Chapter Summary ............................................................................................ 46
CHAPTER 4 DATA COLLECTION AND ANALYSIS FOR MOBILITY IN
UNIVERSITY CAMPUS ............................................................................................ 48
4.1 Data Collection for Mobility in University Campus ........................................ 48
4.1.1 Questionnaire Design for Determining Current Mobility Services .......... 48
4.1.2 Research subjects and Survey Instruments ............................................. 49
4.2 Socio-demographic Characteristics of the respondents .................................... 50
4.3 Descriptive Statistics of respondents ................................................................. 53
4.4 Satisfactory level of current service quality ...................................................... 55
4.5 Reasons behind why students are not preferring to use .................................... 63
CHAPTER 5 DEVELOPMENT OF SHARED MOBILITY DEMAND MODEL .... 66
5.1 Introduction ....................................................................................................... 66
5.2 Testing Linear Assumptions for Ha:mo Demand Model .................................. 67
5.3 Calibration of Ha:mo Demand Model ............................................................... 69

viii
5.4 Testing Linear Assumptions for Muvmi Demand Model ................................. 73
5.5 Calibration of Muvmi Demand Model .............................................................. 76
5.6 Chapter summary ............................................................................................... 78
CHAPTER 6 DATA COLLECTION AND ANALYSIS FOR SHARED MOBILITY
PACKAGE ................................................................................................................... 79
6.1 Mobility Package Design .................................................................................. 79
6.2 Selection of Attributes and Their Levels ........................................................... 81
6.3 Questionnaire Design for Shared Mobility Package ......................................... 84
6.4 Data Collection and Socio-demographic Characteristics of respondents .......... 85
6.5 Mode Choice and Satisfaction Level of Respondents ....................................... 88
6.6 Correlation between explanatory variables ....................................................... 92
CHAPTER 7 DEVELOPMENT OF SHARED MOBILITY PACKAGE MODEL .. 94
7.1 Calibration of Shared Mobility Package Model by Logistic Regression .......... 95
7.1.1 Marginal Effects ....................................................................................... 96
7.2 Calibration of Shared Mobility Package Model by Mixed Logit ..................... 97
7.3 Application of Logistic Regression Model ...................................................... 101
CHAPTER 8 CONCLUSION AND RECOMMENDATIONS ................................ 103
8.1 Research Summary .......................................................................................... 103
8.2 Policy and Recommendation ........................................................................... 106
8.3 Research Limitation and Future Research ....................................................... 108
REFERENCES .......................................................................................................... 110
Appendix A ................................................................................................................ 113
Questionnaire 1: Demand for shared mobility service .............................................. 113
Appendix B ................................................................................................................ 117
Questionnaire 2: Preference on Shared Mobility Package ........................................ 117
Appendix C ................................................................................................................ 124
Probability of Choosing Package by Logistic Regression Model ............................. 124
VITA .......................................................................................................................... 127

List of Tables
Page
Table 1: Mobility-as-a-Service and their Characteristics (Australia, 2018) ................ 22
Table 2: Determining number of sample size based on population size (Gunatilake et
al., 2007) ...................................................................................................................... 39
Table 3: Socio-demographic characteristics of the respondents (N=370) ................... 51
Table 4: Descriptive Statistics ..................................................................................... 53
Table 5: Explanatory Variables in Regression Model ................................................. 67
Table 6: Collinearity statistics for checking multicollinearity for Ha:mo ................... 69
Table 7: ANOVA Test for Multiple Linear Regression Model ................................... 70
Table 8: Model Summary ............................................................................................ 71
Table 9: Multiple Linear Regression Model for Ha:mo .............................................. 71
Table 10: Collinearity statistics for checking multicollinearity for Muvmi ............... 75
Table 11: ANOVA for Muvmi .................................................................................... 75
Table 12: Model Summary for Muvmi ........................................................................ 76
Table 13: Multiple Linear Regression Model for Muvmi ........................................... 77
Table 14 choice design for 7 attributes and 2 levels each (Bush,2014) ....................... 81
Table 15: Attributes and their levels for bundling package ......................................... 82
Table 16: Socio-demographic characteristics of the respondents (N=326) ................. 86
Table 17: Descriptive Statistics of Mode Usage of Students ....................................... 91
Table 18: Explanatory Variables for Mixed Logit Model ........................................... 94
Table 19: Estimation of Logistic Regression Model ................................................... 95
Table 20: Marginal effects of Service Attributes in Package ...................................... 96
Table 21: Estimation of Mixed Logit Model with Normal Distribution ..................... 98
Table 22: Probability of Choosing Each Individual Package .................................... 102

List of Figures
Page
Figure 1: CU Pop Bus routes in Chulalongkorn university (Source:
https://www.chula.ac.th/en/about/green-university/cu-shuttle-bus/) ........................... 13
Figure 2: Numbers of passengers of CU Pop Bus (Source: Monthly report of
passenger trip using CU shuttle bus for procurement and supplies the inspection
board) ........................................................................................................................... 14
Figure 3: Structure of Research ................................................................................... 17
Figure 4: Example of Fixed Package (Ratilainen, 2017) ............................................. 28
Figure 5: Example of Flexible Package (Matyas and Kamargianni, 2018) ................ 30
Figure 6: Example of pay-as-you-go package (Ho et al., 2018) .................................. 32
Figure 7: Study Area (Chulalongkorn University Campus) ........................................ 41
Figure 8: Overview of Methodology ........................................................................... 46
Figure 9: Proportion of Students having driving license ............................................. 52
Figure 10: Satisfactory level of CU Pop Bus (N=370) ................................................ 56
Figure 11: Students’ satisfaction on CU Bike service ................................................. 58
Figure 12: Students’ Satisfaction level on Ha:mo Service .......................................... 60
Figure 13: Satisfactory level of Muvmi ....................................................................... 62
Figure 14: Overall satisfactory level of all modes in CU ............................................ 63
Figure 15: Reason behind why students are not interested to use (a) Ha:mo (b)
Muvmi (c) CU bike ...................................................................................................... 65
Figure 16: P-P Plot for Checking Normality Assumption for Ha:mo ......................... 68
Figure 17: Scatter Plot for testing Homoscedastic assumption for Ha:mo .................. 68
Figure 18: P-P plot for Checking Normality Assumption for Muvmi ......................... 74
Figure 19: Scatter Plot for testing Homoscedastic assumption of Muvmi .................. 74
Figure 20: Example of Monthly Package Design ........................................................ 84
Figure 21: Mode Choice of Students for going to and from Chulalongkorn University
...................................................................................................................................... 89
Figure 22: Mode usage for going around CU campus area ......................................... 90

xi
Figure 23: Amount of money spend for internal mobility service............................... 90
Figure 24: Correlation between socio-demographic characteristics and interest in
package ........................................................................................................................ 93

12
CHAPTER 1
INTRODUCTION
1.1 Background of Study
Chulalongkorn University (CU) is the first Thai national university which is
located in the central business district area (CBD) of Bangkok. The university consists
of twenty-one faculties, four colleges and nine research institutes. Currently, there are
37,000 of students in total studying in CU including both undergraduate and graduate
students.
As CU is located in CBD area and surrounded by numerous public
transportation stations, students can reach CU by various modes such as public bus,
Bangkok Mass Transit system (BTS) sky train, Metropolitan Rapid Transit (MRT)
subway and minivans. In order to reduce the number of vehicular trips generated from
campus and encourage the students to commute by public transport to and from CU,
university provides a free shuttle bus service (CU Pop Bus), connecting to bus stations
and BTS stations nearby CU. Generally, CU Pop Bus runs in six different routes
inside and nearby campus area, serving in and out campus access as well as internal
circulation within the campus.
In order to get around CU campus comfortably and conveniently, CU also
cooperates with other private companies and provides many alternative means of
transport. An electric car sharing service (Ha:mo), a single occupancy vehicle, has
approximately 30 stations around CU campus, and the fare starts at 20 baht for the
first 15 minutes and additional 2 baht per minute will be charged on the additional
travelling time.

13
Muvmi, an electric sharing Tuk Tuk service, is another available mode in CU
campus. It is very convenient for short distance travel as booking and payment can be
done through the application (App) by adding pickup and drop off point.
Nevertheless, this service is only available around Chulalongkorn University and
some designated areas in Bangkok. The fare ranges from 15 baht to 25 baht per ride
depending on the distance travel.
Figure 1: CU Pop Bus routes in Chulalongkorn university
(Source: https://www.chula.ac.th/en/about/green-university/cu-shuttle-bus/)
1.2 Problem Statement
Even though there are four available modes for students’ daily mobility in
CU, CU Pop Bus is the most popular mode among four currently. It is obvious that

14
demand is high because the service is provided for free and open access to all users to
get around CU. Furthermore, five routes are well connected to BTS stations and many
places inside the campus as well. According to the monthly report of passenger trip
using CU shuttle bus for procurement and supplies the inspection board (September
2019), 10,258 trips were generated and there were 552,486 of passengers in total.
During the morning peak hours, less than 20 percent of commuter travel by Pop Bus
from BTS Siam and going inside the campus. Moreover, one third of users relies on
CU Pop Bus for going outside of the campus during the evening peak hour.
Figure 2: Numbers of passengers of CU Pop Bus (Source: Monthly report of passenger trip using CU shuttle bus for procurement and supplies
the inspection board)
As seen in Figure 2, route 1 and route 2 have the highest demand as they
connect with two BTS stations and the student dormitory. On average, there are 62
passengers per trip on both route 1 and route 2, which are too crowded and exceed the
capacity of the bus. In addition, traffic congestion normally occurs along Henri
Dunant Road and Rama 1 road, especially at Chalermpao intersection and it increases
0
2000
4000
6000
8000
10000
12000
1 2 3 4 5 6 7 8 9 10 11 12 13 14 15 16 17 18 19 20 21 22 23 24 25 26 27 28 29 30
Total number of passengers per day
Route 1 Route 2 Route 3 Route 4 Route 5

15
both waiting time and travel time to get access to the nearest BTS stations, especially
in the evening peak hours.
The number of users of the other modes (i.e., Ha:mo, Muvmi and CU bike) are
lesser in number compared to CU Pop Bus. Perhaps a few of students choose the other
modes due to the fare conditions, reliability, and availability of the service. In order to
provide a cheaper price for the students and to encourage the use of active modes such
as CU bike, the concept of bundle mobility service, Mobility-as-a-Service (MaaS),
will be used to bring an effective and convenient mobility integrated service for the
students. Before creating the discount service package for students, it is necessary to
understand the current travel activities of the students, the reason why they rarely
choose the other options than CU Pop Bus and the factors influencing the mode
choices.
1.3 Objectives
The ultimate goals of this study are to improve the service quality and cost-
effective modes in CU such as CU bike, Muvmi and Ha:mo in order to get around the
campus comfortably and conveniently and to encourage students to use shared
mobility. In order to meet the ultimate goals, the specific research questions and
research objectives of the study can be defined as follows.
1. To find out current travel characteristics and satisfaction of students based on
the existing service quality;
2. To find the factors that influences on the number of usages of each mode in
future;
16
3. To determine the attributes of the shared mobility package which have effect
on student’s decision.
1.4 Scope of work
As this study aims to improve the mobility inside and nearby Chulalongkorn
University area, the data collection would be done by collecting travel behavior and
mode choices among four main modes, CU Pop Bus, CU Bike, Ha:mo,
and Muvmi, that are available in CU campus.
Initially, CU students will be asked about demographic characteristics of the
respondents, the satisfactory level of the current mobility service provided in CU and
willingness to pay for each paid mode using the questionnaire survey method. The
data from internal mobility demand questionnaire will be analyzed using statistical
software and the result will be used to develop shared mobility package questionnaire
that explores demand for monthly service package for the students who are currently
studying in Chulalongkorn University. The data from this questionnaire would be
analyzed using logistic regression to explore the factors influencing their choice on
package.
1.5 Structure of Report
This thesis report is composed of eight chapters in total. Chapter one mentions
about the background of the study, the main objective of the study and the scope of
work. The previous studies and findings from many researchers about MaaS will be
discussed in Chapter two and followed by Chapter three: the methodology that will be
used in data treatment and analysis. Chapter four will discuss about the data collection
procedure, the descriptive analysis of the respondents, travel behavior of the current

17
students in CU and mode choice in general by analyzing the data obtained from
questionnaire one. Chapter five will mention about demand model for shared mobility
service (Ha:mo and Muvmi) in CU. The way to create the service package design and
descriptive analysis will be presented in Chapter six while analysis for preference of
the package will be covered in Chapter seven. Finally, Chapter eight will conclude
important findings from the results of data analyses and will give suggestion that
should be considered in designing the service packages and improve the mobility in
CU campus.
Figure 3: Structure of Research

18
CHAPTER 2
LITERATURE REVIEW
The details about the Mobility-as-a-Service (MaaS) and its definition, the
different types of integration behind the MaaS system in order to eliminate the
barriers among service providers and let the users travel smoothly, the core features of
MaaS, case study from many countries will be reviewed in following sections.
2.1 What is Mobility-as-a-Service (MaaS)?
Generally, Mobility-as-a-Service (MaaS) is a system that offers the multiple
mobility services to fulfill the customer needs instead of buying the transportation
mean for the daily mobility needs. The public and private operators need to
collaborate with each other and integrate all the transport means including the
payment system in order to get access to the different transport means through a
single platform such as smartphone application or website. This is a platform where
the MaaS operator offers the designated monthly mobility packages or pay-as-you-go
packages so that the customer can choose the package that meets their travel demand.
Furthermore, the users get the real-time information, traffic and travel condition for
every single moment, therefore, the users can choose their desired mode, book and get
the ticket, plan for their daily trips and make the payment in one single app.
The concept of MaaS is a new trendy concept in transportation field and there
is no exact definition about MaaS. Mobility-as-a-Service is a system that promote the
use of the public transportation mode by using any mobility package that customer
needs rather than owning a vehicle (Kamargianni et al., 2016). In Australia (2018),
MaaS is the integration of all current transport modes, public and private service
providers, and offers the service in a single platform. Giesecke et al. (2016) specifies

19
that it is a user-centric service as the user can choose the preferred mode, buy a ticket,
make a payment and get the real time information through the mobile application.
Kamargianni et al. (2015) mentions that MaaS is bundling the multiple mobility
services into a package that can benefit both users and service operators. MaaS is a
way to present the integrated multiple mobility options for going from the original
point to the destination point (Burrows et al., 2015).
There are many different opinions about the occurrence of the MaaS concept
as well. Johansson (2017) argues that it is one of the solutions that can handle the
shortage of the urban transportation supply and discourage people using own private
cars. Under the sustainable mobility concept, the government starts promoting the use
of public transportation modes and discourages citizen from using private cars. The
travel pattern of the young people is changing with the popularity of the shared
economy like ride sharing, bike sharing and carpooling service. MaaS brings the
concept to provide the flexible and personalized mobility service to promote the
public transport service, to satisfy the daily demand and reduce the critical congestion
problem in the urban area.
On the other hand, Kamargianni et al. (2015) argues that the introduction of
various mobility services, such as bike sharing, car sharing, ride hailing service or on
demand transport service and public transport services, creates the complexity of the
payment system and planning the trip. Having different apps installed in the mobile
phone, owning the various card to access to different transport service and lack of real
time information make people think about the one stop mobility service like MaaS in
order to blur the complexities of the multimodal trips.

20
From the users’ point of view, enabling to travel smoothly and seamlessly is
the crucial characteristic of MaaS. The combination of different transport modes and
service providers, one stop service payment, and the availability of the service
packages which satisfy the customer’s demand are the core characteristics of MaaS
(Jittrapirom et al., 2017). Karlsson et al. (2016) states that the simplicity of the
combined mobility packages is the unique characteristic that can attract the users.
A trial project in Sweden will be mentioned here in order to increase
understanding about the users’ acceptance and the potential market of MaaS, The
Ubigo project developed in Gothenburg; Sweden was one of the full integrated MaaS
services. A multimodal subscription was provided by uniting the existing
transportation services, including the public transport, taxi, car and bike sharing and
car rental services. A six-month field operation test was carried out to study about
people acceptance on MaaS, how MaaS could discourage the use of private car, and
the characteristics that could appeal to the users. A mixed method including interview,
travel diaries, and three phases of questionnaire survey (“before”, “during” and
“after”) was employed. The result of the study indicated that not only the curiosity on
the new technology and mobility pattern but also the convenience and flexibility of
MaaS could attract passengers to use the MaaS service. Furthermore, the result of
“after” questionnaire data analysis showed that the use of private cars decreased and
there was a positive intention to the usage of public transport, walking and bicycle
(Sochor et al., 2014).
MaaS can be implied as an environmental-friendly and sustainable service.
Moreover, the integration among service providers is the key action to provide the

21
multimodal seamless mobility service. Integration can blur the barriers between the
parties and inconvenience of travel.

22
Tab
le 1
: M
obil
ity
-as-
a-S
ervic
e an
d t
hei
r C
har
acte
rist
ics
(Aust
rali
a, 2
018)

23
2.2 MaaS as a System Integration Service
According to the dominant concept of MaaS which provides flexible and
convenient bundling mobility service packages for the users, the integration between
the public and private organizations becomes one of the most critical components in
MaaS. The following sections will describe various types of integration to supply the
seamless transportation service.
2.2.1 Ticket and Payment Integration
The ticket integration is the most fundamental component for combining
payment for single modal transport service. The electronic payment system becomes
popular and the smart card is a widely used technology for combining the payment
electronically. Basically, users can top-up money and access to different type of
transportation means using only one single pass when users are changing from one
mode to another. It can not only lessen the transit time but also bring about the
convenience of transfer among the transportation services.
Discernable examples of the ticket integration are presented here. The EZ-link
card which is widely used in Singapore. The smart card is a stored-value card which
can be used to access to all modes of public transport such as bus, Mass Rapid Transit
(MRT), Light Rail Transit (LRT) and the amount of payment varies by travel
distance. Furthermore, non-transit payment such as the road toll payment and parking
payment can also be done with this single card. The complexity of using various cards
for different transport service is reduced. The Octopus card in Hong Kong which was
launched in 1997 is a successful common ticket as well. According to the study of
Smart Card Alliance (2003), 95% of the commuters in Hong Kong uses the Octopus

24
card for daily travel and the Octopus card could bring the convenience and speed up
the time for buying ticket from 15% to 20%. In addition, the barriers among the
transportation services operators can be eliminated. Although the common tickets in
Singapore and Hongkong are used for all public transit, the payment for each mode is
still paid separately. Similarly, there is a widely usage of rabbit card in Bangkok,
Thailand, which can be used for payment in some participating restaurants and BTS
links. Given the fact that the potential of a common ticket which is an accessible pass
to all public transport modes can be clearly seen as most of the commuters are already
familiar with the usage of card system.
2.2.2 ICT Integration
The information communication technology (ICT) integration is the
combination of service-related information of all different modes. The integration
aims to provide the real-time information such as travel time, waiting time or
traveling conditions to the travelers through the designated mobile application (app).
With a single app, the commuters can plan the trips for the whole day in advance,
book and buy the tickets. Moreover, they also can get the updated information about
all kinds of transit modes and can compare travel times and, costs, and other
conditions among the different modes. ICT integration always comes along with the
ticket and payment integration among the participating partners. Jittrapirom et al.
(2017) points out that ICT plays a crucial role not only to combine data and share the
information between in the participating partners but also to provide the effective and
fast service system as well.

25
Travel information becomes a vital MaaS component in order to improve the
quality of transportation service as the traveling behavior of commuters becomes
more complex and the commuters are using several transportation modes during a
single journey, or various modes for different purposes. By providing the real-time
travel information, people are encouraged to switch their travel mode to the fastest
(or the most desirable) mode (Grotenhuis et al., 2007). The travelers have various
options in hand and can choose the suitable mode that would meet personal demand.
Eryilmaz et al. (2014) mentions that the intermodal travel behavior is increasing with
the increase in travel demand of inhabitants in the metropolitan area. Many people
prefer an easier and more convenient modes such as private car or taxi due to the
complexity of the payment system that requires the travelers to use different mobile
application for different modes and lack of the integrated information (Kamargianni et
al., 2016).
Moovel is the integrated mobility service which was launched in Germany in
2016. The users can make use of mobile application to get access to participating
partners services such as car-sharing service; Mytaxi, a national taxi service; Deutshe
Bahn, the German national rail service provider; and the selective bike-shared
companies. Customers can access to the public transport service through the Moovel
as well in some cities of Hamburg and Stuttgart. Currently, Moovel is still using the
pay-as-you-go system for the payment even though MaaS in other countries are
providing the subscription mobility package for the travelers.

26
2.2.3 The challenges and issues of implementing MaaS service
MaaS is an emerging trend to create a more desirable service that could be the
answer of transport solution and solve problems that are facing in transportation field,
but it is still at the early stage of implementation. Unlike traditional transport services,
MaaS service needs the partnership between the participating parties and it thus has
the institutional, operational and technical challenges that must be overcome to bring
MaaS service to the users in wider practice. Furthermore, the design of the fixed
subscription package should be carefully designed for all the heterogenous travel
patterns.
The outcomes of MaaS system can be varied depending on the objective of the
MaaS service. If the aim is to provide a service that can substitute the use of private
car, there is a potential to reduce the car ownership by supplying a good quality and
reliable public transport and shared mobility services. On the contrary, the number of
unnecessary trips can be unpredictably increased if the aim is to create the transport-
oriented city. For the above reason, the service operating organization should be well
established and offer the monthly subscription packages in order to handle the
unnecessary trip generation and supply the sustainable public transport (Johansson,
2017).
2.3 Bundling of the Mobility Service Package
The service package is one of the feature of MaaS and different kinds of
service packages were tested in the past studies. Ratilainen (2017) mentions that the
bundling service is the heart of the MaaS system, and the transport service modes are
correctly packed with the new mode like bike sharing, thereby having potential in the

27
increased use of the sustainable modes. Moreover, the bundling products or services
are more attractive to the customers and travelers are more likely to buy the package
service or products rather than the individual item (Bakos & Brynjolfsson, 1999).
Schmalensee (1984) and Stigler (1963) states that bundling two goods which are
negatively correlated could make more profit for the sellers.
In additionally, when the sharing services, bike sharing and car sharing, are
taken into the package, they improve the flexibility and convenience of the trip and
this is an ideal concept of MaaS (Jittrapirom et al., 2017). Kamargianni et al. (2015)
also supports the statement by stating that the service package with only traditional
transportation modes such as public buses and taxi cannot bring the flexibility to the
travelers.
There are many studies on the willingness to pay for MaaS service packages
and three kinds of package type are considered in most of the studies. They are
1. Fixed monthly mobility package type
2. Flexible monthly mobility package type and
3. Pay-as-you-go subscription package type
Even though the service package is the main feature of MaaS which can
appeal the travelers to use the service, there is still unclear how to design the service
package that meets the users’ needs. While the service packages are provided by the
operators does not reach the users’ demand, the users are not willing to pay for the
new service.

28
2.4 International studies about MaaS
2.4.1 Case Study in Helsinki, Finland
In 2017, A study in Helsinki emphasized on the users’ intention to the MaaS
and their willingness to pay for the multimodal transport service (Ratilainen, 2017).
Moreover, the users’ acceptance and the factors influencing the willingness to pay in
Finland were studied using the fixed service packages offering. This study targeted to
four focus groups: student, young professional, middle-aged family member and
senior. For the quantitative data, there were 252 respondents in total and half of the
respondents were young and had low household income. The collected data were
analyzed using the multinomial logit model (MNL) and found out that most of the
adoptive users were the students and the public transport users while public transport
was the dominant modes in the service package. The private car users were limited in
consideration about changing the transportation mode, using the public transport
instead (Ratilainen, 2017).
Figure 4: Example of Fixed Package (Ratilainen, 2017)

29
As seen in Figure 4, the predesigned package includes the bundle of the
services and features. Mostly this kind of package is offered at the discounted price
relative to the individual feature price (Bakos & Brynjolfsson, 1999). The monthly
package service is a prepaid service and the customer can buy the extra service easily
through an app.
2.4.2 Case Study in Landon
Another type of package is flexible package which the operators will provide
the menu option type service choice and customers can select the number of trips or
kilometer of travel on individual modes. The app will calculate the service fees
automatically and show up the price after choosing the service. It is like the
customized package type which would meet the traveler’s needs. Furthermore, there
will be more add-on service features like transferability, the un-used trips or the
remaining kilometer will be able to transfer to the next consecutive month.
Matyas and Kamargianni (2018) explored about the features and modes which
appeals the users to shift to MaaS service and what kind of package plan that people
were interested in. The study was conducted in London using mixed-method approach
in order to get the quantitative data (online survey about the stated preference
experiment) and the qualitative data (in-depth interviews). Researchers tracked and
recorded how each of the respondent travel in his or her daily life and the service
packages generated based on his or her mobility records. Not only the fixed packages
but also the flexible packages type (menu options) were provided in the choice set for
the respondents to choose when the fixed packages did not meet their travel demand
or desirable services. The data collection process lasted for 6 months, from November

30
2016 to April 2017 and there were 1,138 participants answering the questionnaire.
The multinomial logit modeling method was used to understand the user preferences
on the MaaS plan.
The result showed that less than 20% of the respondents are less likely to
choose the flexible package option as the package’s price is higher than the fixed
packages. The high-income respondents are more likely to choose the flexible option
while the respondents, however, participants under the age of 30 and low household
income, think that the predetermined fixed bundle plan is preferable than the
personalized option.
Figure 5: Example of Flexible Package (Matyas and Kamargianni, 2018)

31
2.4.3 Case Study in Sydney, Australia
In a study by Ho et al. (2018), the pay-as-you-go package type was considered
when designing the survey questionnaire to explore the potential market of MaaS and
how the individual item included in the package could affect the users’ choices. In
this package, the operators offer the discounted unit price for some services (e.g.
Car2Go). For some partnering services, the operators offer the special discount for
every single trip that the traveler makes. By subscribing this type of the package, the
user can get discount according to the package they buy and travel cheaply.
For this study, data were collected using Computer-Assisted Personal
Interview method in three shopping centers. Each respondent was asked to watch
video explaining about MaaS service and later got into the interview section. There
were 252 participants in the interview for the period of 18 days. Following that, data
was analyzed using conditional multinomial logit regression to understand the
potential market of MaaS. The result showed that most of the respondents prefer to
the pre-design fixed package type.

32
Figure 6: Example of pay-as-you-go package (Ho et al., 2018)
2.5 Chapter Summary
From the related literature reviews, the definition of MaaS is summarized. Key
features in MaaS include integrated services of payment, information, bundling of
services, and the coordination service providers. Case studies are presented to
exemplify the past attempts to investigate details on MaaS development, such as user
preferences, MaaS plan (offering) types, package design.
To design the MaaS service package, prior knowledge about the travel
behavior of the users and the monthly demand of transport should be known before
designing the service packages. It can be clearly seen from above studies that most of
the respondents in different countries have more potential to buy the fixed type
package plan rather than the other types of plan. It can be concluded that the good
design of predetermined package plan can still meet the users’ requirements and it

33
can bring the simplicity and convenience to the users. For the further study in this
thesis, the fixed plan service package will be considered to explore the acceptance
level of the students from Chulalongkorn University and encourage them to use
shared mobility. The following chapter will discuss about the methodology that will
be applied for gathering data from the samples and statistical analysis on the collected
data.

34
CHAPTER 3
RESEARCH METHODOLOGY
This chapter outlines the overall research framework. After the concepts
related with this work are reviewed, this chapter explains the survey method will be
employed in this study. Details are elaborated on how the questionnaire would be
designed in order to obtain the effective data, detail about the data collection method,
target group for this study and statistical treatment of the data which includes multiple
linear regression, mixed logit analysis and validation of the model. The models are
used to understand the respondents’ characteristics and their decision making among
the provided scenarios.
3.1 Stated Preference
3.1.1 Contingent Valuation
Contingent valuation (CV) is widely used to elicit the monetary values,
specifically maximum willingness to pay, associated with the change in quality or
quantity of public goods or non-market goods. When designing, CV questionnaire,
special consideration on these three facts are required. Firstly, the respondents have to
imagine the change of the goods in term of quality and quantity and consider how can
it affect them. Secondly, the respondents might not be familiar with the hypothetical
situation and could result unreliable data. Lastly, willingness to pay for the change of
goods would be asked in questionnaire (Bateman et al., 2002). To elicit the economic
value of goods, some special techniques are used in the questionnaire such as open-
ended elicitation, bidding game elicitation, payment card elicitation, single-bounded
dichotomous choices, and double-bounded dichotomous choice.

35
Open-ended elicitation is a very straightforward technique in asking
willingness to pay for a goods. The drawback of this technique is that the result may
be unrealistic or unreliable as there may be zero answer. However, there are many
studies using open-ended technique to get monetary values of a goods (Alvarez-
Farizo, 1999; Langford et al., 1998). In this thesis, open-ended approach will be used
to explore willingness to pay for each shared mobility mode in CU (specifically,
Ha:mo and Muvmi) under the stated scenarios in the first questionnaire.
3.1.2 Discrete Choice Modelling
Discrete Choice Modelling (DCM) is another method to perform analysis on
the stated preference questionnaire. Unlike Contingent valuation, this approach is
used for determining the values of characteristics and attributes of goods. There are
four approaches to do discrete choice modelling such as choice experiments,
contingent ranking, contingent rating and paired comparisons. The choice
experiments approach is widely used in many studies about MaaS (Ho et al., 2018;
Kamargianni et al., 2015; Ratilainen, 2017), and in health care studies (Sever et al.,
2019). Each alternative contains the bundle of different levels of three or four
attributes to test the weight of each attribute that affects the bundle of service. The
level of each attributes should be ranged carefully and realistically (Bateman et al.,
2002).
3.2 Structure of Questionnaire
A good questionnaire is a critical component of the study and it helps the
researcher, in this matter, to understand better about the relationship between current
travel pattern and respondents’ decision when the service packages are provided. The

36
questionnaire can be separated into three parts: respondents’ socio-demographic
characteristics, travel behavior of individual including monthly transportation
expenses and the designed scenarios.
This study plans to have two rounds of survey data collections. The internal
mobility demand questionnaire was designed to capture travel behaviors in
association of person and travel characteristics, and willingness to pay for some
shared mobility services. The shared mobility package questionnaire was designed to
explore the preference of travelers on designed mobility packages.
Initially, socio-demographic characteristics are important to understand the
factors that influence the decision of respondents in the latter parts of the first survey.
The personal information: gender, age, level of study, personal income, and whether
the respondents have driving license or not, were asked in the first part of the
questionnaire survey. The income is the vigorous explanatory factor for the travel
pattern (Borgoni et al., 2002), and might have significant impact on the demand for
different MaaS service packages. Similarly, Borgoni et al. (2002) also mentioned that
gender and age are important demographic characteristics that acquire for explaining
travel behavior.
In addition, travel pattern of students on campus was asked in the consecutive
section of the questionnaire. Moreover, the amount of money that they currently spent
for going around CU was explored for designing service packages which included the
new innovative modes; Ha:mo and Muvmi in the last part of the questionnaire.
Based on the data collected and analysis results from the internal mobility
demand survey, the questionnaire for shared mobility package were created. Similar
37
to the first questionnaire survey, socio-demographic characteristics of respondents
were asked initially in the first part. Next, current mode choices and amount of usage
for each mode (i.e; CU Pop Bus, CU Bike, Ha:mo, and Muvmi) were recorded as they
could be used as explanatory variables along with other variables such as income and
current travel behaviors.
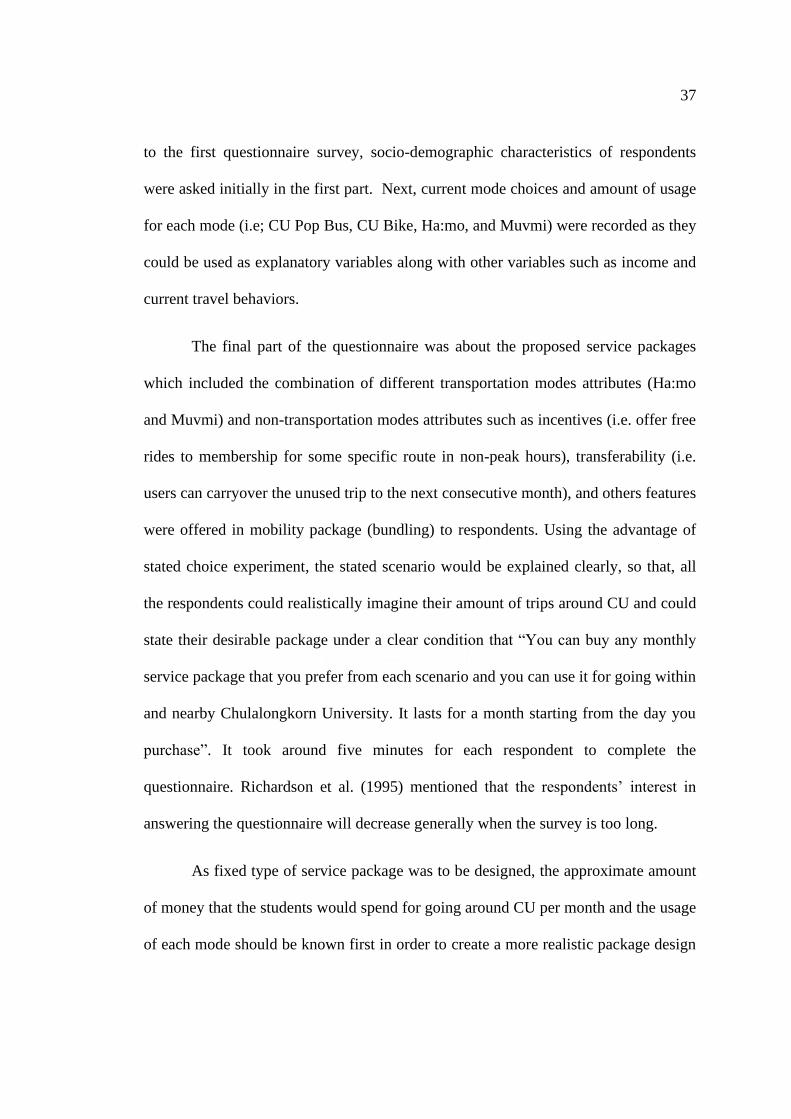
The final part of the questionnaire was about the proposed service packages
which included the combination of different transportation modes attributes (Ha:mo
and Muvmi) and non-transportation modes attributes such as incentives (i.e. offer free
rides to membership for some specific route in non-peak hours), transferability (i.e.
users can carryover the unused trip to the next consecutive month), and others features
were offered in mobility package (bundling) to respondents. Using the advantage of
stated choice experiment, the stated scenario would be explained clearly, so that, all
the respondents could realistically imagine their amount of trips around CU and could
state their desirable package under a clear condition that “You can buy any monthly
service package that you prefer from each scenario and you can use it for going within
and nearby Chulalongkorn University. It lasts for a month starting from the day you
purchase”. It took around five minutes for each respondent to complete the
questionnaire. Richardson et al. (1995) mentioned that the respondents’ interest in
answering the questionnaire will decrease generally when the survey is too long.
As fixed type of service package was to be designed, the approximate amount
of money that the students would spend for going around CU per month and the usage
of each mode should be known first in order to create a more realistic package design

38
which meet the students’ needs. The various methods to create the mobility package
and detail of the experimental design will be presented in next chapter.
3.3 Survey Method
In this section, how the questionnaire survey will be contributed to the
respondents to obtain the required data, the place where survey will be conducted and
the focus group for this study will be discussed in detail.
3.3.1 Instruments for Data Collection
The complete questionnaire was created using the online platform such as
google form, which is user-friendly platform and can be distributed through various
channels. The online survey, the electronic platform, is the easiest and fastest way to
get people participate in answering the questions and the cheapest method for the
surveyor to get the large sample size. Richardson et al. (1995) also supported that
online survey method is inexpensive compare to the costly paper survey and other
data collection methods.
Initially, a full instruction was provided for the respondents, so that, they
could complete survey by themselves. In transportation field, most of the survey is
done alone by the respondents without assistance of a surveyor. Consequently, the
interviewer effect does not influence on data from the respondents and they do not
have pressure while completing the questionnaire. However, the respondent rate may
be lower compared to personal interview.
3.3.2 Determination of Sample Size
The first survey, survey for current internal mobility demand, was conducted
to obtain the reliable information about users, preferences, and willingness to pay, the

39
study chose the method of sample size determination based on willingness to pay.
Gunatilake et al. (2007) proposed the determination based on the amount of
population and desirable significant levels. From Table 2, the open-ended question for
willingness to pay is considered continuous data and the required sample size when
the population size is greater than 10,000 is 119 sample. Nonetheless, some of
preference questions are categorical (rating), and thus the study planned to collect 370
samples.
Table 2: Determining number of sample size based on population size (Gunatilake et
al., 2007)
Population
Size
Continuous Data
(Margin of error
=0.05)
Categorical Data
(Margin of error
=0.05) =0.05, t=1.96 =0.05, t=1.96
1,000 106 278
1,500 110 306
2,000 112 323
4,000 119 351
6,000 119 362
8,000 119 367
10,000 119 370
For the second survey, which focused on discrete choice experiments, there
were some rule of thumbs that could apply for calculation the minimum sample size
required. According to Johnson and Orme (2003); Orme (1998), Sever et al. (2019),
the required sample size depends on three factors: 1. the main effects depends on the
number of choice task (t), 2. the number of alternatives in each choice task (a) and 3.
the largest number of levels for any of the attributes when considering the main
effects (c).

40
For this study, there were seven attributes in total while each of them had the
same levels (two levels). In questionnaire, there were total eight pairs of choice tasks
and the respondents were asked to choose one alternative from each pair.
𝑁 > 500𝑐
𝑡×𝑎 (1)
𝑁 >500 𝑥 2
8𝑥2
𝑁 > 62.5 𝑠𝑎𝑚𝑝𝑙𝑒𝑠
Therefore, a minimum 62.5 samples from the target population group was
required for this experiment. It was noted that various methods of sample size
determination were proposed by many researchers and some methods can result in
larger sample sizes. For instance, Hensher et al. (2005) suggested that the sample
size can be calculated from the number of attributes in practice that are used to create
bundling package. Another sampling approach for choice base experiment is that 50
samples are required for one attribute. However, in many MaaS studies, namely Ho et
al. (2018); Kamargianni et al. (2015); Ratilainen (2017), approximately 250 samples
in total were collected and used for choice modelling. Therefore, 250 samples were
planned in this study for choice modelling purpose.
3.3.3 Study Area
Even though more than four modes are available for users in university
campus area, only four main modes (CU Pop bus, CU bike, Ha:mo and Muvmi) were
considered in this study (excluded modes included motorcycle taxi, regular for-hire
taxi, ride hailing taxi, etc.,). The detail for the study area can be seen clearly in the
Figure (7). All the trips using shared mobilities provided in campus and generated in
this study area were considered, covering all access trips and circulation within the

41
area. It might include the shopping trip to and from MBK, Sam yam Mirtown, Siam
area and BTS station as well.
Figure 7: Study Area (Chulalongkorn University Campus)
3.4 Statistical Treatment of Data
This section explains the statistical methods that were utilized to treat
collected data to understand the travel behavior of the users and factors influencing
the decision making and willingness to pay.
3.4.1 Multiple Linear Regression Analysis
Regression analysis is statistical tool to study about the significant correlation
between dependent variable and at least one independent variable (explanatory

42
variables). Moreover, the strength of impact (explanatory power) of independent
variables, in the other word, the significance of the regressor, on the dependent
variable can be evaluated with Welch’s t-test. The relationship between dependent
variable (the number of usages on each mode) and independent variables (i.e.,
demographic characteristics of the respondents, qualitative variables: satisfactory
level of each modes, and quantitative variables: price reduction and frequency of
usage of each mode currently) would be seen using multiple-linear regression
analysis. In general, the equation for multiple linear regression model can be written
as follows.
Y= + X1+X2+……+Xk+u (2)
where;
Y = dependent variable
X1, X2,…., Xk = explanatory variables
= the intercept value (constant term)
,….., = coefficient of the independent variables
u = error term
Overall significant of the model can be explained using F-test for the
regression. In addition, R-squared from the model can say goodness of fit of the
model as well. The higher R-squared, the better the model. The multicollinearity,
interaction effects between the independent variables, should be tested. The
explanatory power of the model can decrease when two regressors from the model are
highly correlated.
43
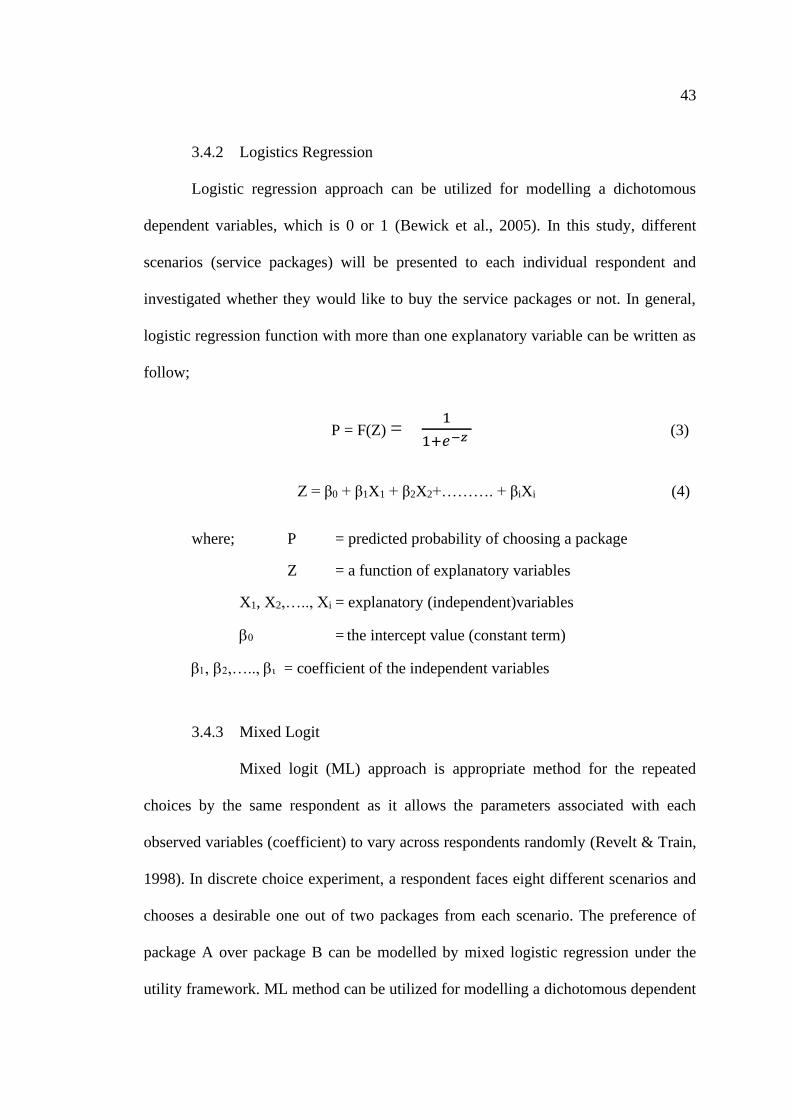
3.4.2 Logistics Regression
Logistic regression approach can be utilized for modelling a dichotomous
dependent variables, which is 0 or 1 (Bewick et al., 2005). In this study, different
scenarios (service packages) will be presented to each individual respondent and
investigated whether they would like to buy the service packages or not. In general,
logistic regression function with more than one explanatory variable can be written as
follow;
P = F(Z) = 1
1+𝑒−𝑧 (3)
Z = β0 + β1X1 + β2X2+………. + βiXi (4)
where; P = predicted probability of choosing a package
Z = a function of explanatory variables
X1, X2,….., Xi = explanatory (independent)variables
= the intercept value (constant term)
,….., = coefficient of the independent variables
3.4.3 Mixed Logit
Mixed logit (ML) approach is appropriate method for the repeated
choices by the same respondent as it allows the parameters associated with each
observed variables (coefficient) to vary across respondents randomly (Revelt & Train,
1998). In discrete choice experiment, a respondent faces eight different scenarios and
chooses a desirable one out of two packages from each scenario. The preference of
package A over package B can be modelled by mixed logistic regression under the
utility framework. ML method can be utilized for modelling a dichotomous dependent

44
variable, which is 1= chosen package, 0= unchosen package. In this study, various
combination of attributes levels (packages) will be presented to each individual
respondent and investigate the factors influence the choice situation (package A or
package B). The utility function for a nth respondent choosing j alternative package
from s choice situation can be written as below.
𝑈𝑛𝑗𝑠 = 𝛽′𝑛𝑋𝑛𝑗𝑠 + 𝜀𝑛𝑗𝑠 (5)
Where Unjs is the utility of the package j while the package j from s choice
situation is chosen by individual n, Xnjs is a vector of observed attributes for
alternative j (i.e., the level of attributes in the package), coefficient vector βn is
unobserved for each n respondent and varies in the population with density f(𝛽|𝜃)
where are the true parameters of the distribution, ɛjs is an unobserved error term which
assumed to be independently and identically distributed. Conditional on 𝛽𝑛s are
known, the standard logit formula for the probability that a respondent n chosen
alternative j in s choice scenario can be denoted as follow:
𝐿(𝑗, 𝑠|𝛽𝑛) = 𝑒𝛽𝑛 𝑋𝑛𝑗𝑠
∑ 𝑒𝛽′𝑛 𝑋𝑛𝑗𝑠𝐽𝑗=1
(6)
If yn is the chosen alternative in all choice situations for individual n: yn = (yn1,
yn2,…….. yns), and the probability of these choices condition on βn is
𝐿(𝑦𝑛 |𝛽𝑛) = ∏ (𝑒𝛽𝑛 𝑋𝑛𝑗𝑠
∑ 𝑒𝛽′𝑛 𝑋𝑛𝑗𝑠𝐽𝑗=1
𝑠 ) (7)
While 𝛽𝑛 is unknown, the unconditional probability of choosing yn is the
integral of standard logit probability over all possible values of 𝛽𝑛 is
𝑃(𝑦𝑛 |𝜃) = ∫ 𝐿(𝑗, 𝑠|𝛽𝑛)𝑓(𝛽|𝜃)𝑑𝛽 (8)

45
Mixed logit model could relax the assumption of independence of irrelevant
alternative and capture the heterogeneous consideration of each individual by
assuming the distribution of random parameters such as log normal, normal, uniform,
triangular and etc. For this study, the random parameters are assumed to be normally
distributed as it is commonly used in mixed logit study and has no restriction of sign
for random coefficient.
3.4.4 Validation and Significance of Data
For testing and validation of the data, the resulting P value from the model
will be used to find the variables that are statistically significant and can explain more
about the dependent variable, the mobility package. When the P value of independent
variable is less than 0.05 for 95% confident interval, it means that variable is
statistically significant.
The statistical measure mentioned above is only for testing of the explanatory
variables, when it comes to test the goodness of fit of the model, MacFadden’s Pseudo
R2 can be used for the study that has large sample size (more than 250 samples). The
equation for calculating Pseudo can be written as below;
= 1 – LL(MLE) / LL(0) (9)
adj
= 1 – [LL(MLE) – p] / LL(0) (10)
LL(MLE) = maximum log-likelihood value
LL(0) = log-likelihood value at zero
= the number of estimated parameters
Analogous to the linear regression model, the higher value of R2, the more
useful in predicting dependent variable.

46
3.5 Research Framework
Figure (8) presents the overview of the methodology that was employed in this
research. Detail about the design experiments and choosing attributes and attributes
levels will be discussed in the later chapters in this thesis.
Figure 8: Overview of Methodology
3.5 Chapter Summary
This chapter presents the methodologies that were employed in this
study. The study planned to organize two data collection, in which the first data
collection captured the basic travel behaviors and preference of the usage of the

47
current modes. The willingness to pay for the paid shared mobility services; Ha:mo
and Muvmi, were collected using open-ended questions. The discrete choice
experiment was formulated so that the decision on mobility package selection was
captured in the second survey. The data from the first survey were analyzed by
descriptive analyses as well as multi-linear regression analysis. The data from the
second survey were analyzed and modelled using logistic regression and mixed logit
approach, so that the preferences on service mobility packages were investigated.

48
CHAPTER 4
DATA COLLECTION AND ANALYSIS FOR MOBILITY IN UNIVERSITY
CAMPUS
4.1 Data Collection for Mobility in University Campus
In this section, questionnaire design and the actual data collection procedure,
that were employed to obtain sufficient data from the target population, were
presented. The characteristics of the respondents who took part in this survey were
also described below.
4.1.1 Questionnaire Design for Determining Current Mobility Services
The questionnaire was separated into three parts: 1) respondents’ socio-
demographic characteristics, 2) travel behavior of individuals including the monthly
transportation expenses and satisfaction on current mode services, and 3) preferences
on mode improvement including willingness to use of each modes if the price has
changed. Initially, the socio-demographic characteristics of each respondent were
collected as these factors might influence the decision of respondents in the latter
parts of the survey. The personal information: gender, age, level of study, personal
income, and possession of driving license were collected. It is noted that the users
need driving licenses to register for the car sharing service (Ha:mo). The income is
the vigorous explanatory factor for travel pattern and might have significant impact on
the demand for each particular mode. Similarly, gender and age are important
demographic characteristics for explaining travel behavior. Next, the respondents
were asked to rate service quality of each mode using a five-point Likert scale.
Moreover, the amount of money that they currently spend for going around CU was

49
explored. The respondents were asked for expected additional amount of travel
would have been made if the price of these new innovative modes was
reduced.
4.1.2 Research subjects and Survey Instruments
Even though there are a lot of faculty members and other employees working
in Chulalongkorn University, this study considered only the students who currently
studying in the main campus as our target group. It included both undergraduate and
graduate students in the main campus as they perceived and used modes of service
around CU main campus. For this questionnaire, both students with and without
driving license were considered. These students were counted in the target group as
they would understand or have had experience on the limitation of services and the
reason behind not choosing to use any of these services even though they were able to
choose them.
The survey was initially designed in google form and distributed to the
students through various platforms and groups via online. Unfortunately, the rate of
online survey participation was not satisfying and unpromising. Firstly, online survey
was conducted for five days starting on Monday, 25 November 2019 to Friday, 29
November 2019. Data collection period was closed to the university exam period and
this might also be one of the reasons why participation rate was not high as expected.
In order to obtain reliable and sufficient data during designated data collection period,
paper questionnaire approach was employed.
To capture data from different respondents, actual survey date was randomly
selected, and data collection was performed between 9:00 to 16:00. The interviewers

50
went to different faculties and randomly invited students to participate in answering
questionnaire. The invited students could choose whether they would like to
participate on-site survey or not. Initially, interviewers briefly explained about the
questionnaire to the respondents to avoid misunderstanding and unreliable
information. Most of the data collection were done in the libraries and co-working
spaces because students always gather in those places.
On-site interview was more reliable and received the higher respondent rate
than online interview even though it was time-consuming and needed more human
resources. Moreover, the advantage of on-site interview was that the interviewer
could give explanation while the respondents had any question and it could even
reduce the non-response answer. During five days of data collection period, a total of
400 respondents were sampled and 30 samples were eliminated due to reliable data
and outlier issue. The total of 370 samples from this questionnaire would be used for
further analysis.
4.2 Socio-demographic Characteristics of the respondents
Out of 370 samples, the percentage of female participating in this survey
(64%) was higher than male respondents (36%). According to the university census
report (2015), CU has 59.5% of female and 40.5% of male. Compared to the actual
population on campus, the proportion of female was slightly over-represented. When
faculties were grouped into two: humanity (education, law, fine and applied arts,
psychology, communication arts, etc.) and science (medicine, dentistry, sport science,
engineering, etc.), 45.1% of respondents were from humanity faculties. The sample
proportion was resembled to the population proportion of students studying in those

51
faculties (44.7%), reported by Chula facts and stats (2019). Generally, the collected
data could represent the true population of the students studying in CU. Details of the
demographic profile of the respondents can be seen in Table (2).
Table 3: Socio-demographic characteristics of the respondents (N=370)
Characteristics Frequency
Percentage(%)
Gender
Male 133 35.9
Female 237 64.1
Faculty
Art 167 45.1
Science 203 54.9
Level of Study
1st year 150 40.5
2nd year 76 20.5
3rd year 64 17.3
4th year 52 14.1
>4th year 3 0.8
postgraduate 25 6.8
Spendable amount of Money
<2000 baht 16 4.3
2000-4000 baht 68 18.4
4001-6000 baht 87 23.5
6001-8000 baht 62 16.8
8001-10000 baht 71 19.2
10001-12000 baht 30 8.1
12001-14000 baht 14 3.8
>14000 baht 22 5.9
By looking at the level of study of the respondents, first-year students were
more active and participated more in the on-site interview, 40.5%, while the response
rate from second-year students were below half of the first-year students. The students
from senior years had the lowest respondent rate, or 14.9%. Income is another
important variable. The amount of money that each student could spend might be
related to the modes that they might choose to go around CU campus area. Thus, the
spendable amount of money could be used to correlate it with the preferable mode by

52
students. According to the collected data, 41.9% of students could spend 2,001-6,000
THB per month while 36% of students could spend between 6,001 THB and 10,000
THB for transportation and daily expenses. Less than 20% of students had spendable
amount of money for living over 10,000 THB per month.
Figure 9: Proportion of Students having driving license
Among 370 of total respondents, only 38% of the students had driving license
while the rest 62% were not able to drive and had limitation for using Ha:mo, in
which users need driving license to make registration. For those who did not have the
driving license would not be able to use this specific mode. According to Figure (9),
the percentage of students who did not have driving license were higher than those
who had the driving license in every level of study except graduate student level. This
was commonly related to the age of students, as most of the first to third year
students were still under the age of 20 and had not taken a driving test yet.
45
26
27
26
2
16
105
50
37
26
1
9
1 S T Y E A R
2 N D Y E A R
3 R D Y E A R
4 T H Y E A R
> 4 T H Y E AR
P O S T G R A D U A T E
Yes No

53
4.3 Descriptive Statistics of respondents
In this section, descriptive statistics of many variables were
summarized and presented in Table 4.
Table 4: Descriptive Statistics
Variables Unit N Minimum Maximum Mean Std.
Deviation
1 Personal Income baht/month 370 3750 21250 9519.8 4722.864
2 Spendable amount of money baht/month 370 1000 15000 6891 3521.845
3 Days come to CU days/week 370 1 5 4.13 1.098
4 Weekly expense going
around CU baht/week 370 100 900 279.29 229.532
5 Current usage of CU Pop Bus times/week 370 0 12 5.81 3.835
6 Current usage of CU bike times/week 370 0 5 0.16 0.611
7 Current usage of Ha:mo times/week 370 0 5 0.13 0.64
8 Current usage of Muvmi times/week 370 0 9 0.85 1.478
9 WTP of Ha:mo baht/ride 370 0.5 20 15.925 4.6561
10 WTP of Muvmi baht/ride 370 2 25 16.75 4.1761
11 Total times tend to use CU
Bike times/week 370 0 13 1.8 2.373
12 Total times tend to use
Ha:mo times/week 370 0 14 1.12 1.924
13 Total times tend to use
Muvmi times/week 370 0 18 2.83 3.121
The respondents’ income per month and the amount of money that they spent
for going around Chulalongkorn University area (i.e., internal trips in campus, trips
to/from BTS stations and shopping trips) were shown. It ranged between from 3,750
THB to 21,250 THB. On average, a person had personal income around 9,500 THB
per month which might include money for accommodation and other living expenses.
In order to know the actual amount of money that they could spend per month,
excluding amount of money of accommodation, respondents were asked again. The
questions on income and spendable amount of money per month were sensitive,
therefore the possible ranges were provided in questionnaire. From the data on the
spendable amount of money per month, a person could spend at least 1,000 THB and
the highest amount was 15,000 THB with an average of 7,000 THB per month for

54
transportation and other living expenses. This is an important variable as it could
reflect to their mode choice to going around CU.
According to Table (4), students came to university four days a week on
average. This confirms that most of the respondents (93%) were undergraduate
students as they had lecture classes nearly every day. The average spending for travel
around campus was 280 THB per week while some students spent up to 900 THB per
week.
When separating four modes in two groups: free service mode (CU Pop Bus
and CU Bike) and paid service mode (Ha:mo and Muvmi), it can be seen that the
average number of times that students used CU Pop Bus in one week (Avg=5.81,
SD=3.835) was significantly the highest. Even though the service was provided for
free, CU bike usage was very low (Avg=0.16, SD=0.611) compared to CU Pop Bus.
In the same way, current usage of Ha:mo in one week (Avg=0.13, SD=0.64) was less
than Muvmi usage (Avg=0.85, SD=1.478). In general, CU Pop Bus was the most
popular mode among four modes.
As Ha:mo and Muvmi are paid service, service fee and available money to be
spent for travel by students can be a determinant of the service usage. A direct
question was asked about the preference of the service fee and expected additional
time (frequency) of usage was recorded. This was an open-ended question for
willingness-to-pay (WTP) for these paid services. As CU bike is free to most students
(free for the first hour), it was exempted from the willingness analysis. From Table
(4), most students were willing to pay around 16 THB per ride for both Ha:mo and
Muvmi services.

55
4.4 Satisfactory level of current service quality
Service quality is one of the important factors that influence user’s mode
choice and user’s behavior. Moreover, it is the key driver for the service provider
business and survival (Charbatzadeh et al., 2016). In this questionnaire, students were
asked to rate their satisfaction level on a five-point Likert scale (1= very dissatisfied
to 5= very satisfied). The study focused on transportation services around the area, in
which students could normally make within and around campus. The following
discussion would be about the level of satisfaction from the user point of view, as a
result of questionnaire analysis.
CU Pop Bus
As mentioned before, CU Pop Bus is a free shuttle bus service provided by
CU. The service runs as schedule and connects to many dominant places within and
nearby campus such as student dormitories, BTS stations and shopping areas. Not
only the students but also other faculty members rely on this free shuttle bus service
in their daily commuting around CU campus.
1%
7%
14%
2% 2%
9%
31%
42%
19%
11%
39%44%
31%
44%
33%
44%
17%
11%
29%
36%
6%1% 3% 5%
18%
0%
10%
20%
30%
40%
50%
Travel Time Waiting TimeCrowdedness Service
Frequecny
Safety
CU Pop Bus
Very Dissatisfied Dissatisfied Neutral Satisfied Very Satisfied

56
Figure 10: Satisfactory level of CU Pop Bus (N=370)
The survey shows that almost all the students had tried and used it
before. Figure 10 presents the level of satisfaction of all respondents on CU Pop Bus.
Looking at the satisfaction of service quality aspects, 50 percentage of respondents
were satisfied with the travel time, perhaps because this service runs with fixed
schedule and the users can check the location of the bus through app. The waiting
time (38%) is not quite satisfied for students especially during the morning and
evening peak hours as it takes longer waiting time than normal. Similarly, students
were not satisfied with crowdedness on bus (56%) especially during peak hours. The
demand of shuttle bus was over the limit of bus capacity and this causes
inconvenience to users. For the safety aspects, 54 percent of users felt safe to use the
shuttle bus. The service runs from 7:00 in the morning to 22:00, it is more convenient
for some users who leave campus in late hours. However, students are pleased with
overall service quality and have a very high demand.
CU Bike
CU bike, shared bicycle service, is provided for free for the first one hour of
usage which is enough time for users to go around CU. Thus, CU bike can be
assumed as another service that CU provides for free. In the questionnaire, we had
questions about whether they had any experience of this service or not. For CU bike,
only 78 respondents, 21% of total respondents, had used CU bike before. In order to
explore the satisfactory level based on user experience, data from 78 participants were
considered and presented in Figure 11. Considering the satisfactory level of CU bike
in three aspects, it was found that 24 percent of the respondents complained about
service availability of CU bike at the dissatisfactory levels. Students could not find

57
bike easily nearby their current location as there are limited number of docking
stations around campus. Regarding to safety aspect, only 18 out of 78 respondents
(24%) had positive opinion while the rest of respondents were not really satisfied with
current service quality.
3% 1%
10%6%
14% 14%
46%
62%56%
33%
21%15%
12%
3% 4%
0%
10%
20%
30%
40%
50%
60%
70%
Travel time Safety Service Availability
CU Bike (N=78, Yes)
Very Dissatisfied Dissatisfied Neutral Satisfied Very Satisfied
2% 3% 3%3%10% 7%
78% 77% 77%
13%8% 11%
3% 3% 2%
0%
10%
20%
30%
40%
50%
60%
70%
80%
90%
Travel time Safety Service Availability
CU Bike (N=292, No)
Very Dissatisfied Dissatisfied Neutral Satisfied Very Satisfied

58
Figure 11: Students’ satisfaction on CU Bike service
Ha:mo
Similar to CU bike, satisfactory level from actual users were considered in
order to get more realistic and practical result. From Figure 12, the number of users
who had positive experience with Ha:mo, paid car sharing service, was the highest in
all service attributes except cost attribute, among four modes available in CU. For the
users who had experience of Ha:mo service before, the highest satisfaction was on
travel time (44%) while cost factor (13%) was the lowest. However, this kind of
service provides flexibility and privacy to the user. One can see the trade-off between
cost and other service attributes. The satisfaction level of safety and service
availability aspects are having similar proportion (29% and 27%) respectively. As
Ha:mo service has a separate mobile app which is convenient for users to find
available vehicle near by their current location and book parking slot in advanced at
their destination point.
2% 3% 4%4%11% 9%
72% 74% 73%
18%10% 12%
5% 3% 2%
0%
10%
20%
30%
40%
50%
60%
70%
80%
Travel time Safety Service Availability
CU Bike (N=370)
Very Dissatisfied Dissatisfied Neutral Satisfied Very Satisfied

59
2%8%
4% 3%5%
18%10% 11%
49%
61%57% 59%
25%
11%
24% 22%19%
2% 5% 5%
0%
10%
20%
30%
40%
50%
60%
70%
Travel time Cost Safety Service
Availability
Ha:mo (N=100, Yes)
Very Dissatisfied Dissatisfied Neutral
Satisfied Very Satisfied
1% 3% 1% 0%1%6% 3% 5%
79%84% 82% 83%
14%6% 11% 10%
5% 1% 3% 2%0%
20%
40%
60%
80%
100%
Travel time Cost Safety Service
Availability
Ha:mo (N=270, No)
Very Dissatisfied Dissatisfied
Neutral Satisfied
Very Satisfied

60
Figure 12: Students’ Satisfaction level on Ha:mo Service
For non-users, cost is the prominent factor that causes students not choosing
this mode. At the same time, students also have free option(s), especially CU Pop Bus
which is the (most) competitive mode for this service.
Muvmi
Muvmi is another paid sharing service available in CU starting from 2018.
The result from survey about Muvmi is shown in Figure 13. Regarding to four
attributes: safety, waiting time, cost, travel time, the biggest proportion of users (48%)
were satisfied with the current service quality in general. Travel time factor had the
highest satisfaction level (59%), followed by safety (52%). The waiting time attribute
was the lowest satisfaction level (30%) as it takes around 10 to 15 minutes on average
to pick up a passenger. Despite the fact that the waiting time is a bit long, it is at the
acceptable level to the students.
1% 4% 2% 1%2%9% 5% 6%
71%78% 75% 76%
17%8%
14% 13%9%1% 4% 3%
0%
20%
40%
60%
80%
100%
Travel time Cost Safety Service
Availability
Ha:mo (N=370)
Very Dissatisfied Dissatisfied Neutral
Satisfied Very Satisfied

61
In general, Muvmi had a large number of users compared to the other two
services: Ha:mo and CU bike. It is on demand service and runs flexibly, the user can
easily add pick up and drop off point in app. It becomes popular among the students.
2% 1%6%
1%5%
14% 15%
7%
34%
49% 49%
41%
35%
27%22%
38%
24%
9% 8%14%
0%
10%
20%
30%
40%
50%
60%
Travel time Cost Waiting time Safety
Muvmi (N=169, Yes)
Very Dissatisfied Dissatisfied Neutral Satisfied Very Satisfied
0% 1% 1% 0%3% 5% 3% 5%
73%81% 79%
75%
19%
10%16% 16%
4% 2% 0% 3%
0%
10%
20%
30%
40%
50%
60%
70%
80%
90%
Travel time Cost Waiting time Safety
Muvmi (N=201, No)
Very Dissatisfied Dissatisfied Neutral Satisfied Very Satisfied

62
Figure 13: Satisfactory level of Muvmi
The result in Figure 14 confirmed that the free shuttle bus, CU Pop Bus,
stands highest (36%) at the satisfied level as expected and followed by Muvmi
(31%), Ha:mo (17%) and CU bike (16%). Among the paid sharing services, Muvmi
has a large number of users compared to Ha:mo. It is popular because of the user-
friendly application, users can easily add pick up and drop off point in app and this
service operates as on demand service.
1% 1% 3%0%
4%9% 9%
6%
55%
66% 65%60%
26%
18% 19%
26%
13%
5% 4%8%
0%
10%
20%
30%
40%
50%
60%
70%
Travel time Cost Waiting time Safety
Muvmi (N=370)
Very Dissatisfied Dissatisfied Neutral Satisfied Very Satisfied

63
Figure 14: Overall satisfactory level of all modes in CU
4.5 Reasons behind why students are not preferring to use
Different people have difference opinions on the provided services and
different preferences. This section discussed the reasons why students still say “No”
to different modes even though the price is reduced. These might be concerned with
the service quality, the environment, and their personal preference.
Firstly, looking at Ha:mo, 140 students out of 234 had limitation to register
Ha:mo because they did not have a driving license even though some of them could
drive. Driving license is a primary requirement for registration.
1% 0% 1% 2%8% 5% 4% 6%
55%
64%
78% 76%
34%26%
15% 14%
2% 5% 2% 2%
0%
10%
20%
30%
40%
50%
60%
70%
80%
90%
CU Pop Bus Muvmi Ha:mo CU Bike
(1) Very Dissatisfied (2) Dissatisfied (3) Neutral
(4) Satisfied (5) Very Satisfied

64
(a)
(b)
(c)
19%
5%
9%
60%
7%
0% 10%20%30%40%50%60%70%
You always go with group of
friends.
It is expensive for you,.
Limited parking station.
You don't have driving license.
Others
Ha:mo
7%
16%
8%
19%
50%
0% 10% 20% 30% 40% 50% 60%
You don't like to share with
others.
The waiting time is too long.
It is still expensive.
App is complex to use.
Others
Muvmi
20%
11%
34%
10%
25%
0% 10% 20% 30% 40%
It cannot be found easily.
You don't know how to ride
the bicycle.
Weather is too hot to ride the
bicycle.
Registration procedure is
complex.
Others
CU Bike

65
Figure 15: Reason behind why students are not interested to use
(a) Ha:mo (b) Muvmi (c) CU bike
Moreover, Ha:mo is a one-seater sharing vehicle service, which it is not
suitable for those who travel with friends. Out of 234, 45 respondents (19%) said that
they always went with friends and Ha:mo was not their choice in this case. Currently,
Ha:mo have had around 30 designated packing lots for vehicles around CU but it still
does not cover many places, and therefore limited number of parking station was
another reason which made this service unattractive.
When it turned to Muvmi, most of the students unliked it for other reasons
even they did not mention a specific reason. The reason “complexity of the App” and
“waiting time is too long” stood at the second and third rank why it was unappealing
to users. Now, Muvmi charges from 15 baht to 25 baht depends on the distance travel,
8.3% of respondents still felt that it was still expensive, and they preferred to choose
other inexpensive mode such as CU Pop Bus.
The weather in Bangkok is too hot and active mobility such as bicycling and
walking are not attractive to users. Among 176 respondents who said they did not
want to use bicycle, large proportion of respondents, 34% students, stated that they
were not interested to use it because of weather. CU has only five docking stations
around the campus so that limited number of docking stations probably make the
mode unattractive and students preferred to choose more convenient and comfortable
modes.

66
CHAPTER 5
DEVELOPMENT OF SHARED MOBILITY DEMAND MODEL
5.1 Introduction
To find the influential factors that have significant effect on the total
number usages that students tend to use for each mode provided in Chulalongkorn
University campus, regression analysis was used. Regression analysis is a statistical
tool to study about the significant correlation between dependent variable and at least
one independent variables (explanatory variables). Moreover, the strength of impact
(explanatory power) of independent variables, the significance of the regressors, on
the dependent variable could be evaluated. For those studies to formulate the linear
equation between dependent variable and more than one independent variables,
multiple linear regression analysis was utilized. The following equation (2) is a
general formula for multiple linear regression analysis.
Y= + X1+X2+..+Xk+u (2)
In this study, several independent variables (see in Table 5), namely spendable
amount of money that students could spend in a month, driving license, satisfactory
levels relating to each attribute, number of days normally travelling to campus, initial
awareness of each mode before survey, current frequency of usage, weekly expenses
for transportation going around CU and willingness to pay for each modes, were used
to explore the effect on total number of times that a user tends to use in the future for
each paid shared mobility mode, especially for Ha:mo and Muvmi service.
Before analyzing the data and discovering the significant effect of explanatory
variables on dependent variable, the data should satisfy with the following

67
assumption. The assumptions for linear regression model are (1) normality (2)
linearity (3) homoscedasticity and (4) absence of multicollinearity.
Table 5: Explanatory Variables in Regression Model
Variables Variable Description Unit
Independent Variable (Dummy variables)
Gender Gender if Female=1,
otherwise=0
Faculty Faculty if Science=1,
otherwise=0
Edu Education if Graduate=1,
otherwise=0
DL Driving License if Yes=1,
otherwise=0
SL
Satisfactory Levels for each service
attributes
if Satisfied or very
satisfied=1,
otherwise=0
Mode_Know Awareness of mode before if Yes=1,
otherwise=0
Independent Variables (Quantitative) W_exp Weekly expense for going around CU Baht
D_CU No. of days come to CU Days
Mode_PR Price reduction for each mode Baht
Mode_usage Current usage of each mode Times
Mode_moretimes Additional trips tend to use in future Times
SM
Spendable amount of money per
month Baht
5.2 Testing Linear Assumptions for Ha:mo Demand Model
As mentioned before, the four assumptions were explored initially. Normality
was checked whether the residuals of the regression are normally distributed or not.
This could be investigated from predicted probability (P-P) plot, if the residuals
distributed along the normality line, it could be said that the disturbance terms of the
regression were distributed normally. As seen in Figure 16, there was a bit deviation

68
from the normality line. However, we can assume that the residual meets the
normality assumption as there is no extreme deviations.
Figure 16: P-P Plot for Checking Normality Assumption for Ha:mo
Figure 17: Scatter Plot for testing Homoscedastic assumption for Ha:mo

69
Multicollinearity test: checking the correlation between independent variables,
the relationship among independent variables should be absent in order to generate the
best model that could predict the dependent variable. Multicollinearity can be checked
from correlation coefficients or variance inflation factor (VIF) values. According to a
rule of thumb, the absence of multicollinearity assumption meets when the tolerance
values should be greater than 0.1 and VIF value should be under 10 (Miles, 2014).
According to Table 6, collinearity statistics table, all the tolerance values were greater
than 0.1 and VIF values were less than 10. Therefore, one could say that there was no
correlation between independent variables.
Table 6: Collinearity statistics for checking multicollinearity for Ha:mo
Variables Collinearity Statistics
Tolerance VIF
1 Constant -- --
2 Driving license 0.922 1.085
3 Price Reduction of
Ha:mo 0.988 1.012
4 Current usage of
Ha:mo 0.902 1.109
5 Ha:mo Travel Time 0.897 1.114
5.3 Calibration of Ha:mo Demand Model
All the linear regression assumptions had been checked and already met. In
this step, multiple linear regression that could explain dependent variable was
generated. The primary purpose of this analysis was to explore the independent
variables that had effect on dependent variable, total number of times that users tend
to use Ha:mo in future. A model generated using stepwise method in SPSS, Statistical
Package for Social Sciences.
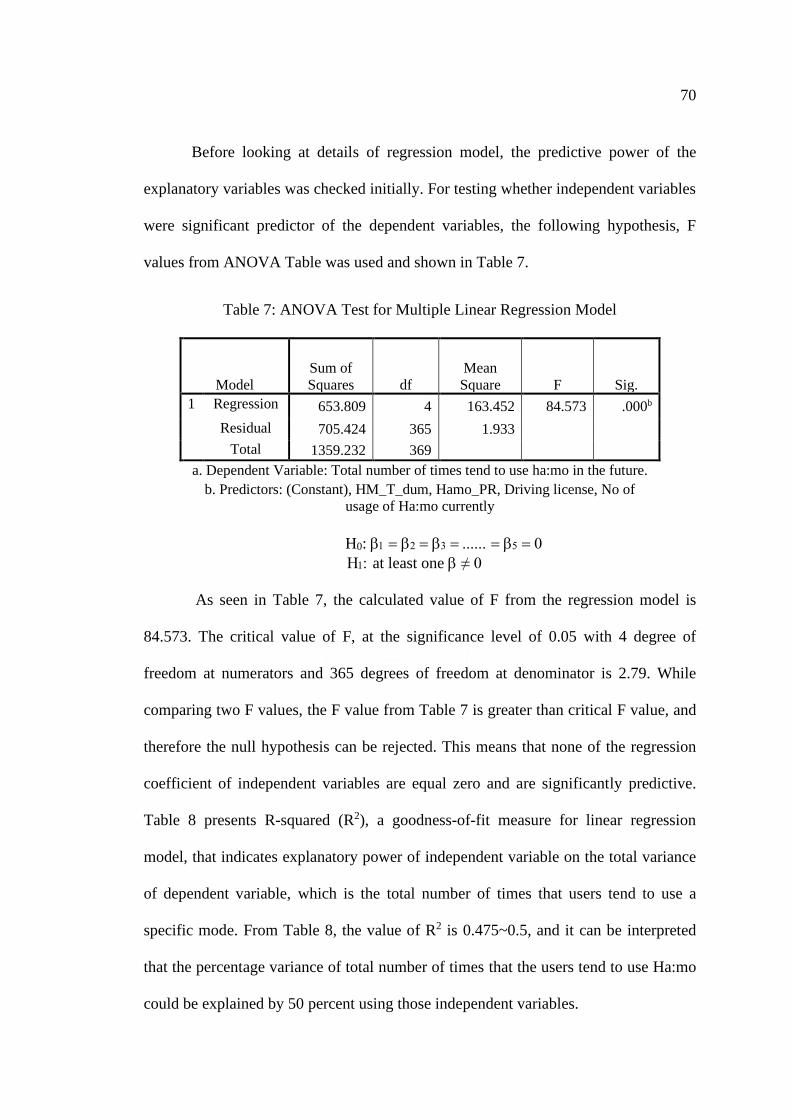
70
Before looking at details of regression model, the predictive power of the
explanatory variables was checked initially. For testing whether independent variables
were significant predictor of the dependent variables, the following hypothesis, F
values from ANOVA Table was used and shown in Table 7.
Table 7: ANOVA Test for Multiple Linear Regression Model
Model
Sum of
Squares df
Mean
Square F Sig.
1 Regression 653.809 4 163.452 84.573 .000b
Residual 705.424 365 1.933
Total 1359.232 369
a. Dependent Variable: Total number of times tend to use ha:mo in the future.
b. Predictors: (Constant), HM_T_dum, Hamo_PR, Driving license, No of
usage of Ha:mo currently
H0: = = = = =
at least one ≠ 0
As seen in Table 7, the calculated value of F from the regression model is
84.573. The critical value of F, at the significance level of 0.05 with 4 degree of
freedom at numerators and 365 degrees of freedom at denominator is 2.79. While
comparing two F values, the F value from Table 7 is greater than critical F value, and
therefore the null hypothesis can be rejected. This means that none of the regression
coefficient of independent variables are equal zero and are significantly predictive.
Table 8 presents R-squared (R2), a goodness-of-fit measure for linear regression
model, that indicates explanatory power of independent variable on the total variance
of dependent variable, which is the total number of times that users tend to use a
specific mode. From Table 8, the value of R2 is 0.475~0.5, and it can be interpreted
that the percentage variance of total number of times that the users tend to use Ha:mo
could be explained by 50 percent using those independent variables.

71
Table 8: Model Summary
Model R R Square
Adjusted R
Square
Std. Error of the
Estimate
1 .694a .481 .475 1.390
a. Predictors: (Constant), Ha:mo_PR, Number of usages of ha:mo
currently, Hamo travel time, Driving license
b. Dependent Variable: Total number of times tend to use ha:mo in the
future.
The model was calibrated, and the result is shown in Table 9. Based on the
model, the regression equation can be written as follow:
Y = 0.336 + 0.589X1 +0.048X2 + 1.781X3 + 0.511X4 (11)
where: Y = total number of times tend to use Ha:mo in the future
X1=driving license,
X2=price reduction,
X3= current usage of Ha:mo, and
X4= Satisfaction level of Muvmi travel time.
Table 9: Multiple Linear Regression Model for Ha:mo
Model
Unstandardized
Coefficients
Standardized
Coefficients
t Sig.
B
Std.
Error Beta 1 Constant .336 .112 3.012 .003
Driving license (1=Yes) .589 .155 .149 3.803 .000
Price Reduction of
Ha:mo(THB) .048 .014 .126 3.331 .001
Current usage of Ha:mo 1.781 .120 .591 14.893 .000
Ha:mo Travel Time
(1=Satisfied) .511 .174 .117 2.936 .004
a. Dependent Variable: Total number of times tend to use Ha:mo in the future.

72
Significant test for each independent variable whether it had significant
correlation with the dependent variable, P values, in Table 9 was carried out. If P
value is greater than 0.05, it means no significant association between dependent
variable and independent variables at 95% confidence level. In such a condition, the
change of independent variables would not affect dependent variable. However, in
Table 9, P values of all explanatory variables were less than 0.05, thus, showing
significant association with the future prediction of Ha:mo. A unit change in
dependent variable can be affected by a unit change in an independent variable.
Regression coefficient () indicates the important order of independent
variable to the dependent variable. In the above model, all the coefficients have
positive sign, indicating a mean of predictor variable increases when the values of
explanator variable increase. For instance, the coefficient of current usage of Ha:mo,
the most important variable, is 1.781. Therefore, the mean of total number of times
using Ha:mo increases by 1.781 with a unit increase in current usage of Ha:mo while
the other variables are holding constant. In other word, the students who currently
have experience in using Ha:mo may use it more in future, compared to those who do
not have experience.
Similarly, the marginal effect of possession driving license, satisfaction on
Ha:mo travel time and price reduction were 0.589, 0.511, and 0.48 respectively. The
second most important variable is driving license possession. Students with driving
license have higher average total usage of Ha:mo by 0.589, compared with those who
do not have driving license. It makes sense that, the need of driving license is a basic
requirement for registration of Ha:mo. For this mode, only users who have driving
license are accessible. In the same way, travel time of Ha:mo which is attractive

73
attributes to Ha:mo users, as this service does not have waiting time and users can
drive directly to their destination point. If users have positive experience in traveling
with Ha:mo, they probably continue using it more in future. Last but not least, price
reduction is another independent variable that could affect the total number of usage
of Ha:mo. Mathematically, total number of usage of Ha:mo tends to increase 0.48
times while the price is reduced by ten baht.
Other independent variables were excluded from the model as they had high P
values and had no significant correlation with dependent variable. Keeping these
variables could reduce precision of the model.
5.4 Testing Linear Assumptions for Muvmi Demand Model
The same procedure with Ha:mo, for multiple linear regression analaysis, was
applied for Muvmi, Tuk Tuk sharing service. Initially, testing the four assumptions
for linear regression model were performed.
As seen in Figure 18, the error between observed and predicted values are
normally distributed along the normality line. Therefore, the residual of the predictors
meets the normality assumption even though little deviations can be seen in the Figure
18.

74
Figure 18: P-P plot for Checking Normality Assumption for Muvmi
Figure 19: Scatter Plot for testing Homoscedastic assumption of Muvmi
The tolerance values, the measure of the influence of one independent variable
on other independent variables and the variance inflation factors of linear regression
(VIF) was used to test the multicollinearity. As mentioned before, the tolerance values
of all independent variables were greater than 0.1. From Table 10, all VIF values were
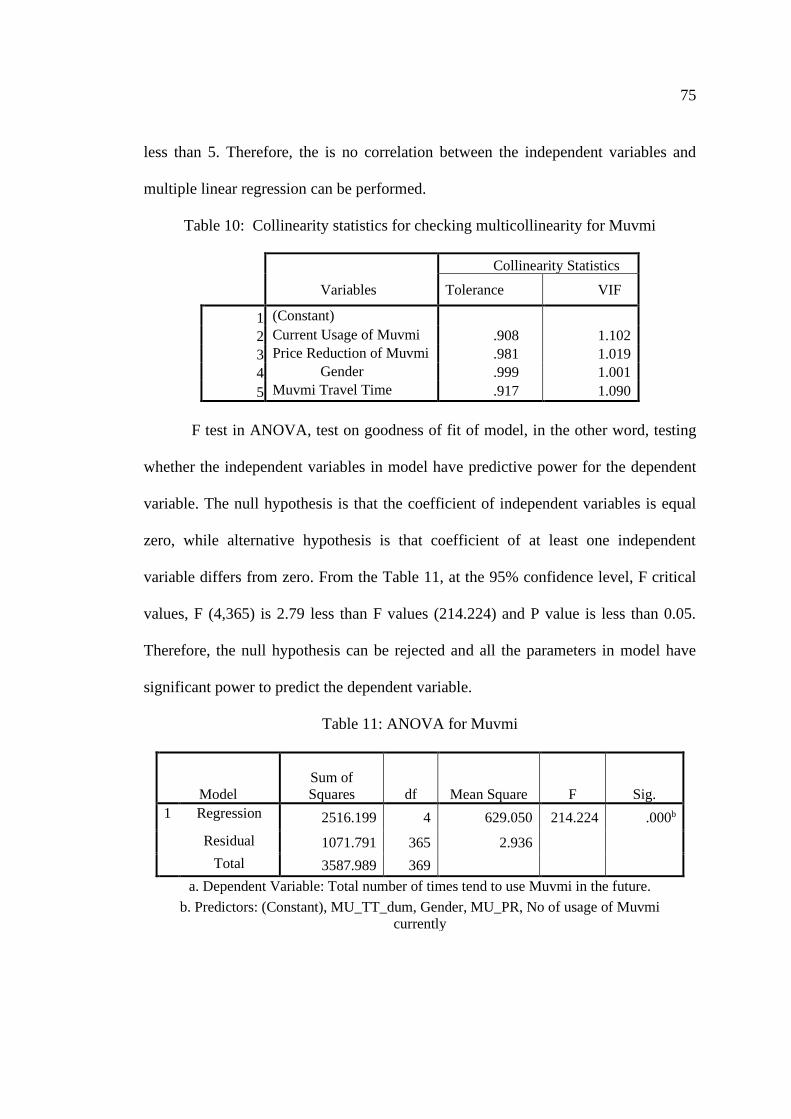
75
less than 5. Therefore, the is no correlation between the independent variables and
multiple linear regression can be performed.
Table 10: Collinearity statistics for checking multicollinearity for Muvmi
Collinearity Statistics
Variables Tolerance VIF
1 (Constant)
2 Current Usage of Muvmi .908 1.102
3 Price Reduction of Muvmi .981 1.019
4 Gender .999 1.001
5 Muvmi Travel Time .917 1.090
F test in ANOVA, test on goodness of fit of model, in the other word, testing
whether the independent variables in model have predictive power for the dependent
variable. The null hypothesis is that the coefficient of independent variables is equal
zero, while alternative hypothesis is that coefficient of at least one independent
variable differs from zero. From the Table 11, at the 95% confidence level, F critical
values, F (4,365) is 2.79 less than F values (214.224) and P value is less than 0.05.
Therefore, the null hypothesis can be rejected and all the parameters in model have
significant power to predict the dependent variable.
Table 11: ANOVA for Muvmi
Model
Sum of
Squares df Mean Square F Sig.
1 Regression 2516.199 4 629.050 214.224 .000b
Residual 1071.791 365 2.936
Total 3587.989 369
a. Dependent Variable: Total number of times tend to use Muvmi in the future.
b. Predictors: (Constant), MU_TT_dum, Gender, MU_PR, No of usage of Muvmi
currently

76
Another measure, R-squared also can measure the goodness of fit of the linear
regression model. Theoretically, if adjusted R-square is larger than 0.5, we can say
that the model is good. According to Table 12, the adjusted R-squared value is 0.698,
or can say that independent variables in the model could predict 69% total variance of
the dependent variable, the total number of times tend to use Muvmi in future.
Table 12: Model Summary for Muvmi
Model R
R
Square
Adjusted R
Square
Std. Error of the
Estimate
1 .837a .701 .698 1.714
a. Predictors: (Constant), MU_TT_dum, Gender, MU_PR, No of
usage of muvmi currently
b. Dependent Variable: Total number of times tend to use Muvmi in
the future. After doing significant test of the overall model, the significance of individual
regressor should be explored in the following step. In general, P value of all
independent variables are less than 0.05, thus, all the independent variables have
significant correlation with the dependent variable.
5.5 Calibration of Muvmi Demand Model
Table 13 presents the final calibration of Muvmi demand model. Regression
coefficients of all independent variables are positive. It implies that a unit increase of
the dependent variable could occur by a unit increase of one independent variable
while the other variables are holding constant in multiple linear regression model. The
regression coefficients of current usage of Muvmi, price reduction, gender and travel
time are 1.589, 0.121, 0.418 and 0.664 respectively.
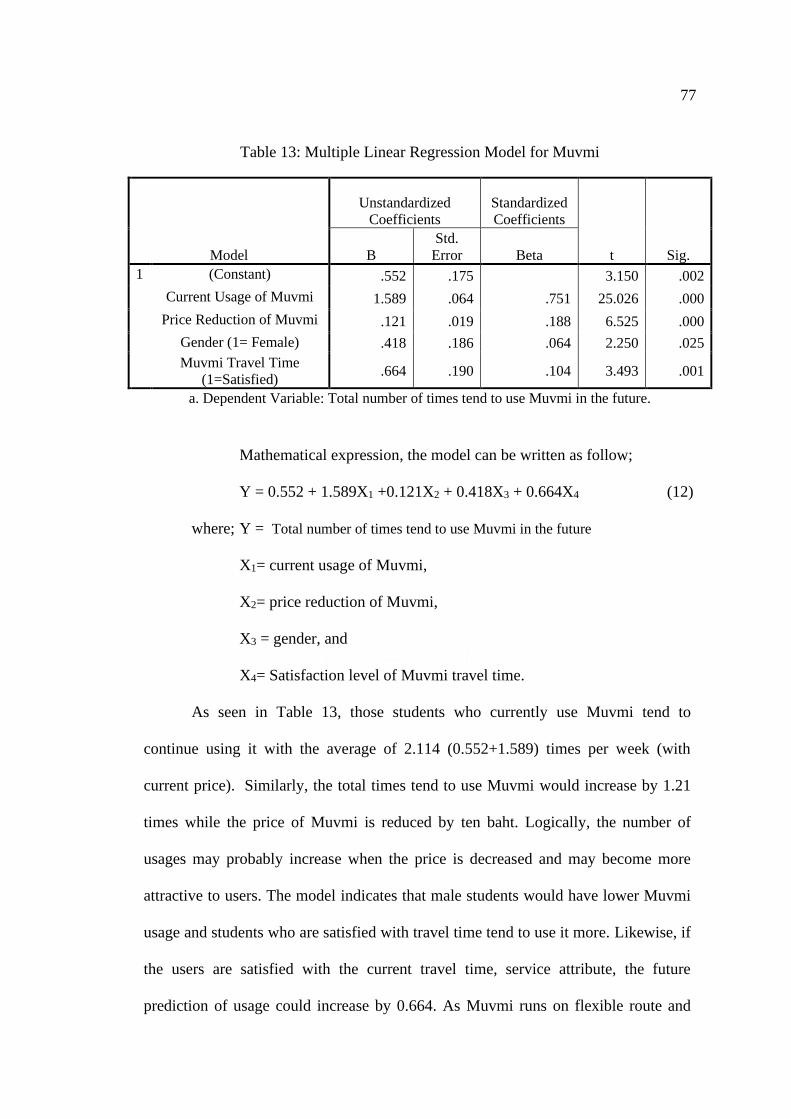
77
Table 13: Multiple Linear Regression Model for Muvmi
Model
Unstandardized
Coefficients
Standardized
Coefficients
t Sig. B
Std.
Error Beta
1 (Constant) .552 .175 3.150 .002
Current Usage of Muvmi 1.589 .064 .751 25.026 .000
Price Reduction of Muvmi .121 .019 .188 6.525 .000
Gender (1= Female) .418 .186 .064 2.250 .025
Muvmi Travel Time
(1=Satisfied) .664 .190 .104 3.493 .001
a. Dependent Variable: Total number of times tend to use Muvmi in the future.
Mathematical expression, the model can be written as follow;
Y = 0.552 + 1.589X1 +0.121X2 + 0.418X3 + 0.664X4 (12)
where; Y = Total number of times tend to use Muvmi in the future
X1= current usage of Muvmi,
X2= price reduction of Muvmi,
X3 = gender, and
X4= Satisfaction level of Muvmi travel time.
As seen in Table 13, those students who currently use Muvmi tend to
continue using it with the average of 2.114 (0.552+1.589) times per week (with
current price). Similarly, the total times tend to use Muvmi would increase by 1.21
times while the price of Muvmi is reduced by ten baht. Logically, the number of
usages may probably increase when the price is decreased and may become more
attractive to users. The model indicates that male students would have lower Muvmi
usage and students who are satisfied with travel time tend to use it more. Likewise, if
the users are satisfied with the current travel time, service attribute, the future
prediction of usage could increase by 0.664. As Muvmi runs on flexible route and

78
can drop users at their destination point. The service also has the least travel time
compared to other modes such as CU Pop Bus which runs in fixed routes.
5.6 Chapter summary
This chapter employs multiple linear regression to develop Ha:mo and Muvmi
demand models. The regression analysis reveals that some factors are associated with
demand, such as gender, having driving license, being the current user of services,
and satisfaction on the current services (travel time). It seems that students who are
currently using these services (Ha:mo and Muvmi) tend to use it more than the other
group in the future. For Muvmi users, the result explains that female probably feels
more comfortable to share the ride with other passengers. Comparing the results from
Ha:mo, gender is not associated with the amount of usage.

79
CHAPTER 6
DATA COLLECTION AND ANALYSIS FOR SHARED MOBILITY
PACKAGE
This chapter explores the way creating shared mobility package to test the
preference of each attributes from service packages, data collection for shared
mobility package questionnaire and followed by exploring socio-demographic
characteristics of the respondents, their mode choice and satisfaction level on the
current service quality.
6.1 Mobility Package Design
Experimental design is a vital concept of choice modeling. A discrete choice
experimental design composes of several choice sets, and each choice set contains
more than one alternative which is the combination of related several attributes and
their levels. Discrete choice experiment is a quantitative method of this study to
evaluate the value of different attributes and their levels that influence the
respondent’s (customer) decision. Moreover, it helps researchers to understand
customers’ choice decision relating with their socioeconomic characteristics. Discrete
choice experimental method is very attractive for researchers and policy makers as it
can weigh different factors and trade-off between them. Most of the choice set are
hypothetical scenarios (products or services) and it is widely used in various fields
such as marketing (Chintagunta & Nair, 2011; Louviere & Hensher, 1983; Zwerina,
1997), transportation field (Ben-Akiva & Bierlaire, 1999; Truong & Hensher, 1985;
Washbrook et al., 2006), environmental studies (Hackbarth & Madlener, 2013; Hoyos
et al., 2015) and health care studies (Ryan & Gerard, 2003; Viney et al., 2002).

80
Since hypothetical scenarios are the combination of different attributes, the
number of combinations also depend on the number of attributes and their levels that
researchers would like to test. For example, there are 128 possible combinations in
total when there are seven attributes and having two levels each by full factorial
design. It is difficult to test all the combinations as it is costly to survey administrator
and could place burden on respondents, causing low respondent rate or inaccurate
answers. In order to solve the above problem, fractional factorial design is popular
and widely used in choice modeling as it reduces the number of combinations to test
and cost effective in practice (Ryan et al., 2012).
The orthogonal design is an effective way to reduce full set of scenarios (full
factorial design) to a governable level (fractional factorial design). Before generating
the choice sets, the researcher might need to decide whether both main effect and
interaction effect might be considered in the study as the main effect consideration
only might already generate a large number of combinations as well. Orthogonal
design can be generated using statistical packages such as SPSS software, Sawtooth
software and Minitab software. However, there are some optimal choice design
catalogues available in some studies (Bush, 2014). For this study, a choice design
catalogue generated from orthogonal arrays will be used to create the package
combinations and presented in Table 14.

81
Table 14 choice design for 7 attributes and 2 levels each (Bush,2014)
Option A Option B
0 0 0 0 0 0 0 1 1 1 1 1 1 1
0 0 1 1 1 1 0 1 1 0 0 0 0 1
0 1 0 1 0 1 1 1 0 1 0 1 0 0
0 1 1 0 1 0 1 1 0 0 1 0 1 0
1 0 0 0 1 1 1 0 1 1 1 0 0 0
1 0 1 1 0 0 1 0 1 0 0 1 1 0
1 1 0 1 1 0 0 0 0 1 0 0 1 1
1 1 1 0 0 1 0 0 0 0 1 1 0 1
6.2 Selection of Attributes and Their Levels
In this section, selection of attributes that might reflect to the user’s choice
decision on the package will be discussed. Generally, there are two type of factors: 1.
package attributes (modes and their service features) 2. sociodemographic factors
(age, educational level, personal monthly income, etc.,).
Level of mode attributes and service attributes should be carefully selected in
order to create more realistic and attractive packages to customers. The problem of
complexity for respondents can be eased while choice tasks are meaningful,
understandable, and handled. From the lesson learned from previous two chapters, the
service attributes that students were likely dissatisfied would be considered in the
creation of the package. However, the selected attributes were considered under these
conditions: 1. they should be realistic for both service providers and users, 2. they
should be helpful features in students’ daily mobility. The selected attributes and
levels are shown in Table 15.

82
Table 15: Attributes and their levels for bundling package
Attributes Attribute levels
Ha:mo 5, 10
Muvmi 5, 10
Carry-over unused trips Yes, No
Having priority for Ha:mo Yes, No
Faster pickup speed for Muvmi Normal, Pickup within 10mins
Free ride per month Yes, No
Package price Normal Price, 20% Discount
Service Attributes
Ha:mo: Car sharing service, Ha:mo, is the second least popular mode in
Chulalongkorn University. This might be because of the driving license requirements
and some students might not know how to drive especially for the first-year students.
So, current access to Ha:mo is limited for students. However, a group of students
presently prefer to use Ha:mo as it is private and fastest mode. From the previous
chapter(s), students use Ha:mo approximately five times per week in maximum which
is equal to 20 times per month. Thus, attribute level five rides per month and ten rides
per month are appropriate to be chosen for later study.
Muvmi: Ride sharing service, Muvmi has become popular among students as
it is targeting to every student in CU as it does not need special requirement such as
driving license, as Ha:mo. Generally, students use Muvmi nine times per week in
maximum equating to 36 times per month. However, the same level as Ha:mo service,
five rides and ten rides per month are considered.

83
Service Attributes
Carry-over: The users can transfer the unused trips to the next consecutive
month when they buy too many trips in their package (or use less in a particular
month). The minimum number of trips included in the package are ten trips which
might be more than actual usage for some package users. Thus, this kind of service
feature is beneficial for the users as they do not need to worry for the remaining trips.
Having Priority for Ha:mo: This feature refers to giving priority to the users
who buy monthly subscription package than normal pay-per-ride users whenever they
book for vehicles. The current Ha:mo users are less satisfied with the service
availability as seen from the answers of the first questionnaire in the Chapter 4.
Pick-up Speed: This refers to the time it takes for a vehicle to reach to user
pick-up point after booking for a trip. Normally, Muvmi service takes ten to fifteen
minutes to gets a vehicle due to high demand and limited number of vehicles. Once
the users subscribe the mobility package, the user can get this special feature once
includes in package. It may help users to reduce waiting time whenever users place
booking.
Price: This is monthly subscription price of the packages which includes all
rides and special incentive features in the package with special discount than users.
The results of questionnaire analysis in Chapter 4 indicated that students could spend
a minimum 400 THB per month for transportation in case of going around
Chulalongkorn campus area. Therefore, the range of package price was set between
160 THB to 400 THB to cover all students.

84
A total sixteen optimum package among 128 combinations with various
attributes were selected using the optimum choice design in Table 14. In the final
arrangement, each respondent had eight different scenarios which consisted of two
alternatives. The respondents chose one alternative which they preferred the most or
alternative that nearly met their mobility needs. The example of the package design
can be seen in below.
Figure 20: Example of Monthly Package Design
6.3 Questionnaire Design for Shared Mobility Package
Final survey consisted of three parts: firstly, personal socio-demographic
characteristics (i.e., gender, education level, personal income, student’s
accommodation and driving license) as the location of accommodation was expected
to have influence on the mode choice; in other words, students who lived in dormitory
or within 2km from Chulalongkorn University were expected to use shared mobility
(Ha:mo and Muvmi) more compared to students who stayed more than 2km away

85
from CU. Secondly, their travel characteristics, mode choice and their satisfaction
level on Ha:mo and Muvmi services was assumed to be based on the current service
quality and price. Later on, a short description about the service package with special
incentive that users would get, how the integrated app would work for the service, and
how it would help in daily mobility were mentioned in order to make sure respondents
understand clearly before going to the third part. Sixteen different combinations were
provided in eight scenarios with no opt-out (neither choice) option. Lastly,
respondents were asked whether they still would like to choose the service package or
not if they had pay per ride option in hand. It could be seen the preference or the
interest on the additional feature of the service package. Detail of the questionnaire
survey can be found in Appendix B.
6.4 Data Collection and Socio-demographic Characteristics of
respondents
The total of 343 respondents were obtained for mobility package
questionnaire, while 17 respondents were eliminated as they were non-students from
Chulalongkorn University. Hence, the total response of 326 samples were used for
further analysis. This data was collected using online approach, in which the
questionnaire was distributed in various platforms to reach to CU students starting
from 1st April to 30th April 2020 for first round and 2nd July to 10th July 2020 for
second round.
In this questionnaire survey, various questions about socio-demographic
characteristics were asked individually. As the target group of this study was the
students from Chulalongkorn University, thus it included not only undergraduate

86
students but also graduate students. Table 16 shows that more than half of the
respondents were male (56.7%) while the rest (43.3%) were female. Comparing the
actual proportion of population, the sample of male respondents were over-
represented as CU has only 40.5% of male and 59.5% of female respectively as
mentioned in section (4.2).
For the education level, the data was separated into two groups: undergraduate
students and graduate students. In a further analysis, these two groups were expected
to have different travel characteristics and preference on the mobility package as most
of the graduate students were less likely come to campus compared to the
undergraduate students. In term of percentage, 73.6% of sample came from
undergraduate students while 26.4% were from graduate students.
Table 16: Socio-demographic characteristics of the respondents (N=326)
Frequency Percentage (%)
Gender Male 185 56.7
Female 141 43.3
Education
Undergrad Students 240 73.6
Graduate Students 86 26.4
Accommodation
CU dormitory 63 19.3
Place within 2km away from CU 65 19.9
Place more than 2km away from CU 198 60.7
Driving License
No 154 47.2
Yes 172 52.8
Personal Income
<5000 THB 71 21.8
5000-10000THB 160 49.1
10001-15000THB 56 17.2
15001-20000THB 10 3.1
>20000 THB 29 8.9

87
Another socio-demographic variable is personal income which is essential
variable in transport related studies as it is more likely to influence on the decision
making in daily mobility. It was expected that high income students would be more
likely to have more options to choose (Ha:mo and Muvmi) which were paid service.
In other words, it was predicted that the packages might be more attractive to the
high-income students. However, it is clearly that nearly half of the students (49.1%)
had their spendable amount of money in the range of 5000 THB-10000 THB per
month for their living which was nearly the same proportion in the previous survey,
while only 12 percent of the population could spend over 15000 THB per month for
their expenses.
Another variable, the location of the students’ accommodation, is compulsory
as it can explain the chosen mobility service available in CU. As mentioned in
previous chapter, the services provided by CU are only available in specific subareas
in the campus. Thus, students who stay in university dormitories or within 2km away
from CU campus were predicted to have high probability on the usage on the shared
mobility service for commuting from/to and within CU. Currently, over 50% of the
respondents, exactly 61%, lived more than 2km away from CU. It is not certain,
however, that the rest of students (40%), who stay in student dormitory and residents
within 2km from CU, would completely choose the paid service as their mode choice
options also include CU Pop Bus (free service) and other available means in CU.
In the previous chapter, driving license is a variable which is highly related
with the accessibility of Ha:mo, since it requires driving license for registration.
Given that most of the respondents were undergraduate students, so it was not

88
surprising that 47.2% of the sample did not have a driving license. However, the
questionnaire used a stated preference approach and assumed that everyone had
driving license and had Ha:mo service option in hand. Every respondent was
answering the questionnaire under the same condition. Therefore, all the data would
be utilized for modeling in the coming section.
6.5 Mode Choice and Satisfaction Level of Respondents
Mobility characteristics of the CU students were explored in the section.
Regrading to their commuting modes to and from Chulalongkorn University, the
majority of samples used Bangkok Mass Transit System (BTS sky train), Mass Rapid
Transit (MRT subway), respectively, as CU is located in the central accessible area
that can be accessed by both metro systems. As stated in previous section, majority of
samples in this study stayed more than 2km away from CU, hence it was not
surprising to see the highest number of usages of BTS and MRT. Minority of students
(15% of respondents) came by bus. It is noted that the bus service is the cheapest
mode among all public transport and the most affordable mode for students. The most
important finding was that most of the students also relied on the service provided by
CU for daily mobility.

89
Figure 21: Mode Choice of Students for going to and from Chulalongkorn University
Considering the trips that students went around CU campus area, we
could clearly see that free shuttle bus was the most popular mode among all provided
services and had the highest percentage of usage by students. From the survey,
highest proportion of students (48.5%) were using CU Pop Bus more than 8 times in a
month. Very low percentage (5.2%) of respondents had never used the CU Pop Bus
before while over 70% of respondents had never used the shared mobility modes. On
the contrary, above 7% of respondents used Ha:mo and CU Bike twice a month while
nearly 17% had used Muvmi one or two times a month.
However, less than 10% of the respondents used Ha:mo, Muvmi, and CU Bike
more than two times per month. As explained in the previous chapter, some modes
were less popular due to longer waiting time and driving license limitation to access
the mode.
51%
15%
14%
15%
1%
2%
2%
0% 10% 20% 30% 40% 50% 60%
BTS,MRT
Public Bus
Private Car
Services provided by CU
Van
Walk
Motorcycle Taxi

90
Figure 22: Mode usage for going around CU campus area
Figure 23: Amount of money spend for internal mobility service
Figure 23 shows the amount of money that students spent for mobility service
in CU for going around the campus. Personal income was asked in the previous
questionnaire, and the result shows that students spent around 1000 THB per month
on average for traveling in and around CU. Therefore, this question was repeated in
this second questionnaire to confirm again. The above figure shows that over 60% of
5.2
0%
86
.80
%
71
.50
% 86
.80
%
12
.30
%
9.2
0%
17
.20
%
7.7
0%16
.90
%
2.5
0%
7.4
0%
3.7
0%1
7.2
0%
0.3
0%
1.5
0%
0.9
0%
48
.50
%
1.2
0%
2.5
0%
0.9
0%
POPBUS HA:MO MUVMI CU BIKE
Never 1-2 times/month 3-5 times/ month
6-8 times/month >8times/month
63.80%
18.10%
7.70%
3.10%
7.40%
0.00% 10.00% 20.00% 30.00% 40.00% 50.00% 60.00% 70.00%
<200 THB
200-400 THB
400-600 THB
600-800 THB
>800 THB

91
students spent less than 200 baht per month and around 82% of students could spend
up to 400 THB per month. It is consistent with the package price which was 150 to
400 THB per month. The results assure that the proposed mobility package prices are
within the affordable price range for the students.
Table 17: Descriptive Statistics of Mode Usage of Students
Variables N Minimum Maximum Mean Std.
Deviation
1 Personal Income baht/month 326 2500 22500 8911.45 5561.1
Current Usage of Shared
Mobility provided by CU
2 Pop Bus times/month 326 0 18 12.727 5.63525
3 Ha:mo times/month 326 0 18 0.7699 2.52602
4 Muvmi times/month 326 0 18 1.9877 3.80605
5 CU Bike times/month 326 0 18 1.0521 2.86524
6
Expense for
going around
CU
baht/month 326 100 900 244.17 238.869
From Table 17, we could see the average usage of each mode in one month
and average expense for going around CU as well. When service separate into two
groups: free service mode (CU Pop Bus and CU Bike) and paid service mode (Ha:mo
and Muvmi), it can be seen that the average number of times that students used CU
Pop Bus in one month (Avg=12.727, SD=5.64) was significantly the highest. Even
though the service was free, CU bike usage was very low (Avg=1.0521, SD=2.865)
compared to CU Pop Bus. In the same way, current usage of Ha:mo in one month
(Avg=0.7699, SD=2.526) was less than Muvmi usage (Avg=1.99, SD=3.806). In
general, CU Pop Bus was the most popular mode among four modes. In addition,
students could spend around 250 THB per month for going around CU while they are
getting money around 8900 THB per month in average.

92
6.6 Correlation between explanatory variables
Figure 24 shows Pearson correlation between socio-demographic
characteristics of the respondents and their interest in the service packages. It is noted
that only the correlation between two variables that are significant at 0.1 level are
shown. A positive correlation indicates a unit increase of one variable would make a
unit increase in the corresponding variable. As seen in the Figure 24, the correlation
value between education level and person income is the highest (0.5) and it is
positively correlated. This implies that senior year students get higher income than
other junior class students. For the interest in package, expense for transportation
going around CU is 0.1 and positively correlated. It means that the more the students
spend for transportation, the more they are interested in service package. It is logical
in that the frequent travelers tend to prefer more discounted price and other privilege
service features to normal services. Another important consideration is the association
between accommodation and usage of internal service. They are negatively correlated,
and it can be implied that those students living more than 2km away from CU less
likely use internal mobility service provided by CU. In the other words, they seem
rely on the other public transport such as BTS, MRT and buses.

93
Figure 24: Correlation between socio-demographic characteristics and interest in
package

94
CHAPTER 7
DEVELOPMENT OF SHARED MOBILITY PACKAGE MODEL
This chapter discusses mainly about development of package demand
models for shared mobility services which would be the answer for the final
objective: determine the attributes of the shared mobility package which have effect
on student’s decision. Binary logistic regression and mixed logit analysis were used to
find factors or attributes influencing on their preference of service packages. In
previous chapter, we have investigated various variables and the correlation between
them. For upcoming model analysis, service package attributes and some socio-
demographic variables which had significant effect on choice decision were selected.
Table 18 shows quantitative and qualitative explanatory variables that would be used
in model.
Table 18: Explanatory Variables for Mixed Logit Model
Variables Variable Description Unit
Independent (Quantitative) Variables Hamo Number of trips of Ha:mo in package Trips
Muvmi Number of trips of Muvmi in package Trips
Price Service package price THB
Income Individual monthly income THB
Independent (Qualitative) Variables (Dummy Variables)
Carryover
Transferable unused trip to next consecutive
month =1 if Yes, = 0 if No
Priority Priority for Ha:mo service =1 if Yes, = 0 if No
Pickup Speed Pickup Speed for Muvmi service =1 if Faster pickup
speed,= 0 if Normal
pickup speed
Free Trip Offer free trip on selected routes and time =1 if Yes, = 0 if No
Gender Gender
= 1 if Female,
otherwise= 0

95
7.1 Calibration of Shared Mobility Package Model by Logistic
Regression
Assuming that the respondents were answered the binary response (Yes, No)
for each package, the collected data was analyzed using logistic regression to explore
the significant of each package attributes on the decision making of students. The
probability of choosing each individual package can be written as
P = F(Z) = 1
1+𝑒−𝑧 (3)
while z is the utility of each package. The estimated coefficient of logistic regression
analysis for each variable can be seen in Table (19).
Table 19: Estimation of Logistic Regression Model
Attributes Estimated
coefficient
Std.
Error Z value Pr(>|Z|)
Intercept 0.80669 0.14352 5.621 1.90E-08 ***
Ha:mo 0.01798 0.0213 0.844 0.39861
Muvmi 0.06029 0.02144 2.813 0.00491 **
Carryover 1.68714 0.06457 26.129 <2e-16 ***
Pickup Speed 0.36637 0.0631 5.806 6.40E-09 ***
Priority 0.32023 0.06339 5.052 4.37E-07 ***
Free Trip 0.35341 0.06295 5.614 1.98E-08 ***
Price -1.02303 0.10237 -9.993 <2e-16 ***
Number of Observation 5216
Null Deviance 7230.9
Residual Deviance 6146.8
R square 0.149
Adjusted R square 0.148
Significance : 0 ‘***’ 0.001 ‘**’ 0.01 ‘*’ 0.05 ‘.’ 0.1 ‘ ’1
As seen in Table (19), the number of trips of Ha:mo in the package has a
positive coefficient which means the increase of trips of Ha:mo in packages could
increase the utility of the package. However, it is not significant, so that, we cannot
certain whether it influence on respondents’ decision nor not. Similarly, the

96
coefficient of number of trips of Muvmi in the package is positively significant.
Therefore, the number of trips of Muvmi in the package has a significant influence on
the decision making. The coefficient of other service package attributes, such as
carryover of unused trips to next consecutive month, priority of using Ha:mo, faster
pickup speed for Muvmi and getting free trips are 1.68714, 0.3202, 0.3663 and
0.35341. Those attributes are positively significant on the utility of the package as
well. In the other word, having one of these service attributes in the package could
increase the utility of choosing the package. In general, we could say that the
respondents prefer to have these privilege features of the service in packages once
they buy the monthly integrated service package. For the price of service package, the
estimated coefficient is -1.023 which is negatively significant. The increase of the
package price could decrease the utility of the package.
7.1.1 Marginal Effects
Marginal effect could express the change of probability of choosing the
package while one of the attributes in the package change by one unit. Table (20)
shows the marginal effect of each service attributes.
Table 20: Marginal effects of Service Attributes in Package
Attributes Marginal Effect
Ha:mo 0.0225
Muvmi 0.0752
Carryover 0.3984
Pickup Speed 0.0913
Priority 0.0799
Free Trip 0.0881
Price -0.2558
A unit increase in number of trips of Ha:mo in the package could increase the
probability of choosing package could be increase by 0.0225. For the number of trips

97
of Muvmi in the package, a unit increase of it could increase the probability of the
package by 0.0752. The marginal value of carryover feature is 0.3984 which is the
highest among all other attributes. Probability of choosing the package with carryover
service attributes is higher 0.3984 times compare to the probability of the package
without carryover feature in package. Having pickup speed feature for Muvmi in the
package could increase the probability of choosing package by 0.0913 while the other
attributes are holding constant. The marginal value for priority of using Ha:mo and
getting free trip when buying package are 0.0799 and 0.0881. For price, the marginal
value is -0.2558 which means a unit increase of package price could decrease the
probability of choosing the package by 0.2558 times.
7.2 Calibration of Shared Mobility Package Model by Mixed Logit
A model was developed to explain the package preference using Mixed Logit
(ML) or Random Parameter Logit (RPL) method which allows high level of
flexibility and reveal heterogeneous preference of the sample population. In mixed
logit, it is necessary to assume distribution of random parameters such as normal, log
normal, uniform, triangular, etc. For this study, the coefficient of number of trips of
Ha:mo, number of trips of Muvmi, special features: carryover, priority, pickup speed
and free trip could be both negative and positive sign, so that, these random
parameters were assumed to be normally distributed. Random parameters with normal
distribution are popular and commonly used in mixed logit studies. However, price
coefficient is assumed to be fixed as price coefficient with the normal distribution
could probably generate the wrong sign. This model used data from all respondents
(326 samples) who answered the questionnaire except some outliers. There are eight
games, two packages in each game, so that, total 5216 observations were be used. The

98
model included alternative attributes of the packages: number of trip of Ha:mo,
number of trip of Muvmi and other special privilege features such as carryover of
unused trip, having priority for Ha:mo service, faster pickup speed, number of free
trip and discounted package price. The definitions and explanations of these attributes
appear in the previous Chapter. Table 21 presents the model estimation result with
normally distributed random parameters such as Ha:mo, Muvmi, priority, pickup
speed, free trip and carryover.
Table 21: Estimation of Mixed Logit Model with Normal Distribution
Mean
Coefficient (SD) Std. Error Z-value P value
Ha:mo 0.0196 (0.1608)*** 0.0197 0.9941 0.3201
Muvmi 0.0477 (0.1309)*** 0.0202 2.3605 0.0182*
Carryover 1.1696 (1.0566)*** 0.0834 14.0315 <2.2e-16***
Pickup Speed 0.2537 (0.0029) 0.091 2.7859 0.005**
Priority 0.2154 (0.0010) 0.0593 3.6338 0.0002***
Free Trip 0.2384 (0.0021) 0.0909 2.6226 0.0087**
Price -0.7311 0.1018 -7.1783 7.059e-13***
Gender -0.2638 0.1083 -2.4375 0.0147*
Income 0.0176 0.0069 2.5586 0.0105*
Number of
respondents 326
Number of observations 5216
Log-likelihood -1464.5
Significance : 0 ‘***’ 0.001 ‘**’ 0.01 ‘*’ 0.05 ‘.’ 0.1 ‘ ’1
As seen in above table, most of the package attributes are statistically
significant at 95% of confident level and affect the probability of choosing service
package. However, estimated coefficient of number of Ha:mo trips is not statistically
significant in the model as P value is greater than 0.05, but logically the signs are
realistic.
By looking at the mode service attributes: number of trips of Ha:mo and
Muvmi, both attributes have positive sign, which means a unit increase of the

99
attributes could increase the utility of the package. In other words, the positive
coefficient means having these feature in the package would be more attractive for
customers. However, the coefficient of Ha:mo service attribute (0.0195) is not
significant at 95% , which means that the presence of Ha:mo service in the package
does not have a significant effect on their decision making, while the offering of
Muvmi service attribute (0.0477) does impact the decision making of purchasing the
mobility package. Additionally, significant standard deviation explains heterogeneous
consideration of parameters among the population. The standard deviation of Muvmi
(0.1309) is statistically significant, so that, the decision considering Muvmi service
vary individually. Generally, this could imply that students prefer Muvmi service
more than Ha:mo service in considering the mobility package. This result is also
consistent with the previous discussion.
Other service attributes which have positive signs for the estimated
coefficients and the values are statistically significant (i.e., 1.169, 0.2537, 0.215,
0.2384 for carryover, pickup speed for Muvmi, priority for Ha:mo service and free
trip respectively). In addition, the standard deviation of carryover (1.0566) is
significant statistically, so that, the decision of individual respondent is vary relating
with carryover of the package while standard deviation of the rest three attributes
(pickup speed, free trip, priority) are not significant, so that, it explains every
respondent has homogeneous consideration or weight on those attributes. In general,
it implies that the package buyers would like to have some privilege service; in other
words, these service features could attract users to purchase the package rather than
pay per ride. A unit increase of either one of these attributes could increase in utility
of mobility package.

100
The price attribute coefficient (-0.7311) is negative and statistically
significant. This means that the service packages may less attractive when the price is
getting higher. In the same way, it could be explained that students prefer a small size
package rather than a large size one. As students have limited income and limited
spendable amount of money per month, a small package would be more appropriate
for this user group.
Another socioeconomic variable, income, is statistically significant at 95%
level and has an estimated coefficient 0.0176. By looking at coefficient, one could say
that the higher income, the higher the utility of the package. The probability of
choosing of service package is influenced by income of the respondents. We can
assume that they are willing to pay at one time for the mobility package rather than
pay per ride. The estimated coefficient of gender, dummy variable, is -0.2638 which
is significant negatively. According to the result from model, the package is less
attractive to female customers. If the customer is female, the utility of choosing
package is decreased.
Using the mean value and standard deviation value from Table (19), the
shared of population is calculated. For the special feature of the package, carryover
option, had a significant standard deviation and 86.7% of population were above zero
while the rest 13.3 were below zero. It could imply that this attribute was preferred
by 86.7 % of respondents and they would like to have this privilege feature. For
another feature, pickup speed did not have a significant standard deviation which
mean they skewed on one side. While calculating the shared population, it proved that
99.99% of population were above zero, in another word, they had the same

101
consideration for having pickup speed feature in the package. Similarly, standard
deviation of free trip and priority were insignificant and 99.99% of population were
having the same consideration.
For the goodness of fit of model, hit rate could be used to validate the
generated shared mobility package model. Hit rate, percentage of correct prediction, is
a measure to compute the goodness of fit of model. Prediction choice probability from
mixed logit model is compared with actual choice of each respondents. For this study,
percentage of correct prediction is 68.21% which means the model is fit to predict
respondent’s choice.
7.3 Application of Logistic Regression Model
The generated logistic regression model was applied to test the preference of
the packages that were used in the second questionnaire. From this we could
investigate the combination of service attributes that could the attract the respondents
the most. Table (22) shows the probability of each package could be chosen. Detail
package design and calculation of probability of choosing individual package can be
found in Appendix C.

102
Table 22: Probability of Choosing Each Individual Package
Package Scenarios Probability
1 30%
2 74%
3 87%
4 16%
5 44%
6 56%
7 74%
8 26%
9 38%
10 62%
11 71%
12 29%
13 14%
14 83%
15 39%
16 56%
As seen in Table (22), the probability of choosing packages 3 is 87% which has the
highest chance to be chosen. The package 3 includes five trips of Ha:mo, five trips of
Muvmi and includes all other attributes such as carryover, pickup speed, priority and
free trip, but with normal package price without any discount. Secondly, the
probability of choosing package 14 is 83% which is the second highest. This package
comprises of five trips of Ha:mo, five trips of Muvmi, having carryover option,
priority of using Ha:mo service and with discounted price. Generally, we probably
could say that students prefer to get privilege service once they purchase the package.
The respondents seem prefer small package (10 trips in package) to large package
(more than 10 trips). Moreover, respondents seem prefer to have carryover service
attribute in package as they would like to make sure that they could spend all the trips
that they have bought since they subscribe the package. Logically, price is a sensitive
attribute, it could decrease the probability of choosing the package while price
increase.

103
CHAPTER 8
CONCLUSION AND RECOMMENDATIONS
8.1 Research Summary
Shared mobility is a transportation strategy that have an impact on travel
behavior and reduce environmental problems. Shared mobility service has been
practicing in many places and Chulalongkorn University is also one of them. CU
locates in CBD area and has various accessible modes nearby the campus: public bus,
Bangkok Mass Transit system (BTS) sky train and Metropolitan Rapid Transit (MRT)
subway. To connect to public transport, CU offers free shuttle bus service for all.
However, it takes longer waiting time than normal due to traffic congestion occurs in
some route and overcrowded during the peak hours. Aiming to bring a convenient
and comfortable mobility for students and solving limited parking space problem in
campus, CU collaborates with other private companies and offer another options,
shared mobility, in the campus area.
Even though shared mobility services, Ha:mo and Muvmi, have been offering
for a certain period of time, they are still less popular and have limited number of
users compared to CU Pop Bus. This study aims to explore the reason behind why
they are less popular and explore an alternative way improving the service quality.
The concept of bundling mobility service is utilized. Before creating bundle package,
it is mandatory to understand the satisfaction of the students on the current service
quality and current demand on those modes.
Two phases of questionnaires had been conducted and the primary objective
of the first questionnaire was to explore the current travel characteristics, satisfaction

104
of students based on the existing service quality and the factors influencing on the
number of usage of shared mobility services in the future.
The result from internal mobility demand questionnaire indicates that students
are not really satisfied with the current quality of the service. To come up with an
example, students feel unsafe to use bicycle, CU bike, as there is no specific lane for
them to ride safely around the campus. Another reason is that bicycles are not
available at some docking stations and has limited number of docking station around
the campus which make students feel inconvenient to use the service. A very small
portion of the students (0.21%) uses shared bicycle service.
For Ha:mo, car sharing service, driving license is a mandatory requirement to
get access to this mode which is a huge barrier for student. Most of the first or second-
year students are less likely owning a driving license. For ride sharing service, a
longer waiting time for Muvmi service is undesirable for students even though the
number of customers of Muvmi service (45%) is much higher than Ha:mo service
(27%). Moreover, it is obvious that a common factor in both services, price, around
20 THB per ride is less attractive for students since students have limited spendable
amount of money per month. Comparing four modes provided by CU, unsurprisingly,
CU Pop Bus is the most popular one while Muvmi gets higher demand among paid
mobility service. For the current usage of Ha:mo service, there are some students
using it up to five times a week while Muvmi having nine times maximum usage in
one week.
The demand models for shared mobility services were generated using
multiple-linear regression method. In Ha:mo demand model, it can be clearly seen

105
that current experience of the service is the primary factor that influence future
demand, means the current users tend to continue using the service when the service
quality has been improved. Secondly, follow by driving license which is essential for
accessible for this service. While using contingent valuation for calculating the
willingness to pay of the students, monetary value for Ha:mo service is less than
normal price range (around 16 THB), price reduction is also another significant
attributes in model that could attract the non-current users and maintain loyalty of
current users. By reducing the service price and improve service quality, the utility of
shared mobility could increase which means the demand of shared mobility service
could increase significantly.
From demand model for Muvmi service, it is noted that female students prefer
more Muvmi than male students. They feel safe to share with other students during
the ride while male students are worried for privacy. Similar to Ha:mo, primary
experience of Muvmi plays the most important role while predicting future demand of
this service. However, price reduction is the least influent factor for utility of Muvmi
service. The average willingness to pay for this service is approximately 17 THB per
ride.
The unsatisfied service quality that need improvement and current demand of
shared mobility were explored in the first phase, the hypothetical scenario (service
package) testing was done in the second phase. The objective of this latter phase was
to investigate the attributes of the shared mobility package which have effect on
students’ decision. Different combination of mode attributes and service attributes
related with price were offered as a package to students in order to explore what kind

106
of factors could influence their decision and their preference on package. The data
collected in the second phase was analyzed by logistic regression and mixed logit
method.
From generic model for all respondents, number of trips for Muvmi in
package is statistically significant and influence on utility of service package.
Moreover, it explains that students are desirable to pay for package which have
privilege features: faster pickup speed for Muvmi which could reduce their waiting
time, having priority for Ha:mo (i.e., advanced booking), randomly getting free trip in
every month and carryover (transferable unused trips to next month). Carryover
feature option is the most vital attribute for integrated package as buyers would like to
make sure that they could use all the trips they have bought. It is notable that monthly
income is another factor that has effect on decision making. The utility of package
seems to be high for high income students. Higher income group of students are
willing to pay for all rides at one payment, buying package.
8.2 Policy and Recommendation
The result of this study could reveal the weakness of the current qualities of all
services and some factors that should be taken into consideration. For CU Pop Bus,
service frequency could be improved by providing more vehicles specially during
peak hours. It could probably solve not only unsatisfied service frequency problem
but also over crowdedness on bus. For CU bike, specific bike lane or facilities that
could improve service safety and frequency should be provided. As CU is located in
central business district area, safety for bike user should be prioritized. Moreover,
accessibility of CU bike is another that should be considered in order to get more

107
users. Providing more docking stations likely improve accessibility of service and
would be more convenient for all users. For Ha:mo, driving license is the barrier for
students to use. Price is common barrier for both Ha:mo and Muvmi. These modes
could be another option for students in their daily mobility around campus if the
service providers could offer the price range approximately 15 THB per ride.
In the first part of study, we also found out that mobile application seems to be
complex for some users. Another thing should be noted is that students are lack of
detail information about the shared mobility service especially for fresher, the first-
year students. Even though they see vehicles on campus, they still lack off
information how to pay or use these specific services. So that, service promotion
should be done more often. From demand model of Ha:mo and Muvmi, it is obvious
that experience users tend to continue using it in the future as well. The first
impression or service experience is virtual for getting more loyal customers. More
than that, users are lack of sharing experience and not willing to pay for the services.
Offering one or two free trips for new users could probably be a good strategy that
could get more users. If both service providers could offer cheaper rides during non-
peak hours, students may interest to use it. The users may probably tend to use it in
future once they have positive experiences from using them.
Another alternative way is that operators could collaborate, come up with
package and promote as an integrated service, it could save some marketing expense
for both service providers. Therefore, preference of service package and factors or
attributes that influence on choosing package have been studied. Having privilege
feature in package seems to make it more attractive. Without any privilege feature

108
seem no different from pay per ride option, thus, students may unwilling to pay for all
ride at the same time. Having carryover in the package seem to be an advantage for
users and it could attract more attention from customers.
Before promoting the service, service provider should support enough vehicles
to accommodate demand. Reliability of the service in terms of waiting time, service
availability might be main concern for users. In order to appeal service package
buyers, improvement of both services are needed especially for service reliability.
Without a reliable service, users would not be willing to pay for the service. Some
service quality improvement should be considered. Last but not least, pricing is a
sensitive factor for both users and service provider. Appropriate pricing of package
could grow the utility of package, if not, people would ignore it.
8.3 Research Limitation and Future Research
In this study, sample frame included both experience users and non-experience
users of the service, so that, it could cause bias in the models. If data were collected
only from experience users from both services, it might probably could give a more
precise models for this study. Related with service attributes that asking for
satisfaction of the students were limited. As this study mentioned only some of the
most possible attributes, there might be other service factors that they are either
satisfied or unsatisfied.
The modes considered in the integrated package included only paid services:
Ha:mo and Muvmi and most of the factors that influence on customer choice were
non-mode attributes. Obviously, the number of trips of Ha:mo and Muvmi have
correlation with package price. The increase in number of total trips, increase the

109
package price as well. Moreover, each scenario in questionnaire had force choices,
two package options, not include pay-per-ride option, so that, it seems to be
unrealistic as actually users have another pay per ride option in hand.
To offer integrated service, many stakeholders should highly collaborate and
work together. As this study is mainly explore or study from user point of view
(demand side), study on supply side (service providers) could be an interesting or
challenging issue for further research as well. Moreover, another sophisticated
approach for finding the probability of the mobility service package using mixed logit
method could be an interesting topic. It may probably could provide a more precise
prediction on probability of choosing package as it counts heterogeneous
consideration of the population.

REFE REN CES
REFERENCES
Alvarez-Farizo, B. (1999). Estimating the benefits of agri-environmental policy:
econometric issues in open-ended contingent valuation studies. Journal of
Environmental Planning and Management, 42(1), 23-43.
Australia, I. (2018). Mobility as a Service in Australia: Customer insights and
opportunities. ITS Australia part with Institute for Choice at University of South
Australia.
Bakos, Y., & Brynjolfsson, E. (1999). Bundling information goods: Pricing, profits, and
efficiency. Management science, 45(12), 1613-1630.
Bateman, I. J., Carson, R. T., Day, B., Hanemann, M., Hanley, N., Hett, T., . . . Pearce,
D. W. (2002). Economic valuation with stated preference techniques: A manual.
Economic valuation with stated preference techniques: a manual.
Ben-Akiva, M., & Bierlaire, M. (1999). Discrete choice methods and their applications
to short term travel decisions. In Handbook of transportation science (pp. 5-33):
Springer.
Bewick, V., Cheek, L., & Ball, J. (2005). Statistics review 14: Logistic regression. Pub
Med Central. Published online 2005 January 13. doi: 10.1186/cc3045. In.
Borgoni, R., Ewert, U.-C., & Prskawetz, A. (2002). How important are household
demographic characteristics to explain private car use patterns? A multilevel
approach to Austrian data. Retrieved from
Burrows, A., Bradburn, J., & Cohen, T. (2015). Journeys of the Future. Introducing
Mobility as a Service. In: Atkins Mobility.
Bush, S. (2014). Optimal designs for stated choice experiments generated from
fractional factorial designs. Journal of Statistical Theory and Practice, 8(2),
367-381.
Charbatzadeh, F., Chipulu, M., Marshall, A., & Ojiako, U. (2016). Determinants of
satisfaction with campus transportation services: Implications for service quality.
Journal of Transport and Supply Chain Management, 10(1), 1-14.
Chintagunta, P. K., & Nair, H. S. (2011). Structural workshop paper—Discrete-choice
models of consumer demand in marketing. Marketing Science, 30(6), 977-996.
Eryilmaz, E., Kagerbauer, M., Schuster, T., & Wolf, O. (2014). Collaborative
management of intermodal mobility. Paper presented at the Working Conference
on Virtual Enterprises.
Giesecke, R., Surakka, T., & Hakonen, M. (2016). Conceptualising mobility as a
service. Paper presented at the 2016 Eleventh International Conference on
Ecological Vehicles and Renewable Energies (EVER).
Grotenhuis, J.-W., Wiegmans, B. W., & Rietveld, P. (2007). The desired quality of
integrated multimodal travel information in public transport: Customer needs for
time and effort savings. Transport Policy, 14(1), 27-38.
Gunatilake, H., Yang, J.-C., & Pattanayak, S. (2007). Good practices for estimating
reliable willingness-to-pay values in the water supply and sanitation sector.
Hackbarth, A., & Madlener, R. (2013). Consumer preferences for alternative fuel
vehicles: A discrete choice analysis. Transportation Research Part D: Transport
and Environment, 25, 5-17.
Hensher, D. A., Rose, J. M., & Greene, W. H. (2005). Applied choice analysis: a
primer: Cambridge University Press.

111
Ho, C. Q., Hensher, D. A., Mulley, C., & Wong, Y. Z. (2018). Potential uptake and
willingness-to-pay for Mobility as a Service (MaaS): A stated choice study.
Transportation Research Part A: Policy and Practice, 117, 302-318.
Hoyos, D., Mariel, P., & Hess, S. (2015). Incorporating environmental attitudes in
discrete choice models: An exploration of the utility of the awareness of
consequences scale. Science of the Total Environment, 505, 1100-1111.
Jittrapirom, P., Caiati, V., Feneri, A.-M., Ebrahimigharehbaghi, S., Alonso González,
M. J., & Narayan, J. (2017). Mobility as a service: A critical review of
definitions, assessments of schemes, and key challenges.
Johansson, M. (2017). Mobility as a service: exploring young people’s mobility
demands and travel behavior. In.
Johnson, R., & Orme, B. (2003). Getting the most from CBC. Sequim: Sawtooth
Software Research Paper Series, Sawtooth Software.
Kamargianni, M., Li, W., Matyas, M., & Schäfer, A. (2016). A critical review of new
mobility services for urban transport. Transportation Research Procedia, 14,
3294-3303.
Kamargianni, M., Matyas, M., Li, W., & Schäfer, A. (2015). Feasibility Study for
“Mobility as a Service” concept in London. UCL Energy Institute.
Karlsson, I. M., Sochor, J., & Strömberg, H. (2016). Developing the ‘Service’in
Mobility as a Service: experiences from a field trial of an innovative travel
brokerage. Transportation Research Procedia, 14, 3265-3273.
Langford, I. H., Kontogianni, A., Skourtos, M. S., Georgiou, S., & Bateman, I. J.
(1998). Multivariate mixed models for open-ended contingent valuation data:
willingness to pay for conservation of monk seals. Environmental and Resource
Economics, 12(4), 443-456.
Louviere, J. J., & Hensher, D. A. (1983). Using discrete choice models with
experimental design data to forecast consumer demand for a unique cultural
event. Journal of Consumer research, 10(3), 348-361.
Matyas, M., & Kamargianni, M. (2018). Exploring Individual Preferences for Mobility
as a Service Plans: A Mixed Methods Approach.
Miles, J. (2014). Tolerance and variance inflation factor. Wiley StatsRef: Statistics
Reference Online.
Orme, B. (1998). Sample size issues for conjoint analysis studies. Sawthooth Software
Research paper Series Squim, WA, USA: Sawthooth Software Inc.
Ratilainen, H. (2017). Mobility-as-a-Service: Exploring Consumer Preferences for
MaaS Subscription Packages Using a Stated Choice Experiment.
Revelt, D., & Train, K. (1998). Mixed logit with repeated choices: households' choices
of appliance efficiency level. Review of economics and statistics, 80(4), 647-657.
Richardson, A. J., Ampt, E. S., & Meyburg, A. H. (1995). Survey methods for transport
planning: Eucalyptus Press Melbourne.
Ryan, M., & Gerard, K. (2003). Using discrete choice experiments to value health care
programmes: current practice and future research reflections. Applied health
economics and health policy, 2(1), 55-64.
Ryan, M., Kolstad, J., Rockers, P., & Dolea, C. (2012). How to conduct a discrete
choice experiment for health workforce recruitment and retention in remote and
rural areas: a user guide with case studies. World Health Organization &
CapacityPlus: World Bank.

112
Schmalensee, R. (1984). Gaussian demand and commodity bundling. Journal of
business, S211-S230.
Sever, I., Verbič, M., & Sever, E. K. (2019). Estimating willingness‐to‐pay for health
care: A discrete choice experiment accounting for non‐attendance to the cost
attribute. Journal of evaluation in clinical practice, 25(5), 843-849.
Sochor, J. L., Strömberg, H., & Karlsson, M. (2014). Travelers’ motives for adopting a
new, innovative travel service: Insights from the UbiGo field operational test in
Gothenburg, Sweden. Paper presented at the 21st World Congress on Intelligent
Transport Systems, Detroit, September 7-11, 2014.
Stigler, G. J. (1963). United States v. Loew's Inc.: A note on block-booking. The
Supreme Court Review, 1963, 152-157.
Truong, T. P., & Hensher, D. A. (1985). Measurement of travel time values and
opportunity cost from a discrete-choice model. The Economic Journal, 438-451.
Viney, R., Lancsar, E., & Louviere, J. (2002). Discrete choice experiments to measure
consumer preferences for health and healthcare. Expert review of
pharmacoeconomics & outcomes research, 2(4), 319-326.
Washbrook, K., Haider, W., & Jaccard, M. (2006). Estimating commuter mode choice:
A discrete choice analysis of the impact of road pricing and parking charges.
Transportation, 33(6), 621-639.
Zwerina, K. (1997). Discrete choice experiments in marketing. Physica-Verlag,
Heidelberg-New York, 2-4.

Appendix A
Questionnaire 1: Demand for shared mobility service

114
This study aims to explore the students’ satisfaction on the current transportation modes provided in Chulalongkorn University campus area. The figure below shows CU campus area, all the trips going within this area are taking into consideration for this study. It might include your shopping trip (to/ from MBK, Sam yam Mirtown, Siam area) and (to and from BTS stations) as well.
Part 1: General information
1. Gender Male Female 2. Faculty …………………………….. 3. Level of study 1st year 2nd year 3rd year 4th year >4th year Graduate Student 4. Personal Income (including pocket money in baht)
<5000 5000-7500 7501-10000 10001-12500 12501-15000 15001-1750 17501-20000 >20000
5. Your spendable amount of money for a month (e.g. Exclude your accommodation or apartment expense) <2000 2000-4000 4001-6000 6001-8000 8001-10000 10001-12000 12001-14000 >14000
6. Driving License for Car Yes No
Part 2 Satisfactory level for every mode available in CU
1. How satisfied are you with CU pop bus service in Chulalongkorn University currently? Please rate your satisfactory level with the following aspects.
Very
dissatisfied Dissatisfied Neutral Satisfied
Very Satisfied
Travel time 1 2 3 4 5
Waiting time 1 2 3 4 5
Crowdedness 1 2 3 4 5
Service frequency 1 2 3 4 5
Safety 1 2 3 4 5
Overall rating 1 2 3 4 5
2. How satisfied are you with Muvmi service in Chulalongkorn University currently?
Please rate your satisfactory level with the following aspects.
Very
dissatisfied Dissatisfied
Neutral
Satisfied
Very Satisfied
Travel time 1 2 3 4 5
Cost 1 2 3 4 5
Waiting time 1 2 3 4 5
Safety 1 2 3 4 5
Overall rating 1 2 3 4 5
3. How satisfied are you with Ha:mo service currently? Please rate your satisfactory level with the following aspects.
Very dissatisfied
Dissatisfied Neutral Satisfied Very Satisfied
Travel time 1 2 3 4 5
Cost 1 2 3 4 5
Safety 1 2 3 4 5
Service availability
1 2 3 4 5
Overall rating 1 2 3 4 5

115
1. How satisfied are you with CU bike service currently? Please rate your satisfactory level with the following aspects.
Very
dissatisfied Dissatisfied Neutral Satisfied
Very Satisfied
Travel Time 1 2 3 4 5
Safety 1 2 3 4 5
Service Availability
1 2 3 4 5
Overall rating 1 2 3 4 5
Part 3 Travel characteristics of respondents
1. How many days in a week do you come to Chulalongkorn University? Daily 3-4 days 1-2days
2. How do you normally come to Chulalongkorn University? Motorcycle (self-driving) Private Car (self-driving) Private Car (drop-off) Public Transport Modes provided by CU (CU pop bus, CU bike, Ha:mo & Muvmi)
3. Currently, how much do you spend for transportation going within Chula area in one week? <200baht 200-400baht 400-600baht 600-800baht >800baht
4. Currently, how many times do you normally use CU pop bus going in Chulalongkorn University area in one week? Never 1-3 times 4-6 times 7-9 times 10-12 times >12 times
5. In one day, how far do you normally walk around CU?.........................km
Part 4 Willingness to pay for each mode (CU bike, Ha:mo & Muvmi) (In this section, please tell me the price you would like to have for each modes and the frequency that you will use based on the price you mention.)
The registration fee is 100 baht and it is free for the first one hour per ride. The vehicle needs to return to the docking station.
1. Do you know the price condition of CU bike before? Yes No
2. Currently, how many times do you normally use CU bike going in CU campus area in one week? Never 1-3 times 4-6times 7-9 times >9 times
3. What kind of service condition would encourage you to use more CU bike? I would use more often when…………….. a. When docking station is available in many places. b. When registration can be done through app. c. When there is no registration fee. d. Others.
4 If we improve the condition you mentioned above, how many more times you tend use CU bike in a week? 0 time (I don’t want to use it more.) 1-3 times 4-6times 7-9 times >9 times
If you tick 0 time continue question no.5, otherwise continue question no.6.
5. Please give me the reason why you are not interested to use it. a. It cannot be found easily. b. You don’t know how to ride the bike. c. Weather is too hot to ride the bicycle. d. Registration procedure is complex. e. Others.
6. Which modes would be replaced by CU bike for the additional trips that you will make? CU pop bus Walking I will travel more and won’t replace any other modes.

116
Ha:mo
Ha:mo fare starts at 20 baht for the first 15 minutes and then charge additional 2 baht per minutes when students use more than 15minutes.
1. Do you know the price condition of Ha:mo before? Yes No
2. Currently, how many times do you use Ha:mo going in CU campus area in one week? Never 1-3 times 4-6 times 7-9 times >9 times
3. Please mention the price per ride you would like to have for Ha:mo to use it more often? (Currently, 20 baht for 15minutes) ……………………………baht
4. With the price you mentioned in question above, how many more times you tend use Ha:mo in one week? 0 time (I don’t want to use it more.) 1-3 times 4-6times 7-9 times >9 times
If you tick 0 time continue question no. 5, otherwise continue question no.6.
5. Please give me the reason why you are not interested to use it. a. You always go with group of friends. b. It is expensive for you. c. Limited parking station. d. You don’t have driving license. e. Others.
6. Which mode would be replaced by Ha:mo for the additional trips that you will make? CU pop bus CU bike Walking I will travel more and won’t replace any other modes.
Muvmi
Students can call through app. The fare varies (15, 20, 25 baht) depends on the distance you travel.
1. Do you know the price condition of Muvmi before? Yes No
2. Currently, how many times do you normally use Muvmi going in Chulalongkorn University area in one week? Never 1-3 times 4-6 times 7-9 times >9 times
3. Assume currently Muvmi price is 20 baht per ride, please name the price you would like to have for Muvmi to use it more often? ……………………………baht
4. With the price you mentioned in question above, how many more times you tend use in one week? 0 time (I don’t want to use it more.) 1-3 times 4-6times 7-9 times >9 times
If you tick 0 time continue question no. 5, otherwise continue question no.6.
5. Please give me the reason why you are not interested to use it. a. You don’t like to share with others. b. The waiting time is too long. c. It is expensive. d. App is complex to use. e. Others
6. Which modes would be replaced by Muvmi for the additional trips that you will make? CU pop bus CU bike Walking I will travel more and won’t replace any other modes.
Thank you for your effort and participation.

117
Appendix B
Questionnaire 2: Preference on Shared Mobility Package

118
Questionnaire survey about shared mobility service in Chulalongkorn University
1. Are you a student who is currently studying in Chulalongkorn University?
Yes No
2. General Information
2.1 Gender Male Female
2.2 Level of study Undergrad Student Graduate Student
2.3 Personal income <5000THB 5000-10000THB
10001-15000THB 15001-20000THB >2000THB
2.4 Accommodation
CU dormitory within 2km away from CU more than 2km away from CU
2.5 Driving license Yes No
3. Mode choice and satisfaction level on the services
The following question is only about traveling in Chulalongkorn University campus area, which is
the area that Ha:mo and Muvmi serve (students generally travel in this area during the day) as in
the picture below.
3.1 Normally, how do you travel to and from Chulalongkorn University? (can choose more than
one mode below).
Private vehicles BTS & MRT Bus Service provided by CU Others

119
3.2 How often do you use the following modes from your place to faculty in CU?
Never Rarely Sometimes Often very often
(1-2times/Month) (3-5times/Month) (6-8times/Month) (>8times/Month)
Pop Bus
Ha:mo
Muvmi
CU bike
Others
3.3 How often do you use the following modes for going around CU campus area?
Never Rarely Sometimes Often very often
(1-2times/Month) (3-5times/Month) (6-8times/Month) (>8times/Month)
Pop Bus
Ha:mo
Muvmi
CU bike
Others
3.4 Currently, how much to you spend for mobility expense for going around CU campus area in
one month?
<200THB (<50THB per week approximately)
200-400THB (50-100THB per week approximately)
400-600THB (100-150THB per week approximately)
600-800THB (150-200THB per week approximately)
>800THB (>200THB per week approximately)
3.5 Please rate your satisfaction level on service quality of Ha:mo and Muvmi.
Satisfied Neutral Dissatisfied Never used
Ha:mo
Muvmi
3.6 Please rate your satisfaction level on Cost of Ha:mo and Muvmi.
Satisfied Neutral Dissatisfied Never used
Ha:mo
Muvmi

120
4. Service package for shared mobility in Chulalongkorn University
Before continues to service package, please read the following information carefully.
Feature of the service
Price : Monthly price of package (discount price)
Ha:mo : Single seater car-sharing service provided in Chula
Muvmi : Six-seaters ride-sharing service in Chula
Carry-over : The remaining trips in this month can be used in the next consecutive month.
Pick-up speed : Once you subscribe the package, Muvmi driver will pick you up within
7minutes (normally 15 minutes)
Priority : Get priority on Ha:mo Advanced Booking
Free trip : Offer FREE trips on selected route and time (1-3 times/ month)

121
4.1 Please choose the package that is the most suitable for your travel.
4.2 Please choose the package that is the most suitable for your travel.
4.3 Please choose the package that is the most suitable for your travel.
Package A
Package B
Package A
Package B
Package A
Package B

122
4.4 Please choose the package that is the most suitable for your travel.
4.5 Please choose the package that is the most suitable for your travel.
4.6 Please choose the package that is the most suitable for your travel.
Package A
Package B
Package A
Package B
Package A
Package B

123
4.7 Please choose the package that is the most suitable for your travel.
4.8 Please choose the package that is the most suitable for your travel.
4.9 If you have pay per ride option, would you still prefer to buy service package?
(prefer pay per ride ) 1 2 3 4 5 (prefer package)
Thank you for your participation. 😊
Package A
Package B
Package A
Package B

124
Appendix C
Probability of Choosing Package by Logistic Regression Model

Att
rib
ute
s \
Pac
kag
es
1
2
3
4
5
6
7
8
Nu
mb
er o
f tr
ips
of
Ha:
mo
5
10
5
10
5
10
5
1
0
Nu
mb
er o
f tr
ips
of
Muvm
i 5
10
5
10
10
5
10
5
Car
ryov
er
0
1
1
0
0
1
1
0
Pic
ku
p S
pee
d
0
1
1
0
1
0
0
1
Pri
ori
ty
0
1
1
0
0
1
1
0
Fre
e T
rip
0
1
1
0
1
0
0
1
Pri
ce
2
3.2
2
3.2
2
.4
3
2.4
3
Z
0.8
48
1.0
43
1.8
79
-1.6
84
-0
.23
6
0.2
26
1.0
52
-1.0
61
Pro
bab
ilit
y
0.3
00
0.7
39
0.8
68
0.1
57
0.4
41
0.5
56
0.7
41
0.2
57
Att
rib
ute
s \
Pac
kag
es
9
10
11
12
13
14
1
5
16
Nu
mb
er o
f tr
ips
of
Ha:
mo
10
5
10
5
10
5
10
5
Nu
mb
er o
f tr
ips
of
Muvm
i 5
10
5
10
10
5
10
5
Car
ryov
er
0
1
1
0
0
1
1
0
Pic
ku
p S
pee
d
0
1
1
0
1
0
0
1
Pri
ori
ty
1
0
0
1
1
0
0
1
Fre
e T
rip
1
0
0
1
0
1
1
0
Pri
ce
2.4
3
2.4
3
4
1.6
4
1
.6
Z
0.4
94
0.4
84
0.8
86
-0.8
96
-1
.81
6
1.6
02
-0.4
62
0.2
48
Pro
bab
ilit
y
0.3
79
0.6
19
0.7
08
0.2
90
0.1
40
0.8
32
0.3
86
0.5
62


VITA
VITA
NAME Sandar Win
DATE OF BIRTH 26 July 1994
PLACE OF BIRTH Myanmar
INSTITUTIONS
ATTENDED
Thanlyin Technological University
HOME ADDRESS Nya/46, Gone Htoo Street, Oo Gyi Kham Quarter,
Taunggyi, Southern Shan State, Myanmar