ANALYSIS OF CASHEW VALUE CHAIN IN GOA Reports/Value Chain Study on Cashew in Goa… · cashew nut...
52
1 UNIVERSITY OF AGRICULTURAL SCIENCES, DHARWAD ANALYSIS OF CASHEW VALUE CHAIN IN GOA Final Draft Report Submitted to: Directorate of Cashew & Cocoa Development Department of Agriculture, Cooperation & Farmer’s Welfare Ministry of Agriculture, Cooperation & Farmer’s Welfare Kera Bhavan, Kochi- 682 011, Kerala State Cashew stakeholder workshop held at ICAR Research Complex, Old Goa Submitted by: Dr. S. M. Mundinamani Principal Investigator & Professor and Head Department of Agricultural Economics College of Agriculture, Vijayapur- 586 101
Transcript of ANALYSIS OF CASHEW VALUE CHAIN IN GOA Reports/Value Chain Study on Cashew in Goa… · cashew nut...

1
UNIVERSITY OF AGRICULTURAL SCIENCES, DHARWAD
ANALYSIS OF CASHEW VALUE CHAIN IN GOA
Final Draft Report
Submitted to:
Directorate of Cashew & Cocoa Development
Department of Agriculture, Cooperation & Farmer’s Welfare
Ministry of Agriculture, Cooperation & Farmer’s Welfare
Kera Bhavan, Kochi- 682 011, Kerala State
Cashew stakeholder workshop held at ICAR Research Complex, Old Goa
Submitted by:
Dr. S. M. Mundinamani
Principal Investigator &
Professor and Head
Department of Agricultural Economics
College of Agriculture, Vijayapur- 586 101

2
UNIVERSITY OF AGRICULTURAL SCIENCES, DHARWAD
Final Draft Report On
ANALYSIS OF CASHEW VALUE CHAIN IN GOA
Research Team Principal Investigator
Dr. S.M.Mundinamani
Professor & Head
Department of Agricultural Economics
Co-Principal Investigator
Dr. M.R.Patil
Principal, Vidya Prabodhini College, Parvari, Goa.
Dr. Adavi Rao Desai
Principal Scientist (Fruit Science)
ICAR Research Complex Goa
Dr. Mantesh R. Naik
Associate Professor & Head
Department of Agricultural Economics
College of Agriculture, Dharwad
Dr. S.J Sonnad
Professor & Head
Department of Agri Business Management
College of Agriculture, Dharwad
Dr. V.S. Patil
Professor
Department of Horticulture
College of Agriculture, Dharwd
Research Staff
Dr. Rangegowda R.
Ms Megha Akki
Ms Sushma
3
CONTENTS
Sl.No. Particulars Page
No.
I Introduction 4
1.1 History of Cashewnut 4
1.2 World scenario of Cashewnut 5
1.3 Cashew scenario of India 5
1.4 Value chain and value chain analysis 6
1.5 Economic use of cashew products 6
1.6 Present study 7
II Methodology 10
III Major findings of the investigation 17
2.1 Growth rate and trend analysis 17
2.2 2. Socio-Economic Profile of Cashewnut growers 17
2.3 Cost and returns of cashewnut in South and North Goa 20
2.4 Marketing costs, channels and price spread 22
2.5 Constraints related to production and exports of plantation and other crops 22
IV Summary and policy implications 27
V Glimpses of field visit -
4
I. INTRODUCTION
Cashew (Anacardiumoccidentale L.) is called as the poor man’s crop and the rich man’s
favourite snack food all over the world. Cashew tree is believed to be a native of Brazil, from
where it has dispersed to different parts of the world primarily for soil conservation, afforestation
and wasteland development. The term ‘cashew’ has originated from the Brazilian name
‘acajaiba’ and the Tupi name ‘acaju’, which the Portuguese converted into ‘caju’ and is
commonly known as ‘kaju’ in India. It is known as ‘Paragi Andi’ in Kerala meaning foreign nut,
‘Lanka Beeja’ in Orissa assuming its introduction from Sri Lanka, and ‘Mundiri’ indicating the
shape of the nut in Tamil Nadu. Cashew is cultivated mainly in the Asian, African and Latin
American zones. The Asiatic zone includes India and Vietnam as the major producers, besides
Indonesia, Philippines, Malaysia, Thailand and Sri Lanka. In the African zone, Nigeria, Côte
d’Ivoire and Tanzania are the major producers, besides other countries like Benin, Guinea
Bissau, Mozambique, Ghana, Senegal and Madagascar.
1.1 History of Cashewnut
It is interesting to note that cashew spread these countries with the aid of elephants that
consumed the cashew fruit along with its nut. As the nut was too hard to digest, later, the
undigested nut was expelled with the droppings and that resulted in the spurt of cashew plants
throughout these countries. Subsequently, the tree spread to a number of countries in Africa,
Asia, Latin America and West Indies. The Portugese traders thus introduced the cashew tree into
India and Africa to prevent soil erosion. Cashew is now widely cultivated for its kernel, fruit,
cashew nut shell liquid and other products. However, it is mostly found in the coastal regions of
South Africa, Madagascar, Tanzania, and South Asia, from Sri Lanka to the Philippines.
Cashew was introduced in other parts of the world since 16th
century mainly with the
intention of afforestation and soil conservation. From its humble beginning as a crop intended to
check soil erosion, but the cashew has come out as a major foreign exchange earner in many
countries. The Cashew tree though in existence for a long time was identified as a useful plant
only in the early twentieth century. The earlier reports about cashew are from Brazil, French,
Portuguese and Dutch observers. Thevat (1558) French naturalist, who visited Brazil during the
period of French settlement, first described the plant being located in the north east. He saw
some local people harvesting the cashew fruits and squeezing juice from them into a jar.

5
1.2. World cashewnut scenario
Cashew is predominantly grown in Asia, Africa and South America continents. Asiatic
zones mainly include India, Vietnam and Indonesia as the major cashew producing countries
followed by Philippines, Malaysia, Thailand and Sri-Lanka. African countries producing cashew
are Nigeria, Tanzania, Mozambique, Kenya, Benin, Guinea- Bissau, Mozambique, Ghana,
Senegal and Madagascar.
The major cashew producing countries in Latin America are Brazil, Columbia, Costa
Rica, Honduras and Salvador. Though cashew is native of Brazil, it gained greater importance in
countries like India, Vietnam, and other African countries. In 1960’s, India was the major
contributor to world cashew nut production followed by Mozambique and Tanzania. Later, East
African countries like Tanzania, Mozambique and Kenya introduced cashew. In 1970’s, the
other Asian countries such as Indonesia, Malaysia and Cambodia, cashew cultivation became
popular. Till 80’s raw cashew nut production witnessed slow and steady growth (Hand book of
cashew nut 2014). From 1990’s global Raw Cashew Nut (RCN) production has seen a
tremendous growth. Since 1990, Vietnam cashew industry has seen massive growth with respect
to cashew nut production and processing. During 1999-2000 world production of raw cashew nut
was 1359 tons and it has increased to 3049 thousand tonnes during 2016-17. At present, Vietnam
is the largest raw cashew nut exporting country to India. From 2001-02 to 2015-06, area and
production of cashew nut has increased at a rate of 2.29 percent and 3.02 percent respectively.
India’s production of raw cashew nut compared to the world production is estimated nearly to 34
percent. Production in other countries like Vietnam, Brazil, and Ivory Coast also illustrated that
increased position in the study period.
1.3 Cashew scenario of India:
India is the largest producer, processer, consumer and exporter of cashew in the world.
The current Cashewnut production in India accounts for 45 per cent of the global production.
India being the leader in the world in raw Cashew nut production and is also the largest supplier
of cashew kernels to the major world markets. A large number of small and marginal farmers,
especially living on the coastal belts of India, depend on cashew for their livelihood. Cultivation
of cashew in India confines mainly to the peninsular areas. It is grown in Kerala, Karnataka,
Goa, and Maharashtra along the West coast and Tamil Nadu, Andhra Pradesh, Odessa and West

6
Bengal along the East-coast, occupies an area of 10.30 lakh hectares in the country with a
production of 9.98 lakh metric tonnes. Even though strong competition from other countries has
reduced India’s share in the global cashew exports, India’s advantage in terms of less percentage
of broken kernels has brought European and US buyers to its proximity. To strengthen cashew
exports, there is scope for increasing production by developing cashew as plantation crop on
commercial basis, exploring new markets, and strengthening non-traditional markets, adding
value to the product by introducing innovations in processing and branding them. Among the
major states in the country, Maharashtra tops with respect to area, production and productivity
of cashew nut. Over the years, the area under cashew cultivation has registered an increase
in all the major cashew growing states, except in Kerala.
1.4 Cashew scenario of Goa
Goa with a production of 24,396 tonnes of raw cashew nuts from an area of 56735 hectares
stands in sixth position both in area and production in India during 2016-17. The productivity of
cashew trees in the state is 430 kg / ha which is less than the national average of 748 kg/ ha. The
productivity is much lower than the all other cashew producing states in India. Cashew
cultivation plays a significant role in the economy of Goa. Growth rates in area, production and
productivity of Cashewnut in Goa state and for all India. Goa state recorded Compound Annual
Growth Rate (CAGR) of 0.25 per cent and at all India level CAGR was 2.29 per cent which was
significant at 1 per cent probability level. In Goa, a decreasing growth rate was observed for the
area under cashew nut (-0.43 per cent). The productivity of cashew in India as a whole was
growing at the rate of 0.71 per cent per annum with 10 per cent significance, while in Goa
productivity was growing at the rate of -0.69 per cent per annum, which were Non significant.
1.5 Economic use of cashew products
Cashew kernel has a unique place in all functions and celebrations of both developed and
developing countries. It is offered at wedding ceremonies as a token of fertility. In fact, it is
considered as having aphrodisiac properties. Its place is very prominent at social and religious
celebrations. It is offered to the guests and visitors and very important persons in educational,
social, religions and political field. Three main cashew products are traded at the international
market: raw cashew nuts, cashew kernel and cashew nut shell liquid. Cashew apple is another
product which is generally processed and consumed locally. The raw cashew nut and cashew

7
kernel are the main commercial products. Raw nuts are exported and imported before or after
processing the cashew kernel. Cashewnut shell liquid is an important commercial byproduct
released from raw nuts at the time of processing. It has industrial and medical applications.
Moreover, the skin of the nut is high in tannins and can be recovered and used in the tanning of
hides. From Cashew apple or fruit, juice is extracted which has high vitamin content and it could
be fermented to give a high proof. In fact cashew nut shell liquid is a valuable raw material for
the preparation of oil paints, varnishes, pigments of gums, type writer rolls, automobile, break
lining and lubricant in air craft. The cashew apple is used in the preparation of fruit juice, syrup,
candy, jelly, pickles, cashew wine and fenny.
Cashew kernel is smaller in size, higher in nutritional value, pleasant, tasty and one of the
most important commercial product. It is known for its delicious, pleasant taste and for the
balanced nutritive profile. It is estimated that 60 per cent of the cashew kernel is consumed in the
form of snacks and the remaining 40 per cent included in confectionery. It contains protein, fat,
carbohydrates and all the fat soluble vitamins A, D and K. It is also a source of minerals like
calcium, magnesium, phosphorous, potassium, sodium, iron and others. In fact, cashew is a
perfect food with zero per cent cholesterol. At present, the dry leaves are used as natural manure
for other crops. Cashew also has medicinal value Cashew apple liquor is used for the ailments of
worm, sickness, cold, body-ache, fever or flue, toothache, fresh wounds and cuts, cramps due to
chilly weather, muscular pain, irregular movement of bowels, low blood pressure, loss of sleep
for aged people, diarrhoea and cholera. The alcoholic produce ‘Fenny’ has laxative properties.
Cashew apple is eaten as a remedy for scurvy. The kernels possess aphrodisiac qualities. Cardol
and Anacardic acid possess powerful rubifacient and vesicant properties obtained from the shell
by maceration in spirit and are applied to cure cracks on the sole of the feet. Root infusion is an
excellent purgative. The dead branches and twigs are regularly collected for fire wood.
1.6. Value chain and value chain analysis
Value chain is a chain of activities in which products pass through all in order and
through each activity, the product gains some value. Value Chain Analysis (VCA) deals with the
examination of the value chain of an enterprise to ascertain how much and at stage value is added.
Value chain improvements reduce inventories, wastage, cost, thus increase efficiency within the
firm and in the market channel. Achieving these gains requires mobility and flexibility in the
scheduling and location of production, processes, inventories and distribution. This can be

8
achieved through supportive and cooperative supplier-buyer relationships (Porter, 1985). Hence,
in the present study, the value chain for cashew nut is studied tracing the value addition at
different stage of the marketing channel of cashew nut.
A value chain or supply chain is a set of value creating activities in the production-
distribution process and the explicit structure of linkages among these activities. Value chain is
associated with quality differentiation and value added from the consumers perspective, while
supply chain is a supplier perspective with a focus on efficiency and logistics and coordination
aspects of moving products from ‘farm to fork’. However, there is a need to integrate both the
terms as food systems need to deliver both value and efficiency. On the other hand, food value
chains ‘comprise all activities required to bring farm products to consumers, including
agricultural production, processing, storage, marketing, distribution and consumption. Various
segments of value chain from production to consumption that includes production, processing,
wholesaling and retailing have been undergoing rapid and unprecedented changes in recent times
in the country. The present survey focus on these issues in cashew nut as is one of the most
important food item of the human diet and also export earner for the nation.
Inspite of its several benefits for the Indian economy, in general and economy of major
cashew growing states in the country in particular, the cashew sector facing many problems in
production, processing, marketing and value addition of different stages. The market
intermediaries enjoying all the benefits of the value addition and exploiting farmers on one hand
and the consumers on the other end.
1.7 Present study
Keeping in view the importance of cashew in the India economy in general and its major
growing states in particularly, the present study made an attempt to analyze the cashew value
chain in Goa with following specific objectives;
Specific objectives:
1. To estimate the growth in area, production and productivity of Cashew nuts in Goa

9
2. To assess the financial feasibility and economic viability of investment in input
supply (nursery), establishment of cashew plantation, cost and returns in cashew
cultivation in the study area.
3. To analyse production, processing, value addition and marketing of cashew in Goa
4. To estimate cost and margins under different channels of cashew and its products
marketing.
5. To assess the institutional support system for promoting cashew economy of Goa
6. To document constraints and opportunities in production, processing, value addition
and marketing of cashew and its products and suggest suitable policy measures to
promote cashew economy of India in general and Goa in particular.

10
II. METHODOLOGY
2.1. Description of the study area:
Goa is a state in India within the coastal region known as the Konkan in West India. It is
bounded by Maharashtra to the north and Karnataka to the east and south, with the Arabian
Sea forming its Western coast. It is India's smallest state by area and the fourth smallest by
population. Goa has the highest GDP per capita among all Indian states, that is two and a half
times that of the country. It was ranked the 'best placed State' by the "Eleventh Finance
Commission" for its infrastructure and ranked on top for the 'best quality of life' in India by the
National Commission on Population based on the 12 Indicators. Panaji is the state's capital,
while Vasco da Gama is its largest city. Goa encompasses an area of 3,702 km2 (1,429 sq mi). It
lies between the latitudes 14°53′54″ N and 15°40′00″ N and longitudes 73°40′33″ E and
74°20′13″ E.
Goa is also known for its coconut cultivation. The coconut tree has been reclassified by
the government as a palm (like a grass), enabling farmers and real estate developers to clear land
with fewer restrictions. Rice is the main food crop, and pulses (legume), Ragi (Finger Millet) and
other food crops are also grown. Main cash crops are coconut, cashewnut, arecanut, sugarcane
and fruits like pineapple, mango and banana. Goa's state animal is the Gaur, the state bird is the
Ruby Throated Yellow Bulbul, which is a variation of Black-crested Bulbul, and the state tree is
the Asan.
The important forests products are bamboo canes, Maratha barks, chillar barks and
the bhirand. Coconut trees are ubiquitous and are present in almost all areas of Goa barring the
elevated regions. A large number of deciduous trees, such as teak, Sal tree, cashew and mango
trees are present. Fruits include jackfruit, mango, pineapple and "black-berry" ("podkoam" in
Konkani language). Goa's forests are rich with medicinal plants.
Goa has more than 33% of its geographic area under government forests (1224.38 km²)
of which about 62% has been brought under Protected Areas (PA) of Wildlife Sanctuaries and
National Park. Since there is a substantial area under private forests and a large tract under
cashew, mango, coconut, etc. plantations, the total forest and tree cover constitutes 56.6% of the
geographic area.

11
2.2 Sampling procedure
Multistage sampling technique was adopted in the selection of the districts, taluks, villages,
cashew growers and markets and market intermediaries.
2.2.1 Selection of study area:
Keeping in view the objectives of the study, three taluks from North Goa district and
three taluks from South Goa District were selected as these taluks accounts more than 70 percent
of cashew plantation area in Goa state. From each selected taluks; two villages were selected
based on highest area under cashew plantation.
As mentioned above Sattari, Permem, Bicholim, Sanguem, Quepem and Canacona Taluk
of Goa were selected for producer’s survey as they are the major cashew growing Taluks in
North and South Goa. From each selected cashew cultivation village, 30 farmers were selected.
In addition to cashew growers, the market intermediaries involved in input supply, processers
and other marketing intermediaries add value to cashew were selected. Thus, in all 180 cashew
growers, 48 market intermediaries including input suppliers and institutional support providers
were selected to collect the required information. To study the consumer preference for cashew
and its products, 20 consumers were selected. Well-structured and pre tested questionnaires were
used for collection of information.

12
Fig: Study area map

13
Table- 2.1: Sampling frame
District Taluk Farmers
Commission
Agents Wholesalers Retailers Processors Consumers
North
Goa Pernem 30 3 3 3 3 5
Bicholim 30 3 3 3 3 5
Sattari 30 3 3 3 3 5
South
Goa Sanguem 30 3 3 3 3 5
Quepem 30 3 3 3 3 5
Canacona 30 3 3 3 3 5
Total sample 180 12 12 12 12 20
2.2.2 Nature and sources of the data
The study utilized both primary and secondary data. The primary data relating to cost
of production, price obtained by the farmers, channels followed in marketing of their produce,
cost of marketing produce were obtained from the producers to study the cost of production, cost
of marketing etc. Similarly, the data on costs incurred by the market functionaries in the
marketing of the produce, price at which the commodity was purchased and sold etc. were
collected in order to work out the margins obtained by each of them. The primary data was
collected from the sample farmers and their awareness about maketing of cashew and market

14
functionaries with the help of pre-tested structured schedule. The some general information
about the cashew cultivators, area under cashew, age of the cashew orchard, number of plants,
spacing, input use etc. The relevant information on other aspects like fixed assets, land use,
cropping pattern, establishment and maintenance cost, yields and returns, quantity sold, price
received, the marketing costs incurred by him, profit margin recorded and the problems faced by
him in the production. The farmers and various aspects of market intermediaries and the
processors were personally interviewed to ensure that the data made available by them were
clear, comprehensive and reasonably correct.
1. Selection of market intermediaries
In addition to farmer, as interaction with market intermediaries the other stakeholders
includes in cashew survey such as Zonal agriculture officer (4), Agriculture Marketing Board
(4), Bankers (1), Cashew grower association (1), Cashew processing association (1), and Cashew
Fenni producer association (1). In all, interaction with 200 stakeholders in cashew and required
information was collected for the study.
2. Nature and Sources of Data
For achieving the objectives of the study, both primary and secondary data were collected.
Secondary data is collected from various sources like websites, Directorate of Agriculture, Goa,
Taluk level Zonal Agricultural office and other authenticated Government Departments in Goa
State. The secondary data for the study included time series data of district wise and taluk wise
area, production and productivity under Cashew for selected Taluks, value addition, input
supply, institutional support system, land utilization pattern, general information about selected
taluks and village wise area under Cashew etc. Selling and purchase price of output by market
intermediaries for the year 2016-17.
The primary data pertaining to the year 2016-17 is collected by using well structured and
pre-tested schedule through a survey of sample respondents. The data relating to general
information about the respondents, family size, age, education, occupation, sources of income,
land holding is obtained from them. The method of personal interview is used to elicit the data

15
from the respondents regarding various inputs used, yields and returns from the intercrops during
gestation period of the cashew. Details on the annual cost of cultivation during bearing period,
yield level and returns, method of sale and cost of marketing, cost of processing, channels
followed in marketing of cashew, marketing cost and margin, value addition, consumer
preference etc is collected and it is ensured that the data made available by the respondents is
relevant, comprehensive and reasonably correct and precise.
Description of crop
Cashew (Anacardium Occidentale L.), belonging to the Anacardiaceae family, native
of tropical region of Brazil, was introduced to India by the Portuguese about five centuries ago as
a means of controlling coastal erosion. It ranks third in the world production of edible tree nut. It
has been well adapted to Indian conditions and is at home in the coastal regions of the country.
Cashew as evergreen tree produces nuts and apples. It has attained much commercial
importance, owing to the wide adaptability in varying agro climatic conditions. It has spread to
some parts of tropical South and Central America, Mexico and the West Indies. Cashew is a
spreading evergreen perennial tree grown up to 10-12 meter in height. It can be cultivated only in
tropics preferably under warm and humid climate (250 C to 350 C and high humidity). It can be
cultivated from the sandy seacoast to laterite hill slopes up to 700 m sea level. It requires a
minimum of 500mm rainfall per year but can withstand extremes of rainfall from 3000-4000mm.
The major factor limiting the distribution of cashew is its inability to tolerate frost and
extreme cold for a long time. The best-suited soil for cashews is the deep well drained with a PH
value ranging between 6.30 to 7.31. Red sandy loams and light coastal sands are also well suited
for this tree. In India, the cashew tree is grown mainly on laterite, red and coastal sands in the
federal states of Kerala, Karnataka, Maharashtra, Goa, Tamil Nadu, Andhra Pradesh, Orissa and
West Bengal. Cashew normally flowers after 3 to 5 years of planting. Flowering period starts
from the end of November till the end of January depending upon the climatic conditions. Flies,
bees and ants as well as wind are the pollinating agents. Cashewnuts contained corrosive liquid
(oil) commercially known as cashew nut shell liquid (CNSL). It is a byproduct of the cashew
industry having tremendous export potential. Inspire of this potential, a good portion of the
CSNL still continues to be burnt as crude fuel in the local manufacturing units. The shell also
contains an oily acidic liquid. In order to extract kernels, the raw nuts are either roasted or

16
steamed to the right level and then passed over to the shelling section. The shells were classified
as waste and used to be purchased only for the purpose of being burnt as fuel mainly at bakeries.
Later it was discovered that the shells thrown away also contain a product that too has precious
foreign exchange. The product was called CSNL. As per the extraction statistics, the CSNL
comprises one per cent of the weight of roasted shells and more than three per cent of the weight
of steamed shells, though the volume of foreign exchange brought in by the CSNL is poor
compared to that brought in by the kernels. The demand for CSNL remains much higher than
kernels, especially from abroad, Because of its heat resistant and anti-corrosive nature, the
CSNL is largely used in the paint industry and at some stage in rockets and also used in brake
lining. At present, India has the capacity to export around 7,000 metric tons of CSNL and
Each metric ton brings in foreign exchange worth Rs.10, 000.The U.S.A., Japan and South Korea
are the major importers of the CSNL from India. Other major export destinations are Hong
Kong, Malaysia and U.K. The cashew nut is about 2-4 cm long and kidney shaped grayish in
color. It is attached to the fleshy peduncle (Cashew Apple) and thin skin between epicarp and
endocarp wall of the shell is a honey comb structure which contains phenolic material
commercially known as Cashew Nut Shell Liquid. Inside the shell kernel is wrapped in a thin
brown skin known as the testa (Outer skin of Kernel).
Analytical tools
For the purpose of evaluating the objectives of the study, based on the nature and extent of data
availability, the following analytical tools will be used for analyzing the data to draw meaningful
results and conclusions.
1. Descriptive analysis
2. Compound annual growth rate analysis.
3. Financial feasibility analysis
4. Garrets ranking technique

17
III. MAJOR FINDINGS OF THE STUDY
1. Trends in area, production and productivity of cashew nut in India
1.1 States wise growth in area, production and productivity of Cashew nut in India
The growth in area, production and productivity of Cashewnut in major cahshew growing
states in India for the study period from 2008-09 to 2016-17 was estimated using the exponential
function and results are presented in the Table 1. It could be observed from the table that, the
growth of area under cashew nut was found to be highest in Orissa (4.80 %) followed by Kerala
(3.51 %), Karnataka (1.93 %), Maharashtra (1.49 %), Tamil Nadu (1.33 %) and Goa (0.86 %),
where as the cashew nut production growth was highest in Karnataka (5.70 %) followed by West
Bengal (2.60 %), Goa (2.40 %), Maharashtra (1.90 %) and Kerala (1.80 %). The productivity
growth rates of Cashew nut during 2008-09 to 2016-17 was found to be positive and significant
in Karnataka (3.29 %) followed by West Bengal (2.62 %) and Goa (1.53 %).
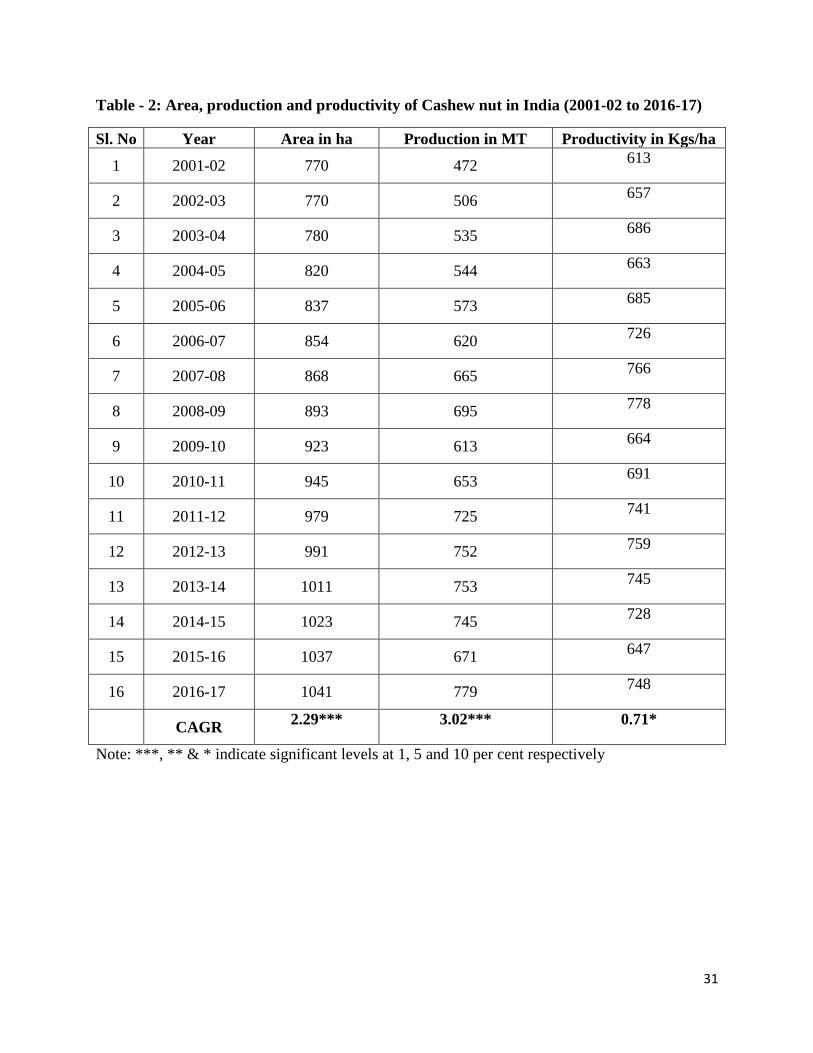
1.2 Growth in area, production and productivity of Cashew nut in India and Goa
Growth in area, production and productivity of Cashewnut in Goa state and for all India
level was estimated for the period from 2001-02 to 2016-17 and the results are presented in the
Table 2. It can be observed from the table that the area under Cashewnut in Goa recorded 0.25
per cent Compound Annual Growth Rate (CAGR) and at all India level, a significant growth of
2.29 per cent was observed. In Goa, a decreasing growth rate was observed for the area under
cashew nut (-0.43 per cent). The productivity growth of cashew nut in India was 0.71 per cent,
while in Goa state, negative growth (-0.69 per cent) per annum was observed.
2. Socio-Economic Profile of Cashew nut growers
2.1 General characteristics of sample farmers
An understanding of general characteristics of sample farmers is expected to provide a
bird’s eye view of the general features prevailing in the study area. Therefore, an attempt has
been made in the study to analyze some of the important characteristics of the cashewnut
growers. The general characteristics of the respondent’s with respect to age, family size and
literacy levels are presented in Table 5.
18
2.1.1 Age of farmers
The study comprised of 180 Cashewnut growers spread over six taluks covering two
districts of Goa. From the Table 5, it could be seen that, majority of the farmers are of old age
(above 50 years) both in North (51.11 %) and South districts of Goa (57.78 %) followed by
middle aged (ranged between 36-50 years in North (37.78 %) and South (26.67%) and it is also
observed that, young aged respondents having age up to 35 year were 11.11 per cent and 15.56
per cent in North and South Goa respectively. However, in case of overall age groups, 54.44 per
cent of respondents were old aged, followed by 32.22 per cent of middle aged and 13.33 per cent
were young aged respondents.
2.1.2 Family size
The classification of sample households in Goa, based on family size (Table 5) showed
that in North Goa large sized family were 41.11 per cent followed by medium sized family with
37.78 per cent and small sized family is 21.11 per cent. In case of South Goa, medium sized
family was 52.22 per cent followed by large sized family with 31.11 per cent and small sized
family is 16.67 per cent. However, in case of overall sample respondent’s medium sized family
were 45.00 per cent followed by large sized family with 36.11 per cent and small sized family is
18.89 per cent.
2.1.3 Education status
Table 5 revealed that the majority of the respondents in North Goa had secondary
education (27.78 %) followed by primary education (25.56 %), PUC 18.89 per cent and illiterate
12.22 per cent, whereas in South Goa, education with PUC is 30.00 per cent followed by
secondary education with 22.22 per cent, primary 21.11 per cent and degree 14.44 percent.
Overall literacy status of sample households presented in tables 5 revealed that, majority of the
respondents (49.44%) with secondary education, their education level ranging from Secondary to
PUC level. The rest of the respondents (36.11%) were with primary and degree level education.

19
2.2 Land holding
Table-5 represents the land holdings of sample Cashew nut growers. The average size of
land holding of sample cashew growers in was 3.23 ha in North Goa and 2.82 ha in South Goa.
The overall landholding was 3.08 ha.
2.3 Experience of sample farmers in Cashew nut cultivation
The experience of more than half of the sample farmers (57.78 %) in Cashewnut
cultivation in north Goa ranging from 20 to 30 years, nearly 22.22 per cent of the farmers has 30
to 40 years and only 20 percent of the farmers had 10 to 20 years. In South Goa district also
more that 50 percent of the sample farmers have 20 to 30 years of experience in cashew
cultivation. The farmers with 30 to 40 years and 10 to 20 years experience in cashewnut
cultivation were 34.44 per cent 14.44 per cent respectively.
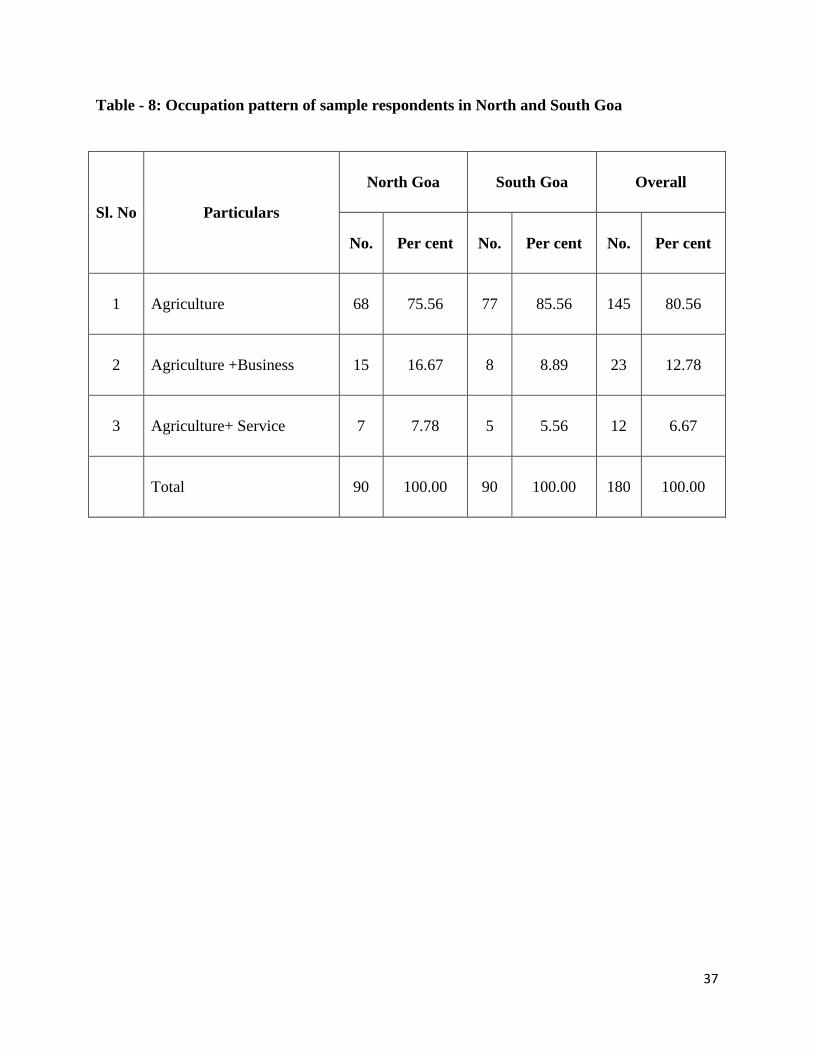
2.4 Occupation pattern of sample respondents
The occupational pattern of sample respondents is presented in the Table 7. Majority of
the sample respondent’s main occupation both in South (85.56 %) and North Goa (75.56 %) was
agriculture. Agriculture + business were the main occupation of 16.67 per cent of farmers in
North Goa and 8.89 per cent of the farmers in South Goa. The rest of the sample farmers (5-7%)
in both the study districts were engaged in various types of serves in addition to agriculture.
However, overall occupational pattern of sample respondents indicated that 80.56 per cent were
involved in agriculture, 12.78 per cent in agriculture + business and 6.67 per cent in agriculture +
service.
3. Establishment Cost of Cashew nut plantation
The establishment cost of Cashewnut plantation in North and South districts of Goa is
presented in the Table 8. The cost of labour for establishment of cashew plantation was higher in
South Goa which accounted for 26.67 percent ( 16,862 per ha) and it was 24.65 percent in
( 13,860 per ha) in North Goa. Similarly, the material cost was also higher (34.73 %) in South
Goa ( 21,958 per ha) when compared to North Goa ( 18.572 per ha, 33.03 %). However,
managerial cost incurred in South Goa was 3402 per ha (5.38) and 2893 per ha (5.15 %) in

20
North Goa The other important cost of investment were land revenue, rental value of land and
depreciation which amounted to 20,995 per ha (33.21) in South Goa and 20895 per ha
(37.17%) in North Goa districts. Thus, the total cost of establishment of cashew plantation
during first year was 63,217 per ha in South Goa and 56,220 per ha in North Goa districts.
3.1. Maintenance cost of Cashew nut plantation during gestation period
3.1.1North Goa district:
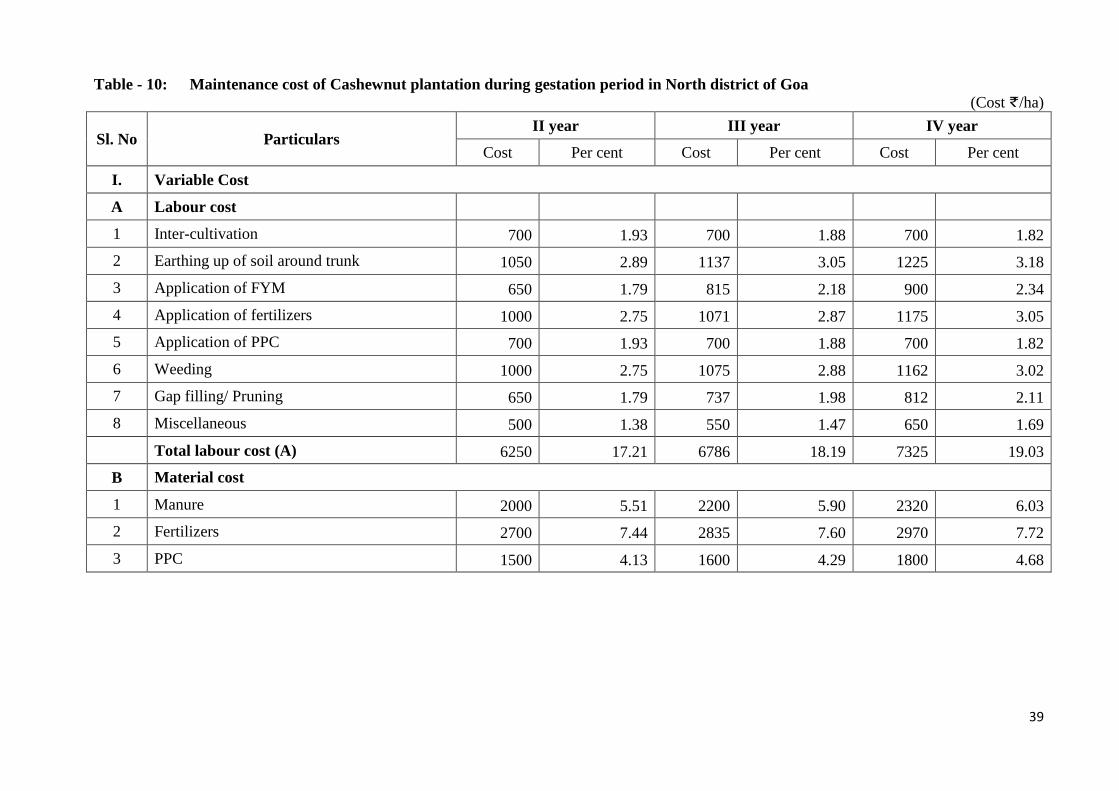
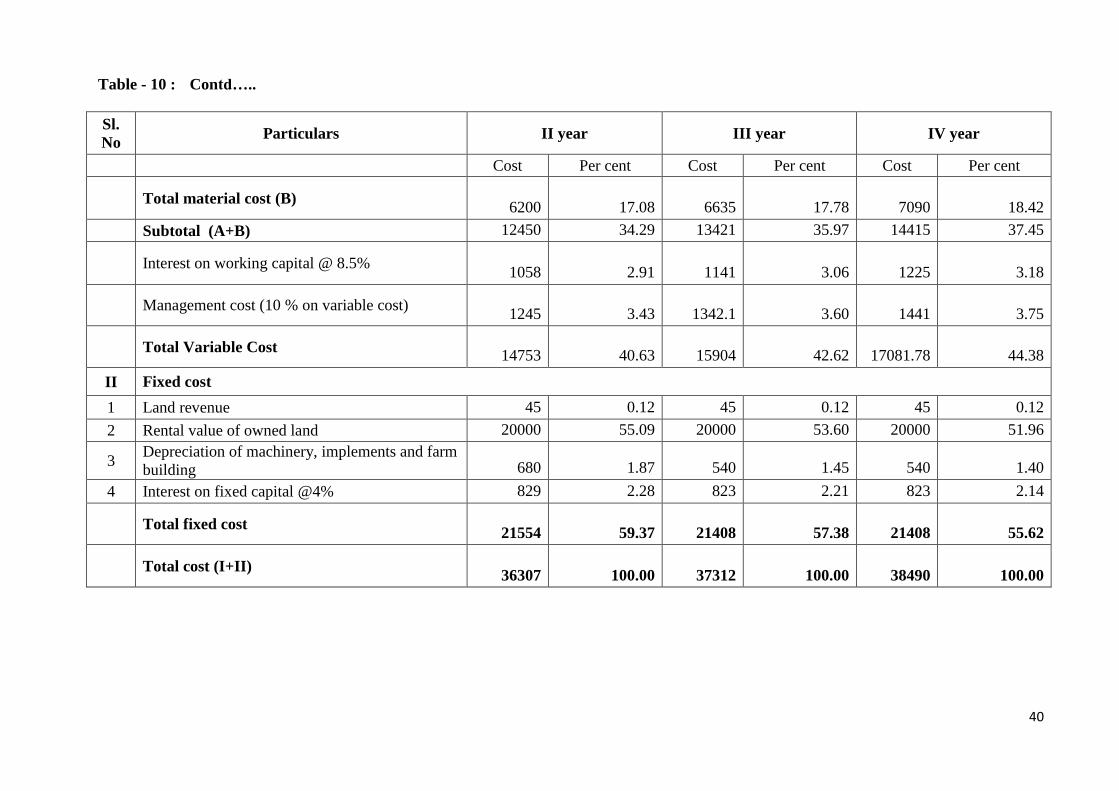
The maintenance cost incurred by the cashewnut growers in North Goa district during the
gestation period is presented in the Table 9. The perusal of the table revealed that total
maintenance cost during second year was 36,307 of which, the variable cost accounted to
6250 with a share of 17.21 per cent of total maintenance cost. The total variable cost comprised
of two components viz., material cost and labour cost. In the total variable cost, the share of
labour component was found to be highest (17.21%) followed by material cost (17.08%),
management cost (3.43%) and interest on working capital (2.91%). The total fixed cost in the
second year contributed nearly 59.37 per cent of the total maintenance cost in second year.
Similarly in third year, the total maintenance cost per ha incurred by the cashewnut
growers was 37,312 of which, the variable cost accounted to 15,904 with a share of 42.62 per
cent of total maintenance cost. In the total variable cost, the share of labour component was
found to be highest (18.19 %) followed by material cost (17.78 %), management cost (3.60 %)
and interest on working capital (3.06 %). The total fixed cost in the third year contributed nearly
57.38 per cent of the total maintenance cost in third year.
However, in case of fourth year, the total maintenance cost per ha was 38,490 of which,
the variable cost accounted to 17,082 with a share of 44.38 per cent of total maintenance cost.
In the total variable cost, the share of labour component was found to be highest (19.03 %)
followed by material cost (18.42 %), management cost (3.75 %) and interest on working capital
(3.18 %). The total fixed cost in the fourth year constituted nearly 55.62 per cent of the total
maintenance cost in fourth year.
21
3.1.2 South Goa district:
The maintenance cost incurred by the South Goa cashewnut growers during the gestation
period are presented in the Table 9. The perusal of the table revealed that total maintenance cost
in the second year was 37,670 of which, the variable cost accounted to 16,116 with a share of
42.78 per cent of total maintenance cost. The total variable cost comprised of two components
viz., material cost and labour cost. In the total variable cost, the share of labour component was
found to be highest (19.50 %) followed by material cost (16.60 %), management cost (3.61%)
and interest on working capital (3.07 %). The total fixed cost in the second year contributed
nearly 57.22 per cent of the total maintenance cost in second year.
Similarly in third year, the total maintenance cost per ha incurred by the cashewnut
growers was 38,256 of which, the variable cost accounted to 16,848 with a share of 44.04 per
cent of total maintenance cost. In the total variable cost, the share of labour component was
found to be highest (19.87 %) followed by material cost (17.29 %), management cost (3.72 %)
and interest on working capital (3.16 %). The total fixed cost in the third year contributed nearly
55.96 per cent of the total maintenance cost in third year.
However, in case of fourth year, the total maintenance cost per ha was 40,015 of which,
the variable cost accounted to 18,607 with a share of 46.50 per cent of total maintenance cost.
In the total variable cost, the share of labour component was found to be highest (21.87 %)
followed by material cost (17.37 %), management cost (3.92 %) and interest on working capital
(3.34 %). The total fixed cost in the fourth year constituted nearly s
3.2 Cost of cultivation of Cashewnut plantation (5th
year onwards)
The cost of cultivation of Cashewnut in North and South districts of Goa is presented in
Table 11. The cost labour was higher in South Goa which amounted to 16,747 per ha (33.04 %)
and 14,351 per ha (28.79 %) in North Goa, followed by material cost of 8957 per ha (17.97
%) and 7095 per ha (14.00 %) respectively in North and South Goa districts. The other
important cost of cultivation were land revenue, rental value of land, amortized establishment
cost, depreciation and interest on fixed capital, these components put together amounted to
22,560 per ha (44.5 %) in South Goa and 22,347 per ha (44.83 %) in case of North Goa Thus,
22
the annual total cost of cultivation of cashewnut plantation after establishment of five year
onward was 50,694 per ha in South Goa and 49,850 per ha in North Goa districts.
3.3 Yield obtained and returns realized in Cashewnut plantation during bearing period (5th
year onwards)
The sample cashewnut growers harvested cashew fruits/nuts for a period of four months
(February, March, April and May) in a year. The yields obtained and returns realized from the
sale of Cashewnut are presented in the Table-12. It could be seen from the table that, per ha
quantity Cashewnuts harvested in North Goa was 1035 kg and 1175 kg per ha in South Goa,
whereas peak yield was harvested in the months of April and May. In view of harvesting of
higher yield of cashewnuts, South Goa district farmers realized higher gross returns ( 1, 64,500)
per ha as compared to North Goa district farmers ( 1,44,900) per ha. The total cost of
production per ha in South Goa district was 53,135 per ha, whereas in North Goa district, it was
51,793. The net returns realized from the sale of Cashewnuts in South Goa was 1, 11,365 per
ha, whereas it was 93,107 per ha in North Goa district.
4.1 Preference of farmers for a particular agency for marketing of cashewnuts
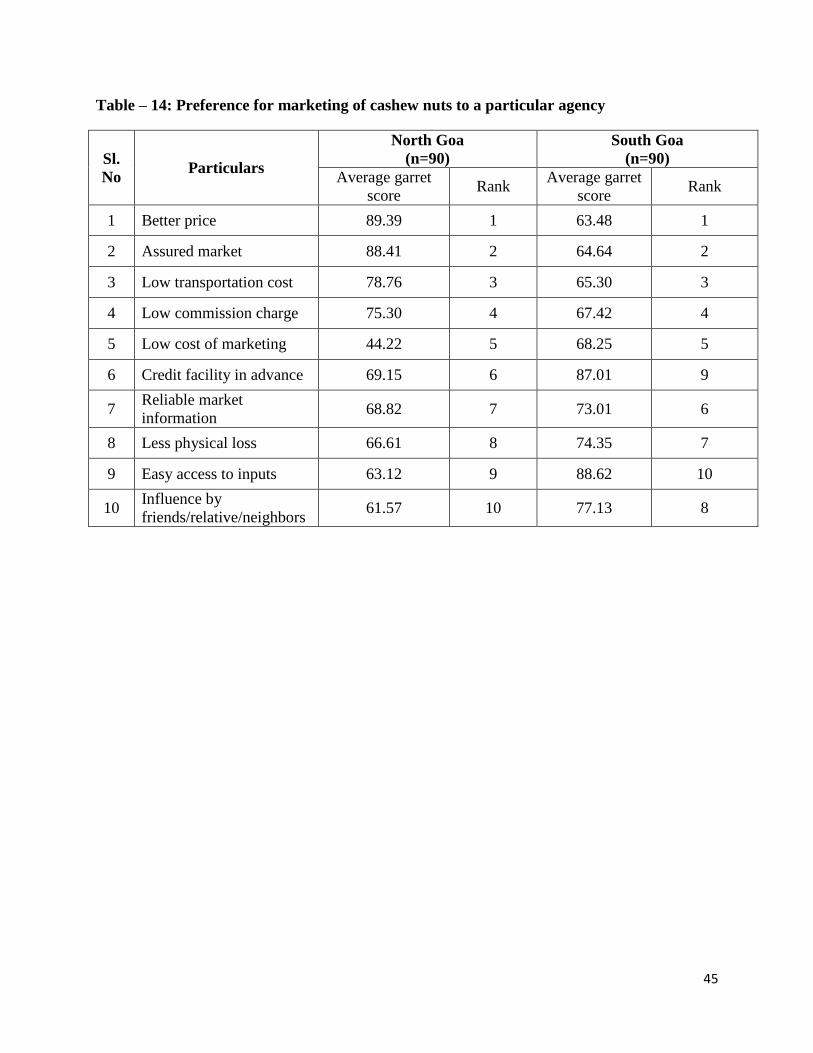
The results presented in the Table 15 revealed that Better price was the major preference
of all most all the sample farmers in North Goa followed by Assured market, Low
transportation cost, Low commission charge, Low cost of marketing , Credit facility in advance ,
Reliable market information, Less physical loss , Easy access to inputs and Influence by
friends/relative/neighbors. Similarly, in South Goa district, the preference for marketing of
cashewnuts was Better price followed by Assured market (Rank II), Low transportation cost
(Rank III), Low commission charge (Rank IV), Low cost of marketing (Rank V), Reliable
market information (Rank VI), Less physical loss (Rank VII), Influence by
friends/relative/neighbors (Rank VIII), Credit facility in advance (Rank IX) and Easy access to
inputs (Rank X).

23
4.1.2 Marketing of cashewnuts by farmer
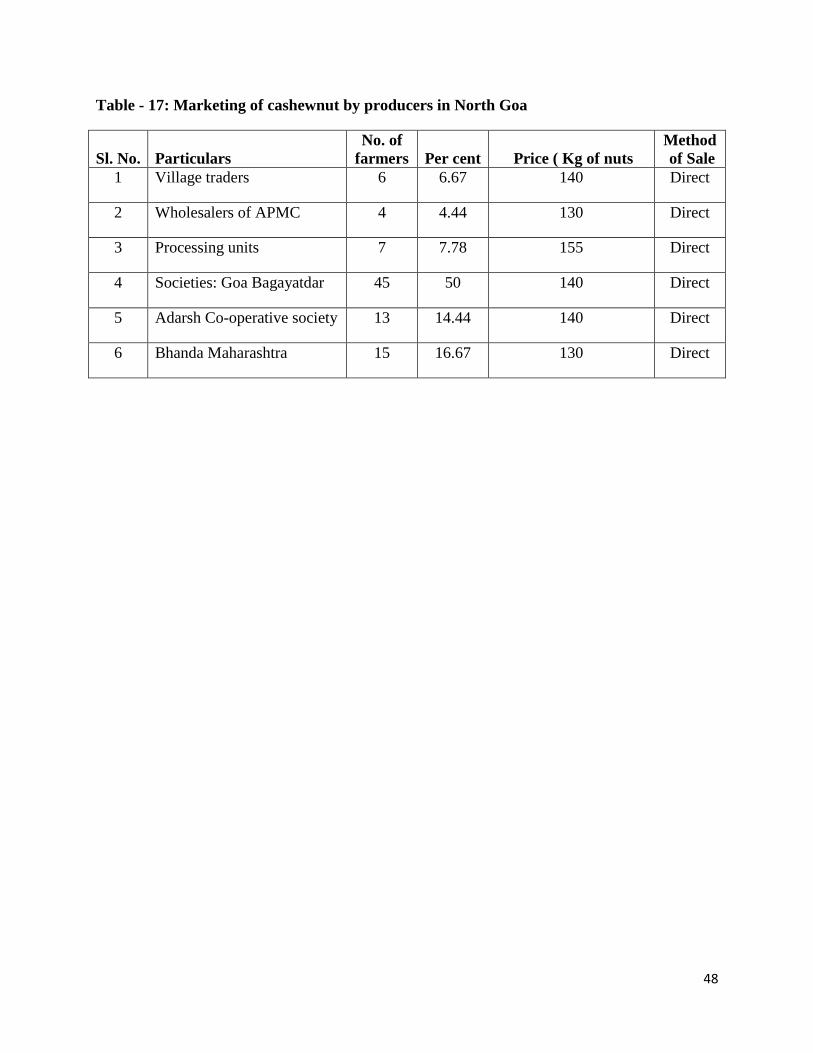
The results on marketing of cashewnut by growers in North Goa are presented in the
Table 13. It is observed that, majority of the farmers sold their produce to Goa Bagayatdar
Society (50.00 %) followed by Bhanda Maharashtra (16.67), Adarsh Co-operative society
(14.44), Processing units (7.78%), Village traders(6.67%), Wholesalers in APMCs (4.44
percent). The method of sale was direct in all the cases of marketing.
The results on marketing of cashewnut by grower in south Goa is presented in the Table
14. It is noticed that, majority of the farmers sold their products to Adarsh Co-operative society
(54.44) followed by Goa Bagayatdar (23.33 %) , Wholesalers (12.22), Village traders (5.56%),
and Processing units (4.44%), The method of sale was direct in all the cases of marketing.
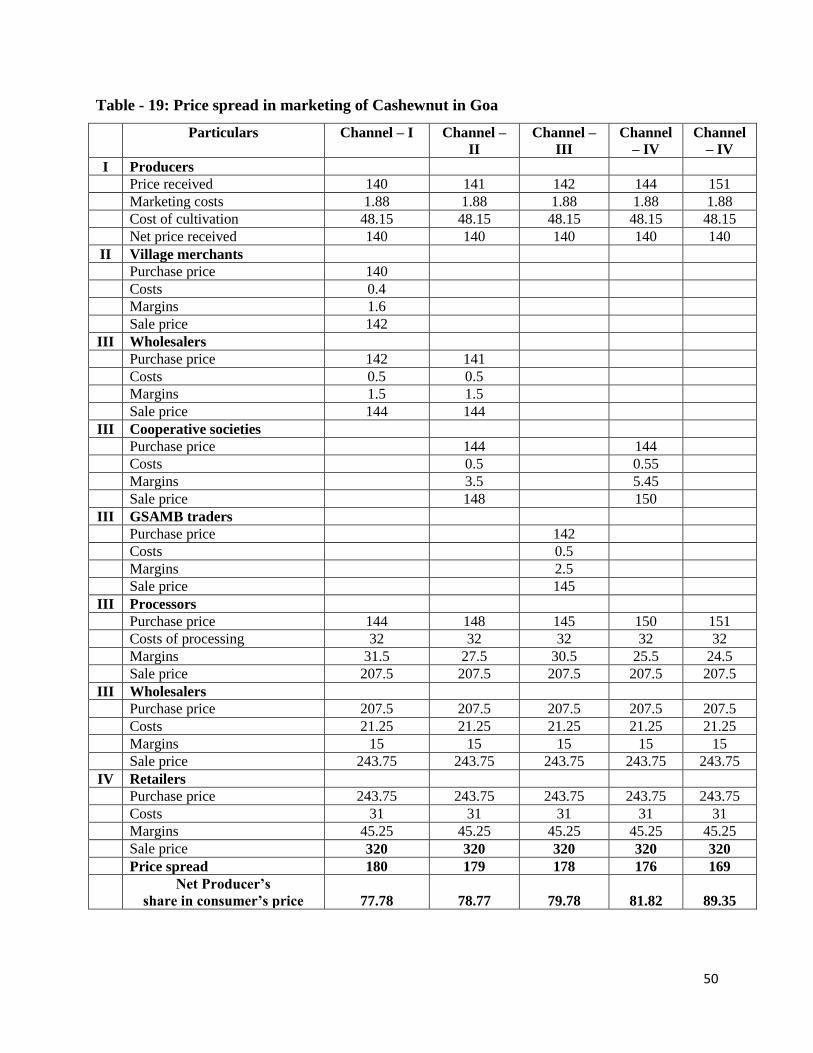
4.1.3 Price spread in marketing of Cashewnut in Goa
The price spread, net producers share in consumers’ rupee and margins of market
intermediaries in Goa are presented in Table 4.22. The table Indicated that the net producer’s
share in consumer’s rupee was found to be more in channel- V of marketing (89.35%) compared
to channel-I, II, III and IV. Correspondingly net price received by the producer per Kg of
Cashewnut was the highest in channel-V ( 151 per Kg) followed by channel-IV ( 144 per Kg),
channel-III ( 142 per Kg), channel-II ( 141 per Kg) and channel-I ( 140 per Kg). The price
spread was marginally more in case of channel-I ( 180/250gm cashew) followed by channel-II
( 179/250gm cashew), channel-III ( 178/250gm cashew), channel-IV ( 176/250gm cashew)
and channel-V ( 169/250gm cashew).
5.1 Constraints faced by Cashewnut producers in Production
The results presented in the Table 16 revealed that wild animals intervention in the
cashewnuts plantation during harvesting period was the major problem experienced by all the
farmers in North Goa (Rank I), followed by non availability of water (Rank II) & good quality
seedlings (Rank III), high wages of labour (Rank IV), pest and disease attack (Rank V), lack of
improved harvesting techniques (Rank VI), power cuts/ shortage of electricity (Rank VII), lack
of technical knowledge (Rank VIII), higher initial investment (Rank IX) and property rights
(Rank X).

24
Table 16 revealed that damage of cashewnuts by wild animals was the major problem
experienced by all the farmers in North Goa (Rank I), followed by non availability of water
(Rank II), non availability of good quality seedlings (Rank III), labour shortage/ high wages of
labour (Rank IV), pest and disease attack (Rank V), lack of improved harvesting techniques
(Rank VI), power cuts/ electricity problem (Rank VII), lack of technical knowledge (Rank VIII),
higher initial investment (Rank IX) and property rights (Rank X).
5.2 Constraints faced by Cashewnut producers in marketing
The results presented in the Table 17 revealed that Poor market intelligence was the
major problem experienced by all the farmers in North Goa followed by Lack of storage
facilities (Rank II), Non availability of market facility near farm (Rank III), Price fluctuation
(Rank IV), Financial support for marketing (Rank V), Delay in payment after sale (Rank VI),
High transportation cost (Rank VII), High commission charges (Rank VIII) and High market fee
(Rank IX).
Similarly, in South Goa the problems reported were Poor market intelligence which was
the major problem experienced by all the farmers (Rank I), followed by Price fluctuation (Rank
II), Non availability of market facility near farm (Rank III), Lack of storage facilities (Rank IV),
High transportation cost (Rank V), Financial support for marketing (Rank VI), High commission
charges (Rank VII), High market fee (Rank VIII) and Delay in payment after sale (Rank IX).

25
IV. SUMMARY AND POLICY IMPLICATIONS
Cashew production provides excellent opportunities in raising the income of the farmers
even in the dry tracts. A significant shift towards horticulture crop specially Cashew is evident
in India and Goa state with an increase in area and production. Cashewnut provides higher unit
productivity and offers a great scope for value addition and this sector is taking inroads
throughout the length and breadth of the state. cashewnut is such a crop which would serve as a
source of income in terms of both raw material and value added product. Keeping in view the
importance of cashew in the Indian economy in general and its major growing states in
particularly, the present study made an attempt to analyze the cashew value chain in Goa with
following specific objectives;
4.1 Specific objectives:
1. To estimate the growth in area, production and productivity of Cashew nuts in Goa
2. To assess the financial feasibility and economic viability of investment in input
supply (nursery), establishment of cashew plantation, cost and returns in cashew
cultivation in the study area.
3. To analyse production, processing, value addition and marketing of cashew in Goa
4. To estimate cost and margins under different channels of cashew and its products
marketing.
5. To assess the institutional support system for promoting cashew economy of Goa
6. To document constraints and opportunities in production, processing, value addition
and marketing of cashew and its products and suggest suitable policy measures to
promote cashew economy of India in general and Goa in particular.

26
4.2 Methodology
The study was based on the data collected from 180 Cashew growers from North and
South districts Goa state. In order to study the marketing aspects, 60 market intermediaries (10
each of commission agent-cum-wholesalers, retailers and consumers) were selected randomly
markets. The study was based on both primary and secondary data. The necessary primary data
pertaining to agricultural year 2016-17 were obtained from the selected sample cashew
cultivators and various market intermediaries through personal interview method with the help of
pre-tested and structured interview schedule and the data.
Secondary data were collected from Directorate of Agriculture, Goa, Goa state marketing
board, Goa and various official departments in Goa office. The secondary data collected for the
study included time series data of State wise area, production and productivity under
Cashewnnut in Goa state and India. Selling and purchase price of output by market
intermediaries for the year 2017-18.
For analysing the data collected during the study, tabular analysis, compound annual
growth rate, financial feasibility analysis and Garret ranking tools were employed. The tabular
presentation was employed for estimating the cost and returns structure in Cashewnut.
Compound growth rate analysis was employed to know the growth rate in the area, production
and productivity of Cashewnut. In order to know the financial feasibility of investment in acid
lime, the measures of project evaluation techniques viz., Benefit Cost Ratio (BCR) was
employed. Garret ranking technique was used to rank the problems faced by the Cashewnut
farmer in the study area on the basis of severity.
4.2. Major findings of the study
The growth of area under cashew nut was found to be highest in Orissa (4.80 %)
followed by Kerala (3.51 %), Karnataka (1.93 %), Maharashtra (1.49 %), Tamil Nadu (1.33
%) and Goa (0.86 %), where as the cashew nut production growth was highest in Karnataka
(5.70 %) followed by West Bengal (2.60 %), Goa (2.40 %), Maharashtra (1.90 %) and Kerala
(1.80 %).

27
It was observed that, the area under Cashewnut in Goa recorded 0.25 per cent
Compound Annual Growth Rate (CAGR) and at all India level, a significant growth of 2.29
per cent was observed.
Majority of the farmers are of old age (above 50 years) both in North (51.11 %)
and South districts of Goa (57.78 %) followed by middle aged (ranged between 36-50 years
in North (37.78 %) and South (26.67%)
The experience of more than half of the sample farmers (57.78 %) in Cashewnut
cultivation in north Goa ranging from 20 to 30 years, nearly 22.22 per cent of the farmers has
30 to 40 years and only 20 percent of the farmers had 10 to 20 years. In South Goa district
also more that 50 percent of the sample farmers have 20 to 30 years of experience in cashew
cultivation.
Majority of the sample respondent’s main occupation both in South (85.56 %) and
North Goa (75.56 %) was agriculture. Agriculture + business were the main occupation of
16.67 per cent of farmers in North Goa and 8.89 per cent of the farmers in South Goa.
The total cost of establishment of cashew plantation during first year was 63,217
per ha in South Goa and 56,220 per ha in North Goa districts.
The annual total cost of cultivation of cashewnut plantation after establishment of
five year onward was 50,694 per ha in South Goa and 49,850 per ha in North Goa
districts.
The price spread was marginally more in case of channel-I ( 180/250gm cashew)
followed by channel-II ( 179/250gm cashew), channel-III ( 178/250gm cashew), channel-
IV ( 176/250gm cashew) and channel-V ( 169/250gm cashew).
Poor market intelligence which was the major problem experienced by all the
farmers, followed by Price fluctuation, Lack of storage facilities
Non availability of water, good quality seedlings, high wages of labour, pest and
disease attack, and lack of improved harvesting techniques were the major problem faced by
farmer during production of cashewnuts.
28
4.3. Policy Implications
Based on the findings of the investigation the following policy can be suggested for promoting
the cashew economy of Goa.
1. The results of estimation of Compound Annual Growth Rates (CAGR) in area, production
and productivity of cashew nut in Goa over other major cashew nut growing states and at all
India level revealed that the CAGR of cashew nut area was declined substantially and
CAGR of cashew nut production and productivity was found to be negative. Efforts should
be made to bring fallow and uncultivable lands under cashew plantation by providing
financial support to the cashew growers.
2. In south Goa district, major cashew plantation is under forest lands, which is not recorded
in the cashew plantation area in Goa state and majority of the farmers are following
traditional methods of cultivation that resulted in low productivity and low production of
cashewnuts. To enhance productivity as well as total production cashew nuts, efforts
should be made to create awareness among the farmers regarding new methods of
cultivation by timely providing good quality sampling and adoption of scientific methods
of cultivation.
3. Majority of the farmers expressed the problem of stem borer when the cashew nut plants
attained the bearing age. This reduced the plant population of the cashew plantation and also
substantially reduced the yield which in turn results in reduction in the income of the farmers.
To overcome this problem, efforts should be made by the concerned departments to advice
the farmers to take appropriate control measures to save the plant. And also arrangements
have to be made to supply stem borer resistant varieties.
4. Attack of wild animals in the cashew plantations during harvesting period of cashew fruits
and also damage of seedlings after plantation. Efforts should be made to support the farmers
by the forest Department or support the farmers to create solar fencing facility in the
cashewnut plantation fields.
5. Majority of the farmers selling raw cashewnuts directly to the traders at low prices, devoid of
the opportunity of value addition to the cashewnut. The private processing units are enjoy the

29
major share in the consumer’s rupee. To improve the producers share in the consumers rupee,
efforts should be made to create awareness among the farmers to organize Farmer Producer
Groups to take up processing of the cashew nuts in to cashew and cashew apple in to juice/
Ura/Fenny, which not only increased the value addition to the cashew nut but also increase
the producer share in the consumer’s rupee.
6. Cashewnut farmers are facing legal problem with regard to land property rights. Most of the
cashew growers in general and South Goa cashew growers in particular are facing the
problems from the forest department, which results in disinterest in maintenance and
management of the cashew plantations. Efforts should be made to define the land
demarcations to through proper measurement of land boundaries.
7. Majority of the farmers are considering the agriculture as the secondary occupation. As a
result they are not taking up appropriate scientific methods of cultivation in cashewnut
plantation, which in turn reduced the yield and income of the farmers. Efforts should be
made to advise the farmers by demonstrating scientific methods of cultivation to realize the
yield and income potentiality of cashew plantation to double their farm income.
8. Wide fluctuation in prices of cashew nuts is another major obstacle faced by the cashew
growers to expand area under cashew plantations. Efforts should be made to announce
Minimum Support Prices well in advance and initiate procurement operations to protect the
interest of the farmers in respect of price fluctuations.
9. Department of Agriculture, Goa implemented various schemes for the benefit of
agriculturists in general and cashew growers in particulars. In view of non availability of
required information regarding implementation various schemes for the benefit of cashew
growers, it is not possible to suggest policy implications.
10. The scientists of ICAR Complex (CCARS) have developed various cashew bye products.
Efforts should be made to enhance the income of the cashew growers by popularizing
and commercializing of the products.

30
Table - 1: States wise Growth in Area, Production and Productivity of Cashew nut in
India during 2008-09 to 2016-17)
Sl. No Major States Area Production Productivity
1 Kerala 3.51** 1.8** -1.69*
2 Karnataka 1.93** 5.7** 3.71**
3 Goa 0.86* 2.4** 1.53
4 Maharashtra 1.49** 1.9** 0.44*
5 Tamil Nadu 1.33** -0.1 -1.40
6 Andhra Pradesh 0.32* -0.6 -0.96
7 Orissa 4.80** -0.7 -5.29
8 West Bengal 0.12 2.6* 2.62*
9 Others States 6.31** 10.5** 3.95*
10 All India 2.14*** 1.7** -0.44
Note: ***, ** & * indicate significant levels at 1, 5 and 10 per cent respectively
31
Table - 2: Area, production and productivity of Cashew nut in India (2001-02 to 2016-17)
Sl. No Year Area in ha Production in MT Productivity in Kgs/ha
1 2001-02 770 472 613
2 2002-03 770 506 657
3 2003-04 780 535 686
4 2004-05 820 544 663
5 2005-06 837 573 685
6 2006-07 854 620 726
7 2007-08 868 665 766
8 2008-09 893 695 778
9 2009-10 923 613 664
10 2010-11 945 653 691
11 2011-12 979 725 741
12 2012-13 991 752 759
13 2013-14 1011 753 745
14 2014-15 1023 745 728
15 2015-16 1037 671 647
16 2016-17 1041 779 748
CAGR
2.29*** 3.02*** 0.71*
Note: ***, ** & * indicate significant levels at 1, 5 and 10 per cent respectively

32
Table-3 Marketwise arrivals and value of Cashewnut in Goa
(Quantity in tonnes and value in Lakh rupee)
SN Year
Ponda Sanquelim Mapusa Curchorem Canacona Valpoi Pernem
Quantity Value Quantity Value Quantity Value Quantity Value Quantity Value Quantity Value Quantity Value
1 2004-05 862.28 388.6 523.62 243.6 154.48 68.81 1806.67 821.8 367.15 165.2 69.88 31.24 61.89 23.97
2 2005-06 402.66 159 897.97 365 164.87 65.05 1091.98 429.7 335.79 131.2 90.79 35.72 123.89 47.67
3 2006-07 353.6 134.6 732.87 286.9 106.48 41.12 882.68 341.1 244.21 93.11 54.14 20.4 81.39 30.69
4 2007-08 435.06 203.1 359.04 168.7 183.08 86.4 1150.7 535.7 343 158.6 75.01 34.89 109.02 51
5 2008-09 357.03 170.2 281.2 141.7 113 54.97 1068.14 532.4 442.58 215.2 77.62 37.65 84.02 41.42
6 2009-11 477.6 247.1 142.03 80.62 122.07 71.62 1100.75 638.9 442.93 261.5 102.39 60.4 124.65 76.19
7 2011-12 28.95 224.9 277.71 224.8 148.63 117.9 1087.45 874 622.62 496.7 136.92 108.9 135.33 109.2
8 2012-13 403.57 307.8 300.57 234.5 114.24 87.67 788.83 621.8 506.41 390.3 173.68 134.3 135.25 104.5
9 2013-14 317.67 243.3 309.18 232.9 186.79 141.8 760.79 639.7 538.07 405.3 162.47 122.1 299.98 229.3
Correlation
co efficient 0.60 0.87 0.62 0.45 0.97 0.99 0.97

33
Table - 4: Area, production and productivity of Cashewnut in Goa (2002-03 to 2016-17)
Sl. No Year Area in Ha Production in Tonnes Productivity in Kgs/ha
1 2002-03 54373 23109 425
2 2003-04 54668 23233 425
3 2004-05 54858 25556 466
4 2005-06 55021 27070 492
5 2006-07 55302 24380 441
6 2007-08 55612 21942 395
7 2008-09 55672 13165 236
8 2009-10 55732 17556 315
9 2010-11 55732 23138 415
10 2011-12 55737 23240 417
11 2012-13 55747 23804 427
12 2013-14 55936 24332 435
13 2014-15 56079 25011 446
14 2015-16 56609 17549 310
15 2016-17 56735 24396 430
CAGR 0.25*** -0.43 NS -0.69 NS
Note: ***, ** & * indicate significant levels at 1, 5 and 10 per cent respectively

34
Table - 5: Growth in area, production and productivity of Cashew nut in India and Goa
(2001-02 to 2016-17)
Sl. No Particulars India Goa
1 Area 2.29*** 0.25***
2 Production 3.02*** -0.43 NS
3 Productivity 0.71* -0.69 NS
Note: ***, ** & * indicate significant levels at 1, 5 and 10 per cent respectively

35
Table – 6: Socio-Economic characteristics of Cashewnut growers in North and South
districts of Goa state
Sl. No Particular North Goa
(n=90)
South Goa
(n=90)
Pooled
(N=180)
I Age group (No.)
A Upto 35 years 10
(11.11)
14
(15.56)
24
(13.33)
B 35-50 years 34
(37.78)
24
(26.67)
58
(32.22)
C Above 50 years 46
(51.11)
52
(57.78)
98
(54.44)
Average age (year) 52 54 51
II Education Status
A Illiterate 11
(12.22)
8
(8.89)
19
(10.56)
B Primary 23
(25.56)
19
(21.11)
42
(23.33)
C Secondary 25
(27.78)
20
(22.22)
45
(25.00)
D PUC 17
(18.89)
27
(30.00)
44
(24.44)
E Degree 10
(11.11)
13
(14.44)
23
(12.78)
F Postgraduates 4
(4.44)
3
(3.33)
7
(3.89)
III Family size
A Small (upto 4) 19
(21.11)
15
(16.67)
34
(18.89)
B Medium (4-6) 34
(37.78)
47
(52.22)
81
(45.00)
C Large (>6) 37
(41.11)
28
(31.11)
65
(36.11)
IV Land holding (No)
A Small farmers(upto 2ha) 42
(46.67)
51
(56.67)
93
(51.67)
B Medium farmers(2 to 5ha) 28
(31.11)
24
(26.67)
52
(28.89)
C Large farmers(>5 ha) 20
(22.22)
15
(16.67)
35
(19.44)
D Average land holding in ha 3.23 2.82 3.08

36
Table - 7: Experience of sample farmers in Cashewnut cultivation
Sl. No Experience
(Years)
North Goa
(n=90)
South Goa
(n=90)
No of farmers Per cent No of farmers Per cent
1 10-20 18 20.00 13 14.44
2 20-30 52 57.78 46 51.11
3 30-40 20 22.22 31 34.44
Total 90 100.00 90 100.00
37
Table - 8: Occupation pattern of sample respondents in North and South Goa
Sl. No Particulars
North Goa South Goa Overall
No. Per cent No. Per cent No. Per cent
1 Agriculture 68 75.56 77 85.56 145 80.56
2 Agriculture +Business 15 16.67 8 8.89 23 12.78
3 Agriculture+ Service 7 7.78 5 5.56 12 6.67
Total 90 100.00 90 100.00 180 100.00

38
Table - 9: Establishment Cost of Cashewnut plantation in North and South Goa
(Per ha)
Sl. No Particulars North Goa South Goa
A. Labour Cost Cost ( ) Per cent Cost ( ) Per cent
1 Land leveling 6360 11.31 7982 12.63
2 Opening of pits and filling of pits 2550 4.54 2959 4.68
3 Manures (FYM) application 1000 1.78 1080 1.71
4 Planting 1250 2.22 1415 2.24
5 Staking 750 1.33 1254 1.98
6 Filling Pits 1250 2.22 1515 2.40
7 Fencing 700 1.25 657 1.04
Total labour cost 13860 24.65 16862 26.67
B. Material cost
1 Manures (FYM ) – (t) 1260 2.24 1518 2.40
2 Fertilizers (Kg) 2892 5.14 3484 5.51
3 Seedlings (No.) 10500 18.68 11750 18.59
4 Staking (sticks) ( including
transportation cost ) – (No.) 420 0.75 406 0.64
5 Fencing 3500 6.23 4800 7.59
Total material cost 18572 33.03 21958 34.73
Sub total (A+B) 32432 57.69 38820 61.41
C. Managerial cost (10% @ VC) 2893 5.15 3402 5.38
Total – I (A+B+C) 35325 62.83 42222 66.79
D. Land revenue 45 0.08 45 0.07
E. Rental value of land 20000 35.57 20000 31.64
F. Depreciation 850 1.51 950 1.50
Total – II (D+E+F) 20895 37.17 20995 33.21
Total cost (I+II) 56220 100.00 63217 100.00
Note: 215 plants/ ha in North Goa and 235 plants/ha in South Goa
39
Table - 10: Maintenance cost of Cashewnut plantation during gestation period in North district of Goa (Cost /ha)
Sl. No Particulars II year III year IV year
Cost Per cent Cost Per cent Cost Per cent
I. Variable Cost
A Labour cost
1 Inter-cultivation 700 1.93 700 1.88 700 1.82
2 Earthing up of soil around trunk 1050 2.89 1137 3.05 1225 3.18
3 Application of FYM 650 1.79 815 2.18 900 2.34
4 Application of fertilizers 1000 2.75 1071 2.87 1175 3.05
5 Application of PPC 700 1.93 700 1.88 700 1.82
6 Weeding 1000 2.75 1075 2.88 1162 3.02
7 Gap filling/ Pruning 650 1.79 737 1.98 812 2.11
8 Miscellaneous 500 1.38 550 1.47 650 1.69
Total labour cost (A) 6250 17.21 6786 18.19 7325 19.03
B Material cost
1 Manure 2000 5.51 2200 5.90 2320 6.03
2 Fertilizers 2700 7.44 2835 7.60 2970 7.72
3 PPC 1500 4.13 1600 4.29 1800 4.68
40
Table - 10 : Contd…..
Sl.
No Particulars II year III year IV year
Cost Per cent Cost Per cent Cost Per cent
Total material cost (B) 6200 17.08 6635 17.78 7090 18.42
Subtotal (A+B) 12450 34.29 13421 35.97 14415 37.45
Interest on working capital @ 8.5% 1058 2.91 1141 3.06 1225 3.18
Management cost (10 % on variable cost) 1245 3.43 1342.1 3.60 1441 3.75
Total Variable Cost 14753 40.63 15904 42.62 17081.78 44.38
II Fixed cost
1 Land revenue 45 0.12 45 0.12 45 0.12
2 Rental value of owned land 20000 55.09 20000 53.60 20000 51.96
3 Depreciation of machinery, implements and farm
building 680 1.87 540 1.45 540 1.40
4 Interest on fixed capital @4% 829 2.28 823 2.21 823 2.14
Total fixed cost 21554 59.37 21408 57.38 21408 55.62
Total cost (I+II) 36307 100.00 37312 100.00 38490 100.00

41
Table – 11 : Maintenance cost of Cashewnut during gestation period in South district of Goa
(Value in /ha)
Sl. No Particulars II year III year IV year
Cost Per cent Cost Per cent Cost Per cent
I. Variable Cost
A Labour cost
1 Inter-cultivation 850 2.26 800 2.09 800 2.00
2 Earthing up of soil around trunk 1320 3.50 1252 3.27 1350 3.37
3 Application of FYM 803 2.13 841 2.20 1859 4.65
4 Application of fertilizers 1187 3.15 1265 3.31 1295 3.24
5 Application of PPC 951 2.53 1011 2.64 1090 2.72
6 Weeding 1284 3.41 1331 3.48 1378 3.44
7 Gap filling/ Pruning 450 1.19 552 1.44 480 1.20
8 Miscellaneous 500 1.33 550 1.44 500 1.25
Total labour cost (A) 7345 19.50 7603 19.87 8753 21.87
B Material cost
1 Manure 2000 5.31 2080 5.44 2160 5.40
2 Fertilizers 2754 7.31 2835 7.41 2889 7.22
3 PPC 1500 3.98 1700 4.44 1900 4.75

42
Table – 11 : Contd…..
Sl.
No Particulars II year III year IV year
Cost Per cent Cost Per cent Cost Per cent
Total material cost (B) 6254 16.60 6615 17.29 6949 17.37
Subtotal (A+B) 13599 36.10 14217.5 37.16 15701.87 39.24
Interest on working capital @ 8.5% 1156 3.07 1208 3.16 1335 3.34
Management cost (10 % on variable cost 1360 3.61 1422 3.72 1570 3.92
Total Variable Cost 16116 42.78 16848 44.04 18607 46.50
II Fixed cost
1 Land revenue 45 0.12 45 0.12 45 0.11
2 Rental value of owned land 20000 53.09 20000 52.28 20000 49.98
3 Depreciation of machinery, implements and farm
building 680 1.81 540 1.41 540 1.35
4 Interest on fixed capital @4% 829 2.20 823.4 2.15 823.4 2.06
Total fixed cost 21554 57.22 21408.4 55.96 21408.4 53.50
Total cost (I+II) 37670 100.00 38256 100.00 40015 100.00

43
Table - 12: Cost of cultivation of Cashewnut plantation in North Goa and South Goa
(5th
year onwards)
Sl.
No Particulars
North Goa South Goa
Cost Per cent Cost Per cent
I Variable Cost
A. Labour Cost
1 Inter-cultivation 750 1.50 850 1.68
2 Loosening of soil around trunk 672 1.35 730 1.44
3 Application of FYM 360 0.72 450 0.89
4 Application of fertilizers 652 1.31 785 1.55
5 Application of PPC 1582 3.17 540 1.07
6 Weeding 2200 4.41 2850 5.62
7 Harvesting 6,850 13.74 8940 17.64
8 Gap filling/ Pruning 735 1.47 852 1.68
9 Miscellaneous 550 1.10 750 1.48
Total Labour Cost 14,351 28.79 16747 33.04
B. Material cost
1 Manure 3,850 7.72 2785 5.49
2 Fertilizers 4,657 9.34 3960 7.81
3 PPC 450 0.90 350 0.69
4 Irrigation cost 0 0.00 0 0.00
Total Material cost 8,957 17.97 7095 14.00
Subtotal (A+B) 23,308 46.76 23842 47.03
Interest on working capital @ 8.5% 1,865 3.74 1907 3.76
Management cost (10 % on VC) 2,331 4.68 2384 4.70
Total Variable Cost 27,503 55.17 28134 55.50
II Fixed cost
1 Land revenue 45 0.09 45 0.09
2 Rent value of owned land 20,000 40.12 20,000 39.45
3 Amortized establishment 1,124 2.25 1,264 2.49
4 Depreciation 320 0.64 385 0.76
5 Interest on fixed capital @ 4% 857.76 1.72 866 1.71
Total fixed cost 22,347 44.83 22560 44.50
Total cost (I+II) 49,850 100.00 50694 100.00

44
Table -13: Yields obtained and Returns realized in Cashewnut Cultiation (5th
year
onwards)
Per ha
Sl. No Particulars North Goa South Goa
1 Yield obtained in nuts (Kg/month)
a) February 75 95
b) March 120 125
c) April 355 375
d) May 485 580
Total yield (Kg/ Ha) 1035 1175
3 Gross returns (Rs) 144900 164500
4 Cost of cultivation ( ) 49843 50685
5 Marketing costs ( ) 1950 2450
6 Total Cost cultivation ( ) 51793 53135
7 Net returns ( ) 93107 111365
B-C Ratio 2.79 3.24
45
Table – 14: Preference for marketing of cashew nuts to a particular agency
Sl.
No Particulars
North Goa
(n=90)
South Goa
(n=90)
Average garret
score Rank
Average garret
score Rank
1 Better price 89.39 1 63.48 1
2 Assured market 88.41 2 64.64 2
3 Low transportation cost 78.76 3 65.30 3
4 Low commission charge 75.30 4 67.42 4
5 Low cost of marketing 44.22 5 68.25 5
6 Credit facility in advance 69.15 6 87.01 9
7 Reliable market
information 68.82 7 73.01 6
8 Less physical loss 66.61 8 74.35 7
9 Easy access to inputs 63.12 9 88.62 10
10 Influence by
friends/relative/neighbors 61.57 10 77.13 8

46
Table – 15: Constraints faced by farmers in cashew nut production
Sl.
No Factors
North Goa
(n=90)
South Goa
(n=90)
Average garret
score Rank
Average
garret score Rank
1 Wild animals problem 89.93 1 78.92 3
2 Non availability of water 87.5 2 88.61 1
3 No availability of good quality
seedlings 79.74 3
68.92 5
4 Labour shortage/ high wages of
labour 77.65 4
77.02 4
5 Pest and disease attack 74.59 5 87.21 2
6 Lack of improved harvesting
techniques 69.87 6
67.86 6
7 Power cuts/ Electricity problem 68.85 7 63.21 9
8 Lack of technical knowledge 67.23 8 66.92 7
9 Higher initial investment 64.82 9 64.71 8
10 Property rights 63.13 10 61.68 10

47
Table – 16: Constraints faced by farmers in cashew nut marketing
Sl.
No Factors
North Goa
(n=90)
South Goa
(n=90)
Average garret
score Rank
Average
garret score Rank
1 Poor market intelligence 77.65 1 78.42 1
2 Lack of storage facilities 72.16 2 69.86 4
3 Non availability of market
facility near farm 68.47 3
72.41 3
4 Price fluctuation 66.85 4 77.92 2
5 Financial support for
marketing 64.32 5
66.52 6
6 Delay in payment after sale 63.81 6 55.09 9
7 High transportation cost 61.72 7 67.33 5
8 High commission charges 58.77 8 65.22 7
9 High market fee 54.82 9 59.48 8
48
Table - 17: Marketing of cashewnut by producers in North Goa
Sl. No. Particulars
No. of
farmers Per cent Price ( Kg of nuts
Method
of Sale
1 Village traders 6 6.67 140 Direct
2 Wholesalers of APMC 4 4.44 130 Direct
3 Processing units 7 7.78 155 Direct
4 Societies: Goa Bagayatdar 45 50 140 Direct
5 Adarsh Co-operative society 13 14.44 140 Direct
6 Bhanda Maharashtra 15 16.67 130 Direct

49
Table - 18: Marketing of cashewnut by producer in South Goa
Sl. No To whom sold No. of
Farmers Per cent
Mode Price/Kg
of nuts
Method
of Sale
1 Village traders 5 5.56 130 Direct
2 Wholesalers 11 12.22 135 Direct
3 Processing units 4 4.44 142 Direct
5 Societies: Goa Bagayatdar 21 23.33 140 Direct
6 Adarsh Co-operative society 49 54.44 140 Direct
50
Table - 19: Price spread in marketing of Cashewnut in Goa
Particulars Channel – I Channel –
II
Channel –
III
Channel
– IV
Channel
– IV
I Producers
Price received 140 141 142 144 151
Marketing costs 1.88 1.88 1.88 1.88 1.88
Cost of cultivation 48.15 48.15 48.15 48.15 48.15
Net price received 140 140 140 140 140
II Village merchants
Purchase price 140
Costs 0.4
Margins 1.6
Sale price 142
III Wholesalers
Purchase price 142 141
Costs 0.5 0.5
Margins 1.5 1.5
Sale price 144 144
III Cooperative societies
Purchase price 144 144
Costs 0.5 0.55
Margins 3.5 5.45
Sale price 148 150
III GSAMB traders
Purchase price 142
Costs 0.5
Margins 2.5
Sale price 145
III Processors
Purchase price 144 148 145 150 151
Costs of processing 32 32 32 32 32
Margins 31.5 27.5 30.5 25.5 24.5
Sale price 207.5 207.5 207.5 207.5 207.5
III Wholesalers
Purchase price 207.5 207.5 207.5 207.5 207.5
Costs 21.25 21.25 21.25 21.25 21.25
Margins 15 15 15 15 15
Sale price 243.75 243.75 243.75 243.75 243.75
IV Retailers
Purchase price 243.75 243.75 243.75 243.75 243.75
Costs 31 31 31 31 31
Margins 45.25 45.25 45.25 45.25 45.25
Sale price 320 320 320 320 320
Price spread 180 179 178 176 169
Net Producer’s
share in consumer’s price 77.78 78.77 79.78 81.82 89.35

51
Channel-I
Producer-village traders-raw Cashewnut wholesalers-processors-cashew wholesalers-retailers-
consumers
Channel-II
Producer- raw cashew nut wholesalers-Cooperative societies-processors- cashew wholesalers-
retailers-consumers
Channel-III
Producer-GSAMB traders-processors-cashew wholesalers-retailers-consumers
Channel-IV
Producer- Cooperative societies-processors- cashew wholesalers-retailers-consumers
Channel-V
Producer-processors- cashew wholesalers-retailers-consumers

52