Analysis of Atmospheric Discharge - Smith & Burgess · Analysis of Atmospheric Discharge ....
31
Analysis of Atmospheric Discharge Qualitative and Quantitative Safety Screening John Burgess, P.E. | Dustin Smith, P.E.
Transcript of Analysis of Atmospheric Discharge - Smith & Burgess · Analysis of Atmospheric Discharge ....

Analysis of Atmospheric Discharge Qualitative and Quantitative Safety Screening
John Burgess, P.E. | Dustin Smith, P.E.

1. Introduction 2. Qualitative Screening Criteria
I. Non-Flammable / Non Toxic II. Flammable / Combustible III. Toxics
3. Semi-Quantitative Screening Criteria 1. Flammable / Combustible 2. Toxics
4. Quantitative Analysis 1. Flammable / Combustible 2. Toxics
5. Data Sources
Agenda
Analysis of Atmospheric Discharge
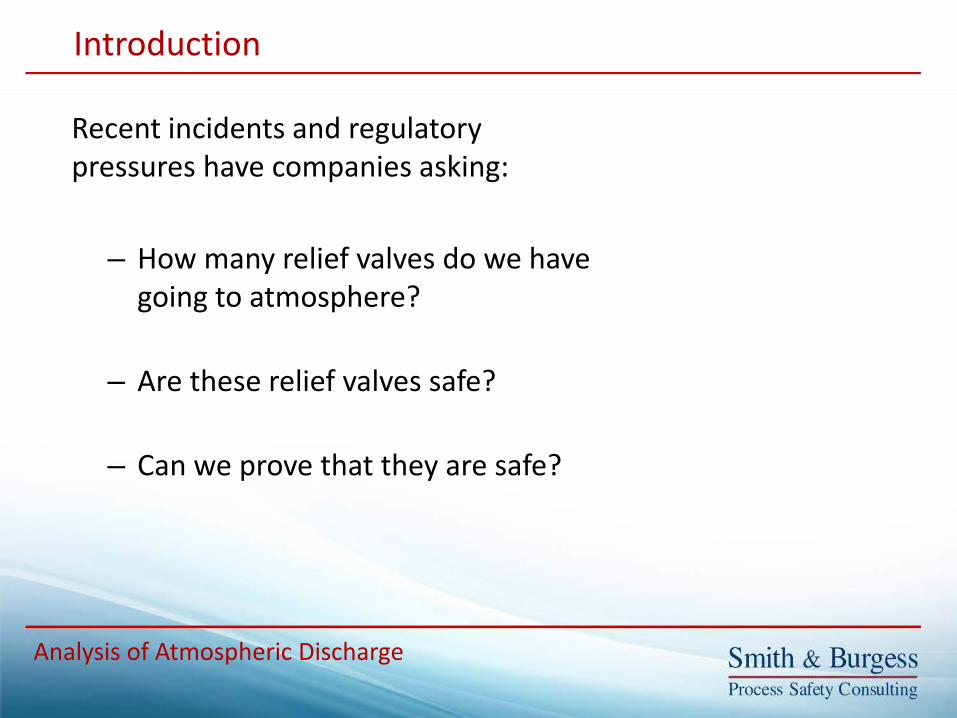
Recent incidents and regulatory pressures have companies asking:
– How many relief valves do we have going to atmosphere?
– Are these relief valves safe?
– Can we prove that they are safe?
Introduction
Analysis of Atmospheric Discharge

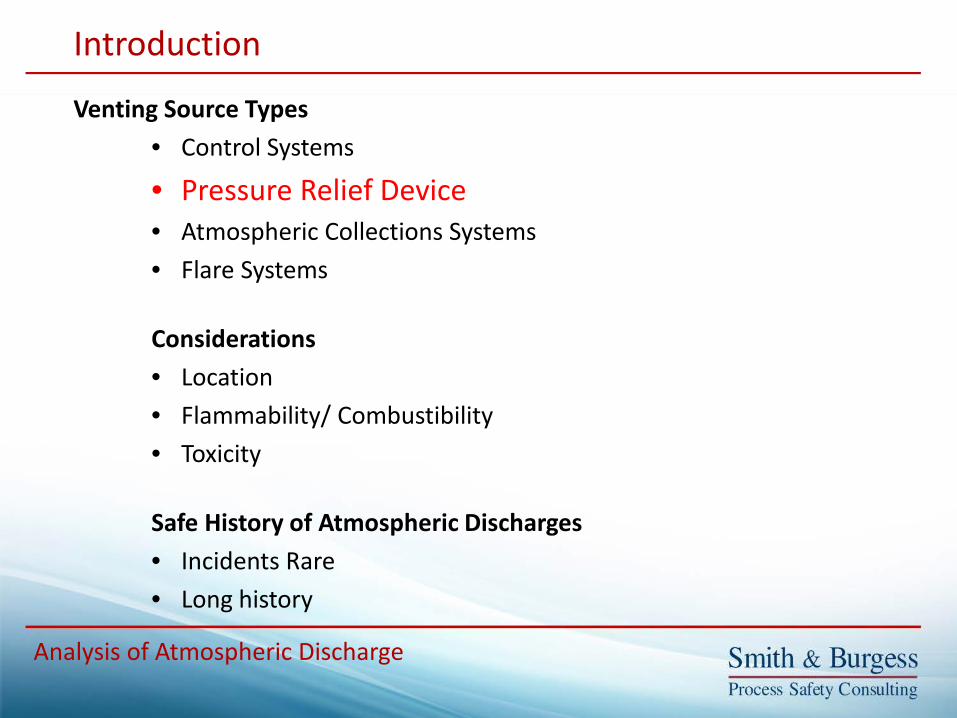
Venting Source Types • Control Systems • Pressure Relief Device • Atmospheric Collections Systems • Flare Systems Considerations • Location • Flammability / Combustibility • Toxicity
Safe History of Atmospheric Discharges • Incidents Rare • Long history
Introduction
Analysis of Atmospheric Discharge
Venting Source Types • Control Systems
• Pressure Relief Device • Atmospheric Collections Systems • Flare Systems
Considerations • Location • Flammability/ Combustibility • Toxicity
Safe History of Atmospheric Discharges • Incidents Rare • Long history
Introduction
Analysis of Atmospheric Discharge
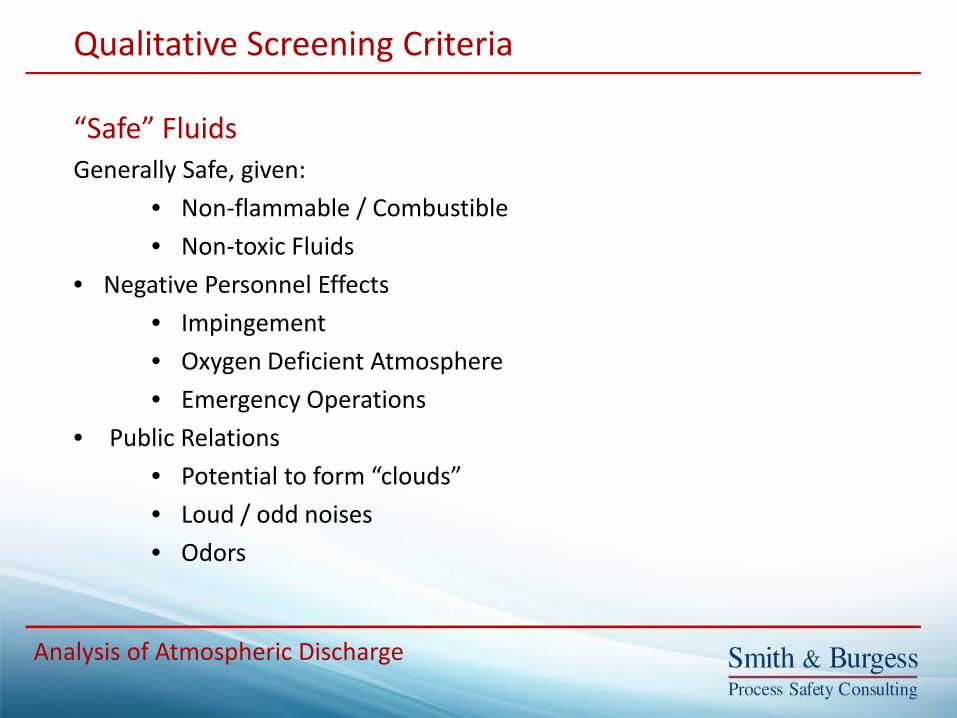
“Safe” Fluids Generally Safe, given:
• Non-flammable / Combustible • Non-toxic Fluids
• Negative Personnel Effects • Impingement • Oxygen Deficient Atmosphere • Emergency Operations
• Public Relations • Potential to form “clouds” • Loud / odd noises • Odors
Qualitative Screening Criteria
Analysis of Atmospheric Discharge

Flammable and/or Combustible Fluids (Toxic) These require more engineering review. Consider the following:
Vapor Releases
• UFL Flammable LFL • Ignition Sources • Safety Factor
• 2x (50% LFL Existing) • 10x (10% LFL New)
Liquid / Solid Releases • Eliminate Scenario Credibility (SIS) • Contain Liquids / Vent only Vapors
Qualitative Screening Criteria
© sxc. Image by G Fordham
Analysis of Atmospheric Discharge
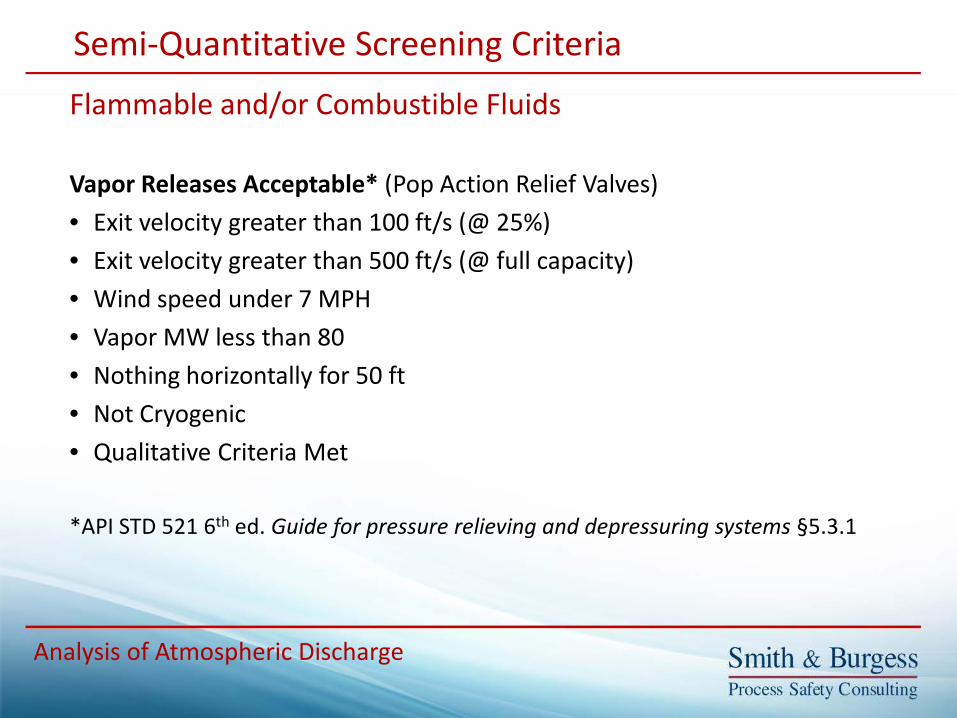
Flammable and/or Combustible Fluids Vapor Releases Acceptable* (Pop Action Relief Valves) • Exit velocity greater than 100 ft/s (@ 25%) • Exit velocity greater than 500 ft/s (@ full capacity) • Wind speed under 7 MPH • Vapor MW less than 80 • Nothing horizontally for 50 ft • Not Cryogenic • Qualitative Criteria Met
*API STD 521 6th ed. Guide for pressure relieving and depressuring systems §5.3.1
Semi-Quantitative Screening Criteria
Analysis of Atmospheric Discharge

Scenario
Valve Capacity (lb/hr)
Exit Velocity
(ft/s)
Jet / Wind Ratio
Jet > 100 ft/s
Acceptable
Rate Capacity 83,554 460 94 Yes Yes Blocked Outlet Required Rate 41,862 230 47 Yes Yes 75% of the Rated Capacity 62,665 345 70 Yes Yes 50% of the Rated Capacity 41,777 230 47 Yes Yes 25% of the Rated Capacity 20,888 115 23 Yes Yes 10% of the Rated Capacity* 8,355 46 9 No No
Semi-Quantitative Screening Criteria
Analysis of Atmospheric Discharge
Flammable and/or Combustible Fluids
Vapor Releases Example* • API STD 521 Criteria • 6Q8 Relief Device, Y-Grade Fluid

Toxic Fluids If Vapor Releases Acceptable*
• Hydrocarbon dilutes from 100% 3% • Per API, Jet effects result in a 30x to 50x Dilution • Toxic Concentrations Limits Lower
• 50 ppm IDLH for H2S (29 CFR 1910.1000 TABLE Z-2 ) • 50 ppm IDLH for Benzene (29 CFR 1910.1000 TABLE Z-2 )
*API STD 521 6th ed. Guide for pressure relieving and depressuring systems §5.3.1
Semi-Quantitative Screening Criteria
Analysis of Atmospheric Discharge
>
30Effluent
Limit
CC

Flammable and/or Combustible Fluids
Quantitative Analysis
Analysis of Atmospheric Discharge
Below LFL
Vertically120 pipe ɸ
to centerlineAbove UFL
Between UFL and LFL
Vapor Releases Acceptable* • API STD 521 §5.8.1 • Worst case wind speed • Minimal temperature
affects • the bottom of cloud may
be 1/6 to 1/3 the “height” below the centerline
*from API STD 521 6th ed. Guide for pressure relieving and depressuring systems
( ) EffVent MWd67.0

Flammable and/or Combustible Fluids
Quantitative Analysis
Analysis of Atmospheric Discharge
Origin of horizontal Equation* • API STD 521 §5.8.1 • Curve Fit Figure 16, results • Assume a perfect Gas
Simplified Assuming • Release T between 70 °F and 600 °F • Maximum vent velocity is near atmospheric pressure • Downwind concentration of interest is ~3% (the LFL)
*from API STD 521 6th ed. Guide for pressure relieving and depressuring systems
( ) EffVent MWdx 67.0=

Flammable and/or Combustible Fluids
Quantitative Analysis
Analysis of Atmospheric Discharge
*from API STD 521 6th ed. Guide for pressure relieving and depressuring systems: §5.8.1
Downwind distance (ft) for Release Streams (MWj)
16 30 44 58 72 86 100 114 128 142
Pipe
Dia
met
er
(dj)
2 5 7 9 10 11 13 14 14 15 16 3 8 11 14 16 17 19 21 22 23 24 4 11 15 18 21 23 25 27 29 31 32 6 16 22 27 31 34 38 41 43 46 48 8 22 30 36 41 46 50 54 58 61 64
10 27 37 45 51 57 63 68 72 76 80
MWd67.0

Phast Dispersion Modeling
Quantitative Analysis
Dispersion Model Details Ethane 0°F & 50 psig 4M6, 25% Capacity Pasquill Stability D Wind speed 3.4 MPH (1.5 M/S)

Dispersion Modeling (Using Phast v6.7)
Quantitative Analysis
Analysis of Atmospheric Discharge
*The Temperature for Saturated Vapor at 250 psig Weather Conditions • Pasquill Stability D, Wind speeds 2.4, 3.4, 6.8 and 10 mph) • Pasquill Stability F, Wind speeds 2.4, 3.4, 6.8 and 10 mph)
2½ G 3 Release to 50% LFL
Downwind Distance (ft)
Ethane Pentane Octane API §5.8.1 to “Safe”, 100% LFL 14 17 22 50#, Cold, 25% / 100% 18¹ / 14 23² / 18 22 / 20 50#, Hot, 25% / 100% 16 / 13 17 / 14 17 / 16 250#, Cold, 25% / 100% 14 / 10 16 / 10 17 / 12 250#, Hot, 25% / 100% 13 / 9 14 / 10 16 / 11
Cold Temp (°F) 0* 200* 375* Hot Temp (°F) 100 400 600

Dispersion Modeling (Using Phast v6.7)
Quantitative Analysis
Analysis of Atmospheric Discharge
2½ G 3 C2 @ 0°F
25% Capacity Release to % of LFL Downwind Distance (ft)
100% (0.029)
75% (0.02175)
66% (0.01914)
50% (0.0145)
API §5.8.1 to “Safe”, 100% LFL 14 14 14 14 Stability F, 10 MPH Wind 8 11 13 17 Stability D, 10 MPH Wind 8 11 13 18
Stability F, 6.8 MPH Wind 8 11 13 17
Stability D, 6.8 MPH Wind 8 11 13 18
Stability F, 3.4 MPH Wind 7 10 12 16
Stability D, 3.4 MPH Wind 7 10 12 17
Stability F, 2.4 MPH Wind 6 10 11 17
Stability D, 2.4 MPH Wind 6 9 11 17

Dispersion Modeling (Using Phast v6.7)
Quantitative Analysis
Analysis of Atmospheric Discharge
2½ G 3 C5 @ 200°F
25% Capacity Release to % of LFL Downwind Distance (ft)
100% (0.013)
75% (0.00975)
66% (0.00858)
50% (0.0065)
API §5.8.1 to “Safe”, 100% LFL 17 17 17 17 Stability F, 10 MPH Wind 10 14 16 21 Stability D, 10 MPH Wind 10 14 16 22
Stability F, 6.8 MPH Wind 10 14 16 21
Stability D, 6.8 MPH Wind 10 14 16 22
Stability F, 3.4 MPH Wind 9 13 14 21
Stability D, 3.4 MPH Wind 9 13 14 22
Stability F, 2.4 MPH Wind 8 13 14 22
Stability D, 2.4 MPH Wind 8 13 14 23

Dispersion Modeling (Using Phast v6.7)
Quantitative Analysis
Analysis of Atmospheric Discharge
*The Temperature for Saturated Vapor at 250 psig Weather Conditions • Pasquill Stability D, Wind speeds 2.4, 3.4, 6.8 and 10 mph) • Pasquill Stability F, Wind speeds 2.4, 3.4, 6.8 and 10 mph)
4 M 6 Release to 50% LFL
Downwind Distance (ft)
Ethane Pentane Octane API §5.8.1 to “Safe”, 100% LFL 27 34 43 50#, Cold, 25% / 100%, 12 / 24 16 / 30 18 / 33 50#, Hot, 25% / 100% 11 / 10 13 / 11 15 / 13
250#, Cold, 25% / 100% 11/ 19 12 / 22 13 / 25 250#, Hot, 25% / 100% 10 / 17 11 / 20 13 / 23
Cold Temp (°F) 0* 200* 375* Hot Temp (°F) 100 400 600

Dispersion Modeling (Using Phast v6.7)
Quantitative Analysis
Analysis of Atmospheric Discharge
*The Temperature for Saturated Vapor at 250 psig Weather Conditions • Pasquill Stability D, Wind speeds 2.4, 3.4, 6.8 and 10 mph) • Pasquill Stability F, Wind speeds 2.4, 3.4, 6.8 and 10 mph)
6 Q 8 Release to 50% LFL
Downwind Distance (ft)
Ethane Pentane Octane API §5.8.1 to “Safe”, 100% LFL 36 46 58 50#, Cold, 25% / 100% 37 / 37 46 / 31 47 / 36 50#, Hot, 25% / 100% 31 / 24 34 / 26 36 / 29
250#, Cold, 25% / 100% 27/ 35 26 / 38 30 / 43 250#, Hot, 25% / 100% 25 / 30 27 / 35 28 / 41
Cold Temp (°F) 0* 200* 375* Hot Temp (°F) 100 400 600
Flammable and/or Combustible Fluids
Quantitative Analysis
Analysis of Atmospheric Discharge
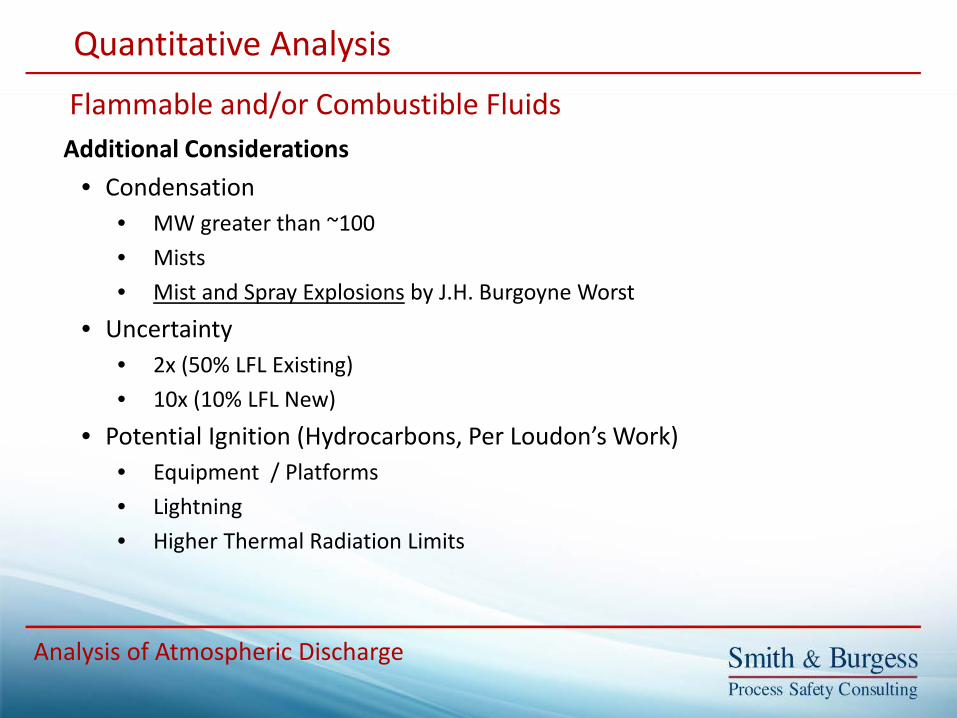
Additional Considerations • Condensation
• MW greater than ~100 • Mists • Mist and Spray Explosions by J.H. Burgoyne Worst
• Uncertainty • 2x (50% LFL Existing) • 10x (10% LFL New)
• Potential Ignition (Hydrocarbons, Per Loudon’s Work) • Equipment / Platforms • Lightning • Higher Thermal Radiation Limits
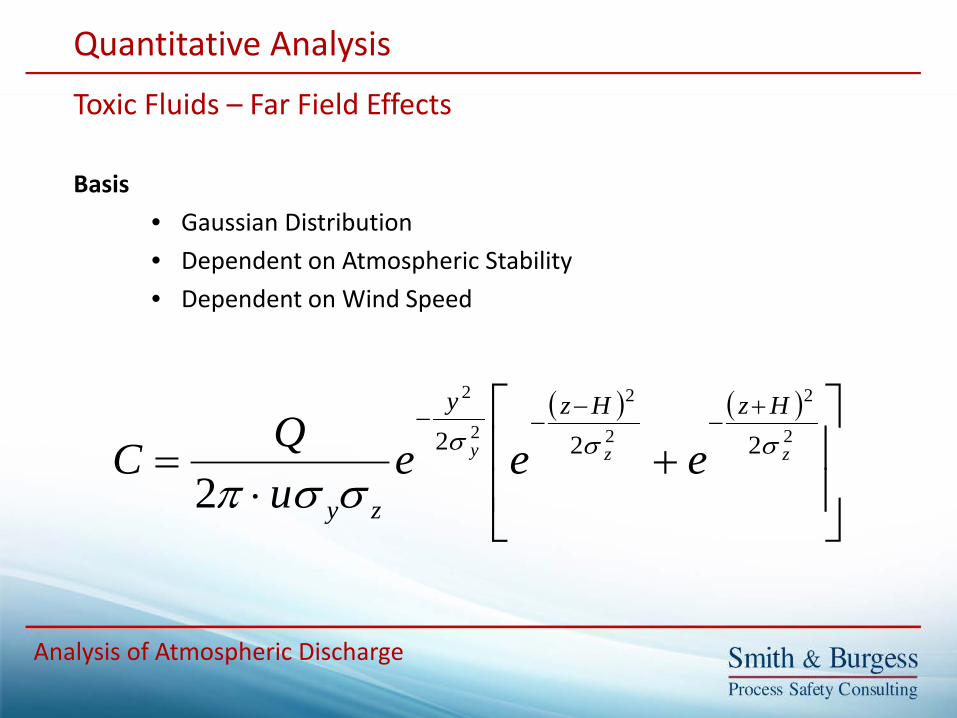
Toxic Fluids – Far Field Effects Basis
• Gaussian Distribution • Dependent on Atmospheric Stability • Dependent on Wind Speed
Quantitative Analysis
Analysis of Atmospheric Discharge
( ) ( )
+
⋅=
+−
−−−
2
2
2
2
2
2
222
2zzy
HzHzy
zy
eeeuQC σσσ
σσπ

Toxic Fluids – Far Field Effects
Gaussian Distribution, Relative cloud widths for Standard Deviation of 12 Right and 25 Left
Quantitative Analysis
Analysis of Atmospheric Discharge
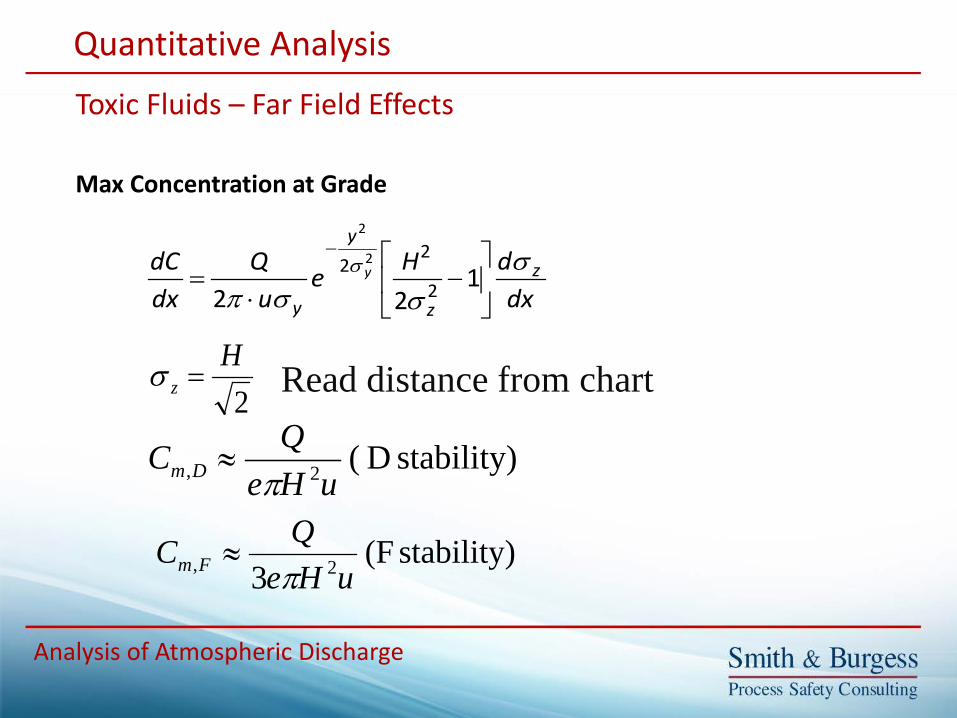
Toxic Fluids – Far Field Effects Max Concentration at Grade
Quantitative Analysis
Analysis of Atmospheric Discharge
dxdHe
uQ
dxdC z
z
y
y
y σσσπ
σ
−
⋅=
−
122 2
22 2
2
2H
z =σ
stability) D (2, uHeQC Dm π
≈
stability) (F3 2, uHe
QC Fm π≈
Read distance from chart
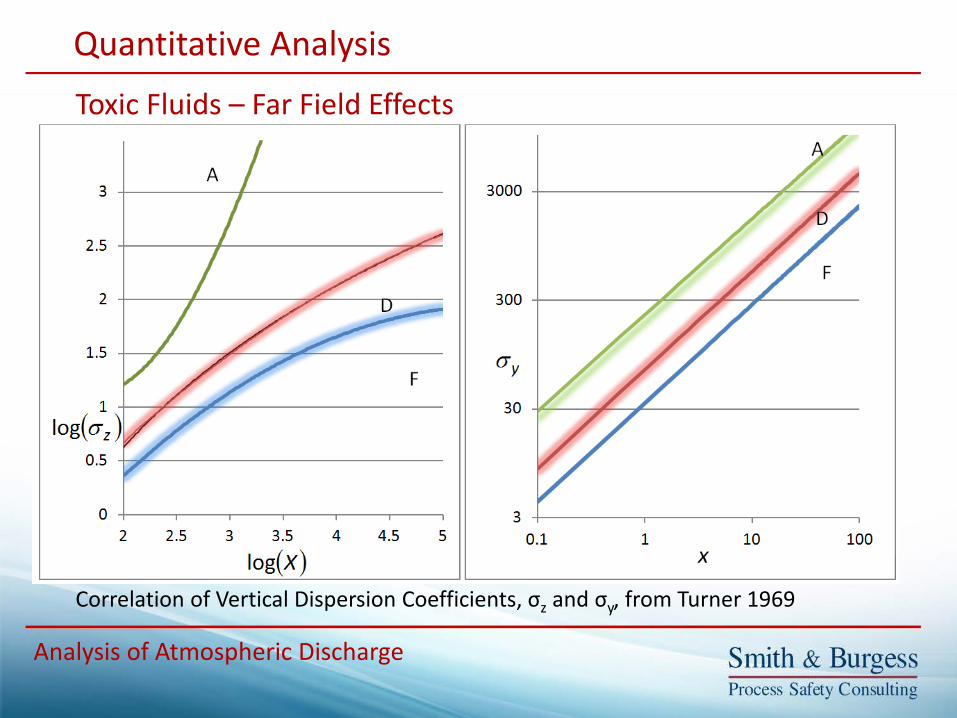
Toxic Fluids – Far Field Effects
Correlation of Vertical Dispersion Coefficients, σz and σy, from Turner 1969
Quantitative Analysis
Analysis of Atmospheric Discharge

Toxic Fluids – Far Field Effects Max Concentration at Grade
Quantitative Analysis
Analysis of Atmospheric Discharge
H, effective height (ft)
Stability D Cmax
Distance (ft) Stability F Cmax
Distance (ft) 50 840 2,244 75 1,384 4,167
100 2,001 6,771 125 2,688 10,222 150 3,443 14,745 200 5,159 28,366

Toxic Fluids – Far Field Effects
Concentrations Profiles at Grade for Two Different Elevation Releases, 50 ft and 100 ft
Quantitative Analysis
Analysis of Atmospheric Discharge

Model Data Summary of RAWS Weather / Climate Data
Quantitative Analysis
Analysis of Atmospheric Discharge
Wind Speed (% Less than listed) %Greater Location 1 MPH 2 MPH 4 MPH 7 MPH 13 mph California, LA Area 0.9 11.8 45.7 77.9 11.7 California, SF Bay Area 16 19.7 29.8 49 12.4 Illinois, Near Chicago 2.6 6.6 21.4 51.1 12.4 Louisiana, Coastal 2.6 3.9 11.4 35.7 17.3 New Jersey, Coastal 5.6 10.9 32.1 66.7 2.8 Ohio Valley 9.5 19.5 60.2 91.9 0.3 Pennsylvania, Philadelphia 35.5 56.7 89.7 99.2 -- Texas, Near Houston (Coastal) 21.7 25.7 39.6 63.4 8.8 Texas, Near Houston (Inland) 3.8 5 15.6 48.1 14.7 Texas, Panhandle 2.0 5.0 18 46.8 18 Utah, Near CO/WY Boarder 21.5 27.8 40.8 57.8 14.3 Washington, Puget Sound Area 74.7 82.7 92.6 98.1 -- West Virginia 4.3 9.3 41.2 75 3.3

Model Data Descriptions of the Pasquill-Gifford Stability Classes
Quantitative Analysis
Analysis of Atmospheric Discharge
Conditions Pasquill-Gifford Stability Class
A B C D E F Pasquill-Gifford Stability Class
Very Unstable
Unstable Slightly
Unstable Neutral
Slightly Stable
Moderately Stable
Day / Night Day Day Day Either Night Night
Winds Relative Low More Most Most More Low
Winds (mph) < 4.5 < 4.5 to 11 4.5 to 13.4+
7 to 13.4+ 4.5 to 11 < 4.5 to 6.5
Cloud Cover No Clouds Few
Clouds Less
Cloudy Cloudy Less Cloudy Few Clouds
Radiation Very
Sunny Sunny
Slightly Sunny
Minimal Night time Night time
Turbulent Mixing
Most More Some Less Little Minimal

Model Data Sources of Exposure Concentrations from Various Agencies
Quantitative Analysis
Analysis of Atmospheric Discharge
Org Guidance Target EPA AEGL Public Exposure AIHA ERPG Public Exposure NIOSH REL & IDLH Worker Exposure OSHA PEL Worker Exposure ACGIH TLV Worker Exposure DOE - SCAPA TEEL DOE workers and public HSE SLOT & SLOD Public Exposure

1. Frank, Michael V. Choosing Safety: A Guide to Using Probabilistic Risk Assessment and Decision Analysis in Complex, High-consequence Systems. Washington, DC: Resources for the Future, 2008. Print.
2. Loudon, D. E. "Requirements for Safe Discharge of Hydrocarbons to Atmosphere." 28th Midyear Meeting of the American Petroleum Institute’s Division of Refining. Pennsylvania, Philadelphia. 15 May 1963. Speech.
3. Centers for Disease Control and Prevention. Centers for Disease Control and Prevention, n.d. Web. 04 Oct. 2013.
4. Turner, D. Bruce. Workbook of Atmospheric Dispersion Estimates. N.p.: US Department of Health, Education, and Welfare, 1970. Print.
5. Weber, A. H. "Atmospheric Dispersion Parameters in Gaussian Plume Modeling." US Environmental Protection Agency (1976): n. pag. Print.
6. DeVaull, George E., John A. King, Ronald J. Lantzy, and David J. Fontaine. Understanding Atmospheric Dispersion of Accidental Releases. New York: American Institute of Chemical Engineers, 1995. Print.
7. API Standard 521, “Pressure-relieving and Depressuring Systems,” American Petroleum Institute, 5th ed., 2008.
Sources

713.802.2647
Principal Consultant: [email protected] Business Development: [email protected]
www.smithburgess.com