
Analysis of aluminium based alloys by - Welcome to ePrints Soton
36
Analysis of aluminium based alloys by calorimetry: quantitative analysis of reactions and reaction kinetics M. J. Starink* Differential scanning calorimetry (DSC) and isothermal calorimetry have been applied extensively to the analysis of light metals, especially Al based alloys. Isothermal calorimetry and differential scanning calorimetry are used for analysis of solid state reactions, such as precipitation, homogenisation, devitrivication and recrystallisation; and solid–liquid reactions, such as incipient melting and solidification, are studied by differential scanning calorimetry. In producing repeatable calorimetry data on Al alloys, sample preparation, reproducibility and baseline drift need to be considered in detail. Calorimetry can be used effectively to study the different solid state reactions and solid–liquid reactions that occur during the main processing steps of Al based alloys (solidification, homogenisation, precipitation). Also, devitrivication of amorphous and ultrafine grained Al based powders and flakes can be studied effectively. Quantitative analysis of the kinetics of reactions is assessed through reviewing the interrelation between activation energy analysis methods, equivalent time approaches, impingement parameter approaches, mean field models for precipitation, the Johnson–Mehl–Avrami–Kolmogorov model, as well as novel models which have not yet found application in calorimetry. Differential scanning calorimetry has occasionally been used in attempts to measure the volume fractions of phases present in Al based alloys, and attempts at determining volume fractions of intermetallic phases in commercial alloys and amounts of devitrified phase in glasses are reviewed. The requirements for the validity of these quantitative applications are also reviewed. Keywords: Differential scanning calorimetry, Precipitation, Aluminium, Modelling, Transformation IMR/419 Introduction Calorimetry is an analysis technique that is part of a group of techniques collectively known as thermal analysis methods. In its broadest sense, thermal analysis refers to the measurement of changes in properties of substances under a controlled temperature program. Thermal analysis techniques can be classified according to the type of temperature program that the sample is subjected to and the measured (output) signal. The most commonly used temperature programs are either iso- thermal hold or heating (scanning) at constant rate, while more recently, temperature modulated scanning and reaction controlled heating have also found application. The signals measured in thermal analysis can include heat flows, temperature changes, mass, evolved gasses, length changes, elastic modulus, and many other properties that characterise properties or reactions of interest. Calorimetry refers to thermal analysis methods that measure the heat evolution from a sample under a controlled temperature program. The two most often applied calorimetry techniques are isothermal calorimetry and differential scanning calorimetry (DSC), which, as the name suggests, is by definition non-isothermal (i.e. a temperature scan). Apart from the more common applications to polymers, glasses and pharmaceuticals, calorimetry has also been applied extensively to the analysis of light metals; especially Al based alloys, but also Ti and Mg based alloys. For light metals for structural applications, DSC is used mostly for analysis of solid–solid reactions, including precipitation, dissolution and recrystallisation, for determining temperatures of incipient melting, and for solidification studies. The present paper presents a review of the techniques and analysis methods of isothermal calorimetry and DSC that are relevant to the study of Al based alloys. The aim is to bring together and critically review the published work that is of direct use to researchers working in the field of calorimetry of light metals. The focus is mostly on work published in the past 10 years. Aluminium based alloys studied by calorimetry can broadly be divided into three groups. The most often *Materials Research Group, School of Engineering Sciences, University of Southampton, Southampton S017 1BJ, email [email protected] ß 2004 IoM Communications Ltd and ASM International Published by Maney for the Institute of Materials, Minerals and Mining and ASM International DOI 10.1179/095066004225010532 International Materials Reviews 2004 VOL 49 NO 3–4 191
Transcript of Analysis of aluminium based alloys by - Welcome to ePrints Soton
Analysis of aluminium based alloys bycalorimetry quantitative analysis of reactionsand reaction kinetics
M J Starink
Differential scanning calorimetry (DSC) and isothermal calorimetry have been applied extensively
to the analysis of light metals especially Al based alloys Isothermal calorimetry and differential
scanning calorimetry are used for analysis of solid state reactions such as precipitation
homogenisation devitrivication and recrystallisation and solidndashliquid reactions such as incipient
melting and solidification are studied by differential scanning calorimetry In producing
repeatable calorimetry data on Al alloys sample preparation reproducibility and baseline drift
need to be considered in detail Calorimetry can be used effectively to study the different solid
state reactions and solidndashliquid reactions that occur during the main processing steps of Al based
alloys (solidification homogenisation precipitation) Also devitrivication of amorphous and
ultrafine grained Al based powders and flakes can be studied effectively Quantitative analysis of
the kinetics of reactions is assessed through reviewing the interrelation between activation energy
analysis methods equivalent time approaches impingement parameter approaches mean field
models for precipitation the JohnsonndashMehlndashAvramindashKolmogorov model as well as novel models
which have not yet found application in calorimetry Differential scanning calorimetry has
occasionally been used in attempts to measure the volume fractions of phases present in Al
based alloys and attempts at determining volume fractions of intermetallic phases in commercial
alloys and amounts of devitrified phase in glasses are reviewed The requirements for the validity
of these quantitative applications are also reviewed
Keywords Differential scanning calorimetry Precipitation Aluminium Modelling Transformation IMR419
IntroductionCalorimetry is an analysis technique that is part ofa group of techniques collectively known as thermalanalysis methods In its broadest sense thermal analysisrefers to the measurement of changes in propertiesof substances under a controlled temperature programThermal analysis techniques can be classified accordingto the type of temperature program that the sample issubjected to and the measured (output) signal The mostcommonly used temperature programs are either iso-thermal hold or heating (scanning) at constant ratewhile more recently temperature modulated scanningand reaction controlled heating have also foundapplication The signals measured in thermal analysiscan include heat flows temperature changes massevolved gasses length changes elastic modulus andmany other properties that characterise properties orreactions of interest Calorimetry refers to thermalanalysis methods that measure the heat evolution
from a sample under a controlled temperature programThe two most often applied calorimetry techniquesare isothermal calorimetry and differential scanningcalorimetry (DSC) which as the name suggests is bydefinition non-isothermal (ie a temperature scan)
Apart from the more common applications topolymers glasses and pharmaceuticals calorimetry hasalso been applied extensively to the analysis of lightmetals especially Al based alloys but also Ti and Mgbased alloys For light metals for structural applicationsDSC is used mostly for analysis of solidndashsolid reactionsincluding precipitation dissolution and recrystallisationfor determining temperatures of incipient melting andfor solidification studies The present paper presentsa review of the techniques and analysis methods ofisothermal calorimetry and DSC that are relevant to thestudy of Al based alloys The aim is to bring togetherand critically review the published work that is of directuse to researchers working in the field of calorimetry oflight metals The focus is mostly on work published inthe past 10 years
Aluminium based alloys studied by calorimetry canbroadly be divided into three groups The most often
Materials Research Group School of Engineering Sciences University ofSouthampton Southampton S017 1BJ email mjstarinksotonacuk
2004 IoM Communications Ltd and ASM InternationalPublished by Maney for the Institute of Materials Minerals and Miningand ASM InternationalDOI 101179095066004225010532 International Materials Reviews 2004 VOL 49 NO 3ndash4 191
studied group of alloys are commercial wrought andcast alloys and alloys that are related to these egexperimental alloys designed to be used as commercialwrought and cast alloys variants and high purityversions or model alloys The calorimetry studies onthese alloys generally focus on the analysis of theprocessing steps involved solidification homogenisa-tion solution treatments and aging A second group ofalloys studied by calorimetry involves Al based alloyscontaining transition metals and rare earth elements thatare candidates for the development of ultrafine grained(nanostructured) materials which can possess enhancedproperties1 The achievement of such a microstructuredepends on the processing conditions and may beachieved by the formation of an amorphous structurethrough rapid solidification (typical cooling rate105 K s21) high energy ball milling or wire electricalexplosion2 followed by controlled heat treatment Incalorimetry work on this second group of Al basedalloys the structural relaxation (devitrivication recov-ery (re-)crystallisation) is often the main objective ofthe study A third group of alloys concerns alloys thathave no commercial or potential commercial applica-tion and which are studied as part of theoretical work toestablish thermodynamic properties which can be usedin verification of the predicted phase diagrams and areassessed and predicted using approaches collectivelytermed CALPHAD (CALculation of PHase Diagrams)In the present work the focus is on studies that arerelevant for the first two groups of materials
Judging from the number of publications applyingthermal analysis techniques DSC is probably the mostpopular of all such techniques Differential scanningcalorimetry is applied to a wide range of materials andsubstances with applications in the field of chemistryaccounting for the majority of research output Thereasons for this popularity are related to speed con-venience accuracy and versatility (see lsquoExperimentalaspects of calorimetryrsquo below) The advantages of non-isothermal calorimetry experiments are well known butthese temperature scanning methods have their ownparticular drawbacks and associated difficulties On theexperimental side temperature inhomogeneities in theapparatus or in the sample can upset the controlledsample conditions aimed for Further analysis of non-isothermal experiments is generally more complicatedthan isothermal experiments particularly because thechanging temperature will influence reaction rates and itcan do this in a complex manner This added complexityhas in the past made several researchers adopt a verycautious and often dismissive attitude towards theanalysis of thermally activated reactions using non-isothermal methods3 However after more than fourdecades of research into the analysis of non-isothermalthermal analysis methods a vast amount knowledge hasbeen gathered and it has become increasingly clear thatlinear heating rate experiments such as DSC can beanalysed to reliably characterise many details of reac-tions The latter positive assessment is true under theproviso that appropriate and verified analysis techniquesare applied to DSC data This however can be adaunting task as the amount of publications on thetheory of analysis of thermal analysis data and linearheating rate experiments in particular is vast and verydiverse in nature Hence the present paper aims to bring
together and critically review the published work thatis important for researchers working in the field ofcalorimetry of Al based alloys
The paper is divided into sections as follows
N the experimental aspects of thermal analysis includ-ing equipment and sample preparation
N the different materials properties and reactions thatcan be measured with calorimetry referring especiallyto Al based alloys
N the analysis and modelling methods for thermallyactivated reactions
N the quantitative analysis of volume fractions ofprecipitates intermetallics and other phases
Throughout the review the literature most relevant tothe aims of the analysis will be discussed For practicalreasons examples will mostly be drawn from theauthorrsquos own work
Experimental aspects of calorimetry
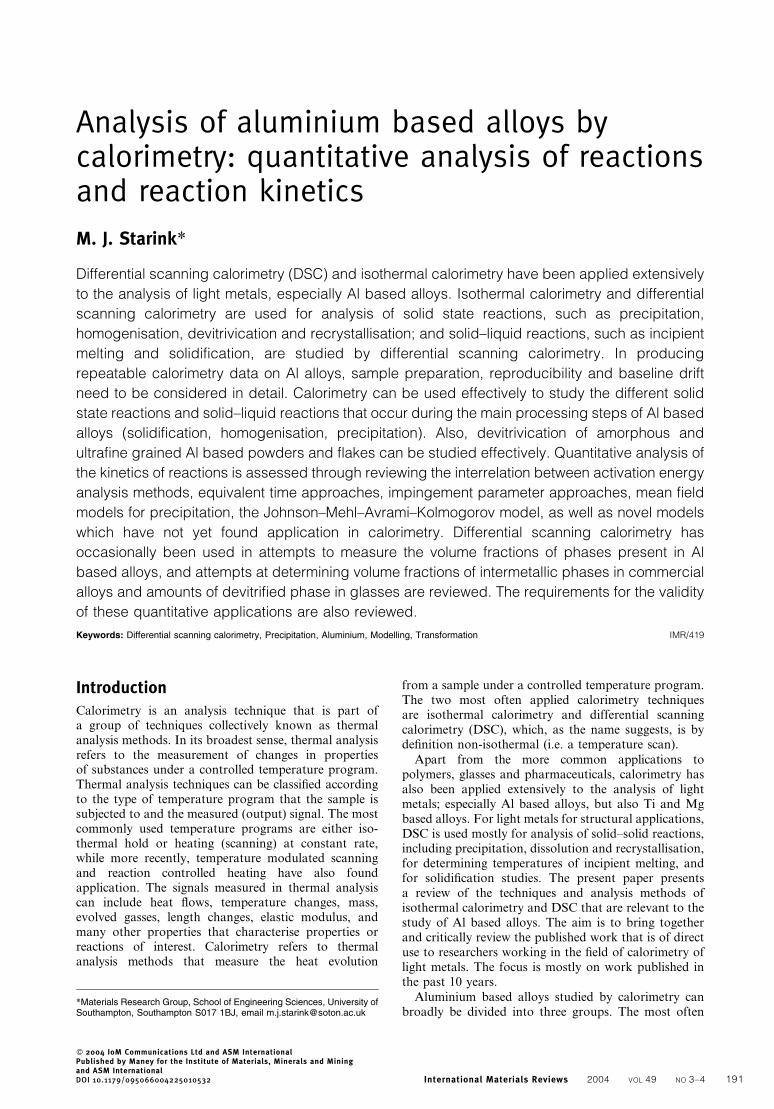
Experimental aspects of isothermal calorimetricanalysisIsothermal calorimetry can be performed with twotypes of instruments differential isothermal calorimetry(DIC) uses the differential signal between a sample andreference while standard isothermal calorimetry mea-sures the signal straight from the sample without using areference As many reactions in Al based alloys causerelatively small heat flows the higher sensitivity ofdifferential isothermal calorimetry is often neededDifferential isothermal calorimetry can be carried outeither with a standard power compensation differentialscanning calorimeter (DSC) used in the isothermal modeor in a much larger calorimeter generally referred to asthe TianndashCalvet microcalorimeter (TCM) (Fig 1) Thehigh sensitivity of the latter type of apparatus is relatedto the use of a sample and a reference symmetricallypositioned within a large volume of thermal mass which
1 Schematic cross-section of TianndashCalvet type micro-
calorimeter (figure supplied by SETARAM Caluire
France)
Starink Analysis of Al based alloys by calorimetry
192 International Materials Reviews 2004 VOL 49 NO 3ndash4
is isolated from external (thermal) disturbances4 Heatexchange of sample and reference are measured by heatflux transducers consisting of several hundreds ofthermocouples which line the surface of the sampleholder45 In such an arrangement heat flows as small as01 mW can be detected The large thermal mass of theequipment also has a drawback as it is responsible for asubstantial thermal lag This means that on introductionof a sample into the isothermal calorimeter the heatflows in the calorimeter are disturbed during whichno reproducible measurement of heat flow is possibleDepending on type of calorimeter and mass of sampleand calorimeter this time lag varies and can be up to05 h for a TianndashCalvet type calorimeter In isothermalcalorimetry using the power compensation DSC thetotal thermal mass of the equipment is smaller and hencethe time of instability is shorter in the order of 1 min
As an example of the results that can be obtained withisothermal calorimetry analysis of Al based alloys inFig 2 isothermal calorimetry curves obtained with aTianndashCalvet microcalorimeter on quenched samples ofan AlndashSi alloy are presented
Experimental aspects of differential scanningcalorimetryBoth differential thermal analysis (DTA) and differen-tial scanning calorimetry (DSC) are concerned with themeasurement of heat evolved from a substance duringheating (or in some cases cooling) The word lsquodiffer-entialrsquo emphasises that measurements involve thedetermination of the relative behaviour of a substanceitself and a reference material The main distinctionbetween DTA and DSC is that in DSC the equipmentcan be calibrated such that the heat evolution from thesample can be measured quantitatively while this isoften not possible for DTA6 Differential scanningcalorimetry (or calibrated DTA) has proven to be avery useful and reproducible technique for the studyof phase transformations and has been widely appliedto study precipitation in Al alloys Besides the basicscientific interest of these studies their underlying aimis to use calorimetry as an effective and rapid tool to
investigate various characteristics of commercial materi-als For example in Al based alloys volume fractions ofprecipitates the melting temperature of specific phasesand the activation energy of reactions can in most casesbe determined by the DSC technique
There are two types of DSC the heat flux DSC andthe power compensation DSC7 the working principlesof the two methods are illustrated in Fig 3 For powercompensation DSC the signal is related to thedifferential heat provided to keep the sample and thereference to the same temperature For heat flux DSCthe signal derives directly from the difference oftemperature between the sample and the reference andin that sense a heat flux DSC is similar to a DTA Forthe heat flux DSC the heat flux measurement has to becalibrated by performing calibration runs with materialsthat display a reaction for which the heat evolution iswell known8 In practice substances such as pure In andpure Zn are often used Thus a heat flux DSC isessentially a DTA instrument that can be calibrated
Sample preparation for calorimetry of lightmetal alloysSample preparation for isothermal calorimetry and DSCstudies of light metal alloys is often a simple process If
2 Isothermal calorimetry curves (normalised with respect
to peak heat flow) of furnace cooled Alndash6Si (at-)
alloy at temperatures 190ndash230uC (thicker lines) with fits
obtained exothermic reactions are due to Si precipita-
tion (from Ref 11)
top heat flux DSC (figure supplied by Mettler-Toledo)
bottom power compensation DSC (figure supplied by
Perkin-Elmer)
3 Schematic cross-section of two types of differential
scanning calorimeter
Starink Analysis of Al based alloys by calorimetry
International Materials Reviews 2004 VOL 49 NO 3ndash4 193
the material to be studied is in the form of powder orribbons eg from rapidly solidification processing asample of the powder or small flakes can be taken and putdirectly in a crucible If bulk material is to be studiedsuitably sized disc-shaped samples can be readily obtainedeither by punching from thin plate or sheet or by cutting(slicing) from machined cylinders In isothermal calori-metry using a TianndashCalvet type instrument the sample iseither a cylinder which nearly fills the cavity in thecalorimeter9 or a batch of 10ndash20 disc-shaped samples withspacers to keep them apart10ndash12 In the latter case thebatch consists of discs having a thickness of about 1 mmand diameter of about 10ndash20 mm this type of sample is tobe preferred if high and homogeneous coolingquenchingrates are needed Sizes are selected such that the samplewill fit the cylindrical cavity lined with thermocouples thatis the sample holder In DSC or DIC using a heatcompensation DSC apparatus total sample mass issmaller and generally a sample consisting of a single discof about 05ndash2 mm thickness and 5ndash8 mm diameter isemployed26 In most calorimetric studies the effects ofsample preparation on the data are not a concern and theease of sample preparation using a range of methods isconsidered as a benefit for the method However it is wellknown that punching grinding machining and cutting allintroduce deformation in Al based alloys and thisinfluences precipitation in most heat treatable Al basedalloys by providing sites for heterogeneous nucleationand by annihilating quenched-in excess vacancies1314
Treatments at relatively high temperatures can causeoxidation or other surface reactions and might cause lossof alloying elements to the atmosphere or to the reactionproducts formed in a surface reaction For calorimetrysamples the thickness of the sample determines to a largeextent the relative importance of the surface reactions andalso surface roughness can play a part If any of theseeffects have a significant influence on reactions occurringduring a calorimetry experiment the sample preparationtechnique will cause variations in the measured data
For Al based alloys precipitation reactions are knownto be particularly sensitive to sample preparation andthe effects of sample preparation have been studied foran 8090 (AlndashLindashCundashMgndashZr) and a 2011 (AlndashCu)alloy15ndash17 For the 2011 (AlndashCu) alloy it was shown15
that for a sample prepared by punching and grindingafter solution treatment the h9 (Al2Cu) precipitationeffect was shifted to lower temperatures as compared toa sample solution treated after punching and grinding
The DSC curves of solution treated 8090 (AlndashLindashCundashMgndashZr) alloys show the precipitation of several phaseswith different precipitation mechanisms operating andhence these alloys are very suitable for study of theinfluence of sample preparation on reactions Forthe 8090 alloy punching and grinding after solutiontreatment appeared to enhance the formation ofsemicoherent S phase precipitates (Al2CuMg)18ndash20 and
d9 (Al3Li) while formation of the structures often termedGuinierndashPrestonndashBagaryatski (GPB) zones appeared tobe very much reduced (see Fig 4) (GuinierndashPreston andGuinierndashPrestonndashBagaryatski zones are structures thatare fully coherent with the matrix and harden the alloybut have a limited stability dissolving at a temperatureabout 200ndash300 K lower than the stable precipitatephases21) The changes in precipitation resulting fromgrinding and punching are generally believed to becaused by the introduction of dislocations in the samplewhich in turn can reduce vacancy concentrations due toannihilation of vacancies on the dislocation Thereduction in GPB zone formation was interpreted asbeing due to a reduced vacancy concentration whichreduces both the stability of the zones and the diffusionrates of Cu and Mg atom migration to the zones Theenhanced S phase formation was interpreted as beingdue to an increased density of dislocations and d9precipitates both of which act as nucleation sites forS phase The enhancement of d9 formation by thepresence of dislocations generated either by grindingand punching after heat treatment or in the case ofan 809020 wt-SiC metal matrix composite (MMC)by misfitting SiC particles is consistent with variousobservations in the literature2223 The mechanisms forthis are not well understood but it was suggested that d9formation occurs via the formation of a short rangeordered (SRO) state and that the presence of this d9precursor in monolithic AlndashLi based alloys retards thesubsequent formation of the d9 phase24
For AlndashLi based alloys Li loss in the surface layers ofsolution treated specimens may be expected to influencethe DSC curves The DSC curves in Fig 5 were obtainedfrom 8090 samples machined before solution heattreatment at 530uC but with varying thickness andsolution treatment time in order to demonstrate theeffect of varying Li depletion The curves are of similarshape with the effects occurring at approximately thesame temperatures However the magnitudes of effectsAndashD appear to decrease in the following order standardthickness (08 mm) and 5 min at 530uC standard
The rod or lath shaped precipitates in AlndashCundashMg alloys which have often(especially up to the mid-1990s) been indicated by S9 are not a separatephase they are a slightly strained semicoherent version of the (incoherent)S phase This is in contrast to precipitation in AlndashCu alloys where the h9has a different crystal structure from the equilibrium h as well as adistinctly lower solvus Several researchers18ndash20 have thus discontinuedthe use of the indication S9 In the present paper the term S9 phase will notbe used instead the indication lsquosemicoherent S phase precipitatesrsquo isused The presence of a possible S99 phase distinct from S9S iscontroversial
4 Differential scanning calorimetry (DSC) curves of solu-
tion treated and cold water quenched (CWQ) 8090 (Alndash
LindashCundashMg) alloy machined before and after solution
heat treatment (SHT) exothermic heat flow on positive
y axis (adapted from Ref 17 in which effect A was
interpreted to be due to GPB zone formation B due to
d9 phase formation C due to dissolution of d9 phase
and zones D is due to Ssemicoherent S phase forma-
tion E is due to S phase dissolution F is due to a
surface reaction)
Starink Analysis of Al based alloys by calorimetry
194 International Materials Reviews 2004 VOL 49 NO 3ndash4
thickness and 30 min at 530uC half thickness and30 min at 530uC The heat content of the d9 forma-tion effect in these specimens decreases with increasingvolume fraction of Li depleted layer indicating that thiseffect can be accounted for by Li loss Interestingly themagnitudes of the GPB zone and S formation effectsalso decrease with increasing Li loss A convincingexplanation for this has proved elusive although it hasbeen noted that the charge in GPB zone heat effectmight be caused by Li being incorporated in GPB zones
In studies of heat treatable solution treated alloysthat are sensitive to quenching rate sample preparationcan further influence calorimetric analysis through thethickness of the specimen influencing the quenchingrates Thus thin samples machined before solutiontreatment will experience a high quenching rate whichcan cause relatively high precipitation rates duringsubsequent thermal analysis If calorimetry samples aremachined from larger blocks of quenched material thelower quenching rates experienced can reduce thesubsequent precipitation rates during thermal analysisprovided the material is substantially quench sensitive inthe quench rate regime considered
Taken together the results indicate that samplepreparation can have a marked influence on precipita-tion effects in the DSC Especially the introduction ofdislocations and the loss of alloying elements duringsolutionising of the samples are by-products of samplepreparation that need to taken into account whendeciding on the means of sample preparation andcomparison and analysis of DSC data
Baseline correction in calorimetryInitial transient
Although modern isothermal calorimeters and DSCs arereliable instruments that can achieve remarkably highaccuracies in measurements of heat evolution noinstrument is perfect and parasitic effects will alwaysoccur In calorimetry parasitic effects are often inducedby disturbances from outside of the measuring cellcausing transients in heat flows within the zones whereheat evolution from the sample and reference aremeasured In the experimental aspects of isothermalcalorimetry section above the transient heat flows thatoccur on introduction of a sample in a TianndashCalvet typemicrocalorimeter and on heating a sample in a powercompensation type DSC in isothermal mode to the test
temperature have already been considered Differentialscanning calorimetry in scanning mode will have aninitial transient period in which measurements areunreliable because in the very first phase of theexperiment the heating rate will accelerate from zeroto the target heating rate During this phase ofaccelerating heating the heat flow is variable (it dependson sample pan and initial equipment temperature) andmeasured heat flows are not suited for analysis Inpractice this initial phase of the experiment which canlast approximately from 20 s to 1 min is generallydisregarded The duration of this transient is dependenton the thermal mass (heat capacity6mass) of the sampleand oven with the larger ovens having a larger transientPower compensation DSCs will in general have a lowerthermal mass in the heated parts as compared to heatflux DSCs (Fig 6) Due to the reduced thermal mass inthe oven section power compensation DSCs have theadvantage of a shorter transient In DSCs with a largerfurnace mass transients of around 1 min can occur andat a heating rate of 100 K min21 this would result in atransient stretching over a range of 100 K Thus thesetransients will limit the heating rate that can be used
Baseline variability and drift
After the initial transient reliable calorimetry measure-ments are possible provided calorimetry baseline andbaseline drift are properly accounted for In DIC curvesbaseline drift results from thermal imbalances betweenthe sample and reference of the calorimeter causingmodest changes in baseline position during the course ofan experiment This drift is mostly negligible for TianndashCalvet type instruments provided the instrument isplaced in a climatised room with stable temperaturebut can become significant for smaller instruments whenvery weak heat evolutions andor experiments ofextremely long duration (many hours) are involvedsuch as precipitation reactions in Al based alloys Somemethods to correct for loss of early time data duringcalorimeter instability and baseline drift have beeninvestigated2526
In analysing linear heating experiments the baselineof the DSC needs to be carefully considered as baselineswill generally be a temperature and time dependent27
The importance of baseline analysis can be illustrated
5 DSC curves of 8090 samples machined prior to solu-
tion treatment and quench with varying thickness and
solution treatment time exothermic heat flow on posi-
tive y axis (adapted from Ref 17)
6 Typical furnaces for heat flux DSC and power compen-
sation DSC (figure supplied by Perkin-Elmer)
Starink Analysis of Al based alloys by calorimetry
International Materials Reviews 2004 VOL 49 NO 3ndash4 195
by plotting DSC curves measured using either inertsubstances as sample and reference or by using nosample at all and repeating these experiments over anextended period (eg several months) This type ofwork was performed by Zahra and Zahra27 for aPerkin-Elmer 1020 series thermal analysis system andsubstantial variations in baseline over the period ofa year were identified Unless the heat flows due toreactions that are to be measured are significantly largerthan the variability in the baseline a correction for thetemperature and time dependence of the baseline needsto be carried out The standard procedure is to performa DSC run with either empty inert pans or an inertsubstance as sample and reference Such a baseline runshould be performed at the heating rate that will be usedfor the actual experiment with a real sample and iscarried out just before or just after the actual experimentwith a real sample In the post-analysis the heat flowmeasured in the baseline run will be subtracted from theheat flow in the experiment on the real sample Therequired frequency of baseline runs will be determinedby the time dependency of the baseline
While the above shows the importance of analysingthe baseline of DSC curves there are many examples ofpublications in which DSC curves are presented withoutproviding an explicit indication of the position of thebaseline Such work is not suitable for a quantitativeanalysis of the heat flows but can provide somequalitative information
Solid state reactions in Al based alloys generally causerelatively small heat effects and thus baseline correctionprocedures are critical and baselines will need to bechecked regularly for these reactions Solidndashliquid andliquidndashsolid reactions on the other hand will generallycause much larger heat flows and baseline correction isless important or can even be omitted
Even though the baseline correction procedure will inmany cases be able to correct for baseline variation thisprocedure is sometimes not sufficient to correct for allspurious effects when very small heat effects are beingstudied
Combined baseline variability and heat capacity effects inDSC
Especially for solid state reactions in Al based alloys theheat effects due to reactions will be of the same order ofmagnitude or smaller than heat effects due to the heatcapacity difference of sample and reference Thus ifthe heat effects due to the solid state reactions are tobe studied a correction for the heat effect due to heatcapacity difference will need to be performed Inprinciple the heat effects due to the heat capacitydifference of sample and reference can be calculated onthe basis of the weights and a weighted average of heatcapacities of the elements part of the alloy In practicehowever this cumbersome procedure is often avoidedand the heat capacity effects are corrected for inconjunction with the baseline variability This is possiblebecause the heat capacity of Al in the solid state is ingood approximation a linear function of the tempera-ture Hence if the baseline of the DSC apparatus is alinear function of the temperature the combined effectof the baseline variability and heat capacity is also alinear function and correction for both contributions tothe DSC signal can be corrected for by subtracting a
linear function If two well-spaced temperatures on theDSC curve where no reactions occur can be identifiedthe linear correction function is readily obtained Unlessa reaction occurs immediately on starting the DSC runone of these points is often readily defined as the pointwhere the DSC first reaches a stable heating rate eg afew tens of degrees beyond the start of heating A secondpoint will need to be taken at the point where a reactionhas completed If baselines are second order polynomialfunctions a similar procedure can be followed but nowthree sections where no reaction occurs will need to beidentified
While a more or less accurate determination of thebaseline is generally possible it should be noted that theprocedures always leave some residual error which canbe negligible or significant in comparison to the effectsthat are measured Uncertainties concerning the positionof the baseline can occur particularly for materialsin which reactions take place over the whole of themeasured DSC curve or materials in which heat effectsdue to reactions are small as compared to baselinevariability
Applications of thermal analysis forAl based alloysUsing DSC a range of materials properties andreactions can be studied In the present section severalof these measurements and materials properties areconsidered focusing especially on applications for Albased alloys
Identification of thermal effectsIn subsequent sections it will be shown that calorimetryis a very valuable and efficient technique to analysea number of reactions that occur in Al based alloysHowever before these applications are consideredattention should first be given to how the reaction thatoccurs during a calorimetry experiment and the phasesinvolved in it can be identified As a calorimetryexperiment in itself cannot identify the phases involvedin the reactions other techniques such as (high resolu-tion) electron microscopy and (electron) diffractionshould be used to identify these phases To identify thephase changes unambiguously one would heat treat asample to a condition that corresponds to the start ofthe thermal effect and a second sample would be heattreated to a condition that corresponds to the end of thethermal effect and preferably further samples would beheat treated to intermediate stages In this proceduresamples will generally be rapidly quenched once the heattreatment is completed (Unless a slow cooling experi-ment is the specific objective of the calorimetry study)These samples would then be analysed using a techniquethat provides conclusive information on the phasessuspected to be involved in the reaction For exampleprecipitation reactions would generally be identifiedusing atom probe analysis high resolution transmissionelectron microscopy (HREM) or transmission electronmicroscopy (TEM) with selected area diffraction (SAD)andor chemical analysis for instance by electrondispersive X-ray spectroscopy (EDS) Several of thesestudies have been reported28ndash32 Recrystallisation is mostlyevidenced by using high resolution scanning elec-tron microscopy (SEM) in combination with electron
Starink Analysis of Al based alloys by calorimetry
196 International Materials Reviews 2004 VOL 49 NO 3ndash4
backscatter diffraction (EBSD) crystallisation anddevitrivication is best evidenced by X-ray diffractionand nanocrystallisation is evidenced by TEM with SADMelting reactions can often be indirectly evidenced bystudying eutectic structures in a sample that is rapidlysolidified by quenching after having (partially) meltedusing SEM (possibly in combination with EDS)
While the above procedures are vital to conclusivelyidentify phases involved in reactions detected bycalorimetry many published works on calorimetricanalysis of metals do not contain a detailed micro-structural analysis and many do not contain any directmicrostructural analysis at all Instead a range of otherindirect approaches have been used to tentativelyidentify reacting phases These unproven interpretationsshould be approached with caution
One example of a contested interpretation is that ofthe exothermic effect at about 60ndash100uC that occursin DSC scans of quenched AlndashCundashMg alloys with Cuand Mg contents about 1ndash2 at- (see Fig 7)33 Thisreaction is important as it is the cause of the rapidhardening encountered in important AlndashCundashMg alloyssuch as the 2024 alloy Many authors have studied thisreaction in DSC and attributed it to so-called GPBzones but this was mostly achieved without conclusivemicrostructural evidence Recently three-dimensionalatom probe (3DAP) analysis of an Alndash11Cundash17Mg(at-) alloy has indicated183435 that GPB zones formmuch later in the aging process while SAD in a TEM ofa sample heated to the peak of the exothermic effectrevealed no evidence of GPB zone formation Three-dimensional atom probe (3DAP) analysis showed that ahigh density of CundashMg CundashCu and MgndashMg clustershad developed after 5 min aging at 150uC thus stronglysuggesting that the exothermic effect is due to theformation of these clusters and not to GPB zones Otherresearchers presented HREM data on an Alndash087Cundash144Mg (at-) alloy aged for 4 h at 190uC and 4 h at200uC which was purported to show GPB zones andthis was suggested to support that GPB zones (notclusters) were responsible for the exothermic peak at60ndash100uC1236 But as aging 4 h at 190 or 200uC is
considerably different to heating at about 10 K min21
to 100uC the latter interpretation has to be consideredto be tentative However the interpretation in favour ofGPB zone formation received support from a DSC andTEM study on quenched Alndash44Cundash17Mg (wt-) agedfor 2760 min at room temperature which showedevidence for diffraction effects due to GPB zones33
Clearly the identification of this exothermic effecthas not been conclusively established and DSC workwhich was not supported by electron microscopy oratom probe work37ndash40 and which tentatively ascribedit to GPB zones still awaits confirmation from furthermicrostructural observations
Heat capacity determinationIn heat capacity measurement of a material using DSCa sample of the material to be investigated is placedin the DSC with a reference of known heat capacitycpref(T) The heat capacity of the sample can then bedetermined from heat flow q from the DSC as41
cpsample(T)~qbzcpref (T) (1)
where b is the heating rate As heat capacities of manysubstances are well known the determination of heatcapacity can also be used to calibrate the heat flowmeasurement in the DSC
Solid state reactionsHomogenisation and solution treatment studies
For heat treatable Al based alloys the best balance ofproperties is obtained if the solution treatment is carriedout such that a maximum of alloying elements isdissolved while no melting occurs Hence solutiontreatment is carried out just below the start temperatureof incipient melting In studies of homogenisation andsolution treatment of heat treatable Al based alloysDSC is generally the technique of choice In thesestudies DSC is effective because it provides a rapidassessment of the temperature range for dissolution ofsoluble phases as well as providing the onset tempera-ture of incipient melting
7 a Hardness and b DSC traces from as quenched (a q) and room temperature aged (times on traces in minutes) high
purity Alndash44Cundash17Mg (wt-) alloy samples (from Ref 33) DSC traces show low temperature clusterGPB zone forma-
tion and their subsequent dissolution A Ad B etc highlight several peaks (see Ref 33)
Starink Analysis of Al based alloys by calorimetry
International Materials Reviews 2004 VOL 49 NO 3ndash4 197
The heat effect due to the dissolution of precipitatephases during DSC experiments can be analysed to yielddata on the solvus of the phases even if those phasesare metastable An example for the determination ofthe solvus of d9 (Al3Li) precipitates in AlndashLi alloys isprovided by Noble and Bray42 In this work thedissolution of the d9 is measured for various AlndashLi alloysat a range of heating rates (Fig 8) As dissolution is adiffusion process that requires some finite time tobe completed the temperature where the endothermicreaction finishes is an overestimate of the solvus tempera-ture but by extrapolating the measured solvus tempera-ture to a zero heat rate the true solvus temperature can befound The solvus data obtained from DSC were inagreement with data obtained from resistivity measure-ments and allowed the determination of the solvus of themetastable d9 phase over a range of temperatures
Dissolution reactions in multicomponent heat treat-able Al alloys can also be analysed to some detail usingDSC Figure 9 shows DSC curves from three AlndashZnndashMgndashCu alloys with compositions close to those ofcommercial 7000 type alloys such as 7010 The DSCcurves reveal that the three alloys have differenttemperatures for the onset of incipient melting onealloy melts from about 480uC another from about490uC and the third does not melt below 510uC Thefinal stage of dissolution is very different between thethree alloys with for one alloy the dissolution being
completed at about 440uC while for the other two alloysdissolution continues up to about 470ndash475uC The causefor these complex differences lies in the presence of varyingamounts of the S (Al2CuMg) g (Mg(CuZn)2) and Tphases that can occur at these temperatures either asequilibrium phase43 or as non-equilibrium remnants fromthe eutectics formed during solidification This means thatthe optimal solution treatment temperatures will differ forthe three alloys The effect of particle size on dissolutionkinetics has also been studied by DSC44
Analysis of dissolution and (the onset of) incipientmelting can also be used to explore optimisation ofalloying content For example the optimisation of Znand Mg content for 7000 alloys has been explored45 TheDSC curves indicate that for an Alndash61Znndash23Mgndash19Cundash012Zr (wt-) alloy g phase dissolution iscompleted at about 460uC ie before the solution treat-ment temperature or incipient melting temperatures arereached Hence provided quench sensitivity is not anissue there is some scope for increasing the alloyingcontent of the alloy A reasonable estimate can beobtained directly from the DSC data For this the gphase dissolution effect was approximated by a triangleas illustrated in Fig 10 (Dissolution effects of
9 DSC curves of AlndashZnndashMgndashCu alloys (wt-) revealing differ-
ences in last stages of dissolution effect (up to y475uC)
and the onset of melting (from about 475uC) exothermic
heat flow on positive y axis (adapted from Ref 45)
a AlndashLi (at-) alloys studied at heating rate of
20 K min21 b effect of heating rate on DSC thermogram
of Alndash98Li (at-) alloy
8 DSC curves of AlndashLi alloys (exothermic heat flow on
positive y axis) heat effects are due to formation and
dissolution of d9 phase (from Ref 42)
10 DSC curves of Alndash61Znndash23Mgndash19Cundash012Zr (wt-)
alloy aged for 4 h at 170uC after solution treatment
together with approximation of heat of g dissolution
using triangular heat effect exothermic heat flow on
positive y axis (from Ref 45)
Starink Analysis of Al based alloys by calorimetry
198 International Materials Reviews 2004 VOL 49 NO 3ndash4
equilibrium phases in many Al based alloys roughlyapproximate this shape4647) It was estimated
xgZn(optalloy)
xgZn(alloyB)
~DQ(optalloy)
DQ(alloyB)~
(Te(alloyB)T1)2
(TSTT1)2
(2)
where xgZnethoptalloyTHORN and x
gZnethalloyBTHORN are the gross Zn
content of the optimised alloy and the alloy in Fig 10respectively DQ is the integrated evolved heat TST is thesolutionising temperature and Te and T1 are defined inFig 10 Using TST5475uC this estimate indicates thatboth the Zn and Mg content can be increased by about12 However it should additionally be considered thatMg (and Cu) content should remain below the S phasesolvus and hence Cu Mg and Zn composition shouldbe limited Thus in order to optimise the balance ofproperties alloy compositions around Alndash7Znndash23Mgndash17Cu (wt-) should be considered If processing can becarried out such that incipient melting below 490uC isavoided the solution treatment temperature can beincreased (to about 485uC providing a safety marginof about 5 K) and alloying content can be furtherincreased
Apart from the dissolution effect itself the subsequentmelting of intermetallic phases also provides informa-tion on the progress of homogenisation and solutiontreatment because the magnitude of these incipientmelting effects increases with increasing amount ofintermetallic phase present Lasa and Rodriguez-Ibabe48
used this to study the homogenisation of two AlndashSindashCundashMg alloys with very similar compositions that were castusing different procedures The DSC curves of a conven-tionally cast Alndash12Sindash44Cundash13Mg (wt-) ingot sampleand a thixoformed Alndash15Sindash44Cundash06Mg (wt-) alloyheat treated for various times at 500uC all show amelting effect with onset temperatures between about507 and 511uC (Fig 11) These endothermic effects wereascribed to the reaction4849
a(Al)zSizAl2CuzAl5Mg8Cu2Si6Liquid (3)
with a possible small contribution from the reaction
AlzCuMgAl2zAl2CuLiquid (4)
The total heat content was used as a measure of theamount of Al2Cu present after homogenisation andthus the DSC data indicate that for the conventionallycast alloy at least 2 h were necessary to achieve themaximum amount of dissolution of Al2Cu and achieveequilibrium The curves obtained for the thixoformedalloy show that the dissolution of Al2Cu was muchfaster in this alloy This was probably due to the finerAl2Cu particle size found in this alloy after thixoform-ing and 05 h at 500uC was almost enough to reachequilibrium For further analysis see lsquoVolume fractionof intermetallic phases measured from solidndashliquidreactionsrsquo below
Precipitation studies ndash qualitative analysis
Differential scanning calorimetry and isothermal calori-metry are used extensively to study precipitation reac-tions in heat treatable Al based alloys Recent work hasfocused on quench sensitivity of precipitation hardenedalloys50ndash52 the effect of room temperature (pre-)agingand the formation of clusters and zones3353ndash55 the heataffected zone in welds5657 influence of thermal shock on
precipitation58 and influence of microalloying onprecipitation59 Following on from the extensive workon Al based MMCs in the 1980s and 1990s the influenceof the addition of ceramic reinforcement on precipita-tion has continued to be extensively studied byDSC60ndash63 In this section the main aspects of qualitativeanalysis are described with an overview of aspects ofdetailed quantitative analysis being presented in sub-sequent sections
In precipitation studies using thermal analysis itshould be borne in mind that precipitation can occurbefore during and after the thermal analysis experi-ment and hence the measurement follows only a portionof the process that is studied In practice this leads totwo different strategies of thermal analysis studies ofprecipitation If an alloy is solution treated andquenched and then isothermal calorimetry or DSC isperformed immediately after quenching the mainobjective will be the study of the precipitation reactionsfrom their start ie the aim will be to study precipitationfrom start to finish in the calorimeter However if thealloy is solution treated quenched and then aged beforethe DSC or calorimetry experiment mostly beingstudied will be the further transformations of aprecipitate structure that has been formed before thecalorimetry experiment is started In the former case thefirst reaction will be exothermic and in the latter case
11 Part of DSC curves of conventionally cast Alndash12Sindash
44Cundash13Mg (wt-) ingot sample (alloy A) and thixo-
formed Alndash15Sindash44Cundash06Mg (wt-) alloy (alloy B)
showing incipient melting exothermic heat flow on
positive y axis (from Ref 48)
Starink Analysis of Al based alloys by calorimetry
International Materials Reviews 2004 VOL 49 NO 3ndash4 199
the first reaction to occur can be either exothermic orendothermic depending on the state of precipitation atthe start of the calorimetry experiment and thetemperature (range) at which it is performed
In isothermal calorimetry work one would usuallyaim to start the experiment as soon as possible afterquenching and aim to measure the heat evolution duringas much of the transformation as can practically beachieved An example of an isothermal calorimetrystudy is provided in Fig 2 which shows isothermalcalorimetry data of precipitation in an AlndashSi alloy InDSC studies of precipitation one can also performexperiments that are started immediately after comple-tion of the quench If experiments are limited to just thisonly a limited insight into processes occurring duringisothermal aging would be obtained because limitationson heating rate would mean that only relatively fastprocesses can be studied For example if a reactionwould occur only at temperatures below 200uC and thatreaction would occur after isothermal aging for at least2 h in the temperature range 100ndash200uC then thatreaction would not occur during the DSC experimentbecause DSC would scan through that range typically in1 min to 1 h For this reason a detailed DSC study ofprecipitation will generally involve multiple DSCexperiments on samples that have received a range ofaging treatments An example involving the aging of asolution treated stretched and subsequently first natu-rally aged (for several months) and then artificially agedAlndashCundashMg alloy is shown in Fig 12 These thermo-grams show that during the final aging for 12ndash72 h at150uC the endothermic effect in the range 120ndash240uCdue to clusterzone dissolution first increases andsubsequently decreases whereas the exothermic effectin the range 240ndash300uC due to S phase formationcontinuously decreases This allows a quantitative orsemiquantitative assessment of the formation andordissolution of zonesclusters and S phase64 This type ofassessment of precipitation by DSC on pre-aged sampleshas found wide application65ndash67
Determination of thermal historyfingerprinting of heattreated alloys
The use of DSC for determination of thermal history ofa heat treated alloy is an application that is closely
related to the precipitation studies described in theprevious section The difference is that in determinationof thermal history the aim is not to study the nature ofthe reactions that cause the heat effects in detail butrather to use the DSC as a tool for investigating asample that has undergone an unknown or ill definedheat treatment The application of this technique can befound in quality control of aging treatments eg inverification of industrial heat treatments and in this casethe application is sometimes termed DSC fingerprint-ing6768 Another application is in assessing heat treat-ments that parts of materials that are inaccessible forrecording of temperature history have undergone Anexample of the latter is the study of heat affected zonesin welds of heat treatable Al based alloys56
For an alloy in which a multistage aging sequenceoccurs the DSC curve will generally be complexcontaining several endothermic and exothermic effectsIn the course of the heat treating of an alloy in which amultistage aging sequence occurs the DSC curve willchange in a complex manner an example of this isprovided in Fig 13 for an 7449 alloy heat treated tovarious commercially applied and non-commercialtreatments69
Precipitate coarsening ndash qualitative analysis
The kinetics of precipitation and dissolution reactions inheat treatable Al based alloys will in general depend onthe size of the precipitates and thus DSC is sensitive tosize of precipitates The exothermic heat effect due tocoarsening is caused by two factors First the reductionof precipitatematrix interfacial area will reduce the totalinterfacial area of the system and second the reductionof the interfacial energy per precipitate will reduce themetastable solubility of elements dissolved in the matrixthus allowing an increase in the volume fraction ofprecipitates The latter is described by the GibbsndashThompsonndashFreundlich relation which gives the ratiobetween the equilibrium concentration of solute in thematrix cmeq and the metastable solubility in the vicinity
12 DSC curves of solution treated and stretched Alndash
118Cundash051Mgndash021Mn (at-) alloy aged for various
times at 150uC exothermic heat flow on positive y
axis (from Ref 64)
effect II mostly g9 dissolution and dissolution of fine g
effect III precipitation and coarsening of g effect IV
mostly dissolution of g
13 DSC curves at heating rate of 10 K min21 of solution
treated and aged samples of 7449 (AlndashZnndashMgndashCundashZr)
alloy T651 is peak aged and T7951ndashT7E represent
aging treatments with increasing overaging exother-
mic heat flow on positive y axis (adapted from
Ref 69)
Starink Analysis of Al based alloys by calorimetry
200 International Materials Reviews 2004 VOL 49 NO 3ndash4
of a spherical particle cm as
cm
cmeq
~exp2cVm
RTrp
(5)
where c is the interfacial energy rp is the particle radiusVm is the atomic volume of the particles and R is the gasconstant However due to small heat effects involved itis often difficult to perform meaningful analyses ofcoarsening of precipitates in Al based alloys using DSCIt should also be noted that evidencing coarseninginvolves the measurement of change of sizes and volumefractions of precipitates for example by TEMEspecially the change in volume fraction can be smalland difficult to determine reliably and thus evidencingall the factors influencing the heat effects due tocoarsening can be difficult certainly in comparison withreactions that involve phase changes
In DSC studies on peak aged and overaged samplesof a 7050 Al based alloy (Alndash645Znndash21Mgndash215Cu(wt-) Alndash28Znndash245Mgndash095Cu (at-))70 and arange of other AlndashZnndashMgndashCu based alloys45697172 itwas observed that with increasing overaging the peakand end temperature of the endothermic dissolutionpeak of the main strengthening precipitates (effect II inFig 13) shift to higher temperatures while the start isabout constant and equal to the prior aging temperature(170uC) One study71 considered that this change in effectII was directly related to coarsening but in anotherwork72 it was suggested that the changes in the DSCcurves are caused by a reduction in the size of effect IIIwhich was ascribed to the exothermic coarseningreaction implying that the underlying dissolutionreactions (effects II and IV) remain largely unchangedWith no direct microstructural evidence of the evolutionof precipitate volume fractions and sizes during linearheating available there is no conclusive evidence tosupport either interpretation In these works thecoarsening reaction was used to quantitatively explainthe change in strength on overaging
Defect annihilation recovery and recrystallisation in
wrought alloys
An example of a DSC study on a deformed non-heat-treatable alloy is the work on a nanocrystalline Alndash76at-Mg (Alndash69wt-Mg) alloy powder that was
produced by ball milling at liquid nitrogen temperatures(lsquocryomillingrsquo)73 The DSC curve of this powder (Fig 14)shows two relatively small exothermic effects prior to theoccurrence of melting from about 530uC As X-raydiffraction (XRD) analysis of the ball milled samplesafter aging at 230uC had shown a significant reduction inlattice strain the first exothermic effect between 100 and230uC was ascribed to recovery (the removing andclustering of dislocations) and elimination of twins Thesecond effect between 300 and 360uC was ascribed torecrystallisation
For heat treatable Al based alloys the heat effects dueto vacancy annihilation recovery and recrystallisationare generally much smaller than heat effects due toprecipitation or dissolution of precipitates and theygenerally occur in overlapping temperature rangesHence the exothermic heat effects due to vacancyannihilation recovery and recrystallisation can often notbe determined in heat treatable Al based alloys Indeformed Al alloys for which no precipitation ordissolution reactions occur (pure Al or dilute non-heat-treatable alloys) recovery and recrystallisationmight be detectable in DSC
Modulated differential scanning calorimetry (MDSC)has also been applied to reveal recovery in themechanically alloyed Al93Fe3Ti2Cr2 alloy in the asmilled condition (see Fig 15)74 It was indicated byTEM and XRD that this as milled material is composedof an Al based supersaturated solid solution with highinternal strains With the aid of XRD the DSC curvehas been interpreted as revealing recovery (effect 1) andformation (precipitation) of intermetallic phases Al6FeAl3Ti and Al13Cr2 (and possibly Al13Fe4) (effects 2 3and 4)
Devitrivication nanocrystallisation
Aluminium based alloys containing transition metalsand rare earth elements are candidates for the develop-ment of ultrafine grained (nanostructured) materialsThe achievement of such a microstructure depends on
14 DSC curves for as milled Alndash69Mg (wt-) alloy
(16 K min21 heating rate) inset is enlarged portion of
DSC curve (from Ref 73)peak 1 recovery peak 2 3 4 formation (precipitation)
of intermetallic phases Al6Fe Al3Ti and Al13Cr2 (and
possibly Al13Fe4) respectively
15 Non-reversing heat flow from modulated DSC experi-
ments on as milled Al93Fe3Ti2Cr2 alloy powder in her-
metic Al pan with heating rate of 2 K min21 (from
Ref 74)
Starink Analysis of Al based alloys by calorimetry
International Materials Reviews 2004 VOL 49 NO 3ndash4 201
the processing conditions and may be achieved bycontrolled heat treatment of amorphous alloys Theamorphous and nanostructured alloys show different(usually enhanced) physical chemical and mechanicalproperties from those of either the conventional poly-crystalline or amorphous state including a high strength(1500 MPa) and excellent high strengthweight ratioDifferential scanning calorimetry has proved to be themost effective method for characterising the kinetics ofdevitrivication including the nanocrystallisation in theseamorphous alloys and is applied in a large number ofstudies75ndash80 although isothermal calorimetry has alsobeen applied81
An instructive application of DSC to the study ofdevitrivication is the work by Gich et al82 on thedevitrivication of a range of rapidly solidified amor-phous AlndashNindashSm ternary alloys The DSC curves ofthree of the alloys are shown in Fig 16 and these curvesshow three exothermic effects that have been ascribed tothe following reactions
A amorphousa-Alzamorphous0
(primary crystallisation)
B amorphous0a-Alzintermatallic phases
(eutectoid crystallisation)
C transformation of intermetallic phases
where amorphous9 signifies the amorphous phase withincreased alloying content resulting from the rejectionof alloying elements from the a-Al phase83 In fact thisidentification of these three types of reaction on heatingof amorphous Al based alloys is common to manyamorphous Al based alloys The types of intermetallicphases formed are dependent on the alloying additionsfor example in the AlndashNindashSm ternary alloys shown inFig 16 intermetallic phases were identified as Al3Sm(formed in reaction B) and Al11Sm3 (formed in reactionC) The temperature ranges of the heat effects as well asthe activation energies (see subsection lsquoMeasuredactivation energies in Al based alloysrsquo below) dependstrongly on the composition revealing how compositionaffects the relative stability of the amorphous thenanocrystalline and the intermetallic phases
Multilayers and interfacial reactions
Differential scanning calorimetry has been applied to thestudy of reactive diffusion in metallic multilayers contain-ing Al layers a detailed overview of experimental pro-cedures and of pre-1997 work is provided by Michaelsenet al7 The evolution of microstructure and the associatedtransformation kinetics in reacting thin films andparticularly transition metals and Al polycrystalline thinfilms are highly relevant to the semiconductor industrywhere such reactions occur in the production of integratedcircuits Layered systems studied by calorimetry includeNbAl8485 TiAl86 NiAl87 ZrAl7 and CoAl88
Isothermal calorimetry and DSC have been employedto study the reaction between ceramic reinforcementsand Al matrix in Al based composites8990
Solidndashliquid and liquidndashsolid reactionsSolidification
In studies of solidification of Al based alloys DSC orDTA performed at constant cooling rate is often akey technique With DSC it is possible to track thesolidification process by virtue of the large endothermicheats produced by the liquidndashsolid transformation Forpure Al the heat effect due to solidification will be asharp exothermic peak starting at a temperature belowthe equilibrium melting temperature The differencebetween liquidus and onset of solidification DT is theundercooling which is an important factor determiningthe microstructure of the solidified alloy An illustrationof an application of DSC to a relatively simple binary Albased alloy is the study of solidification in an Alndash45Cu(wt-) alloy by Larouche et al91 The DSC curves forcooling at different rates shown in Fig 17 reveal thesolidification of the Al rich phase which occurs mostlybetween 643 and 600uC and is dependent on coolingrate With the eutectic temperature being located at547uC the reactions occurring just below that tempera-ture are the solidification of the eutectic
The influence of preparation of the melt on solidifica-tion of AlndashSr alloys was studied by Zhang et al92 Intheir work the solidification of two Alndash10Sr (wt-)alloys one prepared by molten salt electrolysis and oneprepared by a direct mixing method were investigatedThe resulting DSC curves shown in Fig 18 reveal thatthe undercooling at which solidification starts issignificantly different for the two alloys and this wasshown to correspond to a significantly different dendriticsolidification structure It was speculated that the
17 DSC curves of solidification of Alndash45Cu (wt-) alloy
at cooling rates of 5 10 and 60 K min21 (from
Ref 91)curve a Al90Ni4Sm6 curve b Al88Ni6Sm6 curve c
Al88Ni4Sm8 (all curves show three exothermic heat
effects)
16 DSC curves (40 K min21 heating rate) of amorphous
AlndashNindashSm alloys (from Ref 82)
Starink Analysis of Al based alloys by calorimetry
202 International Materials Reviews 2004 VOL 49 NO 3ndash4
intensive current and electromagnetic field in theelectrolysis process would have had a significant effecton the liquid of the AlndashSr melt and the subsequentsolidification process and the microstructure
An illustration of application to a more complex alloycan be found in the study of Hsu et al93 on solidificationin an Alndash06Sindash08Mgndash03Fe (wt-) alloy In this workthe authors employed the entrained droplet technique94
in which 1ndash1000 nm liquid droplets are entrained in asolid matrix which acts as a heterogeneous nucleationcatalyst and their solidification is monitored usingDSC
It should in principle be possible to compare the heateffects during cooling with the thermodynamic andphase diagram predictions made by the approachescollectively termed CALPHAD (CALculation of PHaseDiagrams) Some success has been obtained in studiesof mixing and dissolution of liquids and elementalpowders but reports on successful analysis of enthalpiesof solidification reactions in Al based alloys are largelyabsent from the literature One study carried out byYoussef et al95 compared the latent heat of solidifica-tion of a commercial purity Al alloy and a commercialpurity alloy with additions of TiB2 particles It wasobserved that even though TiB2 particles were pre-sumed the latent heat of solidification of the Al wassignificantly different for the metal matrix composite ascompared to the commercial purity Al alloy Thedifference was spectulatively ascribed to the creation ofelastic strain energy during solidification
Melting and incipient melting
Depending on complexity and alloying content theheating of an Al alloy can give rise to one or a range ofendothermic melting effects96 A DSC trace of meltingof pure Al showing a single peak due to melting of the Alrich phase is depicted in Fig 19 In Al alloys whichcontain intermetallic phases the melting of the Al richphase is often preceded by melting of one or more ofthose minority phases and this type of melting is oftentermed lsquoincipient meltingrsquo Illustrations of application tomore complex alloys are studies by Sha et al97 onmelting in an Alndash06Sindash08Mgndash03Fe (wt-) alloy andby Wang et al49 on Alndash11SindashxCundash03Mg (wt-) alloysIn Fig 20 DSC scans showing the melting reactions in
conventionally mould cast Alndash11SindashxCundash03Mg (wt-)alloys are presented The four reaction peaks (labelled 12 29 3) that can be observed in these DSC scans wereattributed to
1 a(Al)zSi(zAl5SiFez )OLiq
2 a(Al)zCuAl2zSiOLiq
20 a(Al)zSizMg2SiOLiq
3 a(Al)zCuAl2zSizCu2Mg8Si6Al5OLiq
Microalloying with Na Sr or Be has a distinct effect onthe as cast microstructures of these alloys and alsoinfluences subsequent remelting This is illustrated inFig 21 Modification with Na has little effect on theposition of peak 3 but with Be and Sr modificationwhich both enhance the mechanical properties of thesealloys the beginning temperature of peak 3 shifts toabout 512ndash513uC This DSC study thus revealed that therestrictive solution temperature to avoid incipient
18 DSC traces of Alndash10Sr (wt-) alloy prepared by elec-
trolysis (dashed line) and mixing (solid line) during
solidification at cooling rate of 20 K min21 (from
Ref 92)
19 DSC traces of melting of 99999 pure Al at heating
rate of 25 K min21 (from Ref 91)
1 a(Al)zSi(zAl5SiFezhellip)OLiq
2 a(Al)zCuAl2zSiOLiq
29 a(Al)zSizMg2SiOLiq
3 a(Al)zCuAl2zSizCu2Mg8Si6Al5OLiq
20 Heating DSC curves for as cast samples of Alndash11Sindash
xCundash03Mg (wt-) alloys showing melting peaks (from
Ref 49)
Starink Analysis of Al based alloys by calorimetry
International Materials Reviews 2004 VOL 49 NO 3ndash4 203
melting of intermetallic phases could be increased byabout 5 K in the latter modified alloys
Sha et al97 showed that DSC can also be used tostudy the effect of solidification rates on the solidifica-tion reactions and the final solidified microstructure InFig 22 DSC heating curves for Alndash06Si-08Mgndash03Fe(wt-) alloy samples that were solidified at growthvelocities in the range 5ndash120 mm min21 in a Bridgmantype furnace are compared with a sample that wasslowly solidified at a rate of 10 K min21 These DSCcurves show four endothermic reactions (indicated lsquoarsquolsquobrsquo lsquocrsquo lsquodrsquo) and through comparison with knowntemperatures of invariant reactions and with the aidTEM and XRD work these effects were identifiedEffect lsquobrsquo corresponds to a-AlFeSi eutectic melting
a(Al)za-AlFeSiOLiq
effect lsquocrsquo corresponds to a-AlFeSi peritectic melting
a(Al)za-AlFeSiOLiqzAl13Fe4
effect lsquodrsquo corresponds to eutectic melting of Al13Fe4 (alsoindicated as Al3Fe)
a(Al)zAl13Fe4OLiq
The DSC trace from the alloy solidified at 10 K min21
shows that only effects lsquocrsquo and lsquodrsquo are present during theheating cycle The amount of heat released at effect lsquobrsquoof the specimen grown at 5 mm min21 is much less thanthat for the specimen grown at 120 mm min21 indicat-ing that at higher growth velocities in the range 80ndash120 mm min21 more a-AlFeSi phase is formed by theeutectic reaction These results therefore suggested thatthe more non-equilibrium the solidification the morelikely the a-AlFeSi is to form via the eutectic rather thanthe peritectic reaction Effect lsquoarsquo in the DSC tracescorresponds to the melting of the metastable b-AlFeSiphase The alloy solidified at 10 K min21 shows neithereffect lsquoarsquo nor lsquobrsquo Sha et al97 explained this observationby noting that because it is not an equilibrium phase inthe alloy it is unlikely that b-AlFeSi forms at such a slowcooling rate
Determination of heat of incipient melting has alsobeen used to define alloys and processing combinationsin patents on 2000 6000 and 7000 type Al basedalloys9899 The patent on high strength 7000 alloys99
specifically states lsquoThe alloys contain by weight 7 to135 Zn 1 to 38 Mg 06 to 27 Cu 0 to 05 Mn0 to 04 Cr 0 to 02 Zr others up to 005 each and015 total and remainder Al Either wrought or castalloys can be obtained and the specific energy asso-ciated with the DEA melting signal of the product islower than 3 Jgrsquo
Partial melting is an important part of the sinteringprocess as used for the consolidation to near full densityof Al alloy powders The DSC technique has beenemployed in studies of sintering to determine tempera-ture ranges for partial melting of the alloys43100
CALPHAD mixing and dissolution of powdersand liquidsFor obtaining thermodynamic functions of liquid andsolids DSC DTA and isothermal calorimetry areimportant tools Such measurements can be used inverification of the predicted phase diagrams and areassessed and predicted using the approaches collectivelytermed CALPHAD Especially onset of melting ofphases during heating101ndash103 is used to support predictedphase diagrams and measurement of enthalpies offormation of intermetallic phases from reaction ofelemental powders104 or through drop solution calori-metry105ndash108 is used to directly determine formationenthalpies Also DSC data on precipitation reactionscan be used in assessing phase diagrams109 Enthalpiesof mixing of liquid phases are measured by hightemperature calorimetry110ndash112 Further thermodynamicdata can be obtained by measuring the enthalpies ofdissolution of elements in liquid Al113
effect a melting of metastable b-AlFeSi phase effect
b a-AlFeSi eutectic melting effect c a-AlFeSi peritectic
melting effect d eutectic melting of Al13Fe422 DSC heating traces of Alndash06Sindash08Mgndash03Fe (wt-)
alloy solidified at different growth velocities DSC
heating rate is 10 K min21 (adapted from Ref 97)
DEA melting signal in this case refers to the heat content of the incipientmelting peak in a DSC experiment
21 Effect of microelements on DSC curves of Alndash11Sindash
4Cundash03Mg alloy (wt-) all effects are due to melting
of phases (from Ref 49)
Starink Analysis of Al based alloys by calorimetry
204 International Materials Reviews 2004 VOL 49 NO 3ndash4
Modelling of thermally activatedreactions
Introduction general objectivesIn many cases calorimetry data obtained for metalshave been analysed in a purely qualitative manner ieby relating the presence of endothermic or exothermiceffects to particular reactions without attempting toobtain quantitative information on these reactions theirprogress or the mechanisms involved Quantitativeanalysis is more often performed for isothermal experi-ments as compared to linear heating experiments This isrelated to the availability of isothermal models whichare mathematically simpler than their non-isothermalequivalents In the present section these quantitativeanalysis methods are reviewed and their applicabilityassessed
The type of modelling of thermally activated reactionsthat has been used in conjunction with calorimetry orthat can be applied to calorimetry is of a broad anddiverse nature Modelling approaches can mostly beclassified as one of three types
N generic analysis models which are models that userelatively simple expressions that provide the fractiontransformed as a function of time or reaction rate as afunction of fraction transformed and that areapplicable to a wide range of reactions
N simplified physically based models which are modelsthat are specifically based on considerations of thephysical or chemical process often with adjustableprocess-related parameters such as impingementparameters that allow some flexibility in analysingdata
N simulations which are models that make predictionsoften using extensive computer time with all modelparameters being fixed
In using generic analysis models the aim would be tofind an adequate description of the progress of thereaction as a function of time and temperature withlimited consideration being given to the physical basisOn the other extreme simulations are based on thepresumption of a complete understanding of thephysical process with all process and kinetic parametersknown and in this case calorimetry or any otherexperimental work is not used to analyse a reactionbut instead to validate a model Simplified physicallybased models with adjustable process-related parametersaim to analyse experimental data with due regard to thephysical processes while making as little as possiblepresumption about the process
This section focuses on modelling methods that canbe used to analyse calorimetry (especially DSC) data interms of physical processes without making too manypresumptions about the process Hence physicallybased models with adjustable process-related parametersare the focus of discussion and assessments are made ofhow these approaches relate to more specific modelssuch as simulations and also of how they fit into moregeneric analysis methods Thus analysis methods thathave some inherent flexibility that allows them to copewith different types of reactions are mainly consideredrather than discussing in detail computer based simula-tions that are very specific to the reaction considered anddepend on prior knowledge of the physical parametersinvolved The emphasis is on developments that have
appeared over the past 10 years and that are suited foranalysis of thermally activated reactions in Al basedalloys
A general objective of the modelling of thermallyactivated reactions by generic analysis methods andphysically based methods is the derivation of a completedescription of the progress of a reaction that is valid forany thermal treatment be it isothermal by linearheating or any other non-isothermal treatment In thecase of physically based methods an additional aim is tobe able to use the analysis to understand the processesinvolved in the reaction At the outset it should berealised that for many reactions these objectives aredaunting Especially for solid state reactions any givenreaction might progress through a range of mechanismsand intermediate stages all of which will in generalhave a different temperature dependency To come toterms with this complexity simplifying assumptions areoften made and throughout the subsequent sectionsseveral analysis methods based on simplifications arereviewed
Single state variable approaches (singleArrhenius term)The most popular way of dealing with the complexity ofthermally activated reactions is through the assumptionthat the transformation rate during a reaction is theproduct of two functions one depending solely onthe temperature T and the other depending solely on thefraction transformed a (Refs 114ndash117)
da
dt~f (a)k(T) (6)
The temperature dependent function is generallyassumed to follow an Arrhenius type dependency
k~ko exp E
RT
(7)
where E is the activation energy of the reaction Thusto describe the progress of the reaction at all tem-peratures and for all temperaturendashtime programmes thefunction f(a) and the constants ko and E need to bedetermined In general the reaction function f(a) isunknown at the outset of the analysis A range ofstandard functions which represent particular idealisedreaction models have been proposed118119 (see Table 1)Through selection of specific f(a) the formalismdescribed by the above two equations describes specifictypes of reaction kinetics For example the formalismcan incorporate JohnsonndashMehlndashAvramindashKolmogorov(JMAK) kinetics for
f (a)~nfrac12ln(1a)(n1)=n(1a) (8)
Within this concept the description of the progress of areaction is reduced to finding appropriate values for Eko and the function f(a) ndash the so-called kinetic triplet Inthe sections lsquoActivation energy determinationrsquo andlsquoSingle stage reaction modelsrsquo below techniques foranalysing DSC and isothermal calorimetry data basedon equations (6) and (7) are considered but first anapproach that allows comparison of progress ofisothermal reactions with non-isothermal reactionsthrough the lsquoequivalent timersquo concept is discussedStudies from the past 5ndash10 years are mainly considered
Starink Analysis of Al based alloys by calorimetry
International Materials Reviews 2004 VOL 49 NO 3ndash4 205
for an extensive overview of pre-1996 work the reader isreferred to the work by Galwey and Brown119
Equivalent time state variable and temperatureintegralThe equivalent time concept refers to a method designedto describe any non-isothermal treatment with tempera-ture path T(t) by a single variable termed the equivalenttime It thus allows comparison of the progress of areaction when samples are exposed to different tem-perature paths T(t) eg compare the progress of areaction under linear heating conditions with theprogress during isothermal annealing The equivalenttime approach is valid if the progress of a reaction canbe described by a single state variable and in thefollowing subsection the state variable approach isreviewed and the expression for equivalent time isderived
State variable approach and equivalent times
In the state variable approach we consider that thefraction transformed is a unique function of a statevariable v If there is one single temperature dependentprocess operating v is given by
v~
ethtet~0
kdt (9)
For isothermal reactions at Tiso it simply follows
v~kte (10)
The state variable approach is justified in the case thatequation (6) is valid ie the transformation rate duringa reaction is the product of two functions onedepending solely on the temperature and the otherdepending solely on the fraction transformed In this
case we can integrate the above equationethtet~0
da
f (a)~
ethteto
k(T)dt (11)
and as the left-hand side of this equation is a uniquefunction of the fraction transformed we can define astate variable as
v~
ethtet~0
da
f (a)(12)
One result from these equations is the derivation of theequivalent time which is defined as the time attemperature Tiso needed to complete the same amountof the reaction during a non-isothermal annealConsidering that in many cases k can be assumed tobe an Arrhenius expression the equivalent time is givenas
teq~
ethtet~0
exp E
RT(t)
dt exp
E
RTiso
1
(13)
For linear heating we can derive
ethtet~0
exp E
RT(t)
dt~
E
Rb
ethy~yf
exp(y)
y2dy (14)
where y5ERT yf5ERTe (Te being the temperaturereached during the linear heating) and b is the heatingrate Thus to obtain the equivalent time for linearheating we need to calculate the integraleth
y~yf
exp(y)
y2dy~p(yf ) (15)
This integral p(y) is termed the temperature integral orArrhenius integral
Table 1 Selected expressions for reaction function f (a) note that SestakndashBerggren model encompasses R1ndashR3 A1ndashA3and AGn models while the SZ model encompasses R1ndashR3 A1ndashA3 AGn AR and mean field models
Reaction Code f(a) a(t) Ref
Random nucleation unimolecular decay law(1st order)
F1 12a 12exp[2kt] 119
Phase boundary controlled reaction(1st order)
R1 1 kt 119
Phase boundary controlled reaction(2nd order contracting cylinder)
R2 (12a)12 12(12kt)2 119
Phase boundary controlled reaction(3rd order contracting sphere)
R3 (12a)23 12(12kt)3 147
JMAK linear growth in 1D (eg growth ofplate) after saturation of nucleation (n51)
A1 12a 12exp[2kt] hellip
JMAK linear growth in 2D after saturation ofnucleation (n52)
A2 2[2ln(12a)]12(12a) 12exp[2(kt)2] 119
JMAK linear growth in 3D after saturation ofnucleation (n53)
A3 3[2ln(12a)]23(12a) 12exp[2(kt)3] 119
JMAK diffusion controlled growth in 3D aftersaturation of nucleation (n51K)
A1K 1K[2ln(12a)]13(12a) 12exp[2(kt)1K] hellip
JMAK continuous nucleation and diffusioncontrolled growth in 3D (n52K)
A2K 2K[2ln(12a)]35(12a) 12exp[2(kt)2K] hellip
Precipitate growth in 3D after saturation ofnucleation in mean field approximation
H1K a13(12a) 12[(kt)32567z1]2567
(approximation)App 2
JMAK (generalised) AGn n[2ln(12a)](n21)n(12a) 12exp[2(kt)n] 114SestakndashBerggren SB am[2ln(12a)]q(12a)p No known closed
expression115
AustinndashRickett (AR) equation ARn n[(12a)2121](n21)n(12a)2 12[(kt)nz1]21 116 117SZ SZn n[(12a)21g21](n21)n(12a)(gz1)g 12[(kt)ngz1]2g 170 171
Note that A1 and F1 are mathematically identicalAppendix 2 of the present paper
Starink Analysis of Al based alloys by calorimetry
206 International Materials Reviews 2004 VOL 49 NO 3ndash4
Temperature integral and its approximations
A range of approximations of the temperature integralp(y) have been suggested in the literature All the knownapproximations will lose accuracy for small values of y(typically for y below 10ndash15) and some lose accuracy forlarge values of y (typically y exceeding 100) To be ableto appreciate the relevance of these deviations we needto consider the range of y values that can be encounteredwhen analysing linear heating data of thermallyactivated reactions In a recent work120 it was shownthat the range of y values that will in practice occur islimited for various reasons First it was considered thatreactions with high activation energy would generallyoccur at high temperatures and vice versa This will tendto limit the occurrence of extremely low or extremelyhigh values of y (5ERT) Second it was considered thatfor diffusion controlled reactions the typical diffusiondistance l is given by l5(Dt)12 where D is the diffusioncoefficient which is generally given by
D~Do exp ED
RT
(16)
and thus
y~ED
RT~ln
l2
Dot
(17)
Again extreme values of y are unlikely because (i) l andt are limited due to practical considerations and thelower limit for l is defined by interatomic distance (ii)larger diffusion distances l will imply longer experimenttimes t (iii) the logarithmic function will limit variationIt was concluded that only the range 9y100 is ofpractical significance while the overwhelming majorityof reactions in fact occur for 15y60 In this workreactions in Al alloys are the major concern andreactions will generally occur within the latter morerestrictive limits for y
The temperature integral can be calculated usingexpansions of the integral in an infinite series of whichseveral forms have been proposed120ndash122 and a range ofapproximations in the form of a finite number of termshave been proposed in the literature120123ndash129 In termsof practical applicability especially approximations ofthe following form are useful
p(y)exp (AyzB)
yk(18)
where k is a constant between 0 and 2 and A and B areconstants that depend on k This class of approxima-tions is important because it leads to single term closedform expressions for the equivalent time and also formsthe basis for the derivation of a group of activationenergy analysis methods (the direct methods) describedin the following section For each value of exponent k Aand B can be optimised by minimising the deviationbetween the approximation function and the exactintegral From this group of methods the approxima-tion for which the deviation reduces to zero in the limitof very large values of y is the approximation by Murrayand White126
p(y)exp(y)
y2(19)
It has been shown120129 that from this group of
approximations the approximation with A51 that ismost accurate for 20y60 is obtained with k5195which leads to
p(y)exp(y0235)
y195
(20)
if A is not required to be equal to 1 a highly accurateapproximation is given by120
p(y)exp(10008y0312)
y192
(21)
Analyses of accuracies of selected approximations of thetemperature integral have been published in severalworks120130 Comparison of the accuracies of theseapproximations is straightforward and in Fig 23 theaccuracies are compared by plotting ln(pap) where pa isan approximation of p such as those in equations (18)ndash(21) The figure shows that the above two approxima-tions obtained with k5195 and 192 are highly accurateHigher accuracies can be achieved with the morecomplicated expressions (such as the Senum and Yangexpression122128) but these are too complex to yield atransparent analysis method The often quoted Doyleapproximation123ndash125 proves to be the most inaccurateof the approximations tested in Fig 23 and is notconsidered further in this overview
To complete the calculation of the equivalent time forlinear heating we now need to choose which approxi-mation of p(y) is appropriate The approximation inequation (19) has been used to this end and leads to131
teqTf
b
RTf
Eexp
E
RTf
exp
E
RTiso
1
(22)
A better accuracy would be achieved by employingequation (20) to yield
teq0786Tf
b
RTf
E
095
exp E
RTf
| exp E
RTiso
1
(23)
The above expressions for equivalent time can be used inmany problems where the progress of a reaction duringlinear heating needs to be compared with the progressduring isothermal aging (or linear heating at a differentheating rate) For example in work on an 8090 (Alndash240Lindash116Cundash075Mgndash010Zr wt-) metal matrix
23 Relative accuracy of various approximations for tem-
perature integral (adapted from Ref 120)
Starink Analysis of Al based alloys by calorimetry
International Materials Reviews 2004 VOL 49 NO 3ndash4 207
composite the peak of the formation of semicoherent Sphase during heating at 10 K min21 was observed at300uC132 Using that the peak reaction rate occurs fora fraction transformed of about 69 and that theactivation energy for this reaction is 107 kJ mol21equation (22) predicts that at 170uC S phase formationis 69 completed in about 30 h This was found to beconsistent with isothermal aging data
Activation energy determinationTo analyse a thermally activated reaction using theapproach described by equations (6) and (7) we need toobtain the kinetic triplet E ko and the function f(a) Asf(a) is generally not known at the outset of the analysisand ko is a pre-exponential factor that can be adjustedrelatively easily after the other two elements of thetriplet are determined analysis is usually started bydetermining E Once E has been determined thecombination of the value of E and a single transforma-tion curve (ie a curve of a versus t) essentially providesthe solution to the determination of the kinetic tripletand thus determines the kinetics of the reaction withinthe simplified framework provided by equations (6) and(7) From this it will be clear that the determination ofthe activation energy is the crucial step in the analysisAnother reason for the importance of the determinationof the activation energy of the reaction lies in the factthat the activation energy for the overall reaction willgenerally be related to an activation energy for thephysical process that determines the rate of the reactionFor example if the rate determining step is diffusion ofan element through a material the activation energy ofthe overall process will in most cases be determined bythe activation energy for diffusion of that element Thusthe activation energy of the overall process will provideinformation on the physical process that is rate limitingand hence the objective of activation energy analysis isnot only as the first step in characterising the kinetictriplet but it can also be an objective in itself leadingto a better understanding of the mechanisms of thethermally activated reaction
For linear heating experiments activation energies ofreactions can be derived from a set of experimentsperformed at different heating rates For this activationenergy analysis a large number methods have beenproposed (a selection of methods can be found inRefs 129 131 133ndash147) The aim of the present sectionis to describe the main features and accuracies of thesemethods and provide recommendations about whichmethods are best suited for analysis of particular DSCdata It will be shown that several methods have acombination of relative simplicity of application andgood accuracy which allows them to be used foractivation energy analysis in Al based alloys
Activation energy analysis using isoconversion methods
From equations (6) and (7) it follows immediately thatfor transformation studies by performing experiments atconstant temperature Ti E can be obtained from thewell known relation
ln tf~E
RTi
zC1 (24)
where tf is the time needed to reach a certain fraction
transformed and C1 is a constant which depends on thereaction stage and on the kinetic model Thus E can beobtained from two or more experiments at differentvalues of T
All reliable methods of activation energy analysis forlinear heating experiments require the determination ofthe temperatures Tf(b) at which an equivalent stage ofthe reaction is obtained for various heating rates120143
Hence the term isoconversion methods The equivalentstage (also called the constant or fixed stage) may bedefined as the stage at which a fixed amount is trans-formed or at which a fixed fraction of the total amountis transformed Isoconversion methods can be cate-gorised into one of two main groups of methods120 Oneset of methods relies on approximating the temperatureintegral p(y) and requires data on Tf(b) only This firstset of methods includes the Kissinger method131133148
the KissingerndashAkahirandashSunose method134 (also termedthe generalised Kissinger method131) the FlynnndashWallndashOzawa method135ndash137 and several methods that weredevised more recently120122129 These methods havebeen termed type B isoconversion methods or p(y)-isoconversion methods120 The approximation of thetemperature integral which is key to these methods ishere illustrated by considering the derivation of theKissingerndashAkahirandashSunose (KAS) method In thisderivation equation (7) is inserted in equation (6) andthis is integrated by separation of variablesetha
0
da
f (a)~
ko
b
ethTf
0
exp E
RT
dT
~RE
bkB
ethyf
exp(y)
y2dy (25)
where Tf is the temperature at an equivalent (fixed) stateof transformation and b is the heating rate Using theMurray and White126 approximation for p(y) (equa-tion (19)) yields
ln
etha0
da
f (a)~ln
koE
Rzln
1
by2fyf (26)
At constant fraction transformed a this leads to
lnb
T2f
~E
RTfzC2 (27)
where C2 and subsequent C3 C4 etc are parametersthat are independent of T and b According to
equation (27) plots of ln(T 2f b) versus 1Tf should result
in straight lines the slope of the straight lines beingequal to ER This is the basis of the KAS equation Themodel can further be applied to the maximum rate andthis isoconversion model is termed the Kissingermethod133 It was shown73129 that the KAS analysis ispart of a group of methods which can be described bythe generalised equation
lnb
Tkf
~Ea
RTf
zC3 (28)
For temperatures and activation energies commonlyencountered in solid state reactions k5195 results in thebest accuracy of activation energy determination from aplot of ln(T k
f b) versus 1Tf120
A second set of isoconversion methods38139140 doesnot make any mathematical approximation but requires
Starink Analysis of Al based alloys by calorimetry
208 International Materials Reviews 2004 VOL 49 NO 3ndash4
the rate of transformation at Tf(b) as well as data onTf(b) These methods are referred to as type Aisoconversion methods120 (or Friedman methods afterthe researcher who first derived the method139) Themethod is derived by inserting equation (7) intoequation (6) and taking the logarithm yielding38139
lnda
dt~
E
RTfln f (a) (29)
Thus if a range of linear heating experiments atdifferent heating rates b are performed and the timesat which a fixed stage of the reaction is achieved can beidentified for each linear heating experiment f(a) will bea constant By measuring Tf and the transformation ratedadt at that fixed stage for each of the experiments wecan obtain E from the slope of plots of ln(dadt) versus1Tf As dadt can be difficult to measure accuratelywhile the heating rate is much easier to determineaccurately one usually determines E from the slope ofplots of ln(b dadt) versus 1Tf
The definition of an identical stage of the reactionwhich is crucial in these methods is best taken as thestage at which a fixed amount of heat has evolved Asthemaximum reaction rate in good approximation occursat a fixed fraction transformed an identical stage of thereaction can also be taken as the stage at which themaximum heat evolution is observed131138149 It shouldbe noted that this involves a further approximation
All isoconversion-Tf(b) methods involve the plottingof 1Tf versus a logarithmic function which dependsmostly on the heating rate the specific expressions forthe various isoconversion-Tf(b) methods are presentedin Table 2 (It should be noted that in several pre-1990 publications some authors133142 have derivedisoconversion-Tf(b) methods using an assumed kineticreaction model However in the 1990s it has beenshown129131 that such an assumption is not necessaryand hence earlier works133142 on the derivations ofisoconversion-Tf(b) models are now superseded)
Accuracies of isoconversion analysis methods
In order to arrive at recommendations as to which of themany methods for activation energy analysis is mostappropriate the accuracy of these methods needs to beanalysed These accuracies are determined by six factorsas follows120129
(i) Mathematical approximations type B isocon-version methods use approximations of thetemperature integral This approximationcauses inaccuracies which depend on the typeof approximation chosen as well as on y (5ERT)150 For the more accurate methods theseerrors are relatively small (less than 03 fory15 see Fig 24)
(ii) For all methods the temperature at constantamount transformed needs to be obtained fromthe measured data This is prone to slightinaccuracies due to limitation in the accuracyof the baseline determination and minor inac-curacies in the measurement of the sampletemperature (This error will be small formaximum rate methods)
(iii) Type A methods require experimental data onreaction rate at constant amount transformedThese data are prone to inaccuracies resulting
from a limitation in the accuracy of the baselinedetermination the determination of the tem-perature at constant amount transformed andsignal noise
(iv) Small fluctuations in the supposedly constantheating rate may cause errors in determinationof the heating rate
(v) In maximum rate methods the equivalent stagedefined by the maximum rate is not exactly atconstant amount transformed thus introducinga contribution to the errors148151152
(vi) All methods presume that the equilibrium stateis constant In some cases this assumption maynot hold and this introduces deviations in themeasured activation energies149153
The deviations introduced by these six factors have beenanalysed in some detail and for further details thereader is referred to the corresponding publica-tions120148149151152
In Table 2 the main characteristics of a range ofisoconversion methods are presented In the same tableestimates of the deviations introduced by error sources(i)ndash(v) are presented based on typical accuracies ofdeterminations of the main parameters for a typicalreaction in an Al based alloy For the latter data theanalysis of error sources (i)ndash(iii) is based on work by thepresent author120 and the analysis of error source (v) isbased on work by Criado and Ortega148 while errorsource (iv) was considered to be negligible in this case(These methods for calculation of accuracy are brieflysummarised in Appendix 1) Table 2 shows thataccuracies of E determination in the order of 1 shouldbe achievable provided one of the more accurateactivation isoconversion methods such as the type B-195 type B-192 or generalised Kissinger methods isused Also the Friedman type method can achieve goodaccuracies but this method is only recommended ifaccuracies of transformation rates or heat evolution inAl based alloys can be measured with an accuracy betterthan about 02120 which will mostly not be possiblefor thermally activated reactions in Al based alloys
Apart from the isoconversion methods a range ofother methods that either assume that a particularkinetic model holds andor that activation energies canbe derived from a single experiment at one single heatingrate have been suggested These methods have been
24 Relative error introduced by mathematical approxima-
tions in type B activation energy methods (adapted
from Ref 120)
Starink Analysis of Al based alloys by calorimetry
International Materials Reviews 2004 VOL 49 NO 3ndash4 209
Tab
le2
Iso
co
nvers
ion
meth
od
sfo
racti
vati
on
en
erg
yan
aly
sis
wit
hty
pic
al
so
urc
es
of
err
or
Main
sources
oferror
Lim
itofaccuracy
Method
Ref
Expression
Approx
(i)amp(v)
Approx
(ii)ndash(iv)
Recommendeduse
Applic
ation
Ozawa
136
137
lnb~
1 0518
E RTf
zC
2(i)(ii)
(iv)(vi)
71
Notrecommendeddueto
inaccuracies
only
tobeusedin
conjunctionwithcorrection
tables(seeFlynn150)
hellip
Boswell
138
145
lnb Tf
~
Ea
RTf
zC
2(i)(ii)
(iv)(vi)
41
Notrecommendeddueto
inaccuracies
hellip
Generalised
Kissinger
131
134
lnb T2 f
~
E RTf
zC
2(i)(ii)
(iv)(vi)
0 7
1Straightforw
ard
andpopularmethodwith
goodaccuracy
Eis
slopeofplotofln(T
2 fb)
versus1RTf
TypeB-1 95
120
lnb
T1 95
f
~
E RTf
zC
5(i)(ii)
(iv)(vi)
0 4
1Straightforw
ard
methodwithhighaccuracy
Eis
slopeofplotofln(T
1 95
fb)
versus1RTf
TypeB-1 92
120
lnb
T1 92
f
~1 0008
E RTf
zC
6(i)(ii)
(iv)(vi)
0 25
1Straightforw
ard
methodwithvery
highaccuracy
Eis
slopeofplotofln(T
1 92
fb)
versus1 0008RTf
Starink
129
lnb
T1 8
f
~
Eslope
RTf
zC
5
E~
Eslope
1 007
1 2Eslope
105kJmol
1
1
(i)(ii)
(iv)(vi)
0 2
1Very
highaccuracyifTfcanbedeterm
ined
withvery
highaccuracy(toabout0 1
K)
Firstobtain
Eslfrom
slopeof
plots
ofln(T
1 8fb)versus1RTf
thenobtain
Efrom
correction
factorequation
Lyonmethod
122
d(lnb)
d(1=Tf)
E Rz2T
(i)(ii)
(iv)(vi)
0 7
1Anindirectmethodwithgoodaccuracy
Firstobtain
slopeofplots
ofln(b)
versus1T
fthenuseaverageT
toobtain
EKissingerpeak
reactionrate
131
133
lnb T2 p
~
Ea
RTp
zC
2(i)(ii)
(iv)(v)
(vi)
1 2
0 5
RecommendedifTfvaluescannotbe
determ
inedaccurately
dueto
overlapping
heateffectsGoodaccuracy
Eis
slopeofplots
ofln(T
2 pb)
versus1RTp
TypeB-1 95
peak
120
lnb
T1 95
p
~
E RTp
zC
2(i)(ii)
(iv)(v)
(vi)
1 1
0 5
RecommendedifTfvaluescannotbe
determ
inedaccurately
dueto
overlapping
heateffectsHighaccuracy
Eis
theslopeofplots
ofln(T
1 95
pb)
versus1RTp
Friedman
139
38
lnda
dT
b
~
Ea
RTf
zC
(ii)(iv)
(vi)
01 2
Recommendedonly
ifdadT(5
q)values
canbedeterm
inedvery
accurately
(typically
anaccuracybetterthan0 2
isrequired120)
Eis
theslopeofplots
of2ln(bdadT)
versus1RTf
LiandTang
140
Integralform
ulationbased
ontheFriedmanmethod
(ii)(iv)
(vi)
01 2
Recommendedonly
ifdadT(5
q)values
canbedeterm
inedvery
accurately
Numericalintegrationmethod
(seeRef140)
Tfis
thetemperature
atafixedamounttransform
edandTpis
thetemperature
atmaxim
um
reactionrate
Lim
itofaccuracyassuming
aquadraticsummationoferrors
dueto
sourcesgivenerrorcalculationsindicatedin
Refs120148149151152errorsources(i)and(v)are
takenasthemaxim
um
encounteredfor15y60errorsources(ii)ndash(iv)are
estimatedbyassuming1
accuracyin
determ
inationofdadt0 5
Kaccuracyindeterm
iningTf0 25Kaccuracyin
determ
iningTprangeofTfTptaken
as50Kwithreactionsoccurringaround500K
Starink Analysis of Al based alloys by calorimetry
210 International Materials Reviews 2004 VOL 49 NO 3ndash4
tested and reviewed by various authors143154155 and arefound to be generally unreliable especially for solid statereactions where the reaction kinetic model is generallycomplicated and often unknown
Measured activation energies in Al based alloys
Calorimetry and especially DSC have been usedextensively to determine activation energies of thermallyactivated reactions in Al based alloys Observed activa-tion energies for precipitation reactions that occur atabout 200ndash300uC tend to be close to the activationenergy for diffusion at equilibrium vacancy concentra-tion of the rate determining precipitating element (forthe most common alloying elements Cu Mg Si this isabout 120ndash135 kJ mol21 Ref 156) Precipitation reac-tions involving elements with higher activation energiessuch as Fe and Cr occur at higher temperatures(typically 300ndash400uC) and activation energies for thesereactions are generally in line with activation energiesfor diffusion (As Fe and Cr have very low solubilities inAl solid solutions can only be obtained through rapidsolidification or ball milling) For example in nanos-tructured Al93Fe3Cr2Ti2 alloys prepared via ball millingof elemental powders the activation energy for pre-cipitation of Al6Fe is 203 kJ mol21 whereas that for theprecipitation of Al13Fe4 and Al13Cr2 is 228 kJ mol21
(Ref 74) These activation energies are close to theactivation energies for diffusion of Fe and Cr in fcc Al(about 190 and 240 kJ mol21 Ref 74)
For precipitation reactions in quenched materials thatoccur at temperatures below about 150uC the measuredactivation energies are mostly about 55ndash70 kJ mol21These values are considerably lower than the activationenergy for diffusion of alloying elements in Al andthis difference is generally ascribed to the presence ofvacancies with two possible arguments generally beingcited If vacancies are key to the formation of the zonesor clusters then the activation energy for migration of(mono) vacancies (about 60 kJ mol21 in pure Al157158)can be determining the activation energy of the overallprocess It has also been considered that the presenceof substantial amounts of excess vacancies reduces theactivation energy for diffusion of alloying elements Thisis because the activation energy for diffusion is the sumof the activation energy for creation of a vacancy andthe activation energy for the migration of the alloyingelement into the vacancy and in the presence of excessvacancies the former term is effectively zero Thusactivation energies for formation of zones and clusters atlow temperatures are ascribed to the activation energyfor migration in the presence of an excess amount ofvacancies
In dissolution reactions the solvus concentrationchanges during the heating and hence the equilibriumstate is not constant Thus the activation energymethods outlined above are not valid The consequencesof applying activation energy analysis can be illustratedby considering the data on dissolution of d9 in AlndashLialloys at various heating rates (Fig 8) These data showthat in the limit for decreasing heating rates the DSCcurves converge indicating that for low heating rates thedissolution reaction is determined mostly by themetastable equilibrium solvus (In fact Noble andBray42 used this to determine the metastable equilibriumsolvus) If an activation energy analysis method were to
be applied the apparent activation energy for lowheating rates would be infinitely large and also at higherheating rates very high apparent activation energieswould be observed Notwithstanding the questionablevalidity activation energy analysis methods have beenapplied to dissolution reactions In line with the aboveconsideration the activation energy found is in generalsubstantially larger than the activation energy for diffu-sion at equilibrium vacancy concentration159 Interestingexamples of such a questionable approach are providedby Dorward70 and Kamp160 who both applied activationenergy analysis to the dissolution effect of the mainstrengthening phase in AlndashZnndashMgndashCu alloys (a 7050(Alndash645Znndash21Mgndash215Cu wt- Alndash28Znndash245Mgndash095Cu at-) and a 7449 alloy respectively) Thisdissolution effect is effect II in Fig 13 For the overaged7050 alloy this reaction occurs at about 210ndash230uCand the activation energy was determined70 to be135 kJ mol21 while for the 7449-T6 alloy the peak inthe dissolution reaction occurred at 180ndash200uC and theactivation energy was determined160 to be 70iexcl7 kJ mol21 Clearly the two activation energies arequite different and the processes cannot be ascribed to asingle thermally activated process such as diffusion ofMg or Zn In both cases the apparent activation energyis likely to have been influenced by the coarseningreaction (effect III) which effectively determines the endof effect II As the activation energy for coarsening isequal to the activation energy for diffusion this canexplain why in this case the apparent activation energydetermined from a dissolution reaction remains limited
Few measurements of the activation energy forrecovery have appeared in the literature One paper73
determined the activation energy for recovery in aball milled AlndashMg powder alloy to be about 121ndash124 kJ mol21 In this material the activation energyfor recrystallisation was considerably higher 189ndash195 kJ mol21 The activation energy for recoverythrough the process of internal strain release in amechanically alloyed Al93Fe3Ti2Cr2 powder (effect 1 inFig 15) was determined74 to be 112 kJ mol21
For devitrivication of amorphous Al based alloysthe three exothermic reactions have been observed tohave activation energies of 233iexcl10 156iexcl10 and174iexcl10 kJ mol21 in a melt spun Al70Ni13Si17 (at-)alloy161 and 148 336 and 274 kJ mol21 in gas atomisedAl85Ni10Y25La25 alloy powder
162 In the latter alloy thethree activation energies are close to the activationenergies for self-diffusion La diffusion in Al and Nidiffusion in Al suggesting that these three processes arerate controlling for the three reactions162 Activationenergies of devitrivication are strongly dependent oncomposition for example for the three alloysAl90Ni4Sm6 Al88Ni6Sm6 Al88Ni4Sm8 in Fig 16 thefirst reaction was found82 to have activation energies220iexcl20 320iexcl20 and 360iexcl20 kJ mol21 respectivelybut in AlNi7Nd3Cu3 the activation energy for thisprimary recrystallisation is much lower at 138iexcl10 kJ mol21 (Ref 76)
It is noted that for some of the activation energiescited above no error limits were provided in the originalpapers It is hoped that the analysis provided in theprevious subsection and elsewhere120 will contribute tomore consistent analyses of error limits in measuredactivation energies
Starink Analysis of Al based alloys by calorimetry
International Materials Reviews 2004 VOL 49 NO 3ndash4 211
Single stage reaction modelsJMAK mean field and other models compatible withdadt5f(a)k(T)
Having obtained the activation energy for a thermallyactivated reaction the next step in obtaining a fulldescription of the reaction is the determination of thereaction model f(a) Various proposed functions f(a) aregiven in Table 1 and in many cases the analysis can becompleted simply by determining which of the modelsfits best to the data From the reactions listed in thistable the JMAK model is the one most often invokedfor thermally activated reactions in Al based alloyseven to the extent that in many publications163164 theanalyses of precipitation and recrystallisation reactionsare simplified by only considering the JMAK modelAlso calorimetry data on reactions in multilayersare generally investigated using the JMAK model786
In such an approach the determination of the reac-tion model f(a) is reduced to finding the Avramiexponent n
The procedure for analysing isothermal data underthe assumption that the JMAK kinetics is applicableuses the combination of equations (6)ndash(8) or the integralformulation of the JMAK equation (see Table 1) Forlinear heating experiments the temperature integralneeds to be approximated Descriptions of this havebeen provided by various authors86163164 we will hereuse a description that applies the Murray and White126
approximation to yield165
a~1exp(vn) (30)
with
v~RT2
Ebk(T) (31)
From the above two equations the expression for thereaction rate during linear heating is164
da
dt~nv exp(vn)
2
Tz
E
RT2
(32)
The value of n is characteristic for the type of reac-tion Its value can be derived from considering thefollowing
N In reactions in which the interface between reactionproduct and reactant has a constant velocity thevolume of a growing nucleus is initially (beforeimpingement has a significant influence) proportionalto the time to the power Ndim where Ndim is thenumber of dimensions into which the reactionproduct is growing ie for a growing sphere Ndim is3 for a growing cylinder with fixed length that ismuch larger than its radius Ndim is 2
N In diffusion controlled reactions the position of theinterface is a function of the square root of time andhence the volume of the reaction product growsinitially as tNdim2
Thus if nucleation during the course of the reaction isnegligible the equation for n is116149
n~Ndimg (33)
where g is 1 for linear growth or 12 for para-bolic (diffusion controlled) growth It can further beshown116 that the influence of continuous nucleationis to increase n by 1 and hence the general equation
for n is
n~NdimgzB (34)
where B is 0 in the case of site saturation (no nucleationduring the transformation) or 1 for continuous nuclea-tion (at constant nucleation rate)
While it is often assumed that the (generalised) JMAKmodel is valid for solid state reactions includingprecipitation and recrystallisation there have been manyreports of thermally activated solid state reactions thatdo not obey the JMAK model11166ndash175 Deviations fromJMAK kinetics usually involve a reduced reaction ratein the later stages of the transformation which is oftendetected as a deviation from the straight line expected inan Avrami plot (graph of ln[2ln(12a)] versus v) athigher fractions transformed This has instigatedresearch into deviations from the JMAK models and arange of approaches to deal with these deviations havebeen proposed Before reviewing these it is first notedthat recent theoretical work176177 has proven that theJMAK kinetic equation (including its treatment ofphantom nuclei178) is accurate for reactions with lineargrowth provided179
(i) product phases are randomly distributed
(ii) if nucleation occurs nuclei are randomlydistributed180ndash183
(iii) average growth rates are independent of posi-tion in the sample184
(iv) impingement on objects other than neighbour-ing domains of the product phase is negligible
(v) blocking resulting from anisotropic growth185ndash188
is negligible
(vi) the reaction is not influenced by any time-dependent process not directly related to thetransformation studied (eg recrystallisationbeing influenced by recovery)
(vii) the equilibrium state is constant ie the amountthat can transform does not depend on time(this assumption can break down under non-isothermal conditions)
Hence deviations from JMAK kinetics can only occur ifone or more of these preconditions are not satisfied
For diffusion controlled growth reactions the growthrate is initially proportional to the square root oftime (so-called parabolic growth) and impingement ofdiffusion fields around randomly distributed precipitates(so-called soft impingement) is an extremely complexmathematical problem Various researchers have usedsimplifications and approximations and generallyobserve that JMAK kinetics is a good approximationfor diffusion controlled transformations with highsupersaturation which conform to assumptions (i)ndash(vii) even though the JMAK type treatment ofimpingement is not valid179 Early work by Ham189190
has shown that for precipitates on a regular cubic arraygrowing in three dimensions JMAK kinetics is accurateup to a transformed fraction of about 07 to 08 whilefor later stages the reaction is slightly slower thanJMAK kinetics Also Monte Carlo simulations of thetransformations of grains which grow according to adiffusion controlled mechanism (ie growth rate isproportional to the inverse of the particle radius)indicate that JMAK kinetics is a good approximationfor diffusion controlled transformations191 A similarconclusion was reached by Uebele and Hermann192 who
Starink Analysis of Al based alloys by calorimetry
212 International Materials Reviews 2004 VOL 49 NO 3ndash4
approximated diffusion controlled growth in a mathe-matical model which considers parabolic growth andhard impingement Diffusion controlled growth reac-tions are further discussed at the end of this section andin Appendix 2
It has been shown179 that if any of preconditions (i)ndash(v) are not met this will in most cases result in a reactionfor which the fraction transformed initially conforms toJMAK kinetics while the reaction rate for later stages isreduced as compared to the JMAK kinetics A widerange of approaches dealing with kinetics of precipita-tion and recrystallisation reactions incorporating varia-tions from the JMAK model have been proposed Thesemethods include numerical simulation methods whichrequire substantial computing time such as MonteCarlo and cellular automata methods applied to recry-stallisation193 and numerical methods for precipitationbased on simulations of diffusion fields194 and meanfield approximations195ndash199 Results of these simulationsand iterative methods can be compared with calorimetrydata but the simulations depend on the availability ofvarious parameters and hence they are not flexibleanalysis methods that can be employed to analysereactions for which certain characteristics are at theoutset unknown Hence these simulations will not beconsidered here for a detailed overview of thesemethods the reader is referred to the papers cited aboveand the overview of modelling and simulation ofrecrystallisation by Rollett193 Instead in the remainderof this section attention is given to models that can beapplied directly to analysis of transformation rate dataon reactions for which no accurate simulations areavailable and to recent models which are relevant to theunderstanding of such methods The emphasis will be onmodels for precipitation devitrivication and recrystalli-sation reactions which have either been recently derivedor have recently attracted increased attention and whichhave been reported to be able to deal with deviationsfrom JMAK kinetics The model by Woldt200 considersrecrystallisation the models by Yavari and Negri174 andGangopadhyay et al201 consider nanocrystallisationduring devitrivication Keltonrsquos model202203 considerstransformations that involve coupled fluxes of interfacialattachment and long-range diffusion the mean fieldmodel considers precipitation and the work by Starinkand Zahra170 describes a kinetic equation that can bevalid for a range of reaction types
In an attempt to find an explanation for deviationsfrom JMAK kinetics observed for recrystallisation ofseveral metals and alloys Woldt200 presented a modelfor primary recrystallisation which includes two drasticmodifications with respect to JMAK kinetics a nuclea-tion rate related to the size of the interfacial area ofthe recrystallised grains present and an exponentiallydecreasing growth rate for each grain Thus the Woldtmodel modifies the assumption of linear growth andmodifies precondition (ii) The resulting mathematicaltreatment provides solutions for fractions transformedin an iterative scheme ie no direct closed formsolutions for the model are available Some limitedevidence on nucleation of grains at the recrystalliseddeformed interface in Cundash5Al (wt-) and nucleationrates in pure Cu at the surface of a recrystallising SEMsample was presented which is in line with the modi-fications and computed transformation rates indeed
show a resemblance to measured recrystallisation ratesHowever as yet the model has not been quantitativelyverified on recrystallisation in material away fromsample edges nor has it found any application beyondthe paper in which it was first introduced Thus beforethis model for recrystallisation can be confidently usedfurther work is needed to verify its basic assumptions Itshould also be noted that the approach by Woldt200 is byno means the only approach that can quantitativelyexplain the slowing down of the reaction in the laterstages For example it has been shown179 that if any ofpreconditions (i)ndash(v) are not met this will in most casesresult in a reaction for which the transformation rate inthe later stages is reduced as compared to the JMAKkinetics Both Sun et al184 and Starink179 consideredthe case of a transformation with growth rates andnucleation rates that are position dependent and foundresulting kinetics very similar to predictions by Woldtrsquosmodel In practical terms the non-transparent nature ofthe model caused by the extensive calculations that areneeded to obtain solutions can further hamper itsapplication
Even though nanocrystallisation in an amorphousFinimet (Fe735Cu1Nb3Si135B9) alloy has been investi-gated by JMAK type expressions204 it is mostlyaccepted that deviations from JMAK kinetics frequentlyoccur These deviations from JMAK kinetics observedin nanocrystallisation of amorphous alloys have beeninvestigated by Yavari and Negri174 and byGangopadhyay et al201 The work by Yavari andNegri174 indicates that in Fe based amorphous alloysrejection of solute from the growing nanocrystal willcause diffusion to become significant and that inclusionof the variation of the nucleation frequencies duringthe transformation process is needed if coherent resultsare to be obtained from an analysis of transformationkinetics It was indicated that this analysis should alsobe applicable to nanocrystallisation of amorphous Albased alloys but no detailed model was presented bythese authors Gangopadhyay et al201 observed thatJMAK failed to provide an adequate description ofnanocrystallisation during devitrivication of melt spunAl88Gd6La2Ni4 and that Avrami plots showed at leastthree regions with different slope They suggested amodel in which the nanocrystals grow in a diffusioncontrolled reaction with each crystal growing in an areawith a conical shape This model results in transforma-tion kinetics that initially follow JMAK kinetics andin later stages a slowing down with respect to JMAKkinetics occurs The Avrami plot shows two linearstages which resembles the observation on theAl88Gd6La2Ni4 alloy However the unusual geometryof the diffusion field makes it unlikely that the modelhas general validity
Kelton202203 constructed a kinetic model for nuclea-tion that couples the stochastic fluxes of interfacialattachment and long-range diffusion and solved thiscoupled flux model numerically It was found that thesecoupled fluxes decrease the steady state nucleation rateand increase the induction time compared to theclassical theory It was shown that the model couldexplain many of the microstructural features andkinetics observed in devitrivication in metallic glassesespecially the nanocrystallisation process205 For exam-ple the model shows how different average n values
Starink Analysis of Al based alloys by calorimetry
International Materials Reviews 2004 VOL 49 NO 3ndash4 213
obtained from an Avrami analysis are directly relatedto the concentration of the solutions with n increasingwith concentration The coupled flux model alsocaptures the decrease in apparent n with progress ofthe reaction which is a direct consequence of thelong-range diffusion becoming a dominant factor in thelater stages While the model is successful and cancapture many of the aspects of the kinetics ofnanocrystallisation no direct application to analysis oftransformation data such as obtained through calori-metry has as yet been presented The need for numericalsolution of the coupled flux equations will probably limitthe modelrsquos applicability to analysing transformationdata
In a broad sense all models discussed so far areconsistent with the approach described by equation (6)ie for each set of parameters in the respective modelsin principle a function f(a) can be identified but thephilosophies are different For the coupled flux modeldefining f(a) would involve defining interfacial freeenergy diffusion rate start composition metastableequilibrium composition at the interface with thenucleus and driving free energy and also in Woldtrsquosmodel a range of parameters would need to be definedbefore f(a) could be identified Thus the philosophiesbehind the approaches are very different and it isunlikely that the Kelton and Woldt models will be usedfor analysis of calorimetry data through defining f(a) Amore fruitful approach to the relation between thesemodels and calorimetry would be to use calorimetry totry to verify the models but no such work has beenpublished as yet
Starink and Zahra170 also noted the deviationsbetween the JMAK model and data on a range of trans-formations including recrystallisation and precipitationreactions and devised a model to deal with this Incontrast with the type of modelling approaches used byKelton and Woldt the approach taken was specificallyaimed at obtaining a closed form solution to thetransformation rate and the reaction function f(a) andto apply this directly to the analysis of calorimetry dataThe resulting model has been consistently successfulin describing precipitation reactions in Al based alloysand selected other alloys and although no studies ofapplication to recrystallisation have been published thegeneral trends in deviations from JMAK kinetics forrecrystallisation reactions can also be captured by themodel The model contains an approximation forimpingement that deviates from the JMAK treatmentof impingement using the equation170179
a~1aextgi
z1
gi
(35)
where a is the fraction transformed gi is the impinge-ment exponent and aext is the extended fractiontransformed As in the JMAK model aext can be takenas v and equals (kt)n for isothermal reactions Theresulting reaction function f(a) for the model is
f (a)~nfrac12(1a)1=gi1(n1)=n(1a)(giz1)=gi (35a)
Equations (35) and (35a) incorporate the JMAK modelas in the limit of giRlsquo both are identical to thecorresponding JMAK expressions While initially theapplication of equation (35) with an adjustable impinge-ment exponent was purely based on a good fit with
experimental data some new theoretical work andcomparisons with existing theoretical work later showedthat equation (35) can provide good approximations fortransformations in which deviations from the JMAKassumptions (i)ndash(vi) occur179
A further approach which is applied to the modellingof precipitation reactions is the mean field model Thisapproach considers that the influence of the impinge-ment of diffusion field on the growth rate of precipitatesof radius R(t) can be described by considering theaverage solute content of the matrix through190206
dR(t)
dt~
cm_c (t)
cpcm
D
R(t)(36)
where D is the diffusivity c(t) is the average solutecontent of the matrix and cp and cm are the precipitateand matrix compositions at the interface This equationforms the basis of computer based iterative approachesto the modelling of precipitation in which the timeevolution of the sizes of a collection of particles iscalculated It can be shown that approaches based onequation (36) are consistent with the approach based onequations (6) and (7) and specifically that for a reactionwith a dilute solution and a fixed number of particlespresent equation (36) yields nearly exactly the same asequation (35) with gi5567 and n515 (see Appendix 2)Also for less dilute solutions equation (35) with n515provides a very high accuracy approximate solutionto equation (36) Thus the mean field model for preci-pitation is generally not consistent with the JMAKmodel but is in good approximation consistent withequation (35)
It appears clear that the analysis of the mean fieldmodel casts some severe doubts on the widespreadpractice of analysing precipitation reactions using theJMAK model and especially for the later stages of thereaction such an analysis can be expected to becomeinvalid The StarinkndashZahra equation is flexible andencompasses JMAK kinetics the mean field model forprecipitation and a range of deviations from JMAKkinetics which occur in parabolic growth and lineargrowth reactions
Other models for precipitation in Al based alloys
The approach based solely on equations (6) and (7) incombination with the table of f(a) functions (Table 1) or amore restricted selection of functions can in many casesbe inappropriate Especially for precipitation reactionsstudied by DSC it is found that that the retrogradesolubility curve will have a significant effect on theprecipitation rates in the later stages of the reaction andthis invalidates fitting of the standard f(a) functionsHence a number of approaches have appeared in theliterature which either circumvent this problem by onlyconsidering the start of the reaction or which attempt toaccount for the retrograde solvus
One treatment207 of thermally activated reactions inthe presence of a retrograde solvus starts by taking thebasic equations (6) and (7) and considering that inisothermal experiments a is generally assumed to begiven by
a~x(t)
xend(37)
where x(t) is the amount precipitated at time t and
Starink Analysis of Al based alloys by calorimetry
214 International Materials Reviews 2004 VOL 49 NO 3ndash4
xend is the total amount that can precipitate at T Itwas realised that because of the temperature depend-ent solubility of alloying elements in the Al richphase the transformation rate cannot be the productof two separate functions and the function f(a) inequation (6) must be dependent on the temperatureThis was achieved in a general way by defining thefollowing four equations (38)ndash(41) to replace equa-tions (6) and (7)
j~x(t)
xmax(38)
and
a0~x(t)=xeq(T) (39)
in which xeq(T) is the maximum amount that canprecipitate at a given temperature ie
xeq(T)~ limt
x(tT)
and xmax is a constant representing the maximumamount of material that can transform ie the maxi-mum value that xeq(T) can attain The transformationrate equation is now assumed to be
dj
dt~k(T)f 0(jT) (40)
For the kinetic model term f 9(jT) the Sestak andBerggren115 equation was modified to yield an equationthat incorporates the temperature dependency of xeq(T)
f 0(jT)~(1a0)p1(1j)p2frac12ln(1a0)q1
|frac12ln(1j)q2 (41)
where p1 p2 q1 q2gt0 p1zp25p and q1zq25q
The above set of equations was applied to data onprecipitation in Alndash1Si (at-) alloys The solubility of Siin the Al phase is well known and can be described by208
cSi(T)~c exp DHSi
RT
(42)
where clsquo519 and the enthalpy of solution DHSi5
052 eV Hence
xeq~xmaxcSi(T) (43)
xmax5001 The results of the fitting of the DSC curvesfor Alndash1Si (at-) using this approach are presented inFig 25 The fitted curves in general show a goodcorrespondence with the measured DSC curves andin particular capture well the rapid transition fromexothermic to endothermic heat flow without a flat partof the curve with zero heat flow Notwithstanding thegood fit displayed in Fig 25 this approach has somemajor drawbacks most notably that the parameters pand q cannot be directly interpreted in terms of thereaction occurring in the material ie in terms of theclassification proposed above (in lsquoIntroduction generalobjectivesrsquo) this model is a generic model with a physicalbasis that is unclear As a consequence the model hasnot seen any application beyond the paper in which itwas introduced and more recent models (see below)have attempted to include physically meaningful para-meters in the model
Another model for analysing and fitting precipitationeffects in Al based alloys during linear heating was
proposed by Borrego and Gonzalez-Doncel209 in astudy of 6061-Al15 vol-SiCw PM composites Themain part of the model is identical to the JMAK modelfor the linear heating case164 ie equation (30) isadopted with the equation for the state variable forlinear heating
v~
ethko exp
Ea
kBT
dtamp
T2R
bEa
ko exp Ea
RT
(44)
As shown above the reaction rate can be obtained bydifferentiation yielding equation (32) or the variantgiven by Borrego and Gonzalez-Doncel209
da
dt~n
dv
dtvn1 exp(vn) (45)
This reaction rate should be proportional to the heateffect measured in the DSC and hence the aboveequations represent a theoretical model in closed formand with parameters ko Ea and n that can be fitted toDSC data Novel in the approach is that the nucleationrate I(t) of precipitates is assumed to be given by
I(t)~ctqN exp DEn
kBT
(46)
where DEn is the activation energy for nucleation andexponent qN is constant The BorregondashGonzalez-Doncelmodel was fitted to DSC data on the precipitation in6061 (AlndashSindashMg) alloys and an example of the results ispresented in Fig 26 As has been noted elsewhere210 thequality of the fit is limited suggesting that the model isnot particularly suited to describe precipitation in theseAlndashSindashMg alloys Borrego and Gonzalez-Doncel laterexpanded their model to allow an n value that variesduring the progress of the reaction211 This allowedhighly accurate fits to DSC data but this introduction ofadditional fittable parameters without experimentalverification of the physical basis has attracted criti-cism210 The Borrego and Gonzalez-Doncel models havenot been applied to Al based alloys beyond the papers inwhich they were initially introduced but have beenapplied in other alloys212ndash214 (In one of the studies212 itwas observed that lsquoa slight misfit between both experi-mental and theoretical DSC curves [] is observed at theend of the first peakrsquo while fits in other works213 are lessperfect than has been achieved with other models)
curve 1 25 K min21 curve 2 10 K min21 curve 3
20 K min21 curve 4 40 K min21
25 Experimental (dotteddashed lines) and computer gen-
erated (solid lines) DSC curves obtained using equa-
tions (40)ndash(43) and heating rates of 25 10 20 and
40 K min21 (from Ref 207)
Starink Analysis of Al based alloys by calorimetry
International Materials Reviews 2004 VOL 49 NO 3ndash4 215
Also the approach of an adjustable impingementfactor has been applied in the derivation of a modelfor precipitation and recrystallisation For this modelaext was obtained on the basis of the temperatureintegral (see also the section devoted to multistagemodels below)
aextbR
EG
kc expEeff
RT
T
b
2( )s
(47)
where T is the temperature s is the transformationexponent Eeff is the effective activation energy and kcis a (pre-exponential) constant Within the model alsothe variation of the (metastable-) equilibrium state withtemperature is accounted for by using
j~
dj
dt~
d
dtacoceq(T)
co
A2 (48)
where j is the amount of atoms incorporated in thegrowing nuclei divided by the maximum amount ofatoms that can be incorporated according to theequilibrium phase diagram co is the initial concentrationof alloying element dissolved and A2 is a constant TheDSC signal is proportional to j The term ceq(T) isapproximated by regular solution expressions
ceq(T)~c exp DH
RT
(49)
where clsquo is a constant and DH is the enthalpy ofsolution The model has been applied to the analysis ofDSC effects of precipitation in Al based alloys andgenerally good correspondence between model and datahas been observed113946170210
Determination of reaction exponent n
In many cases of the analysis of thermally activated solidstate reactions the objective is to derive all threeelements of the kinetic triplet and hence if the reactioncorresponds to JMAK kinetics or StarinkndashZahrakinetics the reaction exponent n will be obtained in
the course of this procedure However instead ofobtaining the full expression for f(a) in some cases theanalysis can be limited to just obtaining n withoutconsidering the full expression for f(a) Such a morelimited analysis can be enforced if the later parts of thereaction cannot be analysed due to excessive overlapwith a subsequent reaction or if no satisfactory descrip-tion of the later stages of the reaction can be found usingthe standard expressions for f(a)
Several methods to derive the reaction exponent nfor reactions occurring during linear heating havebeen proposed215ndash219 Some of these methods215ndash217219
pre-suppose that JMAK treatment of impingement isvalid and some methods217218 make use of Doylersquosapproximation123ndash125 for the temperature integral As itis clear from the above that both approximationsintroduce significant errors they are not reviewed hereand for a description of the well known derivation of nexponents for reactions that correspond to JMAKkinetics through the so-called Avrami plot (a graphof ln[2ln(12a)] versus v) the reader is referred tostandard works219 and various examples161205 Insteadhere a method170 for determining n that does not sufferfrom inaccurate approximations for the temperatureintegral and which is not limited to JMAK kinetics isreviewed
We assume that for a narrow temperature range at thebeginning of the reaction both impingement and thevariation of the equilibrium state with the temperatureare negligible and for reactions that conform to JMAKStarinkndashZahra and mean field diffusion models we mayapproximate (see equation (47))
A3jaextbR
EGkc exp
Eeff
RT
T
b
2( )n
(50)
where A3 and subsequent A4 to A8 are constants(different symbols s and n were used to allow for thepossibility that linear heating and isothermal pathswould yield different transformation exponents) Takingthe logarithm yields
ln jnEeff
RTz2n ln TzA4 (51)
As the variation in nlnT is generally much smaller thanthe variation in EeffRT we may approximate
Rd ln j
d(1=T)n(Eeffz2RTav) (52)
where Tav stands for the average temperature of the(narrow) temperature range considered Thus n can beobtained from the slope of a plot of ln j versus2EeffRT It is further noted that as a result of takingthe logarithm and the derivative we may in equa-tion (52) insert any variable proportional to j in placeof j For DSC this means that we can use the integratedevolved heat DQ(T) instead of j
For a derivative type thermal analysis method likeDSC the signal is proportional to djdt and to obtain nwithout the need for integration we can calculate thederivative of equation (50) and subsequently take thelogarithm which yields
lnj
nEeff
RTzln
Eeff
Rz2T
z2(n1) ln TzA6 (53)
26 Part of DSC curve for solution treated 6061 alloy
showing precipitation effects due to b0 and b9 phase
thick grey curve represents experimental DSC data
thinner curves are model fits (obtained with impinge-
ment exponents gi1525 gi253 and transformation
exponents s15s2525) from StarinkndashZahra model and
sum of the two is given by zzzz (from Ref 210
note that due to near perfect fit curves cannot be
distinguished over substantial sections)
Starink Analysis of Al based alloys by calorimetry
216 International Materials Reviews 2004 VOL 49 NO 3ndash4
Considering again that the variation in lnT is generallymuch smaller than the variation in EeffRT djdtmay beplotted versus 2EeffRT and n can be obtained from theslope using
Rd ln
j
d(1=T)nEeffRT 2(n1)z
Eeff
2RTz1
1( )
(54)
n(Eeffz2RT)RT 2zEeff
2RTz1
1( )
(55)
Using EeffRTamp1 the second term on the right-hand side in equation (55) is much smaller than thefirst and thus one can obtain the following usefulapproximation
Rd ln j
d(1=T)n(Eeffz2RTav)ampR
d lnj
d(1=T)(56)
However as indicated by the use of the lt symbol thelatter approximation in this equation is less accuratethan the first A significantly better approximation ofequation (54) is
Rd ln
j
d(1=T)n(Eeffz2RTav)z2RTav (57)
Here we have again neglected the variation in T over thetemperature interval and used Tav From equation (57)it follows that n can be obtained from the slope of a plotof ln(djdt) versus 1T In equation (57) we may insertany variable proportional to djdt in place of djdt ForDSC this means that we can use the heat flow q(T)instead of djdt
As examples of application precipitation in slowlycooled Alndash6Si (at-) GPB zone formation in AlndashCundashMg based alloys and recrystallisation of deformed fccmetals were analysed170 For the slowly cooled Alndash6Si(at-) precipitation of Si starts with a process forwhich s505 indicating growth of undissolved coarse Siparticles It was further shown170 that in AlndashCundashMg andAlndashCundashMgndashLindashZr GPB zone formation occurs mainlyvia the growth of pre-existing nuclei (n515) while inAlndashCundashMgndashZr it occurs via nucleation and growth(n525) Also recrystallisation of deformed Ag and Cucould be analysed successfully170
Multistage models (multiple Arrhenius terms)The above treatment of the temperature integral isimportant in analysis and modelling of reactions thatare governed by a single thermally activated processwhich are related to a single activation energy Such aprocess is said to exhibit an isokinetic relationship(IKR)220 However many processes do not complywith these requirements or only comply in approxima-tion be it a good or a less accurate approximation Totreat processes that do not exhibit isokinetic behaviourapproaches in which multiple processes with a rangeof activation energies occur have been proposed Theseapproaches in general lead to transformations thatcannot be approximated by an isokinetic process andwhich cannot be described by a single state variable Onetype of process for which the thermal activation canoften not be described by a single activation energy isa nucleation and growth reaction A characteristic of
this type of two-stage process that sets it aside from othertwo-stage processes is that here the first stage nucleationdoes in itself not lead to substantial amounts oftransformed material as only growth of the nuclei causesthe transformation of substantial amounts of material Inthis case it can be shown that under specific conditions theoverall process shows a behaviour that is in goodapproximation isokinetic and a treatment for thistwo-process reaction has been described by Woldt andco-workers215221 In the Woldt approach both thenucleation rate I(T) and the growth rate are assumed tofollow an Arrhenius type temperature dependency (seealso Kruger216 and de Bruijn et al222)
G(T)~Go expEG
RT
(58)
I(T)~Io expEN
RT
(59)
where EG and EN are the activation energies for growth andnucleation respectively The latter equation implies thatnucleation depends only on themobility of atoms Especiallywhen the driving force for the formation of nuclei (ie thechange in Gibbs free energy due to the transformation of aregion) is small this may become invalid
We may now use the so-called extended volumeconcept to define the extent of the transformation Forthe present case it is given by
aext~
etht0
A1I(z)frac12G(tz)mdz (60)
where A1 is a constant which is related to the initialsupersaturation the dimensionality of the growth andthe mode of transformation while m is a constantrelated to the dimensionality of the growth and themode of transformation (diffusion controlled growth orlinear growth) If the difference between EG and EN issmall equations (58)ndash(60) lead to a relatively simpleexpression for aext (Refs 215 216)
aextbR
EG
kc expEeff
RT
T
b
2( )n
(61)
where
Eeff~mEGzEN
mz1(62)
n~mz1 (63)
and kc is a constant It should be noted that equa-tion (61) is an approximation which is only accurate ifENltEG
215221 and the deviation increases with increas-ing difference between EG and EN
221
One point that was not considered in the papers inwhich equations (61)ndash(63) were derived and analysed isthat an improvement in accuracy of calculation of aext canbe achieved by using the more accurate approximation ofthe temperature integral given by equation (23) Applyingthis approximation for the temperature integral leads to
aext 0786kcT
b
RT
EG
095
expEeff
RT
( )n
(64)
One important element of the above treatment lies in thefact that it shows that for a specific two-stage reaction
Starink Analysis of Al based alloys by calorimetry
International Materials Reviews 2004 VOL 49 NO 3ndash4 217
(nucleation and growth) with a specific temperaturedependence of the two stages (two Arrhenius typedependencies with ENltEG) the resulting transforma-tion can in most cases still be described accurately withone effective activation energy
Determination of volume fractions ofreaction products and phases
General objectivesThe volume fractions of precipitates and intermetallicphases in Al based alloys have a strong influence on theproperties such as yield strength work hardeningtoughness and conductivity In studies of Al basedalloys it is thus often necessary to determine the volumefractions of precipitates or intermetallic phases presentand to monitor the changes in the amounts of thesephases during thermomechanical or heat treatments ordetermine the influence of composition changes on theamounts of precipitates and intermetallic phases presentDepending on size of precipitate measurement ofvolume fraction of precipitates or intermetallic phasescan in many cases be achieved by optical microscopyor electron microscopy but these techniques can becumbersome In the case of TEM the volume that canbe studied is limited (to at best about 10610601 mm)and especially TEM can be prone to error It has beenshown in a range of publications that DSC can be anefficient method for determining average volume frac-tions of precipitates or intermetallic phases and thesemethods are reviewed in this section
Volume fractions of precipitates measuredfrom solidndashsolid reactionsA method for obtaining the volume fractions of theprecipitates based on the heat evolutions due to theprecipitation of the phases as measured by DSC hasbeen outlined in various works by Starink and co-workers2047223ndash225 (These methods were inspired byearly work by van Rooyen and Mittemeijer208) Themain step in the analysis is the assumption that the heatof formation or dissolution of a precipitate or inter-metallic phase is constant ie if a precipitate ofcomposition MmAaBbCc forms then the heat effectmeasured in the DSC is given by
DQMmAaBbCc~DxMmAaBbCc
DHMmAaBbCc(65)
where DQ represents the heat effect in the DSC Dxrepresents the amount of phase formed and DHrepresents the enthalpy of formation of that phase (perlsquomoleculersquo or unit of MmAaBbCc) The equation is alsovalid for dissolution reactions in which case the reactionis endothermic and DQ will be negative and as theamount of phase will reduce Dx will also be negativeTo be able to apply the method values of DH should beavailable Values of DH for specific phases can beobtained in two ways The first method is possible ifan experiment can be performed in which DQ can bemeasured and Dx is known an example being aprecipitation reaction for which initially all precipitatingelements are dissolved while the remaining amount insolution after completion of the exothermic heat releaseDQ can be determined from thermodynamic data fromother additional experiments A second method can
be applied when sufficient data on the thermodynamicfunctions (eg Gibbs free energy) are available tocalculate on a purely theoretical basis the change infree energy involved in the precipitation or dissolutionreaction While CALPHAD approaches should in prin-ciple be able to provide such data in practice nodetailed work using CALPHAD has been publishedand the derivation of DH values from thermodynamicdata has focused on an approach in which the thermo-dynamics of the system is simplified by assuming that aregular solution model approach is valid223226 Thisapproach makes use of the theoretical result that for aphase that is (partially) soluble in the matrix phaseand that adheres to the regular solution model thesolubilities c of the individual elements A B C etc aregiven by
(cA)a(cB)
b(cC)c~c1 exp
DH
RT
(66)
where DH is again the enthalpy of formation perMmAaBbCc unit R is the gas constant T is thetemperature and c1 is a constant Thus if sufficientand reliable solubility data are available DH can becalculated from that solubility data
Application of the method is most straightforwardwhen heat effects in the DSC curves are well separatedbut in practice overlap often occurs To be able toshow all steps necessary in the analysis application ofthe method is here reviewed by considering an examplefor an alloy that is relatively complex The exampleused is that of precipitation in AlndashCundashMgndashLi alloys andmetal matrix composites (MMCs) including a mono-lithic 8090 alloy (Alndash234Lindash125Cundash104Mgndash011Zrwt-) and three MMCs containing 20 wt-SiC parti-cles In these alloys two precipitation sequencesoccur132223227ndash229 One precipitation sequence involvesLi
Li in Al rich phased0d
where d9 is an L12 ordered phase (Al3Li) fully coherentwith the Al matrix and d is the equilibrium AlndashLi phase(AlLi bcc structure) which forms mainly at grainboundaries230 The second precipitation sequenceinvolves Cu and Mg1834231 and is represented as
Cu Mg in Al rich phase
(co-)clusters=GPB zonesS
where the cluster stage involves MgndashMg CundashCu as wellas CundashMg clusters34
The DSC curves obtained for an 8090 MMC aged forvarious times at 170uC are presented in Fig 27 For thisalloy the S precipitation effect (exothermic effectpeaking at about 300uC) decreases with aging timereflecting S precipitation during aging at 170uC (Asimilar change is observed for other AlndashCundashMg basedalloys see eg Fig 12) Also the heat contents of theother effects change during aging In order to calculatethe heat due to the formationdissolution of one specificprecipitate correction must be made for overlapbetween effects Correction methods can be devisedbased on assumptions of the kinetic model for thereaction In principle one might consider that thereaction follows a specific model (eg a JMAK model)and fit predicted transformation rates to parts of the
Starink Analysis of Al based alloys by calorimetry
218 International Materials Reviews 2004 VOL 49 NO 3ndash4
heat effect that appear to be not affected by overlap andthus derive the total heat evolved corrected for overlapIn practice such a cumbersome procedure is oftennot necessary and in the present example an overlapcorrection was based on the assumption that the peakheat flow always occurs at a constant fraction trans-formed223 The overlap-corrected values of the heatevolution of the phaseszones will be referred to as DQSp
(heat evolution due to S precipitation) DQd9d (heatevolution due to d9 dissolution) DQGPBd (heat evolutiondue to GPB zone dissolution) etc The amounts of GPBzones and d9 phase present can be obtained from
xGPB~DQGPBd
DHGPB(67)
xd0~DQd0d
DHd0(68)
where DHGPB and DHd9 are the heats of formation ofGPB zones and d9 phase respectively Due to overlapwith the exothermic effect caused by the formation of Licontaining oxides or nitrides on the surfaces of the DSCsamples the S dissolution effect cannot be measuredaccurately Hence the amount of semicoherent S formedduring aging is derived from the heat effect due to Sprecipitation using
xS~DQSp(WQ)DQSp(t)
DHS
(69)
This expression is valid because (i) TEM work showedthat in the water quenched (WQ) condition no S ispresent and (ii) the end temperature of the S precipita-tion is independent of isothermal aging time whichindicates that at the end of the S precipitation effect inthe DSC run (at 330uC in this example) the amount of Sphase present in the DSC samples is independent ofisothermal aging time
Using this method the amount of phases present inthe four alloys can be determined and data points arepresented in Fig 28 The results in this figure show thatthe amount of S phase forming is significantly reducedwhen the Li content of the alloy is reduced and alsoshows that the addition of ceramic reinforcement greatlyenhances the rate of formation of S phase The volumefractions of strengthening phases determined with themethod were used as input into a dislocation model for
the strengthening of these alloys and a good correspon-dence with measured data was observed232
While the analyses of volume fractions using calori-metry reviewed above generally provided results thatseemed reliable it should be noted that no direct proofof the proportionality of heat effect with volumefraction of phase was provided In order to providesuch a proof the volume fractions of phases measuredfrom an analysis of heat contents should be comparedwith volume fractions determined from a direct micro-scopy technique such as 3DAP TEM or if phasesare sufficiently coarse FEG-SEM (a high resolutionSEM with field emission gun) Unfortunately determi-nation of volume fractions of precipitates generallynecessitates 3DAP or TEM and determination ofvolume fractions with these techniques is not straight-forward and significant experimental uncertainties oreven systematic errors can arise Hence it is unlikelythat presently available techniques can provide aconclusive verification for the measurement of volumefractions by calorimetry In view of this it is relevant toconsider the preconditions for the proportionality ofheat effects to volume fractions of reaction productboth for precipitation reaction and in a more genericsense for transformations studied by calorimetry Forthis proportionality to hold it is required that in allsamples the same reaction occurs and thus it is requiredthat
(i) the composition of reacting phases must be thesame for all samples
(ii) the composition of the product phases must bethe same for all samples
(iii) the ratios of the different phases involved mustbe the same for all samples
Further conditions are(iv) the energy related to interfaces created in the
reaction must be negligible as compared to thetotal heat effect of the reaction or proportionalto the amount of phases formed
(v) the energy related to strains generated in thephases must be either negligible as compared tothe total heat effect of the reaction or propor-tional to the amount of phases formed
27 DSC curves of solution treated quenched and aged
809020 wt-SiCp MMC at 10 K min21 for various
aging times at 170uC (from Ref 132) 28 Amounts of semicoherent S phase present in water
quenched and aged alloys versus aging time at 170uC(MMCs all contain 20 wt-SiCp) data points from
method using DSC and curves from model fit (from
Ref 20)
Starink Analysis of Al based alloys by calorimetry
International Materials Reviews 2004 VOL 49 NO 3ndash4 219
(vi) any temperature dependence of DH should benegligible in the temperature range in whichheat effects occur
When considering precipitation reactions especiallyconditions (ii) (iv) and (v) need to be consideredcarefully For example if the composition of aprecipitate would change in the course of the trans-formation condition (ii) would not be satisfied and itwould have to be considered that the energy releaseper volume of precipitate formed will vary in the courseof the reaction Another example could be coherencystrain or strains in the matrix generated by precipitateswhich if they are related to substantial stored energywould contradict condition (v) Notwithstanding thewide range of preconditions no publications have asyet questioned the proportionality of heat evolved toamount of phase formed for precipitation reactions Oneexample that highlights complications is provided byDSC studies on melt spun hypoeutectic AlndashSi alloys208
In these rapidly solidified alloys Si is present bothdissolved in the Al rich phase and as very fine Siparticles and the heat effect due to coarsening of the fineSi particles during DSC is significant and partly over-lapping with the heat effect due to precipitation of SiThis example is one case in which condition (iv) is notsatisfied
Volume fractions crystallised duringdevitrivicationDifferential scanning calorimetry has been used exten-sively to analyse crystallisation during devitrivication ofrapidly solidified Al based alloys and some attemptshave been made to interpret changes in heat content ofthe devitrivication effects quantitatively in terms of thevolume fraction of amorphous phase formed For manyamorphous alloys DSC experiments reveal threeexothermic reactions that have been ascribed to
A amorphousa-Alzamorphous0
B amorphous0a-Alzintermetallic phases
C transformation of intermetallic phases
On isothermal aging at temperatures close to or belowthe peak of reaction A this reaction will occur and theeffects A and B in the DSC curves will change (Fig 29)To be able to quantitatively assess the volume fraction
of a-Al formed we need to consider that the twodevitrivication reactions A and B will have two differententhalpies of formation per mole a-Al formed If thereactions have a constant enthalpy of formation permole a-Al formed and only the reaction A hasprogressed the volume fraction of a-Al formed will begiven by
Va(tT)
1Vint
~frac12DQA(t~0)DQA(t)=DHA
frac12DQA(t~0)=DHAzfrac12DQB(t~0)=DHB
~DQA(t~0)DQA(t)
DQA(t~0)zfrac12DQB(t~0)=(DHA=DHB) (70)where Va is the volume fraction of a-Al Vint is thevolume fraction of intermetallic phases present afterreaction B DHA and DHB are the enthalpies of the tworeactions per mole a-Al formed No values for these twoenthalpies are known in the literature and henceapproximations have been made Gloriant et al233
investigated two methods to derive the volume fractionof a-Al phase formed in this isothermal aging In the firstmethod they considered that DHA5DHB and ignoredthe volume of the intermetallic phases which yields
Va~DQA(t~0)DQA(t)
DQA(t~0)zDQB(71)
However as the authors realised this method isunreliable as DHA in general should be differentfrom DHB and it was argued that especially thedifferent compositions of the matrix for the twodevitrivication reactions cause deviations from equa-tion (71) Comparison with 3DAP data on Va con-firmed that equation (71) is not accurate In asecond method the amount of a-Al phase formedduring the nanocrystallisation was considered to beproportional to the change of heat evolution in effect Athat occurs during the stage where the heat flow isreduced as a result of pre-aging ie the amount of a-Alphase formed would be proportional to the hatched areain Fig 30
Va~DQhatch
DQA(t~0)zDQB(72)
The results of the latter method indeed correspondedwell with volume fractions of a-Al phase obtained from3DAP analysis
It should be noted that even though results obtainedwith the latter method seem reasonable there is no
29 DSC curves at 40 K min21 of rapidly solidified amor-
phous Al88Ni4Sm8 alloy and Al88Ni4Sm8 aged for 30
and 60 min at 200uC (from Ref 233)
30 DSC curves at 40 K min21 of rapidly solidified amor-
phous Al88Ni4Sm8 alloy and Al88Ni4Sm8 that was aged
for 30 min at 200uC (from Ref 233)
Starink Analysis of Al based alloys by calorimetry
220 International Materials Reviews 2004 VOL 49 NO 3ndash4
proof that the method holds general validity In thepresent case where one phase (a-Al) is formed in tworeactions that are coupled and with different enthalpiesper mole transformed accurate analysis of fractionstransformed is possible only if the ratio DHADHB isknown
Volume fractions of intermetallic phasesmeasured from solidndashliquid reactionsUndissolvable intermetallic phases present in an Albased alloy will generally be coarse and these particleswill be detrimental for a range of properties mostnotably the toughness and the strength is also adverselyaffected Hence determination of the volume fractionof the undissolvable phases is often important Asshown above in the subsection lsquoHomogenisation andsolution treatment studiesrsquo the dissolution of interme-tallic phases can be monitored in a qualitative fashionthrough measuring the incipient melting effects of thesephases using DSC Some attempts have been made torelate these incipient melting effects quantitatively toamounts of phases Lasa and Rodriguez-Ibabe48 ana-lysed their DSC data on the incipient melting afterdifferent homogenisation treatments of two AlndashSindashCundashMg alloys that were cast using different procedures(Fig 11) The heat content of the incipient meltingeffects in the different samples was calculated throughintegration and these data were compared withmeasured volume fractions of Al2Cu phase obtainedfrom image analysis of backscattered SEM micrographsIt was found that in order to assure that the incipientmelting effect is a true reflection of the melting of phasespresent the dissolution of these phases during heatingneeded to be avoided and hence a very fast heating toabout 460uC followed by heating at a rate no lowerthan 10 K min21 was recommended According to theauthors the fractions of Al2Cu phase obtained fromanalysis of the incipient melting effect were lsquoin goodagreement with metallographic measurementsrsquo48 How-ever a closer look at Fig 31 shows that especially forthe thixoformed Alndash15Sindash44Cundash06Mg the two deter-minations of amounts of Al2Cu phase differ consider-ably and hence this work was unable to show that inthese alloys the heat content of the incipient meltingeffect was proportional to the amount of Al2Cu phase
For the heat contents of the incipient meltingreactions in a set of samples to be directly proportionalto amount of a specific phase present in the samplesall preconditions set out above in the discussion ofsolidndashsolid reactions must be satisfied and as interfacialenergies and strain energies can be expected to benegligible conditions (i)ndash(iii) especially are importantHence it is required that (i) the composition of reactingphases must be the same for all samples (ii) thecomposition of the product phases must be the samefor all samples and (iii) the ratios of the different phasesinvolved must be the same for all samples It would begenerally very difficult and time consuming to verifythese conditions However if all preconditions aremet the onset temperature of the reaction should beconstant and hence the onset temperature is anconvenient indicator for the validity of the conditionsFigure 11 shows that in the alloys studied the onsettemperature is not constant and hence we can expectthat one or more of conditions (i)ndash(iii) are not satisfied
and thus the heat content of the incipient melting effectis not proportional to amount of an intermetallicphase involved in the reaction In agreement with thisdeviations from proportionality in Fig 31 correlate withrapid variations in onset temperature in Fig 11(Consider the thixoformed Alndash15Sindash44Cundash06Mg alloyhomogenised for 05ndash2 h)
It should be noted that the highlighted problemswith a true quantitative analysis of volume fractions ofintermetallics from DSC incipient melting peaks doesnot detract from the useful results that can be obtainedfrom a qualitative study
Concluding remarksThe present review has illustrated that calorimetry andespecially differential scanning calorimetry are widelyused in the study of Al based alloys Differential scan-ning calorimetry in particular allows the rapid qualita-tive characterisation of a wide range of reactions that areimportant in determining the properties of the alloysHowever the relative ease of sample preparation and
31 Evolution of amount of Al2Cu in conventionally cast
Alndash12Sindash44Cundash13Mg (wt-) ingot sample (alloy A)
and thixoformed Alndash15Sindash44Cundash06Mg (wt-) alloy
(alloy B) heat treated for various times at 500uC as
calculated both from reduction of DSC peak area and
measured from image analysis of SEM images
amounts in as received condition were taken as 100
(from Ref 48)
Starink Analysis of Al based alloys by calorimetry
International Materials Reviews 2004 VOL 49 NO 3ndash4 221
performance of experiments can be deceptive samplepreparation and baseline instability can influence resultsAlso identification of heat effects in the more complexalloys is not straightforward and requires extensivesupporting microstructural investigation In the analysisof the kinetics of reactions during linear heating inthe DSC recent developments in approximations ofthe temperature integral are crucial in understanding thelimits of accuracy of methods that rely on suchapproximations and also deviations from the widelyused JMAK (JohnsonndashMehlndashAvramindashKolmogorov)models need to be considered Analysis of calorimetrydata in terms of amounts of reacting phases hasattracted some attention but the requirements for thevalidity of this quantitative application are strict and insome cases assumed proportionality of heat contents ofreactions to the amount of single phase formed cannotbe proven
Appendices
Appendix 1 Calculation of accuracies ofisoconversion methodsThe deviations by factors (i)ndash(vi) can be estimated asfollows
Error source (i)
For type B methods it holds120
lnp(yf )
b
~const (73)
The general form for the approximation of p is givenby
pa(y)~exp(y)q(y) (74)
If the ratio between p and the approximation pa is r(y)then we can rearrange equation (73) to
lnpa(yf )r(y)
b
~ln
exp (y)q(yf )r(y)
b
~yzlnq(yf )
b
zlnfrac12r(y)~const (75)
and thus it follows
d lnfrac12q(yf )=bd(1=T)
~E
R
d ln(r(y))
d(1=T)~
E
R1
d lnfrac12r(y)d(y)
(76)
Thus we can conclude that the error introduced byapproximating the temperature integral DEm(T-int) isgiven by
DEm(T-int)
Em~
d lnfrac12r(y)d(y)
~d ln(pa=p)
d(y)(77)
The right-hand side of the equation (77) has beenevaluated elsewhere120 and results are presented inFig 24 This figure shows that for the best p(y)-isoconversion method (type B 192 method) the devia-tions introduced by approximation of the temperatureintegral are less than 025 for y15 and less than075 for y10 For the Lyon method122 in addition tothe approximation of the temperature integral a furthermathematical approximation is introduced which isevaluated elsewhere120 The relative error in E intro-duced is about 22[y(2zy)]21 and hence accuracy is
better than 17 for y10 and better than 08 fory15
Error sources (ii) (iii) and (iv)
If the activation energy is derived from two constantheating rate experiments I and II the activation energyfor a p(y)-isoconversion method (type B method) isgiven by120
Em~R lnbITkfI
lnbIITkfII
1
TfI
1
TfII
1
(78)
where Em represents the measured value of E We canapproximate the deviation introduced by the sources oferror (ii) and (iii) for type B methods as
DEm(ii)(iv)~LEm
LTI
DTIzLEm
LTII
DTIIzLEm
LbIDbI
zLEm
LbIIDbII (79)
where the four terms on the right-hand side relate to theinaccuracies in determination of the temperatures atfixed fraction transformed and the inaccuracies in deter-mination of heating rate The accuracy of the type Amethods (rate-isoconversion methods Friedman method)was analysed in a similar fashion and this yielded
DEm(ii)(iv)~LEm
LTI
DTIzLEm
LTII
DTIIzLEm
LbIDbIz
LEm
LbIIDbIIz
LEm
LqIDqIz
LEm
LqIIDqII (80)
where q5dadT The first four terms on the right-handside are identical to the four terms in the previousequation As the heating rate can generally be deter-mined to a very high accuracy we can ignore the DbIand DbII terms in equation (80) The first term on theright-hand side of equation (80) is evaluated as
LEm
LTI
DTI~RTII
TITII
kzEm
RTI
DTI (81)
As kERT we can approximate
LEm
LTI
DTIEmDTI
TITII
TII
TI
(82)
Thus for type B methods the errors introduced by errorsources (ii)ndash(iv) are mostly dominated by error source(ii) and the errors can be approximated
DEm(ii)(iv)
Em
DTI
TITII
TII
TI
zDTII
TIITI
TI
TII
(83)
This can be further approximated by considering that inmost cases
TITIIvvTII TI
and hence
DEm(iiiv)
Em
DTI
TITIIz
DTII
TIITI(84)
Accuracy of determination of q may depend on a rangeof factors including baseline stability and dependency ofheat flow calibration on heating rate and temperatureand it is thought that Dqq may vary between 05 and5 depending on experimental conditions Considering
Starink Analysis of Al based alloys by calorimetry
222 International Materials Reviews 2004 VOL 49 NO 3ndash4
some typical values for solid state reactions would yieldas indication of the magnitude
RTI
E
TI
TIITI
amp1
20
500
50~05 (85)
Error source (v)
The magnitude of this error depends on the type ofreaction operating The errors for various choices of f(a)have been analysed by Gao et al151 In the present workthe error was estimated by considering the maximumerror introduced by any of these methods in the range15y60
Error source (vi)
The errors introduced by variations of the equilibriumstate during the reaction have attracted little attention inthe literature Attempts at analysis for precipitationreactions have shown that this source of errors can besignificant149
Appendix 2 Mean field model and impingementfactor modelThe mean field model considers that the influence of theimpingement of diffusion field on the growth rate ofspherical precipitates of radius R(t) is related to theaverage solute content of the matrix c(t) through
dR(t)
dt~
cm_c (t)
cpcm
D
R(t)(86)
where D is the diffusivity and cp and cm are theprecipitate and matrix compositions at the interfaceConservation of solute requires that
fpcpz(1fp)_c (t)~coufpfrac12cp
_c (t)~co
_c (t) (87)
where co is the initial matrix concentration fp isthe volume fraction of precipitates which equals43pR(t)3N (N being the number density of growingprecipitates) Eliminating R(t) from these equationsyields
d_c (t)
dt~
D(4=3pN)2=3
(cpcm)(cpco)frac12cp
_c (t)5=3frac12cm
_c (t)
|frac12co_c (t)1=3
~A1(T)frac12cp_c (t)5=3frac12cm
_c (t)frac12co
_c (t)1=3 (88)
where A1(T) is a time-independent factor depending onD N and initial and equilibrium compositions Theprogress of the reaction (evaluated by iteration) can becompared with the StarinkndashZahra model170179
a~1frac12ktn
giz1
gi
(89)
This comparison shows that the StarinkndashZahra modelcan fit the reaction curves to a very high degree ofaccuracy with n515 and gi567 provided the initialconcentration of solute is sufficiently dilute as comparedto the concentration in the precipitate eg
cpcmw10(cocm)
Of special interest is the limit for infinitely dilutesolutions eg where [cp2c(t)] can be considered aconstant In this case equation (88) can be reduced as
follows
d_c (t)
dt~
D(4=3pN)2=3
(cpcm)(cpco)frac12cpco5=3frac12cm
_c (t)
|frac12co_c (t)1=3
~A2(T)frac12cm_c (t)frac12co
_c (t)1=3 (90)
where A2(T) is a time-independent factor depending onD N and initial and equilibrium compositionsConsidering that co2c(t) is proportional to a and thatcm2c(t) is proportional to 12a we can rewriteequation (90) as204
da
dt~A3(T)frac121aa1=3 (91)
Thus the mean field model for precipitation is com-patible with equations (6) and (7) with f(a)5[12a]a13 Ahighly accurate approximate solution for the latterequation is the StarinkndashZahra equation with gi5567and n515 ie
frac121aa1=3nfrac12(1a)1=g1(n1)=n(1a)(gz1)=g
with the gi and n values indicated
Acknowledgements
The provision of original graphs of calorimetry curvesand other data by several of the authors cited in thisreview is gratefully acknowledged Through the years DrA-M Zahra Professor E J Mittemeijer and ProfessorP J Gregson contributed useful discussions on severalof the topics included in this work
References1 T Gloriant and A L Greer Nanostr Mater 1998 10 389ndash396
2 Shushan Dong Guangtian Zou and Haibin Yang Scr Mater
2001 44 17ndash23
3 T P Prasad S B Kanungo and H S Ray Thermochim Acta
1992 203 503ndash514
4 R Sabbah A-M Zahra R Castanet and G Bardon de Segonzac
personal communications CTMndashCNRS Marseille France 1996
5 lsquoCalorimeters Calvetrsquo SETARAM group Caluire France 2001
(descriptions of SETARAM calorimeters)
6 J H Rechardson and R V Peterson lsquoSystematic materials
analysisrsquo 1978 New York Academic Press
7 C Michaelsen K Barmak and T P Weihs Phys D 1997 30
3167ndash3186
8 M J Richardson and E L Charsley in lsquoHandbook of thermal
analysis and calorimetryrsquo (ed M E Brown) Vol 1 547 1998
Amsterdam Elsevier
9 W Lacom Thermochim Acta 1996 271 93ndash100
10 A Zahra C Y Zahra and M Laffitte Z Metallkd 1979 70 669
11 M J Starink and A-M Zahra Philos Mag A 1998 77 187ndash199
12 A Charai T Walther C Alfonso A-M Zahra and C Y Zahra
Acta Mater 2000 48 2751ndash2764
13 L F Mondolfo lsquoAluminium alloys structure and propertiesrsquo
1976 London Butterworths
14 I J Polmear lsquoLight alloys the metallurgy of the light metalsrsquo 3rd
edn 1995 London Arnold
15 C Garcia-Cordovilla and E Louis Metall Trans A 1984 15A
389ndash391
16 C Garcia-Cordovilla and E Louis Thermochim Acta 1985 93
653ndash656
17 M J Starink A J Hobson and P J Gregson Scr Mater 1996
34 1711ndash1716
18 S P Ringer K Hono I J Polmear and T Sakurai Appl Surf
Sci 1996 94ndash95 253ndash260
19 A K Gupta P Gaunt and M C Chaturvedi Philos Mag A
1987 55 375ndash387
Starink Analysis of Al based alloys by calorimetry
International Materials Reviews 2004 VOL 49 NO 3ndash4 223
20 M J Starink P Wang I Sinclair and P J Gregson Acta Mater
1999 47 3841ndash3853
21 T Sato Mater Sci Forum 2000 331ndash337 85
22 P B Prangnell and W M Stobbs Proc 7th Int Conf on
lsquoComposite materialsrsquo ICCM7 (ed W Yunshu et al) 573 1989
Oxford Pergamon Press
23 M Cieslar P Vostry I Stulikova and B Smola in Proc 6th AlndashLi
Conf (ed M Peters and P-J Winkler) 155 1992 Oberursel
DGM Informationsgesellschaft
24 P B Prangnell and W M Stobbs Proc 12th Risoslash Int Symp on
lsquoMetal matrix composites ndash processing microstructure and proper-
tiesrsquo (ed N Hansen et al) 603 1991 Roskilde Risoslash
25 G W Smith Scr Metall Mater 1994 31 357ndash362
26 G W Smith Thermochim Acta 1997 291 59ndash64
27 C Y Zahra and A-M Zahra Thermochimica Acta 1996 276
161ndash174
28 J Y Yao D A Graham B Rinderer and M J Couper Micron
2001 32 865ndash870
29 R D Sa Lisboa and C S Kiminami J Non-Cryst Solids 2002
304 36ndash43
30 S Ikeno H Matsui K Matsuda K Terayama and Y Uetani
J Jpn Inst Met 2001 65 404ndash408
31 G A Edwards K Stiller G L Dunlop and M J Couper Acta
Mater 1998 46 3893ndash3904
32 Y Ohmori L C Doan Y Matsuura S Kobayashi and K Nakai
Mater Trans 2001 42 2576ndash2583
33 S Abis M Massazza P Mengucci and G Riontino Scr Mater
2001 45 685ndash691
34 S P Ringer S K Caraher and I J Polmear Scr Mater 1998 39
1559ndash1567
35 S P Ringer T Sakurai and I J Polmear Acta Mater 1997 45
3731ndash3744
36 A M Zahra C Y Zahra C Alfonso and A Charaı Scr Mater
1998 39 1553ndash1558
37 A K Jena A K Gupta and M C Chaturvedi Acta Metall 1989
37 885ndash895
38 A K Gupta A K Jena and M C Chaturvedi Scr Metall 1988
22 369ndash371
39 M J Starink and A-M Zahra Thermochim Acta 1997 298 179ndash
189
40 A-M Zahra and C Y Zahra J Thermal Anal 1990 36 1465ndash
1470
41 A-M Zahra C Y Zahra R Castanet G Jaromaweiland
G Neuer J Thermal Anal 1992 38 781ndash788
42 B Noble and S E Bray Acta Mater 1998 46 6163ndash6171
43 J M Martin T Gomez-Acebo and F Castro Powder Metall
2002 45 173ndash180
44 S P Chen M S Vossenberg F J Vermolen J van de Langkruis
and S van der Zwaag Mater Sci Eng A 1999 272 250ndash256
45 X Li and M J Starink Mater Sci Forum 2000 331 1071ndash1076
46 M J Starink and A-M Zahra Acta Mater 1998 46 3381ndash3397
47 M J Starink and P van Mourik Mater Sci Eng A 1992 156
183ndash194
48 L Lasa and J M Rodriguez-Ibabe Mater Charact 2002 48
371ndash378
49 Guiqing Wang Xiufang Bian Weimin Wang and Junyan Zhang
Mater Lett 2003 57 4083ndash4087
50 L B Ber and V G Davydov Mater Sci Forum 2002 396ndash402
983ndash988
51 I N A Oguocha M Radjabi and S Yannacopoulos J Mater
Sci 2000 35 5629ndash5634
52 P A Rometsch and G B Schaffer Int J Cast Met Res 2000 12
431ndash439
53 D C Balderach J A Hamilton E Leung M Cristina Tejeda J
Qiao and E M Taleff Mater Sci Eng A 2003 339 194ndash204
54 X J Jiang B Noble V Hansen and J Tafto Metall Mater
Trans A 2001 32A 1063ndash1073
55 X J Jiang B Noble B Holme G Waterloo and J Tafto Metall
Mater Trans A 2000 31A 339ndash348
56 F Lefebvre S Wang M J Starink and I Sinclair Mater Sci
Forum 2002 396ndash402 1555ndash1600
57 M H Chen R Y Hwang and C P Chou Sci Technol Weld
Join 1999 4 21ndash27
58 I N A Oguocha M Radjabi and S Yannacopoulos Can Metall
Q 2001 40 245ndash254
59 T Maeguchi K Yamada and T Sato J Jpn Inst Met 2002 66
127ndash130
60 J M G De Salazar and M I Barrena J Mater Sci 2002 37
1497ndash1502
61 S Ikeno H Matsui K Matsuda and Y Uetani Mater Sci
Forum 2000 331ndash333 1193ndash1197
62 J L Ortiz V Amigo M D Salvador and C R Perez Rev
Metall 2000 36 348ndash356
63 V Massardier L Pelletier and P Merle Mater Sci Eng A 1998
249 121ndash133
64 N Gao L Davin S Wang A Cerezo and M J Starink Mater
Sci Forum 2002 396ndash402 923ndash928
65 C J Tseng S L Lee S C Tsai and C J Cheng J Mater Res
2002 17 2243ndash2250
66 V G Davydov L B Ber E Ya Kaputkin V I Komov O G
Ukolova and E A Lukina Mater Sci Eng A 2000 280 76ndash82
67 D J Lloyd D R Evans and A K Gupta Can Metall Q 2000
39 475ndash482
68 J M Papazian Metall Trans A 1981 12A 269ndash279
69 N Kamp I Sinclair and M J Starink Metall Mater Trans A
2002 33A 1125ndash1136
70 R C Dorward Mater Sci Technol 1999 15 1133ndash1138
71 X Li lsquoMicrostructurendashproperty modelling and predictions of 7xxx
alloysrsquo PhD thesis University of Southampton 2002
72 M J Starink and S C Wang Acta Mater 2003 51 5131ndash5150
73 F Zhou X Z Liao Y T Zhu S Dallek and E J Lavernia Acta
Mater 2003 51 2777ndash2791
74 L Shaw H Luo J Villegas and D Miracle Acta Mater 2003 51
2647ndash2663
75 M T Clavaguera-Mora J Rodriguez-Viejo D Jacovkis J L
Touron N Clavaguera and W S Howells J Non-Cryst Solids
2001 287 162ndash166
76 N Clavaguera J A Diego M T Clavaguera-Mora and A Inoue
NanoStruct Mater 1995 6 485ndash488
77 A S Aronin G E Abrosimova and Y V Kirrsquoyanov Phys Solid
State 2001 43 2003ndash2011
78 N Bassim C S Kiminami M J Kaufman M F Oliveira M N
R V Perdigao and W J Botta Filho Mater Sci Eng A 2001
304ndash306 332ndash337
79 C A D Rodriguez and W J Botta Adv Powder Technol II Key
Eng Mater 2001 189ndash191 573ndash577
80 D V Louzguine and A Inoue J Mater Res 2002 17 1014ndash
1018
81 C J Zhang Y S Wu X L Cai G R Zhou Y C Shi H Yang
and S Wu J Phys Condens Matter 2001 13 L647ndashL653
82 M Gich T Gloriant S Surinach A L Greer and M D Baro
J Non-Cryst Solids 2001 289 214ndash220
83 K Hono Y Zhang A P Tsai A Inoue and T Sakurai Scr
Metall Mater 1995 32 191ndash196
84 G Lucadamo K Barmak D T Carpenter and J M Rickman
Acta Mater 2001 49 2813ndash2826
85 G Lucadamo K Barmak and S Hyun Thermochim Acta 2000
348 53ndash59
86 C Michaelsen and M Dahms Thermochim Acta 1996 288 9ndash27
87 K Barmak C Michaelsen and G Lucadamo J Mater Res 1997
12 133ndash146
88 C Bergman E Emeric G Clugnet and P Gas Defects Diffusion
Forum 2001 194ndash199 1533ndash1538
89 G W Smith W J Baxter and A K Sachdev Mater Sci Eng A
2000 284 246ndash253
90 T X Fan D Zhang Z L Shi R J Wu T Shibayanagai
M Naka and H Mori J Mater Sci 1999 34 5175ndash80
91 D Larouche C Laroche and M Bouchard Acta Mater 2003 51
2161ndash2170
92 Z Zhang X Bian and Y WangMater Lett 2003 57 1261ndash1265
93 C Hsu K A Q OrsquoReilly B Cantor and R Hamerton Mater
Sci Eng A 2001 304ndash306 119ndash124
94 R T Southin and G A Chadwick Acta Metall 1978 26 223ndash
231
95 Y M Youssef R W Hamilton R J Dashwood and P D Lee
Mater Sci Forum 2002 396ndash402 259ndash264
96 D J Chakrabarti and J L Murray Mater Sci Forum 1996 217
177ndash181
97 G Sha K A Q OrsquoReilly B Cantor J Worth and R Hamerton
Mater Sci Eng A 2001 304ndash306 612ndash616
98 P Sainfort J Domeyne and T Warner lsquoProcess for the
desensitisation to intercrystalline corrosion of 2000 and 6000 series
Al alloys and corresponding productsrsquo US patent 5643372 (1997)
99 P Sainfort and P Gomiero lsquo7000 Alloy having high mechanical
strength and a process for obtaining itrsquo US patent 5560789
(1996)
100 H J Brinkman J Duszczyk and L Katgerman Scr Mater
1997 37 293ndash297
Starink Analysis of Al based alloys by calorimetry
224 International Materials Reviews 2004 VOL 49 NO 3ndash4
101 C A Ahravci and M O Pekguleryuz Calphad 1998 22 147ndash
155
102 J Fjellstedt A E W Jarfors and T El-Benawy Mater Des
2001 22 443ndash449
103 R E Hackenberg M C Gao L Kaufman and G J Shiflet Acta
Mater 2002 50 2245ndash2258
104 M Nassik F Z Chrifi-Alaoui K Mahdouk and J C Gachon
J Alloys Compd 2003 350 151ndash154
105 D Kevorkov R Schmid-Fetzer A Pisch F Hodaj and
C Colinet Z Metallkd 2001 92 953ndash958
106 J C Anglezio C Servant and I Ansara Calphad 1994 18 273ndash
309
107 Y Feutelais B Legendre M Guymont and P Ochin J Alloys
Compd 2001 322 184ndash189
108 V T Witusiewicz I Arpshofen H-J Seifert F Sommer and
F Aldinger Thermochim Acta 2000 356 39ndash57
109 A W Zhu B M Gable G J Shiflet and E A Starke Mater
Sci Forum 2002 396ndash402 21ndash30
110 P Saltykov V T Witusiewicz I Arpshofen O Fabrichnaya
H J Seifert F Aldinger Scand J Metall 2001 30 297ndash301
111 V Witusiewicz U K Stolz I Arpshofen and F Sommer
Z Metallkd 1998 89 704ndash713
112 L B Ber and E Y Kaputkin Phys Met Metallogr 2001 92
199ndash209
113 K Bouche F Barbier and A Coulet Z Metallkd 1997 88 446ndash
451
114 J Malek Thermochim Acta 1995 267 61
115 J Sestak and G Berggren Thermochim Acta 1971 3 1
116 M J Starink J Mater Sci 1997 32 4061ndash4070
117 E G Prout and F C Tompkins Trans Faraday Soc 1946 42
468
118 S Vyazovkin and C A Wright Int Rev Phys Chem 1998 17
407ndash433
119 A K Galwey and M E Brown in lsquoHandbook of thermal
analysis and calorimetryrsquo (ed M E Brown) Vol 1 147 1998
Amsterdam Elsevier
120 M J Starink Thermochim Acta 2003 404 163ndash176
121 O Schlomilch lsquoVorlesungen uber hoheren Analysisrsquo 2nd edn
266 1874 Braunschweig
122 R E Lyon Thermochim Acta 1997 297 117
123 C D Doyle J Appl Polym Sci 1961 5 285
124 C D Doyle J Appl Polym Sci 1962 6 693
125 C D Doyle Nature 1965 207 290
126 P Murray and J White Trans Brit Ceram Soc 1955 54 204
127 A W Coats and J P Redfern Nature 1964 201 68ndash69
128 G I Senum and R T Yang J Therm Anal 1977 16 1033
129 M J Starink Thermochim Acta 1996 288 97ndash104
130 J W Graydon S J Thorpe and D W Kirk Acta Metall Mater
1994 42 3163ndash3166
131 E J Mittemeijer J Mater Sci 1992 27 3977ndash3987
132 M J Starink and P J Gregson Mater Sci Eng A 1996 211
54ndash65
133 H E Kissinger J Res Natl Bur Stand 1956 57 217
134 T Akahira and T Sunose Trans 1969 Joint Convention Four
Electrical Institutes 1969 paper 246
135 H Flynn and L A Wall J Polym Sci 1966 4 323
136 T Ozawa J Therm Anal 1970 2 301
137 T Ozawa Thermochim Acta 1992 203 159
138 P G Boswell J Thermal Anal 1980 18 353
139 H L Friedman J Polym Sci C 1964 6 183ndash195
140 C-R Li and T B Tang Thermochim Acta 1999 325 43ndash46
141 R DeIasi and P N Adler Metall Trans A 1977 8A 1177
142 L V Meisel and P J Cote Acta Metall 1983 31 1053ndash1059
143 A Ortega Int J Chem Kinet 2002 34 193
144 P Barczy and F Tranta Scand J Metall 1975 4 284ndash288
145 L C Chen and F Spaepen J Appl Phys 1991 69 679
146 S Vyazovkin J Comput Chem 1997 18 393ndash402
147 A Ortega Thermochim Acta 1996 284 379ndash387
148 J M Criado and A Ortega J Non-Cryst Solids 1986 87 302ndash
311
149 M J Starink J Mater Sci 1997 32 6505ndash6512
150 J H Flynn J Therm Anal 1983 27 95
151 Xiang Gao Dun Chen and D Dollimore Thermochim Acta
1993 223 75ndash82
152 Dun Chen Xiang Gao and D Dollimore Thermochim Acta
1993 215 109
153 M B Berkenpas J A Barnard R V Ramanujan and H I
Aaronson Scr Metall 1986 20 323
154 J M Criado and A Ortega J Therm Anal 1984 29 1225
155 K Dasa and T K Bandyopadhyay Scr Mater 2001 44 2597ndash
2603
156 E A Brandes (ed) lsquoSmithells metals reference bookrsquo 1983
Oxford Butterworths
157 R W Siegel J Nucl Mater 1978 69ndash70 117ndash146
158 W DeSorbo and D Turnbull Acta Metall 1959 7 83ndash85
159 N C W Kuijpers W H Kool S van der Zwaag Mater Sci
Forum 2002 396ndash402 675ndash680
160 N Kamp lsquoToughnessndashstrength relationships in high strength
7xxx Al alloysrsquo PhD thesis University of Southampton
2002
161 B J McKay P Cizek P Schumacher and K A Q OrsquoReilly
Mater Sci Eng A 2001 304ndash306 240ndash244
162 O N Senkov J M Scotta and D B Miracle J Alloys Compd
2002 337 83ndash88
163 I N A Oguocha and S Yannacopoulos J Mater Sci 1999 34
3335ndash3340
164 S P Chen K M Mussert and S van der Zwaag J Mater Sci
1998 33 4477ndash4493
165 A Varschavski and E Donoso J Therm Anal Calorim 2002
68 231ndash241
166 Eon-Sik Lee and Young G Kim Acta Metall Mater 1990 38
1669
167 J B Austin and R L Rickett Trans Am Inst Min Eng 1939
135 396
168 R A Vandermeer and P Gordon in lsquoRecovery and recrystalliza-
tion in metalsrsquo (ed L Himmel) 211 1963 New York Gordon
and Breach Science Publishers
169 L Q Xing J Eckert W Loser L Schultz and D M Herlach
Philos Mag A 1999 79 1095
170 M J Starink and A-M Zahra Thermochim Acta 1997 292
159ndash168
171 M J Starink and A-M Zahra Acta Mater 1998 46 3381ndash3397
172 M J Starink C Y Zahra and A-M Zahra J Therm Anal
Calorim 1998 51 933ndash942
173 M K Miller K F Russell P J Pareige M J Starink and
R C Thomson Mater Sci Eng A 1998 250 49ndash54
174 A R Yavari and D Negri Nanostruct Mater 1997 8 969ndash986
175 E Pineda and D Crespo J Non-Cryst Solids 2003 317 85ndash90
176 V Sessa M Fanfoni and M Tomellini Phys Rev B 1996 54
836
177 Ge Yu and J K L Lai J Appl Phys 1996 79 3504
178 C Michaelsen M Dahms and M Pfuff Phys Rev B 1996 53
11877ndash78
179 M J Starink J Mater Sci 2001 36 4433ndash4441
180 E Pineda T Pradell and D Crespo Philos Mag A 2002 82
107ndash121
181 W S Tong J M Rickman and K Barmak J Chem Phys 2001
114 915
182 J M Rickman W S Tong and K Barmak Acta Mater 1997
45 1153
183 M Tomellini M Fanfoni and M Volpe Phys Rev B 2000 62
11300ndash03
184 N X Sun X D Liu and K Lu Scr Mater 1996 34 1201
185 D P Birnie III and M C Weinberg J Chem Phys 1995 103
3742
186 M C Weinberg and D P Birnie III J Chem Phys 1996 105
5139
187 D P Birnie III and M C Weinberg Physica A 1996 230 484
188 M C Weinberg and D P Birnie III J Non-Cryst Solids 1996
202 290
189 F S Ham J Appl Phys 1959 30 1518
190 F S Ham Q Appl Math 1959 17 137
191 E Pineda and D Crespo Phys Rev B 1999 60 3104
192 P Uebele and H Hermann Modell Simul Mater Sci Eng 1996
4 203
193 A D Rollett Progr Mater Sci 1997 42 79ndash99
194 M P Jackson M J Starink and R C Reed Mater Sci Eng A
1999 264 26ndash38
195 O R Myhr and Oslash Grong Acta Mater 2000 48 1605
196 A Deschamps and Y Brechet Acta Mater 1999 47 293
197 J S Langer and A J Schwartz Phys Rev A 1980 21 948
198 C Sigli Mater Sci Forum 2000 331ndash337 513
199 R Kampmann and R Wagner in lsquoDecomposition of alloys the
early stagesrsquo (ed P Haasen et al) 91ndash103 1984 New York
Pergamon Press
200 E Woldt Metall Mater Trans A 2001 32 2465ndash2473
201 A K Gangopadhyay T K Croat and K F Kelton Acta
Mater 2000 48 4035ndash4043
202 K F Kelton Acta Mater 2000 48 1967ndash1980
Starink Analysis of Al based alloys by calorimetry
International Materials Reviews 2004 VOL 49 NO 3ndash4 225
203 K F Kelton J Non-Cryst Solids 2000 274 147ndash154
204 M Baricco M Groppi E Bosco and A Catellero Mater Sci
Forum 2001 360ndash362 445ndash450
205 K F Kelton T K Croat A K Gangopadhyay L-Q Xing
A L Greer M Weyland X Li and K Rajan J Non-Cryst
Solids 2003 317 71ndash77
206 M Tomellini J Alloys Compd 2003 348 189ndash94
207 M J Starink J Mater Sci Lett 1996 15 1747ndash1748
208 M van Rooyen and E J Mittemeijer Metall Trans A 1989
20A 1207ndash1214
209 A Borrego and G Gonzalez-Doncel Mater Sci Eng A 1998
A245 10ndash18
210 M J Starink Mater Sci Eng A 1999 A276 289ndash292
211 A Borrego and G Gonzalez-Doncel Mater Sci Eng A 1998
A252 149
212 G Garces and P Adeva J Alloys Compd 2002 347 188ndash192
213 A Varschavsky and E Donoso Mater Lett 2003 57 1266ndash
1271
214 A Varschavsky and E Donoso J Therm Anal Calorim 2002
68 231ndash241
215 E Woldt J Phys Chem Solids 1992 53 521
216 P Kruger J Phys Chem Solids 1993 54 1549
217 J M Criado and A Ortega Acta Metall 1987 35 1715ndash1721
218 Eon-Sik Lee and Young G Kim Acta Metall Mater 1990 38
1677
219 J W Christian lsquoThe theory of transformations in metals and
alloysrsquo 542 1975 Oxford Pergamon Press
220 S Vyazovkin and W Linert J Solid State Chem 1995 114
392
221 G Ruitenberg E Woldt and A K Petford-Long Thermochim
Acta 2001 378 97
222 T J W de Bruijn W A de Jong and P J van den Berg
Thermochim Acta 1981 45 315
223 M J Starink and P J Gregson Scr Metall Mater 1995 33
893ndash900
224 M J Starink A J Hobson I Sinclair and P J Gregson Mater
Sci Eng A 2000 289 130ndash142
225 M J Starink A J Hobson and P J Gregson Mater Sci Forum
2000 331ndash337 1321ndash1326
226 M J Starink and P J Gregson Mater Sci Forum 1996 217ndash
222 673
227 A Luo D J Lloyd A Gupta and W V Youdelis Acta Metall
Mater 1993 41 769ndash776
228 Tsung-Rong Chen Guan-Jye Peng and J C Huang Metall
Mater Trans A 1996 27 2923ndash2933
229 A Gaber and N Afify Appl Phys A 1997 65 57ndash62
230 K Satya Prasad A K Mukhopadhyay A A Gokhale
D Banerjee and D B Goel Scr Metall Mater 1994 30 1299
231 H-C Shih N J Ho and J C Huang Metall Mater Trans A
1996 27A 2479
232 M J Starink P Wang I Sinclair and P J Gregson Acta Mater
1999 47 3855ndash3868
233 T Gloriant M Gich S Surinach M D Baro and A L Greer
Mater Sci Forum 2000 343ndash346 365ndash370
Starink Analysis of Al based alloys by calorimetry
226 International Materials Reviews 2004 VOL 49 NO 3ndash4
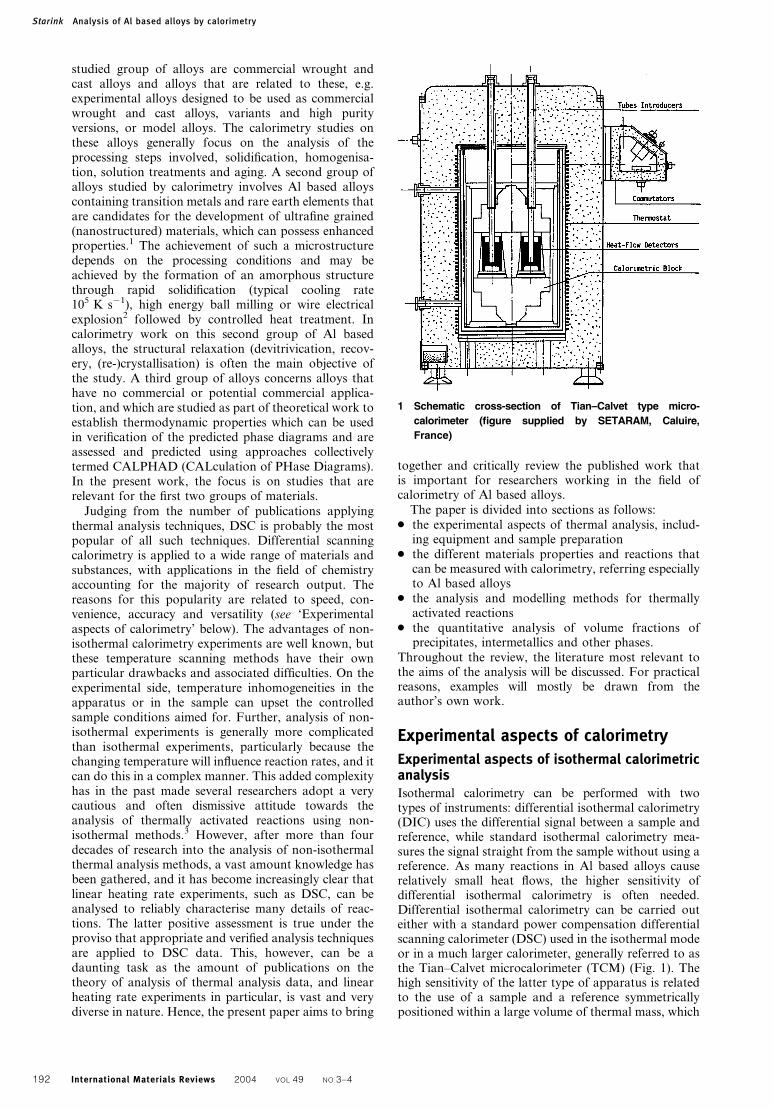
studied group of alloys are commercial wrought andcast alloys and alloys that are related to these egexperimental alloys designed to be used as commercialwrought and cast alloys variants and high purityversions or model alloys The calorimetry studies onthese alloys generally focus on the analysis of theprocessing steps involved solidification homogenisa-tion solution treatments and aging A second group ofalloys studied by calorimetry involves Al based alloyscontaining transition metals and rare earth elements thatare candidates for the development of ultrafine grained(nanostructured) materials which can possess enhancedproperties1 The achievement of such a microstructuredepends on the processing conditions and may beachieved by the formation of an amorphous structurethrough rapid solidification (typical cooling rate105 K s21) high energy ball milling or wire electricalexplosion2 followed by controlled heat treatment Incalorimetry work on this second group of Al basedalloys the structural relaxation (devitrivication recov-ery (re-)crystallisation) is often the main objective ofthe study A third group of alloys concerns alloys thathave no commercial or potential commercial applica-tion and which are studied as part of theoretical work toestablish thermodynamic properties which can be usedin verification of the predicted phase diagrams and areassessed and predicted using approaches collectivelytermed CALPHAD (CALculation of PHase Diagrams)In the present work the focus is on studies that arerelevant for the first two groups of materials
Judging from the number of publications applyingthermal analysis techniques DSC is probably the mostpopular of all such techniques Differential scanningcalorimetry is applied to a wide range of materials andsubstances with applications in the field of chemistryaccounting for the majority of research output Thereasons for this popularity are related to speed con-venience accuracy and versatility (see lsquoExperimentalaspects of calorimetryrsquo below) The advantages of non-isothermal calorimetry experiments are well known butthese temperature scanning methods have their ownparticular drawbacks and associated difficulties On theexperimental side temperature inhomogeneities in theapparatus or in the sample can upset the controlledsample conditions aimed for Further analysis of non-isothermal experiments is generally more complicatedthan isothermal experiments particularly because thechanging temperature will influence reaction rates and itcan do this in a complex manner This added complexityhas in the past made several researchers adopt a verycautious and often dismissive attitude towards theanalysis of thermally activated reactions using non-isothermal methods3 However after more than fourdecades of research into the analysis of non-isothermalthermal analysis methods a vast amount knowledge hasbeen gathered and it has become increasingly clear thatlinear heating rate experiments such as DSC can beanalysed to reliably characterise many details of reac-tions The latter positive assessment is true under theproviso that appropriate and verified analysis techniquesare applied to DSC data This however can be adaunting task as the amount of publications on thetheory of analysis of thermal analysis data and linearheating rate experiments in particular is vast and verydiverse in nature Hence the present paper aims to bring
together and critically review the published work thatis important for researchers working in the field ofcalorimetry of Al based alloys
The paper is divided into sections as follows
N the experimental aspects of thermal analysis includ-ing equipment and sample preparation
N the different materials properties and reactions thatcan be measured with calorimetry referring especiallyto Al based alloys
N the analysis and modelling methods for thermallyactivated reactions
N the quantitative analysis of volume fractions ofprecipitates intermetallics and other phases
Throughout the review the literature most relevant tothe aims of the analysis will be discussed For practicalreasons examples will mostly be drawn from theauthorrsquos own work
Experimental aspects of calorimetry
Experimental aspects of isothermal calorimetricanalysisIsothermal calorimetry can be performed with twotypes of instruments differential isothermal calorimetry(DIC) uses the differential signal between a sample andreference while standard isothermal calorimetry mea-sures the signal straight from the sample without using areference As many reactions in Al based alloys causerelatively small heat flows the higher sensitivity ofdifferential isothermal calorimetry is often neededDifferential isothermal calorimetry can be carried outeither with a standard power compensation differentialscanning calorimeter (DSC) used in the isothermal modeor in a much larger calorimeter generally referred to asthe TianndashCalvet microcalorimeter (TCM) (Fig 1) Thehigh sensitivity of the latter type of apparatus is relatedto the use of a sample and a reference symmetricallypositioned within a large volume of thermal mass which
1 Schematic cross-section of TianndashCalvet type micro-
calorimeter (figure supplied by SETARAM Caluire
France)
Starink Analysis of Al based alloys by calorimetry
192 International Materials Reviews 2004 VOL 49 NO 3ndash4
is isolated from external (thermal) disturbances4 Heatexchange of sample and reference are measured by heatflux transducers consisting of several hundreds ofthermocouples which line the surface of the sampleholder45 In such an arrangement heat flows as small as01 mW can be detected The large thermal mass of theequipment also has a drawback as it is responsible for asubstantial thermal lag This means that on introductionof a sample into the isothermal calorimeter the heatflows in the calorimeter are disturbed during whichno reproducible measurement of heat flow is possibleDepending on type of calorimeter and mass of sampleand calorimeter this time lag varies and can be up to05 h for a TianndashCalvet type calorimeter In isothermalcalorimetry using the power compensation DSC thetotal thermal mass of the equipment is smaller and hencethe time of instability is shorter in the order of 1 min
As an example of the results that can be obtained withisothermal calorimetry analysis of Al based alloys inFig 2 isothermal calorimetry curves obtained with aTianndashCalvet microcalorimeter on quenched samples ofan AlndashSi alloy are presented
Experimental aspects of differential scanningcalorimetryBoth differential thermal analysis (DTA) and differen-tial scanning calorimetry (DSC) are concerned with themeasurement of heat evolved from a substance duringheating (or in some cases cooling) The word lsquodiffer-entialrsquo emphasises that measurements involve thedetermination of the relative behaviour of a substanceitself and a reference material The main distinctionbetween DTA and DSC is that in DSC the equipmentcan be calibrated such that the heat evolution from thesample can be measured quantitatively while this isoften not possible for DTA6 Differential scanningcalorimetry (or calibrated DTA) has proven to be avery useful and reproducible technique for the studyof phase transformations and has been widely appliedto study precipitation in Al alloys Besides the basicscientific interest of these studies their underlying aimis to use calorimetry as an effective and rapid tool to
investigate various characteristics of commercial materi-als For example in Al based alloys volume fractions ofprecipitates the melting temperature of specific phasesand the activation energy of reactions can in most casesbe determined by the DSC technique
There are two types of DSC the heat flux DSC andthe power compensation DSC7 the working principlesof the two methods are illustrated in Fig 3 For powercompensation DSC the signal is related to thedifferential heat provided to keep the sample and thereference to the same temperature For heat flux DSCthe signal derives directly from the difference oftemperature between the sample and the reference andin that sense a heat flux DSC is similar to a DTA Forthe heat flux DSC the heat flux measurement has to becalibrated by performing calibration runs with materialsthat display a reaction for which the heat evolution iswell known8 In practice substances such as pure In andpure Zn are often used Thus a heat flux DSC isessentially a DTA instrument that can be calibrated
Sample preparation for calorimetry of lightmetal alloysSample preparation for isothermal calorimetry and DSCstudies of light metal alloys is often a simple process If
2 Isothermal calorimetry curves (normalised with respect
to peak heat flow) of furnace cooled Alndash6Si (at-)
alloy at temperatures 190ndash230uC (thicker lines) with fits
obtained exothermic reactions are due to Si precipita-
tion (from Ref 11)
top heat flux DSC (figure supplied by Mettler-Toledo)
bottom power compensation DSC (figure supplied by
Perkin-Elmer)
3 Schematic cross-section of two types of differential
scanning calorimeter
Starink Analysis of Al based alloys by calorimetry
International Materials Reviews 2004 VOL 49 NO 3ndash4 193
the material to be studied is in the form of powder orribbons eg from rapidly solidification processing asample of the powder or small flakes can be taken and putdirectly in a crucible If bulk material is to be studiedsuitably sized disc-shaped samples can be readily obtainedeither by punching from thin plate or sheet or by cutting(slicing) from machined cylinders In isothermal calori-metry using a TianndashCalvet type instrument the sample iseither a cylinder which nearly fills the cavity in thecalorimeter9 or a batch of 10ndash20 disc-shaped samples withspacers to keep them apart10ndash12 In the latter case thebatch consists of discs having a thickness of about 1 mmand diameter of about 10ndash20 mm this type of sample is tobe preferred if high and homogeneous coolingquenchingrates are needed Sizes are selected such that the samplewill fit the cylindrical cavity lined with thermocouples thatis the sample holder In DSC or DIC using a heatcompensation DSC apparatus total sample mass issmaller and generally a sample consisting of a single discof about 05ndash2 mm thickness and 5ndash8 mm diameter isemployed26 In most calorimetric studies the effects ofsample preparation on the data are not a concern and theease of sample preparation using a range of methods isconsidered as a benefit for the method However it is wellknown that punching grinding machining and cutting allintroduce deformation in Al based alloys and thisinfluences precipitation in most heat treatable Al basedalloys by providing sites for heterogeneous nucleationand by annihilating quenched-in excess vacancies1314
Treatments at relatively high temperatures can causeoxidation or other surface reactions and might cause lossof alloying elements to the atmosphere or to the reactionproducts formed in a surface reaction For calorimetrysamples the thickness of the sample determines to a largeextent the relative importance of the surface reactions andalso surface roughness can play a part If any of theseeffects have a significant influence on reactions occurringduring a calorimetry experiment the sample preparationtechnique will cause variations in the measured data
For Al based alloys precipitation reactions are knownto be particularly sensitive to sample preparation andthe effects of sample preparation have been studied foran 8090 (AlndashLindashCundashMgndashZr) and a 2011 (AlndashCu)alloy15ndash17 For the 2011 (AlndashCu) alloy it was shown15
that for a sample prepared by punching and grindingafter solution treatment the h9 (Al2Cu) precipitationeffect was shifted to lower temperatures as compared toa sample solution treated after punching and grinding
The DSC curves of solution treated 8090 (AlndashLindashCundashMgndashZr) alloys show the precipitation of several phaseswith different precipitation mechanisms operating andhence these alloys are very suitable for study of theinfluence of sample preparation on reactions Forthe 8090 alloy punching and grinding after solutiontreatment appeared to enhance the formation ofsemicoherent S phase precipitates (Al2CuMg)18ndash20 and
d9 (Al3Li) while formation of the structures often termedGuinierndashPrestonndashBagaryatski (GPB) zones appeared tobe very much reduced (see Fig 4) (GuinierndashPreston andGuinierndashPrestonndashBagaryatski zones are structures thatare fully coherent with the matrix and harden the alloybut have a limited stability dissolving at a temperatureabout 200ndash300 K lower than the stable precipitatephases21) The changes in precipitation resulting fromgrinding and punching are generally believed to becaused by the introduction of dislocations in the samplewhich in turn can reduce vacancy concentrations due toannihilation of vacancies on the dislocation Thereduction in GPB zone formation was interpreted asbeing due to a reduced vacancy concentration whichreduces both the stability of the zones and the diffusionrates of Cu and Mg atom migration to the zones Theenhanced S phase formation was interpreted as beingdue to an increased density of dislocations and d9precipitates both of which act as nucleation sites forS phase The enhancement of d9 formation by thepresence of dislocations generated either by grindingand punching after heat treatment or in the case ofan 809020 wt-SiC metal matrix composite (MMC)by misfitting SiC particles is consistent with variousobservations in the literature2223 The mechanisms forthis are not well understood but it was suggested that d9formation occurs via the formation of a short rangeordered (SRO) state and that the presence of this d9precursor in monolithic AlndashLi based alloys retards thesubsequent formation of the d9 phase24
For AlndashLi based alloys Li loss in the surface layers ofsolution treated specimens may be expected to influencethe DSC curves The DSC curves in Fig 5 were obtainedfrom 8090 samples machined before solution heattreatment at 530uC but with varying thickness andsolution treatment time in order to demonstrate theeffect of varying Li depletion The curves are of similarshape with the effects occurring at approximately thesame temperatures However the magnitudes of effectsAndashD appear to decrease in the following order standardthickness (08 mm) and 5 min at 530uC standard
The rod or lath shaped precipitates in AlndashCundashMg alloys which have often(especially up to the mid-1990s) been indicated by S9 are not a separatephase they are a slightly strained semicoherent version of the (incoherent)S phase This is in contrast to precipitation in AlndashCu alloys where the h9has a different crystal structure from the equilibrium h as well as adistinctly lower solvus Several researchers18ndash20 have thus discontinuedthe use of the indication S9 In the present paper the term S9 phase will notbe used instead the indication lsquosemicoherent S phase precipitatesrsquo isused The presence of a possible S99 phase distinct from S9S iscontroversial
4 Differential scanning calorimetry (DSC) curves of solu-
tion treated and cold water quenched (CWQ) 8090 (Alndash
LindashCundashMg) alloy machined before and after solution
heat treatment (SHT) exothermic heat flow on positive
y axis (adapted from Ref 17 in which effect A was
interpreted to be due to GPB zone formation B due to
d9 phase formation C due to dissolution of d9 phase
and zones D is due to Ssemicoherent S phase forma-
tion E is due to S phase dissolution F is due to a
surface reaction)
Starink Analysis of Al based alloys by calorimetry
194 International Materials Reviews 2004 VOL 49 NO 3ndash4
thickness and 30 min at 530uC half thickness and30 min at 530uC The heat content of the d9 forma-tion effect in these specimens decreases with increasingvolume fraction of Li depleted layer indicating that thiseffect can be accounted for by Li loss Interestingly themagnitudes of the GPB zone and S formation effectsalso decrease with increasing Li loss A convincingexplanation for this has proved elusive although it hasbeen noted that the charge in GPB zone heat effectmight be caused by Li being incorporated in GPB zones
In studies of heat treatable solution treated alloysthat are sensitive to quenching rate sample preparationcan further influence calorimetric analysis through thethickness of the specimen influencing the quenchingrates Thus thin samples machined before solutiontreatment will experience a high quenching rate whichcan cause relatively high precipitation rates duringsubsequent thermal analysis If calorimetry samples aremachined from larger blocks of quenched material thelower quenching rates experienced can reduce thesubsequent precipitation rates during thermal analysisprovided the material is substantially quench sensitive inthe quench rate regime considered
Taken together the results indicate that samplepreparation can have a marked influence on precipita-tion effects in the DSC Especially the introduction ofdislocations and the loss of alloying elements duringsolutionising of the samples are by-products of samplepreparation that need to taken into account whendeciding on the means of sample preparation andcomparison and analysis of DSC data
Baseline correction in calorimetryInitial transient
Although modern isothermal calorimeters and DSCs arereliable instruments that can achieve remarkably highaccuracies in measurements of heat evolution noinstrument is perfect and parasitic effects will alwaysoccur In calorimetry parasitic effects are often inducedby disturbances from outside of the measuring cellcausing transients in heat flows within the zones whereheat evolution from the sample and reference aremeasured In the experimental aspects of isothermalcalorimetry section above the transient heat flows thatoccur on introduction of a sample in a TianndashCalvet typemicrocalorimeter and on heating a sample in a powercompensation type DSC in isothermal mode to the test
temperature have already been considered Differentialscanning calorimetry in scanning mode will have aninitial transient period in which measurements areunreliable because in the very first phase of theexperiment the heating rate will accelerate from zeroto the target heating rate During this phase ofaccelerating heating the heat flow is variable (it dependson sample pan and initial equipment temperature) andmeasured heat flows are not suited for analysis Inpractice this initial phase of the experiment which canlast approximately from 20 s to 1 min is generallydisregarded The duration of this transient is dependenton the thermal mass (heat capacity6mass) of the sampleand oven with the larger ovens having a larger transientPower compensation DSCs will in general have a lowerthermal mass in the heated parts as compared to heatflux DSCs (Fig 6) Due to the reduced thermal mass inthe oven section power compensation DSCs have theadvantage of a shorter transient In DSCs with a largerfurnace mass transients of around 1 min can occur andat a heating rate of 100 K min21 this would result in atransient stretching over a range of 100 K Thus thesetransients will limit the heating rate that can be used
Baseline variability and drift
After the initial transient reliable calorimetry measure-ments are possible provided calorimetry baseline andbaseline drift are properly accounted for In DIC curvesbaseline drift results from thermal imbalances betweenthe sample and reference of the calorimeter causingmodest changes in baseline position during the course ofan experiment This drift is mostly negligible for TianndashCalvet type instruments provided the instrument isplaced in a climatised room with stable temperaturebut can become significant for smaller instruments whenvery weak heat evolutions andor experiments ofextremely long duration (many hours) are involvedsuch as precipitation reactions in Al based alloys Somemethods to correct for loss of early time data duringcalorimeter instability and baseline drift have beeninvestigated2526
In analysing linear heating experiments the baselineof the DSC needs to be carefully considered as baselineswill generally be a temperature and time dependent27
The importance of baseline analysis can be illustrated
5 DSC curves of 8090 samples machined prior to solu-
tion treatment and quench with varying thickness and
solution treatment time exothermic heat flow on posi-
tive y axis (adapted from Ref 17)
6 Typical furnaces for heat flux DSC and power compen-
sation DSC (figure supplied by Perkin-Elmer)
Starink Analysis of Al based alloys by calorimetry
International Materials Reviews 2004 VOL 49 NO 3ndash4 195
by plotting DSC curves measured using either inertsubstances as sample and reference or by using nosample at all and repeating these experiments over anextended period (eg several months) This type ofwork was performed by Zahra and Zahra27 for aPerkin-Elmer 1020 series thermal analysis system andsubstantial variations in baseline over the period ofa year were identified Unless the heat flows due toreactions that are to be measured are significantly largerthan the variability in the baseline a correction for thetemperature and time dependence of the baseline needsto be carried out The standard procedure is to performa DSC run with either empty inert pans or an inertsubstance as sample and reference Such a baseline runshould be performed at the heating rate that will be usedfor the actual experiment with a real sample and iscarried out just before or just after the actual experimentwith a real sample In the post-analysis the heat flowmeasured in the baseline run will be subtracted from theheat flow in the experiment on the real sample Therequired frequency of baseline runs will be determinedby the time dependency of the baseline
While the above shows the importance of analysingthe baseline of DSC curves there are many examples ofpublications in which DSC curves are presented withoutproviding an explicit indication of the position of thebaseline Such work is not suitable for a quantitativeanalysis of the heat flows but can provide somequalitative information
Solid state reactions in Al based alloys generally causerelatively small heat effects and thus baseline correctionprocedures are critical and baselines will need to bechecked regularly for these reactions Solidndashliquid andliquidndashsolid reactions on the other hand will generallycause much larger heat flows and baseline correction isless important or can even be omitted
Even though the baseline correction procedure will inmany cases be able to correct for baseline variation thisprocedure is sometimes not sufficient to correct for allspurious effects when very small heat effects are beingstudied
Combined baseline variability and heat capacity effects inDSC
Especially for solid state reactions in Al based alloys theheat effects due to reactions will be of the same order ofmagnitude or smaller than heat effects due to the heatcapacity difference of sample and reference Thus ifthe heat effects due to the solid state reactions are tobe studied a correction for the heat effect due to heatcapacity difference will need to be performed Inprinciple the heat effects due to the heat capacitydifference of sample and reference can be calculated onthe basis of the weights and a weighted average of heatcapacities of the elements part of the alloy In practicehowever this cumbersome procedure is often avoidedand the heat capacity effects are corrected for inconjunction with the baseline variability This is possiblebecause the heat capacity of Al in the solid state is ingood approximation a linear function of the tempera-ture Hence if the baseline of the DSC apparatus is alinear function of the temperature the combined effectof the baseline variability and heat capacity is also alinear function and correction for both contributions tothe DSC signal can be corrected for by subtracting a
linear function If two well-spaced temperatures on theDSC curve where no reactions occur can be identifiedthe linear correction function is readily obtained Unlessa reaction occurs immediately on starting the DSC runone of these points is often readily defined as the pointwhere the DSC first reaches a stable heating rate eg afew tens of degrees beyond the start of heating A secondpoint will need to be taken at the point where a reactionhas completed If baselines are second order polynomialfunctions a similar procedure can be followed but nowthree sections where no reaction occurs will need to beidentified
While a more or less accurate determination of thebaseline is generally possible it should be noted that theprocedures always leave some residual error which canbe negligible or significant in comparison to the effectsthat are measured Uncertainties concerning the positionof the baseline can occur particularly for materialsin which reactions take place over the whole of themeasured DSC curve or materials in which heat effectsdue to reactions are small as compared to baselinevariability
Applications of thermal analysis forAl based alloysUsing DSC a range of materials properties andreactions can be studied In the present section severalof these measurements and materials properties areconsidered focusing especially on applications for Albased alloys
Identification of thermal effectsIn subsequent sections it will be shown that calorimetryis a very valuable and efficient technique to analysea number of reactions that occur in Al based alloysHowever before these applications are consideredattention should first be given to how the reaction thatoccurs during a calorimetry experiment and the phasesinvolved in it can be identified As a calorimetryexperiment in itself cannot identify the phases involvedin the reactions other techniques such as (high resolu-tion) electron microscopy and (electron) diffractionshould be used to identify these phases To identify thephase changes unambiguously one would heat treat asample to a condition that corresponds to the start ofthe thermal effect and a second sample would be heattreated to a condition that corresponds to the end of thethermal effect and preferably further samples would beheat treated to intermediate stages In this proceduresamples will generally be rapidly quenched once the heattreatment is completed (Unless a slow cooling experi-ment is the specific objective of the calorimetry study)These samples would then be analysed using a techniquethat provides conclusive information on the phasessuspected to be involved in the reaction For exampleprecipitation reactions would generally be identifiedusing atom probe analysis high resolution transmissionelectron microscopy (HREM) or transmission electronmicroscopy (TEM) with selected area diffraction (SAD)andor chemical analysis for instance by electrondispersive X-ray spectroscopy (EDS) Several of thesestudies have been reported28ndash32 Recrystallisation is mostlyevidenced by using high resolution scanning elec-tron microscopy (SEM) in combination with electron
Starink Analysis of Al based alloys by calorimetry
196 International Materials Reviews 2004 VOL 49 NO 3ndash4
backscatter diffraction (EBSD) crystallisation anddevitrivication is best evidenced by X-ray diffractionand nanocrystallisation is evidenced by TEM with SADMelting reactions can often be indirectly evidenced bystudying eutectic structures in a sample that is rapidlysolidified by quenching after having (partially) meltedusing SEM (possibly in combination with EDS)
While the above procedures are vital to conclusivelyidentify phases involved in reactions detected bycalorimetry many published works on calorimetricanalysis of metals do not contain a detailed micro-structural analysis and many do not contain any directmicrostructural analysis at all Instead a range of otherindirect approaches have been used to tentativelyidentify reacting phases These unproven interpretationsshould be approached with caution
One example of a contested interpretation is that ofthe exothermic effect at about 60ndash100uC that occursin DSC scans of quenched AlndashCundashMg alloys with Cuand Mg contents about 1ndash2 at- (see Fig 7)33 Thisreaction is important as it is the cause of the rapidhardening encountered in important AlndashCundashMg alloyssuch as the 2024 alloy Many authors have studied thisreaction in DSC and attributed it to so-called GPBzones but this was mostly achieved without conclusivemicrostructural evidence Recently three-dimensionalatom probe (3DAP) analysis of an Alndash11Cundash17Mg(at-) alloy has indicated183435 that GPB zones formmuch later in the aging process while SAD in a TEM ofa sample heated to the peak of the exothermic effectrevealed no evidence of GPB zone formation Three-dimensional atom probe (3DAP) analysis showed that ahigh density of CundashMg CundashCu and MgndashMg clustershad developed after 5 min aging at 150uC thus stronglysuggesting that the exothermic effect is due to theformation of these clusters and not to GPB zones Otherresearchers presented HREM data on an Alndash087Cundash144Mg (at-) alloy aged for 4 h at 190uC and 4 h at200uC which was purported to show GPB zones andthis was suggested to support that GPB zones (notclusters) were responsible for the exothermic peak at60ndash100uC1236 But as aging 4 h at 190 or 200uC is
considerably different to heating at about 10 K min21
to 100uC the latter interpretation has to be consideredto be tentative However the interpretation in favour ofGPB zone formation received support from a DSC andTEM study on quenched Alndash44Cundash17Mg (wt-) agedfor 2760 min at room temperature which showedevidence for diffraction effects due to GPB zones33
Clearly the identification of this exothermic effecthas not been conclusively established and DSC workwhich was not supported by electron microscopy oratom probe work37ndash40 and which tentatively ascribedit to GPB zones still awaits confirmation from furthermicrostructural observations
Heat capacity determinationIn heat capacity measurement of a material using DSCa sample of the material to be investigated is placedin the DSC with a reference of known heat capacitycpref(T) The heat capacity of the sample can then bedetermined from heat flow q from the DSC as41
cpsample(T)~qbzcpref (T) (1)
where b is the heating rate As heat capacities of manysubstances are well known the determination of heatcapacity can also be used to calibrate the heat flowmeasurement in the DSC
Solid state reactionsHomogenisation and solution treatment studies
For heat treatable Al based alloys the best balance ofproperties is obtained if the solution treatment is carriedout such that a maximum of alloying elements isdissolved while no melting occurs Hence solutiontreatment is carried out just below the start temperatureof incipient melting In studies of homogenisation andsolution treatment of heat treatable Al based alloysDSC is generally the technique of choice In thesestudies DSC is effective because it provides a rapidassessment of the temperature range for dissolution ofsoluble phases as well as providing the onset tempera-ture of incipient melting
7 a Hardness and b DSC traces from as quenched (a q) and room temperature aged (times on traces in minutes) high
purity Alndash44Cundash17Mg (wt-) alloy samples (from Ref 33) DSC traces show low temperature clusterGPB zone forma-
tion and their subsequent dissolution A Ad B etc highlight several peaks (see Ref 33)
Starink Analysis of Al based alloys by calorimetry
International Materials Reviews 2004 VOL 49 NO 3ndash4 197
The heat effect due to the dissolution of precipitatephases during DSC experiments can be analysed to yielddata on the solvus of the phases even if those phasesare metastable An example for the determination ofthe solvus of d9 (Al3Li) precipitates in AlndashLi alloys isprovided by Noble and Bray42 In this work thedissolution of the d9 is measured for various AlndashLi alloysat a range of heating rates (Fig 8) As dissolution is adiffusion process that requires some finite time tobe completed the temperature where the endothermicreaction finishes is an overestimate of the solvus tempera-ture but by extrapolating the measured solvus tempera-ture to a zero heat rate the true solvus temperature can befound The solvus data obtained from DSC were inagreement with data obtained from resistivity measure-ments and allowed the determination of the solvus of themetastable d9 phase over a range of temperatures
Dissolution reactions in multicomponent heat treat-able Al alloys can also be analysed to some detail usingDSC Figure 9 shows DSC curves from three AlndashZnndashMgndashCu alloys with compositions close to those ofcommercial 7000 type alloys such as 7010 The DSCcurves reveal that the three alloys have differenttemperatures for the onset of incipient melting onealloy melts from about 480uC another from about490uC and the third does not melt below 510uC Thefinal stage of dissolution is very different between thethree alloys with for one alloy the dissolution being
completed at about 440uC while for the other two alloysdissolution continues up to about 470ndash475uC The causefor these complex differences lies in the presence of varyingamounts of the S (Al2CuMg) g (Mg(CuZn)2) and Tphases that can occur at these temperatures either asequilibrium phase43 or as non-equilibrium remnants fromthe eutectics formed during solidification This means thatthe optimal solution treatment temperatures will differ forthe three alloys The effect of particle size on dissolutionkinetics has also been studied by DSC44
Analysis of dissolution and (the onset of) incipientmelting can also be used to explore optimisation ofalloying content For example the optimisation of Znand Mg content for 7000 alloys has been explored45 TheDSC curves indicate that for an Alndash61Znndash23Mgndash19Cundash012Zr (wt-) alloy g phase dissolution iscompleted at about 460uC ie before the solution treat-ment temperature or incipient melting temperatures arereached Hence provided quench sensitivity is not anissue there is some scope for increasing the alloyingcontent of the alloy A reasonable estimate can beobtained directly from the DSC data For this the gphase dissolution effect was approximated by a triangleas illustrated in Fig 10 (Dissolution effects of
9 DSC curves of AlndashZnndashMgndashCu alloys (wt-) revealing differ-
ences in last stages of dissolution effect (up to y475uC)
and the onset of melting (from about 475uC) exothermic
heat flow on positive y axis (adapted from Ref 45)
a AlndashLi (at-) alloys studied at heating rate of
20 K min21 b effect of heating rate on DSC thermogram
of Alndash98Li (at-) alloy
8 DSC curves of AlndashLi alloys (exothermic heat flow on
positive y axis) heat effects are due to formation and
dissolution of d9 phase (from Ref 42)
10 DSC curves of Alndash61Znndash23Mgndash19Cundash012Zr (wt-)
alloy aged for 4 h at 170uC after solution treatment
together with approximation of heat of g dissolution
using triangular heat effect exothermic heat flow on
positive y axis (from Ref 45)
Starink Analysis of Al based alloys by calorimetry
198 International Materials Reviews 2004 VOL 49 NO 3ndash4
equilibrium phases in many Al based alloys roughlyapproximate this shape4647) It was estimated
xgZn(optalloy)
xgZn(alloyB)
~DQ(optalloy)
DQ(alloyB)~
(Te(alloyB)T1)2
(TSTT1)2
(2)
where xgZnethoptalloyTHORN and x
gZnethalloyBTHORN are the gross Zn
content of the optimised alloy and the alloy in Fig 10respectively DQ is the integrated evolved heat TST is thesolutionising temperature and Te and T1 are defined inFig 10 Using TST5475uC this estimate indicates thatboth the Zn and Mg content can be increased by about12 However it should additionally be considered thatMg (and Cu) content should remain below the S phasesolvus and hence Cu Mg and Zn composition shouldbe limited Thus in order to optimise the balance ofproperties alloy compositions around Alndash7Znndash23Mgndash17Cu (wt-) should be considered If processing can becarried out such that incipient melting below 490uC isavoided the solution treatment temperature can beincreased (to about 485uC providing a safety marginof about 5 K) and alloying content can be furtherincreased
Apart from the dissolution effect itself the subsequentmelting of intermetallic phases also provides informa-tion on the progress of homogenisation and solutiontreatment because the magnitude of these incipientmelting effects increases with increasing amount ofintermetallic phase present Lasa and Rodriguez-Ibabe48
used this to study the homogenisation of two AlndashSindashCundashMg alloys with very similar compositions that were castusing different procedures The DSC curves of a conven-tionally cast Alndash12Sindash44Cundash13Mg (wt-) ingot sampleand a thixoformed Alndash15Sindash44Cundash06Mg (wt-) alloyheat treated for various times at 500uC all show amelting effect with onset temperatures between about507 and 511uC (Fig 11) These endothermic effects wereascribed to the reaction4849
a(Al)zSizAl2CuzAl5Mg8Cu2Si6Liquid (3)
with a possible small contribution from the reaction
AlzCuMgAl2zAl2CuLiquid (4)
The total heat content was used as a measure of theamount of Al2Cu present after homogenisation andthus the DSC data indicate that for the conventionallycast alloy at least 2 h were necessary to achieve themaximum amount of dissolution of Al2Cu and achieveequilibrium The curves obtained for the thixoformedalloy show that the dissolution of Al2Cu was muchfaster in this alloy This was probably due to the finerAl2Cu particle size found in this alloy after thixoform-ing and 05 h at 500uC was almost enough to reachequilibrium For further analysis see lsquoVolume fractionof intermetallic phases measured from solidndashliquidreactionsrsquo below
Precipitation studies ndash qualitative analysis
Differential scanning calorimetry and isothermal calori-metry are used extensively to study precipitation reac-tions in heat treatable Al based alloys Recent work hasfocused on quench sensitivity of precipitation hardenedalloys50ndash52 the effect of room temperature (pre-)agingand the formation of clusters and zones3353ndash55 the heataffected zone in welds5657 influence of thermal shock on
precipitation58 and influence of microalloying onprecipitation59 Following on from the extensive workon Al based MMCs in the 1980s and 1990s the influenceof the addition of ceramic reinforcement on precipita-tion has continued to be extensively studied byDSC60ndash63 In this section the main aspects of qualitativeanalysis are described with an overview of aspects ofdetailed quantitative analysis being presented in sub-sequent sections
In precipitation studies using thermal analysis itshould be borne in mind that precipitation can occurbefore during and after the thermal analysis experi-ment and hence the measurement follows only a portionof the process that is studied In practice this leads totwo different strategies of thermal analysis studies ofprecipitation If an alloy is solution treated andquenched and then isothermal calorimetry or DSC isperformed immediately after quenching the mainobjective will be the study of the precipitation reactionsfrom their start ie the aim will be to study precipitationfrom start to finish in the calorimeter However if thealloy is solution treated quenched and then aged beforethe DSC or calorimetry experiment mostly beingstudied will be the further transformations of aprecipitate structure that has been formed before thecalorimetry experiment is started In the former case thefirst reaction will be exothermic and in the latter case
11 Part of DSC curves of conventionally cast Alndash12Sindash
44Cundash13Mg (wt-) ingot sample (alloy A) and thixo-
formed Alndash15Sindash44Cundash06Mg (wt-) alloy (alloy B)
showing incipient melting exothermic heat flow on
positive y axis (from Ref 48)
Starink Analysis of Al based alloys by calorimetry
International Materials Reviews 2004 VOL 49 NO 3ndash4 199
the first reaction to occur can be either exothermic orendothermic depending on the state of precipitation atthe start of the calorimetry experiment and thetemperature (range) at which it is performed
In isothermal calorimetry work one would usuallyaim to start the experiment as soon as possible afterquenching and aim to measure the heat evolution duringas much of the transformation as can practically beachieved An example of an isothermal calorimetrystudy is provided in Fig 2 which shows isothermalcalorimetry data of precipitation in an AlndashSi alloy InDSC studies of precipitation one can also performexperiments that are started immediately after comple-tion of the quench If experiments are limited to just thisonly a limited insight into processes occurring duringisothermal aging would be obtained because limitationson heating rate would mean that only relatively fastprocesses can be studied For example if a reactionwould occur only at temperatures below 200uC and thatreaction would occur after isothermal aging for at least2 h in the temperature range 100ndash200uC then thatreaction would not occur during the DSC experimentbecause DSC would scan through that range typically in1 min to 1 h For this reason a detailed DSC study ofprecipitation will generally involve multiple DSCexperiments on samples that have received a range ofaging treatments An example involving the aging of asolution treated stretched and subsequently first natu-rally aged (for several months) and then artificially agedAlndashCundashMg alloy is shown in Fig 12 These thermo-grams show that during the final aging for 12ndash72 h at150uC the endothermic effect in the range 120ndash240uCdue to clusterzone dissolution first increases andsubsequently decreases whereas the exothermic effectin the range 240ndash300uC due to S phase formationcontinuously decreases This allows a quantitative orsemiquantitative assessment of the formation andordissolution of zonesclusters and S phase64 This type ofassessment of precipitation by DSC on pre-aged sampleshas found wide application65ndash67
Determination of thermal historyfingerprinting of heattreated alloys
The use of DSC for determination of thermal history ofa heat treated alloy is an application that is closely
related to the precipitation studies described in theprevious section The difference is that in determinationof thermal history the aim is not to study the nature ofthe reactions that cause the heat effects in detail butrather to use the DSC as a tool for investigating asample that has undergone an unknown or ill definedheat treatment The application of this technique can befound in quality control of aging treatments eg inverification of industrial heat treatments and in this casethe application is sometimes termed DSC fingerprint-ing6768 Another application is in assessing heat treat-ments that parts of materials that are inaccessible forrecording of temperature history have undergone Anexample of the latter is the study of heat affected zonesin welds of heat treatable Al based alloys56
For an alloy in which a multistage aging sequenceoccurs the DSC curve will generally be complexcontaining several endothermic and exothermic effectsIn the course of the heat treating of an alloy in which amultistage aging sequence occurs the DSC curve willchange in a complex manner an example of this isprovided in Fig 13 for an 7449 alloy heat treated tovarious commercially applied and non-commercialtreatments69
Precipitate coarsening ndash qualitative analysis
The kinetics of precipitation and dissolution reactions inheat treatable Al based alloys will in general depend onthe size of the precipitates and thus DSC is sensitive tosize of precipitates The exothermic heat effect due tocoarsening is caused by two factors First the reductionof precipitatematrix interfacial area will reduce the totalinterfacial area of the system and second the reductionof the interfacial energy per precipitate will reduce themetastable solubility of elements dissolved in the matrixthus allowing an increase in the volume fraction ofprecipitates The latter is described by the GibbsndashThompsonndashFreundlich relation which gives the ratiobetween the equilibrium concentration of solute in thematrix cmeq and the metastable solubility in the vicinity
12 DSC curves of solution treated and stretched Alndash
118Cundash051Mgndash021Mn (at-) alloy aged for various
times at 150uC exothermic heat flow on positive y
axis (from Ref 64)
effect II mostly g9 dissolution and dissolution of fine g
effect III precipitation and coarsening of g effect IV
mostly dissolution of g
13 DSC curves at heating rate of 10 K min21 of solution
treated and aged samples of 7449 (AlndashZnndashMgndashCundashZr)
alloy T651 is peak aged and T7951ndashT7E represent
aging treatments with increasing overaging exother-
mic heat flow on positive y axis (adapted from
Ref 69)
Starink Analysis of Al based alloys by calorimetry
200 International Materials Reviews 2004 VOL 49 NO 3ndash4
of a spherical particle cm as
cm
cmeq
~exp2cVm
RTrp
(5)
where c is the interfacial energy rp is the particle radiusVm is the atomic volume of the particles and R is the gasconstant However due to small heat effects involved itis often difficult to perform meaningful analyses ofcoarsening of precipitates in Al based alloys using DSCIt should also be noted that evidencing coarseninginvolves the measurement of change of sizes and volumefractions of precipitates for example by TEMEspecially the change in volume fraction can be smalland difficult to determine reliably and thus evidencingall the factors influencing the heat effects due tocoarsening can be difficult certainly in comparison withreactions that involve phase changes
In DSC studies on peak aged and overaged samplesof a 7050 Al based alloy (Alndash645Znndash21Mgndash215Cu(wt-) Alndash28Znndash245Mgndash095Cu (at-))70 and arange of other AlndashZnndashMgndashCu based alloys45697172 itwas observed that with increasing overaging the peakand end temperature of the endothermic dissolutionpeak of the main strengthening precipitates (effect II inFig 13) shift to higher temperatures while the start isabout constant and equal to the prior aging temperature(170uC) One study71 considered that this change in effectII was directly related to coarsening but in anotherwork72 it was suggested that the changes in the DSCcurves are caused by a reduction in the size of effect IIIwhich was ascribed to the exothermic coarseningreaction implying that the underlying dissolutionreactions (effects II and IV) remain largely unchangedWith no direct microstructural evidence of the evolutionof precipitate volume fractions and sizes during linearheating available there is no conclusive evidence tosupport either interpretation In these works thecoarsening reaction was used to quantitatively explainthe change in strength on overaging
Defect annihilation recovery and recrystallisation in
wrought alloys
An example of a DSC study on a deformed non-heat-treatable alloy is the work on a nanocrystalline Alndash76at-Mg (Alndash69wt-Mg) alloy powder that was
produced by ball milling at liquid nitrogen temperatures(lsquocryomillingrsquo)73 The DSC curve of this powder (Fig 14)shows two relatively small exothermic effects prior to theoccurrence of melting from about 530uC As X-raydiffraction (XRD) analysis of the ball milled samplesafter aging at 230uC had shown a significant reduction inlattice strain the first exothermic effect between 100 and230uC was ascribed to recovery (the removing andclustering of dislocations) and elimination of twins Thesecond effect between 300 and 360uC was ascribed torecrystallisation
For heat treatable Al based alloys the heat effects dueto vacancy annihilation recovery and recrystallisationare generally much smaller than heat effects due toprecipitation or dissolution of precipitates and theygenerally occur in overlapping temperature rangesHence the exothermic heat effects due to vacancyannihilation recovery and recrystallisation can often notbe determined in heat treatable Al based alloys Indeformed Al alloys for which no precipitation ordissolution reactions occur (pure Al or dilute non-heat-treatable alloys) recovery and recrystallisationmight be detectable in DSC
Modulated differential scanning calorimetry (MDSC)has also been applied to reveal recovery in themechanically alloyed Al93Fe3Ti2Cr2 alloy in the asmilled condition (see Fig 15)74 It was indicated byTEM and XRD that this as milled material is composedof an Al based supersaturated solid solution with highinternal strains With the aid of XRD the DSC curvehas been interpreted as revealing recovery (effect 1) andformation (precipitation) of intermetallic phases Al6FeAl3Ti and Al13Cr2 (and possibly Al13Fe4) (effects 2 3and 4)
Devitrivication nanocrystallisation
Aluminium based alloys containing transition metalsand rare earth elements are candidates for the develop-ment of ultrafine grained (nanostructured) materialsThe achievement of such a microstructure depends on
14 DSC curves for as milled Alndash69Mg (wt-) alloy
(16 K min21 heating rate) inset is enlarged portion of
DSC curve (from Ref 73)peak 1 recovery peak 2 3 4 formation (precipitation)
of intermetallic phases Al6Fe Al3Ti and Al13Cr2 (and
possibly Al13Fe4) respectively
15 Non-reversing heat flow from modulated DSC experi-
ments on as milled Al93Fe3Ti2Cr2 alloy powder in her-
metic Al pan with heating rate of 2 K min21 (from
Ref 74)
Starink Analysis of Al based alloys by calorimetry
International Materials Reviews 2004 VOL 49 NO 3ndash4 201
the processing conditions and may be achieved bycontrolled heat treatment of amorphous alloys Theamorphous and nanostructured alloys show different(usually enhanced) physical chemical and mechanicalproperties from those of either the conventional poly-crystalline or amorphous state including a high strength(1500 MPa) and excellent high strengthweight ratioDifferential scanning calorimetry has proved to be themost effective method for characterising the kinetics ofdevitrivication including the nanocrystallisation in theseamorphous alloys and is applied in a large number ofstudies75ndash80 although isothermal calorimetry has alsobeen applied81
An instructive application of DSC to the study ofdevitrivication is the work by Gich et al82 on thedevitrivication of a range of rapidly solidified amor-phous AlndashNindashSm ternary alloys The DSC curves ofthree of the alloys are shown in Fig 16 and these curvesshow three exothermic effects that have been ascribed tothe following reactions
A amorphousa-Alzamorphous0
(primary crystallisation)
B amorphous0a-Alzintermatallic phases
(eutectoid crystallisation)
C transformation of intermetallic phases
where amorphous9 signifies the amorphous phase withincreased alloying content resulting from the rejectionof alloying elements from the a-Al phase83 In fact thisidentification of these three types of reaction on heatingof amorphous Al based alloys is common to manyamorphous Al based alloys The types of intermetallicphases formed are dependent on the alloying additionsfor example in the AlndashNindashSm ternary alloys shown inFig 16 intermetallic phases were identified as Al3Sm(formed in reaction B) and Al11Sm3 (formed in reactionC) The temperature ranges of the heat effects as well asthe activation energies (see subsection lsquoMeasuredactivation energies in Al based alloysrsquo below) dependstrongly on the composition revealing how compositionaffects the relative stability of the amorphous thenanocrystalline and the intermetallic phases
Multilayers and interfacial reactions
Differential scanning calorimetry has been applied to thestudy of reactive diffusion in metallic multilayers contain-ing Al layers a detailed overview of experimental pro-cedures and of pre-1997 work is provided by Michaelsenet al7 The evolution of microstructure and the associatedtransformation kinetics in reacting thin films andparticularly transition metals and Al polycrystalline thinfilms are highly relevant to the semiconductor industrywhere such reactions occur in the production of integratedcircuits Layered systems studied by calorimetry includeNbAl8485 TiAl86 NiAl87 ZrAl7 and CoAl88
Isothermal calorimetry and DSC have been employedto study the reaction between ceramic reinforcementsand Al matrix in Al based composites8990
Solidndashliquid and liquidndashsolid reactionsSolidification
In studies of solidification of Al based alloys DSC orDTA performed at constant cooling rate is often akey technique With DSC it is possible to track thesolidification process by virtue of the large endothermicheats produced by the liquidndashsolid transformation Forpure Al the heat effect due to solidification will be asharp exothermic peak starting at a temperature belowthe equilibrium melting temperature The differencebetween liquidus and onset of solidification DT is theundercooling which is an important factor determiningthe microstructure of the solidified alloy An illustrationof an application of DSC to a relatively simple binary Albased alloy is the study of solidification in an Alndash45Cu(wt-) alloy by Larouche et al91 The DSC curves forcooling at different rates shown in Fig 17 reveal thesolidification of the Al rich phase which occurs mostlybetween 643 and 600uC and is dependent on coolingrate With the eutectic temperature being located at547uC the reactions occurring just below that tempera-ture are the solidification of the eutectic
The influence of preparation of the melt on solidifica-tion of AlndashSr alloys was studied by Zhang et al92 Intheir work the solidification of two Alndash10Sr (wt-)alloys one prepared by molten salt electrolysis and oneprepared by a direct mixing method were investigatedThe resulting DSC curves shown in Fig 18 reveal thatthe undercooling at which solidification starts issignificantly different for the two alloys and this wasshown to correspond to a significantly different dendriticsolidification structure It was speculated that the
17 DSC curves of solidification of Alndash45Cu (wt-) alloy
at cooling rates of 5 10 and 60 K min21 (from
Ref 91)curve a Al90Ni4Sm6 curve b Al88Ni6Sm6 curve c
Al88Ni4Sm8 (all curves show three exothermic heat
effects)
16 DSC curves (40 K min21 heating rate) of amorphous
AlndashNindashSm alloys (from Ref 82)
Starink Analysis of Al based alloys by calorimetry
202 International Materials Reviews 2004 VOL 49 NO 3ndash4
intensive current and electromagnetic field in theelectrolysis process would have had a significant effecton the liquid of the AlndashSr melt and the subsequentsolidification process and the microstructure
An illustration of application to a more complex alloycan be found in the study of Hsu et al93 on solidificationin an Alndash06Sindash08Mgndash03Fe (wt-) alloy In this workthe authors employed the entrained droplet technique94
in which 1ndash1000 nm liquid droplets are entrained in asolid matrix which acts as a heterogeneous nucleationcatalyst and their solidification is monitored usingDSC
It should in principle be possible to compare the heateffects during cooling with the thermodynamic andphase diagram predictions made by the approachescollectively termed CALPHAD (CALculation of PHaseDiagrams) Some success has been obtained in studiesof mixing and dissolution of liquids and elementalpowders but reports on successful analysis of enthalpiesof solidification reactions in Al based alloys are largelyabsent from the literature One study carried out byYoussef et al95 compared the latent heat of solidifica-tion of a commercial purity Al alloy and a commercialpurity alloy with additions of TiB2 particles It wasobserved that even though TiB2 particles were pre-sumed the latent heat of solidification of the Al wassignificantly different for the metal matrix composite ascompared to the commercial purity Al alloy Thedifference was spectulatively ascribed to the creation ofelastic strain energy during solidification
Melting and incipient melting
Depending on complexity and alloying content theheating of an Al alloy can give rise to one or a range ofendothermic melting effects96 A DSC trace of meltingof pure Al showing a single peak due to melting of the Alrich phase is depicted in Fig 19 In Al alloys whichcontain intermetallic phases the melting of the Al richphase is often preceded by melting of one or more ofthose minority phases and this type of melting is oftentermed lsquoincipient meltingrsquo Illustrations of application tomore complex alloys are studies by Sha et al97 onmelting in an Alndash06Sindash08Mgndash03Fe (wt-) alloy andby Wang et al49 on Alndash11SindashxCundash03Mg (wt-) alloysIn Fig 20 DSC scans showing the melting reactions in
conventionally mould cast Alndash11SindashxCundash03Mg (wt-)alloys are presented The four reaction peaks (labelled 12 29 3) that can be observed in these DSC scans wereattributed to
1 a(Al)zSi(zAl5SiFez )OLiq
2 a(Al)zCuAl2zSiOLiq
20 a(Al)zSizMg2SiOLiq
3 a(Al)zCuAl2zSizCu2Mg8Si6Al5OLiq
Microalloying with Na Sr or Be has a distinct effect onthe as cast microstructures of these alloys and alsoinfluences subsequent remelting This is illustrated inFig 21 Modification with Na has little effect on theposition of peak 3 but with Be and Sr modificationwhich both enhance the mechanical properties of thesealloys the beginning temperature of peak 3 shifts toabout 512ndash513uC This DSC study thus revealed that therestrictive solution temperature to avoid incipient
18 DSC traces of Alndash10Sr (wt-) alloy prepared by elec-
trolysis (dashed line) and mixing (solid line) during
solidification at cooling rate of 20 K min21 (from
Ref 92)
19 DSC traces of melting of 99999 pure Al at heating
rate of 25 K min21 (from Ref 91)
1 a(Al)zSi(zAl5SiFezhellip)OLiq
2 a(Al)zCuAl2zSiOLiq
29 a(Al)zSizMg2SiOLiq
3 a(Al)zCuAl2zSizCu2Mg8Si6Al5OLiq
20 Heating DSC curves for as cast samples of Alndash11Sindash
xCundash03Mg (wt-) alloys showing melting peaks (from
Ref 49)
Starink Analysis of Al based alloys by calorimetry
International Materials Reviews 2004 VOL 49 NO 3ndash4 203
melting of intermetallic phases could be increased byabout 5 K in the latter modified alloys
Sha et al97 showed that DSC can also be used tostudy the effect of solidification rates on the solidifica-tion reactions and the final solidified microstructure InFig 22 DSC heating curves for Alndash06Si-08Mgndash03Fe(wt-) alloy samples that were solidified at growthvelocities in the range 5ndash120 mm min21 in a Bridgmantype furnace are compared with a sample that wasslowly solidified at a rate of 10 K min21 These DSCcurves show four endothermic reactions (indicated lsquoarsquolsquobrsquo lsquocrsquo lsquodrsquo) and through comparison with knowntemperatures of invariant reactions and with the aidTEM and XRD work these effects were identifiedEffect lsquobrsquo corresponds to a-AlFeSi eutectic melting
a(Al)za-AlFeSiOLiq
effect lsquocrsquo corresponds to a-AlFeSi peritectic melting
a(Al)za-AlFeSiOLiqzAl13Fe4
effect lsquodrsquo corresponds to eutectic melting of Al13Fe4 (alsoindicated as Al3Fe)
a(Al)zAl13Fe4OLiq
The DSC trace from the alloy solidified at 10 K min21
shows that only effects lsquocrsquo and lsquodrsquo are present during theheating cycle The amount of heat released at effect lsquobrsquoof the specimen grown at 5 mm min21 is much less thanthat for the specimen grown at 120 mm min21 indicat-ing that at higher growth velocities in the range 80ndash120 mm min21 more a-AlFeSi phase is formed by theeutectic reaction These results therefore suggested thatthe more non-equilibrium the solidification the morelikely the a-AlFeSi is to form via the eutectic rather thanthe peritectic reaction Effect lsquoarsquo in the DSC tracescorresponds to the melting of the metastable b-AlFeSiphase The alloy solidified at 10 K min21 shows neithereffect lsquoarsquo nor lsquobrsquo Sha et al97 explained this observationby noting that because it is not an equilibrium phase inthe alloy it is unlikely that b-AlFeSi forms at such a slowcooling rate
Determination of heat of incipient melting has alsobeen used to define alloys and processing combinationsin patents on 2000 6000 and 7000 type Al basedalloys9899 The patent on high strength 7000 alloys99
specifically states lsquoThe alloys contain by weight 7 to135 Zn 1 to 38 Mg 06 to 27 Cu 0 to 05 Mn0 to 04 Cr 0 to 02 Zr others up to 005 each and015 total and remainder Al Either wrought or castalloys can be obtained and the specific energy asso-ciated with the DEA melting signal of the product islower than 3 Jgrsquo
Partial melting is an important part of the sinteringprocess as used for the consolidation to near full densityof Al alloy powders The DSC technique has beenemployed in studies of sintering to determine tempera-ture ranges for partial melting of the alloys43100
CALPHAD mixing and dissolution of powdersand liquidsFor obtaining thermodynamic functions of liquid andsolids DSC DTA and isothermal calorimetry areimportant tools Such measurements can be used inverification of the predicted phase diagrams and areassessed and predicted using the approaches collectivelytermed CALPHAD Especially onset of melting ofphases during heating101ndash103 is used to support predictedphase diagrams and measurement of enthalpies offormation of intermetallic phases from reaction ofelemental powders104 or through drop solution calori-metry105ndash108 is used to directly determine formationenthalpies Also DSC data on precipitation reactionscan be used in assessing phase diagrams109 Enthalpiesof mixing of liquid phases are measured by hightemperature calorimetry110ndash112 Further thermodynamicdata can be obtained by measuring the enthalpies ofdissolution of elements in liquid Al113
effect a melting of metastable b-AlFeSi phase effect
b a-AlFeSi eutectic melting effect c a-AlFeSi peritectic
melting effect d eutectic melting of Al13Fe422 DSC heating traces of Alndash06Sindash08Mgndash03Fe (wt-)
alloy solidified at different growth velocities DSC
heating rate is 10 K min21 (adapted from Ref 97)
DEA melting signal in this case refers to the heat content of the incipientmelting peak in a DSC experiment
21 Effect of microelements on DSC curves of Alndash11Sindash
4Cundash03Mg alloy (wt-) all effects are due to melting
of phases (from Ref 49)
Starink Analysis of Al based alloys by calorimetry
204 International Materials Reviews 2004 VOL 49 NO 3ndash4
Modelling of thermally activatedreactions
Introduction general objectivesIn many cases calorimetry data obtained for metalshave been analysed in a purely qualitative manner ieby relating the presence of endothermic or exothermiceffects to particular reactions without attempting toobtain quantitative information on these reactions theirprogress or the mechanisms involved Quantitativeanalysis is more often performed for isothermal experi-ments as compared to linear heating experiments This isrelated to the availability of isothermal models whichare mathematically simpler than their non-isothermalequivalents In the present section these quantitativeanalysis methods are reviewed and their applicabilityassessed
The type of modelling of thermally activated reactionsthat has been used in conjunction with calorimetry orthat can be applied to calorimetry is of a broad anddiverse nature Modelling approaches can mostly beclassified as one of three types
N generic analysis models which are models that userelatively simple expressions that provide the fractiontransformed as a function of time or reaction rate as afunction of fraction transformed and that areapplicable to a wide range of reactions
N simplified physically based models which are modelsthat are specifically based on considerations of thephysical or chemical process often with adjustableprocess-related parameters such as impingementparameters that allow some flexibility in analysingdata
N simulations which are models that make predictionsoften using extensive computer time with all modelparameters being fixed
In using generic analysis models the aim would be tofind an adequate description of the progress of thereaction as a function of time and temperature withlimited consideration being given to the physical basisOn the other extreme simulations are based on thepresumption of a complete understanding of thephysical process with all process and kinetic parametersknown and in this case calorimetry or any otherexperimental work is not used to analyse a reactionbut instead to validate a model Simplified physicallybased models with adjustable process-related parametersaim to analyse experimental data with due regard to thephysical processes while making as little as possiblepresumption about the process
This section focuses on modelling methods that canbe used to analyse calorimetry (especially DSC) data interms of physical processes without making too manypresumptions about the process Hence physicallybased models with adjustable process-related parametersare the focus of discussion and assessments are made ofhow these approaches relate to more specific modelssuch as simulations and also of how they fit into moregeneric analysis methods Thus analysis methods thathave some inherent flexibility that allows them to copewith different types of reactions are mainly consideredrather than discussing in detail computer based simula-tions that are very specific to the reaction considered anddepend on prior knowledge of the physical parametersinvolved The emphasis is on developments that have
appeared over the past 10 years and that are suited foranalysis of thermally activated reactions in Al basedalloys
A general objective of the modelling of thermallyactivated reactions by generic analysis methods andphysically based methods is the derivation of a completedescription of the progress of a reaction that is valid forany thermal treatment be it isothermal by linearheating or any other non-isothermal treatment In thecase of physically based methods an additional aim is tobe able to use the analysis to understand the processesinvolved in the reaction At the outset it should berealised that for many reactions these objectives aredaunting Especially for solid state reactions any givenreaction might progress through a range of mechanismsand intermediate stages all of which will in generalhave a different temperature dependency To come toterms with this complexity simplifying assumptions areoften made and throughout the subsequent sectionsseveral analysis methods based on simplifications arereviewed
Single state variable approaches (singleArrhenius term)The most popular way of dealing with the complexity ofthermally activated reactions is through the assumptionthat the transformation rate during a reaction is theproduct of two functions one depending solely onthe temperature T and the other depending solely on thefraction transformed a (Refs 114ndash117)
da
dt~f (a)k(T) (6)
The temperature dependent function is generallyassumed to follow an Arrhenius type dependency
k~ko exp E
RT
(7)
where E is the activation energy of the reaction Thusto describe the progress of the reaction at all tem-peratures and for all temperaturendashtime programmes thefunction f(a) and the constants ko and E need to bedetermined In general the reaction function f(a) isunknown at the outset of the analysis A range ofstandard functions which represent particular idealisedreaction models have been proposed118119 (see Table 1)Through selection of specific f(a) the formalismdescribed by the above two equations describes specifictypes of reaction kinetics For example the formalismcan incorporate JohnsonndashMehlndashAvramindashKolmogorov(JMAK) kinetics for
f (a)~nfrac12ln(1a)(n1)=n(1a) (8)
Within this concept the description of the progress of areaction is reduced to finding appropriate values for Eko and the function f(a) ndash the so-called kinetic triplet Inthe sections lsquoActivation energy determinationrsquo andlsquoSingle stage reaction modelsrsquo below techniques foranalysing DSC and isothermal calorimetry data basedon equations (6) and (7) are considered but first anapproach that allows comparison of progress ofisothermal reactions with non-isothermal reactionsthrough the lsquoequivalent timersquo concept is discussedStudies from the past 5ndash10 years are mainly considered
Starink Analysis of Al based alloys by calorimetry
International Materials Reviews 2004 VOL 49 NO 3ndash4 205
for an extensive overview of pre-1996 work the reader isreferred to the work by Galwey and Brown119
Equivalent time state variable and temperatureintegralThe equivalent time concept refers to a method designedto describe any non-isothermal treatment with tempera-ture path T(t) by a single variable termed the equivalenttime It thus allows comparison of the progress of areaction when samples are exposed to different tem-perature paths T(t) eg compare the progress of areaction under linear heating conditions with theprogress during isothermal annealing The equivalenttime approach is valid if the progress of a reaction canbe described by a single state variable and in thefollowing subsection the state variable approach isreviewed and the expression for equivalent time isderived
State variable approach and equivalent times
In the state variable approach we consider that thefraction transformed is a unique function of a statevariable v If there is one single temperature dependentprocess operating v is given by
v~
ethtet~0
kdt (9)
For isothermal reactions at Tiso it simply follows
v~kte (10)
The state variable approach is justified in the case thatequation (6) is valid ie the transformation rate duringa reaction is the product of two functions onedepending solely on the temperature and the otherdepending solely on the fraction transformed In this
case we can integrate the above equationethtet~0
da
f (a)~
ethteto
k(T)dt (11)
and as the left-hand side of this equation is a uniquefunction of the fraction transformed we can define astate variable as
v~
ethtet~0
da
f (a)(12)
One result from these equations is the derivation of theequivalent time which is defined as the time attemperature Tiso needed to complete the same amountof the reaction during a non-isothermal annealConsidering that in many cases k can be assumed tobe an Arrhenius expression the equivalent time is givenas
teq~
ethtet~0
exp E
RT(t)
dt exp
E
RTiso
1
(13)
For linear heating we can derive
ethtet~0
exp E
RT(t)
dt~
E
Rb
ethy~yf
exp(y)
y2dy (14)
where y5ERT yf5ERTe (Te being the temperaturereached during the linear heating) and b is the heatingrate Thus to obtain the equivalent time for linearheating we need to calculate the integraleth
y~yf
exp(y)
y2dy~p(yf ) (15)
This integral p(y) is termed the temperature integral orArrhenius integral
Table 1 Selected expressions for reaction function f (a) note that SestakndashBerggren model encompasses R1ndashR3 A1ndashA3and AGn models while the SZ model encompasses R1ndashR3 A1ndashA3 AGn AR and mean field models
Reaction Code f(a) a(t) Ref
Random nucleation unimolecular decay law(1st order)
F1 12a 12exp[2kt] 119
Phase boundary controlled reaction(1st order)
R1 1 kt 119
Phase boundary controlled reaction(2nd order contracting cylinder)
R2 (12a)12 12(12kt)2 119
Phase boundary controlled reaction(3rd order contracting sphere)
R3 (12a)23 12(12kt)3 147
JMAK linear growth in 1D (eg growth ofplate) after saturation of nucleation (n51)
A1 12a 12exp[2kt] hellip
JMAK linear growth in 2D after saturation ofnucleation (n52)
A2 2[2ln(12a)]12(12a) 12exp[2(kt)2] 119
JMAK linear growth in 3D after saturation ofnucleation (n53)
A3 3[2ln(12a)]23(12a) 12exp[2(kt)3] 119
JMAK diffusion controlled growth in 3D aftersaturation of nucleation (n51K)
A1K 1K[2ln(12a)]13(12a) 12exp[2(kt)1K] hellip
JMAK continuous nucleation and diffusioncontrolled growth in 3D (n52K)
A2K 2K[2ln(12a)]35(12a) 12exp[2(kt)2K] hellip
Precipitate growth in 3D after saturation ofnucleation in mean field approximation
H1K a13(12a) 12[(kt)32567z1]2567
(approximation)App 2
JMAK (generalised) AGn n[2ln(12a)](n21)n(12a) 12exp[2(kt)n] 114SestakndashBerggren SB am[2ln(12a)]q(12a)p No known closed
expression115
AustinndashRickett (AR) equation ARn n[(12a)2121](n21)n(12a)2 12[(kt)nz1]21 116 117SZ SZn n[(12a)21g21](n21)n(12a)(gz1)g 12[(kt)ngz1]2g 170 171
Note that A1 and F1 are mathematically identicalAppendix 2 of the present paper
Starink Analysis of Al based alloys by calorimetry
206 International Materials Reviews 2004 VOL 49 NO 3ndash4
Temperature integral and its approximations
A range of approximations of the temperature integralp(y) have been suggested in the literature All the knownapproximations will lose accuracy for small values of y(typically for y below 10ndash15) and some lose accuracy forlarge values of y (typically y exceeding 100) To be ableto appreciate the relevance of these deviations we needto consider the range of y values that can be encounteredwhen analysing linear heating data of thermallyactivated reactions In a recent work120 it was shownthat the range of y values that will in practice occur islimited for various reasons First it was considered thatreactions with high activation energy would generallyoccur at high temperatures and vice versa This will tendto limit the occurrence of extremely low or extremelyhigh values of y (5ERT) Second it was considered thatfor diffusion controlled reactions the typical diffusiondistance l is given by l5(Dt)12 where D is the diffusioncoefficient which is generally given by
D~Do exp ED
RT
(16)
and thus
y~ED
RT~ln
l2
Dot
(17)
Again extreme values of y are unlikely because (i) l andt are limited due to practical considerations and thelower limit for l is defined by interatomic distance (ii)larger diffusion distances l will imply longer experimenttimes t (iii) the logarithmic function will limit variationIt was concluded that only the range 9y100 is ofpractical significance while the overwhelming majorityof reactions in fact occur for 15y60 In this workreactions in Al alloys are the major concern andreactions will generally occur within the latter morerestrictive limits for y
The temperature integral can be calculated usingexpansions of the integral in an infinite series of whichseveral forms have been proposed120ndash122 and a range ofapproximations in the form of a finite number of termshave been proposed in the literature120123ndash129 In termsof practical applicability especially approximations ofthe following form are useful
p(y)exp (AyzB)
yk(18)
where k is a constant between 0 and 2 and A and B areconstants that depend on k This class of approxima-tions is important because it leads to single term closedform expressions for the equivalent time and also formsthe basis for the derivation of a group of activationenergy analysis methods (the direct methods) describedin the following section For each value of exponent k Aand B can be optimised by minimising the deviationbetween the approximation function and the exactintegral From this group of methods the approxima-tion for which the deviation reduces to zero in the limitof very large values of y is the approximation by Murrayand White126
p(y)exp(y)
y2(19)
It has been shown120129 that from this group of
approximations the approximation with A51 that ismost accurate for 20y60 is obtained with k5195which leads to
p(y)exp(y0235)
y195
(20)
if A is not required to be equal to 1 a highly accurateapproximation is given by120
p(y)exp(10008y0312)
y192
(21)
Analyses of accuracies of selected approximations of thetemperature integral have been published in severalworks120130 Comparison of the accuracies of theseapproximations is straightforward and in Fig 23 theaccuracies are compared by plotting ln(pap) where pa isan approximation of p such as those in equations (18)ndash(21) The figure shows that the above two approxima-tions obtained with k5195 and 192 are highly accurateHigher accuracies can be achieved with the morecomplicated expressions (such as the Senum and Yangexpression122128) but these are too complex to yield atransparent analysis method The often quoted Doyleapproximation123ndash125 proves to be the most inaccurateof the approximations tested in Fig 23 and is notconsidered further in this overview
To complete the calculation of the equivalent time forlinear heating we now need to choose which approxi-mation of p(y) is appropriate The approximation inequation (19) has been used to this end and leads to131
teqTf
b
RTf
Eexp
E
RTf
exp
E
RTiso
1
(22)
A better accuracy would be achieved by employingequation (20) to yield
teq0786Tf
b
RTf
E
095
exp E
RTf
| exp E
RTiso
1
(23)
The above expressions for equivalent time can be used inmany problems where the progress of a reaction duringlinear heating needs to be compared with the progressduring isothermal aging (or linear heating at a differentheating rate) For example in work on an 8090 (Alndash240Lindash116Cundash075Mgndash010Zr wt-) metal matrix
23 Relative accuracy of various approximations for tem-
perature integral (adapted from Ref 120)
Starink Analysis of Al based alloys by calorimetry
International Materials Reviews 2004 VOL 49 NO 3ndash4 207
composite the peak of the formation of semicoherent Sphase during heating at 10 K min21 was observed at300uC132 Using that the peak reaction rate occurs fora fraction transformed of about 69 and that theactivation energy for this reaction is 107 kJ mol21equation (22) predicts that at 170uC S phase formationis 69 completed in about 30 h This was found to beconsistent with isothermal aging data
Activation energy determinationTo analyse a thermally activated reaction using theapproach described by equations (6) and (7) we need toobtain the kinetic triplet E ko and the function f(a) Asf(a) is generally not known at the outset of the analysisand ko is a pre-exponential factor that can be adjustedrelatively easily after the other two elements of thetriplet are determined analysis is usually started bydetermining E Once E has been determined thecombination of the value of E and a single transforma-tion curve (ie a curve of a versus t) essentially providesthe solution to the determination of the kinetic tripletand thus determines the kinetics of the reaction withinthe simplified framework provided by equations (6) and(7) From this it will be clear that the determination ofthe activation energy is the crucial step in the analysisAnother reason for the importance of the determinationof the activation energy of the reaction lies in the factthat the activation energy for the overall reaction willgenerally be related to an activation energy for thephysical process that determines the rate of the reactionFor example if the rate determining step is diffusion ofan element through a material the activation energy ofthe overall process will in most cases be determined bythe activation energy for diffusion of that element Thusthe activation energy of the overall process will provideinformation on the physical process that is rate limitingand hence the objective of activation energy analysis isnot only as the first step in characterising the kinetictriplet but it can also be an objective in itself leadingto a better understanding of the mechanisms of thethermally activated reaction
For linear heating experiments activation energies ofreactions can be derived from a set of experimentsperformed at different heating rates For this activationenergy analysis a large number methods have beenproposed (a selection of methods can be found inRefs 129 131 133ndash147) The aim of the present sectionis to describe the main features and accuracies of thesemethods and provide recommendations about whichmethods are best suited for analysis of particular DSCdata It will be shown that several methods have acombination of relative simplicity of application andgood accuracy which allows them to be used foractivation energy analysis in Al based alloys
Activation energy analysis using isoconversion methods
From equations (6) and (7) it follows immediately thatfor transformation studies by performing experiments atconstant temperature Ti E can be obtained from thewell known relation
ln tf~E
RTi
zC1 (24)
where tf is the time needed to reach a certain fraction
transformed and C1 is a constant which depends on thereaction stage and on the kinetic model Thus E can beobtained from two or more experiments at differentvalues of T
All reliable methods of activation energy analysis forlinear heating experiments require the determination ofthe temperatures Tf(b) at which an equivalent stage ofthe reaction is obtained for various heating rates120143
Hence the term isoconversion methods The equivalentstage (also called the constant or fixed stage) may bedefined as the stage at which a fixed amount is trans-formed or at which a fixed fraction of the total amountis transformed Isoconversion methods can be cate-gorised into one of two main groups of methods120 Oneset of methods relies on approximating the temperatureintegral p(y) and requires data on Tf(b) only This firstset of methods includes the Kissinger method131133148
the KissingerndashAkahirandashSunose method134 (also termedthe generalised Kissinger method131) the FlynnndashWallndashOzawa method135ndash137 and several methods that weredevised more recently120122129 These methods havebeen termed type B isoconversion methods or p(y)-isoconversion methods120 The approximation of thetemperature integral which is key to these methods ishere illustrated by considering the derivation of theKissingerndashAkahirandashSunose (KAS) method In thisderivation equation (7) is inserted in equation (6) andthis is integrated by separation of variablesetha
0
da
f (a)~
ko
b
ethTf
0
exp E
RT
dT
~RE
bkB
ethyf
exp(y)
y2dy (25)
where Tf is the temperature at an equivalent (fixed) stateof transformation and b is the heating rate Using theMurray and White126 approximation for p(y) (equa-tion (19)) yields
ln
etha0
da
f (a)~ln
koE
Rzln
1
by2fyf (26)
At constant fraction transformed a this leads to
lnb
T2f
~E
RTfzC2 (27)
where C2 and subsequent C3 C4 etc are parametersthat are independent of T and b According to
equation (27) plots of ln(T 2f b) versus 1Tf should result
in straight lines the slope of the straight lines beingequal to ER This is the basis of the KAS equation Themodel can further be applied to the maximum rate andthis isoconversion model is termed the Kissingermethod133 It was shown73129 that the KAS analysis ispart of a group of methods which can be described bythe generalised equation
lnb
Tkf
~Ea
RTf
zC3 (28)
For temperatures and activation energies commonlyencountered in solid state reactions k5195 results in thebest accuracy of activation energy determination from aplot of ln(T k
f b) versus 1Tf120
A second set of isoconversion methods38139140 doesnot make any mathematical approximation but requires
Starink Analysis of Al based alloys by calorimetry
208 International Materials Reviews 2004 VOL 49 NO 3ndash4
the rate of transformation at Tf(b) as well as data onTf(b) These methods are referred to as type Aisoconversion methods120 (or Friedman methods afterthe researcher who first derived the method139) Themethod is derived by inserting equation (7) intoequation (6) and taking the logarithm yielding38139
lnda
dt~
E
RTfln f (a) (29)
Thus if a range of linear heating experiments atdifferent heating rates b are performed and the timesat which a fixed stage of the reaction is achieved can beidentified for each linear heating experiment f(a) will bea constant By measuring Tf and the transformation ratedadt at that fixed stage for each of the experiments wecan obtain E from the slope of plots of ln(dadt) versus1Tf As dadt can be difficult to measure accuratelywhile the heating rate is much easier to determineaccurately one usually determines E from the slope ofplots of ln(b dadt) versus 1Tf
The definition of an identical stage of the reactionwhich is crucial in these methods is best taken as thestage at which a fixed amount of heat has evolved Asthemaximum reaction rate in good approximation occursat a fixed fraction transformed an identical stage of thereaction can also be taken as the stage at which themaximum heat evolution is observed131138149 It shouldbe noted that this involves a further approximation
All isoconversion-Tf(b) methods involve the plottingof 1Tf versus a logarithmic function which dependsmostly on the heating rate the specific expressions forthe various isoconversion-Tf(b) methods are presentedin Table 2 (It should be noted that in several pre-1990 publications some authors133142 have derivedisoconversion-Tf(b) methods using an assumed kineticreaction model However in the 1990s it has beenshown129131 that such an assumption is not necessaryand hence earlier works133142 on the derivations ofisoconversion-Tf(b) models are now superseded)
Accuracies of isoconversion analysis methods
In order to arrive at recommendations as to which of themany methods for activation energy analysis is mostappropriate the accuracy of these methods needs to beanalysed These accuracies are determined by six factorsas follows120129
(i) Mathematical approximations type B isocon-version methods use approximations of thetemperature integral This approximationcauses inaccuracies which depend on the typeof approximation chosen as well as on y (5ERT)150 For the more accurate methods theseerrors are relatively small (less than 03 fory15 see Fig 24)
(ii) For all methods the temperature at constantamount transformed needs to be obtained fromthe measured data This is prone to slightinaccuracies due to limitation in the accuracyof the baseline determination and minor inac-curacies in the measurement of the sampletemperature (This error will be small formaximum rate methods)
(iii) Type A methods require experimental data onreaction rate at constant amount transformedThese data are prone to inaccuracies resulting
from a limitation in the accuracy of the baselinedetermination the determination of the tem-perature at constant amount transformed andsignal noise
(iv) Small fluctuations in the supposedly constantheating rate may cause errors in determinationof the heating rate
(v) In maximum rate methods the equivalent stagedefined by the maximum rate is not exactly atconstant amount transformed thus introducinga contribution to the errors148151152
(vi) All methods presume that the equilibrium stateis constant In some cases this assumption maynot hold and this introduces deviations in themeasured activation energies149153
The deviations introduced by these six factors have beenanalysed in some detail and for further details thereader is referred to the corresponding publica-tions120148149151152
In Table 2 the main characteristics of a range ofisoconversion methods are presented In the same tableestimates of the deviations introduced by error sources(i)ndash(v) are presented based on typical accuracies ofdeterminations of the main parameters for a typicalreaction in an Al based alloy For the latter data theanalysis of error sources (i)ndash(iii) is based on work by thepresent author120 and the analysis of error source (v) isbased on work by Criado and Ortega148 while errorsource (iv) was considered to be negligible in this case(These methods for calculation of accuracy are brieflysummarised in Appendix 1) Table 2 shows thataccuracies of E determination in the order of 1 shouldbe achievable provided one of the more accurateactivation isoconversion methods such as the type B-195 type B-192 or generalised Kissinger methods isused Also the Friedman type method can achieve goodaccuracies but this method is only recommended ifaccuracies of transformation rates or heat evolution inAl based alloys can be measured with an accuracy betterthan about 02120 which will mostly not be possiblefor thermally activated reactions in Al based alloys
Apart from the isoconversion methods a range ofother methods that either assume that a particularkinetic model holds andor that activation energies canbe derived from a single experiment at one single heatingrate have been suggested These methods have been
24 Relative error introduced by mathematical approxima-
tions in type B activation energy methods (adapted
from Ref 120)
Starink Analysis of Al based alloys by calorimetry
International Materials Reviews 2004 VOL 49 NO 3ndash4 209
Tab
le2
Iso
co
nvers
ion
meth
od
sfo
racti
vati
on
en
erg
yan
aly
sis
wit
hty
pic
al
so
urc
es
of
err
or
Main
sources
oferror
Lim
itofaccuracy
Method
Ref
Expression
Approx
(i)amp(v)
Approx
(ii)ndash(iv)
Recommendeduse
Applic
ation
Ozawa
136
137
lnb~
1 0518
E RTf
zC
2(i)(ii)
(iv)(vi)
71
Notrecommendeddueto
inaccuracies
only
tobeusedin
conjunctionwithcorrection
tables(seeFlynn150)
hellip
Boswell
138
145
lnb Tf
~
Ea
RTf
zC
2(i)(ii)
(iv)(vi)
41
Notrecommendeddueto
inaccuracies
hellip
Generalised
Kissinger
131
134
lnb T2 f
~
E RTf
zC
2(i)(ii)
(iv)(vi)
0 7
1Straightforw
ard
andpopularmethodwith
goodaccuracy
Eis
slopeofplotofln(T
2 fb)
versus1RTf
TypeB-1 95
120
lnb
T1 95
f
~
E RTf
zC
5(i)(ii)
(iv)(vi)
0 4
1Straightforw
ard
methodwithhighaccuracy
Eis
slopeofplotofln(T
1 95
fb)
versus1RTf
TypeB-1 92
120
lnb
T1 92
f
~1 0008
E RTf
zC
6(i)(ii)
(iv)(vi)
0 25
1Straightforw
ard
methodwithvery
highaccuracy
Eis
slopeofplotofln(T
1 92
fb)
versus1 0008RTf
Starink
129
lnb
T1 8
f
~
Eslope
RTf
zC
5
E~
Eslope
1 007
1 2Eslope
105kJmol
1
1
(i)(ii)
(iv)(vi)
0 2
1Very
highaccuracyifTfcanbedeterm
ined
withvery
highaccuracy(toabout0 1
K)
Firstobtain
Eslfrom
slopeof
plots
ofln(T
1 8fb)versus1RTf
thenobtain
Efrom
correction
factorequation
Lyonmethod
122
d(lnb)
d(1=Tf)
E Rz2T
(i)(ii)
(iv)(vi)
0 7
1Anindirectmethodwithgoodaccuracy
Firstobtain
slopeofplots
ofln(b)
versus1T
fthenuseaverageT
toobtain
EKissingerpeak
reactionrate
131
133
lnb T2 p
~
Ea
RTp
zC
2(i)(ii)
(iv)(v)
(vi)
1 2
0 5
RecommendedifTfvaluescannotbe
determ
inedaccurately
dueto
overlapping
heateffectsGoodaccuracy
Eis
slopeofplots
ofln(T
2 pb)
versus1RTp
TypeB-1 95
peak
120
lnb
T1 95
p
~
E RTp
zC
2(i)(ii)
(iv)(v)
(vi)
1 1
0 5
RecommendedifTfvaluescannotbe
determ
inedaccurately
dueto
overlapping
heateffectsHighaccuracy
Eis
theslopeofplots
ofln(T
1 95
pb)
versus1RTp
Friedman
139
38
lnda
dT
b
~
Ea
RTf
zC
(ii)(iv)
(vi)
01 2
Recommendedonly
ifdadT(5
q)values
canbedeterm
inedvery
accurately
(typically
anaccuracybetterthan0 2
isrequired120)
Eis
theslopeofplots
of2ln(bdadT)
versus1RTf
LiandTang
140
Integralform
ulationbased
ontheFriedmanmethod
(ii)(iv)
(vi)
01 2
Recommendedonly
ifdadT(5
q)values
canbedeterm
inedvery
accurately
Numericalintegrationmethod
(seeRef140)
Tfis
thetemperature
atafixedamounttransform
edandTpis
thetemperature
atmaxim
um
reactionrate
Lim
itofaccuracyassuming
aquadraticsummationoferrors
dueto
sourcesgivenerrorcalculationsindicatedin
Refs120148149151152errorsources(i)and(v)are
takenasthemaxim
um
encounteredfor15y60errorsources(ii)ndash(iv)are
estimatedbyassuming1
accuracyin
determ
inationofdadt0 5
Kaccuracyindeterm
iningTf0 25Kaccuracyin
determ
iningTprangeofTfTptaken
as50Kwithreactionsoccurringaround500K
Starink Analysis of Al based alloys by calorimetry
210 International Materials Reviews 2004 VOL 49 NO 3ndash4
tested and reviewed by various authors143154155 and arefound to be generally unreliable especially for solid statereactions where the reaction kinetic model is generallycomplicated and often unknown
Measured activation energies in Al based alloys
Calorimetry and especially DSC have been usedextensively to determine activation energies of thermallyactivated reactions in Al based alloys Observed activa-tion energies for precipitation reactions that occur atabout 200ndash300uC tend to be close to the activationenergy for diffusion at equilibrium vacancy concentra-tion of the rate determining precipitating element (forthe most common alloying elements Cu Mg Si this isabout 120ndash135 kJ mol21 Ref 156) Precipitation reac-tions involving elements with higher activation energiessuch as Fe and Cr occur at higher temperatures(typically 300ndash400uC) and activation energies for thesereactions are generally in line with activation energiesfor diffusion (As Fe and Cr have very low solubilities inAl solid solutions can only be obtained through rapidsolidification or ball milling) For example in nanos-tructured Al93Fe3Cr2Ti2 alloys prepared via ball millingof elemental powders the activation energy for pre-cipitation of Al6Fe is 203 kJ mol21 whereas that for theprecipitation of Al13Fe4 and Al13Cr2 is 228 kJ mol21
(Ref 74) These activation energies are close to theactivation energies for diffusion of Fe and Cr in fcc Al(about 190 and 240 kJ mol21 Ref 74)
For precipitation reactions in quenched materials thatoccur at temperatures below about 150uC the measuredactivation energies are mostly about 55ndash70 kJ mol21These values are considerably lower than the activationenergy for diffusion of alloying elements in Al andthis difference is generally ascribed to the presence ofvacancies with two possible arguments generally beingcited If vacancies are key to the formation of the zonesor clusters then the activation energy for migration of(mono) vacancies (about 60 kJ mol21 in pure Al157158)can be determining the activation energy of the overallprocess It has also been considered that the presenceof substantial amounts of excess vacancies reduces theactivation energy for diffusion of alloying elements Thisis because the activation energy for diffusion is the sumof the activation energy for creation of a vacancy andthe activation energy for the migration of the alloyingelement into the vacancy and in the presence of excessvacancies the former term is effectively zero Thusactivation energies for formation of zones and clusters atlow temperatures are ascribed to the activation energyfor migration in the presence of an excess amount ofvacancies
In dissolution reactions the solvus concentrationchanges during the heating and hence the equilibriumstate is not constant Thus the activation energymethods outlined above are not valid The consequencesof applying activation energy analysis can be illustratedby considering the data on dissolution of d9 in AlndashLialloys at various heating rates (Fig 8) These data showthat in the limit for decreasing heating rates the DSCcurves converge indicating that for low heating rates thedissolution reaction is determined mostly by themetastable equilibrium solvus (In fact Noble andBray42 used this to determine the metastable equilibriumsolvus) If an activation energy analysis method were to
be applied the apparent activation energy for lowheating rates would be infinitely large and also at higherheating rates very high apparent activation energieswould be observed Notwithstanding the questionablevalidity activation energy analysis methods have beenapplied to dissolution reactions In line with the aboveconsideration the activation energy found is in generalsubstantially larger than the activation energy for diffu-sion at equilibrium vacancy concentration159 Interestingexamples of such a questionable approach are providedby Dorward70 and Kamp160 who both applied activationenergy analysis to the dissolution effect of the mainstrengthening phase in AlndashZnndashMgndashCu alloys (a 7050(Alndash645Znndash21Mgndash215Cu wt- Alndash28Znndash245Mgndash095Cu at-) and a 7449 alloy respectively) Thisdissolution effect is effect II in Fig 13 For the overaged7050 alloy this reaction occurs at about 210ndash230uCand the activation energy was determined70 to be135 kJ mol21 while for the 7449-T6 alloy the peak inthe dissolution reaction occurred at 180ndash200uC and theactivation energy was determined160 to be 70iexcl7 kJ mol21 Clearly the two activation energies arequite different and the processes cannot be ascribed to asingle thermally activated process such as diffusion ofMg or Zn In both cases the apparent activation energyis likely to have been influenced by the coarseningreaction (effect III) which effectively determines the endof effect II As the activation energy for coarsening isequal to the activation energy for diffusion this canexplain why in this case the apparent activation energydetermined from a dissolution reaction remains limited
Few measurements of the activation energy forrecovery have appeared in the literature One paper73
determined the activation energy for recovery in aball milled AlndashMg powder alloy to be about 121ndash124 kJ mol21 In this material the activation energyfor recrystallisation was considerably higher 189ndash195 kJ mol21 The activation energy for recoverythrough the process of internal strain release in amechanically alloyed Al93Fe3Ti2Cr2 powder (effect 1 inFig 15) was determined74 to be 112 kJ mol21
For devitrivication of amorphous Al based alloysthe three exothermic reactions have been observed tohave activation energies of 233iexcl10 156iexcl10 and174iexcl10 kJ mol21 in a melt spun Al70Ni13Si17 (at-)alloy161 and 148 336 and 274 kJ mol21 in gas atomisedAl85Ni10Y25La25 alloy powder
162 In the latter alloy thethree activation energies are close to the activationenergies for self-diffusion La diffusion in Al and Nidiffusion in Al suggesting that these three processes arerate controlling for the three reactions162 Activationenergies of devitrivication are strongly dependent oncomposition for example for the three alloysAl90Ni4Sm6 Al88Ni6Sm6 Al88Ni4Sm8 in Fig 16 thefirst reaction was found82 to have activation energies220iexcl20 320iexcl20 and 360iexcl20 kJ mol21 respectivelybut in AlNi7Nd3Cu3 the activation energy for thisprimary recrystallisation is much lower at 138iexcl10 kJ mol21 (Ref 76)
It is noted that for some of the activation energiescited above no error limits were provided in the originalpapers It is hoped that the analysis provided in theprevious subsection and elsewhere120 will contribute tomore consistent analyses of error limits in measuredactivation energies
Starink Analysis of Al based alloys by calorimetry
International Materials Reviews 2004 VOL 49 NO 3ndash4 211
Single stage reaction modelsJMAK mean field and other models compatible withdadt5f(a)k(T)
Having obtained the activation energy for a thermallyactivated reaction the next step in obtaining a fulldescription of the reaction is the determination of thereaction model f(a) Various proposed functions f(a) aregiven in Table 1 and in many cases the analysis can becompleted simply by determining which of the modelsfits best to the data From the reactions listed in thistable the JMAK model is the one most often invokedfor thermally activated reactions in Al based alloyseven to the extent that in many publications163164 theanalyses of precipitation and recrystallisation reactionsare simplified by only considering the JMAK modelAlso calorimetry data on reactions in multilayersare generally investigated using the JMAK model786
In such an approach the determination of the reac-tion model f(a) is reduced to finding the Avramiexponent n
The procedure for analysing isothermal data underthe assumption that the JMAK kinetics is applicableuses the combination of equations (6)ndash(8) or the integralformulation of the JMAK equation (see Table 1) Forlinear heating experiments the temperature integralneeds to be approximated Descriptions of this havebeen provided by various authors86163164 we will hereuse a description that applies the Murray and White126
approximation to yield165
a~1exp(vn) (30)
with
v~RT2
Ebk(T) (31)
From the above two equations the expression for thereaction rate during linear heating is164
da
dt~nv exp(vn)
2
Tz
E
RT2
(32)
The value of n is characteristic for the type of reac-tion Its value can be derived from considering thefollowing
N In reactions in which the interface between reactionproduct and reactant has a constant velocity thevolume of a growing nucleus is initially (beforeimpingement has a significant influence) proportionalto the time to the power Ndim where Ndim is thenumber of dimensions into which the reactionproduct is growing ie for a growing sphere Ndim is3 for a growing cylinder with fixed length that ismuch larger than its radius Ndim is 2
N In diffusion controlled reactions the position of theinterface is a function of the square root of time andhence the volume of the reaction product growsinitially as tNdim2
Thus if nucleation during the course of the reaction isnegligible the equation for n is116149
n~Ndimg (33)
where g is 1 for linear growth or 12 for para-bolic (diffusion controlled) growth It can further beshown116 that the influence of continuous nucleationis to increase n by 1 and hence the general equation
for n is
n~NdimgzB (34)
where B is 0 in the case of site saturation (no nucleationduring the transformation) or 1 for continuous nuclea-tion (at constant nucleation rate)
While it is often assumed that the (generalised) JMAKmodel is valid for solid state reactions includingprecipitation and recrystallisation there have been manyreports of thermally activated solid state reactions thatdo not obey the JMAK model11166ndash175 Deviations fromJMAK kinetics usually involve a reduced reaction ratein the later stages of the transformation which is oftendetected as a deviation from the straight line expected inan Avrami plot (graph of ln[2ln(12a)] versus v) athigher fractions transformed This has instigatedresearch into deviations from the JMAK models and arange of approaches to deal with these deviations havebeen proposed Before reviewing these it is first notedthat recent theoretical work176177 has proven that theJMAK kinetic equation (including its treatment ofphantom nuclei178) is accurate for reactions with lineargrowth provided179
(i) product phases are randomly distributed
(ii) if nucleation occurs nuclei are randomlydistributed180ndash183
(iii) average growth rates are independent of posi-tion in the sample184
(iv) impingement on objects other than neighbour-ing domains of the product phase is negligible
(v) blocking resulting from anisotropic growth185ndash188
is negligible
(vi) the reaction is not influenced by any time-dependent process not directly related to thetransformation studied (eg recrystallisationbeing influenced by recovery)
(vii) the equilibrium state is constant ie the amountthat can transform does not depend on time(this assumption can break down under non-isothermal conditions)
Hence deviations from JMAK kinetics can only occur ifone or more of these preconditions are not satisfied
For diffusion controlled growth reactions the growthrate is initially proportional to the square root oftime (so-called parabolic growth) and impingement ofdiffusion fields around randomly distributed precipitates(so-called soft impingement) is an extremely complexmathematical problem Various researchers have usedsimplifications and approximations and generallyobserve that JMAK kinetics is a good approximationfor diffusion controlled transformations with highsupersaturation which conform to assumptions (i)ndash(vii) even though the JMAK type treatment ofimpingement is not valid179 Early work by Ham189190
has shown that for precipitates on a regular cubic arraygrowing in three dimensions JMAK kinetics is accurateup to a transformed fraction of about 07 to 08 whilefor later stages the reaction is slightly slower thanJMAK kinetics Also Monte Carlo simulations of thetransformations of grains which grow according to adiffusion controlled mechanism (ie growth rate isproportional to the inverse of the particle radius)indicate that JMAK kinetics is a good approximationfor diffusion controlled transformations191 A similarconclusion was reached by Uebele and Hermann192 who
Starink Analysis of Al based alloys by calorimetry
212 International Materials Reviews 2004 VOL 49 NO 3ndash4
approximated diffusion controlled growth in a mathe-matical model which considers parabolic growth andhard impingement Diffusion controlled growth reac-tions are further discussed at the end of this section andin Appendix 2
It has been shown179 that if any of preconditions (i)ndash(v) are not met this will in most cases result in a reactionfor which the fraction transformed initially conforms toJMAK kinetics while the reaction rate for later stages isreduced as compared to the JMAK kinetics A widerange of approaches dealing with kinetics of precipita-tion and recrystallisation reactions incorporating varia-tions from the JMAK model have been proposed Thesemethods include numerical simulation methods whichrequire substantial computing time such as MonteCarlo and cellular automata methods applied to recry-stallisation193 and numerical methods for precipitationbased on simulations of diffusion fields194 and meanfield approximations195ndash199 Results of these simulationsand iterative methods can be compared with calorimetrydata but the simulations depend on the availability ofvarious parameters and hence they are not flexibleanalysis methods that can be employed to analysereactions for which certain characteristics are at theoutset unknown Hence these simulations will not beconsidered here for a detailed overview of thesemethods the reader is referred to the papers cited aboveand the overview of modelling and simulation ofrecrystallisation by Rollett193 Instead in the remainderof this section attention is given to models that can beapplied directly to analysis of transformation rate dataon reactions for which no accurate simulations areavailable and to recent models which are relevant to theunderstanding of such methods The emphasis will be onmodels for precipitation devitrivication and recrystalli-sation reactions which have either been recently derivedor have recently attracted increased attention and whichhave been reported to be able to deal with deviationsfrom JMAK kinetics The model by Woldt200 considersrecrystallisation the models by Yavari and Negri174 andGangopadhyay et al201 consider nanocrystallisationduring devitrivication Keltonrsquos model202203 considerstransformations that involve coupled fluxes of interfacialattachment and long-range diffusion the mean fieldmodel considers precipitation and the work by Starinkand Zahra170 describes a kinetic equation that can bevalid for a range of reaction types
In an attempt to find an explanation for deviationsfrom JMAK kinetics observed for recrystallisation ofseveral metals and alloys Woldt200 presented a modelfor primary recrystallisation which includes two drasticmodifications with respect to JMAK kinetics a nuclea-tion rate related to the size of the interfacial area ofthe recrystallised grains present and an exponentiallydecreasing growth rate for each grain Thus the Woldtmodel modifies the assumption of linear growth andmodifies precondition (ii) The resulting mathematicaltreatment provides solutions for fractions transformedin an iterative scheme ie no direct closed formsolutions for the model are available Some limitedevidence on nucleation of grains at the recrystalliseddeformed interface in Cundash5Al (wt-) and nucleationrates in pure Cu at the surface of a recrystallising SEMsample was presented which is in line with the modi-fications and computed transformation rates indeed
show a resemblance to measured recrystallisation ratesHowever as yet the model has not been quantitativelyverified on recrystallisation in material away fromsample edges nor has it found any application beyondthe paper in which it was first introduced Thus beforethis model for recrystallisation can be confidently usedfurther work is needed to verify its basic assumptions Itshould also be noted that the approach by Woldt200 is byno means the only approach that can quantitativelyexplain the slowing down of the reaction in the laterstages For example it has been shown179 that if any ofpreconditions (i)ndash(v) are not met this will in most casesresult in a reaction for which the transformation rate inthe later stages is reduced as compared to the JMAKkinetics Both Sun et al184 and Starink179 consideredthe case of a transformation with growth rates andnucleation rates that are position dependent and foundresulting kinetics very similar to predictions by Woldtrsquosmodel In practical terms the non-transparent nature ofthe model caused by the extensive calculations that areneeded to obtain solutions can further hamper itsapplication
Even though nanocrystallisation in an amorphousFinimet (Fe735Cu1Nb3Si135B9) alloy has been investi-gated by JMAK type expressions204 it is mostlyaccepted that deviations from JMAK kinetics frequentlyoccur These deviations from JMAK kinetics observedin nanocrystallisation of amorphous alloys have beeninvestigated by Yavari and Negri174 and byGangopadhyay et al201 The work by Yavari andNegri174 indicates that in Fe based amorphous alloysrejection of solute from the growing nanocrystal willcause diffusion to become significant and that inclusionof the variation of the nucleation frequencies duringthe transformation process is needed if coherent resultsare to be obtained from an analysis of transformationkinetics It was indicated that this analysis should alsobe applicable to nanocrystallisation of amorphous Albased alloys but no detailed model was presented bythese authors Gangopadhyay et al201 observed thatJMAK failed to provide an adequate description ofnanocrystallisation during devitrivication of melt spunAl88Gd6La2Ni4 and that Avrami plots showed at leastthree regions with different slope They suggested amodel in which the nanocrystals grow in a diffusioncontrolled reaction with each crystal growing in an areawith a conical shape This model results in transforma-tion kinetics that initially follow JMAK kinetics andin later stages a slowing down with respect to JMAKkinetics occurs The Avrami plot shows two linearstages which resembles the observation on theAl88Gd6La2Ni4 alloy However the unusual geometryof the diffusion field makes it unlikely that the modelhas general validity
Kelton202203 constructed a kinetic model for nuclea-tion that couples the stochastic fluxes of interfacialattachment and long-range diffusion and solved thiscoupled flux model numerically It was found that thesecoupled fluxes decrease the steady state nucleation rateand increase the induction time compared to theclassical theory It was shown that the model couldexplain many of the microstructural features andkinetics observed in devitrivication in metallic glassesespecially the nanocrystallisation process205 For exam-ple the model shows how different average n values
Starink Analysis of Al based alloys by calorimetry
International Materials Reviews 2004 VOL 49 NO 3ndash4 213
obtained from an Avrami analysis are directly relatedto the concentration of the solutions with n increasingwith concentration The coupled flux model alsocaptures the decrease in apparent n with progress ofthe reaction which is a direct consequence of thelong-range diffusion becoming a dominant factor in thelater stages While the model is successful and cancapture many of the aspects of the kinetics ofnanocrystallisation no direct application to analysis oftransformation data such as obtained through calori-metry has as yet been presented The need for numericalsolution of the coupled flux equations will probably limitthe modelrsquos applicability to analysing transformationdata
In a broad sense all models discussed so far areconsistent with the approach described by equation (6)ie for each set of parameters in the respective modelsin principle a function f(a) can be identified but thephilosophies are different For the coupled flux modeldefining f(a) would involve defining interfacial freeenergy diffusion rate start composition metastableequilibrium composition at the interface with thenucleus and driving free energy and also in Woldtrsquosmodel a range of parameters would need to be definedbefore f(a) could be identified Thus the philosophiesbehind the approaches are very different and it isunlikely that the Kelton and Woldt models will be usedfor analysis of calorimetry data through defining f(a) Amore fruitful approach to the relation between thesemodels and calorimetry would be to use calorimetry totry to verify the models but no such work has beenpublished as yet
Starink and Zahra170 also noted the deviationsbetween the JMAK model and data on a range of trans-formations including recrystallisation and precipitationreactions and devised a model to deal with this Incontrast with the type of modelling approaches used byKelton and Woldt the approach taken was specificallyaimed at obtaining a closed form solution to thetransformation rate and the reaction function f(a) andto apply this directly to the analysis of calorimetry dataThe resulting model has been consistently successfulin describing precipitation reactions in Al based alloysand selected other alloys and although no studies ofapplication to recrystallisation have been published thegeneral trends in deviations from JMAK kinetics forrecrystallisation reactions can also be captured by themodel The model contains an approximation forimpingement that deviates from the JMAK treatmentof impingement using the equation170179
a~1aextgi
z1
gi
(35)
where a is the fraction transformed gi is the impinge-ment exponent and aext is the extended fractiontransformed As in the JMAK model aext can be takenas v and equals (kt)n for isothermal reactions Theresulting reaction function f(a) for the model is
f (a)~nfrac12(1a)1=gi1(n1)=n(1a)(giz1)=gi (35a)
Equations (35) and (35a) incorporate the JMAK modelas in the limit of giRlsquo both are identical to thecorresponding JMAK expressions While initially theapplication of equation (35) with an adjustable impinge-ment exponent was purely based on a good fit with
experimental data some new theoretical work andcomparisons with existing theoretical work later showedthat equation (35) can provide good approximations fortransformations in which deviations from the JMAKassumptions (i)ndash(vi) occur179
A further approach which is applied to the modellingof precipitation reactions is the mean field model Thisapproach considers that the influence of the impinge-ment of diffusion field on the growth rate of precipitatesof radius R(t) can be described by considering theaverage solute content of the matrix through190206
dR(t)
dt~
cm_c (t)
cpcm
D
R(t)(36)
where D is the diffusivity c(t) is the average solutecontent of the matrix and cp and cm are the precipitateand matrix compositions at the interface This equationforms the basis of computer based iterative approachesto the modelling of precipitation in which the timeevolution of the sizes of a collection of particles iscalculated It can be shown that approaches based onequation (36) are consistent with the approach based onequations (6) and (7) and specifically that for a reactionwith a dilute solution and a fixed number of particlespresent equation (36) yields nearly exactly the same asequation (35) with gi5567 and n515 (see Appendix 2)Also for less dilute solutions equation (35) with n515provides a very high accuracy approximate solutionto equation (36) Thus the mean field model for preci-pitation is generally not consistent with the JMAKmodel but is in good approximation consistent withequation (35)
It appears clear that the analysis of the mean fieldmodel casts some severe doubts on the widespreadpractice of analysing precipitation reactions using theJMAK model and especially for the later stages of thereaction such an analysis can be expected to becomeinvalid The StarinkndashZahra equation is flexible andencompasses JMAK kinetics the mean field model forprecipitation and a range of deviations from JMAKkinetics which occur in parabolic growth and lineargrowth reactions
Other models for precipitation in Al based alloys
The approach based solely on equations (6) and (7) incombination with the table of f(a) functions (Table 1) or amore restricted selection of functions can in many casesbe inappropriate Especially for precipitation reactionsstudied by DSC it is found that that the retrogradesolubility curve will have a significant effect on theprecipitation rates in the later stages of the reaction andthis invalidates fitting of the standard f(a) functionsHence a number of approaches have appeared in theliterature which either circumvent this problem by onlyconsidering the start of the reaction or which attempt toaccount for the retrograde solvus
One treatment207 of thermally activated reactions inthe presence of a retrograde solvus starts by taking thebasic equations (6) and (7) and considering that inisothermal experiments a is generally assumed to begiven by
a~x(t)
xend(37)
where x(t) is the amount precipitated at time t and
Starink Analysis of Al based alloys by calorimetry
214 International Materials Reviews 2004 VOL 49 NO 3ndash4
xend is the total amount that can precipitate at T Itwas realised that because of the temperature depend-ent solubility of alloying elements in the Al richphase the transformation rate cannot be the productof two separate functions and the function f(a) inequation (6) must be dependent on the temperatureThis was achieved in a general way by defining thefollowing four equations (38)ndash(41) to replace equa-tions (6) and (7)
j~x(t)
xmax(38)
and
a0~x(t)=xeq(T) (39)
in which xeq(T) is the maximum amount that canprecipitate at a given temperature ie
xeq(T)~ limt
x(tT)
and xmax is a constant representing the maximumamount of material that can transform ie the maxi-mum value that xeq(T) can attain The transformationrate equation is now assumed to be
dj
dt~k(T)f 0(jT) (40)
For the kinetic model term f 9(jT) the Sestak andBerggren115 equation was modified to yield an equationthat incorporates the temperature dependency of xeq(T)
f 0(jT)~(1a0)p1(1j)p2frac12ln(1a0)q1
|frac12ln(1j)q2 (41)
where p1 p2 q1 q2gt0 p1zp25p and q1zq25q
The above set of equations was applied to data onprecipitation in Alndash1Si (at-) alloys The solubility of Siin the Al phase is well known and can be described by208
cSi(T)~c exp DHSi
RT
(42)
where clsquo519 and the enthalpy of solution DHSi5
052 eV Hence
xeq~xmaxcSi(T) (43)
xmax5001 The results of the fitting of the DSC curvesfor Alndash1Si (at-) using this approach are presented inFig 25 The fitted curves in general show a goodcorrespondence with the measured DSC curves andin particular capture well the rapid transition fromexothermic to endothermic heat flow without a flat partof the curve with zero heat flow Notwithstanding thegood fit displayed in Fig 25 this approach has somemajor drawbacks most notably that the parameters pand q cannot be directly interpreted in terms of thereaction occurring in the material ie in terms of theclassification proposed above (in lsquoIntroduction generalobjectivesrsquo) this model is a generic model with a physicalbasis that is unclear As a consequence the model hasnot seen any application beyond the paper in which itwas introduced and more recent models (see below)have attempted to include physically meaningful para-meters in the model
Another model for analysing and fitting precipitationeffects in Al based alloys during linear heating was
proposed by Borrego and Gonzalez-Doncel209 in astudy of 6061-Al15 vol-SiCw PM composites Themain part of the model is identical to the JMAK modelfor the linear heating case164 ie equation (30) isadopted with the equation for the state variable forlinear heating
v~
ethko exp
Ea
kBT
dtamp
T2R
bEa
ko exp Ea
RT
(44)
As shown above the reaction rate can be obtained bydifferentiation yielding equation (32) or the variantgiven by Borrego and Gonzalez-Doncel209
da
dt~n
dv
dtvn1 exp(vn) (45)
This reaction rate should be proportional to the heateffect measured in the DSC and hence the aboveequations represent a theoretical model in closed formand with parameters ko Ea and n that can be fitted toDSC data Novel in the approach is that the nucleationrate I(t) of precipitates is assumed to be given by
I(t)~ctqN exp DEn
kBT
(46)
where DEn is the activation energy for nucleation andexponent qN is constant The BorregondashGonzalez-Doncelmodel was fitted to DSC data on the precipitation in6061 (AlndashSindashMg) alloys and an example of the results ispresented in Fig 26 As has been noted elsewhere210 thequality of the fit is limited suggesting that the model isnot particularly suited to describe precipitation in theseAlndashSindashMg alloys Borrego and Gonzalez-Doncel laterexpanded their model to allow an n value that variesduring the progress of the reaction211 This allowedhighly accurate fits to DSC data but this introduction ofadditional fittable parameters without experimentalverification of the physical basis has attracted criti-cism210 The Borrego and Gonzalez-Doncel models havenot been applied to Al based alloys beyond the papers inwhich they were initially introduced but have beenapplied in other alloys212ndash214 (In one of the studies212 itwas observed that lsquoa slight misfit between both experi-mental and theoretical DSC curves [] is observed at theend of the first peakrsquo while fits in other works213 are lessperfect than has been achieved with other models)
curve 1 25 K min21 curve 2 10 K min21 curve 3
20 K min21 curve 4 40 K min21
25 Experimental (dotteddashed lines) and computer gen-
erated (solid lines) DSC curves obtained using equa-
tions (40)ndash(43) and heating rates of 25 10 20 and
40 K min21 (from Ref 207)
Starink Analysis of Al based alloys by calorimetry
International Materials Reviews 2004 VOL 49 NO 3ndash4 215
Also the approach of an adjustable impingementfactor has been applied in the derivation of a modelfor precipitation and recrystallisation For this modelaext was obtained on the basis of the temperatureintegral (see also the section devoted to multistagemodels below)
aextbR
EG
kc expEeff
RT
T
b
2( )s
(47)
where T is the temperature s is the transformationexponent Eeff is the effective activation energy and kcis a (pre-exponential) constant Within the model alsothe variation of the (metastable-) equilibrium state withtemperature is accounted for by using
j~
dj
dt~
d
dtacoceq(T)
co
A2 (48)
where j is the amount of atoms incorporated in thegrowing nuclei divided by the maximum amount ofatoms that can be incorporated according to theequilibrium phase diagram co is the initial concentrationof alloying element dissolved and A2 is a constant TheDSC signal is proportional to j The term ceq(T) isapproximated by regular solution expressions
ceq(T)~c exp DH
RT
(49)
where clsquo is a constant and DH is the enthalpy ofsolution The model has been applied to the analysis ofDSC effects of precipitation in Al based alloys andgenerally good correspondence between model and datahas been observed113946170210
Determination of reaction exponent n
In many cases of the analysis of thermally activated solidstate reactions the objective is to derive all threeelements of the kinetic triplet and hence if the reactioncorresponds to JMAK kinetics or StarinkndashZahrakinetics the reaction exponent n will be obtained in
the course of this procedure However instead ofobtaining the full expression for f(a) in some cases theanalysis can be limited to just obtaining n withoutconsidering the full expression for f(a) Such a morelimited analysis can be enforced if the later parts of thereaction cannot be analysed due to excessive overlapwith a subsequent reaction or if no satisfactory descrip-tion of the later stages of the reaction can be found usingthe standard expressions for f(a)
Several methods to derive the reaction exponent nfor reactions occurring during linear heating havebeen proposed215ndash219 Some of these methods215ndash217219
pre-suppose that JMAK treatment of impingement isvalid and some methods217218 make use of Doylersquosapproximation123ndash125 for the temperature integral As itis clear from the above that both approximationsintroduce significant errors they are not reviewed hereand for a description of the well known derivation of nexponents for reactions that correspond to JMAKkinetics through the so-called Avrami plot (a graphof ln[2ln(12a)] versus v) the reader is referred tostandard works219 and various examples161205 Insteadhere a method170 for determining n that does not sufferfrom inaccurate approximations for the temperatureintegral and which is not limited to JMAK kinetics isreviewed
We assume that for a narrow temperature range at thebeginning of the reaction both impingement and thevariation of the equilibrium state with the temperatureare negligible and for reactions that conform to JMAKStarinkndashZahra and mean field diffusion models we mayapproximate (see equation (47))
A3jaextbR
EGkc exp
Eeff
RT
T
b
2( )n
(50)
where A3 and subsequent A4 to A8 are constants(different symbols s and n were used to allow for thepossibility that linear heating and isothermal pathswould yield different transformation exponents) Takingthe logarithm yields
ln jnEeff
RTz2n ln TzA4 (51)
As the variation in nlnT is generally much smaller thanthe variation in EeffRT we may approximate
Rd ln j
d(1=T)n(Eeffz2RTav) (52)
where Tav stands for the average temperature of the(narrow) temperature range considered Thus n can beobtained from the slope of a plot of ln j versus2EeffRT It is further noted that as a result of takingthe logarithm and the derivative we may in equa-tion (52) insert any variable proportional to j in placeof j For DSC this means that we can use the integratedevolved heat DQ(T) instead of j
For a derivative type thermal analysis method likeDSC the signal is proportional to djdt and to obtain nwithout the need for integration we can calculate thederivative of equation (50) and subsequently take thelogarithm which yields
lnj
nEeff
RTzln
Eeff
Rz2T
z2(n1) ln TzA6 (53)
26 Part of DSC curve for solution treated 6061 alloy
showing precipitation effects due to b0 and b9 phase
thick grey curve represents experimental DSC data
thinner curves are model fits (obtained with impinge-
ment exponents gi1525 gi253 and transformation
exponents s15s2525) from StarinkndashZahra model and
sum of the two is given by zzzz (from Ref 210
note that due to near perfect fit curves cannot be
distinguished over substantial sections)
Starink Analysis of Al based alloys by calorimetry
216 International Materials Reviews 2004 VOL 49 NO 3ndash4
Considering again that the variation in lnT is generallymuch smaller than the variation in EeffRT djdtmay beplotted versus 2EeffRT and n can be obtained from theslope using
Rd ln
j
d(1=T)nEeffRT 2(n1)z
Eeff
2RTz1
1( )
(54)
n(Eeffz2RT)RT 2zEeff
2RTz1
1( )
(55)
Using EeffRTamp1 the second term on the right-hand side in equation (55) is much smaller than thefirst and thus one can obtain the following usefulapproximation
Rd ln j
d(1=T)n(Eeffz2RTav)ampR
d lnj
d(1=T)(56)
However as indicated by the use of the lt symbol thelatter approximation in this equation is less accuratethan the first A significantly better approximation ofequation (54) is
Rd ln
j
d(1=T)n(Eeffz2RTav)z2RTav (57)
Here we have again neglected the variation in T over thetemperature interval and used Tav From equation (57)it follows that n can be obtained from the slope of a plotof ln(djdt) versus 1T In equation (57) we may insertany variable proportional to djdt in place of djdt ForDSC this means that we can use the heat flow q(T)instead of djdt
As examples of application precipitation in slowlycooled Alndash6Si (at-) GPB zone formation in AlndashCundashMg based alloys and recrystallisation of deformed fccmetals were analysed170 For the slowly cooled Alndash6Si(at-) precipitation of Si starts with a process forwhich s505 indicating growth of undissolved coarse Siparticles It was further shown170 that in AlndashCundashMg andAlndashCundashMgndashLindashZr GPB zone formation occurs mainlyvia the growth of pre-existing nuclei (n515) while inAlndashCundashMgndashZr it occurs via nucleation and growth(n525) Also recrystallisation of deformed Ag and Cucould be analysed successfully170
Multistage models (multiple Arrhenius terms)The above treatment of the temperature integral isimportant in analysis and modelling of reactions thatare governed by a single thermally activated processwhich are related to a single activation energy Such aprocess is said to exhibit an isokinetic relationship(IKR)220 However many processes do not complywith these requirements or only comply in approxima-tion be it a good or a less accurate approximation Totreat processes that do not exhibit isokinetic behaviourapproaches in which multiple processes with a rangeof activation energies occur have been proposed Theseapproaches in general lead to transformations thatcannot be approximated by an isokinetic process andwhich cannot be described by a single state variable Onetype of process for which the thermal activation canoften not be described by a single activation energy isa nucleation and growth reaction A characteristic of
this type of two-stage process that sets it aside from othertwo-stage processes is that here the first stage nucleationdoes in itself not lead to substantial amounts oftransformed material as only growth of the nuclei causesthe transformation of substantial amounts of material Inthis case it can be shown that under specific conditions theoverall process shows a behaviour that is in goodapproximation isokinetic and a treatment for thistwo-process reaction has been described by Woldt andco-workers215221 In the Woldt approach both thenucleation rate I(T) and the growth rate are assumed tofollow an Arrhenius type temperature dependency (seealso Kruger216 and de Bruijn et al222)
G(T)~Go expEG
RT
(58)
I(T)~Io expEN
RT
(59)
where EG and EN are the activation energies for growth andnucleation respectively The latter equation implies thatnucleation depends only on themobility of atoms Especiallywhen the driving force for the formation of nuclei (ie thechange in Gibbs free energy due to the transformation of aregion) is small this may become invalid
We may now use the so-called extended volumeconcept to define the extent of the transformation Forthe present case it is given by
aext~
etht0
A1I(z)frac12G(tz)mdz (60)
where A1 is a constant which is related to the initialsupersaturation the dimensionality of the growth andthe mode of transformation while m is a constantrelated to the dimensionality of the growth and themode of transformation (diffusion controlled growth orlinear growth) If the difference between EG and EN issmall equations (58)ndash(60) lead to a relatively simpleexpression for aext (Refs 215 216)
aextbR
EG
kc expEeff
RT
T
b
2( )n
(61)
where
Eeff~mEGzEN
mz1(62)
n~mz1 (63)
and kc is a constant It should be noted that equa-tion (61) is an approximation which is only accurate ifENltEG
215221 and the deviation increases with increas-ing difference between EG and EN
221
One point that was not considered in the papers inwhich equations (61)ndash(63) were derived and analysed isthat an improvement in accuracy of calculation of aext canbe achieved by using the more accurate approximation ofthe temperature integral given by equation (23) Applyingthis approximation for the temperature integral leads to
aext 0786kcT
b
RT
EG
095
expEeff
RT
( )n
(64)
One important element of the above treatment lies in thefact that it shows that for a specific two-stage reaction
Starink Analysis of Al based alloys by calorimetry
International Materials Reviews 2004 VOL 49 NO 3ndash4 217
(nucleation and growth) with a specific temperaturedependence of the two stages (two Arrhenius typedependencies with ENltEG) the resulting transforma-tion can in most cases still be described accurately withone effective activation energy
Determination of volume fractions ofreaction products and phases
General objectivesThe volume fractions of precipitates and intermetallicphases in Al based alloys have a strong influence on theproperties such as yield strength work hardeningtoughness and conductivity In studies of Al basedalloys it is thus often necessary to determine the volumefractions of precipitates or intermetallic phases presentand to monitor the changes in the amounts of thesephases during thermomechanical or heat treatments ordetermine the influence of composition changes on theamounts of precipitates and intermetallic phases presentDepending on size of precipitate measurement ofvolume fraction of precipitates or intermetallic phasescan in many cases be achieved by optical microscopyor electron microscopy but these techniques can becumbersome In the case of TEM the volume that canbe studied is limited (to at best about 10610601 mm)and especially TEM can be prone to error It has beenshown in a range of publications that DSC can be anefficient method for determining average volume frac-tions of precipitates or intermetallic phases and thesemethods are reviewed in this section
Volume fractions of precipitates measuredfrom solidndashsolid reactionsA method for obtaining the volume fractions of theprecipitates based on the heat evolutions due to theprecipitation of the phases as measured by DSC hasbeen outlined in various works by Starink and co-workers2047223ndash225 (These methods were inspired byearly work by van Rooyen and Mittemeijer208) Themain step in the analysis is the assumption that the heatof formation or dissolution of a precipitate or inter-metallic phase is constant ie if a precipitate ofcomposition MmAaBbCc forms then the heat effectmeasured in the DSC is given by
DQMmAaBbCc~DxMmAaBbCc
DHMmAaBbCc(65)
where DQ represents the heat effect in the DSC Dxrepresents the amount of phase formed and DHrepresents the enthalpy of formation of that phase (perlsquomoleculersquo or unit of MmAaBbCc) The equation is alsovalid for dissolution reactions in which case the reactionis endothermic and DQ will be negative and as theamount of phase will reduce Dx will also be negativeTo be able to apply the method values of DH should beavailable Values of DH for specific phases can beobtained in two ways The first method is possible ifan experiment can be performed in which DQ can bemeasured and Dx is known an example being aprecipitation reaction for which initially all precipitatingelements are dissolved while the remaining amount insolution after completion of the exothermic heat releaseDQ can be determined from thermodynamic data fromother additional experiments A second method can
be applied when sufficient data on the thermodynamicfunctions (eg Gibbs free energy) are available tocalculate on a purely theoretical basis the change infree energy involved in the precipitation or dissolutionreaction While CALPHAD approaches should in prin-ciple be able to provide such data in practice nodetailed work using CALPHAD has been publishedand the derivation of DH values from thermodynamicdata has focused on an approach in which the thermo-dynamics of the system is simplified by assuming that aregular solution model approach is valid223226 Thisapproach makes use of the theoretical result that for aphase that is (partially) soluble in the matrix phaseand that adheres to the regular solution model thesolubilities c of the individual elements A B C etc aregiven by
(cA)a(cB)
b(cC)c~c1 exp
DH
RT
(66)
where DH is again the enthalpy of formation perMmAaBbCc unit R is the gas constant T is thetemperature and c1 is a constant Thus if sufficientand reliable solubility data are available DH can becalculated from that solubility data
Application of the method is most straightforwardwhen heat effects in the DSC curves are well separatedbut in practice overlap often occurs To be able toshow all steps necessary in the analysis application ofthe method is here reviewed by considering an examplefor an alloy that is relatively complex The exampleused is that of precipitation in AlndashCundashMgndashLi alloys andmetal matrix composites (MMCs) including a mono-lithic 8090 alloy (Alndash234Lindash125Cundash104Mgndash011Zrwt-) and three MMCs containing 20 wt-SiC parti-cles In these alloys two precipitation sequencesoccur132223227ndash229 One precipitation sequence involvesLi
Li in Al rich phased0d
where d9 is an L12 ordered phase (Al3Li) fully coherentwith the Al matrix and d is the equilibrium AlndashLi phase(AlLi bcc structure) which forms mainly at grainboundaries230 The second precipitation sequenceinvolves Cu and Mg1834231 and is represented as
Cu Mg in Al rich phase
(co-)clusters=GPB zonesS
where the cluster stage involves MgndashMg CundashCu as wellas CundashMg clusters34
The DSC curves obtained for an 8090 MMC aged forvarious times at 170uC are presented in Fig 27 For thisalloy the S precipitation effect (exothermic effectpeaking at about 300uC) decreases with aging timereflecting S precipitation during aging at 170uC (Asimilar change is observed for other AlndashCundashMg basedalloys see eg Fig 12) Also the heat contents of theother effects change during aging In order to calculatethe heat due to the formationdissolution of one specificprecipitate correction must be made for overlapbetween effects Correction methods can be devisedbased on assumptions of the kinetic model for thereaction In principle one might consider that thereaction follows a specific model (eg a JMAK model)and fit predicted transformation rates to parts of the
Starink Analysis of Al based alloys by calorimetry
218 International Materials Reviews 2004 VOL 49 NO 3ndash4
heat effect that appear to be not affected by overlap andthus derive the total heat evolved corrected for overlapIn practice such a cumbersome procedure is oftennot necessary and in the present example an overlapcorrection was based on the assumption that the peakheat flow always occurs at a constant fraction trans-formed223 The overlap-corrected values of the heatevolution of the phaseszones will be referred to as DQSp
(heat evolution due to S precipitation) DQd9d (heatevolution due to d9 dissolution) DQGPBd (heat evolutiondue to GPB zone dissolution) etc The amounts of GPBzones and d9 phase present can be obtained from
xGPB~DQGPBd
DHGPB(67)
xd0~DQd0d
DHd0(68)
where DHGPB and DHd9 are the heats of formation ofGPB zones and d9 phase respectively Due to overlapwith the exothermic effect caused by the formation of Licontaining oxides or nitrides on the surfaces of the DSCsamples the S dissolution effect cannot be measuredaccurately Hence the amount of semicoherent S formedduring aging is derived from the heat effect due to Sprecipitation using
xS~DQSp(WQ)DQSp(t)
DHS
(69)
This expression is valid because (i) TEM work showedthat in the water quenched (WQ) condition no S ispresent and (ii) the end temperature of the S precipita-tion is independent of isothermal aging time whichindicates that at the end of the S precipitation effect inthe DSC run (at 330uC in this example) the amount of Sphase present in the DSC samples is independent ofisothermal aging time
Using this method the amount of phases present inthe four alloys can be determined and data points arepresented in Fig 28 The results in this figure show thatthe amount of S phase forming is significantly reducedwhen the Li content of the alloy is reduced and alsoshows that the addition of ceramic reinforcement greatlyenhances the rate of formation of S phase The volumefractions of strengthening phases determined with themethod were used as input into a dislocation model for
the strengthening of these alloys and a good correspon-dence with measured data was observed232
While the analyses of volume fractions using calori-metry reviewed above generally provided results thatseemed reliable it should be noted that no direct proofof the proportionality of heat effect with volumefraction of phase was provided In order to providesuch a proof the volume fractions of phases measuredfrom an analysis of heat contents should be comparedwith volume fractions determined from a direct micro-scopy technique such as 3DAP TEM or if phasesare sufficiently coarse FEG-SEM (a high resolutionSEM with field emission gun) Unfortunately determi-nation of volume fractions of precipitates generallynecessitates 3DAP or TEM and determination ofvolume fractions with these techniques is not straight-forward and significant experimental uncertainties oreven systematic errors can arise Hence it is unlikelythat presently available techniques can provide aconclusive verification for the measurement of volumefractions by calorimetry In view of this it is relevant toconsider the preconditions for the proportionality ofheat effects to volume fractions of reaction productboth for precipitation reaction and in a more genericsense for transformations studied by calorimetry Forthis proportionality to hold it is required that in allsamples the same reaction occurs and thus it is requiredthat
(i) the composition of reacting phases must be thesame for all samples
(ii) the composition of the product phases must bethe same for all samples
(iii) the ratios of the different phases involved mustbe the same for all samples
Further conditions are(iv) the energy related to interfaces created in the
reaction must be negligible as compared to thetotal heat effect of the reaction or proportionalto the amount of phases formed
(v) the energy related to strains generated in thephases must be either negligible as compared tothe total heat effect of the reaction or propor-tional to the amount of phases formed
27 DSC curves of solution treated quenched and aged
809020 wt-SiCp MMC at 10 K min21 for various
aging times at 170uC (from Ref 132) 28 Amounts of semicoherent S phase present in water
quenched and aged alloys versus aging time at 170uC(MMCs all contain 20 wt-SiCp) data points from
method using DSC and curves from model fit (from
Ref 20)
Starink Analysis of Al based alloys by calorimetry
International Materials Reviews 2004 VOL 49 NO 3ndash4 219
(vi) any temperature dependence of DH should benegligible in the temperature range in whichheat effects occur
When considering precipitation reactions especiallyconditions (ii) (iv) and (v) need to be consideredcarefully For example if the composition of aprecipitate would change in the course of the trans-formation condition (ii) would not be satisfied and itwould have to be considered that the energy releaseper volume of precipitate formed will vary in the courseof the reaction Another example could be coherencystrain or strains in the matrix generated by precipitateswhich if they are related to substantial stored energywould contradict condition (v) Notwithstanding thewide range of preconditions no publications have asyet questioned the proportionality of heat evolved toamount of phase formed for precipitation reactions Oneexample that highlights complications is provided byDSC studies on melt spun hypoeutectic AlndashSi alloys208
In these rapidly solidified alloys Si is present bothdissolved in the Al rich phase and as very fine Siparticles and the heat effect due to coarsening of the fineSi particles during DSC is significant and partly over-lapping with the heat effect due to precipitation of SiThis example is one case in which condition (iv) is notsatisfied
Volume fractions crystallised duringdevitrivicationDifferential scanning calorimetry has been used exten-sively to analyse crystallisation during devitrivication ofrapidly solidified Al based alloys and some attemptshave been made to interpret changes in heat content ofthe devitrivication effects quantitatively in terms of thevolume fraction of amorphous phase formed For manyamorphous alloys DSC experiments reveal threeexothermic reactions that have been ascribed to
A amorphousa-Alzamorphous0
B amorphous0a-Alzintermetallic phases
C transformation of intermetallic phases
On isothermal aging at temperatures close to or belowthe peak of reaction A this reaction will occur and theeffects A and B in the DSC curves will change (Fig 29)To be able to quantitatively assess the volume fraction
of a-Al formed we need to consider that the twodevitrivication reactions A and B will have two differententhalpies of formation per mole a-Al formed If thereactions have a constant enthalpy of formation permole a-Al formed and only the reaction A hasprogressed the volume fraction of a-Al formed will begiven by
Va(tT)
1Vint
~frac12DQA(t~0)DQA(t)=DHA
frac12DQA(t~0)=DHAzfrac12DQB(t~0)=DHB
~DQA(t~0)DQA(t)
DQA(t~0)zfrac12DQB(t~0)=(DHA=DHB) (70)where Va is the volume fraction of a-Al Vint is thevolume fraction of intermetallic phases present afterreaction B DHA and DHB are the enthalpies of the tworeactions per mole a-Al formed No values for these twoenthalpies are known in the literature and henceapproximations have been made Gloriant et al233
investigated two methods to derive the volume fractionof a-Al phase formed in this isothermal aging In the firstmethod they considered that DHA5DHB and ignoredthe volume of the intermetallic phases which yields
Va~DQA(t~0)DQA(t)
DQA(t~0)zDQB(71)
However as the authors realised this method isunreliable as DHA in general should be differentfrom DHB and it was argued that especially thedifferent compositions of the matrix for the twodevitrivication reactions cause deviations from equa-tion (71) Comparison with 3DAP data on Va con-firmed that equation (71) is not accurate In asecond method the amount of a-Al phase formedduring the nanocrystallisation was considered to beproportional to the change of heat evolution in effect Athat occurs during the stage where the heat flow isreduced as a result of pre-aging ie the amount of a-Alphase formed would be proportional to the hatched areain Fig 30
Va~DQhatch
DQA(t~0)zDQB(72)
The results of the latter method indeed correspondedwell with volume fractions of a-Al phase obtained from3DAP analysis
It should be noted that even though results obtainedwith the latter method seem reasonable there is no
29 DSC curves at 40 K min21 of rapidly solidified amor-
phous Al88Ni4Sm8 alloy and Al88Ni4Sm8 aged for 30
and 60 min at 200uC (from Ref 233)
30 DSC curves at 40 K min21 of rapidly solidified amor-
phous Al88Ni4Sm8 alloy and Al88Ni4Sm8 that was aged
for 30 min at 200uC (from Ref 233)
Starink Analysis of Al based alloys by calorimetry
220 International Materials Reviews 2004 VOL 49 NO 3ndash4
proof that the method holds general validity In thepresent case where one phase (a-Al) is formed in tworeactions that are coupled and with different enthalpiesper mole transformed accurate analysis of fractionstransformed is possible only if the ratio DHADHB isknown
Volume fractions of intermetallic phasesmeasured from solidndashliquid reactionsUndissolvable intermetallic phases present in an Albased alloy will generally be coarse and these particleswill be detrimental for a range of properties mostnotably the toughness and the strength is also adverselyaffected Hence determination of the volume fractionof the undissolvable phases is often important Asshown above in the subsection lsquoHomogenisation andsolution treatment studiesrsquo the dissolution of interme-tallic phases can be monitored in a qualitative fashionthrough measuring the incipient melting effects of thesephases using DSC Some attempts have been made torelate these incipient melting effects quantitatively toamounts of phases Lasa and Rodriguez-Ibabe48 ana-lysed their DSC data on the incipient melting afterdifferent homogenisation treatments of two AlndashSindashCundashMg alloys that were cast using different procedures(Fig 11) The heat content of the incipient meltingeffects in the different samples was calculated throughintegration and these data were compared withmeasured volume fractions of Al2Cu phase obtainedfrom image analysis of backscattered SEM micrographsIt was found that in order to assure that the incipientmelting effect is a true reflection of the melting of phasespresent the dissolution of these phases during heatingneeded to be avoided and hence a very fast heating toabout 460uC followed by heating at a rate no lowerthan 10 K min21 was recommended According to theauthors the fractions of Al2Cu phase obtained fromanalysis of the incipient melting effect were lsquoin goodagreement with metallographic measurementsrsquo48 How-ever a closer look at Fig 31 shows that especially forthe thixoformed Alndash15Sindash44Cundash06Mg the two deter-minations of amounts of Al2Cu phase differ consider-ably and hence this work was unable to show that inthese alloys the heat content of the incipient meltingeffect was proportional to the amount of Al2Cu phase
For the heat contents of the incipient meltingreactions in a set of samples to be directly proportionalto amount of a specific phase present in the samplesall preconditions set out above in the discussion ofsolidndashsolid reactions must be satisfied and as interfacialenergies and strain energies can be expected to benegligible conditions (i)ndash(iii) especially are importantHence it is required that (i) the composition of reactingphases must be the same for all samples (ii) thecomposition of the product phases must be the samefor all samples and (iii) the ratios of the different phasesinvolved must be the same for all samples It would begenerally very difficult and time consuming to verifythese conditions However if all preconditions aremet the onset temperature of the reaction should beconstant and hence the onset temperature is anconvenient indicator for the validity of the conditionsFigure 11 shows that in the alloys studied the onsettemperature is not constant and hence we can expectthat one or more of conditions (i)ndash(iii) are not satisfied
and thus the heat content of the incipient melting effectis not proportional to amount of an intermetallicphase involved in the reaction In agreement with thisdeviations from proportionality in Fig 31 correlate withrapid variations in onset temperature in Fig 11(Consider the thixoformed Alndash15Sindash44Cundash06Mg alloyhomogenised for 05ndash2 h)
It should be noted that the highlighted problemswith a true quantitative analysis of volume fractions ofintermetallics from DSC incipient melting peaks doesnot detract from the useful results that can be obtainedfrom a qualitative study
Concluding remarksThe present review has illustrated that calorimetry andespecially differential scanning calorimetry are widelyused in the study of Al based alloys Differential scan-ning calorimetry in particular allows the rapid qualita-tive characterisation of a wide range of reactions that areimportant in determining the properties of the alloysHowever the relative ease of sample preparation and
31 Evolution of amount of Al2Cu in conventionally cast
Alndash12Sindash44Cundash13Mg (wt-) ingot sample (alloy A)
and thixoformed Alndash15Sindash44Cundash06Mg (wt-) alloy
(alloy B) heat treated for various times at 500uC as
calculated both from reduction of DSC peak area and
measured from image analysis of SEM images
amounts in as received condition were taken as 100
(from Ref 48)
Starink Analysis of Al based alloys by calorimetry
International Materials Reviews 2004 VOL 49 NO 3ndash4 221
performance of experiments can be deceptive samplepreparation and baseline instability can influence resultsAlso identification of heat effects in the more complexalloys is not straightforward and requires extensivesupporting microstructural investigation In the analysisof the kinetics of reactions during linear heating inthe DSC recent developments in approximations ofthe temperature integral are crucial in understanding thelimits of accuracy of methods that rely on suchapproximations and also deviations from the widelyused JMAK (JohnsonndashMehlndashAvramindashKolmogorov)models need to be considered Analysis of calorimetrydata in terms of amounts of reacting phases hasattracted some attention but the requirements for thevalidity of this quantitative application are strict and insome cases assumed proportionality of heat contents ofreactions to the amount of single phase formed cannotbe proven
Appendices
Appendix 1 Calculation of accuracies ofisoconversion methodsThe deviations by factors (i)ndash(vi) can be estimated asfollows
Error source (i)
For type B methods it holds120
lnp(yf )
b
~const (73)
The general form for the approximation of p is givenby
pa(y)~exp(y)q(y) (74)
If the ratio between p and the approximation pa is r(y)then we can rearrange equation (73) to
lnpa(yf )r(y)
b
~ln
exp (y)q(yf )r(y)
b
~yzlnq(yf )
b
zlnfrac12r(y)~const (75)
and thus it follows
d lnfrac12q(yf )=bd(1=T)
~E
R
d ln(r(y))
d(1=T)~
E
R1
d lnfrac12r(y)d(y)
(76)
Thus we can conclude that the error introduced byapproximating the temperature integral DEm(T-int) isgiven by
DEm(T-int)
Em~
d lnfrac12r(y)d(y)
~d ln(pa=p)
d(y)(77)
The right-hand side of the equation (77) has beenevaluated elsewhere120 and results are presented inFig 24 This figure shows that for the best p(y)-isoconversion method (type B 192 method) the devia-tions introduced by approximation of the temperatureintegral are less than 025 for y15 and less than075 for y10 For the Lyon method122 in addition tothe approximation of the temperature integral a furthermathematical approximation is introduced which isevaluated elsewhere120 The relative error in E intro-duced is about 22[y(2zy)]21 and hence accuracy is
better than 17 for y10 and better than 08 fory15
Error sources (ii) (iii) and (iv)
If the activation energy is derived from two constantheating rate experiments I and II the activation energyfor a p(y)-isoconversion method (type B method) isgiven by120
Em~R lnbITkfI
lnbIITkfII
1
TfI
1
TfII
1
(78)
where Em represents the measured value of E We canapproximate the deviation introduced by the sources oferror (ii) and (iii) for type B methods as
DEm(ii)(iv)~LEm
LTI
DTIzLEm
LTII
DTIIzLEm
LbIDbI
zLEm
LbIIDbII (79)
where the four terms on the right-hand side relate to theinaccuracies in determination of the temperatures atfixed fraction transformed and the inaccuracies in deter-mination of heating rate The accuracy of the type Amethods (rate-isoconversion methods Friedman method)was analysed in a similar fashion and this yielded
DEm(ii)(iv)~LEm
LTI
DTIzLEm
LTII
DTIIzLEm
LbIDbIz
LEm
LbIIDbIIz
LEm
LqIDqIz
LEm
LqIIDqII (80)
where q5dadT The first four terms on the right-handside are identical to the four terms in the previousequation As the heating rate can generally be deter-mined to a very high accuracy we can ignore the DbIand DbII terms in equation (80) The first term on theright-hand side of equation (80) is evaluated as
LEm
LTI
DTI~RTII
TITII
kzEm
RTI
DTI (81)
As kERT we can approximate
LEm
LTI
DTIEmDTI
TITII
TII
TI
(82)
Thus for type B methods the errors introduced by errorsources (ii)ndash(iv) are mostly dominated by error source(ii) and the errors can be approximated
DEm(ii)(iv)
Em
DTI
TITII
TII
TI
zDTII
TIITI
TI
TII
(83)
This can be further approximated by considering that inmost cases
TITIIvvTII TI
and hence
DEm(iiiv)
Em
DTI
TITIIz
DTII
TIITI(84)
Accuracy of determination of q may depend on a rangeof factors including baseline stability and dependency ofheat flow calibration on heating rate and temperatureand it is thought that Dqq may vary between 05 and5 depending on experimental conditions Considering
Starink Analysis of Al based alloys by calorimetry
222 International Materials Reviews 2004 VOL 49 NO 3ndash4
some typical values for solid state reactions would yieldas indication of the magnitude
RTI
E
TI
TIITI
amp1
20
500
50~05 (85)
Error source (v)
The magnitude of this error depends on the type ofreaction operating The errors for various choices of f(a)have been analysed by Gao et al151 In the present workthe error was estimated by considering the maximumerror introduced by any of these methods in the range15y60
Error source (vi)
The errors introduced by variations of the equilibriumstate during the reaction have attracted little attention inthe literature Attempts at analysis for precipitationreactions have shown that this source of errors can besignificant149
Appendix 2 Mean field model and impingementfactor modelThe mean field model considers that the influence of theimpingement of diffusion field on the growth rate ofspherical precipitates of radius R(t) is related to theaverage solute content of the matrix c(t) through
dR(t)
dt~
cm_c (t)
cpcm
D
R(t)(86)
where D is the diffusivity and cp and cm are theprecipitate and matrix compositions at the interfaceConservation of solute requires that
fpcpz(1fp)_c (t)~coufpfrac12cp
_c (t)~co
_c (t) (87)
where co is the initial matrix concentration fp isthe volume fraction of precipitates which equals43pR(t)3N (N being the number density of growingprecipitates) Eliminating R(t) from these equationsyields
d_c (t)
dt~
D(4=3pN)2=3
(cpcm)(cpco)frac12cp
_c (t)5=3frac12cm
_c (t)
|frac12co_c (t)1=3
~A1(T)frac12cp_c (t)5=3frac12cm
_c (t)frac12co
_c (t)1=3 (88)
where A1(T) is a time-independent factor depending onD N and initial and equilibrium compositions Theprogress of the reaction (evaluated by iteration) can becompared with the StarinkndashZahra model170179
a~1frac12ktn
giz1
gi
(89)
This comparison shows that the StarinkndashZahra modelcan fit the reaction curves to a very high degree ofaccuracy with n515 and gi567 provided the initialconcentration of solute is sufficiently dilute as comparedto the concentration in the precipitate eg
cpcmw10(cocm)
Of special interest is the limit for infinitely dilutesolutions eg where [cp2c(t)] can be considered aconstant In this case equation (88) can be reduced as
follows
d_c (t)
dt~
D(4=3pN)2=3
(cpcm)(cpco)frac12cpco5=3frac12cm
_c (t)
|frac12co_c (t)1=3
~A2(T)frac12cm_c (t)frac12co
_c (t)1=3 (90)
where A2(T) is a time-independent factor depending onD N and initial and equilibrium compositionsConsidering that co2c(t) is proportional to a and thatcm2c(t) is proportional to 12a we can rewriteequation (90) as204
da
dt~A3(T)frac121aa1=3 (91)
Thus the mean field model for precipitation is com-patible with equations (6) and (7) with f(a)5[12a]a13 Ahighly accurate approximate solution for the latterequation is the StarinkndashZahra equation with gi5567and n515 ie
frac121aa1=3nfrac12(1a)1=g1(n1)=n(1a)(gz1)=g
with the gi and n values indicated
Acknowledgements
The provision of original graphs of calorimetry curvesand other data by several of the authors cited in thisreview is gratefully acknowledged Through the years DrA-M Zahra Professor E J Mittemeijer and ProfessorP J Gregson contributed useful discussions on severalof the topics included in this work
References1 T Gloriant and A L Greer Nanostr Mater 1998 10 389ndash396
2 Shushan Dong Guangtian Zou and Haibin Yang Scr Mater
2001 44 17ndash23
3 T P Prasad S B Kanungo and H S Ray Thermochim Acta
1992 203 503ndash514
4 R Sabbah A-M Zahra R Castanet and G Bardon de Segonzac
personal communications CTMndashCNRS Marseille France 1996
5 lsquoCalorimeters Calvetrsquo SETARAM group Caluire France 2001
(descriptions of SETARAM calorimeters)
6 J H Rechardson and R V Peterson lsquoSystematic materials
analysisrsquo 1978 New York Academic Press
7 C Michaelsen K Barmak and T P Weihs Phys D 1997 30
3167ndash3186
8 M J Richardson and E L Charsley in lsquoHandbook of thermal
analysis and calorimetryrsquo (ed M E Brown) Vol 1 547 1998
Amsterdam Elsevier
9 W Lacom Thermochim Acta 1996 271 93ndash100
10 A Zahra C Y Zahra and M Laffitte Z Metallkd 1979 70 669
11 M J Starink and A-M Zahra Philos Mag A 1998 77 187ndash199
12 A Charai T Walther C Alfonso A-M Zahra and C Y Zahra
Acta Mater 2000 48 2751ndash2764
13 L F Mondolfo lsquoAluminium alloys structure and propertiesrsquo
1976 London Butterworths
14 I J Polmear lsquoLight alloys the metallurgy of the light metalsrsquo 3rd
edn 1995 London Arnold
15 C Garcia-Cordovilla and E Louis Metall Trans A 1984 15A
389ndash391
16 C Garcia-Cordovilla and E Louis Thermochim Acta 1985 93
653ndash656
17 M J Starink A J Hobson and P J Gregson Scr Mater 1996
34 1711ndash1716
18 S P Ringer K Hono I J Polmear and T Sakurai Appl Surf
Sci 1996 94ndash95 253ndash260
19 A K Gupta P Gaunt and M C Chaturvedi Philos Mag A
1987 55 375ndash387
Starink Analysis of Al based alloys by calorimetry
International Materials Reviews 2004 VOL 49 NO 3ndash4 223
20 M J Starink P Wang I Sinclair and P J Gregson Acta Mater
1999 47 3841ndash3853
21 T Sato Mater Sci Forum 2000 331ndash337 85
22 P B Prangnell and W M Stobbs Proc 7th Int Conf on
lsquoComposite materialsrsquo ICCM7 (ed W Yunshu et al) 573 1989
Oxford Pergamon Press
23 M Cieslar P Vostry I Stulikova and B Smola in Proc 6th AlndashLi
Conf (ed M Peters and P-J Winkler) 155 1992 Oberursel
DGM Informationsgesellschaft
24 P B Prangnell and W M Stobbs Proc 12th Risoslash Int Symp on
lsquoMetal matrix composites ndash processing microstructure and proper-
tiesrsquo (ed N Hansen et al) 603 1991 Roskilde Risoslash
25 G W Smith Scr Metall Mater 1994 31 357ndash362
26 G W Smith Thermochim Acta 1997 291 59ndash64
27 C Y Zahra and A-M Zahra Thermochimica Acta 1996 276
161ndash174
28 J Y Yao D A Graham B Rinderer and M J Couper Micron
2001 32 865ndash870
29 R D Sa Lisboa and C S Kiminami J Non-Cryst Solids 2002
304 36ndash43
30 S Ikeno H Matsui K Matsuda K Terayama and Y Uetani
J Jpn Inst Met 2001 65 404ndash408
31 G A Edwards K Stiller G L Dunlop and M J Couper Acta
Mater 1998 46 3893ndash3904
32 Y Ohmori L C Doan Y Matsuura S Kobayashi and K Nakai
Mater Trans 2001 42 2576ndash2583
33 S Abis M Massazza P Mengucci and G Riontino Scr Mater
2001 45 685ndash691
34 S P Ringer S K Caraher and I J Polmear Scr Mater 1998 39
1559ndash1567
35 S P Ringer T Sakurai and I J Polmear Acta Mater 1997 45
3731ndash3744
36 A M Zahra C Y Zahra C Alfonso and A Charaı Scr Mater
1998 39 1553ndash1558
37 A K Jena A K Gupta and M C Chaturvedi Acta Metall 1989
37 885ndash895
38 A K Gupta A K Jena and M C Chaturvedi Scr Metall 1988
22 369ndash371
39 M J Starink and A-M Zahra Thermochim Acta 1997 298 179ndash
189
40 A-M Zahra and C Y Zahra J Thermal Anal 1990 36 1465ndash
1470
41 A-M Zahra C Y Zahra R Castanet G Jaromaweiland
G Neuer J Thermal Anal 1992 38 781ndash788
42 B Noble and S E Bray Acta Mater 1998 46 6163ndash6171
43 J M Martin T Gomez-Acebo and F Castro Powder Metall
2002 45 173ndash180
44 S P Chen M S Vossenberg F J Vermolen J van de Langkruis
and S van der Zwaag Mater Sci Eng A 1999 272 250ndash256
45 X Li and M J Starink Mater Sci Forum 2000 331 1071ndash1076
46 M J Starink and A-M Zahra Acta Mater 1998 46 3381ndash3397
47 M J Starink and P van Mourik Mater Sci Eng A 1992 156
183ndash194
48 L Lasa and J M Rodriguez-Ibabe Mater Charact 2002 48
371ndash378
49 Guiqing Wang Xiufang Bian Weimin Wang and Junyan Zhang
Mater Lett 2003 57 4083ndash4087
50 L B Ber and V G Davydov Mater Sci Forum 2002 396ndash402
983ndash988
51 I N A Oguocha M Radjabi and S Yannacopoulos J Mater
Sci 2000 35 5629ndash5634
52 P A Rometsch and G B Schaffer Int J Cast Met Res 2000 12
431ndash439
53 D C Balderach J A Hamilton E Leung M Cristina Tejeda J
Qiao and E M Taleff Mater Sci Eng A 2003 339 194ndash204
54 X J Jiang B Noble V Hansen and J Tafto Metall Mater
Trans A 2001 32A 1063ndash1073
55 X J Jiang B Noble B Holme G Waterloo and J Tafto Metall
Mater Trans A 2000 31A 339ndash348
56 F Lefebvre S Wang M J Starink and I Sinclair Mater Sci
Forum 2002 396ndash402 1555ndash1600
57 M H Chen R Y Hwang and C P Chou Sci Technol Weld
Join 1999 4 21ndash27
58 I N A Oguocha M Radjabi and S Yannacopoulos Can Metall
Q 2001 40 245ndash254
59 T Maeguchi K Yamada and T Sato J Jpn Inst Met 2002 66
127ndash130
60 J M G De Salazar and M I Barrena J Mater Sci 2002 37
1497ndash1502
61 S Ikeno H Matsui K Matsuda and Y Uetani Mater Sci
Forum 2000 331ndash333 1193ndash1197
62 J L Ortiz V Amigo M D Salvador and C R Perez Rev
Metall 2000 36 348ndash356
63 V Massardier L Pelletier and P Merle Mater Sci Eng A 1998
249 121ndash133
64 N Gao L Davin S Wang A Cerezo and M J Starink Mater
Sci Forum 2002 396ndash402 923ndash928
65 C J Tseng S L Lee S C Tsai and C J Cheng J Mater Res
2002 17 2243ndash2250
66 V G Davydov L B Ber E Ya Kaputkin V I Komov O G
Ukolova and E A Lukina Mater Sci Eng A 2000 280 76ndash82
67 D J Lloyd D R Evans and A K Gupta Can Metall Q 2000
39 475ndash482
68 J M Papazian Metall Trans A 1981 12A 269ndash279
69 N Kamp I Sinclair and M J Starink Metall Mater Trans A
2002 33A 1125ndash1136
70 R C Dorward Mater Sci Technol 1999 15 1133ndash1138
71 X Li lsquoMicrostructurendashproperty modelling and predictions of 7xxx
alloysrsquo PhD thesis University of Southampton 2002
72 M J Starink and S C Wang Acta Mater 2003 51 5131ndash5150
73 F Zhou X Z Liao Y T Zhu S Dallek and E J Lavernia Acta
Mater 2003 51 2777ndash2791
74 L Shaw H Luo J Villegas and D Miracle Acta Mater 2003 51
2647ndash2663
75 M T Clavaguera-Mora J Rodriguez-Viejo D Jacovkis J L
Touron N Clavaguera and W S Howells J Non-Cryst Solids
2001 287 162ndash166
76 N Clavaguera J A Diego M T Clavaguera-Mora and A Inoue
NanoStruct Mater 1995 6 485ndash488
77 A S Aronin G E Abrosimova and Y V Kirrsquoyanov Phys Solid
State 2001 43 2003ndash2011
78 N Bassim C S Kiminami M J Kaufman M F Oliveira M N
R V Perdigao and W J Botta Filho Mater Sci Eng A 2001
304ndash306 332ndash337
79 C A D Rodriguez and W J Botta Adv Powder Technol II Key
Eng Mater 2001 189ndash191 573ndash577
80 D V Louzguine and A Inoue J Mater Res 2002 17 1014ndash
1018
81 C J Zhang Y S Wu X L Cai G R Zhou Y C Shi H Yang
and S Wu J Phys Condens Matter 2001 13 L647ndashL653
82 M Gich T Gloriant S Surinach A L Greer and M D Baro
J Non-Cryst Solids 2001 289 214ndash220
83 K Hono Y Zhang A P Tsai A Inoue and T Sakurai Scr
Metall Mater 1995 32 191ndash196
84 G Lucadamo K Barmak D T Carpenter and J M Rickman
Acta Mater 2001 49 2813ndash2826
85 G Lucadamo K Barmak and S Hyun Thermochim Acta 2000
348 53ndash59
86 C Michaelsen and M Dahms Thermochim Acta 1996 288 9ndash27
87 K Barmak C Michaelsen and G Lucadamo J Mater Res 1997
12 133ndash146
88 C Bergman E Emeric G Clugnet and P Gas Defects Diffusion
Forum 2001 194ndash199 1533ndash1538
89 G W Smith W J Baxter and A K Sachdev Mater Sci Eng A
2000 284 246ndash253
90 T X Fan D Zhang Z L Shi R J Wu T Shibayanagai
M Naka and H Mori J Mater Sci 1999 34 5175ndash80
91 D Larouche C Laroche and M Bouchard Acta Mater 2003 51
2161ndash2170
92 Z Zhang X Bian and Y WangMater Lett 2003 57 1261ndash1265
93 C Hsu K A Q OrsquoReilly B Cantor and R Hamerton Mater
Sci Eng A 2001 304ndash306 119ndash124
94 R T Southin and G A Chadwick Acta Metall 1978 26 223ndash
231
95 Y M Youssef R W Hamilton R J Dashwood and P D Lee
Mater Sci Forum 2002 396ndash402 259ndash264
96 D J Chakrabarti and J L Murray Mater Sci Forum 1996 217
177ndash181
97 G Sha K A Q OrsquoReilly B Cantor J Worth and R Hamerton
Mater Sci Eng A 2001 304ndash306 612ndash616
98 P Sainfort J Domeyne and T Warner lsquoProcess for the
desensitisation to intercrystalline corrosion of 2000 and 6000 series
Al alloys and corresponding productsrsquo US patent 5643372 (1997)
99 P Sainfort and P Gomiero lsquo7000 Alloy having high mechanical
strength and a process for obtaining itrsquo US patent 5560789
(1996)
100 H J Brinkman J Duszczyk and L Katgerman Scr Mater
1997 37 293ndash297
Starink Analysis of Al based alloys by calorimetry
224 International Materials Reviews 2004 VOL 49 NO 3ndash4
101 C A Ahravci and M O Pekguleryuz Calphad 1998 22 147ndash
155
102 J Fjellstedt A E W Jarfors and T El-Benawy Mater Des
2001 22 443ndash449
103 R E Hackenberg M C Gao L Kaufman and G J Shiflet Acta
Mater 2002 50 2245ndash2258
104 M Nassik F Z Chrifi-Alaoui K Mahdouk and J C Gachon
J Alloys Compd 2003 350 151ndash154
105 D Kevorkov R Schmid-Fetzer A Pisch F Hodaj and
C Colinet Z Metallkd 2001 92 953ndash958
106 J C Anglezio C Servant and I Ansara Calphad 1994 18 273ndash
309
107 Y Feutelais B Legendre M Guymont and P Ochin J Alloys
Compd 2001 322 184ndash189
108 V T Witusiewicz I Arpshofen H-J Seifert F Sommer and
F Aldinger Thermochim Acta 2000 356 39ndash57
109 A W Zhu B M Gable G J Shiflet and E A Starke Mater
Sci Forum 2002 396ndash402 21ndash30
110 P Saltykov V T Witusiewicz I Arpshofen O Fabrichnaya
H J Seifert F Aldinger Scand J Metall 2001 30 297ndash301
111 V Witusiewicz U K Stolz I Arpshofen and F Sommer
Z Metallkd 1998 89 704ndash713
112 L B Ber and E Y Kaputkin Phys Met Metallogr 2001 92
199ndash209
113 K Bouche F Barbier and A Coulet Z Metallkd 1997 88 446ndash
451
114 J Malek Thermochim Acta 1995 267 61
115 J Sestak and G Berggren Thermochim Acta 1971 3 1
116 M J Starink J Mater Sci 1997 32 4061ndash4070
117 E G Prout and F C Tompkins Trans Faraday Soc 1946 42
468
118 S Vyazovkin and C A Wright Int Rev Phys Chem 1998 17
407ndash433
119 A K Galwey and M E Brown in lsquoHandbook of thermal
analysis and calorimetryrsquo (ed M E Brown) Vol 1 147 1998
Amsterdam Elsevier
120 M J Starink Thermochim Acta 2003 404 163ndash176
121 O Schlomilch lsquoVorlesungen uber hoheren Analysisrsquo 2nd edn
266 1874 Braunschweig
122 R E Lyon Thermochim Acta 1997 297 117
123 C D Doyle J Appl Polym Sci 1961 5 285
124 C D Doyle J Appl Polym Sci 1962 6 693
125 C D Doyle Nature 1965 207 290
126 P Murray and J White Trans Brit Ceram Soc 1955 54 204
127 A W Coats and J P Redfern Nature 1964 201 68ndash69
128 G I Senum and R T Yang J Therm Anal 1977 16 1033
129 M J Starink Thermochim Acta 1996 288 97ndash104
130 J W Graydon S J Thorpe and D W Kirk Acta Metall Mater
1994 42 3163ndash3166
131 E J Mittemeijer J Mater Sci 1992 27 3977ndash3987
132 M J Starink and P J Gregson Mater Sci Eng A 1996 211
54ndash65
133 H E Kissinger J Res Natl Bur Stand 1956 57 217
134 T Akahira and T Sunose Trans 1969 Joint Convention Four
Electrical Institutes 1969 paper 246
135 H Flynn and L A Wall J Polym Sci 1966 4 323
136 T Ozawa J Therm Anal 1970 2 301
137 T Ozawa Thermochim Acta 1992 203 159
138 P G Boswell J Thermal Anal 1980 18 353
139 H L Friedman J Polym Sci C 1964 6 183ndash195
140 C-R Li and T B Tang Thermochim Acta 1999 325 43ndash46
141 R DeIasi and P N Adler Metall Trans A 1977 8A 1177
142 L V Meisel and P J Cote Acta Metall 1983 31 1053ndash1059
143 A Ortega Int J Chem Kinet 2002 34 193
144 P Barczy and F Tranta Scand J Metall 1975 4 284ndash288
145 L C Chen and F Spaepen J Appl Phys 1991 69 679
146 S Vyazovkin J Comput Chem 1997 18 393ndash402
147 A Ortega Thermochim Acta 1996 284 379ndash387
148 J M Criado and A Ortega J Non-Cryst Solids 1986 87 302ndash
311
149 M J Starink J Mater Sci 1997 32 6505ndash6512
150 J H Flynn J Therm Anal 1983 27 95
151 Xiang Gao Dun Chen and D Dollimore Thermochim Acta
1993 223 75ndash82
152 Dun Chen Xiang Gao and D Dollimore Thermochim Acta
1993 215 109
153 M B Berkenpas J A Barnard R V Ramanujan and H I
Aaronson Scr Metall 1986 20 323
154 J M Criado and A Ortega J Therm Anal 1984 29 1225
155 K Dasa and T K Bandyopadhyay Scr Mater 2001 44 2597ndash
2603
156 E A Brandes (ed) lsquoSmithells metals reference bookrsquo 1983
Oxford Butterworths
157 R W Siegel J Nucl Mater 1978 69ndash70 117ndash146
158 W DeSorbo and D Turnbull Acta Metall 1959 7 83ndash85
159 N C W Kuijpers W H Kool S van der Zwaag Mater Sci
Forum 2002 396ndash402 675ndash680
160 N Kamp lsquoToughnessndashstrength relationships in high strength
7xxx Al alloysrsquo PhD thesis University of Southampton
2002
161 B J McKay P Cizek P Schumacher and K A Q OrsquoReilly
Mater Sci Eng A 2001 304ndash306 240ndash244
162 O N Senkov J M Scotta and D B Miracle J Alloys Compd
2002 337 83ndash88
163 I N A Oguocha and S Yannacopoulos J Mater Sci 1999 34
3335ndash3340
164 S P Chen K M Mussert and S van der Zwaag J Mater Sci
1998 33 4477ndash4493
165 A Varschavski and E Donoso J Therm Anal Calorim 2002
68 231ndash241
166 Eon-Sik Lee and Young G Kim Acta Metall Mater 1990 38
1669
167 J B Austin and R L Rickett Trans Am Inst Min Eng 1939
135 396
168 R A Vandermeer and P Gordon in lsquoRecovery and recrystalliza-
tion in metalsrsquo (ed L Himmel) 211 1963 New York Gordon
and Breach Science Publishers
169 L Q Xing J Eckert W Loser L Schultz and D M Herlach
Philos Mag A 1999 79 1095
170 M J Starink and A-M Zahra Thermochim Acta 1997 292
159ndash168
171 M J Starink and A-M Zahra Acta Mater 1998 46 3381ndash3397
172 M J Starink C Y Zahra and A-M Zahra J Therm Anal
Calorim 1998 51 933ndash942
173 M K Miller K F Russell P J Pareige M J Starink and
R C Thomson Mater Sci Eng A 1998 250 49ndash54
174 A R Yavari and D Negri Nanostruct Mater 1997 8 969ndash986
175 E Pineda and D Crespo J Non-Cryst Solids 2003 317 85ndash90
176 V Sessa M Fanfoni and M Tomellini Phys Rev B 1996 54
836
177 Ge Yu and J K L Lai J Appl Phys 1996 79 3504
178 C Michaelsen M Dahms and M Pfuff Phys Rev B 1996 53
11877ndash78
179 M J Starink J Mater Sci 2001 36 4433ndash4441
180 E Pineda T Pradell and D Crespo Philos Mag A 2002 82
107ndash121
181 W S Tong J M Rickman and K Barmak J Chem Phys 2001
114 915
182 J M Rickman W S Tong and K Barmak Acta Mater 1997
45 1153
183 M Tomellini M Fanfoni and M Volpe Phys Rev B 2000 62
11300ndash03
184 N X Sun X D Liu and K Lu Scr Mater 1996 34 1201
185 D P Birnie III and M C Weinberg J Chem Phys 1995 103
3742
186 M C Weinberg and D P Birnie III J Chem Phys 1996 105
5139
187 D P Birnie III and M C Weinberg Physica A 1996 230 484
188 M C Weinberg and D P Birnie III J Non-Cryst Solids 1996
202 290
189 F S Ham J Appl Phys 1959 30 1518
190 F S Ham Q Appl Math 1959 17 137
191 E Pineda and D Crespo Phys Rev B 1999 60 3104
192 P Uebele and H Hermann Modell Simul Mater Sci Eng 1996
4 203
193 A D Rollett Progr Mater Sci 1997 42 79ndash99
194 M P Jackson M J Starink and R C Reed Mater Sci Eng A
1999 264 26ndash38
195 O R Myhr and Oslash Grong Acta Mater 2000 48 1605
196 A Deschamps and Y Brechet Acta Mater 1999 47 293
197 J S Langer and A J Schwartz Phys Rev A 1980 21 948
198 C Sigli Mater Sci Forum 2000 331ndash337 513
199 R Kampmann and R Wagner in lsquoDecomposition of alloys the
early stagesrsquo (ed P Haasen et al) 91ndash103 1984 New York
Pergamon Press
200 E Woldt Metall Mater Trans A 2001 32 2465ndash2473
201 A K Gangopadhyay T K Croat and K F Kelton Acta
Mater 2000 48 4035ndash4043
202 K F Kelton Acta Mater 2000 48 1967ndash1980
Starink Analysis of Al based alloys by calorimetry
International Materials Reviews 2004 VOL 49 NO 3ndash4 225
203 K F Kelton J Non-Cryst Solids 2000 274 147ndash154
204 M Baricco M Groppi E Bosco and A Catellero Mater Sci
Forum 2001 360ndash362 445ndash450
205 K F Kelton T K Croat A K Gangopadhyay L-Q Xing
A L Greer M Weyland X Li and K Rajan J Non-Cryst
Solids 2003 317 71ndash77
206 M Tomellini J Alloys Compd 2003 348 189ndash94
207 M J Starink J Mater Sci Lett 1996 15 1747ndash1748
208 M van Rooyen and E J Mittemeijer Metall Trans A 1989
20A 1207ndash1214
209 A Borrego and G Gonzalez-Doncel Mater Sci Eng A 1998
A245 10ndash18
210 M J Starink Mater Sci Eng A 1999 A276 289ndash292
211 A Borrego and G Gonzalez-Doncel Mater Sci Eng A 1998
A252 149
212 G Garces and P Adeva J Alloys Compd 2002 347 188ndash192
213 A Varschavsky and E Donoso Mater Lett 2003 57 1266ndash
1271
214 A Varschavsky and E Donoso J Therm Anal Calorim 2002
68 231ndash241
215 E Woldt J Phys Chem Solids 1992 53 521
216 P Kruger J Phys Chem Solids 1993 54 1549
217 J M Criado and A Ortega Acta Metall 1987 35 1715ndash1721
218 Eon-Sik Lee and Young G Kim Acta Metall Mater 1990 38
1677
219 J W Christian lsquoThe theory of transformations in metals and
alloysrsquo 542 1975 Oxford Pergamon Press
220 S Vyazovkin and W Linert J Solid State Chem 1995 114
392
221 G Ruitenberg E Woldt and A K Petford-Long Thermochim
Acta 2001 378 97
222 T J W de Bruijn W A de Jong and P J van den Berg
Thermochim Acta 1981 45 315
223 M J Starink and P J Gregson Scr Metall Mater 1995 33
893ndash900
224 M J Starink A J Hobson I Sinclair and P J Gregson Mater
Sci Eng A 2000 289 130ndash142
225 M J Starink A J Hobson and P J Gregson Mater Sci Forum
2000 331ndash337 1321ndash1326
226 M J Starink and P J Gregson Mater Sci Forum 1996 217ndash
222 673
227 A Luo D J Lloyd A Gupta and W V Youdelis Acta Metall
Mater 1993 41 769ndash776
228 Tsung-Rong Chen Guan-Jye Peng and J C Huang Metall
Mater Trans A 1996 27 2923ndash2933
229 A Gaber and N Afify Appl Phys A 1997 65 57ndash62
230 K Satya Prasad A K Mukhopadhyay A A Gokhale
D Banerjee and D B Goel Scr Metall Mater 1994 30 1299
231 H-C Shih N J Ho and J C Huang Metall Mater Trans A
1996 27A 2479
232 M J Starink P Wang I Sinclair and P J Gregson Acta Mater
1999 47 3855ndash3868
233 T Gloriant M Gich S Surinach M D Baro and A L Greer
Mater Sci Forum 2000 343ndash346 365ndash370
Starink Analysis of Al based alloys by calorimetry
226 International Materials Reviews 2004 VOL 49 NO 3ndash4
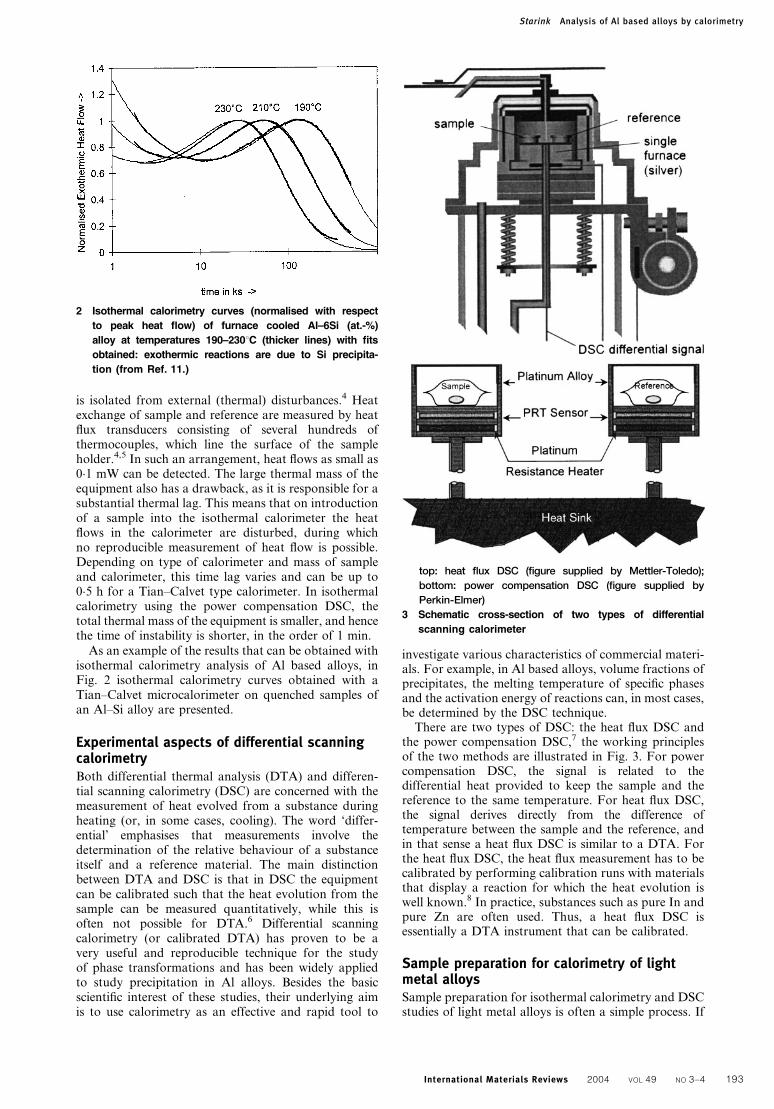
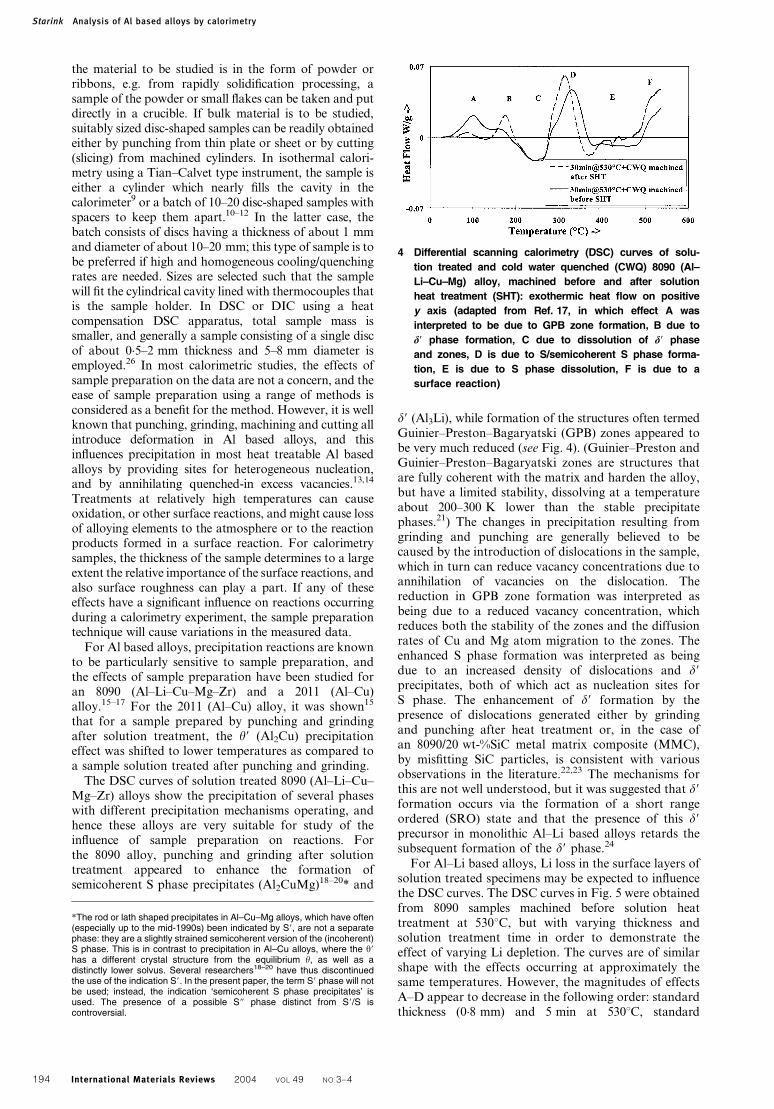
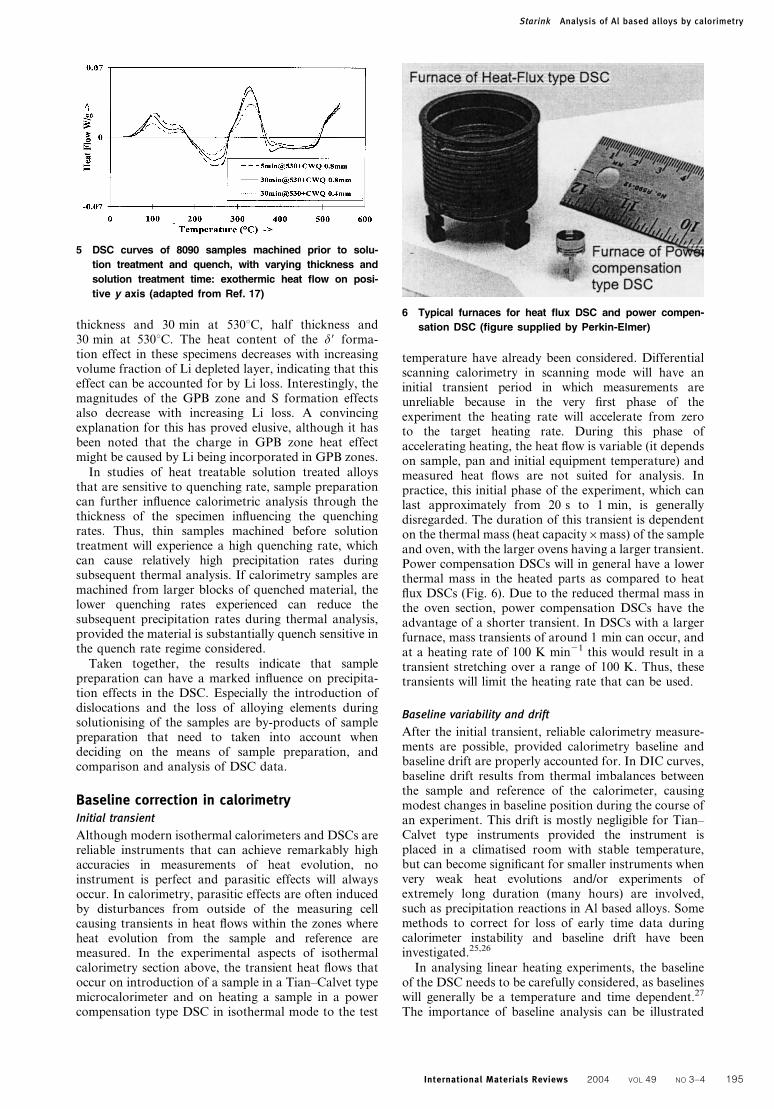
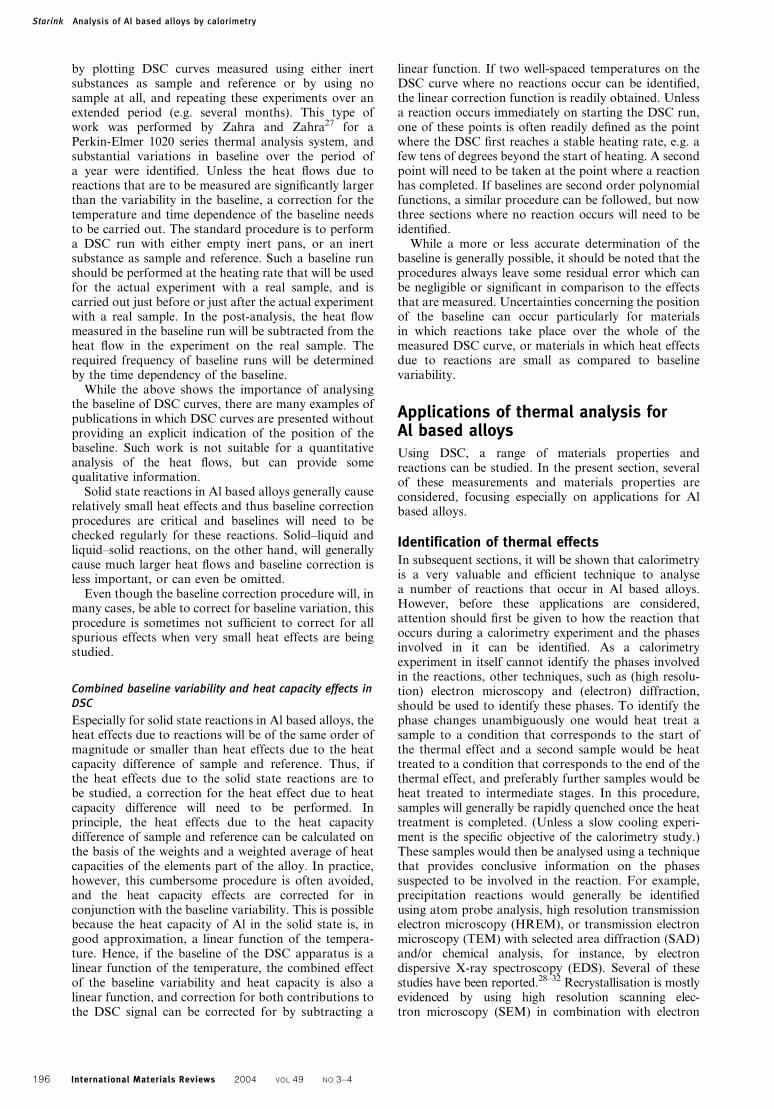
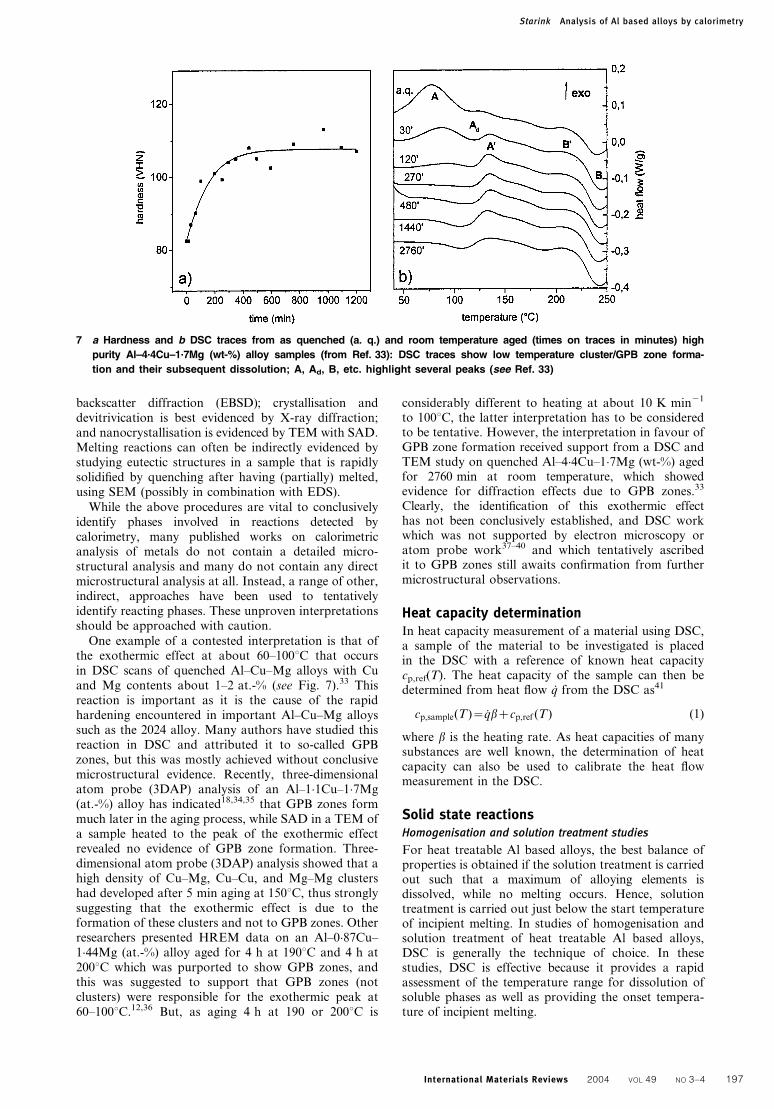
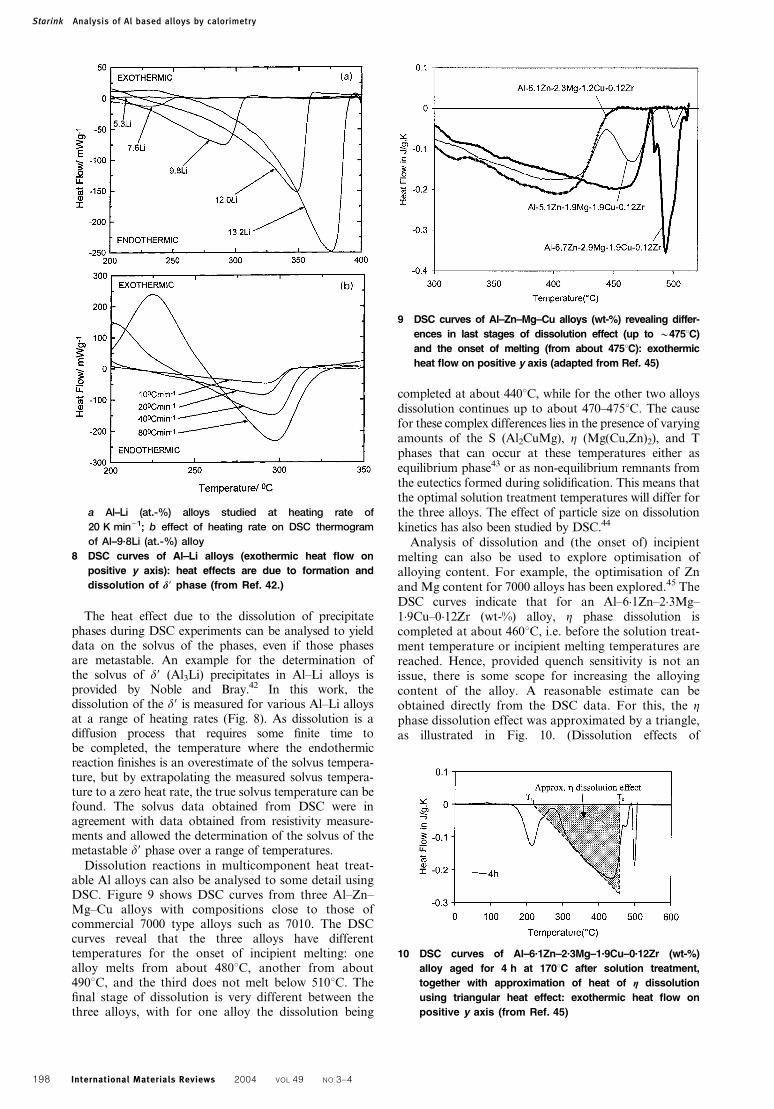
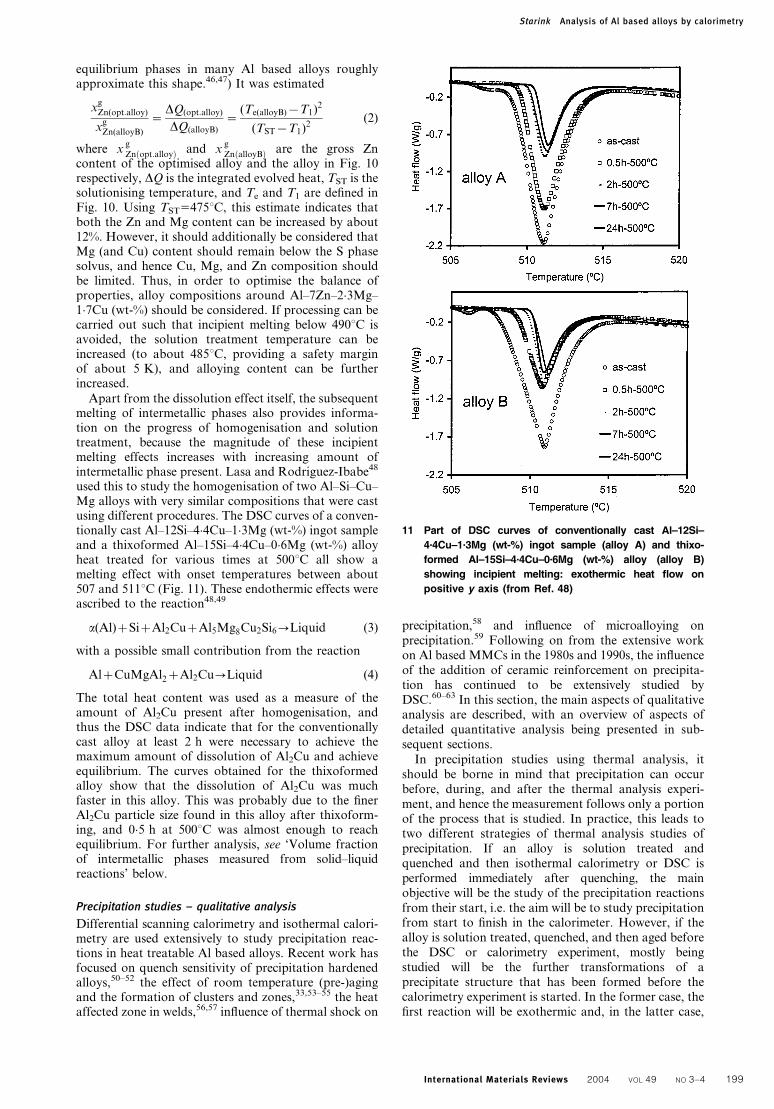
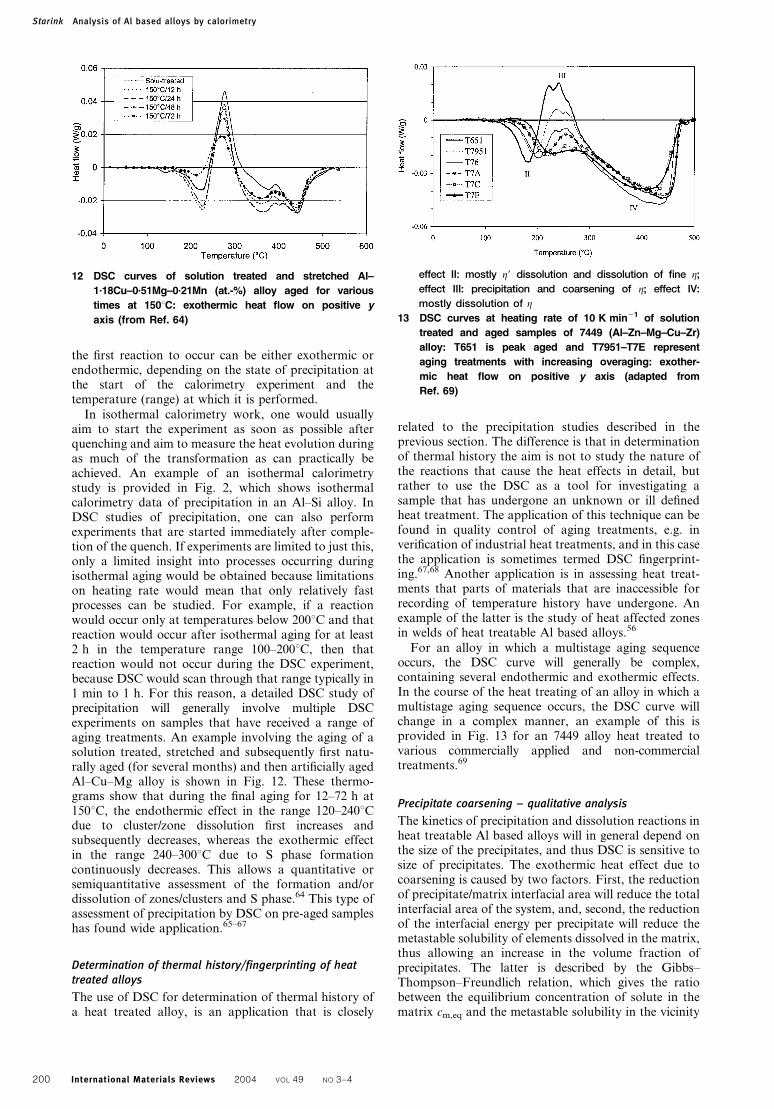
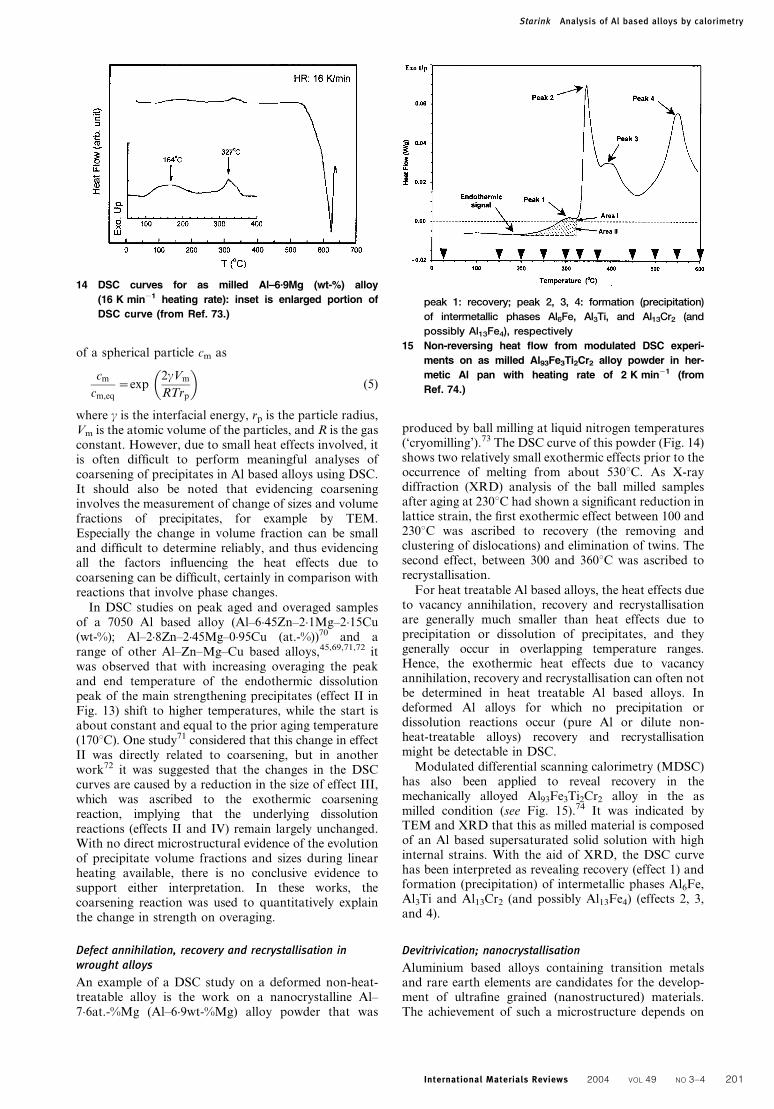
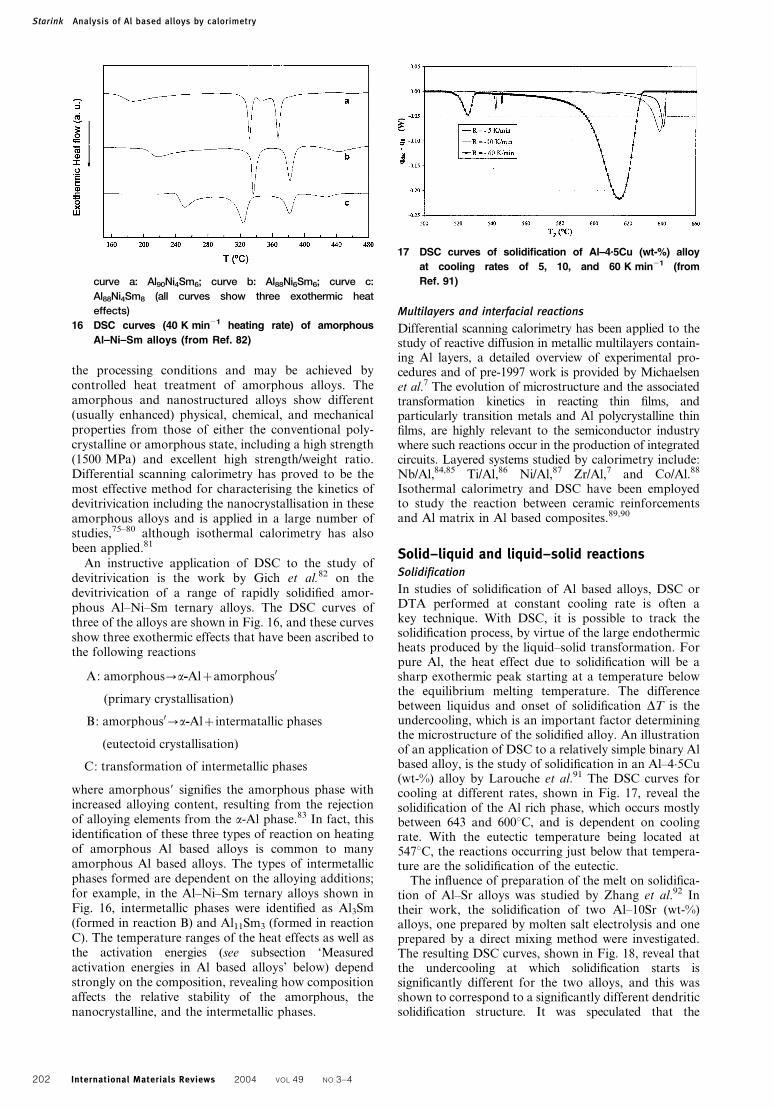
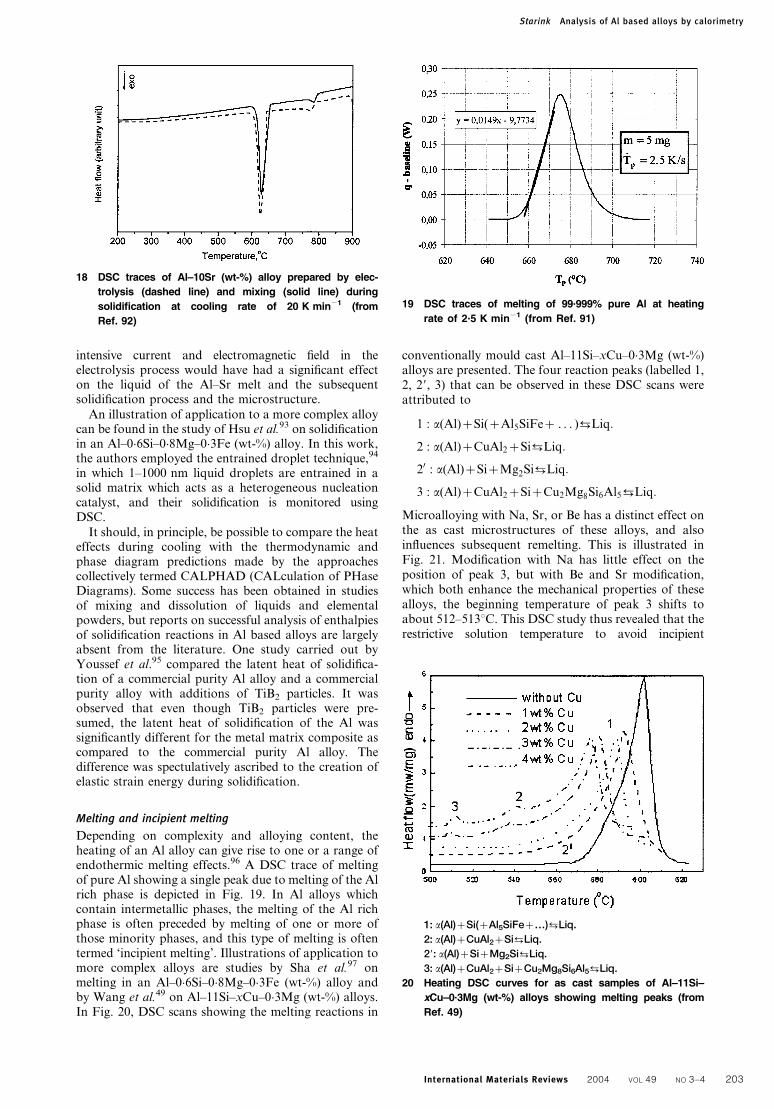
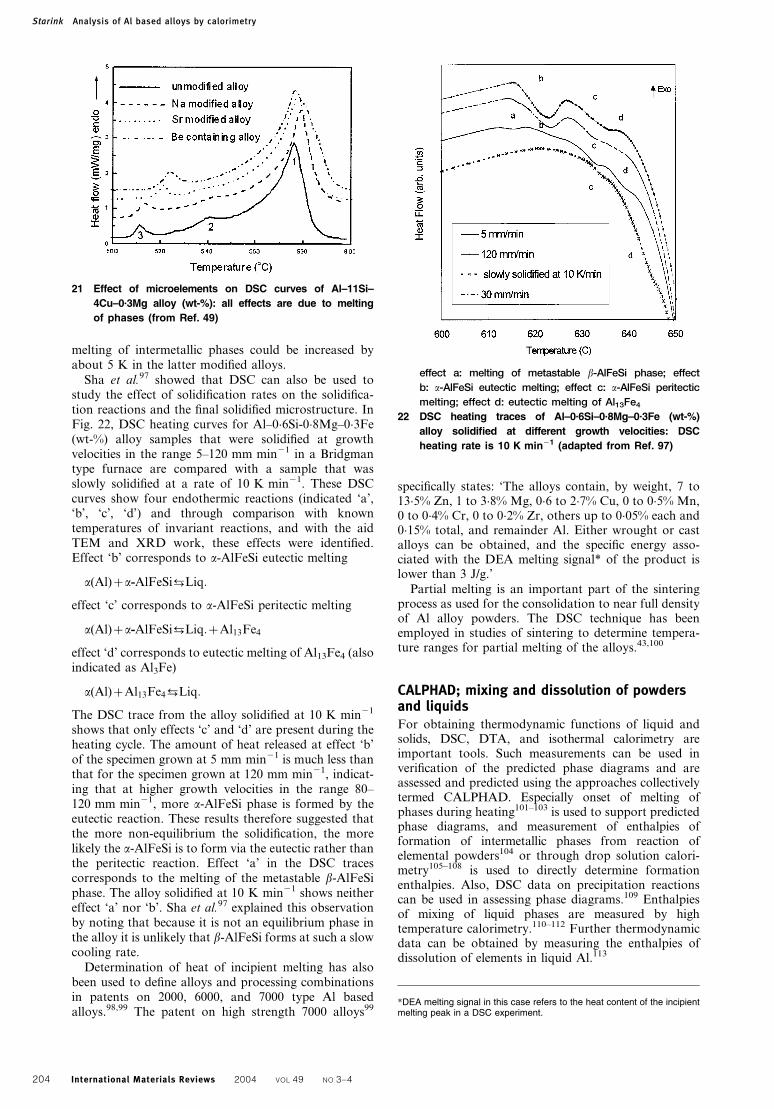
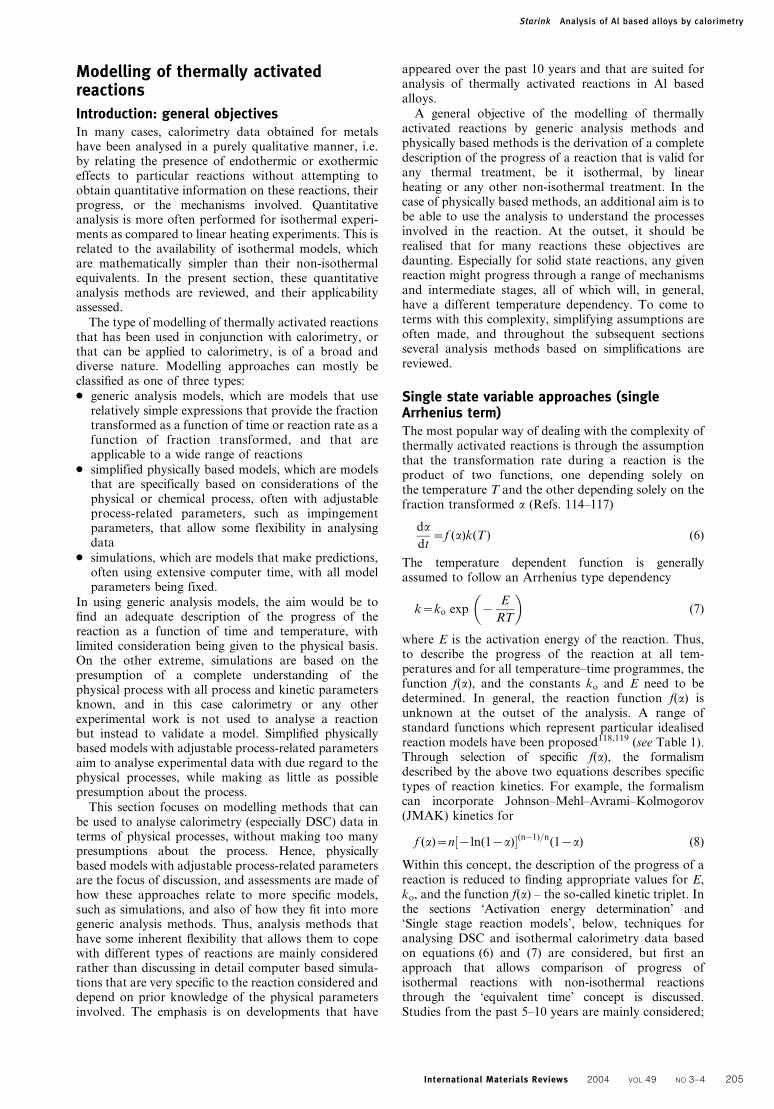
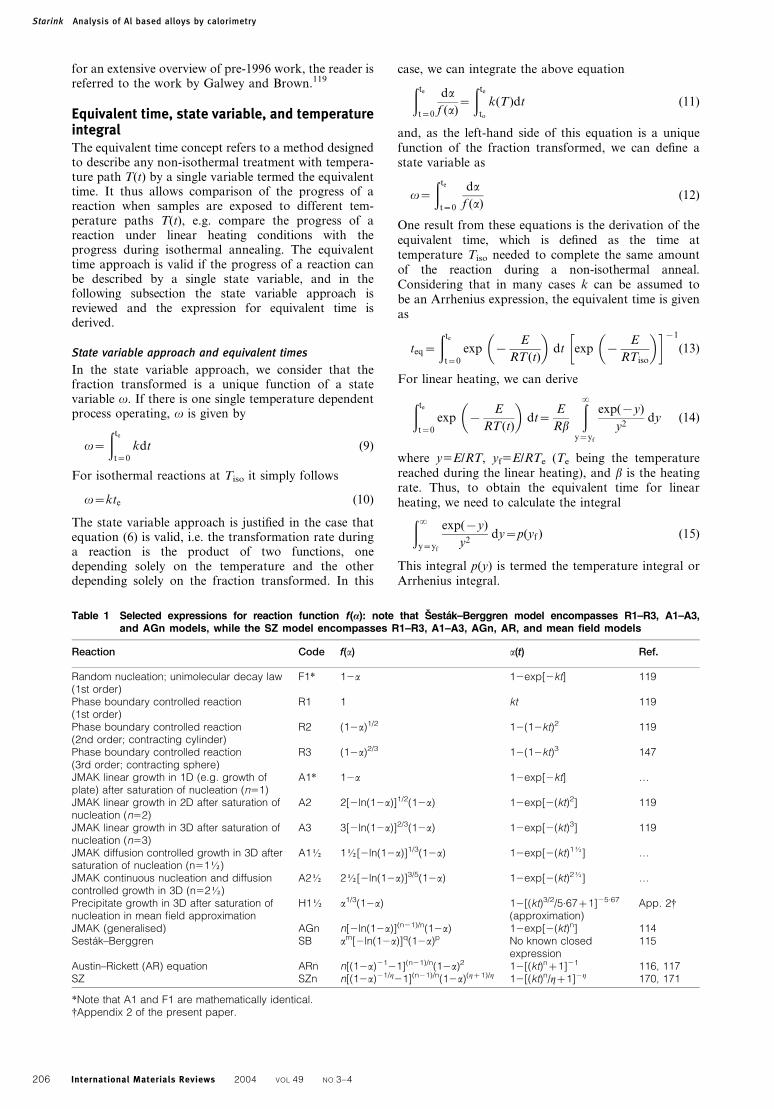

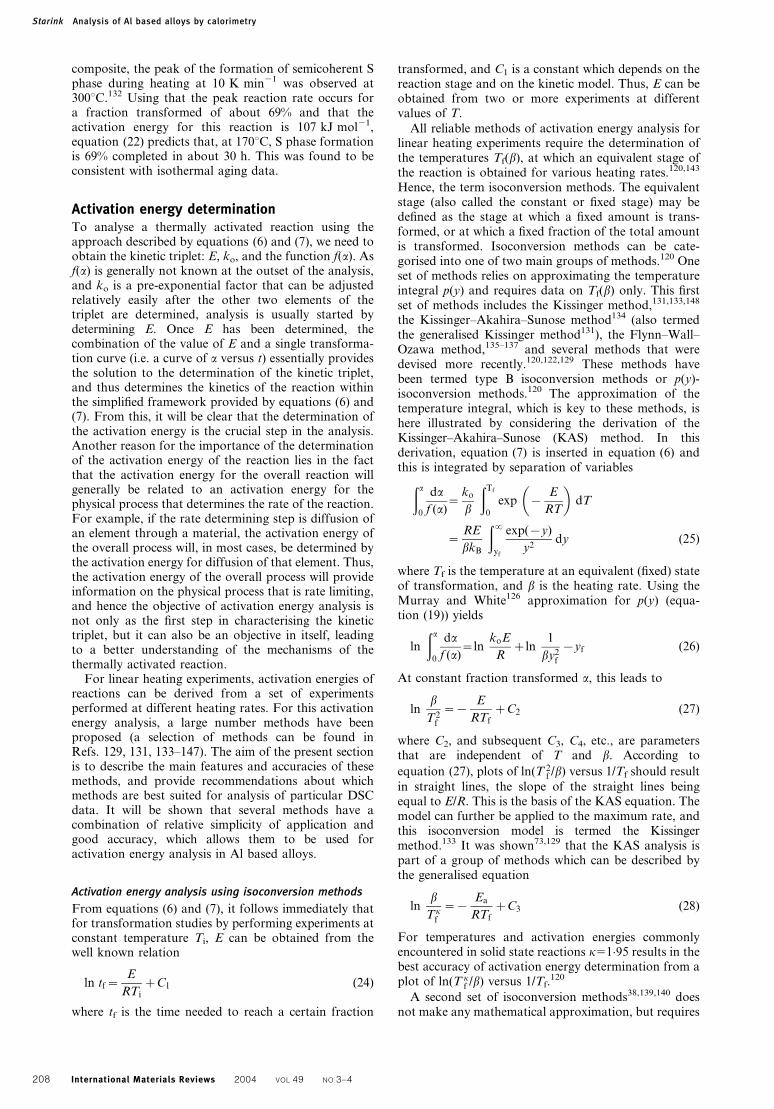
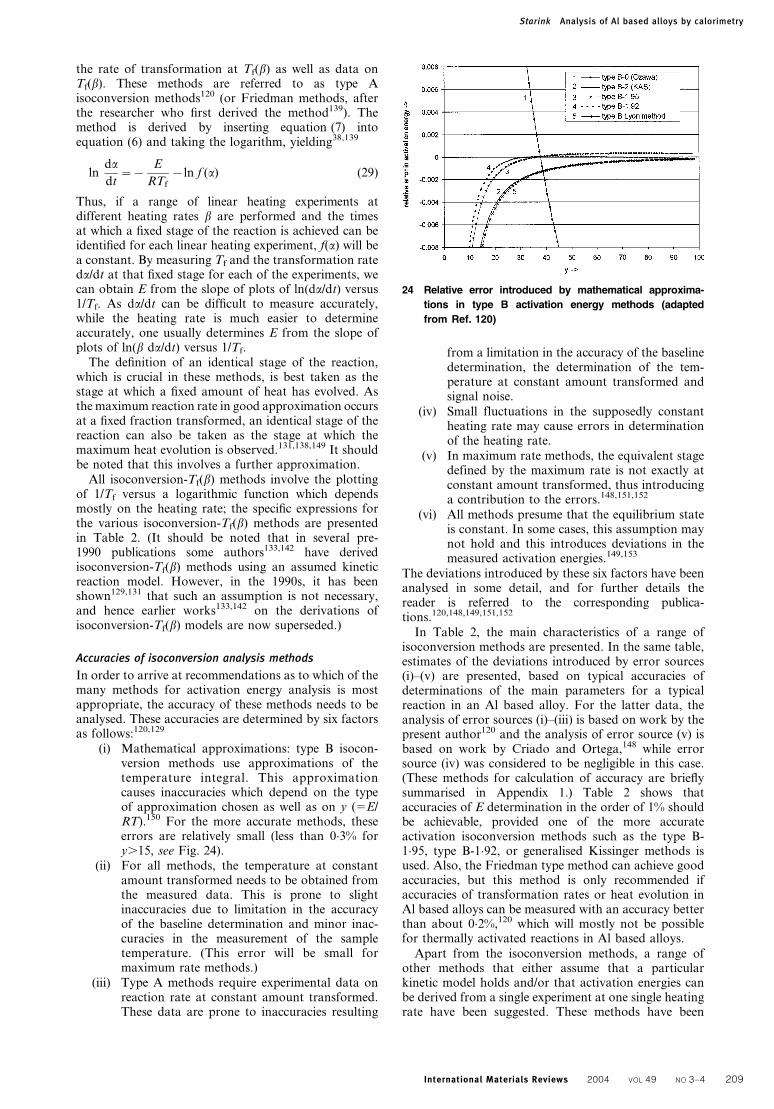
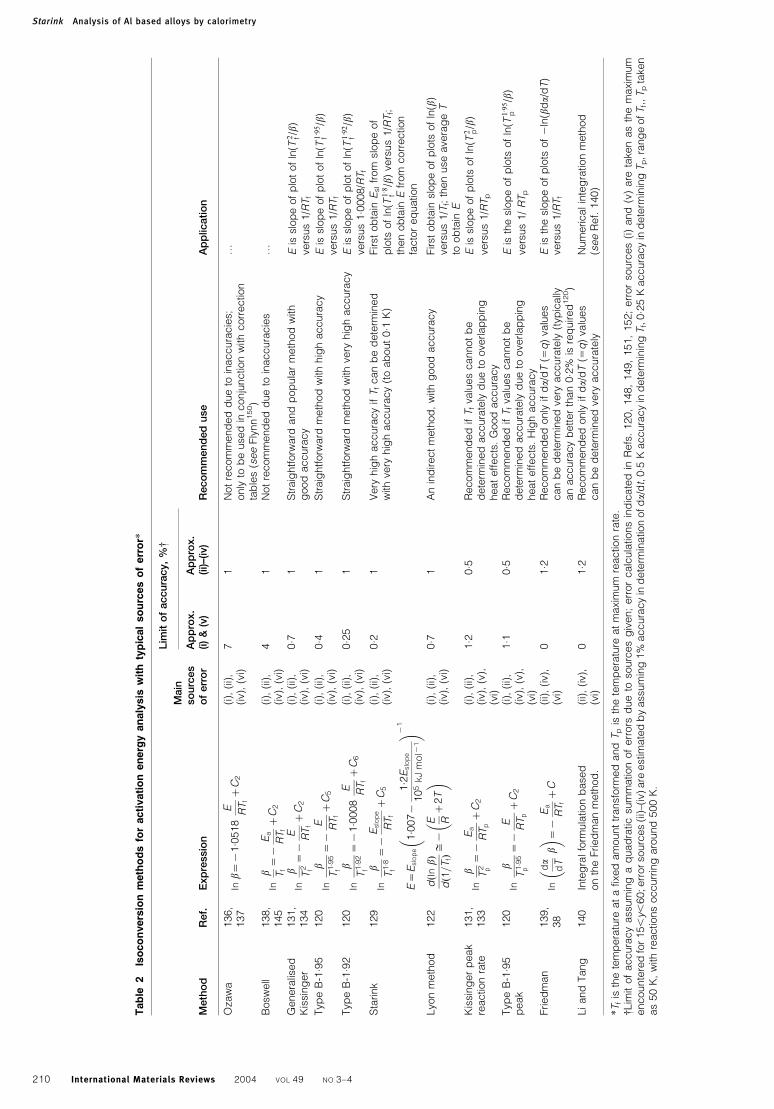
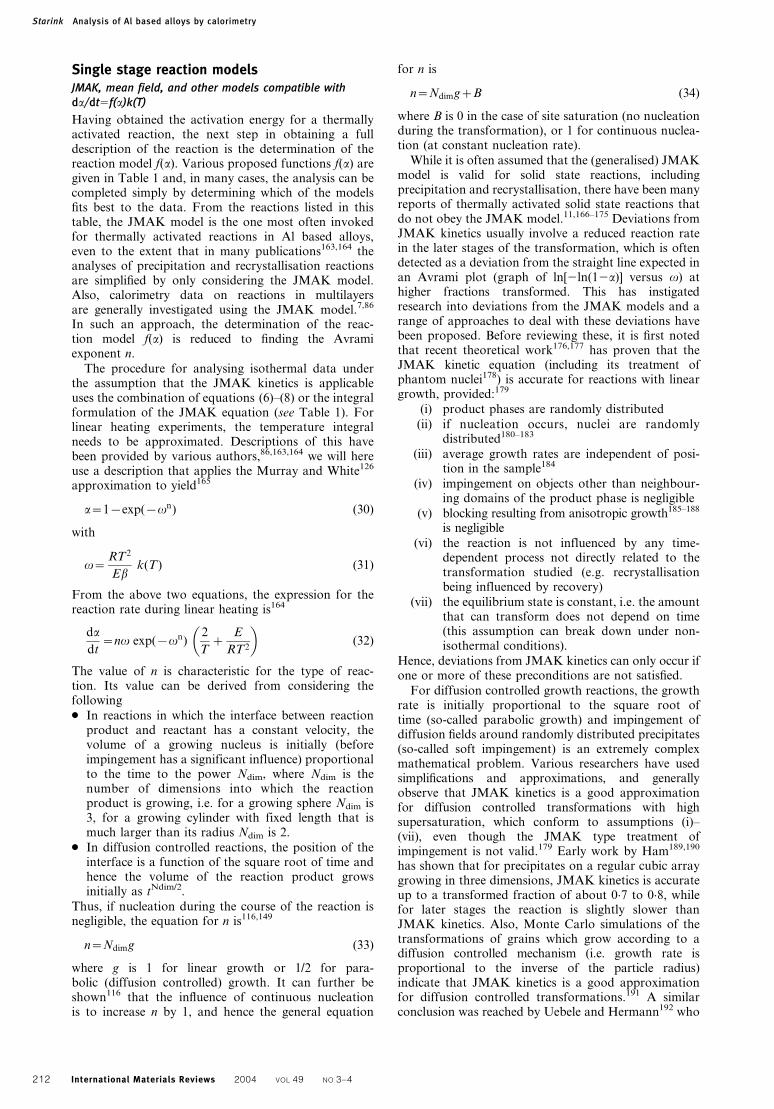

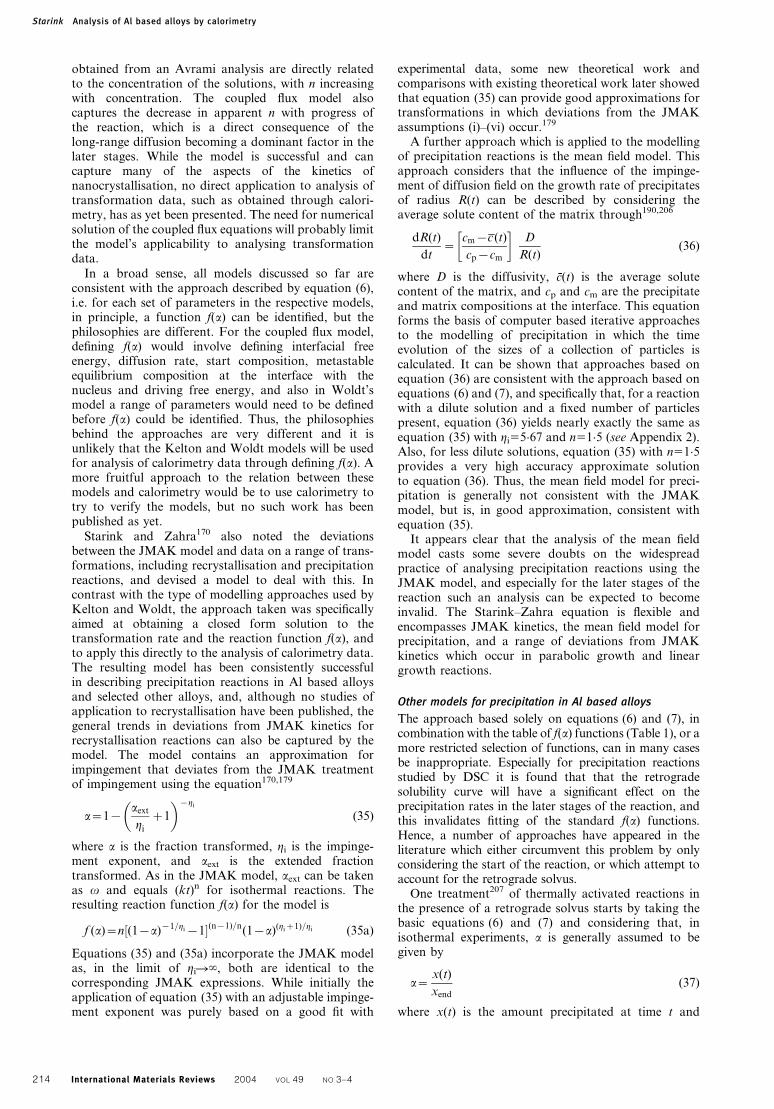
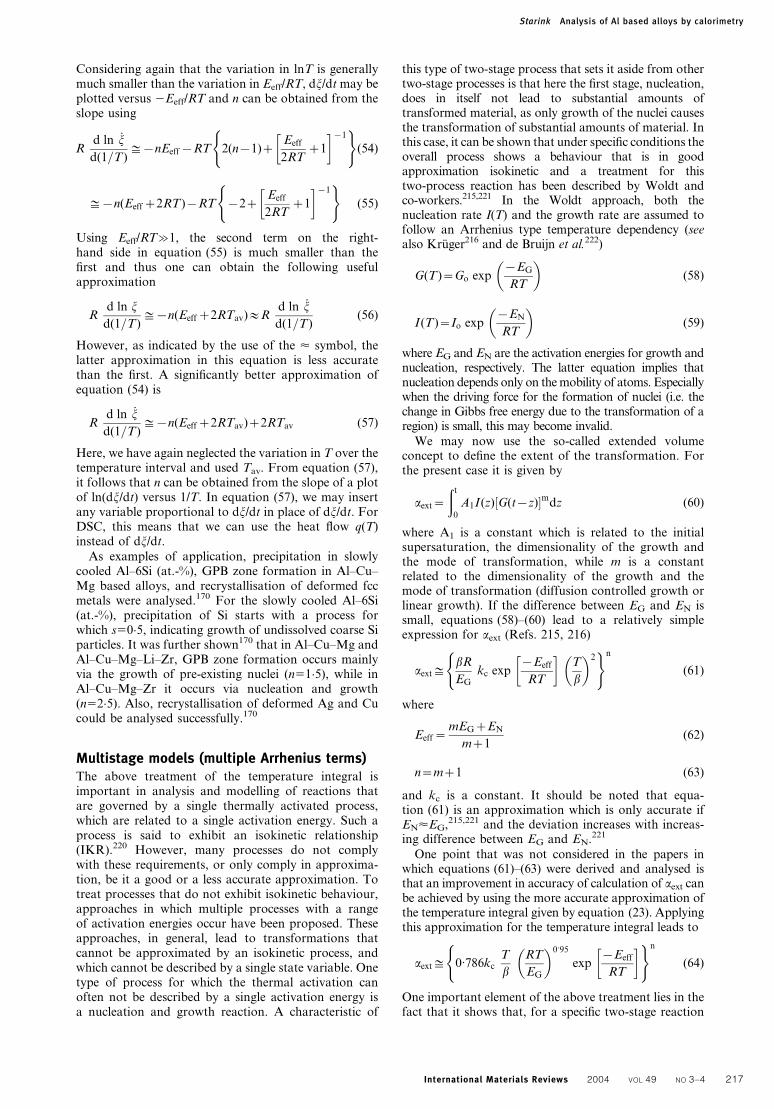
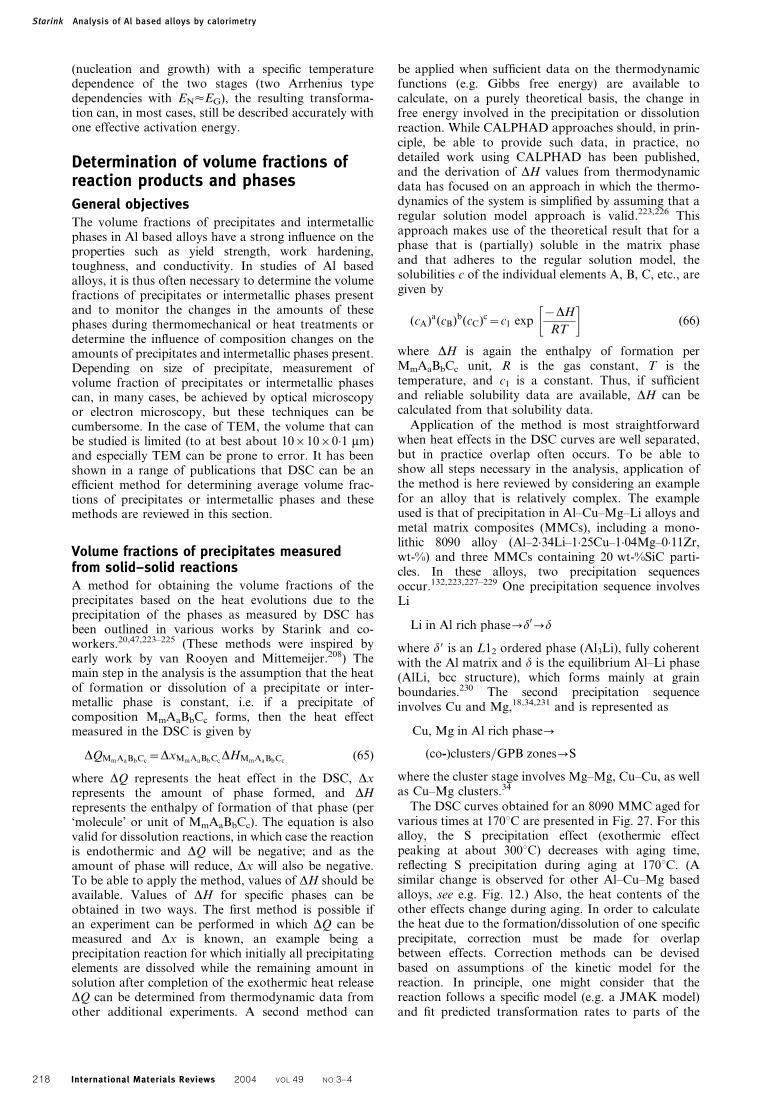

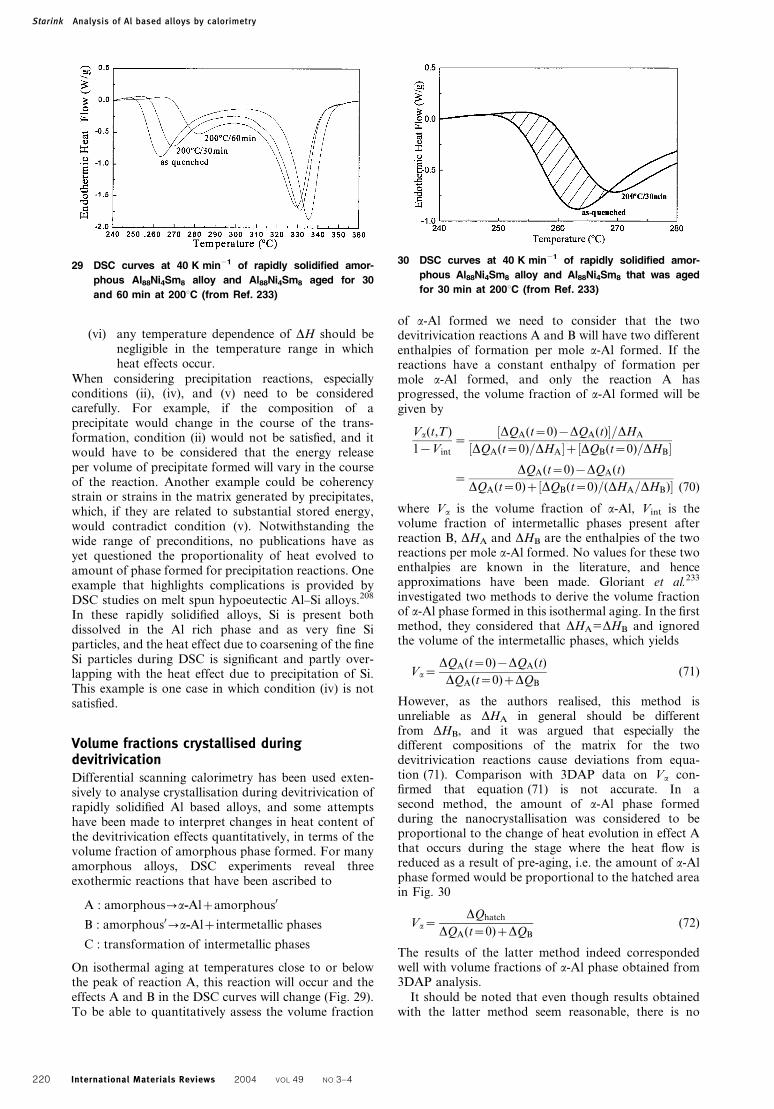
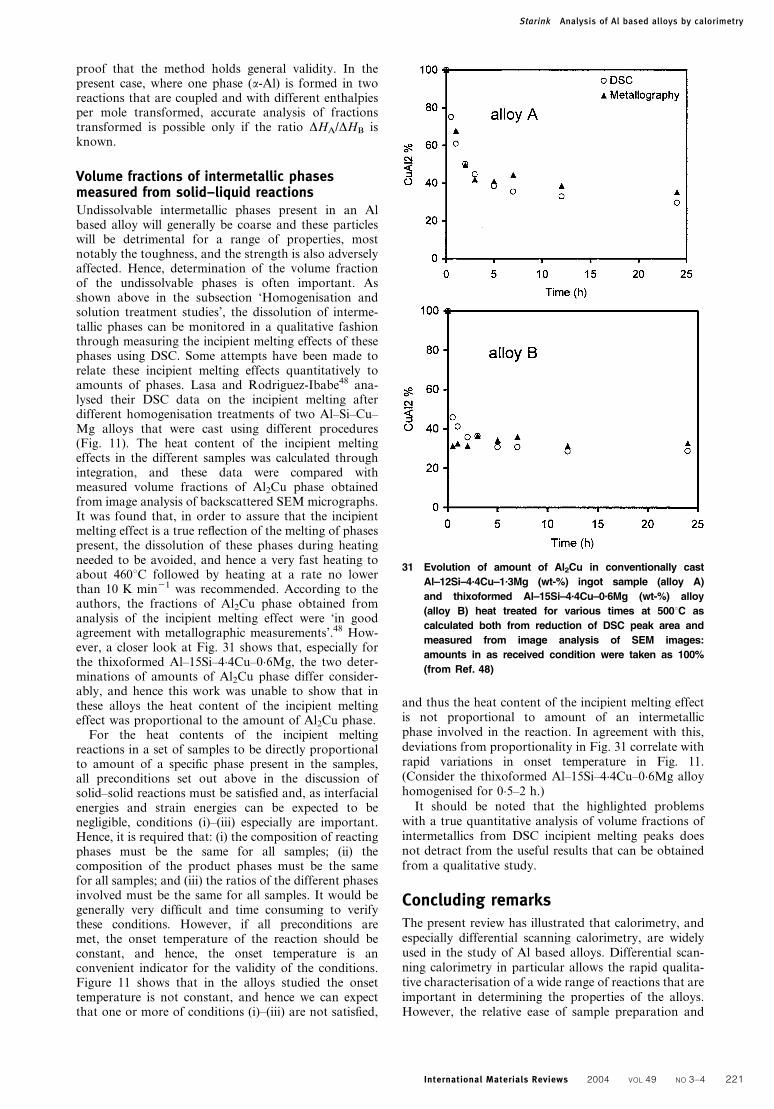


![Medicine - Welcome to ePrints Soton - ePrints Soton · 2019. 12. 16. · an increasing incidence of PIBD within the United Kingdom but the reasons behind this remain unclear.[3,4]](https://static.fdocuments.net/doc/165x107/60ff7d6bdea7f0731c231467/medicine-welcome-to-eprints-soton-eprints-soton-2019-12-16-an-increasing.jpg)


