Analysis of Alternatives (AoA) of Open Colllaboration and ... · Analysis of Alternatives(AoA)of...
110
September 2015 US DEPARTMENT OF ENE RGY NATIONAL NUCLEAR SECURITY ADMINISTRATION Enterprise Construction Management Services Revision 3 Analysis of Alternatives (AoA) of Open Collaboration and Research Capabilities, Collaboration in Research and Engineering in Advanced Technology and Education (CREATE), and High-Performance Computing Innovation Center (HPCIC) on the Livermore Valley Open Campus (LVOC) BPA Number: DE-NA0000385 Order Number: DE-DT00009033 SAND2016-0025R
Transcript of Analysis of Alternatives (AoA) of Open Colllaboration and ... · Analysis of Alternatives(AoA)of...

September 2015
US DEPARTMENT OF ENERGYNATIONAL NUCLEAR SECURITY ADMINISTRATION
Enterprise Construction Management Services
Revision 3
Analysis of Alternatives (AoA) of Open Collaboration and Research Capabilities,
Collaboration in Research and Engineering in Advanced Technology and Education (CREATE), and
High-Performance Computing Innovation Center (HPCIC) on the Livermore Valley Open Campus
(LVOC)
BPA Number: DE-NA0000385Order Number: DE-DT00009033
SAND2016-0025R


Enterprise Construction Management Services HPCIC and CREATE AoA Report
Parsons iii160025r.Docx
APPROVAL
Submitted by Date: September 10, 2015Mark A. Lane, PMPECMS AoA LeadParsons
Accepted by Date:Samuel D. BrinkerContract Officer’s RepresentativeNNSA

Enterprise Construction Management Services HPCIC and CREATE AoA Report
Parsons iv160025r.Docx
This page intentionally left blank.
Enterprise Construction Management Services HPCIC and CREATE AoA Report
Parsons v160025r.Docx
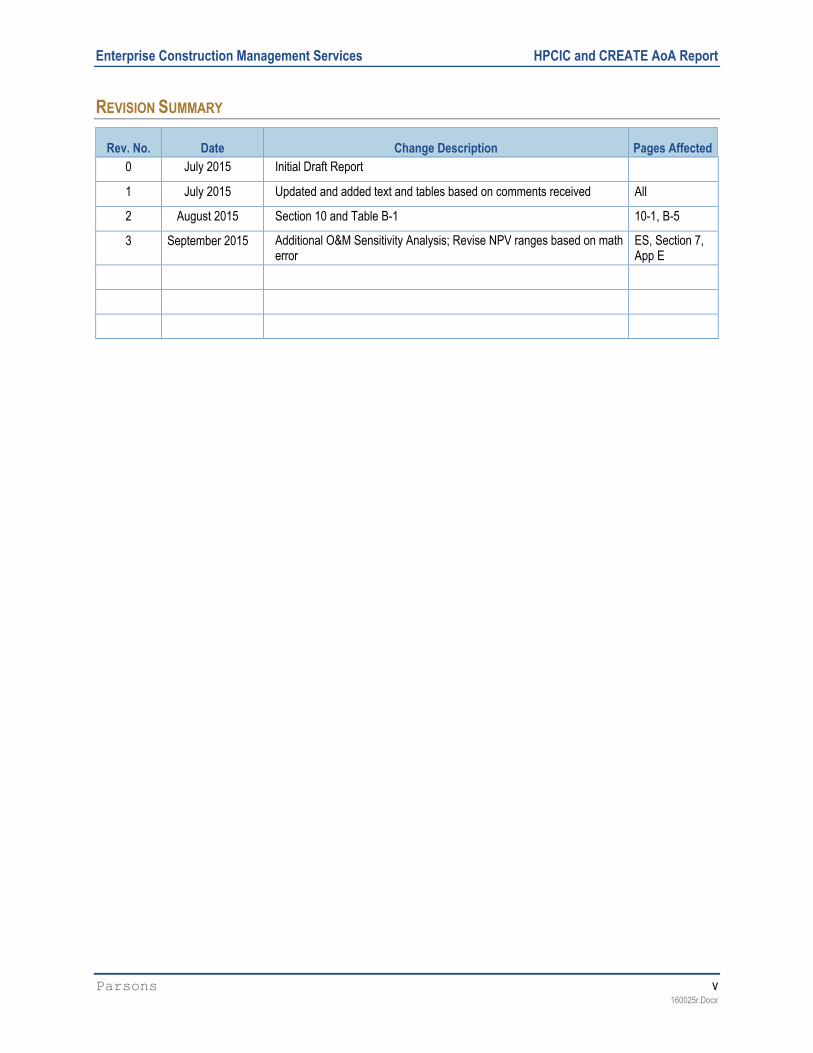
REVISION SUMMARY
Rev. No. Date Change Description Pages Affected
0 July 2015 Initial Draft Report
1 July 2015 Updated and added text and tables based on comments received All
2 August 2015 Section 10 and Table B-1 10-1, B-5
3 September 2015 Additional O&M Sensitivity Analysis; Revise NPV ranges based on math error
ES, Section 7, App E

Enterprise Construction Management Services HPCIC and CREATE AoA Report
Parsons vi160025r.Docx
This page intentionally left blank.

Enterprise Construction Management Services HPCIC and CREATE AoA Report
Parsons vii160025r.Docx
CONTENTS
ACRONYMS .................................................................................................................................XI
EXECUTIVE SUMMARY ........................................................................................................... ES-1
1 SCOPE ............................................................................................................................. 1-11.1 Overall Process .............................................................................................................................1-11.2 GAO Best Practices ......................................................................................................................1-3
2 INTRODUCTION AND MISSION NEED ................................................................................... 2-52.1 Introduction....................................................................................................................................2-52.2 Mission Need.................................................................................................................................2-5
2.2.1 HPCIC ...........................................................................................................................2-62.2.2 CREATE........................................................................................................................2-7
3 REQUIREMENTS AND ASSUMPTIONS .................................................................................. 3-13.1 Requirements ................................................................................................................................3-1
3.1.1 Space Programming Requirements.............................................................................3-13.1.2 Mission and Program Requirements ...........................................................................3-3
3.2 Assumptions and Constraints.......................................................................................................3-3
4 ALTERNATIVES IDENTIFIED AND DESCRIBED....................................................................... 4-14.1 Alternatives Identified....................................................................................................................4-14.2 Description of Alternatives ............................................................................................................4-1
4.2.1 Existing Facilities (Status Quo) ....................................................................................4-14.2.2 Renovate Facilities .......................................................................................................4-14.2.3 Two New Line-Item Facilities .......................................................................................4-24.2.4 Lease Off-site Facility ...................................................................................................4-24.2.5 Lease Two Commercial On-Site Facilities...................................................................4-24.2.6 Single New Line-Item Facility.......................................................................................4-34.2.7 Lease Single On-Site Facility .......................................................................................4-34.2.8 Build Multiple Smaller Facilities....................................................................................4-34.2.9 Develop Only HPCIC....................................................................................................4-44.2.10 Develop Only CREATE ................................................................................................4-44.2.11 Renovate LLNL Facility/Develop New CREATE Facility ............................................4-4
4.3 Alternative Advantages and Disadvantages ................................................................................4-4
5 INITIAL SCREENING OF ALTERNATIVES............................................................................... 5-1
6 EVALUATION CRITERIA...................................................................................................... 6-1
7 COST AND SCHEDULE ESTIMATES ..................................................................................... 7-17.1 Net Present Value (NPV)..............................................................................................................7-17.2 Acquisition Approach ....................................................................................................................7-17.3 NPV Range....................................................................................................................................7-27.4 Cost Sensitivity Analysis ...............................................................................................................7-2
8 ALTERNATIVE EVALUATION ............................................................................................... 8-1

Enterprise Construction Management Services HPCIC and CREATE AoA Report
Parsons viii160025r.Docx
9 CONCLUSIONS .................................................................................................................. 9-1
10 TEAM MEMBERS ............................................................................................................. 10-1
APPENDICES
APPENDIX A GAO AOA BEST PRACTICES EVALUATION.......................................................A-1
APPENDIX B ALTERNATIVES SKETCHES AND ADVANTAGES/DISADVANTAGES........................B-1
APPENDIX C INITIAL ALTERNATIVE SCREENING RATIONALE ..................................................C-1
APPENDIX D EVALUATION CRITERIA ....................................................................................D-1
APPENDIX E COST ESTIMATE(S) ..........................................................................................E-1
APPENDIX F ALTERNATIVE ANALYSES ................................................................................. F-1
APPENDIX G REFERENCES ................................................................................................. G-1
FIGURES
Figure 1-1: Overall AoA Process Diagram.......................................................................................................1-2Figure 1-2: “Develop Alternatives” Process Diagram......................................................................................1-2Figure 1-3: “Describe Alternatives” Process Diagram.....................................................................................1-2Figure 1-4: “Analyze Alternatives” Process Diagram ......................................................................................1-3Figure B-1: CREATE (Alts. 3, 5, and 11) ........................................................................................................ B-2Figure B-2: HPCIC (Alts. 3 and 5) ................................................................................................................... B-2Figure B-3: Single Facility (Alts. 6 and 7)........................................................................................................ B-3Figure B-4: HPCIC (B543 Reno – Alt. 11) ...................................................................................................... B-3Figure E-1: Lease Schedule ............................................................................................................................ E-8Figure E-2: Line Item Schedule....................................................................................................................... E-9
TABLES
Table ES-1: Alternatives for Further Evaluation ...........................................................................................ES-3Table ES-2: Alternatives Analysis Results in Rank Order ...........................................................................ES-4Table ES-3: O&M Sensitivity .........................................................................................................................ES-5Table 3-1: Summary of Space Requirements..................................................................................................3-2Table 3-2: Mission and Program Requirements ..............................................................................................3-3Table 4-1: Initial Alternatives ............................................................................................................................4-1Table 5-1: Initial Screening of Alternatives ......................................................................................................5-1Table 6-1: Desired Criteria................................................................................................................................6-1Table 6-2: Importance Weighting .....................................................................................................................6-2Table 6-3: Desired Attribute Relative Importance and Weight........................................................................6-3Table 7-1: NPV Results ($M)............................................................................................................................7-1Table 7-2: TPC Comparisons Based on Acquisition Strategy ($M)................................................................7-1Table 7-3: Range Analysis Results ($M) .........................................................................................................7-2Table 8-1: Risk Matrix .......................................................................................................................................8-1Table 8-2: Risk List and Levels for Alternatives ..............................................................................................8-2
Enterprise Construction Management Services HPCIC and CREATE AoA Report
Parsons ix160025r.Docx
Table 8-3: Alternative Evaluation Scale ...........................................................................................................8-3Table 8-4: Alternative Scoring Results (Un-weighted) ....................................................................................8-3Table 8-5: Alternatives Results – Weighted Score..........................................................................................8-4Table 8-6: Sensitivity Cases .............................................................................................................................8-5Table 8-7: Sensitivity Analysis for Evaluation Criteria.....................................................................................8-6Table 8-8: Sensitivity Analysis Results ............................................................................................................8-7Table 9-1: Alternative Rankings .......................................................................................................................9-1Table A-1: GAO Best Practices Evaluation .................................................................................................... A-1Table B-1: Alternatives Advantages and Disadvantages............................................................................... B-4Table C-10-1: Mission and Program Requirements .......................................................................................C-1Table C-10-2: Screening Results and Rationale ............................................................................................C-1Table D-1: Desired Attributes ..........................................................................................................................D-1Table D-2: Importance and Weighting Factor.................................................................................................D-2Table D-3: Desired Attribute Relative Importance and Weight ......................................................................D-3Table D-4: Rationale for Attribute and Importance.........................................................................................D-4Table E-1: Compliance with GAO’s 12-Step Guidance.................................................................................. E-3Table E-2: O&M Costs ..................................................................................................................................... E-9Table E-3: NPV Results ($M) ........................................................................................................................ E-11Table E-4: Sensitivity Analysis ...................................................................................................................... E-12Table E-5: TPC Comparisons Based on Acquisition Strategy ($M) ............................................................ E-13Table E-6: Key Parameters Range Analysis ................................................................................................ E-14Table E-7: Range Analysis Results ($M)...................................................................................................... E-14Table E-8: Estimating Team .......................................................................................................................... E-14Table F-1: Attribute Evaluation Scale...............................................................................................................F-1Table F-2: Scoring of Alternatives....................................................................................................................F-2Table F-3: Rationale for Alternative Scoring....................................................................................................F-3Table F-4: Alternatives Results – Weighted Score....................................................................................... F-10Table F-5: Ranking of Alternatives................................................................................................................ F-11Table F-6: Sensitivity Analyses for Evaluation Criteria ................................................................................ F-11Table F-7: Sensitivity Analysis on Evaluation Weighting ............................................................................. F-13Table F-8: Five Sensitivity Analyses for Elimination of Selected Desired Attributes and Risks................. F-13

Enterprise Construction Management Services HPCIC and CREATE AoA Report
Parsons x160025r.Docx
This page intentionally left blank.

Enterprise Construction Management Services HPCIC and CREATE AoA Report
Parsons xi160025r.Docx
ACRONYMS
A&E Architecture and Engineering
AoA Analysis of Alternatives
ASAP as soon as possible
BOE basis of estimate
BOMA Building Owners and Managers Association
CD Critical Decision
CDR Conceptual Design Report
CEPE Cost Estimating and Program Evaluation
COR Contracting Officer’s Representative
CRADA Cooperative Research and Development Agreements
CREATE Collaboration in Research and Engineering for Advanced Technology and Education
CRF Combustion Research Facility
CSI Construction Specifications Institute
D&C design and construction
D&D dismantlement and decommissioning
DOE Department of Energy
DOR Development Options Report
DP Defense Program
EA Environmental Assessment
EAC Estimate at Completion
ECMS Enterprise Construction Management Services
EIS Environmental Impact Statement
ENR Engineering News-Record
EOL end of life
ES Executive Summary
ES&H environment, safety, and health
EVM Earned Value Management
FY fiscal year
G Guide
GAA General Access Area
GAO Government Accountability Office
GPP General Plant Project
GSA General Services Administration
GSF gross square feet

Enterprise Construction Management Services HPCIC and CREATE AoA Report
Parsons xii160025r.Docx
HPC High-Performance Computing
HPCIC High-Performance Computing Innovation Center
ICE Independent Cost Estimate
ICE/R Independent Cost Estimate/Review
IGPP Institutional General Plant Projects
IPR Independent Project Review
IPT Integrated Project Team
ISSM Integrated Safeguards and Security Management
IT Information Technology
LA Limited Area
LCC life-cycle cost
LCCE life-cycle cost estimate
LEED Leadership in Energy and Environmental Design
LEP Life Extension Program
LI line item
LLNL Lawrence Livermore National Laboratory
LVOC Livermore Valley Open Campus
M&O management and operating
MDNC Mission Dependent, Not Critical
MNC Mission Need Concept
MNS Mission Need Statement
NA-APM National Nuclear Security Administration, Acquisition and Project Management
NEPA National Environmental Policy Act
NIF National Ignition Facility
NMD Not Mission Dependent
NNSA National Nuclear Security Administration
NPV net present value
NRW Normalized Relative Weighting
NSF Net square feet
NW Nuclear Weapons
O Order
O&M operations and maintenance
OMB Office of Management and Budget
PM Project Management
PME Project Management Executive

Enterprise Construction Management Services HPCIC and CREATE AoA Report
Parsons xiii160025r.Docx
PPA Property Protection Area
PR Program Requirement
R&D Research and Development
ROM rough order of magnitude
sf square feet
SME subject matter expert
SNDA Subordination Non-disturbance Attornment Agreement
SNL Sandia National Laboratories
SNL/CA Sandia National Laboratories - California
ST&E science, technology and engineering
TPC total project cost
TSF Terascale Simulation Facility
US United States
USACE US Army Corps of Engineers
USF usable square feet
WBS work breakdown structure

Enterprise Construction Management Services HPCIC and CREATE AoA Report
Parsons xiv160025r.Docx
This page intentionally left blank.

Enterprise Construction Management Services HPCIC and CREATE AoA Report
Parsons ES-1160025r.Docx
EXECUTIVE SUMMARY
The Livermore Valley Open Campus (LVOC), a joint initiative of the National Nuclear Security
Administration (NNSA), Lawrence Livermore National Laboratory (LLNL), and Sandia
National Laboratories (SNL), enhances the national security missions of NNSA by promoting
greater collaboration between world-class scientists at the national security laboratories, and their
partners in industry and academia. Strengthening the science, technology, and engineering
(ST&E) base of our nation is one of the NNSA’s top goals. By conducting coordinated and
collaborative programs, LVOC enhances both the NNSA and the broader national science and
technology base, and helps to ensure the health of core capabilities at LLNL and SNL. These
capabilities must remain strong to enable the laboratories to execute their primary mission for
NNSA.
The LVOC is located on Department of Energy (DOE) federal government property that is
managed by SNL and LLNL, with 110 acres of that property designated as a General Access
Area (GAA). Two new capabilities to enhance and advance critical national security goals and
help the laboratories attract and retain an outstanding workforce are the Collaboration in
Research and Engineering for Advanced Technology and Education (CREATE) and the High-
Performance Computing Innovation Center (HPCIC). These are key items to expanding existing
capabilities and realizing the LVOC vision.
The NNSA Administrator and the Under Secretary for Science authorized the creation of LVOC
by approving the Mission Need Concept (MNC) on July 20, 2009 [Ref. 1]. The need for
CREATE and HPCIC, the first new major acquisition projects for LVOC, was documented in the
Critical Decision-0 (CD-0) Mission Need Statement: Open Collaboration and Research
Capabilities in the Livermore Open Campus [Ref. 2]. The NNSA Administrator approved the
CD-0 for LVOC development on April 22, 2013, and requested submission of CD-1 for
CREATE and HPCIC. In accordance with DOE Order (O) 413.3B, Department of Energy
Program and Project Management for the Acquisition of Capital Assets [Ref. 3], systems
engineering principles and processes were used to evaluate the alternatives to meet the Mission
Need. This report provides the analysis of alternatives (AoA) to evaluate the alternatives to meet
the Mission Need.
A team of subject matter experts (SMEs) from the Enterprise Construction Management Services
(ECMS) contractor, including project management, risk, and estimating personnel, was
assembled to perform the AoA. The team was independent of the contractors benefitting from
the outcome of the AoA, and had sufficient federal oversight. The composition of the team is
included in Section 10. The analysis was conducted consistent with the Government
Accountability Office (GAO) best practices, GAO report GAO-15-37, DOE and NNSA Project
Management: Analysis of Alternatives Could be Improved by Incorporating Best Practices, dated
December 11, 2014 [Ref. 4]. The evaluation of how the team addressed the 24 Best Practices is
in Appendix A.

Enterprise Construction Management Services HPCIC and CREATE AoA Report
Parsons ES-2160025r.Docx
To evaluate the alternatives to achieve the capabilities of CREATE and HPCIC for the LVOC,
the team used the following process:
Identify high-level functional requirements to meet the Mission Need.
Establish the criteria to be used to screen and evaluate the alternatives.
Identify the weighting factors for each evaluation criterion based on their relative
importance.
Conduct brainstorming sessions to identify a list of potential alternatives.
Develop pre-conceptual alternative descriptions, facility sketches, advantages/disadvantages
(pros/cons), and relative risks for each alternative.
Review and screen out alternatives that do not meet the mission and program requirements.
Develop net present value (NPV) and life-cycle costs (LCCs) for each remaining alternative,
including design and construction, operations and maintenance (O&M), and
decommissioning.
Using multi-attribute decision analysis, rate each alternative according to its ability to meet
evaluation criteria.
Perform sensitivity analyses, document the results, and identify the ranking of the
alternatives.
Present the AoA to management.
Authorized in 2009, the LVOC facilitates strategic partnering for the broader national security
mission by:
1. Mission Delivery: LVOC provides an optimum environment to engage external
knowledge and capabilities in support of NNSA missions. Leveraging talent and
resources compounds value of NNSA investments.
2. Science, Technology & Engineering (ST&E): LVOC facilitates national and international
collaborations to maintain second-to-none ST&E supporting the breadth of the national
security mission.
3. Workforce: LVOC addresses the intellectual challenges facing the NNSA through
stimulating work that helps retain the current workforce, as well as attract the next
generation of talent to the NNSA laboratories.
LLNL is leading the effort on the HPCIC. The HPCIC is currently operating on the open campus
in rented trailers and focusing on developing industry and academic programs in areas of nuclear
security, advanced manufacturing, energy, cybersecurity, biosecurity, and big data. The goals of
the HPCIC include the following:
Enterprise Construction Management Services HPCIC and CREATE AoA Report
Parsons ES-3160025r.Docx
1. Advances needed in next generation supercomputing systems intensifies urgency to
expand beneficial external collaborations
2. High-performance computing (HPC) solutions applied to stockpile stewardship,
advanced manufacturing (e.g. additive), cybersecurity, biosecurity, big data analytics, and
complex energy systems.
SNL is leading the effort on CREATE at its California campus. The goals of CREATE include
the following:
1. Hydrogen science and technology for energy applications, cybersecurity, advance
engineering and manufacturing and translational biomedicine.
2. Growing NNSA Mission Needs in the Nuclear Weapons (NW) program (directed
stockpile work and life extension programs) drive the need to reconfigure the site to bring
additional buildings into the Limited Area by moving appropriate functions to the LVOC.
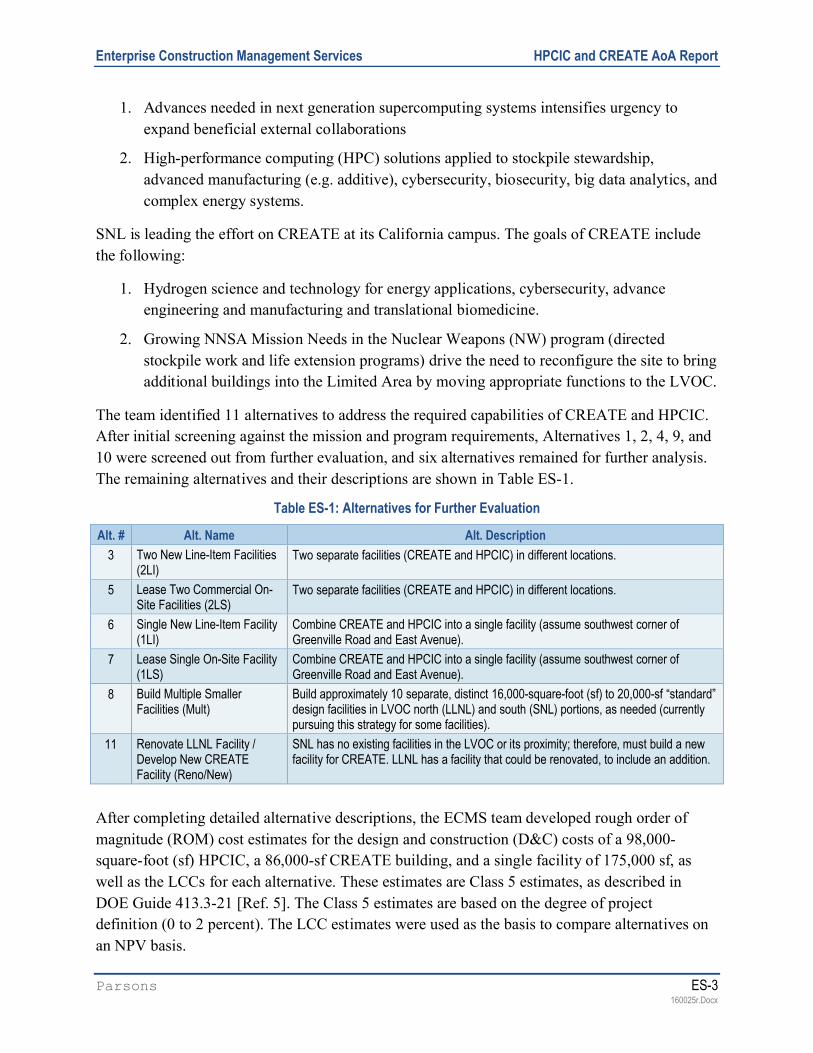
The team identified 11 alternatives to address the required capabilities of CREATE and HPCIC.
After initial screening against the mission and program requirements, Alternatives 1, 2, 4, 9, and
10 were screened out from further evaluation, and six alternatives remained for further analysis.
The remaining alternatives and their descriptions are shown in Table ES-1.
Table ES-1: Alternatives for Further Evaluation
Alt. # Alt. Name Alt. Description
3 Two New Line-Item Facilities(2LI)
Two separate facilities (CREATE and HPCIC) in different locations.
5 Lease Two Commercial On-Site Facilities (2LS)
Two separate facilities (CREATE and HPCIC) in different locations.
6 Single New Line-Item Facility (1LI)
Combine CREATE and HPCIC into a single facility (assume southwest corner of Greenville Road and East Avenue).
7 Lease Single On-Site Facility(1LS)
Combine CREATE and HPCIC into a single facility (assume southwest corner of Greenville Road and East Avenue).
8 Build Multiple Smaller Facilities (Mult)
Build approximately 10 separate, distinct 16,000-square-foot (sf) to 20,000-sf “standard”design facilities in LVOC north (LLNL) and south (SNL) portions, as needed (currently pursuing this strategy for some facilities).
11 Renovate LLNL Facility /Develop New CREATE Facility (Reno/New)
SNL has no existing facilities in the LVOC or its proximity; therefore, must build a new facility for CREATE. LLNL has a facility that could be renovated, to include an addition.
After completing detailed alternative descriptions, the ECMS team developed rough order of
magnitude (ROM) cost estimates for the design and construction (D&C) costs of a 98,000-
square-foot (sf) HPCIC, a 86,000-sf CREATE building, and a single facility of 175,000 sf, as
well as the LCCs for each alternative. These estimates are Class 5 estimates, as described in
DOE Guide 413.3-21 [Ref. 5]. The Class 5 estimates are based on the degree of project
definition (0 to 2 percent). The LCC estimates were used as the basis to compare alternatives on
an NPV basis.

Enterprise Construction Management Services HPCIC and CREATE AoA Report
Parsons ES-4160025r.Docx
In addition, the team evaluated the advantages and disadvantages of each alternative and
performed a comparative qualitative risk analysis. Those activities supported the quantitative
scoring of the alternatives against the desired attributes and features, or “selection criteria.” The
team developed 20 evaluation criteria, or attributes, that were rated in importance and then
weighted. The team then rated each alternative against how well it met each desired attribute,
allowing the alternatives to be compared to each other.
The AoA report provides details of the analysis process, as well as the descriptions for each
alternative and the results of the final scoring and ranking process.
Table ES-2 shows the results of the weighted scoring for each alternative in rank order.
Table ES-2: Alternatives Analysis Results in Rank Order
Rank Alternative No. Weighted Score NPV ($M) Risk Rank
1 5 (lease 2 new facilities) 94.4 131.0 M
2 7 (lease 1 combined facility) 77.1 135.9 M
3 3 (build 2 new line items) 75.6 165.2 M
4 6 (build 1 combined line item) 64.9 164.4 M
5 8 (build multiple smaller facilities) 55.1 225.2 M
6 11 (renovate 1 facility and build 1 new facility)
42.5 181.1 M
In summary, Alternative 5 (2 leased facilities) was ranked the highest by the team and
Alternative 7 (1 combined leased facility) was ranked second. Overall, the leased facilities
ranked higher in the evaluation than the line item (LI) alternatives. In general, leased facilities
have a more favorable NPV and are expected to be ready for use sooner than the LI construction.
A single facility, procured by either lease or LI, will have additional risks or concerns that will
need to be addressed if either of the single facility alternatives is chosen to move forward. The
concerns include the following:
National Environmental Policy Act (NEPA): A single building combining the capabilities of
CREATE and HPCIC, may put the DOE’s and the laboratories’ environmental approval
postures at risk. Each laboratory has identified its separate facilities in the appropriate site
Environmental Assessment (EA) or Environmental Impact Statement (EIS). A single facility
combining the capabilities of CREATE and HPCIC may lead to a reanalysis and additional
NEPA documentation. Possible delay could be 6 to 18 months.
State Regulatory Agencies: DOE and SNL – California (SNL/CA) or LLNL may be at risk of
being identified as a single owner/manager of the single facility. State regulators currently
consider the two laboratories as separate facilities because they are managed and operated
separately.
Enterprise Construction Management Services HPCIC and CREATE AoA Report
Parsons ES-5160025r.Docx
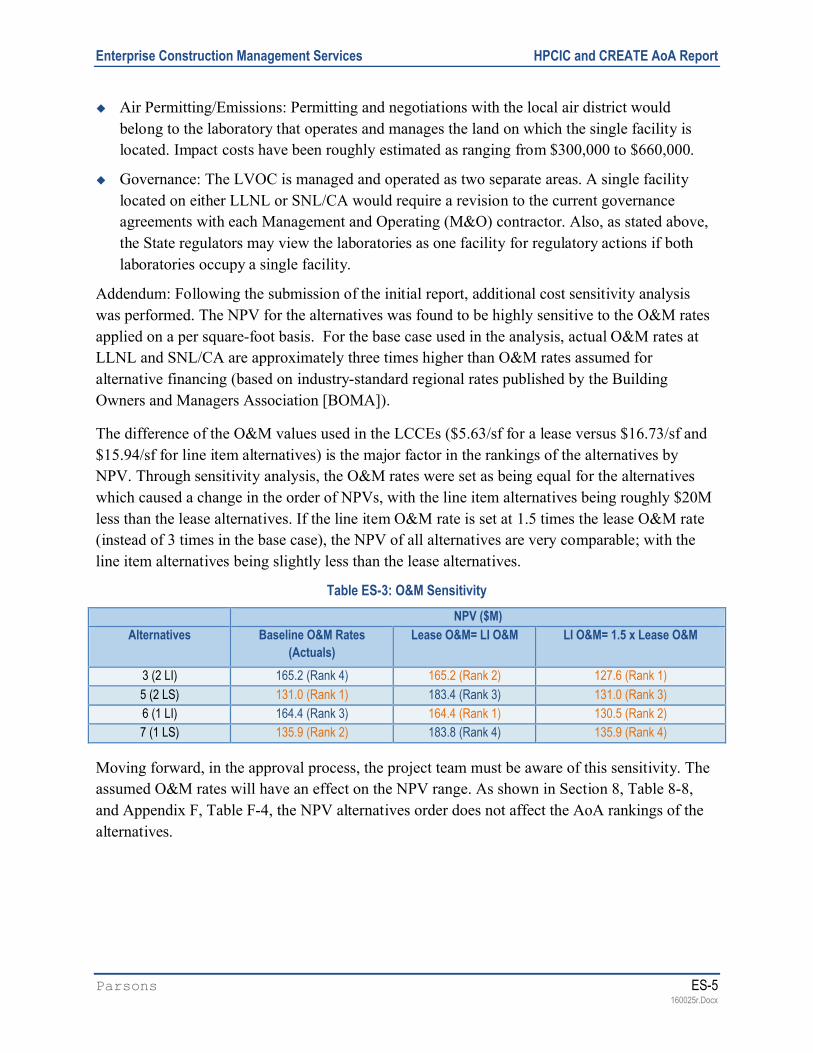
Air Permitting/Emissions: Permitting and negotiations with the local air district would
belong to the laboratory that operates and manages the land on which the single facility is
located. Impact costs have been roughly estimated as ranging from $300,000 to $660,000.
Governance: The LVOC is managed and operated as two separate areas. A single facility
located on either LLNL or SNL/CA would require a revision to the current governance
agreements with each Management and Operating (M&O) contractor. Also, as stated above,
the State regulators may view the laboratories as one facility for regulatory actions if both
laboratories occupy a single facility.
Addendum: Following the submission of the initial report, additional cost sensitivity analysis
was performed. The NPV for the alternatives was found to be highly sensitive to the O&M rates
applied on a per square-foot basis. For the base case used in the analysis, actual O&M rates at
LLNL and SNL/CA are approximately three times higher than O&M rates assumed for
alternative financing (based on industry-standard regional rates published by the Building
Owners and Managers Association [BOMA]).
The difference of the O&M values used in the LCCEs ($5.63/sf for a lease versus $16.73/sf and
$15.94/sf for line item alternatives) is the major factor in the rankings of the alternatives by
NPV. Through sensitivity analysis, the O&M rates were set as being equal for the alternatives
which caused a change in the order of NPVs, with the line item alternatives being roughly $20M
less than the lease alternatives. If the line item O&M rate is set at 1.5 times the lease O&M rate
(instead of 3 times in the base case), the NPV of all alternatives are very comparable; with the
line item alternatives being slightly less than the lease alternatives.
Table ES-3: O&M Sensitivity
NPV ($M)
Alternatives Baseline O&M Rates
(Actuals)
Lease O&M= LI O&M LI O&M= 1.5 x Lease O&M
3 (2 LI) 165.2 (Rank 4) 165.2 (Rank 2) 127.6 (Rank 1)
5 (2 LS) 131.0 (Rank 1) 183.4 (Rank 3) 131.0 (Rank 3)
6 (1 LI) 164.4 (Rank 3) 164.4 (Rank 1) 130.5 (Rank 2)
7 (1 LS) 135.9 (Rank 2) 183.8 (Rank 4) 135.9 (Rank 4)
Moving forward, in the approval process, the project team must be aware of this sensitivity. The
assumed O&M rates will have an effect on the NPV range. As shown in Section 8, Table 8-8,
and Appendix F, Table F-4, the NPV alternatives order does not affect the AoA rankings of the
alternatives.

Enterprise Construction Management Services HPCIC and CREATE AoA Report
Parsons ES-6160025r.Docx
This page intentionally left blank.

Enterprise Construction Management Services HPCIC and CREATE AoA Report
Parsons 1-1160025r.Docx
1 SCOPE
The National Nuclear Security Administration (NNSA) tasked the Enterprise Construction
Management Services (ECMS) team to develop an independent Analysis of Alternatives (AoA)
for the Open Collaboration and Research Capabilities of Collaboration in Research and
Engineering for Advanced Technology and Education (CREATE) and High-Performance
Computing Innovation Center (HPCIC) on the Livermore Valley Open Campus (LVOC).
Following the process described in Department of Energy (DOE) Order (O) 413.3B, the project
team worked closely with the NNSA Office of Acquisition and Project Management (NA-APM)
and the Management and Operating (M&O) contractors. A team of subject matter experts
(SMEs) was assembled to develop and evaluate the potential alternatives. The ECMS team
conducting the AoA was independent of the M&O contractors. Federal oversight was provided
by NNSA, NA-APM, and Cost Estimating and Program Execution (CEPE). The collaborative
team is listed in Section 10 and includes federal, ECMS, and M&O members. The M&O
members provided SMEs to support the ECMS team with information on the laboratories
facilities, LVOC and for the CREATE and HPCIC mission need. This report identifies and
analyzes preliminary conceptual design alternatives for the capabilities needed for CREATE and
HPCIC; it suggests pursuing an alternative concept for the basis of the conceptual design. This
report provides the high-level functions/requirements, alternative descriptions, selection criteria,
and results of the alternatives evaluation, which could serve as the basis for the selection of the
alternative to be developed during the conceptual design of CREATE and HPCIC for the LVOC.
The ECMS team was requested to complete the independent AoA after considerable progress
had been made by the M&O teams. A significant amount of documentation had been completed
to include the Livermore Valley Open Campus Master Plan, Final Report, Version 1.2, Flad
Architects, dated November 4, 2010 [Ref. 6] (referred to as the Flad study), a draft Conceptual
Design Report (CDR), and Critical Decision-1 (CD-1) documents [Ref. 7] and appendices. An
independent project review (IPR) had also been completed on the CD-1 documentation, and
numerous cost estimates were previously completed. This information was provided; however, to
complete an independent analysis of alternatives, much of the information was used for
comparison purposes only.
1.1 Overall Process
The approach for the AoA was to identify the requirements, develop evaluation criteria
(attributes), identify possible alternatives, perform an initial screening of the alternatives, and
then perform a more complete evaluation of the viable alternatives to determine which
alternative best satisfies the selection criteria. These evaluations included preconceptual-level
life-cycle costs estimates (LCCEs), project schedule, execution risk, and other criteria
established in advance by the alternatives team and the Program Office. At the conclusion of the
alternatives evaluation, it is anticipated that the Project Management Executive (PME) or another
appropriate decision maker will select a preferred alternative based on the team’s results.

Enterprise Construction Management Services HPCIC and CREATE AoA Report
Parsons 1-2160025r.Docx
Figure 1-1 shows the overall process. The process starts with the Mission Need Statement
(MNS) and functions and requirements. Steps 1 and 2 are part of the CD-0, Approve Mission
Need, as specified in DOE O 413.3B. The AoA team reviews this information and ensures that
the functions and requirements are clearly stated. If needed, the team clarifies the requirements
so that they can be used for initial screening of alternatives. The team then develops the
evaluation criteria and assigns an importance level (1–4) to each criterion (3 on the process
diagram).
Figure 1-1: Overall AoA Process Diagram
The next step (4) is to develop the alternatives. Figure 1-2 shows this process in additional detail.
This activity starts with a team brainstorming session to identify the possible alternatives.
Figure 1-2: “Develop Alternatives” Process Diagram
After the alternatives are identified, they are then depicted in both words and conceptual
sketches. Figure 1-3 shows this process, which begins with the preparation of the draft
alternative descriptions, followed by alternative sketches and further definition of the alternative
attributes and features. This material is reviewed and updated.
Figure 1-3: “Describe Alternatives” Process Diagram

Enterprise Construction Management Services HPCIC and CREATE AoA Report
Parsons 1-3160025r.Docx
After the alternatives are defined, an initial screening of the alternatives is performed using the
mission and program requirements identified in Step 2. If an alternative cannot meet the
requirements, it is screened out from further consideration. In this case, the team does not
develop life-cycle costs (LCCs) and conducts no further analysis of the screened-out alternative.
The team documents the rationale for the screening decisions. After screening, the team analyzes
the remaining alternatives (Step 6). Figure 1-4 shows this process.
Figure 1-4: “Analyze Alternatives” Process Diagram
After the alternative descriptions, including the conceptual sketches, are reviewed and updated,
the LCCE and Advantages/Disadvantages and Alternative Risks activities proceed in parallel.
Once this material is available the team meets to evaluate the alternatives against the weighted
criteria. The team identifies and performs sensitivity analyses to determine the robustness of the
ranked scores and documents the rationale for the scoring.
The ECMS team developed a Microsoft Excel workbook to perform these calculations and report
the results.
The analysis results in a ranking of the alternatives. Once the analysis is complete, the team
develops a briefing for management and report to document the analysis (this document). The
final step (7), determine the preferred alternative, is performed by senior management after
briefings and review of the AoA report.
1.2 GAO Best Practices
To ensure that the recommended alternative is selected correctly, the Government Accountability
Office (GAO)’s 24 Best Practices for the AoA was followed to the extent possible; each is
documented in Appendix A. The use of a rigorous alternatives analysis process assists in the
selection of an alternative based on the criteria reviewed and approved by major stakeholders, so
that a proper selection can be made.

Enterprise Construction Management Services HPCIC and CREATE AoA Report
Parsons 1-4160025r.Docx
This page intentionally left blank.

Enterprise Construction Management Services HPCIC and CREATE AoA Report
Parsons 2-5160025r.Docx
2 INTRODUCTION AND MISSION NEED
2.1 Introduction
The NNSA Administrator and the Under Secretary for Science approved the Mission Need
Concept (MNC) for the LVOC on July 20, 2009. The LVOC project will include, in part, the
design and construction of the CREATE and the HPCIC capabilities. The LVOC is a joint
initiative of the NNSA, the LLNL, and the SNL/CA to enhance the national security missions of
NNSA by promoting greater collaboration between the world-class scientists at the national
security laboratories and their partners in industry and academia. The LVOC, which creates a
shared space between the two adjacent laboratories, is in accordance with NNSA’s vision for
increased scientific interaction and collaboration across the nuclear security enterprise.
2.2 Mission Need
The MNC for LVOC was approved in 2009, and the LVOC Development Options Report (DOR)
[Ref. 8] was received and endorsed in 2010. These documents established a mission need and the
framework for developing LVOC. The Mission Need and Program Requirements Document for
the Livermore Valley Open Campus was approved on April 22, 2013. This approval was for the
Open Collaboration and Research Facilities in the Livermore Valley Open Campus; HPCIC and
CREATE.
The LVOC leverages and facilitates ready access to the expertise and capital investments already
made by NNSA and the DOE Office of Science while providing a dynamic and exciting work
environment for scientists and engineers. As stated earlier, this joint initiative is a campus of
more than 100 acres dedicated to enhancing the national security mission by strengthening the
science, technology, and engineering (ST&E) base of our nation, one of the NNSA’s top goals in
its 2011 Strategic Plan. Currently encompassing more than a dozen buildings and over 200
employees working in areas such as combustion, biofuels, advanced computing, and
cybersecurity, this new campus is specifically designed as an unclassified open environment to
encourage and build collaboration with external partners in academia and industry. LVOC
expands on the nuclear weapons (NW)-focused partnership initiated between LLNL and SNL in
the 1950s into a channeled alliance that is prepared to meet a broad range of 21st century
challenges. Capitalizing on the expertise and opportunities of a thriving and innovative
community, LVOC draws on new intellect and problem-solving skills to address our nation’s
most pressing security challenges.
The LVOC will address many capability gaps related to LLNL and SNL/CA efforts to enhance
their national security Research and Development (R&D) programs, develop a new pipeline for
the workforce of the future, and stay at the forefront of ST&E capabilities through increased
collaboration with academic and industry partners. The approval of the MNS on April 22, 2013,
provided authorization to proceed with the development of LVOC and preparation of CD-1 for
the HPCIC and CREATE to target one or more specific capability gaps.

Enterprise Construction Management Services HPCIC and CREATE AoA Report
Parsons 2-6160025r.Docx
2.2.1 HPCIC
The effort being led by LLNL focuses on the HPCIC. The HPCIC benefits NNSA by
(1) advancing high-performance computing (HPC) tools; (2) attracting, retaining, and training the
workforce; and (3) establishing strategic partnerships with the industry in open research fields that
are aligned with the broader DOE and NNSA missions. Initial efforts of the HPCIC continue to
focus on developing industry and academic programs in the areas of manufacturing, energy,
cybersecurity, biosecurity, and big data. HPCIC programmatic activities have grown in scale and
complexity and now require a transition from temporary incubators into modern, higher capacity
facilities that better meet the program needs for approximately 400 staff, partners/collaborators
and interns.
High-end computing is a core strategic capability of the NNSA laboratories, particularly at
LLNL since its founding in 1952. The nuclear security mission space is the original and is still a
critically important driver for maintaining this strategic capability. Under the Advanced
Simulation and Computing Program, the NNSA laboratories have developed and are continuing
to develop sophisticated methodologies and techniques that are necessary to accurately model
physical systems. This involves an enormous and comprehensive effort to fund, coordinate, and
manage multiple disciplines, including computer acquisition and services, siting and support,
integrated code development, underlying science, verification and validation, and quantification
of uncertainty. Despite the classified nature of NNSA’s primary mission, many of the underlying
science and engineering activities are unclassified and involve universities, industry, and civilian
agencies. Specific actions by the NNSA are being initiated to further facilitate such
collaborations. The endorsement and support of the LVOC and HPCIC are two such examples.
The HPCIC was launched to foster LLNL and industry collaborations, and is dedicated to
partnering with American industry to develop, prove, and deploy HPC solutions in areas
including (but not limited to) manufacturing, complex energy and infrastructure systems,
cybersecurity, biosecurity, and big data analytics – all areas in which NNSA and DOE mutually
share the need for cutting-edge research. Attraction and retention of a world-class workforce are
important facets to maintaining a US technological advantage in HPC. These broadened
collaborations with industry will allow the workforce to enhance and apply their skills to a
diverse set of new and intellectually challenging projects. More broadly, the objectives of the
HPCIC program align with NNSA’s mission to strengthen US competitiveness.
The historical body of effort and investment by DOE in simulation provides a collective
capability that is unique in the world and can be leveraged to create jobs and strengthen US
competitiveness in the 21st Century’s global economy, consistent with the FY 2011 National
Defense Authorization Act, which strongly encourages the support of industrial interactions
through Cooperative Research and Development Agreements (CRADAs). The HPCIC brings
government, national laboratories, research institutes, industry, and academia together in an

Enterprise Construction Management Services HPCIC and CREATE AoA Report
Parsons 2-7160025r.Docx
ecosystem in which partners leverage the strengths and talent of entities across the globe with
new partnering constructs.
Due to the location, ease of access (in particular for foreign nationals), and the collaborative
design environment, the HPCIC facility has hosted more than 30,000 visitors and 3,000 events
since its opening in June 2011. The incubator currently houses industry and academic
collaborators, as well as a small contingent of LLNL personnel who are necessary to operate and
manage the facility. Due to space limitations, the HPCIC workforce pipeline programs continue
to be dispersed throughout the General Access (open) and Property Protection (closed) Areas
(PPAs).
2.2.2 CREATE
At its California campus, SNL has growing unclassified, collaborative programs in hydrogen
science and technology, cybersecurity, and engineering environments for the future. At the same
time, growth in the NW program requires additional space in the limited area to execute this core
mission. An opportunity exists to simultaneously meet these programmatic needs while also
enhancing the security profile of the SNL/CA site through a more efficient configuration. Sandia
has proposed that the CREATE facility support these customer-driven national security mission
requirements while demonstrating a fiscally responsible approach to cost control.
The CREATE facility on the LVOC is needed to support customer-driven national security
mission requirements and is a key enabler to meeting the need for classified program growth on
the site while demonstrating a fiscally responsible approach to cost control. Specific
requirements for the CREATE facility are driven by the efficiencies of combining several
unclassified administrative functions into one location in the LVOC GAA along with space for
R&D programs that enhance NW and other national security work in hydrogen science,
cybersecurity, and diverse engineering collaborations. Completion of this facility in the GAA
will allow the relocation of about 150 staff members who are engaged in unclassified
administrative functions and research programs, freeing up office space in the Limited Areas
(LAs) for NW and other classified activities.
The proposed CREATE facility will make space available on the LVOC GAA for office, light
laboratory, and meeting areas in a state-of-the-art facility that is safer, more functional, and more
energy efficient than many existing buildings on the site. This space will enable collaboration
with academic and industrial partners that build or maintain expertise in unclassified aspects of
programs that are normally housed in the LA. Collaborations with universities in the CREATE
facility will also provide increased recruiting opportunities for prospective employees, enticing
talent to explore careers within the NW and related programs.
The increase in classified work on the SNL/CA site requires additional office and light laboratory
space in the LA, forcing other programs and administrative functions to relocate to appropriate
lower security zones. To ensure uninterrupted operations, reduce long-term operational costs,

Enterprise Construction Management Services HPCIC and CREATE AoA Report
Parsons 2-8160025r.Docx
reduce energy inefficiency, increase productivity, and enhance capabilities while allowing for
growth in critical national security programs housed in the LA, SNL/CA has an urgent need to
develop its GAA space on the LVOC.
Enterprise Construction Management Services HPCIC and CREATE AoA Report
Parsons 3-1160025r.Docx
3 REQUIREMENTS AND ASSUMPTIONS
3.1 Requirements
3.1.1 Space Programming Requirements
The team received information on the space planning for CREATE and HPCIC that had been
used in the development of the CD-1 documentation, revision 3, dated February 2015. The Space
Requirement Planning Worksheets were reviewed with the known requirements to determine if
the 86,000-sf CREATE facility and the 98,000-sf HPCIC are appropriately sized. The team
developed independent estimates of net square footage (NSF) using circulation factors of
workstations and support facilities based on typical industry standards and experience. A
comparison was then made, shown in Table 3-1, between the provided numbers (column A), and
the numbers developed by the team (column B).
Table 3-1 shows the breakdown of the space requirements, which were reviewed in meetings
with the alternatives team and in interviews. The comparison of A and B resulted in an
approximate 12 percent increase in the HPCIC. The difference in area is due to standardizing the
circulation factor and the building common area factor. The circulation factor is the interior
space of a structure that is required for internal movement between offices and support areas and
is not included in the NSF. The building common area factor allows for restrooms, stairs,
elevators, mechanical/electrical rooms, janitor closets, etc. The 98,000 sf, as identified by the
HPCIC team, is achievable through compromise on the sizes of the support area and
collaborative spaces.
In an effort to evaluate the space requirements of a single facility alternative, the requirements provided by CREATE and HPCIC were combined to achieve efficiencies in space utilization.
Under column C, in Table 3-1, the facility would consist of a centralized “hub” for training/conference, a cafeteria, badge requirements, a learning center, and a fitness center.
Separate wings for CREATE and HPCIC would connect to the hub. Combining the requirements into the single facility resulted in an approximate overall reduction of 5 percent from the total of
space requirements that LLNL and SNL/CA identified for their facilities. It represents an approximate 10 percent reduction of the size identified using typical commercial sizing and
building factors (column B versus column C).

Enterprise Construction Management Services HPCIC and CREATE AoA Report
Parsons 3-2160025r.Docx
Table 3-1: Summary of Space Requirements
Program Comparison Summary
CREATE A B C
Engineering 23,624 20,142 0
Mission Support 14,581 11,960 0
Campus Amenities 23,527 23,171 0
Shared Support 6,756 6,227 0
Subtotal USF 68,488 61,500 0
Building Common Area Factor 17,122 21,525 0
Total GSF 85,610 83,025
HPCIC A B C
Group A 25,618 18,314 0
Group B 25,618 16,533 0
Group C 11,220 9,916 0
Group D 14,295 12,951 0
Learning Center Included below 5,413 0
Badging/Reception/Outreach Multimedia Included below 14,918 0
Support Areas 20,729 3,478 0
Subtotal USF 97,480 81,523 0
Building Common Area Factor Included above 28,533 0
Total GSF 97,480 110,056 0
One Facility A B C
CREATE Staff 0 0 28,508
HPCIC Staff 0 0 46,895
Training/Conference Center 0 0 13,897
Badging/Reception/Outreach Multimedia 0 0 3,393
Technical Library 0 0 4,940
Public Spaces 0 0 4,030
Fitness Center 0 0 7,155
Café/Coffee Shop 0 0 6,526
Learning Center 0 0 5,413
Common Functions on Each Floor 0 0 9,087
Subtotal USF 129,844
Total USF 129,844
Building Common Area Factor 45,445
Total GSF 183,090 193,081 175,289
GSF = gross square feetUSF = usable square feet
A = Programmed area providedB = Parsons’ revisions to programC = Proposed program for one shared facility

Enterprise Construction Management Services HPCIC and CREATE AoA Report
Parsons 3-3160025r.Docx
3.1.2 Mission and Program Requirements
Thirteen high-level requirements were identified as Mission Requirements and Program
Requirements; they are listed in Table 3-2. The team reviewed the program assumptions from the
documentation provided and added assumptions, as appropriate, for the project and the analysis.
The criteria identified as “Requirements” were used in the prescreening process. Alternatives
were judged to either meet the requirements “minimally” or “fully.” If an alternative did not
meet one of the criteria, it was judged as noncompliant and screened out. The criteria identified
as “Desired Features/Attributes” were used to perform the detailed evaluation of the down-
selected alternatives from the prescreening process. Section 5 discusses this evaluation process.
Table 3-2: Mission and Program Requirements
Requirements
Number Description
SourceMission Requirements
PR-1 Provide additional unclassified office/laboratory/collaboration space for LLNL, SNL/CA, and outside collaborators in the LVOC.
MNS – page 3, 4
PR-2 Provide a work environment that is modern, dynamic, and flexible. MNS – page 3, 4
PR-3 Obtain operational effectiveness and efficiencies. MNS – page 4
PR-4 Develop workforce pipeline for attraction, recruitment, development, and retention of world-class staff in a competitive regional market.
MNS – page 1
Program Requirements
PR-5 Provide approximately 160,000 to 200,000 total gross square feet (gsf)(combined requirement for CREATE and HPCIC).
MNS – page 4
PR-6 Provide flexible space of about 4,400 gsf (CREATE) and 1,000 net sf (HPCIC) for light laboratory.
MNS and PRD(CD-1 space reqmts)
PR-7 Support increased demands for LA space. MNS – page 4, PRD
PR-8 Consolidate educational outreach programs and facilities. MNS and PRD
PR-9 Provide additional space in proximity to synergistic programs. MNS and PRD
PR-10 Provide additional space as soon as possible. NW LEP scheduleExoscale Roadmap
PR-11 Mission need is for 15 years (currently identified), with expected life of facility of 35 years. Strategic Planning Documents / Mission timeframes
PR-12 Provide capability to meet Leadership in Energy and Environmental Design (LEED) Gold. PRD and DOE reqmt
PR-13 Provide appropriate security flexibility for different program requirements. MNS – page 2
3.2 Assumptions and Constraints
Key assumptions and constraints factor into the scope and content of the program requirements
for the CREATE and HPCIC capabilities within the existing LVOC. In addition, the interface of
both existing and proposed infrastructure systems, facilities, and projects with CREATE and
HPCIC must be coordinated.
Enterprise Construction Management Services HPCIC and CREATE AoA Report
Parsons 3-4160025r.Docx
Replacement of support systems, utilities, and facilities must be fully integrated with the overall
site modernization, consolidation, and disposition effort. CREATE and HPCIC capabilities will
be integrated with projects supporting the strategic framework and transformational activities for
LVOC.
Other key assumptions are as follows:
1. Budget and resources will be available, as necessary, to optimize the CREATE and
HPCIC implementation.
2. The facility(ies) will be located on or adjacent to the existing Open Campus, on federal
government owned property.
3. The LVOC will provide typical infrastructure support: office and support facilities, roads,
and utility systems (e.g., electrical, natural gas, fire protection, water, sewer, and
information and security communications).
4. The acquisition strategy for CREATE and HPCIC will be determined in accordance with
the DOE O 413.3B process and as part of the outcome of CD-1. The AoA will evaluate a
diverse set of options to determine those that best meet the mission needs established at
CD-0.
Site initiatives to implement the NNSA vision are constrained by the following:
1. Near-term line item (LI) budget limitations for Mission Dependent, Not Critical (MDNC)
and Not Mission Dependent (NMD) construction.
2. There is no space on SNL/CA to renovate near the LVOC. Space is not available and no
building exists that could meet the requirements of CREATE.
Operational Limitations:
The project(s) has no unmanageable operational limitations in effectiveness, capacity,
technology, organizations, or other special considerations. Existing facilities will
continue to be used and maintained during the acquisition of any alternative.
Geographic, Organizational, and Environmental Location:
No unmanageable geographic, organizational, or environmental limitations are expected
with this project.
Internal organizational interfaces exist to support functional requirements development,
program management concurrence, and environmental, safety, and health requirements;
to include National Environmental Policy Act (NEPA) requirements.
The LVOC is governed by two separate institutions: North Campus – LLNL and South
Campus – SNL/CA.

Enterprise Construction Management Services HPCIC and CREATE AoA Report
Parsons 3-5160025r.Docx
Standardization and Standards Requirements:
If acquired through the traditional LI process, the requirements of DOE O 413.3B will be
applied to the entire project life cycle, including design, construction, startup, and
turnover. Design, construction, and execution of the project will comply with all
applicable national codes and standards.
If acquired through alternative financing process, the requirements for operating leases
under Office of Management and Budget (OMB) A-11 criteria will be met.
Environment, Safety, and Health (ES&H):
All proposed alternatives must comply with applicable federal, state, and local policies,
regulations, and orders related to the protection of the environment and the safety and
health of workers and the public.
Safeguards and Security:
LLNL and SNL/CA are committed to implementing Integrated Safeguards and Security
Management (ISSM). All project documentation will be reviewed for classification
before it is issued.
Interfaces with Existing and Planned Acquisitions:
All preliminary planning related to satisfying the mission need have not identified any
existing or planned acquisition consequence.
Affordability Limits on Investment:
The objective is to meet the requirements of the mission need at the optimum life-cycle
cost, while protecting the health, safety, security, and welfare of employees and the
public.
Legal and Regulatory Constraints or Requirements:
The project will be conducted in full compliance with all applicable federal, state, and
local requirements.
Stakeholder Considerations:
Significant stakeholder involvement is anticipated. Primary stakeholders include
DOE/NNSA Headquarters Program Offices, various LLNL and SNL/CA government and
contractor organizations, potential facility developer(s), and land owners near the site.
Other external stakeholders may comment or provide input to the initial project planning.
Limitations Associated with Program Structure, Competition and Contracting,
Streamlining, and Use of Development Prototypes or Demonstrations:

Enterprise Construction Management Services HPCIC and CREATE AoA Report
Parsons 3-6160025r.Docx
An Integrated Project Team (IPT) was formed, consisting of government and contractor
personnel. The IPT functional areas included project management, program management,
operations, budget and finance, contracting, safety, environment, and quality.
Additional Assumptions:
All alternatives that pass the initial screening will at least minimally meet the Mission
and Program Requirements. If not feasible, the alternative will be screened out from
further consideration.
Cost analysis will be completed using parametric estimates and resources, such as
RSMeans and existing DOE/NNSA projects.
Cost estimating will be reported at a Level 2/3 work breakdown structure (WBS).
The LI cost estimates will use a Federal Direct approach for the design and construction.
This approach will include the design and construction efforts being directly contracted
by the NNSA or through an entity such as the US Army Corps of Engineers (USACE).
The facility(ies) are of low risk, with standard office and light laboratory space.
Construction will be outside the LA/PPA, or in areas that are transitioning to become
outside the LA/PPA.
Additional estimating assumptions are documented in the basis of estimate (BOE)
provided in Appendix E.

Enterprise Construction Management Services HPCIC and CREATE AoA Report
Parsons 4-1160025r.Docx
4 ALTERNATIVES IDENTIFIED AND DESCRIBED
4.1 Alternatives Identified
The team developed the initial set of alternatives in meetings during the site visit in May 2015.
The team used these alternative concepts to identify 11 distinct alternatives. These alternatives
were evaluated as potential solutions for the needed capabilities of HPCIC and CREATE for the
LVOC, to include the identification of the potential preferred alternative that would be further
developed during the conceptual design process.
The group of initial alternatives is included in Table 4-1.
Table 4-1: Initial Alternatives
Alt. # Alt. Name Alt. Description
1 Existing Facilities No action, other than normal maintenance (Status Quo).
2 Renovate Facilities Renovate facilities at both laboratories.
3 Two New Line-Item Facilities Two separate facilities (CREATE and HPCIC) in different locations.
4 Lease Off-Site Facility Consider GSA lease or separate commercial lease.
5 Lease Two Commercial On-site Facilities
Two separate facilities (CREATE and HPCIC) in different locations.
6 Single New Line-Item Facility Combine CREATE and HPCIC into a single facility (assume southwest corner of Greenville Road and East Avenues).
7 Lease Single On-site Facility Combine CREATE and HPCIC into a single facility (assume southwest corner of Greenville Road and East Avenue).
8 Build Multiple Smaller Facilities Build approximately 10 separate, distinct 16,000-sf to 20,000-sf "standard" design facilities located in LVOC in north (LLNL) or south (SNL) portions, as needed (currently pursuing this strategy for some facilities)
9 Develop Only HPCIC Build or lease a single facility meeting HPCIC needs only.
10 Develop Only CREATE Build or lease a single facility meeting CREATE (SNL) needs only.
11 Renovate LLNL Facility/Develop New CREATE Facility
SNL has no existing facilities in the LVOC or its proximity; therefore, build a new facility. LLNL has a facility that could be renovated, to include additions.
4.2 Description of Alternatives
4.2.1 Existing Facilities (Status Quo)
Use existing facilities as is and perform no special actions other than normal maintenance.
This alternative would not generate or make available any new facility; therefore, it would
continue operations and maintenance (O&M) of substandard, inefficient offices and trailers that
are beyond their useful life.
4.2.2 Renovate Facilities
Renovate facilities at both laboratories, including additions. The alternative includes repurposing
and/or renovating (which could include minor modifications, general plant project [GPP]

Enterprise Construction Management Services HPCIC and CREATE AoA Report
Parsons 4-2160025r.Docx
improvements, and/or LI-funded modifications) one or more existing on-site facilities as a means
to satisfy the mission specifications and facility requirements. SNL does not have any buildings
suitable for renovation in or adjacent to LVOC that will meet the functional requirements of
CREATE.
For HPCIC, renovating any of three existing LLNL building complexes (B543, B551E/W, and
B571/671) is possible. These buildings are currently functioning as standard office buildings
with LLNL occupants. In each case, significant modifications would be required to meet HPCIC
project performance parameters. All three buildings pose issues with locality, seismic suitability,
and disruption to the traffic and roadways, and they are currently occupied. Two were previously
considered unworkable by the project team due to these issues.
Based on building size, location, and compatibility of building layout for offices, as well as the
need for meeting, training, visualization, education, and other collaboration space, B543
provided the closest fit to the criteria.
4.2.3 Two New Line-Item Facilities
Two separate facilities (CREATE and HPCIC) may be constructed in different locations. The
CREATE facility would be a 3-story building comprising 86,000 gsf; HPCIC would be a 3-story
building comprising 98,000 gsf.
This alternative would meet the mission need by acquiring the capital asset through the DOE LI
process, as outlined in DOE O 413.3B. Under this approach, site selection and facility
specification and design can specifically meet the mission need.
4.2.4 Lease Off-Site Facility
Consider a General Services Administration (GSA) lease or a separate commercial lease.
Lease an off-site facility, either by occupying an existing facility or by pursuing a new
construction lease approach. Commercial options are at least 2 miles from SNL, and existing
office facilities are 3 miles from SNL. Note that a GSA lease would be direct to NNSA and not
through SNL or LLNL.
4.2.5 Lease Two Commercial On-Site Facilities
Two separate facilities (CREATE and HPCIC) in different locations on-site.
This third-party leasing approach offers the potential for a private developer to address the
functional and technical requirements through a commercial opportunity on Sandia’s and
Livermore’s campuses. Because Sandia and Livermore would be the key anchor tenants in the
developments, the mission and functional requirements could be met. The co-location studies
indicate that close proximity is an enabler of the national security mission imperative outlined for
CREATE, HPCIC and LVOC development. DOE would provide a 35-year ground lease to the
owner/developer, and the M&O contractors would lease the facilities for 15 years.

Enterprise Construction Management Services HPCIC and CREATE AoA Report
Parsons 4-3160025r.Docx
4.2.6 Single New Line-Item Facility
Combine CREATE and HPCIC into a single facility (assume southwest corner of Greenville
Road and East Avenue).
The new facility would combine the CREATE and HPCIC functions into a single, co-located
complex of buildings with a central common area consisting of a training center, a cafeteria,
other stand-alone functions, and two wings—one for CREATE and one for HPCIC. The new
facility is assumed to be on the portion of the LVOC managed and operated by SNL/CA, on the
west side of the current Greenville Road fence near the guard gate. The new facility will reduce
space requirements over the two separate buildings (Alt. 3) by approximately 5 percent by
sharing common spaces. The acquisition strategy would be a design-build, LI project. SNL
would manage the new facility and LLNL would rent (lease) space for its activities.
4.2.7 Lease Single On-Site Facility
Combine CREATE and HPCIC into a single facility (assume southwest corner of Greenville
Road and East Avenue).
The new facility would combine the CREATE and HPCIC functions into a single, co-located
complex of buildings with a central common area consisting of a training center, cafeteria, other
stand-alone functions, and two wings—one for CREATE and one for HPCIC. The new facility is
assumed to be on SNL property on the west side of the current Greenville Road fence near the
guard gate. The new facility will reduce space requirements over the two separate buildings
(Alt. 5) by approximately 5 percent by sharing common spaces. The acquisition strategy would
be an on-site lease project. DOE would provide a 35-year ground lease to the owner/developer
and M&O contractors would lease the facility for 15 years.
4.2.8 Build Multiple Smaller Facilities
Build approximately 10 each of 16,000-sf to 20,000-sf “standard” design facilities in the north
and south portions of the LVOC, as needed (currently pursuing this strategy for some facilities).
A similar facility is currently being built on SNL.
Each laboratory would develop approximately five facilities using the campus approach, as
defined in the Flad study, creating a North Village and a South Village. The acquisition strategy
would be operations-funded facilities, constructing one building per year for each laboratory in a
5-year period (assumed to match the LI timeline).
Each facility will have separate, distinct functions (departments, groups, etc.) so that each facility
can be considered as a stand-alone, complete facility. Each laboratory would develop an annual
work plan to perform multiple new construction (single function) projects in strategically located
facilities around the plant over several years.

Enterprise Construction Management Services HPCIC and CREATE AoA Report
Parsons 4-4160025r.Docx
4.2.9 Develop Only HPCIC
Build or lease a single facility meeting the needs of HPCIC only.
This would be the same facility as defined in alternatives 3 or 5, but only the HPCIC (LLNL)
facility.
4.2.10 Develop Only CREATE
Build or lease a single facility meeting the needs of CREATE only.
This would be the same facility as defined in Alternatives 3 or 5, but only the CREATE (SNL)
facility.
4.2.11 Renovate LLNL Facility / Develop New CREATE Facility
This option provides a new CREATE facility in the LVOC (using cost information from Alts. 3
and 10), since SNL has no existing facilities in the proximity of the LVOC that can be renovated.
LLNL has a facility (Building 543) that could be renovated and/or expanded to meet HPCIC
needs. (See discussion in Alt. 2.)
4.3 Alternative Advantages and Disadvantages
As an initial step in the alternatives evaluation, the alternatives team identified advantages (pros)
and disadvantages (cons) for each alternative. Appendix B, Table B-1 provides a more detailed
list and comparison of the advantages and disadvantages among the alternatives. The advantages
and disadvantages of each alternative were developed and are used to assist the team with
informing the risk evaluation and how well each alternative addresses the evaluation criteria.

Enterprise Construction Management Services HPCIC and CREATE AoA Report
Parsons 5-1160025r.Docx
5 INITIAL SCREENING OF ALTERNATIVES
The team performed an initial screening of the alternatives against the 13 mission and program
requirements. The screening resulted in either a “2” score (meaning that the alternative fully met
the requirement), “0” score (meaning that the alternative did not meet the requirement), or a “1”
score (meaning that the alternative partially met the requirement). Table 5-1 shows the results of
the screening. If an alternative has a single “0” score, the summary shows a “No.” The
requirements are described in Section 3. The scoring is only intended to determine the viability
of an alternative and is only used to perform an initial screening of those alternatives not being
able to meet, or partially meet, the requirements. Appendix C describes the screening performed
and the rationale for scoring.
Table 5-1: Initial Screening of Alternatives
Req. # Requirement
Alternative
1 2 3 4 5 6 7 8 9 10 11
PR-1 Provide additional unclassified office/laboratory/collaboration space for LLNL, SNL, and outside collaborators in the LVOC.
0 0 2 0 2 2 2 2 0 0 2
PR-2 Provide a work environment that is modern, dynamic, and flexible.
0 0 2 2 2 2 2 1 2 2 1
PR-3 Obtain operational effectiveness and efficiencies. 0 0 2 0 2 1 1 1 1 1 1
PR-4 Mission: Develop workforce pipeline for attraction, recruitment, development, and retention of world-class staff in a competitive regional market.
0 0 2 1 2 2 2 2 1 1 2
PR-5 Provide approximately 160,000 to 200,000 total gsf(combined requirement for CREATE and HPCIC).
0 0 2 2 2 2 2 2 0 0 2
PR-6 Provide flexible space for light laboratory of about4,400 gsf (CREATE) and 1,000 net sf (HPCIC).
0 0 2 2 2 2 2 2 0 0 2
PR-7 Support increased demands for LA space. 0 0 2 2 2 2 2 2 1 1 1
PR-8 Consolidate educational outreach programs and facilities.
0 0 2 2 2 2 2 2 1 1 1
PR-9 Provide additional space in proximity to synergistic programs.
0 0 2 0 2 1 1 2 1 1 2
PR-10 Provide additional space as soon as possible. 0 0 1 2 2 1 2 1 2 2 1
PR-11 Mission need is for 15 years (currently identified),with expected life of facility of 35 years.
1 0 2 2 2 2 2 2 1 1 2
PR-12 Provide approximately 160,000 to 200,000 total gsf(combined requirement for CREATE and HPCIC).
0 0 2 2 2 2 2 2 2 2 2
PR-13 Provide flexible space for light laboratory of about4,400 gsf (CREATE) and 1,000 net sf (HPCIC).
1 0 2 2 2 2 2 2 2 2 1
Summary Conclusion No No Yes No Yes Yes Yes Yes No No Yes
1 = Marginal 0 = No 2 = Yes

Enterprise Construction Management Services HPCIC and CREATE AoA Report
Parsons 5-2160025r.Docx
Alternatives 1, 2, 4, 9, and 10 were screened out by the team and, therefore, removed from
further consideration. The alternatives removed did not meet one or more of the minimum
requirements listed in Table 5-1. Therefore, the team did not consider that these alternatives
should be evaluated further. Table C-2, Appendix C, provides the specific rationale for each
screening evaluation of the requirements by alternative.

Enterprise Construction Management Services HPCIC and CREATE AoA Report
Parsons 6-1160025r.Docx
6 EVALUATION CRITERIA
The team developed criteria to evaluate the alternatives. Materials previously developed for this
project, including the identified requirements, were used. Additional desired elements were
identified based on discussions with potential users and the team’s experience with NNSA and
other projects. Table 6-1 shows these criteria, or attributes, and the source of the criteria.
Table 6-1: Desired Criteria
D# Desired Attribute Additional Description and NotesSource of Criteria
1 Less than 0.25-mile distance between synergistic activities is the highest importance.
Flad Architecture and Engineering (A&E) 11-4-10 Master Plan (pp.4-26–4-29) identified the village concept for synergistic grouping for walking and bicycling between areas, as well as adjacency to “anchor” facilities; National Ignition Facility (NIF) and Terascale Simulation Facility (TSF) for LLNL; andCombustion Research Facility (CRF) for SNL.
PR-9
2 Operations within 3 to 5 years is of highest importance.
HPCIC timeframe is consistent with Sierra procurement (precursor to Exascale technology, CORAL partnership). CREATE: timing is important to meet upcoming NW Life Extension Program (LEP) and ALT schedules
PR-3,PR-10
3 Moving out of old and/or temporary space is highly desirable.
HPCIC trailer lease renewal uncertain after May 2017; CREATE replaces aged mobile facilities.
PR-1, PR-2, PR-5
4 Reduced deferred maintenance is highly desirable.
Consolidation of staff will enable closure of up to 10 facilities (HPCIC); allows repurposing and elimination of facilities (CREATE).
PR-3, PR-5
5 Co-locating related functions is critical to improving site operations.
CREATE allows consolidation of key externally-focused mission programs with currently distributed support functions and creates efficiency for both researchers and administration; reduced redundancy in badging personnel and processing systems (CREATE); and overall mission improvements with co-locating R&D functions in modern space. HPCIC allows for the co-location of key externally focused mission programs in HPC and applied HPC, and allows multidisciplinary research staff to increase efficiency and form high-functioning IPTs for complex projects. Workforce development programs are streamlined through co-location and resource sharing.
PR-1, PR-5, PR-8, PR-9
6 Class A office space is consistent with standards in the Bay Area for recruitment and retention.
CA NNSA facilities compete with Fortune 100 Silicon Valley and San Francisco/Mission Bay companies (e.g., new Googleplex, Apple, Autodesk facilities).
PR-2, PR-3, PR-4, PR-12
7 Create a gateway for industrial partnerships.
Industry partners bring resources and new talent to problems of interest to NNSA. Industry partners are drawn to laboratories for their intellectual property and highly educated and specialized workforce. Creating a physical space that attracts partners and potential new hires requires modern facilities and adequate space to enable and sustain collaborations and networking events.
PR-1, PR-5, PR-13
8 Lower DOE risks. Use qualitative risk analysis results from the risk analysis. PR-5, PR-7, PR-11
9 Lower LCC (NPV). 35-year evaluation; all DOE costs, including capital, O&M, end of life (EOL)dismantlement and decommissioning (D&D), and lease (if applicable).
PR-3, budget
10 Near-term cash flow—lower is better.
Evaluate the first 5 years of cash flow. PR-3,budget
11 Ease of making facility modifications in the future.
Ability to make changes in the future. PR-2, PR-6, PR-13

Enterprise Construction Management Services HPCIC and CREATE AoA Report
Parsons 6-2160025r.Docx
D# Desired Attribute Additional Description and NotesSource of Criteria
12 Ease of meeting Freeze the Footprint initiative.
Consolidation of staff will enable closure of up to 10 facilities (HPCIC); allows repurposing and elimination of facilities (CREATE).
PR-3, PR-8 / OMB Directive
13 Ease of transition and relocation.
Transition and relocation may require double moves; very desirable to eliminate double moves.
PR-3, PR-4, PR-5, PR-10
14 Increased energy efficiency and sustainability.
Very important in meeting Department goals. PR-3, PR-5, PR-12
15 Ease of providing space for visitors or part-time staff(flexible space).
Flexible space allows reconfiguration to meet needs, usually accomplished with open floor plan offices.
PR-1, PR-2, PR-4, PR-5, PR-6
16 Ease of standing up different laboratory functional areas in flex space.
Laboratories (light or educational) are used for various purposes; flexible space allows for reconfiguration, as needed.
PR-6
17 Expedient funding availability. Funding options include LI, GPP, IGPP, and alternative finance. PR-10, PR-11
18 Assuring and overseeing safety.
Assuring and overseeing construction and operations safety. PR-2, PR-3
19 Assuring and overseeing security.
Assuring and overseeing security during construction and operations. PR-7, PR-13
20 Ease of constructing within the existing NEPA envelope.
Staying within the current environmental framework for the open campus (LLNL and SNL/CA).
PR-3
For the detailed alternatives evaluation, the team assigned weighting factors to each desired
feature. The team used a scale to evaluate the relative compliance of the alternative for each
feature. Table 6-2 shows the weighting factors used for the evaluation. The weighting factors are
not sequential: the most important criterion is weighted 5; the next most important criterion is
weighted 3. This adds emphasis to the highest criterion importance.
Table 6-2: Importance Weighting
Criteria Importance
Weighting Factor
Importance Rationale
1 5 Highest importance; borders on a requirement.
2 3 Very important; highly desirable.
3 2 Medium; desirable.
4 1 Lowest importance.
Appendix D provides further discussion of the evaluation criteria and the rationale for the rating
of importance. The importance of each attribute is a reflection of the AoA team’s interpretation
of the requirements on the attributes/evaluation criteria. As can be seen in Table 6-3, the team
has determined that the most important criteria to meet include the need to minimize distance
between synergistic activities, achieve operations within 3 to 5 years, obtain Class A office
space, establish collaborative space for industrial partners, minimize risk, and maintain DOE
safety, security, and environmental objectives.

Enterprise Construction Management Services HPCIC and CREATE AoA Report
Parsons 6-3160025r.Docx
During the alternative evaluation a series of sensitivity analyses were performed on the ratings of
importance. Those results are shown in Section 8.
Table 6-3: Desired Attribute Relative Importance and Weight
D# Desired Attributes ImportanceAttributeWeight
1 Less than 0.25-mile distance between synergistic activities is the highest importance. 1 5
2 Operations completion within 3 to 5 years is of highest importance. 1 5
3 Moving out of old and/or temporary space is highly desirable. 2 3
4 Reduced deferred maintenance is highly desirable. 2 3
5 Co-locating related functions is critical to improving site operations. 1 5
6 Class A office space is consistent with standards in the Bay Area for recruitment and retention.
1 5
7 Create a gateway for industrial partnerships. 1 5
8 Minimize DOE risks. 1 5
9 Lower LCC (NPV). 2 3
10 Near-term cash flow; lower is better. 2 3
11 Ease of making facility modifications in future. 4 1
12 Ease of meeting Freeze the Footprint initiative. 2 3
13 Ease of transition and relocation. 2 3
14 Increased energy efficiency and sustainability. 2 3
15 Ease of providing space for visitors or part-time staff (flexible space). 1 5
16 Ease of standing up different laboratory functional areas in flex space. 4 1
17 Expedient funding availability. 1 5
18 Assuring and overseeing safety. 1 5
19 Assuring and overseeing security. 3 2
20 Ease of constructing within the existing NEPA envelope. 1 5

Enterprise Construction Management Services HPCIC and CREATE AoA Report
Parsons 6-4160025r.Docx
This page intentionally left blank.

Enterprise Construction Management Services HPCIC and CREATE AoA Report
Parsons 7-1160025r.Docx
7 COST AND SCHEDULE ESTIMATES
LCCEs were developed for each viable alternative identified for the project. These estimates are
only intended to be used to support the AoA. A subset of the LCCE for the preferred alternative
can also be used to confirm or revise the total project cost (TPC) range and expected funding
profile for the project at the time of CD-1 approval if no further estimates are developed as part
of a conceptual design process.
The bases and assumptions used for the LCCEs and the calculations of NPV for each alternative
are fully described in Appendix E. Appendix E also discusses how these estimates were
developed in accordance with the best practices for developing and managing the capital
program costs found in the Government Accountability Office (GAO) Cost Estimating and
Assessment Guide [Ref. 9].
7.1 Net Present Value (NPV)
Table 7-1 presents the results of the NPV analyses for each alternative considered. All costs are
time-phased using a summary-level schedule developed for the proposed overall facility life of
35 years. The time-phased costs are appropriately escalated and a NPV is calculated in
accordance with OMB Circular A-94 using the January 2015 nominal discount rate presented
therein for a 30-year life (maximum provided). The discount factor used was 3.4 percent.
Table 7-1: NPV Results ($M)
Alternative NPV Ranking by NPV
3 – Build New Facilities (Line Item) 165.2 4
5 – Build New Facilities (Lease Financing) 131.0 1
6 – Single New Facility (Line Item) 164.4 3
7 – Single New Facility (Lease) 135.9 2
8 – Multiple Small Constructed Facilities 225.2 6
11 – Renovate LLNL Facility/Develop New CREATE Facility 181.1 5
7.2 Acquisition Approach
Table 7-2 compares the TPCs for the various acquisition strategies.
Table 7-2: TPC Comparisons Based on Acquisition Strategy ($M)
Facility
Alternative Financing
(Lease)Line Item
(Federal Direct)M&O
Procurement
HPCIC 31.2 39.0 47.5
CREATE 30.2 37.8 46.0
Single Building 65.9 82.3 100.2
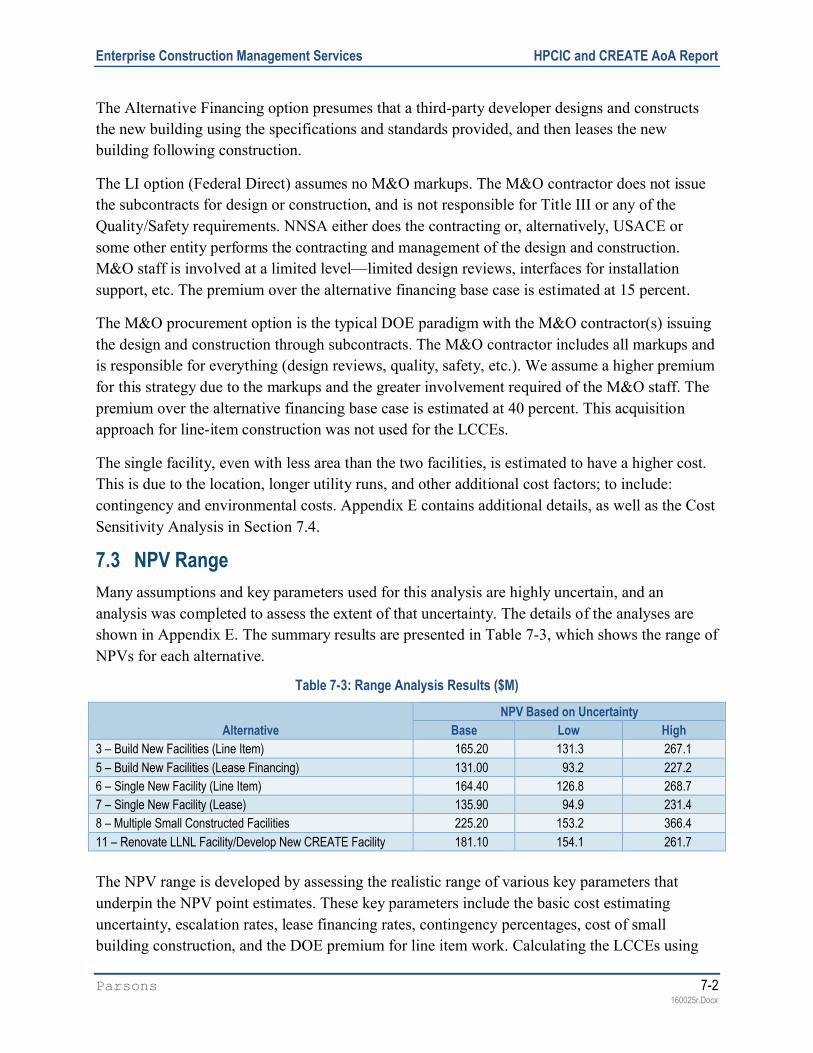
Enterprise Construction Management Services HPCIC and CREATE AoA Report
Parsons 7-2160025r.Docx
The Alternative Financing option presumes that a third-party developer designs and constructs
the new building using the specifications and standards provided, and then leases the new
building following construction.
The LI option (Federal Direct) assumes no M&O markups. The M&O contractor does not issue
the subcontracts for design or construction, and is not responsible for Title III or any of the
Quality/Safety requirements. NNSA either does the contracting or, alternatively, USACE or
some other entity performs the contracting and management of the design and construction.
M&O staff is involved at a limited level—limited design reviews, interfaces for installation
support, etc. The premium over the alternative financing base case is estimated at 15 percent.
The M&O procurement option is the typical DOE paradigm with the M&O contractor(s) issuing
the design and construction through subcontracts. The M&O contractor includes all markups and
is responsible for everything (design reviews, quality, safety, etc.). We assume a higher premium
for this strategy due to the markups and the greater involvement required of the M&O staff. The
premium over the alternative financing base case is estimated at 40 percent. This acquisition
approach for line-item construction was not used for the LCCEs.
The single facility, even with less area than the two facilities, is estimated to have a higher cost.
This is due to the location, longer utility runs, and other additional cost factors; to include:
contingency and environmental costs. Appendix E contains additional details, as well as the Cost
Sensitivity Analysis in Section 7.4.
7.3 NPV Range
Many assumptions and key parameters used for this analysis are highly uncertain, and an
analysis was completed to assess the extent of that uncertainty. The details of the analyses are
shown in Appendix E. The summary results are presented in Table 7-3, which shows the range of
NPVs for each alternative.
Table 7-3: Range Analysis Results ($M)
Alternative
NPV Based on Uncertainty
Base Low High
3 – Build New Facilities (Line Item) 165.20 131.3 267.1
5 – Build New Facilities (Lease Financing) 131.00 93.2 227.2
6 – Single New Facility (Line Item) 164.40 126.8 268.7
7 – Single New Facility (Lease) 135.90 94.9 231.4
8 – Multiple Small Constructed Facilities 225.20 153.2 366.4
11 – Renovate LLNL Facility/Develop New CREATE Facility 181.10 154.1 261.7
The NPV range is developed by assessing the realistic range of various key parameters that
underpin the NPV point estimates. These key parameters include the basic cost estimating
uncertainty, escalation rates, lease financing rates, contingency percentages, cost of small
building construction, and the DOE premium for line item work. Calculating the LCCEs using

Enterprise Construction Management Services HPCIC and CREATE AoA Report
Parsons 7-3160025r.Docx
both minimum and maximum values for these parameters generated the data necessary to
calculate the low and high NPVs for each alternative and establish the range. See Appendix E -
Table E-6, Section E9.
Figure 7-1 graphically presents the ranges of NPV for each of the viable alternatives. For each
alternative, the triangle represents the “Base” NPV from Table 7-3.
Figure 7-1: NPV Ranges
7.4 Cost Sensitivity Analysis
A cost sensitivity analysis was conducted by varying 10 key parameters as described in
Appendix E. The sensitivity analysis concludes that the results are generally insensitive such that
very few variations in key parameters alter the ranking of the alternatives relative to the NPV of
LCCs. Changes to just a few parameters have a minor impact on that ranking. These are
summarized as follows:
Decreasing the assumed O&M escalation from 2 percent to 1 percent reverses the rankings of
Alternatives 3 and 6.
50
100
150
200
250
300
350
400
3 – Build New Facilities (Line
Item).
5 – Build New Facilities (Lease
Financing)
6 – Single New Facility (Line
Item)
7 - Single NewFacility (Lease)
8 – Multiple small
constructed facilities
11- RenovateLLNL
Facility/DevelopNew CREATE
Facility
NP
V (
$M)
Alternatives

Enterprise Construction Management Services HPCIC and CREATE AoA Report
Parsons 7-4160025r.Docx
Using the same contingency percentage for the single-building concept as for the separate
buildings makes Alternative 7 slightly more favorable than Alternative 5. For the base case,
contingency rates for the single building alternatives were 5 percent higher than the other
alternatives based on the increased level of risk identified with a single building alternative.
The only exception is the O&M rate. For the base case, actual O&M rates at LLNL and SNL/CA
are approximately three times higher than O&M rates assumed for alternative financing (based
on industry-standard regional rates published by the Building Owners and Managers
Association). Sensitivity analysis shows that the line item scenarios (Alt. 3 and 6) become
slightly more favorable from a life cycle cost perspective when the commercial rate gets within
20% of the current actual rates.
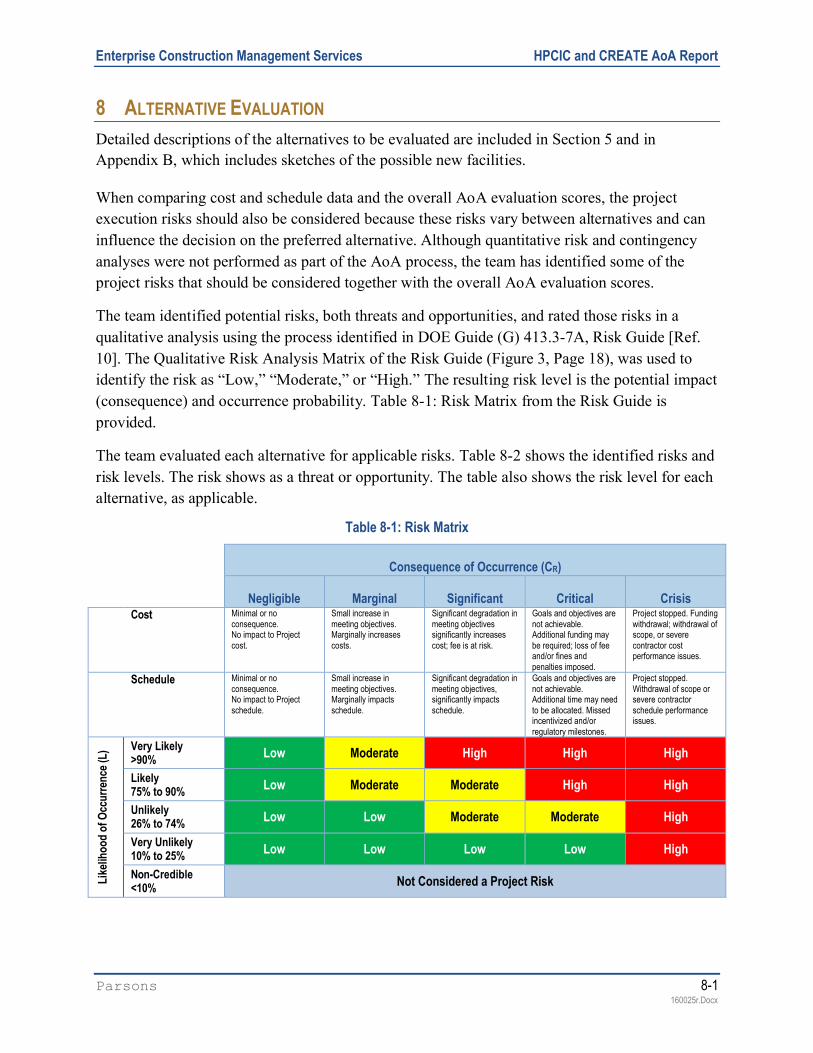
Enterprise Construction Management Services HPCIC and CREATE AoA Report
Parsons 8-1160025r.Docx
8 ALTERNATIVE EVALUATION
Detailed descriptions of the alternatives to be evaluated are included in Section 5 and in
Appendix B, which includes sketches of the possible new facilities.
When comparing cost and schedule data and the overall AoA evaluation scores, the project
execution risks should also be considered because these risks vary between alternatives and can
influence the decision on the preferred alternative. Although quantitative risk and contingency
analyses were not performed as part of the AoA process, the team has identified some of the
project risks that should be considered together with the overall AoA evaluation scores.
The team identified potential risks, both threats and opportunities, and rated those risks in a
qualitative analysis using the process identified in DOE Guide (G) 413.3-7A, Risk Guide [Ref.
10]. The Qualitative Risk Analysis Matrix of the Risk Guide (Figure 3, Page 18), was used to
identify the risk as “Low,” “Moderate,” or “High.” The resulting risk level is the potential impact
(consequence) and occurrence probability. Table 8-1: Risk Matrix from the Risk Guide is
provided.
The team evaluated each alternative for applicable risks. Table 8-2 shows the identified risks and
risk levels. The risk shows as a threat or opportunity. The table also shows the risk level for each
alternative, as applicable.
Table 8-1: Risk Matrix
Consequence of Occurrence (CR)
Negligible Marginal Significant Critical CrisisCost Minimal or no
consequence. No impact to Project cost.
Small increase in meeting objectives. Marginally increases costs.
Significant degradation in meeting objectives significantly increases cost; fee is at risk.
Goals and objectives are not achievable. Additional funding may be required; loss of fee and/or fines and penalties imposed.
Project stopped. Funding withdrawal; withdrawal of scope, or severe contractor cost performance issues.
Schedule Minimal or no consequence. No impact to Project schedule.
Small increase in meeting objectives. Marginally impacts schedule.
Significant degradation in meeting objectives, significantly impacts schedule.
Goals and objectives are not achievable. Additional time may need to be allocated. Missed incentivized and/or regulatory milestones.
Project stopped. Withdrawal of scope or severe contractor schedule performance issues.
Like
lihoo
d of
Occ
urre
nce
(L) Very Likely
>90%Low Moderate High High High
Likely75% to 90%
Low Moderate Moderate High High
Unlikely26% to 74%
Low Low Moderate Moderate High
Very Unlikely10% to 25%
Low Low Low Low High
Non-Credible<10%
Not Considered a Project Risk

Enterprise Construction Management Services HPCIC and CREATE AoA Report
Parsons 8-2160025r.Docx
Table 8-2: Risk List and Levels for Alternatives
Alternatives – INPUT VALUES
2LI 2LS 1LI 1LS Mult Reno/New
No. Risk Description (Threat Unless Noted) 3 5 6 7 8 11
Threats
1Design does not provide for all desired functions, requiring additional investment
l m l m m m
2Limited vendor/contractor availability and/or interest because of external market conditions
m l m l m m
3Significant safety, security, or environmental issues emerge during development of a facility on federal land, impacting project success
m l m l m m
4Costs much higher than expected or accounted for in uncertainty to due inflation, labor issues, or competition for CA labor/materials
m l m l m m
5Inability to get contracts approved, (e.g., construction, ground lease signed or facility lease agreement signed)
l m l m l l
6Unidentified subsurface conditions (e.g., utility, environmental hazard, or cultural/historic resource) delays project and increases costs
l l m m m l
7Inadequate government staffing to deliver project causes delays and increases costs
m l m l l m
8Turnover of government personnel causes approval delay or reauthorization
l m l m l l
9Lack of clarity of roles, responsibilities, and authorities for DOE/NNSA, delaying the project
l m l m l l
10Claims and changes during construction process increase costs
m l m l m m
11Availability of construction materials delays project and increases costs
m l m l m m
12Project invokes additional NEPA/CEQA lab-prepared environmental documentation, causing project delays and increasing costs
l l m m l l
13
Increased probability that NEPA/CEQA regulators move to consider LLNL/SNL joint site regardless of project outcome and/or potentially impacting laboratories’future operations
l l h h l l
14Delays in the required governmental actions or approvals delay the project
m h m H l m
15Funding is unavailable, reduced, and/or delayed, impacting the project
h l h l m h
Opportunity
16Provides capital investment while minimizing demand for limited DOE funds (LI)
(l) (h) (l) (h) (m) (l)
17Cost and schedule improvements due to transfer of government risk to nongovernment entity
(m) (h) (m) (h) (m) (m)
18Construction costs realized much lower than expected or planned
(m) (l) (m) (l) (m) (m)
19 Building size is optimized, reducing construction costs (m) (l) (h) (m) (l) (l)
20Ability to accommodate changes in future mission needs reduces operational costs
(l) (h) (l) (h) (m) (l)
Overall Risk Summary (All Risks) m m m m m mSum/# 1.80 1.50 1.95 1.65 1.70 1.90Rank: 4 1 6 2 3 5
Threats Only Summary m l m m m mSum/# 1.6 1.4 1.87 1.67 1.53 1.67Rank: 3 1 6 4 2 4
Opportunities Only Summary (m) (m) (m) (m) (m) (l)
Sum/# 2.40 1.80 2.20 1.60 2.20 2.60Rank: 5 2 3 1 3 6
Note: Score calculated: H or (L) = 3; M or (M) = 2; L or (H) = 1.
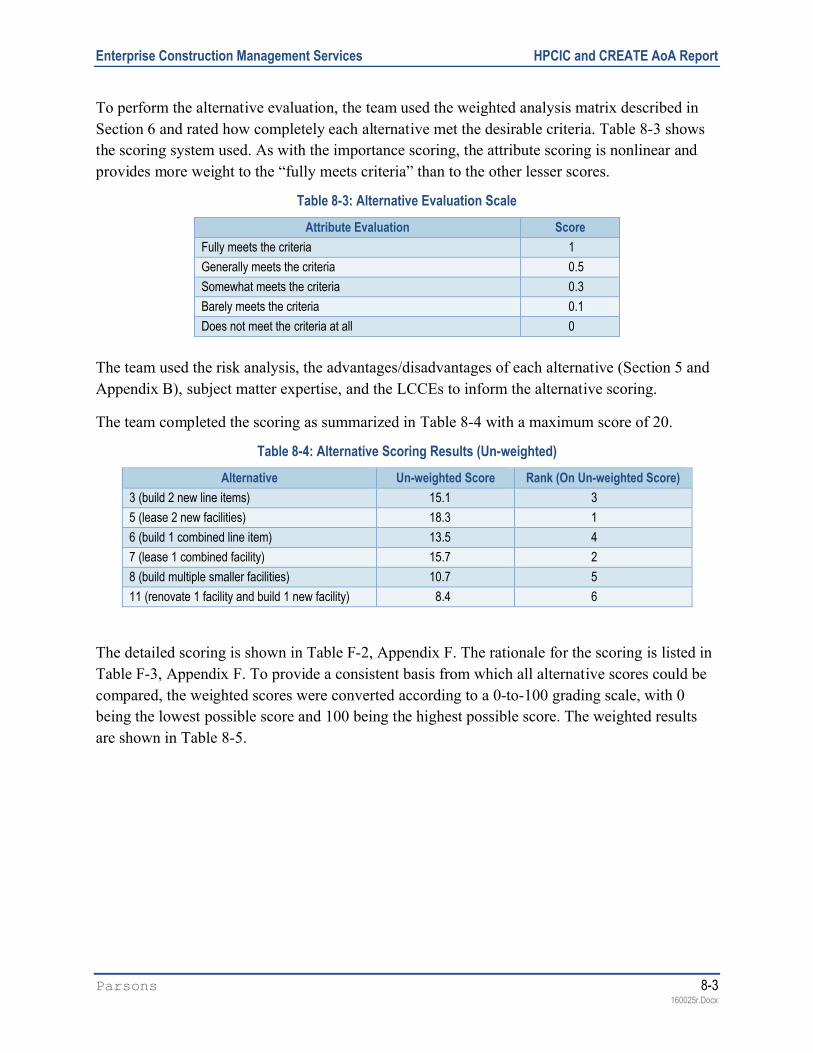
Enterprise Construction Management Services HPCIC and CREATE AoA Report
Parsons 8-3160025r.Docx
To perform the alternative evaluation, the team used the weighted analysis matrix described in
Section 6 and rated how completely each alternative met the desirable criteria. Table 8-3 shows
the scoring system used. As with the importance scoring, the attribute scoring is nonlinear and
provides more weight to the “fully meets criteria” than to the other lesser scores.
Table 8-3: Alternative Evaluation Scale
Attribute Evaluation Score
Fully meets the criteria 1
Generally meets the criteria 0.5
Somewhat meets the criteria 0.3
Barely meets the criteria 0.1
Does not meet the criteria at all 0
The team used the risk analysis, the advantages/disadvantages of each alternative (Section 5 and
Appendix B), subject matter expertise, and the LCCEs to inform the alternative scoring.
The team completed the scoring as summarized in Table 8-4 with a maximum score of 20.
Table 8-4: Alternative Scoring Results (Un-weighted)
Alternative Un-weighted Score Rank (On Un-weighted Score)
3 (build 2 new line items) 15.1 3
5 (lease 2 new facilities) 18.3 1
6 (build 1 combined line item) 13.5 4
7 (lease 1 combined facility) 15.7 2
8 (build multiple smaller facilities) 10.7 5
11 (renovate 1 facility and build 1 new facility) 8.4 6
The detailed scoring is shown in Table F-2, Appendix F. The rationale for the scoring is listed in
Table F-3, Appendix F. To provide a consistent basis from which all alternative scores could be
compared, the weighted scores were converted according to a 0-to-100 grading scale, with 0
being the lowest possible score and 100 being the highest possible score. The weighted results
are shown in Table 8-5.

Enterprise Construction Management Services HPCIC and CREATE AoA Report
Parsons 8-4160025r.Docx
Table 8-5: Alternatives Results – Weighted Score
D# Desired Attributes Importance
Normalized Weighting
(NW)3
2LI5
2LS6
1LI7
1LS8
Mult
11Reno/New
1Less than 0.25-mile distance between synergistic activities is the highest importance.
1 6.7 6.7 6.7 0.7 0.7 6.7 6.7
2Operations within 3 to 5 years is of highest importance.
1 6.7 6.7 6.7 6.7 6.7 3.3 2.0
3Moving out of old and/or temporary space is highly desirable.
2 4.0 4.0 4.0 4.0 4.0 4.0 2.0
4Reduced deferred maintenance is highly desirable.
2 4.0 4.0 4.0 4.0 4.0 2.0 2.0
5Co-locating related functions is critical to improving site operations.
1 6.7 6.7 6.7 6.7 6.7 2.0 2.0
6Class A office space is consistent with standards in the Bay Area for recruitment and retention.
1 6.7 6.7 6.7 6.7 6.7 3.3 2.0
7Create a gateway for industrial partnerships.
1 6.7 3.3 6.7 2.0 3.3 3.3 3.3
8 Lower DOE risks. 1 6.7 2.0 6.7 2.0 3.3 3.3 2.0
9 Lower LCC (NPV). 2 4.0 2.0 4.0 2.0 4.0 0.4 1.2
10 Near-term cash flow—lower is better. 2 4.0 1.2 4.0 1.2 4.0 0.4 0.4
11Ease of making facility modifications in the future.
4 1.3 0.7 0.4 0.7 0.4 0.7 0.7
12Ease of meeting Freeze the Footprint initiative.
2 4.0 0.4 4.0 0.4 4.0 1.2 1.2
13 Ease of transition and relocation. 2 4.0 4.0 4.0 4.0 4.0 2.0 1.2
14Increased energy efficiency and sustainability.
2 4.0 4.0 4.0 4.0 4.0 2.0 1.2
15Ease of providing space for visitors or part-time staff (flexible space).
1 6.7 6.7 6.7 6.7 6.7 2.0 3.3
16Ease of standing up different laboratory functional areas in flex space.
4 1.3 1.3 1.3 1.3 1.3 0.4 0.7
17 Expedient funding availability. 1 6.7 0.7 6.7 0.7 6.7 3.3 0.7
18 Assuring and overseeing safety 1 6.7 6.7 3.3 6.7 3.3 6.7 3.3
19 Assuring and overseeing security 3 2.7 2.7 1.3 2.7 1.3 2.7 1.3
20Ease of constructing within the existing NEPA envelope.
1 6.7 6.7 6.7 2.0 2.0 6.7 6.7
Score 100.0 76.9 94.4 64.9 77.1 56.4 43.9

Enterprise Construction Management Services HPCIC and CREATE AoA Report
Parsons 8-5160025r.Docx
As a check on these results and to determine the impacts of both the weighting and some input
scores, the evaluation team performed a series of sensitivity analyses. Table 8-6 lists the
Sensitivity Cases that modified the evaluation weighting factors (Cases S-1 through S-4). The
table also lists additional sensitivity analyses performed on the impact of various evaluation
criteria and risk analysis in the scoring (Cases S-5 through S-9).
Sensitivities 1 through 4 were completed to ensure there was no biasing of the results in favor
of one category (Cost, Mission, Infrastructure, or Schedule) over others in the evaluation of
the alternatives against the criteria.
Sensitivity 5 (Remove Attribute #8 from the evaluation criteria) was completed to validate
that there was no inadvertent effect of bias of over counting in the risk analysis.
Sensitivities 6 and 7 were added to ensure that there was no inadvertent biasing of alternative
financing alternatives due to low near-term cash flow and NPV.
Sensitivity 8 removes the attributes for risk, near-term cash flow and NPV from the
evaluation criteria – a combination of sensitivities 5, 6 and 7.
Sensitivity 9 was done to revise the risk matrix to remove possible risks that could be
considered a duplicate to the desired attributes.
Table 8-6: Sensitivity Cases
Sensitivity Case Change
S-1: Cost Highest Importance (Desired Attributes D#9 and D#10) Cost Importance =1; Others = –2
S-2: Mission Highest Importance (Desired Attributes D#1, D#2, D#5, D#7, and D#15)
Mission Importance = 1; Others = –2
S-3: Infrastructure Sustainment Highest Importance (Desired Attributes D#4, D#5, D#6, D#12, D#14, and D#16)
Infrastructure Sustainment Importance=1; Others = –2
S-4: Schedule Highest Importance (Desired Attributes D#2, D#10, and D#17). Schedule Importance = 1; Others = –2
S-5: Delete Desired Attribute for Risk Delete Attribute #8
S-6: Delete Desired Attribute for Near-Term Cash Flow Delete Attribute #9
S-7: Delete Desired Attribute for NPV Delete Attribute #10
S-8: Combined Changes S-5, S-6, and S-7 Delete Attributes #8, #9, #10
S-9: Revise Risk Matrix to Remove Risks Possibly Duplicative of Desired Attributes Delete Risks #12,#13, #15, #16, and #17
Key: Others –2 = Reduce baseline Importance values by 2, or to the minimum value (4)
For sensitivity runs 1 through 4, the revisions to the importance rankings are shown in Table 8-7.

Enterprise Construction Management Services HPCIC and CREATE AoA Report
Parsons 8-6160025r.Docx
Table 8-7: Sensitivity Analysis for Evaluation Criteria
D# Criteria BaselineS-1
CostS-2
Mission
S-3Infrastructure Sustainment
S-4Schedule
1 Less than 0.25-mile distance between synergistic activities is the highest importance.
1 3 1 3 3
2 Operations completion within 3 to 5 years is of highest importance.
1 3 1 3 1
3 Moving out of old and/or temporary space is highly desirable.
2 4 4 1 4
4 Reduced deferred maintenance is highly desirable. 2 4 4 1 4
5 Co-locating related functions is critical to improving site operations.
1 3 1 3 3
6 Class A office space is consistent with standards in the Bay Area for recruitment and retention.
1 3 3 1 3
7 Create a gateway for industrial partnerships. 1 3 1 3 3
8 Lower DOE project success risks. 1 3 3 3 3
9 Lower LCC (NPV). 2 1 4 4 4
10 Near-term cash flow; lower is better. 2 1 4 4 1
11 Ease of making facility modifications in future. 4 4 4 1 4
12 Ease of meeting Freeze the Footprint initiative. 2 4 4 1 4
13 Ease of transition and relocation. 2 4 4 4 4
14 Increased energy efficiency and sustainability. 2 4 4 1 4
15 Ease of providing space for visitors or part-time staff (flexible space).
1 3 1 3 3
16 Ease of standing up different laboratory functional areas in flex space.
4 4 4 1 4
17 Expedient funding availability. 1 3 3 3 1
18 Assuring and overseeing safety 1 3 3 3 3
19 Assuring and overseeing security 3 4 4 4 4
20 Ease of constructing within the existing NEPA envelope.
1 3 3 3 3

Enterprise Construction Management Services HPCIC and CREATE AoA Report
Parsons 8-7160025r.Docx
Table 8-8 provides the normalized weighted results for the top four alternatives. Alternative 5
scored the highest of all the cases. For sensitivity cases 2, 7, 8, and 9, Alternative 3 becomes the
second highest rated, instead of Alternative 7. Appendix F provides the complete sensitivity
results.
Table 8-8: Sensitivity Analysis Results
Sensitivity Analysis
Alternatives & Normalized Weighted Results
3 5 6 7
Baseline Analysis 75.6 94.4 64.9 77.1
S-1: Cost Highest Importance (Desired Attributes D# 9 and D#10) 68.4 94.2 60.0 80.5
S-2: Mission Highest Importance (Desired Attributes D#1, D#2, D#5, D#7,and D#15)
79.3 95.1 66.2 74.2
S-3: Infrastructure Sustainment Highest Importance (Desired Attributes D#4, D#5, D#6, D#12, D#14, and D#16)
77.5 91.2 71.9 82.1
S-4: Schedule Highest Importance (Desired Attributes D#2, D#10, and D#17) 68.3 94.5 60.3 81.5
S-5: Delete Desired Attribute for Risk 78.9 94.0 67.4 79.0
S-6: Delete Desired Attribute for Near-term Cash Flow 76.7 94.2 65.6 76.1
S-7: Delete Desired Attribute for NPV 77.5 94.2 66.4 76.1
S-8: Combined Changes S-5, S-6, and S-7 82.5 93.4 70.0 77.0
S-9: Revise Risk Matrix to Remove Risks Possibly Duplicative of Desired Attributes
76.9 94.4 66.3 80.4

Enterprise Construction Management Services HPCIC and CREATE AoA Report
Parsons 8-8160025r.Docx
This page intentionally left blank.

Enterprise Construction Management Services HPCIC and CREATE AoA Report
Parsons 9-1160025r.Docx
9 CONCLUSIONS
The results of the scoring of the alternatives are listed in Table 9-1.
Table 9-1: Alternative Rankings
Rank Alternative Score
1 5 (lease 2 new facilities) 94.4
2 7 (lease 1 combined facility) 77.1
3 3 (build 2 new line items) 75.6
4 6 (build 1 combined line item) 64.9
5 8 (build multiple smaller facilities) 55.1
6 11 (renovate 1 and build 1 new facility) 42.5
Alternative 5 (2LS: HPCIC and CREATE) was identified as the highest ranking alternative.
Alternative 7 (1LS) and Alternative 3 (2LI: HPCIC and CREATE) were scored very similarly
and ranked second and third, respectively. In the nine sensitivity analyses completed (see Table
8-8), these were the only two alternatives that changed positions. In sensitivity cases 3, 7, 8, and
9 (described in Section 8 and Appendix F), the rankings for these two were reversed; Alternative
3 was ranked second and Alternative 7 was ranked third.

Enterprise Construction Management Services HPCIC and CREATE AoA Report
Parsons 9-2160025r.Docx
This page intentionally left blank.

Enterprise Construction Management Services HPCIC and CREATE AoA Report
Parsons 10-1160025r.Docx
10 TEAM MEMBERS
The Alternatives Analysis team consisted of the following personnel:
NNSA Participants Area of Expertise/Role
Sam Brinker NNSA – Livermore Field Office – Contracting Officer’s Representative
Lois Marik NNSA – Sandia Field Office
Tony Trujillo NNSA – NA-APM 23 – Project Integrator
Ward Sigmund NA-113 (Contractor) – Programs
Paul Ross NA-113 – Programs
Bill McNavage NA-1.3 CEPE (Advised Team and Reviewed Process)
ECMS Participants
Mark Lane ECMS Team Lead
Matt Champagney ECMS Team Task Manager
Scott Dam ECMS Team Risks / Alternatives Analysis
Doug Gray ECMS Team Life-cycle costs
Terri Callins ECMS Team Space Planner
Lawrence Livermore National Laboratory
Buck Koonce LLNL – Senior Management
Camille Bibeau LLNL – LVOC Lead
Jeff Brunetti LLNL – LVOC Project Management (Risks, Security, and ES&H)
Al Moser LLNL – Business Directorate (Cost Analysis)
Jeff Brenner LLNL – LVOC Planning Manager
Hank Glauser LLNL – Facilities
Dean Yoshida LLNL – Project Management Engineering & Construction
John Post LLNL – Management
Sandia National Laboratories/California
Denise Koker SNL – Director California Site Operations
Andrew McIlroy SNL – Deputy Chief Technology Officer
John Garcia SNL – Physical Operations
Doug Vrieling SNL – Project Management Engineering & Construction
Devon Powers SNL – LVOC Project Management
Dave Hopman SNL – Cost Analysis
Howard Royer SNL – Planning & Studies
The AoA execution process was reviewed and advised on by the following:
NNSA Cost Estimating and Program Evaluation (CEPE) – William McNavage (NA-1.3)
Enterprise Construction Management Services HPCIC and CREATE AoA Report
Parsons 10-2160025r.Docx
This page intentionally left blank.
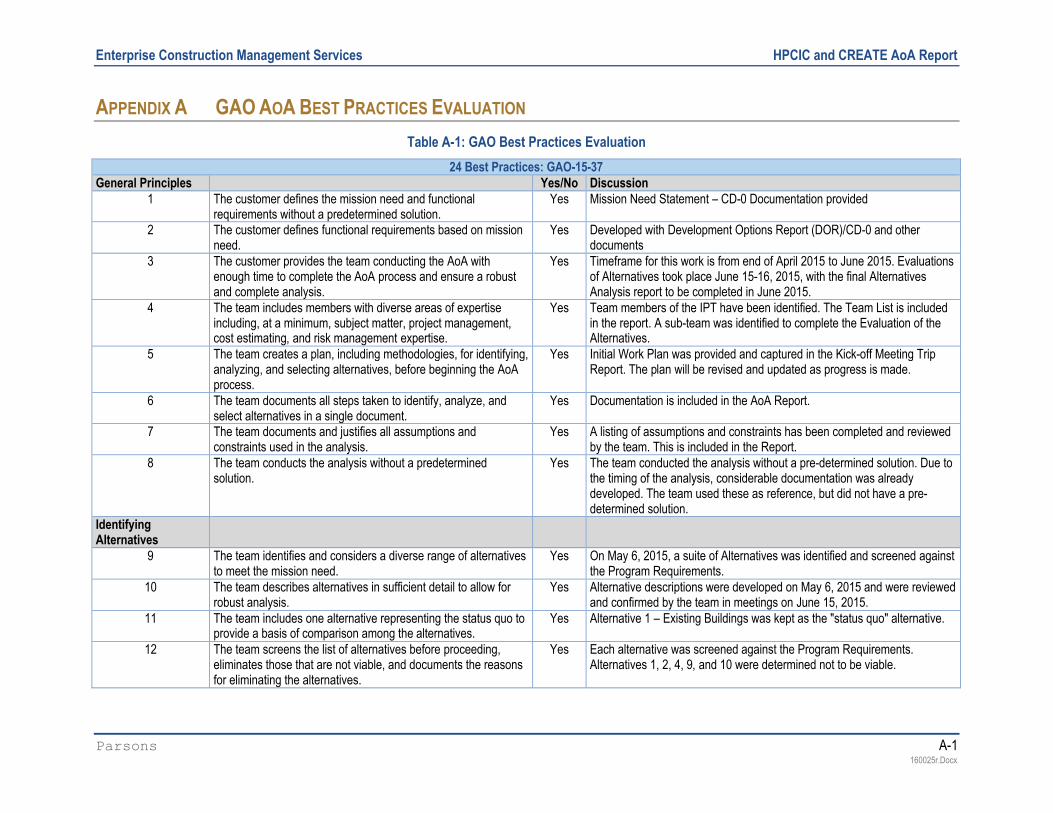
Enterprise Construction Management Services HPCIC and CREATE AoA Report
Parsons A-1160025r.Docx
APPENDIX A GAO AOA BEST PRACTICES EVALUATION
Table A-1: GAO Best Practices Evaluation
24 Best Practices: GAO-15-37General Principles Yes/No Discussion
1 The customer defines the mission need and functional requirements without a predetermined solution.
Yes Mission Need Statement – CD-0 Documentation provided
2 The customer defines functional requirements based on mission need.
Yes Developed with Development Options Report (DOR)/CD-0 and other documents
3 The customer provides the team conducting the AoA with enough time to complete the AoA process and ensure a robust and complete analysis.
Yes Timeframe for this work is from end of April 2015 to June 2015. Evaluations of Alternatives took place June 15-16, 2015, with the final Alternatives Analysis report to be completed in June 2015.
4 The team includes members with diverse areas of expertise including, at a minimum, subject matter, project management, cost estimating, and risk management expertise.
Yes Team members of the IPT have been identified. The Team List is included in the report. A sub-team was identified to complete the Evaluation of the Alternatives.
5 The team creates a plan, including methodologies, for identifying, analyzing, and selecting alternatives, before beginning the AoAprocess.
Yes Initial Work Plan was provided and captured in the Kick-off Meeting Trip Report. The plan will be revised and updated as progress is made.
6 The team documents all steps taken to identify, analyze, and select alternatives in a single document.
Yes Documentation is included in the AoA Report.
7 The team documents and justifies all assumptions and constraints used in the analysis.
Yes A listing of assumptions and constraints has been completed and reviewed by the team. This is included in the Report.
8 The team conducts the analysis without a predetermined solution.
Yes The team conducted the analysis without a pre-determined solution. Due to the timing of the analysis, considerable documentation was already developed. The team used these as reference, but did not have a pre-determined solution.
Identifying Alternatives
9 The team identifies and considers a diverse range of alternatives to meet the mission need.
Yes On May 6, 2015, a suite of Alternatives was identified and screened against the Program Requirements.
10 The team describes alternatives in sufficient detail to allow for robust analysis.
Yes Alternative descriptions were developed on May 6, 2015 and were reviewed and confirmed by the team in meetings on June 15, 2015.
11 The team includes one alternative representing the status quo to provide a basis of comparison among the alternatives.
Yes Alternative 1 – Existing Buildings was kept as the "status quo" alternative.
12 The team screens the list of alternatives before proceeding, eliminates those that are not viable, and documents the reasons for eliminating the alternatives.
Yes Each alternative was screened against the Program Requirements. Alternatives 1, 2, 4, 9, and 10 were determined not to be viable.

Enterprise Construction Management Services HPCIC and CREATE AoA Report
Parsons A-2160025r.Docx
24 Best Practices: GAO-15-37Analyzing the Alternatives
13 The team develops a LCCE for each alternative, including all costs from inception of the project through design, development, deployment, operation, maintenance, and retirement.
Yes LCCEs for each viable alternative were developed using the estimate plan that was originally drafted in May 2015 and was updated throughout the process.
14 The team presents the LCCE for each alternative as a range, or with a confidence interval, and not solely as a point estimate.
Yes NPV of LCC was presented and provided as a range. This is described in the report.
15 The team expresses the LCCE in present value terms and explains why it chose the specific discount rate used.
Yes The LCCEs were presented in the NPV. The Estimate Plan includes escalation and the discount rate used.
16 The team uses a standard process to quantify the benefits/effectiveness of each alternative and documents this process.
Yes The team quantified the benefits/effectiveness of each alternative and documented them in the report.
17 The team quantifies the benefits/effectiveness resulting from each alternative over that alternative's full life cycle, if possible
Yes An NPV was prepared for each of the viable alternatives.
18 The team explains how each measure of benefit/effectiveness supports the mission need.
Yes The rationale of how each of the Alternatives is included in the report.
19 The team identifies and documents the significant risks and mitigation strategies for each alternative.
Risks were documented and identified by the team. Both threats and opportunities are included.
20 The team tests and documents the sensitivity of both the cost and benefit/effectiveness estimates for each alternative to risks and changes in key assumptions.
Yes Sensitivity Analyses were completed on the LCCE and on the attributes (changing in Importance).
Selecting a Preferred Alternative
21 The team or decision maker defines the selection criteria based on mission need.
Yes The team identified a list of "Desired Attributes" and rated their importance relative to each other, from 1 (most important) to 4 (least important). This list was developed on May 5, 2015. Attributes and importance were confirmed in meetings held June 15-16, 2015.
22 The team or decision maker weights the selection criteria to reflect the relative importance of each criterion.
Yes The team decided the relative importance of each attribute and the weight. Importance of 1 = weight of 5; Importance of 2 = weight of 3, Importance of 3 = 2, and Importance of 4 = 1.
23 The team or the decision maker compares alternatives’ NPV, if possible.
Yes The NPVs of the LCCs were presented and provided as a range. This is described in the report.
24 An entity independent of the AoA process reviews the extent to which best practices have been followed (for certain projects, additional independent reviews may be necessary at earlier stages of the process, such as reviewing the study plan or for reviewing the identification of viable alternatives).
Yes Cost Estimating and Program Evaluation (CEPE) reviewed the evaluation process and acted as a process advisor throughout the analysis.
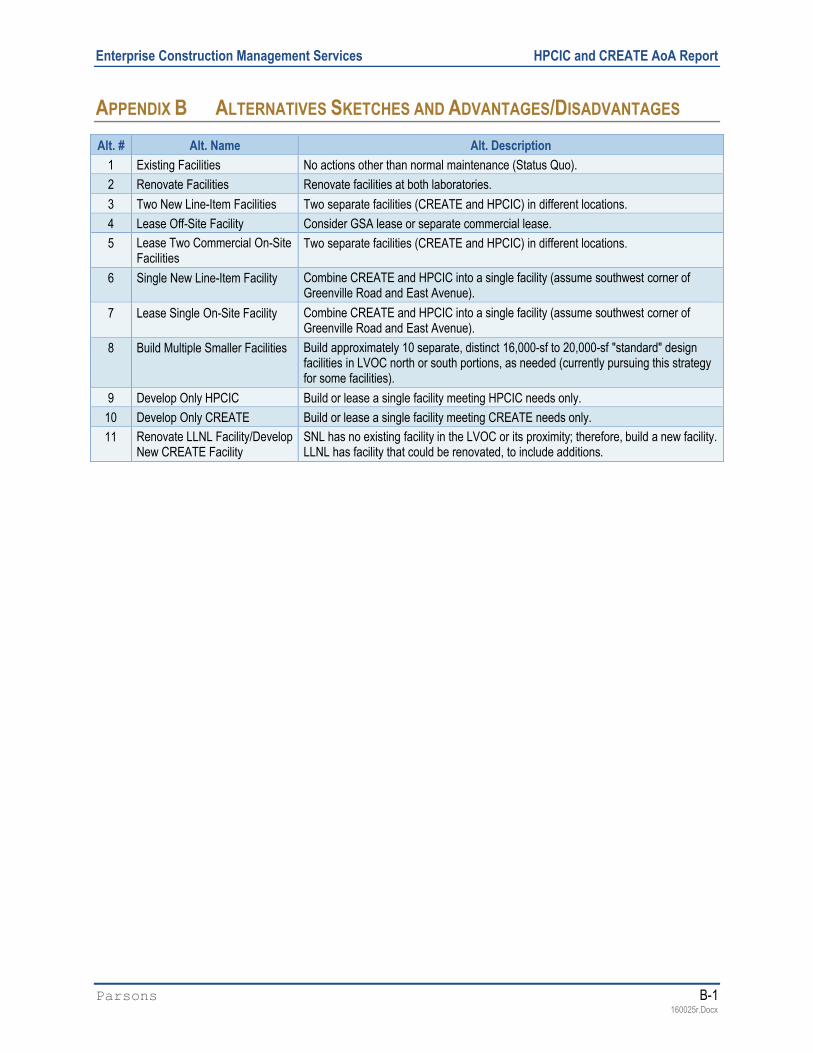
Enterprise Construction Management Services HPCIC and CREATE AoA Report
Parsons B-1160025r.Docx
APPENDIX B ALTERNATIVES SKETCHES AND ADVANTAGES/DISADVANTAGES
Alt. # Alt. Name Alt. Description
1 Existing Facilities No actions other than normal maintenance (Status Quo).
2 Renovate Facilities Renovate facilities at both laboratories.
3 Two New Line-Item Facilities Two separate facilities (CREATE and HPCIC) in different locations.
4 Lease Off-Site Facility Consider GSA lease or separate commercial lease.
5 Lease Two Commercial On-SiteFacilities
Two separate facilities (CREATE and HPCIC) in different locations.
6 Single New Line-Item Facility Combine CREATE and HPCIC into a single facility (assume southwest corner of Greenville Road and East Avenue).
7 Lease Single On-Site Facility Combine CREATE and HPCIC into a single facility (assume southwest corner of Greenville Road and East Avenue).
8 Build Multiple Smaller Facilities Build approximately 10 separate, distinct 16,000-sf to 20,000-sf "standard" design facilities in LVOC north or south portions, as needed (currently pursuing this strategy for some facilities).
9 Develop Only HPCIC Build or lease a single facility meeting HPCIC needs only.
10 Develop Only CREATE Build or lease a single facility meeting CREATE needs only.
11 Renovate LLNL Facility/Develop New CREATE Facility
SNL has no existing facility in the LVOC or its proximity; therefore, build a new facility.LLNL has facility that could be renovated, to include additions.
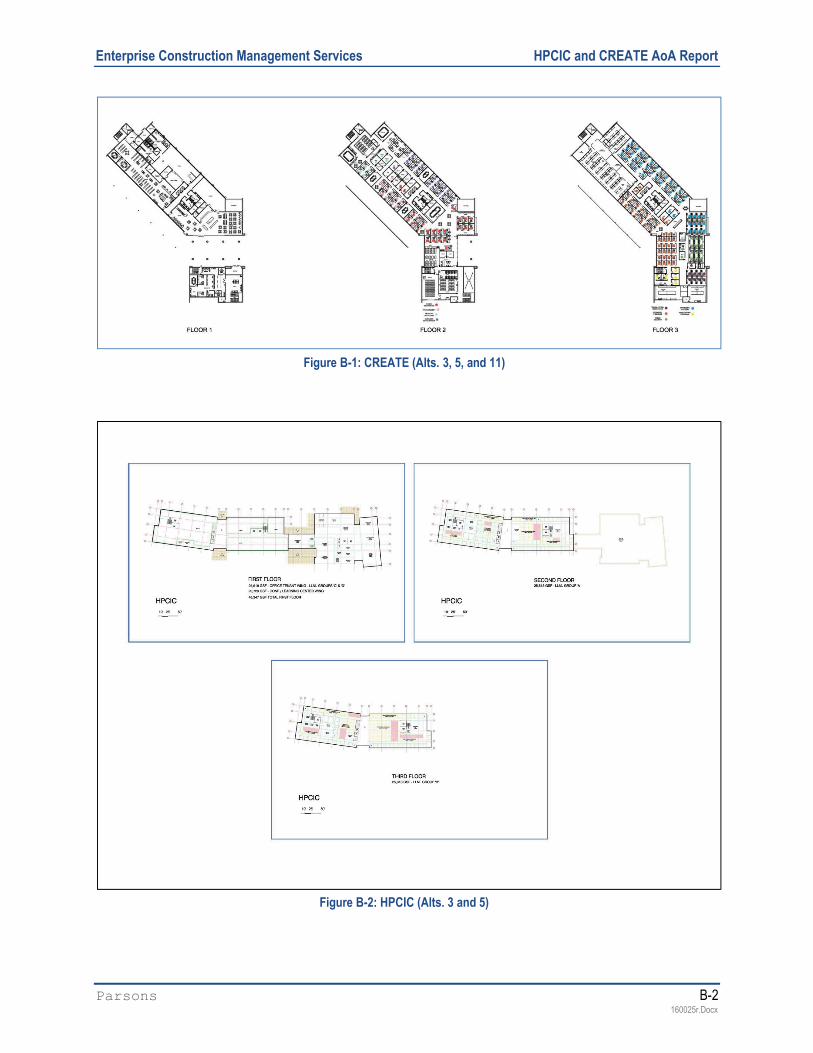
Enterprise Construction Management Services HPCIC and CREATE AoA Report
Parsons B-2160025r.Docx
Figure B-1: CREATE (Alts. 3, 5, and 11)
Figure B-2: HPCIC (Alts. 3 and 5)

Enterprise Construction Management Services HPCIC and CREATE AoA Report
Parsons B-3160025r.Docx
Figure B-3: Single Facility (Alts. 6 and 7)
Figure B-4: HPCIC (B543 Reno – Alt. 11)

Enterprise Construction Management Services HPCIC and CREATE AoA Report
Parsons B-4160025r.Docx
Table B-1: Alternatives Advantages and Disadvantages
2LI 2LS 1LI 1LS Mult Reno/New
Advantages (Pros) 3 5 6 7 8 11
Meets mission needs (mission and program requirements). X X X X X X
Eliminates deferred maintenance (as a result of the facilities being turned cold and dark).
X X X X X X
Known process within DOE to get approval. X X X X
Maintains greater control of the facility (direct involvement in design and operations).
X X X X
Easier construction/schedule advantages using standard commercial construction.
X X
Requires fewer federal and M&O resources (e.g., construction management and safety oversight).
X X
Less O&M support under lease; owner responsible for major items. X X
Likely an earlier move-in date. X X
Timeline of funding availability is quicker by using indirect (laboratory overhead) budgets to fund leases and no requirement to compete for funding (external to laboratory).
X X
Lower upfront cash flow requirement, since not funding design/construction.
X X
Ease of collaboration with outside commercial activities, since commercial entities would have no (or fewer) restrictions on outside work.
X X
Captures numerous partnering and funding opportunities aligned with Exascale and advanced manufacturing activities (assuming ability to complete on schedule).
X X
Provides a single anchor facility for the LVOC. X X
Enhancement in the collaboration between laboratories. X X
One building construction would be simpler to control; design through operations, negotiations, and approval.
X X
Only a single set of tie-ins needed; fewer service disruptions to make tie-ins.
X X
Fits into existing governance structure of each laboratory controlling its own facilities.
X X X X
Independently controlled and managed by each laboratory. X X X X
Fits within existing state and federal regulatory framework of the LLNL and SNL as separate sites and separate NEPA envelopes.
X X X X
Location more convenient (utilities and distance from core facilities, for both laboratories).
X X X X
Likely quicker to get to the first facility. X
More flexibility in future use. X
CREATE (SNL) would get a new building. X
Repurposing the existing facility is desirable; does not increase the footprint.
X
Brings existing facility (B543) up to current earthquake standards; life safety.
X

Enterprise Construction Management Services HPCIC and CREATE AoA Report
Parsons B-5160025r.Docx
Table B-1: Alternatives Advantages and Disadvantages (Cont’d.)
2LI 2LS 1LI 1LS Mult Reno/New
Disadvantages (Cons) 3 5 6 7 8 11
LI process is complex and time consuming. X X X
Competes with numerous higher budgetary priorities across the complex.
X X X
Timeline to obtain funding is extended (versus lease). X X X
Higher upfront cash flow required to fund design and construction. X X X
More difficult to accommodate strategic industry partners (and their ability to do commercial work), thus limiting collaboration.
X X X X
Likely misses numerous partnering and funding opportunities that are aligned with Exascale and advanced manufacturing activities (HPCIC need date is timed with the Exascale roadmap).
X X X X
More cumbersome approval process involving Office of Management and Budget (OMB).
X X
More complex legal interfaces required (ground lease, SNDA, facility lease, third-party structure, financing structure, etc.).
X X
Decision whether to renew facility and ground leases required at end of each lease term.
X X
Less control over design and construction. X X
Less control over modifications and improvements. X X
Must work through third-party (owner) for maintenance and other tenant issues.
X X
Requires some level of priority changes for indirect budgets possibly delaying other activities.
X X
Doesn’t fit in existing governance model. X X
Location not as convenient (utilities and distance from core facilities for both laboratories).
X X
Certain NEPA and regulatory/state regulatory issues with one facility. X X
Possible impact to regulators viewing the laboratories as one site for emission purposes.
X X
Requires managing two simultaneous design and construction efforts. X X X
Requires OMB approval for two leased facilities. X
If there is a change in mission, less flexibility in getting out of the lease. X
Each laboratory may need (want) to lease its portion of the facility. X
Slower process to get to the total required area (mission need). X
Not as efficient to build or operate. X
Not as efficient from a land-use perspective. X
Lack of collaboration, since groups are located in different buildings. X
Uncertainty of funding availability due to increased need for using internal (indirect) budgets.
X
Requires greater Federal and M&O resources to develop and manage design through operations; potential impacts on staff.
X
Possibly more disruption to site operations. X
Segmentation may be an issue (each building must be unique and support a separate function/use—stand-alone).
X
May impact overhead rates to construct facilities, since using indirect budgets (higher cost impact to indirect rate).
X
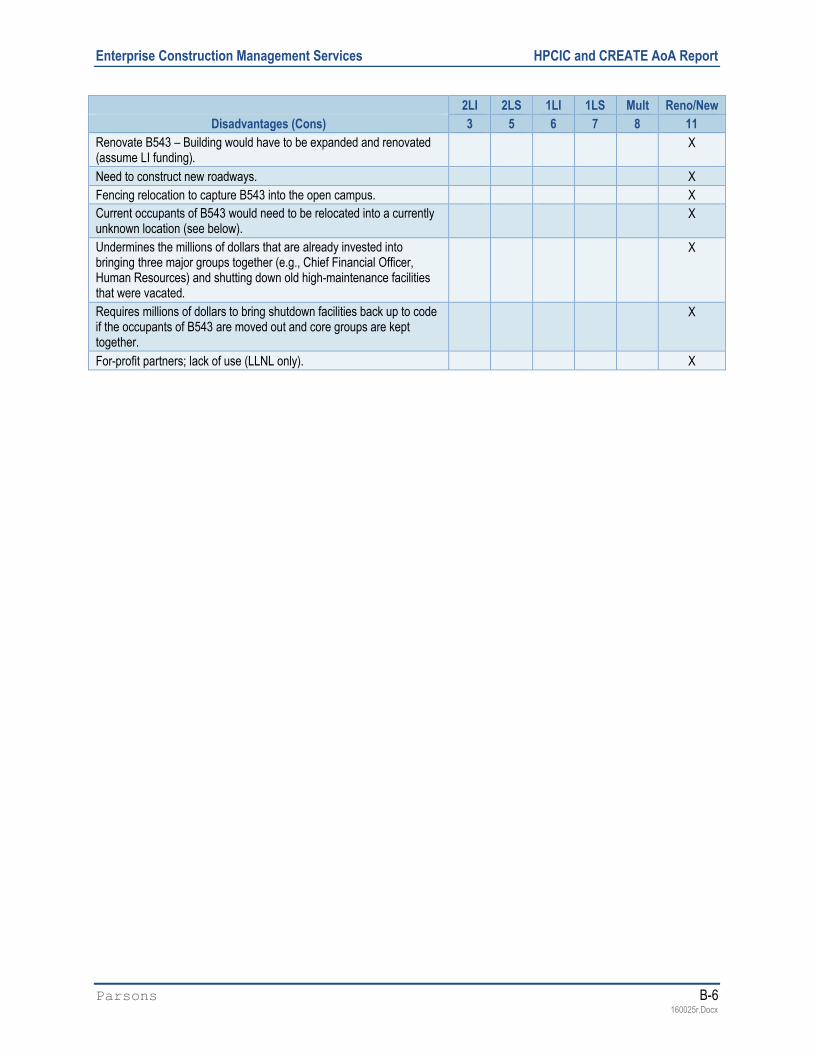
Enterprise Construction Management Services HPCIC and CREATE AoA Report
Parsons B-6160025r.Docx
2LI 2LS 1LI 1LS Mult Reno/New
Disadvantages (Cons) 3 5 6 7 8 11
Renovate B543 – Building would have to be expanded and renovated (assume LI funding).
X
Need to construct new roadways. X
Fencing relocation to capture B543 into the open campus. X
Current occupants of B543 would need to be relocated into a currently unknown location (see below).
X
Undermines the millions of dollars that are already invested intobringing three major groups together (e.g., Chief Financial Officer, Human Resources) and shutting down old high-maintenance facilities that were vacated.
X
Requires millions of dollars to bring shutdown facilities back up to code if the occupants of B543 are moved out and core groups are kept together.
X
For-profit partners; lack of use (LLNL only). X

Enterprise Construction Management Services HPCIC and CREATE AoA Report
Parsons C-1160025r.Docx
APPENDIX C INITIAL ALTERNATIVE SCREENING RATIONALE
Table C-1 provides the rationale for the initial screening of alternatives included in Section 5.
The 13 Mission and Program Requirements, detailed in Table 4-2 (reproduced below as Table
C-1 for easy reference), were evaluated for each alternative and the rationale. Table C-2 provides
the rating and rationale.
Table C-10-1: Mission and Program Requirements
Requirements
Number Description
Mission Requirements
PR-1 Provide additional unclassified office/laboratory/collaboration space for LLNL, SNL/CA, and outside collaborators in the LVOC.
PR-2 Provide a work environment that is modern, dynamic, and flexible.
PR-3 Obtain operational effectiveness and efficiencies.
PR-4 Develop workforce pipeline for attraction, recruitment, development, and retention of world-class staff in a competitive regional market.
Program Requirements
PR-5 Provide approximately 160,000 to 200,000 total gsf (combined requirement for CREATE and HPCIC)
PR-6 Provide flexible space for light laboratory of about 4,400 gsf (CREATE) and 1,000 net sf (HPCIC)
PR-7 Support increased demands for Limited Area Space
PR-8 Consolidate educational outreach programs and facilities
PR-9 Provide additional space in proximity to synergistic programs
PR-10 Provide additional space as soon as possible
PR-11 Mission need is for 15 years (currently identified) with expected life of facility 35 years
PR-12 Provide capability to meet LEED Gold
PR-13 Provide appropriate security flexibility for different program requirements
Table C-2 provides the rating and rationale for the alternatives with respect to the requirements.
Table C-10-2: Screening Results and Rationale
Alt # Brief Title Req. # Score Rationale for Screening Results
1Existing Facilities
Sum 0 Does not meet mission or program requirements.
PR-1 to PR-10
0 Existing facilities don't provide additional modern space to meet mission requirements in either laboratory, near the LVOC areas.
PR-11 1 Existing facilities with maintenance should last 15 years.
PR-12 0 Existing facilities do not meet LEED Gold.
PR-13 1 Existing facilities provide security flexibility.
2Renovate Facilities
Sum 0 Does not meet mission or program requirements.
PR-1 to PR-13
0 LLNL can renovate one building, but SNL cannot renovate any buildings in the LVOC vicinity; insufficient space to meet future needs.
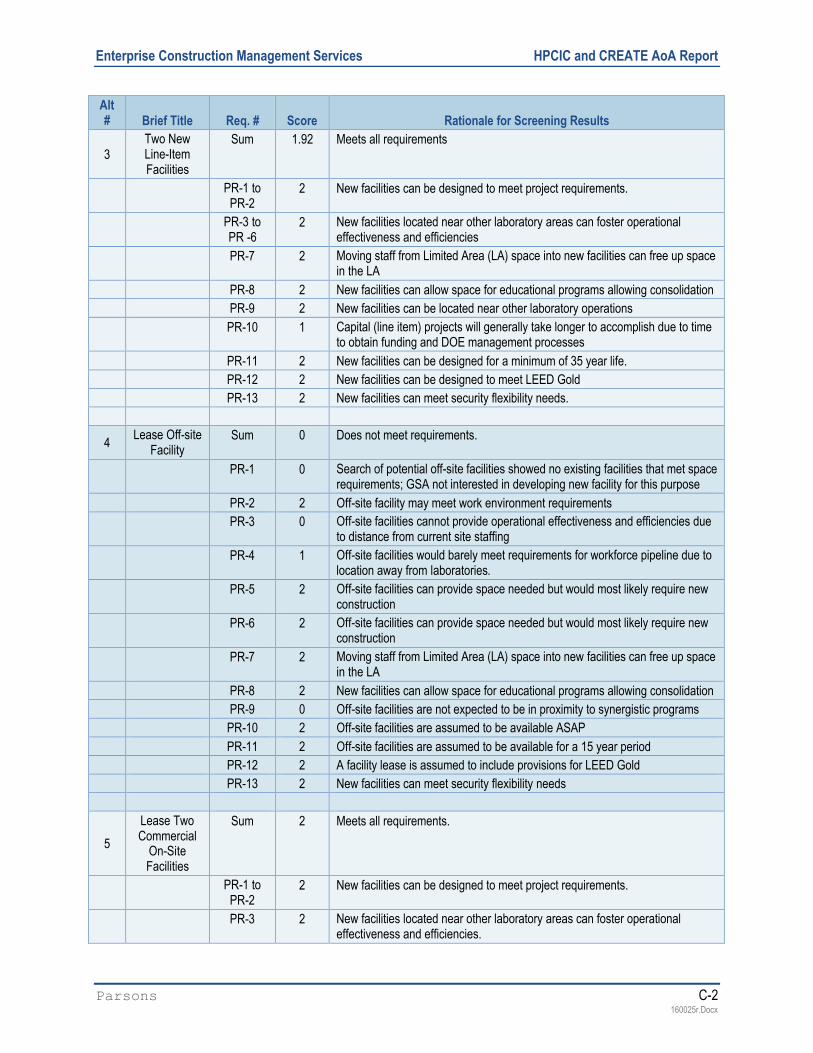
Enterprise Construction Management Services HPCIC and CREATE AoA Report
Parsons C-2160025r.Docx
Alt # Brief Title Req. # Score Rationale for Screening Results
3Two New Line-Item Facilities
Sum 1.92 Meets all requirements
PR-1 to PR-2
2 New facilities can be designed to meet project requirements.
PR-3 to PR -6
2 New facilities located near other laboratory areas can foster operational effectiveness and efficiencies
PR-7 2 Moving staff from Limited Area (LA) space into new facilities can free up space in the LA
PR-8 2 New facilities can allow space for educational programs allowing consolidation
PR-9 2 New facilities can be located near other laboratory operations
PR-10 1 Capital (line item) projects will generally take longer to accomplish due to time to obtain funding and DOE management processes
PR-11 2 New facilities can be designed for a minimum of 35 year life.
PR-12 2 New facilities can be designed to meet LEED Gold
PR-13 2 New facilities can meet security flexibility needs.
4Lease Off-site
FacilitySum 0 Does not meet requirements.
PR-1 0 Search of potential off-site facilities showed no existing facilities that met space requirements; GSA not interested in developing new facility for this purpose
PR-2 2 Off-site facility may meet work environment requirements
PR-3 0 Off-site facilities cannot provide operational effectiveness and efficiencies due to distance from current site staffing
PR-4 1 Off-site facilities would barely meet requirements for workforce pipeline due to location away from laboratories.
PR-5 2 Off-site facilities can provide space needed but would most likely require new construction
PR-6 2 Off-site facilities can provide space needed but would most likely require new construction
PR-7 2 Moving staff from Limited Area (LA) space into new facilities can free up space in the LA
PR-8 2 New facilities can allow space for educational programs allowing consolidation
PR-9 0 Off-site facilities are not expected to be in proximity to synergistic programs
PR-10 2 Off-site facilities are assumed to be available ASAP
PR-11 2 Off-site facilities are assumed to be available for a 15 year period
PR-12 2 A facility lease is assumed to include provisions for LEED Gold
PR-13 2 New facilities can meet security flexibility needs
5
Lease Two Commercial
On-SiteFacilities
Sum 2 Meets all requirements.
PR-1 to PR-2
2 New facilities can be designed to meet project requirements.
PR-3 2 New facilities located near other laboratory areas can foster operational effectiveness and efficiencies.

Enterprise Construction Management Services HPCIC and CREATE AoA Report
Parsons C-3160025r.Docx
Alt # Brief Title Req. # Score Rationale for Screening Results
PR-4 to PR-6
2 New facilities can be designed to meet project requirements.
PR-7 2 Moving staff from Limited Area (LA) space into new facilities can free up space in the LA.
PR-8 2 New facilities can allow space for educational programs allowing consolidation.
PR-9 2 New facilities can be located near other laboratory operations.
PR-10 2 A leased facility is assumed to be available sooner compared to a line-item project.
PR-11 2 New facilities can be designed for a minimum 35-year life.
PR-12 2 New facilities can be designed to meet LEED Gold standards.
PR-13 2 New facilities can meet security flexibility needs.
6Single New Line-Item Facility
Sum 1.77 Meets all requirements.
PR-1 2 New facility can be designed to meet project requirements.
PR-2 2 New single facility will be further away from at least one of the operational areas.
PR-3 1 New facility can be designed to meet project requirements.
PR-4 2 Moving staff from LA space into new facilities can free up space in the LA.
PR-5 2 New facility can allot space for educational programs, allowing consolidation.
PR-6 2 New single facility will be further away from at least one of the laboratories.
PR-7 2 Capital (line item) projects will generally take longer to accomplish due to time to obtain funding and DOE management processes.
PR-8 2 New facility can be designed for a minimum life of 35 years.
PR-9 1 New single facility will be further away from at least one of the laboratories.
PR-10 1 New facility can meet security flexibility needs.
PR-11 2 New facility can be designed for a minimum life of 35 years.
PR-12 2 New facility can be designed to meet LEED Gold.
PR-13 2 New facility can meet security flexibility needs.
7Lease Single
On-SiteFacility
Sum 1.85 Meets all requirements.
PR-1 to PR-2
2 New facility can be designed to meet project requirements.
PR-3 1 New single facility will be further away from at least one of the operational areas.
PR-4 to PR-6
2 New facility can be designed to meet project requirements.
PR-7 2 Moving staff from LA space into new facilities can free up space in the LA.
PR-8 2 New facility can allot space for educational programs, allowing consolidation.
PR-9 1 New single facility will be further away from at least one of the laboratories.
PR-10 2 A leased facility is assumed to be available sooner compared to an LI project.
PR-11 2 New facilities can be designed for a minimum life of 35 years.
PR-12 2 New facilities can be designed to meet LEED Gold standards.

Enterprise Construction Management Services HPCIC and CREATE AoA Report
Parsons C-4160025r.Docx
Alt # Brief Title Req. # Score Rationale for Screening Results
PR-13 2 New facilities can meet security flexibility needs.
8Build Multiple
Smaller Facilities
Sum 1.77 Can meet all mission and program requirements.
PR-1 to PR-2
2 New facilities can be designed to meet project requirements.
PR-3 1 Numerous small facilities are not as efficient or effective due to need to move between buildings.
PR-4 to PR-6
2 New facility can be designed to meet project requirements.
PR-7 2 New facilities will provide sufficient space to allow freeing LA space.
PR-8 2 New facilities can allot space for educational programs, allowing consolidation.
PR-9 1 Multiple facilities can be located near other laboratory operations.
PR-10 2 Multiple projects will take longer to accomplish due to having to phase the work due to annual funding limitations.
PR-11 2 New facilities can be designed for a minimum life of 35 years.
PR-12 2 New facilities can be designed to meet LEED Gold standards.
PR-13 2 New facilities can meet security flexibility needs.
9Develop Only
HPCIC Sum 0 Does not meet mission need because SNL does not participate in this
alternative; screened out.
PR-1 0 Does not meet mission need since SNL does not participate in this alternative.
PR-2 2 A new facility can provide a modern, flexible work environment.
PR-3 1 A new facility can provide operational effectiveness; however, because it is only for one laboratory, it will minimally meet effectiveness needs.
PR-4 1 A new facility can provide a competitive pipeline, but for only one laboratory.
PR-5 0 Single-purpose facility does not provide sufficient space for other laboratoryactivities.
PR-6 0 Single-purpose facility does not provide sufficient space for other laboratoryactivities.
PR-7 to PR-9
1 Single-purpose facility does not provide sufficient space for other laboratoryactivities and therefore is rated as “partially meets.”
PR-10 2 Assume single smaller facility could be provided faster than larger facility or two facilities.
PR-11 1 Single-purpose facility is assumed to be available for at least 15 years (design life of 35 years), but it only meets one laboratory’s need.
PR-12 2 A new facility can be designed to meet LEED Gold standards.
PR-13 2 A new facility can meet security flexibility needs.
10Develop Only
CREATE Sum 0 Does not meet mission need since LLNL does not participate in this
alternative; screened out.
PR-1 0 Does not meet mission need since LLNL does not participate in this alternative.
PR-2 2 A new facility can provide a modern, flexible work environment.
PR-3 1 A new facility can provide operational effectiveness for only one laboratory,thus minimally meeting effectiveness needs.

Enterprise Construction Management Services HPCIC and CREATE AoA Report
Parsons C-5160025r.Docx
Alt # Brief Title Req. # Score Rationale for Screening Results
PR-4 1 A new facility can provide a competitive pipeline, but for only one laboratory.
PR-5 to PR-6
0 Single-purpose facility does not provide sufficient space for other lab activities.
PR-7 to PR-9
1 Single-purpose facility does not provide sufficient space for other laboratoryactivities and is therefore rated as “partially meets.”
PR-10 2 Assume single smaller facility could be provided faster than a larger facility or two facilities.
PR-11 1 Single-purpose facility is assumed to be available for at least 15 years (design life of 35 years), but it only meets one laboratory’s need.
PR-12 2 New facility can be designed to meet LEED Gold standards.
PR-13 2 New facility can meet security flexibility needs.
11
Renovate LLNL Facility/Develop New
CREATE Facility
Sum 1.54 Can meet all mission and program needs.
PR-1 2 New facility can be designed to meet project requirement; renovated facilities can be improved or expanded to meet needs.
PR-2 1 One new facility can provide a modern, flexible facility, but the refurbished facility is challenged to meet this need; rated "partial."
PR-3 1 One new facility can provide operational effectiveness, but the refurbished facility is challenged to meet this need; rated "partial."
PR-4 2 The new and refurbished facilities can provide competitive facilities for the workforce.
PR-5 2 A new facility can be designed to meet project space requirements; renovated facilities can be improved or expanded to meet needs.
PR-6 2 New facilities can be designed to meet project space requirements; renovated facilities can be improved or expanded to meet needs.
PR-7 1 New facilities can be designed to meet project space requirements; renovated facilities can be improved or expanded to meet needs, but not as well as all new facilities can.
PR-8 1 New facilities can be designed to meet project space requirements; renovated facilities can be improved or expanded to meet needs, but not as well as all new facilities can.
PR-9 2 New and refurbished facilities can be located in proximity to synergistic programs.
PR-10 1 Refurbished facilities may take longer that other alternatives.
PR-11 2 New or refurbished facilities can meet the 35-year lifetime requirement.
PR-12 2 New and refurbished facilities can meet LEED Gold standards.
PR-13 1 Security flexibility may be more difficult for a refurbished LLNL facility, since itrequires relocation of security fencing separating LVOC and the PPA.

Enterprise Construction Management Services HPCIC and CREATE AoA Report
Parsons C-6160025r.Docx
This page intentionally left blank.

Enterprise Construction Management Services HPCIC and CREATE AoA Report
Parsons D-1160025r.Docx
APPENDIX D EVALUATION CRITERIA
The AoA is an activity-driven process. Appendix D lists the first five activities in the process.
Appendix E continues the process by detailing the LCCE, and Appendix F continues the
evaluation activities through the sensitivity analyses.
Activity 1: Determine the required and desirable attributes for the project. List the attributes for
the project. Table D-1 lists the desired attributes established by the alternative team and
additional descriptions for the attribute, as well as its source.
Table D-1: Desired Attributes
D# Desired Attribute Additional Description and notes.Source of Criteria
1 Less than 0.25-mile distance between synergistic activities is the highest importance.
Flad A&E 11-4-10 Master Plan (pp.4-26--4-29) identified the village concept for synergistic grouping for walking and bicycling between areas, as well as adjacency to “anchor” facilities; National Ignition Facility (NIF) and Terascale Simulation Facility (TSF) for LLNL and Combustion Research Facility (CRF) for SNL.
PR-9
2 Operations completion within 3 to 5 years is of highest importance.
HPCIC timeframe consistent with Sierra procurement (precursor to Exascale technology, CORAL partnership); CREATE: timing important to meet upcoming NW LEP and ALT schedules.
PR-3, PR-10
3 Moving out of old and/or temporary space is highly desirable.
HPCIC trailer lease renewal uncertain after May 2017; CREATE replaces aged mobile facilities.
PR-1, PR-2, PR-5
4 Reduced deferred maintenance is highly desirable.
Consolidation of staff will enable closure of up to 10 facilities (HPCIC); allows repurposing and elimination of facilities (CREATE).
PR-3, PR-5
5 Co-locating related functions is critical to improving site operations.
CREATE allows consolidation of key externally-focused mission programs with currently distributed support functions and creates efficiency for both researchers and administration; reduced redundancy in badging personnel and processing systems (CREATE); and overall mission improvements with co-locating R&D functions in modern space.HPCIC allows for the co-location of key externally-focused mission programs in HPC and applied HPC, and allows multidisciplinary research staff to increase efficiency and form high functioning integrated project teams (IPTs) for complex projects. Workforce development programs are streamlined through co-location and resource sharing.
PR-1, PR-5, PR-8, PR-9
6 Class A office space is consistent with standards in the Bay Area for recruitment and retention.
CA NNSA facilities compete with Fortune 100 Silicon Valley and San Francisco/Mission Bay companies (e.g., new Googleplex, Apple, Autodesk facilities).
PR-2, PR-3, PR-4, PR-12
7 Create a gateway for industrial partnerships.
Industry partners bring resources and new talent to problems of interest to NNSA. Industry partners are drawn to laboratories for their intellectual property and highly educated and specialized workforce. Creating a physical space that attracts partners and potential new hires requires modern facilities and adequate space to enable and sustain collaborations and networking events.
PR-1, PR-5, PR-13
8 Minimize DOE risks. Use qualitative risk analysis results from the Risk Tab. PR-5, PR-7, PR-11
9 Lower LCC (NPV). 35-year evaluation; all DOE costs, including capital, O&M, end-of-life D&D, and lease (if applicable).
PR-3, budget

Enterprise Construction Management Services HPCIC and CREATE AoA Report
Parsons D-2160025r.Docx
D# Desired Attribute Additional Description and notes.Source of Criteria
10 Near-term cash flow; lower is better.
Evaluate first 5 years of cash flow. PR-3, budget
11 Ease of making facility modifications in future.
Ability to make changes in future. PR-2, PR-6, PR-13
12 Ease of meeting Freeze the Footprint initiative.
Consolidation of staff will enable closure of up to 10 facilities (HPCIC); allows repurposing and elimination of facilities (CREATE).
PR-3, PR-8 /OMB
Directive
13 Ease of transition and relocation.
Transition and relocation may require double moves; very desirable to eliminate double moves.
PR-3, PR-4, PR-5, PR-10
14 Increased energy efficiency and sustainability.
Very important in meeting Department goals. PR-3, 5, 12
15 Ease of providing space for visitors or part-time staff(flexible space).
Flexible space allows reconfiguration to meet needs, usually accomplished with open floor plan offices.
PR-1, PR-2, PR-4, PR-5,
PR-6
16 Ease of standing up different laboratory functional areas in flex space.
Laboratories (light and educational) are used for various purposes; flexible space allows for reconfiguration, as needed.
PR-6
17 Expedient funding availability. Funding options include LI, GPP, IGPP, and alternative finance. PR-10, PR-11
18 Assuring and overseeing safety.
Assuring and overseeing construction and operations safety. PR-2, PR-3
19 Assuring and overseeing security.
Assuring and overseeing security during construction and operations. PR-7, PR-13
20 Ease of constructing within the existing NEPA envelope.
Staying within the current environmental framework for the open campus (LLNL and SNL/CA).
PR-3
Activity 2: Determine how the attributes will be ranked by importance. Assign a number to each
(1-4).
Activity 3: Assign a weighting factor for each criteria importance. The weighting factor will be
associated with each attribute. The most important criterion is given a weighting of 5; the least
important, a rating of 1.
Table D-2: Importance and Weighting Factor
Attribute Importance Weighting Factor Importance Rationale
1 5 Highest importance; borders on a requirement.
2 3 Very important; highly desirable.
3 2 Medium; desirable.
4 1 Lowest importance.
Activity 4: Assign an importance factor to each attribute and document rational for selection.
Activity 5: Correlate the weight factor with the importance. Table D-3 shows the importance and
weight for each attribute. Table D-4 describes the rationale used for identifying the importance
of the attribute.

Enterprise Construction Management Services HPCIC and CREATE AoA Report
Parsons D-3160025r.Docx
Table D-3: Desired Attribute Relative Importance and Weight
D# Desired Attributes ImportanceAttributeWeight
1 Less than 0.25-mile distance between synergistic activities is the highest importance. 1 5
2 Operations completion within 3 to 5 years is of highest importance. 1 5
3 Moving out of old and/or temporary space is highly desirable. 2 3
4 Reduced deferred maintenance is highly desirable. 2 3
5 Co-locating related functions is critical to improving site operations. 1 5
6 Class A office space is consistent with standards in the Bay Area for recruitment and retention.
1 5
7 Create a gateway for industrial partnerships. 1 5
8 Minimize DOE risks. 1 5
9 Lower LCC (NPV). 2 3
10 Near-term cash flow; lower is better. 2 3
11 Ease of making facility modifications in future. 4 1
12 Ease of meeting Freeze the Footprint initiative. 2 3
13 Ease of transition and relocation. 2 3
14 Increased energy efficiency and sustainability. 2 3
15 Ease of providing space for visitors or part-time staff (flexible space). 1 5
16 Ease of standing up different laboratory functional areas in flex space. 4 1
17 Expedient funding availability. 1 5
18 Assuring and overseeing safety. 1 5
19 Assuring and overseeing security. 3 2
20 Ease of constructing within the existing NEPA envelope. 1 5

Enterprise Construction Management Services HPCIC and CREATE AoA Report
Parsons D-4160025r.Docx
Table D-4: Rationale for Attribute and Importance
No. Desired Attribute Importance Rationale for Criteria and Importance
1 Less than 0.25-mile distance between synergistic activities is the highest importance.
1 Borders on a mission requirement.
2 Operations completion within 3 to 5 years is of highest importance.
1 Borders on a mission requirement.
3 Moving out of old and/or temporary space is highly desirable.
2 Temporary space has limited functionality and life; need as soon as possible (ASAP).
4 Reduced deferred maintenance is highly desirable.
2 SNL dealing with accelerated deferred maintenance.
5 Co-locating related functions is critical to improving site operations.
1 Critical to SNL/LLNL mission, currently hindering programmatic growth and pipeline.
6 Class A office space is consistent with standards in the Bay Area for recruitment and retention.
1 Borders on a mission requirement.
7 Create a gateway for industrial partnerships. 1 Critical to SNL/LLNL mission, currently hindering programmatic growth and pipeline.
8 Lower DOE project success risks. 1 Lower risks are critical; of highest importance.
9 Lower LCC (NPV). 2 Consider cost sensitivity analysis with 1 rating.
10 Near-term cash flow; lower is better. 2 Consider cost sensitivity analysis with 1 rating.
11 Ease of making facility modifications in future. 4 Of lowest importance compared to other criteria.
12 Ease of meeting Freeze the Footprint initiative. 2 Important, but not high compared to other criteria.
13 Ease of transition and relocation. 2 Minimizing double moves very desirable.
14 Increased energy efficiency and sustainability. 2 Very important in meeting Department goals.
15 Ease of providing space for visitors or part-time staff (flexible space).
1 Borders on a requirement.
16 Ease of standing up different laboratory functional areas in flex space.
4 Ability to convert spaces for different laboratory uses is minimally important.
17 Expedient funding availability. 1 Ability to obtain funding is critical to project success.
18 Assuring and overseeing safety. 1 Safety is always an important goal.
19 Assuring and overseeing security. 3 Security risk is lower in the general access area.
20 Ease of constructing within the existing NEPA envelope.
1 Any exceedance of the current NEPA and regulatory permits could have significant project (cost and time), and broader institutional impacts if additional environmental permitting is required.

Enterprise Construction Management Services HPCIC and CREATE AoA Report
Parsons E-1160025r.Docx
APPENDIX E COST ESTIMATE(S)
E1 Purpose of Estimate(s)
LCCEs are developed for each viable alternative identified for the project. These estimates are
prepared to support the AoA. A subset of the LCCEs for the preferred alternative can also be
used to confirm or revise the TPC range and the expected funding profile for the project at the
time of CD-1 approval if no further estimates are developed as part of a conceptual design
process. These estimates will be submitted to Mr. Sam Brinker, NNSA.
E2 Overview of Estimate Approach
In general, most estimates are derived from two base estimates—those associated with new
facility construction using an LI approach (see Alts. 3 and 6 below) and those associated with
new facility construction using private financing and leaseback (see Alts. 5 and 7 below).
Estimates are Class 5 quality, as defined in DOE G 413.3-21 and are generally developed using
parametric techniques and factoring, although actual rates provided by LLNL and SNL are used
in some places.
Other cost elements are estimated as follows:
Annual O&M costs for line item scenarios are estimated based on current O&M costs
experienced by both LLNL and SNL at their respective locations. For alternative financing
cases, industry-standard regional rates published by the BOMA are used.
End-of-life D&D costs (for newly constructed facilities) are estimated parametrically based
on building volumes.
All costs are time-phased using a summary-level schedule developed for the proposed overall
facility life of 35 years. The time-phased costs are appropriately escalated and a NPV is
calculated in accordance with OMB Circular A-94 using the January 2015 nominal discount rate
presented therein for a 30-year life (maximum provided). A more specific estimating approach is
discussed for each alternative in the next section.
E3 Discussion of Estimate Methodologies and Approaches
Alt. 3: Build New Facilities (Line Item)
The base estimate is developed as if it is to be done from a commercial standpoint, and not a
DOE-managed perspective (see Alt. 5 description below). Appropriate adjustments are then
made to account for DOE processes, practices, and site considerations. These include extra costs
for a “DOE premium,” as well as slightly higher contingency.

Enterprise Construction Management Services HPCIC and CREATE AoA Report
Parsons E-2160025r.Docx
Alt. 5: Build New Facilities (Lease Financing)
The TPC is derived under the assumption that a commercial developer builds the new facilities
on site—one at LLNL (HPCIC) and one at SNL (CREATE). The developer will then lease the
buildings. The cost estimate is prepared using conventional Construction Specifications Institute
(CSI) format. Unit rates are applied for most construction divisions using common reference
sources, such as RSMeans. In some cases, we use factored costs based on percentages of other
costs. The hard construction costs are adjusted to the Livermore geographical area to account for
the higher-than-national-average wage and material rates. Other project costs are added to the
construction costs, such as contractor general conditions, engineering support, and construction
management. Contingency and escalation are also included to derive the TPC.
The annual lease payments are determined based on a 25-year note to retire the debt service, and
a final 10-year lease. Lease payments include money over and above the amortized debt to
provide a rate of return for the Lessor (i.e., a for-profit scenario). In addition to the lease, other
annual expenses are included:
The annual O&M costs, based on O&M rates provided by each laboratory.
Allowance for major refurbishment approximately midway through the building life.
Final building D&D.
Alt. 6: Single New Facility (Line Item)
Instead of two separate buildings on separate campuses, a single 175,000-sf building is
constructed on land operated and managed by SNL/CA. The estimating approach is similar to
Alternative 3. The proposed site for the single building is approximately a half-mile from the
utility tie-ins, so higher costs are factored into the estimate to account for the increased distance.
Also, the new site would trigger potential NEPA issues—perhaps permitting delays, extra filings,
etc. This is accounted for through the higher contingency for this alternative.
Alt. 7: Single New Facility (Lease)
Instead of two separate buildings on separate campuses, a single 175,000-sf building is
constructed on land operated and managed by SNL/CA. The estimating approach is similar to
Alternative 5. The proposed site for the combined building is approximately a half-mile from the
utility tie-ins, so higher costs are factored into the estimate to account for the increased distance.
Also, the new site would trigger potential NEPA issues—perhaps permitting delays, extra filings,
etc. This is accounted for through the higher contingency for this alternative.
Leasing considerations are similar to those identified in Alternative 5.
Alt. 8: Multiple Small Constructed Facilities
This alternative entails a phased construction of buildings at the LLNL-managed LVOC for
HPCIC, and similar phased construction of buildings at the SNL-managed LVOC for CREATE.
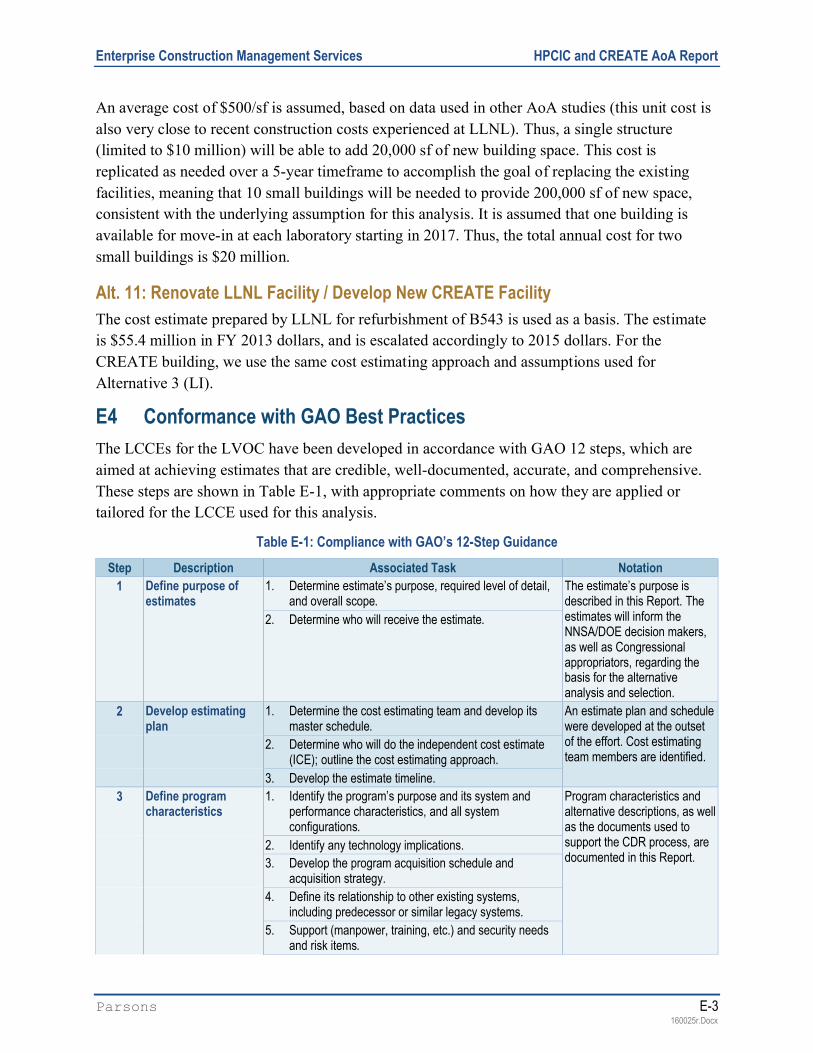
Enterprise Construction Management Services HPCIC and CREATE AoA Report
Parsons E-3160025r.Docx
An average cost of $500/sf is assumed, based on data used in other AoA studies (this unit cost is
also very close to recent construction costs experienced at LLNL). Thus, a single structure
(limited to $10 million) will be able to add 20,000 sf of new building space. This cost is
replicated as needed over a 5-year timeframe to accomplish the goal of replacing the existing
facilities, meaning that 10 small buildings will be needed to provide 200,000 sf of new space,
consistent with the underlying assumption for this analysis. It is assumed that one building is
available for move-in at each laboratory starting in 2017. Thus, the total annual cost for two
small buildings is $20 million.
Alt. 11: Renovate LLNL Facility / Develop New CREATE Facility
The cost estimate prepared by LLNL for refurbishment of B543 is used as a basis. The estimate
is $55.4 million in FY 2013 dollars, and is escalated accordingly to 2015 dollars. For the
CREATE building, we use the same cost estimating approach and assumptions used for
Alternative 3 (LI).
E4 Conformance with GAO Best Practices
The LCCEs for the LVOC have been developed in accordance with GAO 12 steps, which are
aimed at achieving estimates that are credible, well-documented, accurate, and comprehensive.
These steps are shown in Table E-1, with appropriate comments on how they are applied or
tailored for the LCCE used for this analysis.
Table E-1: Compliance with GAO’s 12-Step Guidance
Step Description Associated Task Notation
1 Define purpose of estimates
1. Determine estimate’s purpose, required level of detail, and overall scope.
The estimate’s purpose is described in this Report. The estimates will inform the NNSA/DOE decision makers,as well as Congressional appropriators, regarding the basis for the alternative analysis and selection.
2. Determine who will receive the estimate.
2 Develop estimating plan
1. Determine the cost estimating team and develop its master schedule.
An estimate plan and schedule were developed at the outset of the effort. Cost estimating team members are identified.
2. Determine who will do the independent cost estimate (ICE); outline the cost estimating approach.
3. Develop the estimate timeline.
3 Define program characteristics
1. Identify the program’s purpose and its system and performance characteristics, and all system configurations.
Program characteristics and alternative descriptions, as well as the documents used to support the CDR process, are documented in this Report.
2. Identify any technology implications.
3. Develop the program acquisition schedule and acquisition strategy.
4. Define its relationship to other existing systems, including predecessor or similar legacy systems.
5. Support (manpower, training, etc.) and security needs and risk items.

Enterprise Construction Management Services HPCIC and CREATE AoA Report
Parsons E-4160025r.Docx
Table E-1: Compliance with GAO’s 12-Step Guidance
Step Description Associated Task Notation
6. System quantities for development, testing, and production.
7. Deployment and maintenance plans.
4 Determine estimating structure
1. Define a work breakdown structure (WBS) and describe each element in a WBS dictionary (a major automated information system may have only a cost element structure).
The estimating structure follows conventional CSI format for construction projects.
2. Choose the best estimating method for each WBS element; Identify potential cross-checks for likely cost and schedule drivers.
This report describes the estimate methodology and approach used for each alternative and can be considered a checklist toensure capture of all relevant items.
3. Develop a cost estimating checklist.
5 Identify ground rules and assumptions
1. Clearly define what the estimate includes and excludes. The set of assumptions is described in this Report. Final estimate documentation fully describes all assumptions used for the LCCE for each alternative.
2. Identify global and program-specific assumptions, such as the estimate’s base year, including time-phasing and life cycle.
3. Identify program schedule information by phase and program acquisition strategy.
4. Identify any schedule or budget constraints, inflation assumptions, and travel costs.
5. Specify equipment the government is to furnish as well as the use of existing facilities or new modification or development.
6. Identify prime contractor and major subcontractors.
7. Determine technology refresh cycles, technology assumptions, and new technology to be developed.
8. Define commonality with legacy systems and assumed heritage savings.
9. Describe effects of new ways of doing business.
6 Obtain data 1. Create a data collection plan with emphasis on collecting current and relevant technical, programmatic, cost, and risk data.
Data acquisition is ongoing.Data used is fully described and documented in this Report.Data is being provided by both laboratories, including previous cost estimates, actual O&M costs, interest rates, and lease terms. Other data sources,such as RSMeans cost works,are used.
Costs are normalized among all alternatives (e.g., common escalation factors, unit rates, contractor markups and general conditions, project life cycle).
2. Investigate possible data sources.
3. Collect data and normalize it for cost accounting, inflation, learning, and quantity adjustments.
4. Analyze data for cost drivers, trends, and outliers and compare results against rules of thumb and standard factors derived from historical data.
5. Interview data sources and document all pertinent information, including an assessment of data reliability and uncertainty.
6. Store data for future estimates.

Enterprise Construction Management Services HPCIC and CREATE AoA Report
Parsons E-5160025r.Docx
Table E-1: Compliance with GAO’s 12-Step Guidance
Step Description Associated Task Notation
7 Develop point estimate and compare it to an ICE
1. Develop the cost model, estimating each WBS element, using the best methodology from the data collected, and including all estimating assumptions.
These steps have been completed, as appropriate, and documented in this Report.
Costs are developed in 2015 base year dollars, and areescalated using standard escalation indices across the entire life cycle.An ICE/Report (R) will be done by DOE’s Office of Acquisition and Project Management organization and used to confirm the reasonableness of the LCCEs.
2. Express costs in constant year dollars.
3. Time-phase the results by spreading costs in the years they are expected to occur, based on the program schedule.
4. Sum the WBS elements to develop the overall point estimate.
5. Validate the estimate by looking for errors, such as double counting and omitted costs.
6. Compare estimate against the ICE and examine where and why differences arose.
7. Perform cross-checks on cost drivers to see if results are similar.
8. Update the model as more data becomes available or as changes occur, and compare results against previous estimates.
8 Conduct sensitivity analysis
1. Test the sensitivity of cost elements to changes in estimating input values and key assumptions.
Key assumptions are identified and Sensitivity Analyses has been conducted. The results of those analyses are communicated in this Report.
2. Identify effects on the overall estimate of changing the program schedule or quantities.
3. Determine which assumptions are key cost drivers and which cost elements are affected most by changes.
9 Conduct risk and uncertainty analysis
1. Determine and discuss with technical experts the level of cost, schedule, and technical risk associated with each WBS element.
A qualitative analysis of risk and uncertainty has been done for each alternative LCCE, and those results will be used to inform the AoA decision making process. The analyses is fully described and documented in this report.
2. Analyze each risk for its severity and probability.
3. Develop minimum, most likely, and maximum ranges for each risk element.
4. Determine type of risk distributions and reason for their use.
5. Ensure that risks are not correlated.
6. Use an acceptable statistical analysis method (e.g., Monte Carlo simulation) to develop a confidence interval around the point estimate.
7. Identify the confidence level of the point estimate.
8. Identify the amount of contingency funding and add this to the point estimate to determine the risk-adjusted cost estimate.
9. Recommend that the project or program office develop a risk management plan to track and mitigate risks.
10 Document the estimate
1. Document all steps used to develop the estimate so that a cost analyst that is unfamiliar with the program can recreate it quickly and produce the same result.
The LCCE for each alternative is fully described and documented in this Report.
2. Document the purpose of the estimate, the team that prepared it, the approver(s) of the estimate, and the approval date(s).

Enterprise Construction Management Services HPCIC and CREATE AoA Report
Parsons E-6160025r.Docx
Table E-1: Compliance with GAO’s 12-Step Guidance
Step Description Associated Task Notation
3. Describe the program, its schedule, and the technical baseline used to create the estimate.
4. Present the program’s time-phased LCC.
5. Discuss all ground rules and assumptions.
6. Include auditable and traceable data sources for each cost element and document for all data sources how the data was normalized.
7. Describe in detail the estimating methodology and rationale used to derive each WBS element’s cost (prefer more detail over less).
8. Describe the results of the risk, uncertainty, and sensitivity analyses and whether any contingency funds were identified.
9. Document how the estimate compares to the funding profile.
10. Track how this estimate compares to any previous estimates.
11 Present estimate to management for approval
1. Develop a briefing that presents the documented LCCE. A briefing to NNSA management was given.
2. Include an explanation of the technical and programmatic baseline and any uncertainties.
3. Compare the estimate to an ICE and explain any differences.
4. Compare the estimate (LCCE) or ICE to the budget with enough detail to easily defend it by showing how it is accurate, complete, and high in quality.
5. Focus in a logical manner on the largest cost elements and cost drivers.
6. Make the content clear and complete, so that those who are unfamiliar with it can easily comprehend the competence that underlies the estimate results.
7. Make backup slides available for more probing questions.
8. Act on and document feedback from management.
9. Request acceptance of the estimate.
12 Update the estimate to reflect actual costs and changes
1. Update the estimate to reflect changes in technical or program assumptions or to keep it current as the program passes through new phases or milestones.
These estimates are only intended to be used to support the AoA process; therefore, this step is not applicable in this situation.
2. Replace estimates with earned value management (EVM) estimate at completion (EAC) and independent EAC from the integrated EVM system.
3. Report progress on meeting cost and schedule estimates.
4. Perform a post mortem and document lessons learned for elements for which actual costs or schedules differ from the estimate.
5. Document all changes to the program and how they affect the cost estimate.

Enterprise Construction Management Services HPCIC and CREATE AoA Report
Parsons E-7160025r.Docx
E5 Estimate Basis and Assumptions
E5.1 Estimate Basis
Building Size
HPCIC – 98,000 sf
CREATE – 86,000 sf
Single (combined) building – 175,000 sf
Small building – 20,000 sf
Lease Assumptions
Interest rate for construction financing – 4%
Bond interest rate – 5%
Bond repayment – 25 years
Residual lease period – 10 years
Annual O&M – based on industry-standard regional rates published by the BOMA
Time Value of Money Assumptions
Base year for estimates: 3rd Quarter FY 2015
Escalation Rates:
Construction costs and other project costs – 3% per year based on recent history (ENR)
O&M costs and other variable lease costs – 2% per year based on average CPI for past
5 years, consistent with DOE and GSA guidance
Discount Rate: 3.4% per year (OMB A-94 Nominal Rate, 30 years)
Other LCCE Assumptions
D&D costs are estimated using parametric costs.
D&D Schedule: D&D of existing facilities is assumed to start in the first year following end
of building life. D&D costs are spread over 2 years.
Major refurbishment of new buildings occurs at the approximate midpoint of building life,
and is based on 25 percent of TPC. Costs are spread over 2 years.
Benefits
HPCIC, $/Year $63,540
CREATE (one-time) $187,000

Enterprise Construction Management Services HPCIC and CREATE AoA Report
Parsons E-8160025r.Docx
Schedules
The construction schedules for the two basic cases (Lease and LI) of construction are developed.
Figure E-1 shows a typical schedule for a lease acquisition and construction. Figure E-2 shows a
typical schedule for an LI acquisition and construction.
Figure E-1: Lease Schedule

Enterprise Construction Management Services HPCIC and CREATE AoA Report
Parsons E-9160025r.Docx
Figure E-2: Line Item Schedule
E5.2 Operations and Maintenance Costs
O&M unit costs used for line item cases are based on actual expenses currently realized at each
laboratory, and reflect the rates used by the laboratories in their respective conceptual design
studies. The O&M unit costs used for the lease cases are based on industry-standard regional
rates published by the BOMA. The reported average costs are as follows:
Table E-2: O&M Costs
LLNL, $/sf SNL, $/sf
O&M Costs – LI 16.73 15.94
O&M Costs – Lease 5.63 5.63
E5.3 Cost of Building Lease
The basis for the lease cost calculation is the specific building construction cost, including
financing charges and interest. This amount is then amortized over a 25-year bond note period at
5 percent interest rate. This rate is consistent with government financing achieved in some recent
DOE alternative financing arrangements (at Argonne, Pacific Northwest, and Oak Ridge
National Laboratories).
Enterprise Construction Management Services HPCIC and CREATE AoA Report
Parsons E-10160025r.Docx
To determine the total fixed lease payment, the annual debt service is marked up by a factor of
1.2. That amount captures the cost of lessor management, administration, and profit margin.
Following retirement of the debt, lease payments are reduced for the final 10 years to only the
landlord’s profit and management expense.
The lease payments do not include the estimated costs for O&M, future upgrades/refurbishments,
or end-of-life D&D; however, all of those costs are included as separate LCC elements for this
analysis.
E5.4 D&D Costs
The costs for D&D are based on a parametric factor of $1.63 per cubic foot, and on the
calculated building volume. This results in a D&D unit cost of about $45/sf, which is reasonable.
D&D of clean office-type buildings (no hazardous materials) should be about 10 to 15 percent of
new construction cost.
D&D costs are only applied to the new buildings constructed in this AoA study. This occurs at
the end of the 35-year useful life. Our study assumes no D&D of existing buildings.
E5.5 Schedule Assumptions
The general schedule assumptions used to develop the LCCs and perform the NPV analysis are
as follows:
Line item design/construction starts, at the earliest, in FY 2018, and is completed in FY
2021.
Private developer design/construction can start as soon as FY 2017, and is completed in
FY2019.
O&M costs are incurred in FY 2021 for the LI scenario and in FY2019 for the lease scenario,
based on the end of construction and turnover.
Small GPP-type buildings are available in FY 2018, at the rate of two buildings per year for 5
years. O&M costs for small buildings are prorated based on the expected square footage
available for occupancy.
E5.6 Benefits
Two quantitative benefits are identified and captured in the NPV analyses. The first benefit is a
$63,500 per year reduction in LLNL costs due to not having to pay rent for the current trailers
that house personnel who would be moving to a new building. This is a recurring savings
distributed throughout the 35-year life. The second benefit is a one-time $187,000 savings in
deferred maintenance costs for SNL. This savings occurs in year 5 for purposes of the AoA
study.

Enterprise Construction Management Services HPCIC and CREATE AoA Report
Parsons E-11160025r.Docx
E6 Estimate Results
Table E-3 presents the results from the NPV analyses for each alternative considered.
Table E-3: NPV Results ($M)
Alternative NPV Ranking
3 – Build New Facilities (Line Item) 165.2 4
5 – Build New Facilities (Lease Financing) 131.0 1
6 – Single New Facility (Line Item) 164.4 3
7 – Single New Facility (Lease) 135.9 2
8 – Multiple small constructed facilities 225.2 6
11 – Renovate LLNL Facility/Develop New CREATE Facility 181.1 5
E7 Sensitivity Analysis
A cost sensitivity analysis was conducted by varying 10 key parameters, and results are shown in
Table E-4.
The analysis concludes that very few variations in key parameters will alter the ranking of the
alternatives relative to the NPV of LCCs. Changes to just a few parameters have a minor impact
on that ranking. These are summarized as follows:
Decreasing the assumed O&M escalation from 2 to 1 percent reverses the rankings of
Alternatives 3 and 6.
Assuming the same contingency for the single-building concept as for the separate buildings
concept makes Alternative 7 slightly more favorable in terms of NPV compared to
Alternative 5. (For the base case, contingency rates for the single building alternatives were
5 percent higher than the other alternatives based on the increased level of risk identified
with a single building alternative.)
The only exception is the O&M rate. For the base case, actual O&M rates at LLNL and SNL/CA
are approximately three times higher than O&M rates assumed for alternative financing (based
on industry-standard regional rates published by the BOMA). Sensitivity analysis shows that the
line item scenarios (Alt. 3 and 6) become slightly more favorable from a life cycle cost basis
when the commercial rate gets within 20% of the current actual rates.
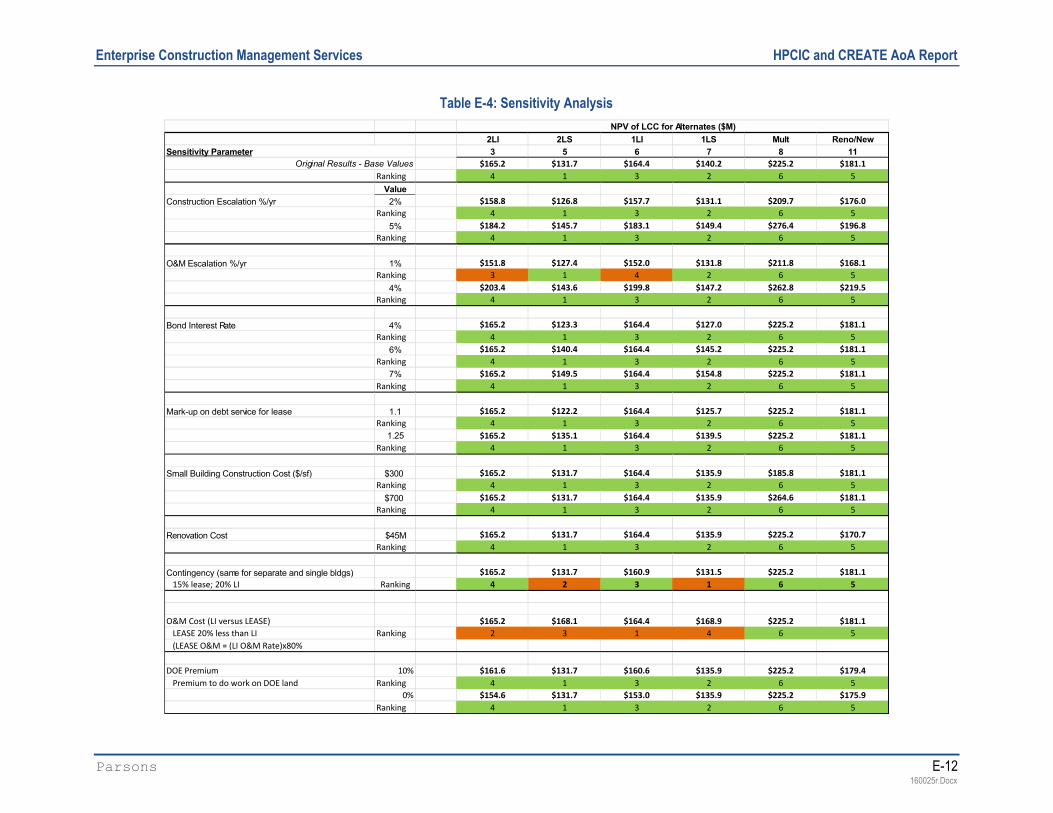
Enterprise Construction Management Services HPCIC and CREATE AoA Report
Parsons E-12160025r.Docx
Table E-4: Sensitivity Analysis
2LI 2LS 1LI 1LS Mult Reno/New
3 5 6 7 8 11
Original Results - Base Values $165.2 $131.7 $164.4 $140.2 $225.2 $181.1
Ranking 4 1 3 2 6 5
Value
Construction Escalation %/yr 2% $158.8 $126.8 $157.7 $131.1 $209.7 $176.0
Ranking 4 1 3 2 6 5
5% $184.2 $145.7 $183.1 $149.4 $276.4 $196.8
Ranking 4 1 3 2 6 5
O&M Escalation %/yr 1% $151.8 $127.4 $152.0 $131.8 $211.8 $168.1
Ranking 3 1 4 2 6 5
4% $203.4 $143.6 $199.8 $147.2 $262.8 $219.5
Ranking 4 1 3 2 6 5
Bond Interest Rate 4% $165.2 $123.3 $164.4 $127.0 $225.2 $181.1
Ranking 4 1 3 2 6 5
6% $165.2 $140.4 $164.4 $145.2 $225.2 $181.1
Ranking 4 1 3 2 6 5
7% $165.2 $149.5 $164.4 $154.8 $225.2 $181.1
Ranking 4 1 3 2 6 5
Mark-up on debt service for lease 1.1 $165.2 $122.2 $164.4 $125.7 $225.2 $181.1
Ranking 4 1 3 2 6 5
1.25 $165.2 $135.1 $164.4 $139.5 $225.2 $181.1
Ranking 4 1 3 2 6 5
Small Building Construction Cost ($/sf) $300 $165.2 $131.7 $164.4 $135.9 $185.8 $181.1
Ranking 4 1 3 2 6 5
$700 $165.2 $131.7 $164.4 $135.9 $264.6 $181.1
Ranking 4 1 3 2 6 5
Renovation Cost $45M $165.2 $131.7 $164.4 $135.9 $225.2 $170.7
Ranking 4 1 3 2 6 5
Contingency (same for separate and single bldgs) $165.2 $131.7 $160.9 $131.5 $225.2 $181.1
15% lease; 20% LI Ranking 4 2 3 1 6 5
O&M Cost (LI versus LEASE) $165.2 $168.1 $164.4 $168.9 $225.2 $181.1
LEASE 20% less than LI Ranking 2 3 1 4 6 5
(LEASE O&M = (LI O&M Rate)x80%
DOE Premium 10% $161.6 $131.7 $160.6 $135.9 $225.2 $179.4
Premium to do work on DOE land Ranking 4 1 3 2 6 5
0% $154.6 $131.7 $153.0 $135.9 $225.2 $175.9
Ranking 4 1 3 2 6 5
NPV of LCC for Alternates ($M)
Sensitivity Parameter

Enterprise Construction Management Services HPCIC and CREATE AoA Report
Parsons E-13160025r.Docx
E8 Acquisition Approach
Table E-5 is a comparative table showing the TPC for various acquisition strategies.
Table E-5: TPC Comparisons Based on Acquisition Strategy ($M)
Alternative Financing (Lease) Line Item (Federal Direct) M&O Procurement
HPCIC 31.2 39.0 47.5
CREATE 30.2 37.8 46.0
Single Building 65.9 82.3 100.2
The Alternative Financing option presumes that a third-party developer designs and constructs
the new building using specifications and standards provided, and then leases the new building
following construction.
The LI option (Federal Direct) assumes no M&O markups. The M&O contractor doesn’t issue
the sub-contracts for design or construction, and is not responsible for Title III or any of the
Quality /Safety requirements. NNSA either does the contracting or, alternatively, USACE or
some other entity does the contracting and management of the design and construction. M&O
staff is involved at a limited level—limited design reviews, interfaces for installation support,
etc. The premium over the alternative financing base case is estimated at 15 percent, based on
parameters used in other AoA studies This premium excludes contingency and escalation.
The M&O Procurement option is the typical DOE paradigm, with the M&O(s) issuing the design
and construction through sub-contracts. The M&O includes all of their markups and is
responsible for everything (design reviews, quality, safety, etc.). We assume a higher premium
for this strategy due to the markups and greater involvement required from the M&O staff. The
premium over the alternative financing base case is estimated at 40 percent.
The single facility has less square-feet than the combined area of the two separate facilities, yet
is estimated to have a higher cost. The location of the single facility requires longer utility runs
than the other options, as well as additional infrastructure to include sidewalks and parking.
Additional cost factors are added to address the risk of combining the functions into one facility.
Additional environmental and NEPA coordination cost are added and the amount of contingency
is increased to account for this risk.
E9 Range Analysis
Some of the assumptions and key parameters used for this analysis are obviously uncertain at
this early stage, and an analysis was completed to assess the extent of that uncertainty. Table E-6
presents the various key parameters that underpin the LCC estimates and NPV analyses, and
shows the range assumed around the estimated base values, as described in Section E5. The
results are presented in Table E-7, which shows the range of NPVs for each alternative.

Enterprise Construction Management Services HPCIC and CREATE AoA Report
Parsons E-14160025r.Docx
Table E-6: Key Parameters Range Analysis
LVOC LCC Estimates Key Parameters Range Analysis
Base Low High
Cost Estimating Uncertainty
HPCIC, $M $31.2 $27.8 $39.1
CREATE, $M $30.2 $26.9 $37.6
Single Building, $M $65.9 $57.8 $81.4
Escalation
Construction Escalation 3% 2% 5%
O&M Escalation 2% 1% 4%
Small Building Cost/sf $500 $300 $700
Contingency
Contingency – Line Item Project
HPCIC, CREATE 20% 15% 25%
Single Building 25% 20% 30%
Contingency – Lease Project
HPCIC, CREATE 15% 10% 20%
Single Building 20% 15% 25%
Leasing Parameters
Bond Interest Rate 5% 4% 7%
Markup on Debt Payments 1.2 1 1.25
DOE Premium (LI) 15% 10% 25%
Table E-7: Range Analysis Results ($M)
Alternative
NPV Based on Range Analysis
Base Low High
3 – Build New Facilities (Line Item) 165.2 131.3 267.1
5 – Build New Facilities (Lease Financing) 131.0 93.2 227.2
6 – Single New Facility (Line Item) 164.4 126.8 268.7
7 – Single New Facility (Lease) 135.9 94.9 231.4
8 – Multiple Small Constructed Facilities 225.2 153.2 366.4
11 – Renovate LLNL Facility/Develop New CREATE Facility 181.1 154.1 261.7
E10 Estimate TeamTable E-8: Estimating Team
Name Organization Phone Number / email
Doug Gray Longenecker & Associates 303-437-2745 (cell) / [email protected] Lead Estimator
Scott Dam Longenecker & Associates 703-538-8944 / [email protected] Quality Assurance

Enterprise Construction Management Services HPCIC and CREATE AoA Report
Parsons E-15160025r.Docx
E11 Estimate Development Schedule
The estimate development schedule is shown below:
Finalize estimate plan May 1
On-site meetings to finalize assumptions and collect data May 4–7
Complete point estimates for all elements and all alternatives June 4
Complete NPV calculations for all alternatives June 10
Complete risk/uncertainty analysis for all estimates June 10
Complete sensitivity analyses for all alternatives June 10

Enterprise Construction Management Services HPCIC and CREATE AoA Report
Parsons E-16160025r.Docx
This page intentionally left blank.

Enterprise Construction Management Services HPCIC and CREATE AoA Report
Parsons F-1160025r.Docx
APPENDIX F ALTERNATIVE ANALYSES
After the completion of the LCCEs and the Risk analysis, the following activities are used to
complete the AoA.
Activity 6: Determine the scoring scale for each attribute. These are used to score each attribute
by alternative. It is the relative ability of the alternative to meet the criteria. Table F-1 shows the
values that the team used in the evaluation. Note that the non-linear approach to the scores gives
a larger emphasis on fully meeting the criteria.
Table F-1: Attribute Evaluation Scale
Attribute Evaluation Score
Fully meets the criteria 1
Generally meets the criteria 0.5
Somewhat meets the criteria 0.3
Barely meets the criteria 0.1
Does not meet the criteria at all 0
Activity 7: Score each Alternative by attribute, using the agreed upon scoring system. Table F-2
is the team scoring results for the Alternatives. Table F-3 includes the rationale for the scoring of
the Alternatives.

Enterprise Construction Management Services HPCIC and CREATE AoA Report
Parsons F-2160025r.Docx
Table F-2: Scoring of Alternatives
D# Desired Attributes2LI3
2LS5
1LI6
1LS7
Mult8
Reno/New11
1 Less than 0.25-mile distance between synergistic activities is the highest importance.
1 1 0.1 0.1 1 1
2 Operations completion within 3 to 5 years is of the highest importance.
1 1 1 1 0.5 0.3
3 Moving out of old and/or temporary space is highly desirable.
1 1 1 1 1 0.5
4 Reduced deferred maintenance is highly desirable. 1 1 1 1 0.5 0.5
5 Co-locating related functions is critical to improving site operations.
1 1 1 1 0.3 0.3
6 Class A office space is consistent with standards in the Bay Area for recruitment and retention.
1 1 1 1 0.5 0.3
7 Create a gateway for industrial partnerships. 0.3 1 0.3 0.5 0.3 0.3
8 Lower DOE risks. 0.3 1 0.3 0.5 0.5 0.3
9 Lower LCC (NPV). 0.5 1 0.5 1 0.1 0.3
10 Near-term cash flow; lower is better. 0.3 1 0.3 1 0.1 0.1
11 Ease of making facility modifications in the future. 0.5 0.3 0.5 0.3 0.5 0.5
12 Ease of meeting Freeze the Footprint initiative. 0.1 1 0.1 1 0.3 0.3
13 Ease of transition and relocation. 1 1 1 1 0.5 0.3
14 Increased energy efficiency and sustainability. 1 1 1 1 0.5 0.3
15 Ease of providing space for visitors or part-time staff(flexible space).
1 1 1 1 0.3 0.5
16 Ease of standing up different laboratory functional areas in flex space.
1 1 1 1 0.3 0.5
17 Expedient funding availability. 0.1 1 0.1 1 0.5 0.1
18 Assuring and overseeing safety. 1 0.5 1 0.5 1 0.5
19 Assuring and overseeing security. 1 0.5 1 0.5 1 0.5
20 Ease of constructing within the existing NEPA envelope.
1 1 0.3 0.3 1 1
Total Score – Unweighted 15.1 18.3 13.5 15.7 10.7 8.4

Enterprise Construction Management Services HPCIC and CREATE AoA Report
Parsons F-3160025r.Docx
Table F-3: Rationale for Alternative Scoring
D# Desired Attributes Imp. 3 5 6 7 8 11
1 Less than 0.25-mile distance between synergistic activities is the highest importance.
1 1 1 0.1 0.1 1 1
Flad A&E 11-4-10 Master Plan (pp.4-26–4-29) identified the village concept for synergistic grouping for walking and bicycling between areas, as well as adjacency to “anchor” facilities; NIF and TSF for LLNL, and CRF for SNL.
2LI Alt. 3 Rationale Fully Meets – The location of the new HPCIC and CREATE are within the 0.25-mile distance of the attribute.
2LS Alt. 5 Rationale Fully Meets – The location of the new HPCIC and CREATE are within the 0.25-mile distance of the attribute.
1LI Alt. 6 Rationale Barely Meets – The suggested location of the single building is located off of LLNL on SNL/CA land. The building would not be within 0.25 miles from HPCIC synergistic activities.
1LS Alt. 7 Rationale Barely Meets – The suggested location of the single building is located off of LLNL on SNL/CA land. The building would not be within 0.25 miles from HPCIC synergistic activities.
Mult Alt. 8 Rationale Fully Meets – The location of the multiple buildings would be dictated by the two laboratories and therefore within 0.25 mile of their synergistic activities.
Reno/New Alt. 11Rationale
Fully Meets – The location of the new CREATE facility and the renovated B543 are within0.25 mile of the synergistic activities.
D# Desired Attributes Imp 3 5 6 7 8 11
2 Operations within 3 to 5 years is of highest importance
1 1 1 1 1 0.5 0.3
HPCIC timeframe is consistent with Sierra procurement (precursor to Exascale technology, CORAL partnerships); CREATE timing important to meet NW LEP and ALT schedules.
2LI Alt. 3 Rationale Fully Meets – Schedule for line item assumes FY 2021 move-in.
2LS Alt. 5 Rationale Fully Meets – Schedule for lease assumes FY 2019 move-in.
1LI Alt. 6 Rationale Fully Meets – Schedule for LI assumes FY 2021 move-in.
1LS Alt. 7 Rationale Fully Meets – Schedule for lease assumes FY 2019 move-in.
Mult Alt. 8 Rationale Generally Meets – Schedule assumes that construction is funded within 5 years. Construction of final buildings will not be complete in year 5.
Reno/New Alt. 11Rationale
Somewhat Meets – Renovation will take longer to move people out and renovate old facilities. The CREATE facility will be operational within 5 years.
D# Desired Attributes Imp. 3 5 6 7 8 11
3 Move out of old and/or temporary space is highly desirable
2 1 1 1 1 1 0.5
CREATE replaces aged mobile facilities; temporary HPCIC trailers lease renewal uncertain after May 2017
2LI Alt. 3 Rationale Fully Meets – New facilities.
2LS Alt. 5 Rationale Fully Meets – New facilities.
1LI Alt. 6 Rationale Fully Meets – New facilities.
1LS Alt. 7 Rationale Fully Meets – New facilities.
Mult Alt. 8 Rationale Fully Meets – New facilities.
Reno/New Alt. 11Rationale
Generally Meets – CREATE is a new facility. HPCIC will remain in an old facility (though renovated).

Enterprise Construction Management Services HPCIC and CREATE AoA Report
Parsons F-4160025r.Docx
Table F-3: Rationale for Alternative Scoring (Cont’d.)
D# Desired Attributes Imp. 3 5 6 7 8 11
4 Reduced deferred maintenance is highly desirable 2 1 1 1 1 0.5 0.5
Consolidation of staff will enable closure of up to 10 facilities (HPCIC); allows repurposing and elimination of facilities (CREATE).
2LI Alt. 3 Rationale Fully Meets – New facilities.
2LS Alt. 5 Rationale Fully Meets – New facilities.
1LI Alt. 6 Rationale Fully Meets – New facilities.
1LS Alt. 7 Rationale Fully Meets – New facilities.
Mult Alt. 8 Rationale Generally Meets – Multiple constructions of facilities would have a longer time with deferred maintenance. Less money available to buy down deferred maintenance.
Reno/New Alt. 11 Rationale Generally Meets – Renovate requires extra moves and renovations of old facilities that were cold and dark.
D# Desired Attributes Imp. 3 5 6 7 8 11
5 Co-locating related functions is critical to improving site operations
1 1 1 1 1 0.3 0.3
CREATE allows consolidation of key externally-focused mission programs with currently distributed support functions and creates efficiency for both researchers and administration; reduced redundancy in badging personnel and processing systems (CREATE); and overall mission improvements with co-locating R&D functions in modern space. HPCIC allows for the co-location of key externally-focused mission programs in HPC and applied HPC, and allows multidisciplinary research staff to increase efficiency and form high functioning integrated project teams (IPTs) for complex projects. Workforce development programs are streamlined through co-location and resource sharing.
2LI Alt. 3 Rationale Fully Meets – New facilities meet the attribute of co-location.
2LS Alt. 5 Rationale Fully Meets – New facilities meet the attribute of co-location.
1LI Alt. 6 Rationale Fully Meets – New facilities meet the attribute of co-location.
1LS Alt. 7 Rationale Fully Meets – New facilities meet the attribute of co-location.
Mult Alt. 8 Rationale Somewhat Meets – The multiple alternative would spread out over multiple buildings for CREATE and multiple buildings for HPCIC. This does not provide the same co-location benefits/synergy as if the functions are located in each in one location.
Reno/New Alt. 11 Rationale Somewhat Meets – The renovation for HPCIC would cause the relocation and splitting up of departments currently located in B543; These departments were located in B543 in an effort to co-locate and increase efficiencies, thus reducing site operations efficiency. CREATE would meet its consolidation goals in a new facility.
D# Desired Attributes Imp. 3 5 6 7 8 11
6 Class A Office space consistent with standards in the Bay Area for recruitment and retention
1 1 1 1 1 0.5 0.3
CA NNSA facilities compete with Fortune 100 Silicon Valley and San Francisco/Mission Bay companies (e.g., new Googleplex, Apple, Autodesk facilities).
2LI Alt. 3 Rationale Fully Meets – New facilities will be designed and constructed consistent with Class A officeSpace.
2LS Alt. 5 Rationale Fully Meets – New facilities will be designed and constructed consistent with Class A office Space.
1LI Alt. 6 Rationale Fully Meets – New facilities will be designed and constructed consistent with Class A officeSpace.
1LS Alt. 7 Rationale Fully Meets – New facilities will be designed and constructed consistent with Class A office Space.

Enterprise Construction Management Services HPCIC and CREATE AoA Report
Parsons F-5160025r.Docx
Table F-3: Rationale for Alternative Scoring (Cont’d.)
Mult Alt. 8 Rationale Generally Meets – Multiple new facilities will generally meet the overall goal, but will not be as functional as one collaborative work space.
Reno/New Alt. 11 Rationale Somewhat Meets – The renovated space will improve the space, but it will be limited to its current footprint. May be limited in the layout and design of renovated space. New CREATEfacility would meet the attribute goal.
D# Desired Attributes Imp. 3 5 6 7 8 11
7 Create a gateway for industrial partnerships 1 0.3 1 0.3 0.5 0.3 0.3
Industry partners bring resources and new talent to problems of interest to NNSA. Industry partners are drawn to laboratories for their intellectual property and highly educated and specialized workforce. Creating a physical space that attracts partners and potential new hires requires modern facilities and adequate space to enable and sustain collaborations and networking events.
2LI Alt. 3 Rationale Somewhat Meets – Will create space, but it would be more difficult to allow industry partners to collaborate fully in a government-owned facility. Space would be available at both laboratories.
2LS Alt. 5 Rationale Fully Meets – New space available at both laboratories to allow the collaboration with industry partners. Ease of collaboration with outside commercial entities would have no (or fewer) restrictions on outside work.
1LI Alt. 6 Rationale Somewhat Meets – Will create space, but it would be more difficult to allow industry partners to collaborate fully in a government-owned facility. Would be located only at one laboratory(SNL/CA), reducing the benefit LLNL.
1LS Alt. 7 Rationale Generally Meets – Lease space allows the ease of collaboration with outside commercial entities. Would be located only at one laboratory (SNL/CA), reducing the benefit for LLNL.
Mult Alt. 8 Rationale Somewhat Meets – Will create space, but it would be more difficult to allow industry partners to collaborate fully in a government owned facility. Space would be available at both laboratories.
Reno/New Alt. 11 Rationale Somewhat Meets – Will create space, but it would be more difficult to allow industry partners to collaborate fully in a government owned facility. Space would be available at both laboratories.
D# Desired Attributes Imp. 3 5 6 7 8 11
8 Lower DOE Programmatic Risks 1 0.3 1 0.3 0.5 0.5 0.3
Use qualitative risk analysis results from Risk Tab of the Evaluation Worksheet.
2LI Alt. 3 Rationale Somewhat Meets – See Risk Analysis for specific risks and risk level; overall risk level is Moderate with the third highest risk score (almost equivalent to Alt. 6 and Alt. 11).
2LS Alt. 5 Rationale Fully Meets – Overall risk level is Moderate; lowest ranking risk score (returned a score of 0.01 above a risk level of Low).
1LI Alt. 6 Rationale Somewhat Meets – See Risk Analysis for specific risks and risk level; overall risk level is Moderate, with the highest risk score (almost equivalent to Alt. 3 and Alt. 11).
1LS Alt. 7 Rationale Generally Meets – See Risk Analysis for specific risks and risk level; overall risk level is Moderate, with the second lowest ranking risk score.
MULT Alt. 8 Rationale Generally Meets – See Risk Analysis for specific risks and risk level; overall risk level is Moderate. Almost equivalent to Alt. 7.
Reno/New Alt. 11 Rationale Somewhat Meets – See Risk Analysis for specific risks and risk level; overall risk level is Moderate. (Almost equivalent to Alt. 3 and Alt. 6).

Enterprise Construction Management Services HPCIC and CREATE AoA Report
Parsons F-6160025r.Docx
Table F-3: Rationale for Alternative Scoring (Cont’d.)
D# Desired Attributes Imp. 3 5 6 7 8 11
9 Lower LCC (NPV) 2 0.5 1 0.5 1 0.1 0.3
35-year evaluation; all DOE costs, including capital, O&M, end-of-life D&D, and lease (if applicable).
2LI Alt. 3 Rationale Generally Meets – Alt. 3 and Alt. 6 return essentially the equivalent NPV. See the LCCE.
2LS Alt. 5 Rationale Fully Meets – The lowest NPV. See LCCE.
1LI Alt. 6 Rationale Generally Meets – Alt. 3 and Alt. 6 return essentially the equivalent NPV. See the LCCE.
1LS Alt. 7 Rationale Fully Meets – The second lowest NPV. Almost equivalent to Alt. 5.
MULT Alt. 8 Rationale Barely Meets – The highest NPV. See the LCCE.
Reno/New Alt. 11 Rationale Somewhat Meets – The second highest NPV. See the LCCE.
D# Desired Attributes Imp. 3 5 6 7 8 11
10 Near-term cash flow; lower is better 2 0.3 1 0.3 1 0.1 0.1
Evaluate first 5 years of cash flow.
2LI Alt. 3 Rationale Somewhat Meets – LI project (Alt. 3 and Alt. 6) had similar projected requirements for near-term cash flow. Approximately four times required by lease in the first 5 years.
2LS Alt. 5 Rationale Fully Meets – Lease projects (Alt. 5 and Alt. 7) require the least cash flow in the first 5 years.
1LI Alt. 6 Rationale Somewhat Meets – LI project (Alt. 3 and Alt. 6) had similar projected requirements for near-term cash. Approximately four times required by lease in the first 5 years.
1LS Alt. 7 Rationale Fully Meets – Lease projects (Alt. 5 and Alt. 7) require the least cash flow in the first 5 years.
Mult Alt. 8 Rationale Barely Meets – Multiple new facilities require the largest amount of cash in the first 5 years.
Reno/New Alt. 11 Rationale Barely Meets – Alt. 11 requires the second greatest amount of cash in the first 5 years.
D# Desired Attributes Imp. 3 5 6 7 8 11
11 Ease of making facility modifications in future 4 0.5 0.3 0.5 0.3 0.5 0.5
Ability to make changes in future.
2LI Alt. 3 Rationale Generally Meets – For government-owned buildings, it is generally easier to make changes in the future.
2LS Alt. 5 Rationale Somewhat Meets – The government does not own or control these buildings. It will be somewhat harder to make changes in the future.
1LI Alt. 6 Rationale Generally Meets – For government-owned buildings, it is generally easier to make changes in the future.
1LS Alt. 7 Rationale Somewhat Meets – The government does not own or control these buildings. It will be somewhat harder to make changes in the future.
Mult Alt. 8 Rationale Generally Meets – For government-owned buildings, it is generally easier to make changes in the future.
Reno/New Alt. 11 Rationale Generally Meets – For government-owned buildings, it is generally easier to make changes in the future.

Enterprise Construction Management Services HPCIC and CREATE AoA Report
Parsons F-7160025r.Docx
Table F-3: Rationale for Alternative Scoring (Cont’d.)
D# Desired Attributes Imp. 3 5 6 7 8 11
12 Ease of meeting Freeze the Footprint initiative 2 0.1 1 0.1 1 0.3 0.3
Consolidation of staff will enable closure of up to 10 facilities (HPCIC); allows repurposing and elimination of facilities (CREATE).
2LI Alt. 3 Rationale Barely Meets – Enough space has to be identified to construct an LI project of the anticipated size to meet the requirement.
2LS Alt. 5 Rationale Fully Meets – Lease facilities are easiest to meet the requirement.
1LI Alt. 6 Rationale Barely Meets – Enough space has to be identified to construct a line item project of the anticipated size to meet the requirement.
1LS Alt. 7 Rationale Fully Meets – Lease facilities are easiest to meet the requirement.
Mult Alt. 8 Rationale Somewhat Meets – Additional time to establish a strategy to meet the requirements. Multiple buildings are not a good way to consolidate activities and multiple facilities will not be as efficient.
Reno/New Alt. 11 Rationale Somewhat Meets – Renovated space is challenging to meet the attribute.
D# Desired Attributes Imp. 3 5 6 7 8 11
13 Ease of transition and relocation 2 1 1 1 1 0.5 0.3
Transition and relocation may require double moves; very desirable to eliminate double moves.
2LI Alt. 3 Rationale Fully Meets – Only one move is required.
2LS Alt. 5 Rationale Fully Meets – Only one move is required.
1LI Alt. 6 Rationale Fully Meets – Only one move is required.
1LS Alt. 7 Rationale Fully Meets – Only one move is required.
Mult Alt. 8 Rationale Generally Meets – Coordination challenge over time with the multiple smaller facilities, but minimal impact.
Reno/New Alt. 11 Rationale Somewhat Meets – Multiple moves over time for the renovated space. Moving people out of the area to be renovated and setting up temporary space. Requires multiple moves to complete action.
D# Desired Attributes Imp. 3 5 6 7 8 11
14 Increased energy efficiency and sustainability 2 1 1 1 1 0.5 0.3
Very important in meeting Department goals.
2LI Alt. 3 Rationale Fully Meets – New facility designed and constructed to meet efficiency and sustainability requirements.
2LS Alt. 5 Rationale Fully Meets – New facility designed and constructed to meet efficiency and sustainability requirements.
1LI Alt. 6 Rationale Fully Meets – New facility designed and constructed to meet efficiency and sustainability requirements.
1LS Alt. 7 Rationale Fully Meets – New facility designed and constructed to meet efficiency and sustainability requirements.
Mult Alt. 8 Rationale Generally Meets – Multiple facilities are not as efficient as a single facility.
Reno/New Alt. 11 Rationale Somewhat Meets – A renovated facility will increase efficiency and sustainability but will not achieve as much as a new facility.

Enterprise Construction Management Services HPCIC and CREATE AoA Report
Parsons F-8160025r.Docx
Table F-3: Rationale for Alternative Scoring (Cont’d.)
D# Desired Attributes Imp. 3 5 6 7 8 11
15 Ease of providing space for visitors or part-time staff (flexible space)
1 1 1 1 1 0.3 0.5
Flexible space allows reconfiguration to meet needs, usually accomplished with open floor plan offices.
2LI Alt. 3 Rationale Fully Meets – New facility designed and constructed to attain flexibility and providing space.
2LS Alt. 5 Rationale Fully Meets – New facility designed and constructed to attain flexibility and providing space.
1LI Alt. 6 Rationale Fully Meets – New facility designed and constructed to attain flexibility and providing space.
1LS Alt. 7 Rationale Fully Meets – New facility designed and constructed to attain flexibility and providing space.
Mult Alt. 8 Rationale Somewhat Meets – Multiple facilities will have less flexibility in the layout and open floor plans.Constrained to smaller footprints.
Reno/New Alt. 11 Rationale Generally Meets – Renovated space will be generally difficult to provide flexibility. Constrained by the current footprint of B543. CREATE would meet the attribute.
D# Desired Attributes Imp. 3 5 6 7 8 11
16 Ease of standing up different laboratory functional areas in flex space
4 1 1 1 1 0.3 0.5
Laboratories (light or educational) are used for various purposes; flexible space allows reconfiguration as needed
2LI Alt. 3 Rationale Fully Meets – New facility can be designed and constructed for ease of reconfiguration.
2LS Alt. 5 Rationale Fully Meets – New facility can be designed and constructed for ease of reconfiguration.
1LI Alt. 6 Rationale Fully Meets – New facility can be designed and constructed for ease of reconfiguration.
1LS Alt. 7 Rationale Fully Meets – New facility can be designed and constructed for ease of reconfiguration.
Mult Alt. 8 Rationale Somewhat Meets – Multiple facilities will have a smaller footprint with less capability of flexibility.
Reno/New Alt. 11 Rationale Generally Meets – The new CREATE facility would fully meet the requirement. Renovation of B543 would barely meet. The addition to B543 would be the laboratory; there is barely any flexibility.
D# Desired Attributes Imp. 3 5 6 7 8 11
17 Expedient Funding Availability 1 0.1 1 0.1 1 0.5 0.1
Funding options include line-item, GPP, IGPP, Alternative finance
2LI Alt. 3 Rationale Barely Meets – The line item alternatives would not compete well with other priorities within the complex.
2LS Alt. 5 Rationale Fully Meets – Lease cost is a small percentage of overhead/fixed cost. Rates will not be raised.
1LI Alt. 6 Rationale Barely Meets – The line item alternatives would not compete well with other priorities within the complex.
1LS Alt. 7 Rationale Fully Meets – Lease cost is a small percentage of overhead/fixed cost. Rates will not be raised.
Mult Alt. 8 Rationale Generally Meets – Multiple facilities would compete year-to-year with operations needs. Much easier to control than line item.
Reno/New Alt. 11 Rationale Barely Meets – The LI alternatives would not compete well with other priorities within the complex.
D# Desired Attributes Imp. 3 5 6 7 8 11
18 Assuring and Overseeing safety 1 1 0.5 1 0.5 1 0.5
Assuring and overseeing construction and operations safety.
2LI Alt. 3 Rationale Fully Meets – Government retains oversight and control of safety during construction and operations.

Enterprise Construction Management Services HPCIC and CREATE AoA Report
Parsons F-9160025r.Docx
Table F-3: Rationale for Alternative Scoring (Cont’d.)
2LS Alt. 5 Rationale Generally Meets – Facility owner/operator would be required to meet all requirements relevant to commercial safety.
1LI Alt. 6 Rationale Fully Meets – Government retains oversight and control of safety during construction and operations.
1LS Alt. 7 Rationale Generally Meets – Facility owner/operator would be required to meet all requirements relevant to commercial safety.
Mult Alt. 8 Rationale Fully Meets – Government retains oversight and control of safety during construction and operations.
Reno/New Alt. 11 Rationale Generally Meets – New facility (CREATE) would fully meets. The requirements to renovate B543 increase the concern for safety during construction (renovation, moving fence-line, and constructing roads).
D# Desired Attributes Imp. 3 5 6 7 8 11
19 Assuring and Overseeing Security 3 1 0.5 1 0.5 1 0.5
Assuring and overseeing security during construction and during operations.
2LI Alt. 3 Rationale Fully Meets – Government maintains control and oversight the security.
2LS Alt. 5 Rationale Generally Meets – Current GAA Security Plan would be followed. The facility owner/operator would be expected to define, document, and meet all applicable security requirements. SNL and LLNL would conduct security reviews for potential impacts to lab operations.
1LI Alt. 6 Rationale Fully Meets – Government maintains control and oversight the security.
1LS Alt. 7 Rationale Generally Meets – Current GAA Security Plan would be followed. The facility owner/operator would be expected to define, document, and meet all applicable security requirements. SNL and LLNL would conduct security reviews for potential impacts to laboratory operations.
Mult Alt. 8 Rationale Fully Meets – Government maintains control and oversight the security.
Reno/New Alt. 11 Rationale Generally Meets – Renovation of B543 adds a level of complexity on where people would be able to work and park, due to proximity to high-security area. CREATE fully meets.
D# Desired Attributes Imp. 3 5 6 7 8 11
20 Ease of construction within the existing NEPA Envelope
1 1 1 0.3 0.3 1 1
Staying within the current environmental framework for the Open Campus (LLNL and SNL/CA).
2LI Alt. 3 Rationale Fully Meets – New facilities (CREATE and HPCIC) fall within the current NEPA envelope.
2LS Alt. 5 Rationale Fully Meets – New facilities (CREATE and HPCIC) fall within the current NEPA envelope.
1LI Alt. 6 Rationale Somewhat Meets – A single, combined-use facility has not been planned in the existing environmental documents. There are certain NEPA and regulatory/state regulatory issues with one facility. Possible impact from regulators viewing the laboratories as “one” site for emission purposes. A determination may be written that could take into the slightly different use that had previously been identified.
1LS Alt. 7 Rationale Somewhat Meets – A single, combined-use facility has not been planned in the existing environmental documents. There are certain NEPA and regulatory/state regulatory issues with one facility. Possible impact from regulators viewing the laboratories as “one” site for emission purposes. A determination may be written that could take into the slightly different use that had previously been identified.
Mult Alt. 8 Rationale Fully Meets – Multiple facilities (CREATE and HPCIC) fall within the current NEPA envelope.
Reno/New Alt. 11 Rationale Fully Meets – Renovation for HPCIC and the new CREATE facility falls within the current NEPA envelope.

Enterprise Construction Management Services HPCIC and CREATE AoA Report
Parsons F-10160025r.Docx
Activity 8: Compute the weighted score (attribute weight times score) for each alternative by
multiplying by the attribute weight by the Alternative score.
Table F-4 shows the results of the weighted scoring of the Alternatives.
Table F-4: Alternatives Results – Weighted Score
D# Desired Attributes
Normalized Relative
Weighting (NRW)
2LI3
2LS5
1LI6
1LS7
Mult8
Reno/New11
1 Less than 0.25-mile distance between synergistic activities is the highest importance.
6.7 6.7 6.7 0.7 0.7 6.7 6.7
2 Operations completion within 3 to 5 years is of highest importance.
6.7 6.7 6.7 6.7 6.7 3.3 2.0
3 Moving out of old and/or temporary space is highly desirable.
4.0 4.0 4.0 4.0 4.0 4.0 2.0
4 Reduced deferred maintenance is highly desirable. 4.0 4.0 4.0 4.0 4.0 2.0 2.0
5 Co-locating related functions is critical to improving site operations.
6.7 6.7 6.7 6.7 6.7 2.0 2.0
6 Class A office space is consistent with standards in the Bay Area for recruitment and retention.
6.7 6.7 6.7 6.7 6.7 3.3 2.0
7 Create a gateway for industrial partnerships. 6.7 2.0 6.7 2.0 3.3 2.0 2.0
8 Lower DOE project success risks. 6.7 2.0 6.7 2.0 3.3 3.3 2.0
9 Lower LCC (NPV). 4.0 2.0 4.0 2.0 4.0 0.4 1.2
10 Near-term cash flow; lower is better. 4.0 1.2 4.0 1.2 4.0 0.4 0.4
11 Ease of making facility modifications in future. 1.3 0.7 0.4 0.7 0.4 0.7 0.7
12 Ease of meeting Freeze the Footprint initiative. 4.0 0.4 4.0 0.4 4.0 1.2 1.2
13 Ease of transition and relocation. 4.0 4.0 4.0 4.0 4.0 2.0 1.2
14 Increased energy efficiency and sustainability. 4.0 4.0 4.0 4.0 4.0 2.0 1.2
15 Ease of providing space for visitors or part-time staff(flexible space).
6.7 6.7 6.7 6.7 6.7 2.0 3.3
16 Ease of standing up different laboratory functional areas in flex space.
1.3 1.3 1.3 1.3 1.3 0.4 0.7
17 Expedient funding availability. 6.7 0.7 6.7 0.7 6.7 3.3 0.7
18 Assuring and overseeing safety 6.7 6.7 3.3 6.7 3.3 6.7 3.3
19 Assuring and overseeing security 2.7 2.7 1.3 2.7 1.3 2.7 1.3
20 Ease of constructing within the existing NEPA envelope. 6.7 6.7 6.7 2.0 2.0 6.7 6.7
100.0 75.6 94.4 64.9 77.1 55.1 42.5
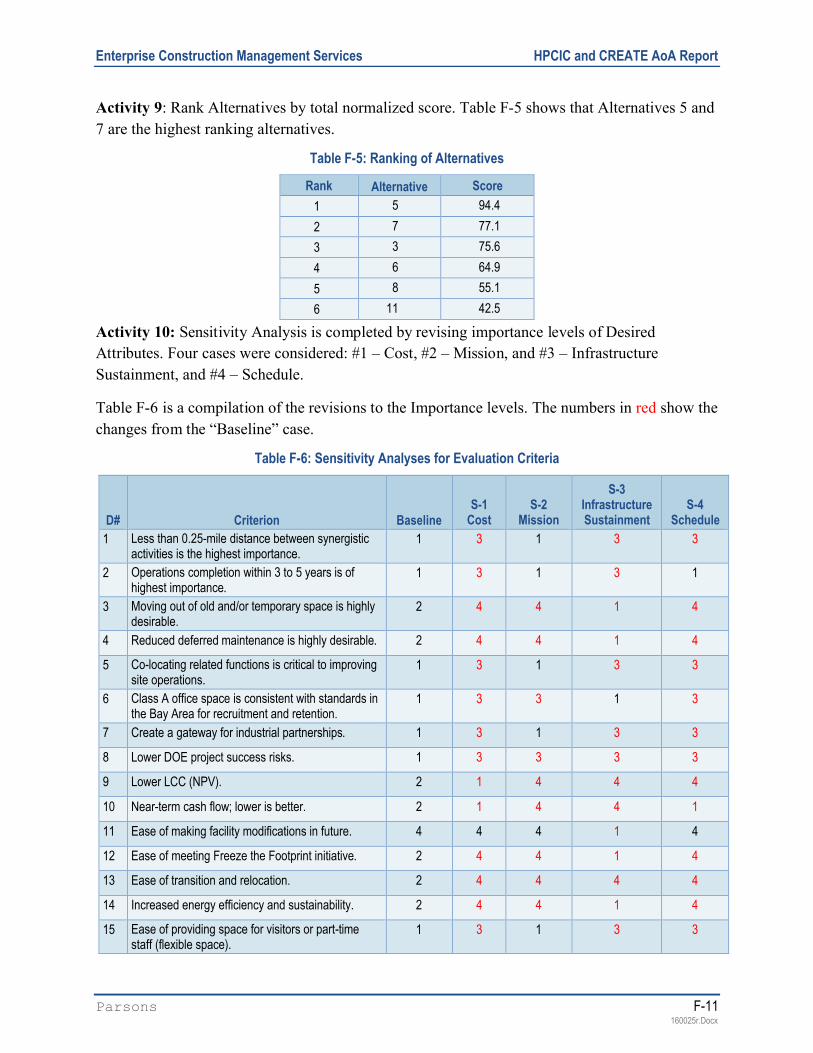
Enterprise Construction Management Services HPCIC and CREATE AoA Report
Parsons F-11160025r.Docx
Activity 9: Rank Alternatives by total normalized score. Table F-5 shows that Alternatives 5 and
7 are the highest ranking alternatives.
Table F-5: Ranking of Alternatives
Rank Alternative Score
1 5 94.4
2 7 77.1
3 3 75.6
4 6 64.9
5 8 55.1
6 11 42.5
Activity 10: Sensitivity Analysis is completed by revising importance levels of Desired
Attributes. Four cases were considered: #1 – Cost, #2 – Mission, and #3 – Infrastructure
Sustainment, and #4 – Schedule.
Table F-6 is a compilation of the revisions to the Importance levels. The numbers in red show the
changes from the “Baseline” case.
Table F-6: Sensitivity Analyses for Evaluation Criteria
D# Criterion BaselineS-1
CostS-2
Mission
S-3Infrastructure Sustainment
S-4Schedule
1 Less than 0.25-mile distance between synergistic activities is the highest importance.
1 3 1 3 3
2 Operations completion within 3 to 5 years is of highest importance.
1 3 1 3 1
3 Moving out of old and/or temporary space is highly desirable.
2 4 4 1 4
4 Reduced deferred maintenance is highly desirable. 2 4 4 1 4
5 Co-locating related functions is critical to improving site operations.
1 3 1 3 3
6 Class A office space is consistent with standards in the Bay Area for recruitment and retention.
1 3 3 1 3
7 Create a gateway for industrial partnerships. 1 3 1 3 3
8 Lower DOE project success risks. 1 3 3 3 3
9 Lower LCC (NPV). 2 1 4 4 4
10 Near-term cash flow; lower is better. 2 1 4 4 1
11 Ease of making facility modifications in future. 4 4 4 1 4
12 Ease of meeting Freeze the Footprint initiative. 2 4 4 1 4
13 Ease of transition and relocation. 2 4 4 4 4
14 Increased energy efficiency and sustainability. 2 4 4 1 4
15 Ease of providing space for visitors or part-time staff (flexible space).
1 3 1 3 3

Enterprise Construction Management Services HPCIC and CREATE AoA Report
Parsons F-12160025r.Docx
D# Criterion BaselineS-1
CostS-2
Mission
S-3Infrastructure Sustainment
S-4Schedule
16 Ease of standing up different laboratory functional areas in flex space.
4 4 4 1 4
17 Expedient funding availability. 1 3 3 3 1
18 Assuring and overseeing safety 1 3 3 3 3
19 Assuring and overseeing security 3 4 4 4 4
20 Ease of constructing within the existing NEPA envelope.
1 3 3 3 3
Sensitivity #1 – Cost: Attributes related to cost were given an importance of 1: All others
were lowered two levels.
Sensitivity #2 – Mission: Attributes related to Mission were given an importance of 1: All
others were lowered two levels.
Sensitivity #3 – Infrastructure Sustainment: Attributes related to Infrastructure Sustainment
were given an importance of 1: All others were lowered two levels.
Sensitivity #4 – Schedule: Attributes related to Schedule were given an importance of 1: All
others were lowered 2 levels.
Sensitivity #5 – Delete Desired Attribute for Risk; Delete Attribute #8.
Sensitivity #6 – Delete Desired Attribute for Near-term Cash Flow; Delete Attribute #9.
Sensitivity #7 – Delete Desired Attribute for NPV; Delete Attribute #10.
Sensitivity #8 – Combine Changes S-5, S-6, and S-7; Delete Attributes #8, #9, and #10.
Sensitivity #9 – Revise Risk Matrix to remove risks possibly duplicative of desired attributes;
Delete Risks #12, #13, #15, #16, and #17.
Activity 11: Compute the weighted score for the revised Importance levels (Activity 8) and
Rank the Alternatives (Activity 9) based on the results of the Sensitivity Analyses. Table F-7
presents the results of these Sensitivity Analyses. Alternative 5, two leased facilities, remains the
highest ranking alternative. Alternatives 3 and 7 swap the second and third rankings for the
mission sensitivity case.
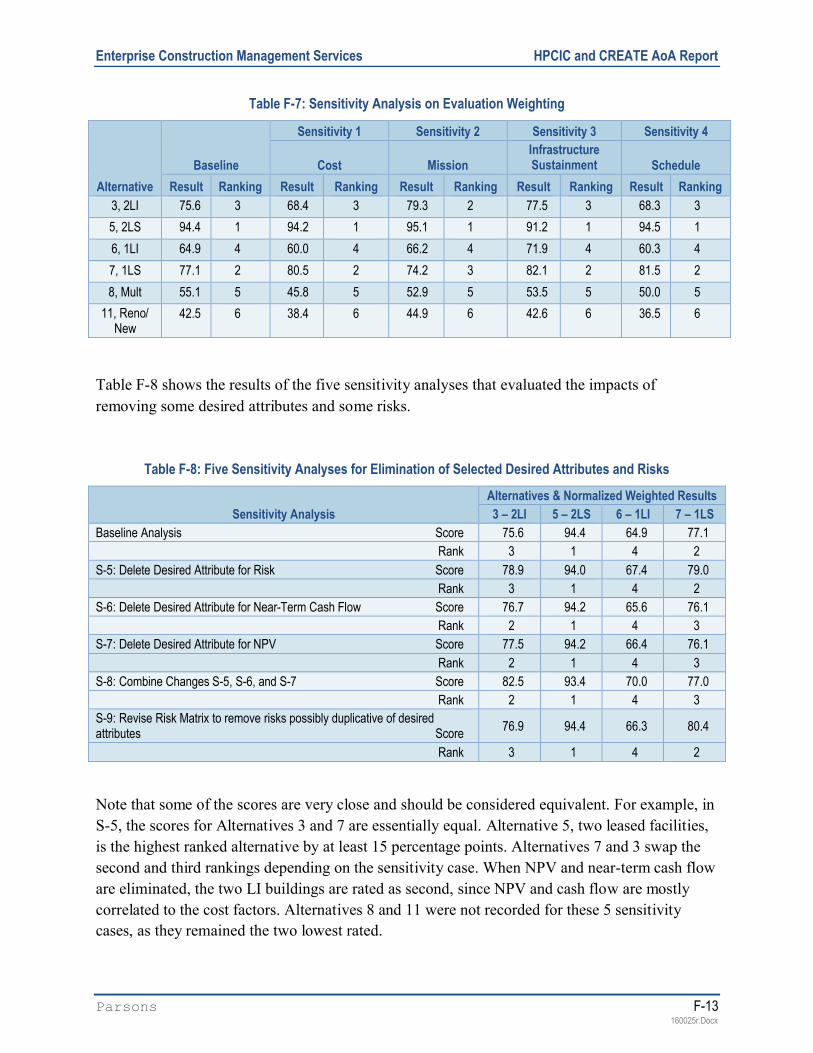
Enterprise Construction Management Services HPCIC and CREATE AoA Report
Parsons F-13160025r.Docx
Table F-7: Sensitivity Analysis on Evaluation Weighting
Alternative
Baseline
Sensitivity 1 Sensitivity 2 Sensitivity 3 Sensitivity 4
Cost MissionInfrastructure Sustainment Schedule
Result Ranking Result Ranking Result Ranking Result Ranking Result Ranking
3, 2LI 75.6 3 68.4 3 79.3 2 77.5 3 68.3 3
5, 2LS 94.4 1 94.2 1 95.1 1 91.2 1 94.5 1
6, 1LI 64.9 4 60.0 4 66.2 4 71.9 4 60.3 4
7, 1LS 77.1 2 80.5 2 74.2 3 82.1 2 81.5 2
8, Mult 55.1 5 45.8 5 52.9 5 53.5 5 50.0 5
11, Reno/ New
42.5 6 38.4 6 44.9 6 42.6 6 36.5 6
Table F-8 shows the results of the five sensitivity analyses that evaluated the impacts of
removing some desired attributes and some risks.
Table F-8: Five Sensitivity Analyses for Elimination of Selected Desired Attributes and Risks
Sensitivity Analysis
Alternatives & Normalized Weighted Results
3 – 2LI 5 – 2LS 6 – 1LI 7 – 1LS
Baseline Analysis Score 75.6 94.4 64.9 77.1
Rank 3 1 4 2
S-5: Delete Desired Attribute for Risk Score 78.9 94.0 67.4 79.0
Rank 3 1 4 2
S-6: Delete Desired Attribute for Near-Term Cash Flow Score 76.7 94.2 65.6 76.1
Rank 2 1 4 3
S-7: Delete Desired Attribute for NPV Score 77.5 94.2 66.4 76.1
Rank 2 1 4 3
S-8: Combine Changes S-5, S-6, and S-7 Score 82.5 93.4 70.0 77.0
Rank 2 1 4 3
S-9: Revise Risk Matrix to remove risks possibly duplicative of desired attributes Score
76.9 94.4 66.3 80.4
Rank 3 1 4 2
Note that some of the scores are very close and should be considered equivalent. For example, in
S-5, the scores for Alternatives 3 and 7 are essentially equal. Alternative 5, two leased facilities,
is the highest ranked alternative by at least 15 percentage points. Alternatives 7 and 3 swap the
second and third rankings depending on the sensitivity case. When NPV and near-term cash flow
are eliminated, the two LI buildings are rated as second, since NPV and cash flow are mostly
correlated to the cost factors. Alternatives 8 and 11 were not recorded for these 5 sensitivity
cases, as they remained the two lowest rated.

Enterprise Construction Management Services HPCIC and CREATE AoA Report
Parsons F-14160025r.Docx
This page intentionally left blank.

Enterprise Construction Management Services HPCIC and CREATE AoA Report
Parsons G-1160025r.Docx
APPENDIX G REFERENCES
1. Mission Need Concept for The Establishment of the Livermore Valley Open Campus,
Capabilities at Lawrence Livermore National Laboratory & Sandia National
Laboratories, California, dated June 2009.
2. Mission Need Statement, Critical Decision 0: Open Collaboration and Research
Capabilities in the Livermore Valley Open Campus for the Lawrence Livermore National
Laboratory and Sandia National Laboratories, January 2013.
3. DOE O 413.3B Department of Energy Program and Project Management for the
Acquisition of Capital Assets.
4. Government Accountability Office, DOE and NNSA Project Management: Analysis of
Alternatives Could Be Improved by Incorporating Best Practices, GAO-15-37, DRAFT,
published December 11, 2014.
5. DOE G 413.3-21 Cost Estimating Guide, May 9, 2011.
6. Livermore Valley Open Campus Master Plan, Final Report, Version 1.2, Flad Architects,
dated November 4, 2010.
7. Open Collaboration and Research Capabilities on the Livermore Valley Open Campus:
Collaboration in Research and Engineering for Advanced Technology and Education
(CREATE) and High Performance Computing Innovation Center (HPCIC), CD-1:
Alternatives Analysis and Business Case, rev. 3, submitted February 2015.
8. Livermore Valley Open Campus Development Options Report, dated September 10,
2010.
9. Government Accountability Office, Cost Estimating and Assessment Guide, GAO 09-
3SP, March 2009.
9. DOE G 413.3-7A, Risk Guide, 1/12/11.

Enterprise Construction Management Services HPCIC and CREATE AoA Report
Parsons G-2160025r.Docx
This page intentionally left blank.