
Analysis of Agonist and Antagonist Effects on Thyroid...
18
Mol. Endocrinol. 2011 25:15-31 originally published online Nov 24, 2010; , doi: 10.1210/me.2010-0202 Palma, P. Webb and I. Polikarpov A. C. M. Figueira, D. M. Saidemberg, P. C. T. Souza, L. Martínez, T. S. Scanlan, J. D. Baxter, M. S. Skaf, M. S. Conformation by Hydrogen/Deuterium Exchange Analysis of Agonist and Antagonist Effects on Thyroid Hormone Receptor Society please go to: http://mend.endojournals.org//subscriptions/ or any of the other journals published by The Endocrine Molecular Endocrinology To subscribe to Copyright © The Endocrine Society. All rights reserved. Print ISSN: 0021-972X. Online
Transcript of Analysis of Agonist and Antagonist Effects on Thyroid...

Mol. Endocrinol. 2011 25:15-31 originally published online Nov 24, 2010; , doi: 10.1210/me.2010-0202
Palma, P. Webb and I. Polikarpov A. C. M. Figueira, D. M. Saidemberg, P. C. T. Souza, L. Martínez, T. S. Scanlan, J. D. Baxter, M. S. Skaf, M. S.
Conformation by Hydrogen/Deuterium Exchange
Analysis of Agonist and Antagonist Effects on Thyroid Hormone Receptor
Society please go to: http://mend.endojournals.org//subscriptions/ or any of the other journals published by The EndocrineMolecular EndocrinologyTo subscribe to
Copyright © The Endocrine Society. All rights reserved. Print ISSN: 0021-972X. Online

Analysis of Agonist and Antagonist Effects onThyroid Hormone Receptor Conformation byHydrogen/Deuterium Exchange
A. C. M. Figueira, D. M. Saidemberg, P. C. T. Souza, L. Martínez, T. S. Scanlan,J. D. Baxter, M. S. Skaf, M. S. Palma, P. Webb, and I. Polikarpov
Laboratorio de Cristalografia de Proteínas (A.C.M.F., I.P.), Instituto de Física de Sao Carlos, Universidadede Sao Paulo, Sao Carlos, SP, Brazil 13560-970; Laboratorio Nacional de Biociencias (A.C.M.F.),Campinas, SP, Brazil 13083-100; Departamento de Biologia (D.M.S., M.S.P.), Centro de Estudos deInsetos Sociais - Instituto de Biocências de Rio Claro, Universidade Estadual Paulista, Rio Claro, SP, Brazil13506-900; Institute of Chemistry (P.C.T.S., L.M., M.S.S.), State University of Campinas, Campinas, SP,Brazil 13083-970; and Department of Physiology and Pharmacology (T.S.S.), Oregon Health and ScienceUniversity, Portland, Oregon; and Diabetes Center and Cancer Research Unit (J.D.B., P.W.), TheMethodist Hospital Research Institute, Houston, Texas 77030
Thyroid hormone receptors (TRs) are ligand-gated transcription factors with critical roles in de-velopment and metabolism. Although x-ray structures of TR ligand-binding domains (LBDs) withagonists are available, comparable structures without ligand (apo-TR) or with antagonists are not.It remains important to understand apo-LBD conformation and the way that it rearranges withligands to develop better TR pharmaceuticals. In this study, we conducted hydrogen/deuteriumexchange on TR LBDs with or without agonist (T3) or antagonist (NH3). Both ligands reducedeuterium incorporation into LBD amide hydrogens, implying tighter overall folding of the do-main. As predicted, mass spectroscopic analysis of individual proteolytic peptides after hydrogen/deuterium exchange reveals that ligand increases the degree of solvent protection of regionsclose to the buried ligand-binding pocket. However, there is also extensive ligand protection ofother regions, including the dimer surface at H10–H11, providing evidence for allosteric commu-nication between the ligand-binding pocket and distant interaction surfaces. Surprisingly, C-terminal activation helix H12, which is known to alter position with ligand, remains relativelyprotected from solvent in all conditions suggesting that it is packed against the LBD irrespectiveof the presence or type of ligand. T3, but not NH3, increases accessibility of the upper part ofH3–H5 to solvent, and we propose that TR H12 interacts with this region in apo-TR and that thisinteraction is blocked by T3 but not NH3. We present data from site-directed mutagenesis experimentsand molecular dynamics simulations that lend support to this structural model of apo-TR and itsligand-dependent conformational changes. (Molecular Endocrinology 25: 15–31, 2011)
NURSA Molecule Pages: Nuclear Receptors: TR� � ER�; Ligands:Thyroid hormone � 4-hydroxyta-moxifen � NH3.
Thyroid hormone receptors (TRs) are physiologicallyimportant transcription factors that belong to the nu-
clear hormone receptor (NR) family and play roles inregulation of cholesterol levels, metabolism and heartfunction in adults (1–4). TRs mediate actions of thyroid
hormones, predominantly T3 (3,5,3� triiodo-L-thyronine)but are transcriptionally active with and without ligandsbecause they bind constitutively to chromatin, often asheterodimers with retinoid X receptors (RXRs). T3 mod-ulates gene transcription by altering the conformation of
ISSN Print 0888-8809 ISSN Online 1944-9917Printed in U.S.A.Copyright © 2011 by The Endocrine Societydoi: 10.1210/me.2010-0202 Received May 25, 2010. Accepted October 14, 2010.First Published Online November 24, 2010
Abbreviations: AF-2, Activation function 2; CG, conjugate gradient; DBD, DNA-bindingdomain; ER, estrogen receptor; H/D, hydrogen/deuterium; LBD, ligand-binding domain;LBP, ligand-binding pocket; MD, molecular dynamics; NR, nuclear receptor; PDB, ProteinData Bank; RMSD, root mean square deviation; RXR, retinoid X receptor; TR, thyroidhormone receptor.
O R I G I N A L R E S E A R C H
Mol Endocrinol, January 2011, 25(1):15–31 mend.endojournals.org 15

the TR ligand-binding domain (LBD), which in turn altersthe complement of TR-associated coregulators (1–4).
It is important to understand how ligands influence TRLBD conformation to develop better pharmaceuticals tomodulate receptor activity (5–8). We, and others, ob-tained x-ray structures of TR LBDs with agonists (4, 6,8–12). These structures, with subsequent similar struc-tures of other NRs, reveal that the LBD adopts a canon-ical three-dimensional fold comprised of 12 conserved�-helices (H) and 4 �-strands (S) (13–18). Hormone oc-cupies a buried ligand-binding pocket (LBP) formed byH5–H6 on the top, by H7 and H11 on one side, and alongthe opposite side by H2, S3 and S4, and H3, being en-closed by a lid formed by the C-terminal part of H11 andH12 (10–18). At present, x-ray structures of unliganded(apo-) TRs or TRs with available antagonists have notbeen reported. Thus, it has not been possible to performdetailed comparisons of TR conformation in active ago-nist-bound and unliganded and inactive states.
One hormone-dependent change in apo-TR conforma-tion has been inferred from mutational analysis of TR andcomparison of liganded TR structures with available x-ray structures of other apo- and antagonist-bound NRLBDs (14–17); agonist promotes packing of C-terminalH12 into an active position against the LBD. This eventcompletes a coactivator binding surface [activation func-tion 2 (AF-2)] that includes surface-exposed hydrophobicresidues from H3 and H5 and partly occluding an over-lapping corepressor binding surface that is also comprisedof residues from H3 and H5 but extends below the usualposition of H12 in the liganded state (15–18). AlthoughH12 must adopt a distinct position that fully exposes thecorepressor binding surface in the absence of ligand, theorganization of H12 in apo-TR is unknown (18).
Hormone induces other rearrangements in the LBD.Analysis of dynamics of several NR LBDs suggests thatthey are disordered without hormone (19, 20). Earlymodels suggested that ligand stabilizes the region near theLBP, with the rest of the domain remaining more orga-nized in the absence of ligand (21–23). Several specificligand-dependent changes have been inferred from muta-tional analysis of TRs. First, in vitro assembly assays in-dicate that H1, which links the LBD to the receptor DNA-binding domain (DBD), packs tightly against the LBD(H2–H11) with agonists (24–26). Second, analysis oftemperature (B) factors in x-ray structures of ligandedTR-LBDs with human resistance to thyroid hormone syn-drome mutations reveals instability in the H1–H3 region(25, 26). Because resistance to thyroid hormone mutantsretain features of apo-TR LBD conformation with ago-nists, it is likely that the H1–H3 region is unstructuredwithout ligand. Last, T3-dependent rearrangements in
surface salt bridge clusters in the H7–H8 region and H11,near the TR dimer surface, stabilize bound T3 and in-hibit apo-TR homodimer formation (24 –26). Pres-ently, however, the true extent and function of confor-mational changes that occur upon hormone binding arenot known.
It is also important to understand structural alterationsthat occur in response to TR antagonists to comprehendthe molecular basis of their action and to provide infor-mation for the structure-directed development of usefulantagonist compounds for treatment of thyrotoxicosisand cardiac arrhythmias (18). We identified the first TRantagonists, based on TR LBD x-ray structures and theknowledge that active H12 conformation is required forcoactivator binding. We reasoned that ligands that resem-ble native hormone with appropriately placed extensionscould compete for agonist but would dislodge H12, in-hibiting coactivator binding and receptor activity (27).Later, x-ray structures of estrogen receptors (ERs) revealthat many antagonists indeed contain bulky extensionsthat displace H12, which packs over the H3–H5 region ofAF-2 (7, 14, 17, 28). Our lead antagonist, NH3, is derivedfrom the synthetic TR� agonist GC-1 and contains a 5�-nitrophenylethynyl extension predicted to dislodge H12(27). NH3 binds TRs with nanomolar affinity, blocks TRLBD interactions with coactivators, and antagonizes T3
responses in cell culture, tadpoles, and rats. More surpris-ingly, NH3 also inhibits TR LBD interactions with core-pressors, and we proposed that the ligand repositionsH12 so that it occludes the coactivator and the corepres-sor binding surfaces (27). This idea is not proven, and theextent to which NH3 alters other aspects of LBD confor-mation is not clear.
Amide hydrogen/deuterium (H/D) exchange can beused to probe protein conformation and dynamics (29–31). In this technique, protein samples are incubated indeuterated (D, heavy) water, and exchange of deuteriumwith protein amide hydrogens (H, light isotope) is de-tected by mass spectroscopic analysis of complete pro-teins or individual proteolytic peptides. Because amidehydrogens must contact solution for deuterium exchangeto occur, the increase in protein/peptide mass after incu-bation in heavy water provides a useful index of solventexposure in different conditions (29–34). Several studiesconfirmed that this technique yields information aboutligand-dependent structural perturbations and dynamicsof different NR (21–23, 32–34), including the full-lengthperoxisome proliferator-activated receptor-RXR het-erodimer (34). Molecular dynamics (MD) simulationscomplement this method, and MD has been used to ex-amine other aspects of LBD dynamic behavior (35–41).Here, we use H/D exchange to probe TR LBD conforma-
16 Figueira et al. Agonist and Antagonist Conformation of TR�1 Mol Endocrinol, January 2011, 25(1):15–31
tion with or without T3 or NH3. This analysis, coupledwith TR LBD x-ray structures, prior knowledge of ligand-dependent conformational rearrangements of the LBD,site-directed mutagenesis experiments, and MD simula-tions, allows us to generate specific hypotheses aboutapo-LBD organization and effects of TR agonists andantagonists on LBD structure.
Results
TR LBD characterizationMass-spectroscopic analysis of humanTR�1 LBD
preparations revealed that the protein is intact and com-posed of dimers and monomers. The average molecularmass of TR�1 LBD monomer (amino acids 209-461) pre-dicted by MS-digest software is 30,049 Da (28,645 Dafrom TR plus 1422 Da from His tag and linker). Mass-spectroscopic analysis of apo-TR�1 LBD preparationsreveals peaks of 60,108.1 � 26.8 Da and 30,039.2 � 19.3Da, which correspond to LBD average molecular mass ofTR dimers and monomers. The proportion of monomersand dimers determined in apo-TR mass-spectroscopicmeasurements, based on the absolute intensity of eachpeak, was approximately 62 and 38% for dimers andmonomers, respectively. The monomer/dimer distribu-tion was consistent with previous studies of the protein bysize exclusion chromatography and native gel electro-phoresis (10, 42). Analysis of TR�1 LBD preparationsliganded to T3 and NH3 reveals that they are also com-prised of a mix of monomers and dimers in similar con-ditions (data not shown).
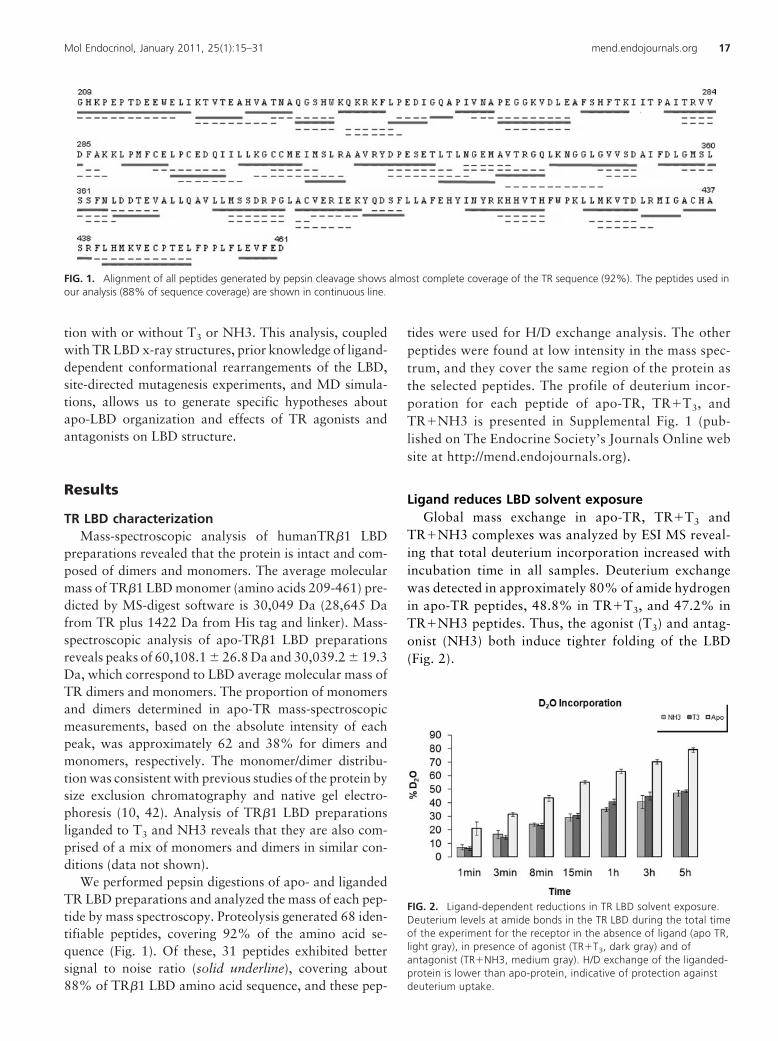
We performed pepsin digestions of apo- and ligandedTR LBD preparations and analyzed the mass of each pep-tide by mass spectroscopy. Proteolysis generated 68 iden-tifiable peptides, covering 92% of the amino acid se-quence (Fig. 1). Of these, 31 peptides exhibited bettersignal to noise ratio (solid underline), covering about88% of TR�1 LBD amino acid sequence, and these pep-
tides were used for H/D exchange analysis. The otherpeptides were found at low intensity in the mass spec-trum, and they cover the same region of the protein asthe selected peptides. The profile of deuterium incor-poration for each peptide of apo-TR, TR�T3, andTR�NH3 is presented in Supplemental Fig. 1 (pub-lished on The Endocrine Society’s Journals Online website at http://mend.endojournals.org).
Ligand reduces LBD solvent exposureGlobal mass exchange in apo-TR, TR�T3 and
TR�NH3 complexes was analyzed by ESI MS reveal-ing that total deuterium incorporation increased withincubation time in all samples. Deuterium exchangewas detected in approximately 80% of amide hydrogenin apo-TR peptides, 48.8% in TR�T3, and 47.2% inTR�NH3 peptides. Thus, the agonist (T3) and antag-onist (NH3) both induce tighter folding of the LBD(Fig. 2).
FIG. 1. Alignment of all peptides generated by pepsin cleavage shows almost complete coverage of the TR sequence (92%). The peptides used inour analysis (88% of sequence coverage) are shown in continuous line.
FIG. 2. Ligand-dependent reductions in TR LBD solvent exposure.Deuterium levels at amide bonds in the TR LBD during the total timeof the experiment for the receptor in the absence of ligand (apo TR,light gray), in presence of agonist (TR�T3, dark gray) and ofantagonist (TR�NH3, medium gray). H/D exchange of the liganded-protein is lower than apo-protein, indicative of protection againstdeuterium uptake.
Mol Endocrinol, January 2011, 25(1):15–31 mend.endojournals.org 17

Apo-TR LBD conformationWe analyzed deuterium incorporation into individual
apo-TR LBD proteolytic peptides as a function of timeand projected positions of each peptide onto x-ray struc-tural models of T3-TR LBDs. Analysis of effects of short(1 min) heavy water incubation implies that the apo-LBDis well folded (Fig. 3A). Some apo-LBD peptides wereonly weakly deuterated, even after long D2O incubationtimes, as shown by blue color (�15% D incorporation) inthe structure projection in Fig. 4A.
Analysis of positions of peptides and the extent of deu-teration suggests that apo-LBD conformation resemblesagonist-bound LBD (Fig. 3A). Peptides with amino acidsthat are predicted to form the folded core of the domain(H1, H2, H6, H9, and H10, and �-strands S2 and S3)exhibit low deuterium incorporation (blue). By contrast,peptides with amino acids that lie on the surface of thedomain exhibit intermediate or high levels of deuteriumincorporation (green and yellow, 15–50%, H3, H5, andthe center of H11; orange and red, �50%, the H1 C
FIG. 3. Deuterium incorporation into individual TR-LBD peptides varies with ligand. Deuterium uptake at each time point (t1 to t8 - 1, 3, 8, 15,60, 180, 300 and 480 min, respectively) for apo-TR, TR�T3 and TR�NH3 is shown, respectively, in A, B and C. The rates of deuterium uptake arecolor-coded: red shows an uptake over 75%; orange, from 74 to 50%; yellow, from 49 to 40%, dark green, from 39 to 25%, light green, from24 to 15%; blue, below 14%. The secondary structure was determined by DSSP software program. �-helices are given as �1 - �12, and �-strandsare termed as �1 - �4. The last line represents the hydrophobicity of each residue, plotted by Texshade software. The first two residues in eachpeptide are not colored because they do not participate in H/D exchange (31).
18 Figueira et al. Agonist and Antagonist Conformation of TR�1 Mol Endocrinol, January 2011, 25(1):15–31

terminus, S1, H4, and H8). Surprisingly, three parts of thepredicted protein surface appear well protected from sol-vent; the N-terminal H0/H1 region, part of H3 in theAF-2 surface (amino acids 280-286), and the region thatencompasses the loop between H11 and C-terminal acti-vation H12 and H12 itself.
Deuterium incorporation into apo-TR peptides gen-erally increased as a function of time (note progressionof color from blue through green, yellow and orange tored in Fig. 3A). The most striking changes (�15% deu-terium incorporation after 1 min to �85% deuteriumincorporation after 5 h) involved the dimer surface (Cterminus of H10 and the N terminus of H11) and the
H5–H6 region. Thus, both regions of protein are ini-tially protected from solvent but undergo motions thatbring them into contact with solution during the in-cubation. Interestingly, H12 exhibited only moder-ate deuterium incorporation during the experiment(�15%, blue, to �49%, yellow), implying that it is nothighly solvent exposed. Four TR segments remainedcompletely protected (blue) throughout the experi-ment: the N-terminal part of H1 (amino acids 209-221); �-strands S2 and S3; the C-terminal part of H3(amino acids 280-286); and a fragment from the C-terminal part of H11 and the loop between H11 andH12 (amino acids 434-450).
FIG. 3. Continued.
Mol Endocrinol, January 2011, 25(1):15–31 mend.endojournals.org 19

Together, our results suggest that apo-TR is well struc-tured and that its fold resembles that of liganded LBD. Inaddition, the fact that most TR peptides are, at least,partly accessible to deuterium exchange during 5-h incu-bations implies that apo-LBD is relatively dynamic.
T3-TR conformationMeasurement of deuterium exchange into TR-T3 com-
plex proteolytic peptides supports the conclusion that li-gand induces a more compact configuration than apo-LBD (Figs. 3B and 4B). Whereas deuterium incorporationinto apo-TR approached 100% after 5 h for some pep-tides (Table 1), rates of deuterium incorporation intoT3-TR peptides reached only 67%, at best, and were usu-
ally lower (Table 1 and Fig. 3B). Nearly all peptides from theTR-T3 complex were poorly accessible after 1 min heavywater incubations (�15% incorporation, blue) (Fig. 3B andTable 1). At this time, only H4, the S2/S3 �-sheet region, andH8 exhibited intermediate levels of deuterium incorporation(15–49%). Most regions of TR remained inaccessible (blue)during longer incubations or exhibited only intermediatelevels of deuterium incorporation (15 – 40%, green)(Table 1 and Fig. 3B). Exceptions were peptides in theloop between S1 and H3, the upper part of H3, H4, theS3/S4 region, H8, and the center of H11, which allexhibited more than 40% deuterium exchange.
Projection of peptides that exhibit increased solventprotection in the presence of T3 vs. apo-TR onto struc-
FIG. 3. Continued.
20 Figueira et al. Agonist and Antagonist Conformation of TR�1 Mol Endocrinol, January 2011, 25(1):15–31
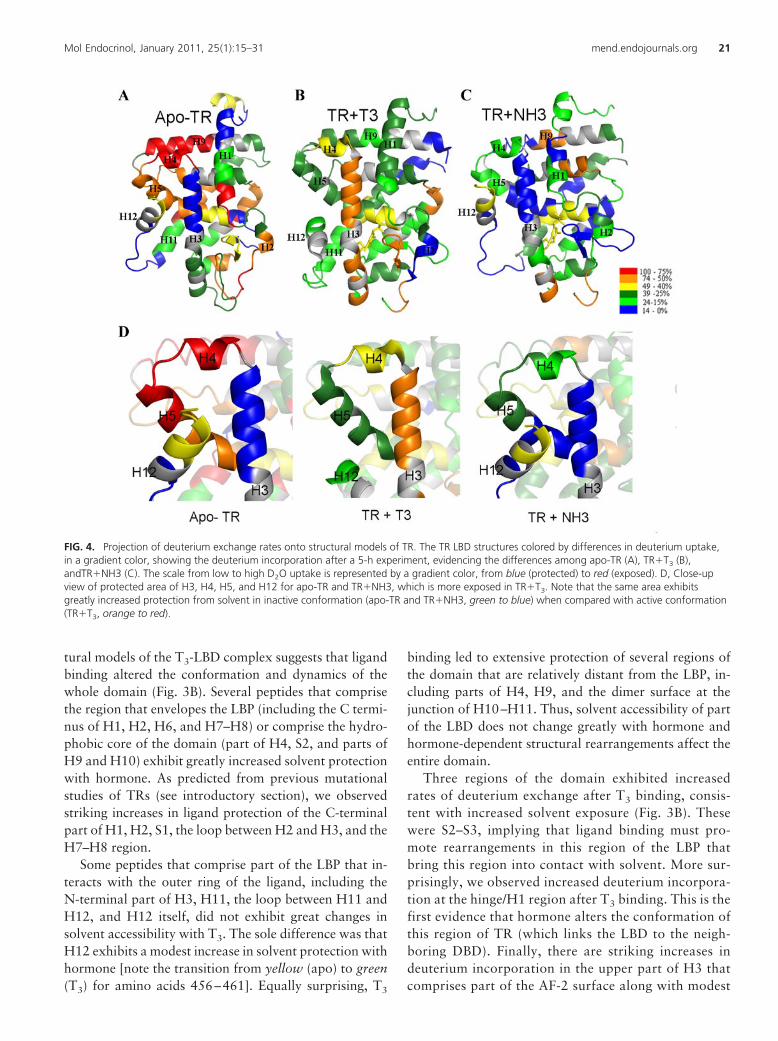
tural models of the T3-LBD complex suggests that ligandbinding altered the conformation and dynamics of thewhole domain (Fig. 3B). Several peptides that comprisethe region that envelopes the LBP (including the C termi-nus of H1, H2, H6, and H7–H8) or comprise the hydro-phobic core of the domain (part of H4, S2, and parts ofH9 and H10) exhibit greatly increased solvent protectionwith hormone. As predicted from previous mutationalstudies of TRs (see introductory section), we observedstriking increases in ligand protection of the C-terminalpart of H1, H2, S1, the loop between H2 and H3, and theH7–H8 region.
Some peptides that comprise part of the LBP that in-teracts with the outer ring of the ligand, including theN-terminal part of H3, H11, the loop between H11 andH12, and H12 itself, did not exhibit great changes insolvent accessibility with T3. The sole difference was thatH12 exhibits a modest increase in solvent protection withhormone [note the transition from yellow (apo) to green(T3) for amino acids 456–461]. Equally surprising, T3
binding led to extensive protection of several regions ofthe domain that are relatively distant from the LBP, in-cluding parts of H4, H9, and the dimer surface at thejunction of H10–H11. Thus, solvent accessibility of partof the LBD does not change greatly with hormone andhormone-dependent structural rearrangements affect theentire domain.
Three regions of the domain exhibited increasedrates of deuterium exchange after T3 binding, consis-tent with increased solvent exposure (Fig. 3B). Thesewere S2–S3, implying that ligand binding must pro-mote rearrangements in this region of the LBP thatbring this region into contact with solvent. More sur-prisingly, we observed increased deuterium incorpora-tion at the hinge/H1 region after T3 binding. This is thefirst evidence that hormone alters the conformation ofthis region of TR (which links the LBD to the neigh-boring DBD). Finally, there are striking increases indeuterium incorporation in the upper part of H3 thatcomprises part of the AF-2 surface along with modest
FIG. 4. Projection of deuterium exchange rates onto structural models of TR. The TR LBD structures colored by differences in deuterium uptake,in a gradient color, showing the deuterium incorporation after a 5-h experiment, evidencing the differences among apo-TR (A), TR�T3 (B),andTR�NH3 (C). The scale from low to high D2O uptake is represented by a gradient color, from blue (protected) to red (exposed). D, Close-upview of protected area of H3, H4, H5, and H12 for apo-TR and TR�NH3, which is more exposed in TR�T3. Note that the same area exhibitsgreatly increased protection from solvent in inactive conformation (apo-TR and TR�NH3, green to blue) when compared with active conformation(TR�T3, orange to red).
Mol Endocrinol, January 2011, 25(1):15–31 mend.endojournals.org 21
increases in deuterium incorporation in the neighbor-ing H4 region relative to apo-TR. Thus, hormone bind-ing must expose the upper part of AF-2 to solvent (seeDiscussion).
NH3-TR conformationAs seen with T3-TR, the NH3-TR complex appeared
more tightly packed than apo-TR. H/D exchange rates forindividual peptides reached only 60% (down from 100%without ligand; Fig. 3C and Table 1). Most peptides ex-hibited low levels of deuterium incorporation (blue) dur-ing short heavy water incubations and reached interme-
diate levels (green) only after extended incubation, as seenwith T3.
Projection of positions of peptides that exhibited in-creased protection from solvent in the presence of NH3onto the TR-T3 structural model revealed strong similar-ities between effects of both ligands on TR conformation.We observed 1) concerted protection in regions of the LBPthat envelop the charged ligand carboxylate group andinner ring, especially the region between H1 and H3, theN terminus of H7, and the C terminus of H8; 2) fewalterations in solvent accessibility in the region of the LBPthat envelops the outer ring and 5�-phenyl ring extension
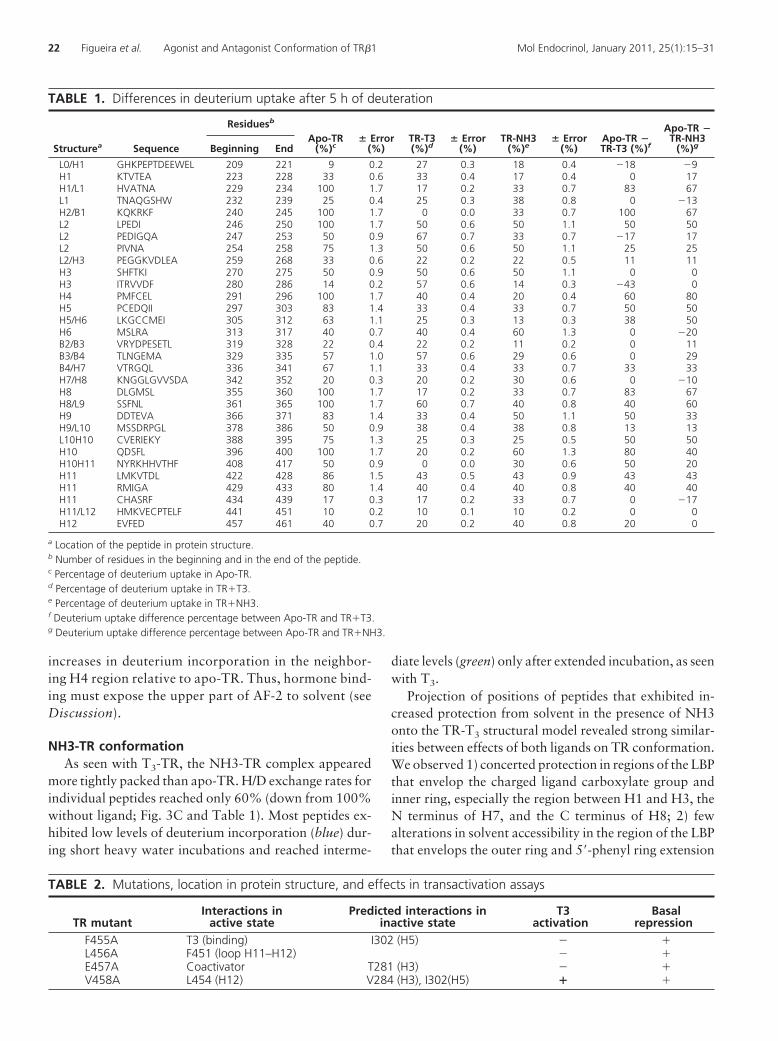
TABLE 2. Mutations, location in protein structure, and effects in transactivation assays
TR mutantInteractions in
active statePredicted interactions in
inactive stateT3
activationBasal
repressionF455A T3 (binding) I302 (H5) � �L456A F451 (loop H11–H12) � �E457A Coactivator T281 (H3) � �V458A L454 (H12) V284 (H3), I302(H5) � �
TABLE 1. Differences in deuterium uptake after 5 h of deuteration
Structurea Sequence
Residuesb
Apo-TR(%)c
� Error(%)
TR-T3(%)d
� Error(%)
TR-NH3(%)e
� Error(%)
Apo-TR �TR-T3 (%)f
Apo-TR �TR-NH3
(%)gBeginning End
L0/H1 GHKPEPTDEEWEL 209 221 9 0.2 27 0.3 18 0.4 �18 �9H1 KTVTEA 223 228 33 0.6 33 0.4 17 0.4 0 17H1/L1 HVATNA 229 234 100 1.7 17 0.2 33 0.7 83 67L1 TNAQGSHW 232 239 25 0.4 25 0.3 38 0.8 0 �13H2/B1 KQKRKF 240 245 100 1.7 0 0.0 33 0.7 100 67L2 LPEDI 246 250 100 1.7 50 0.6 50 1.1 50 50L2 PEDIGQA 247 253 50 0.9 67 0.7 33 0.7 �17 17L2 PIVNA 254 258 75 1.3 50 0.6 50 1.1 25 25L2/H3 PEGGKVDLEA 259 268 33 0.6 22 0.2 22 0.5 11 11H3 SHFTKI 270 275 50 0.9 50 0.6 50 1.1 0 0H3 ITRVVDF 280 286 14 0.2 57 0.6 14 0.3 �43 0H4 PMFCEL 291 296 100 1.7 40 0.4 20 0.4 60 80H5 PCEDQII 297 303 83 1.4 33 0.4 33 0.7 50 50H5/H6 LKGCCMEI 305 312 63 1.1 25 0.3 13 0.3 38 50H6 MSLRA 313 317 40 0.7 40 0.4 60 1.3 0 �20B2/B3 VRYDPESETL 319 328 22 0.4 22 0.2 11 0.2 0 11B3/B4 TLNGEMA 329 335 57 1.0 57 0.6 29 0.6 0 29B4/H7 VTRGQL 336 341 67 1.1 33 0.4 33 0.7 33 33H7/H8 KNGGLGVVSDA 342 352 20 0.3 20 0.2 30 0.6 0 �10H8 DLGMSL 355 360 100 1.7 17 0.2 33 0.7 83 67H8/L9 SSFNL 361 365 100 1.7 60 0.7 40 0.8 40 60H9 DDTEVA 366 371 83 1.4 33 0.4 50 1.1 50 33H9/L10 MSSDRPGL 378 386 50 0.9 38 0.4 38 0.8 13 13L10H10 CVERIEKY 388 395 75 1.3 25 0.3 25 0.5 50 50H10 QDSFL 396 400 100 1.7 20 0.2 60 1.3 80 40H10H11 NYRKHHVTHF 408 417 50 0.9 0 0.0 30 0.6 50 20H11 LMKVTDL 422 428 86 1.5 43 0.5 43 0.9 43 43H11 RMIGA 429 433 80 1.4 40 0.4 40 0.8 40 40H11 CHASRF 434 439 17 0.3 17 0.2 33 0.7 0 �17H11/L12 HMKVECPTELF 441 451 10 0.2 10 0.1 10 0.2 0 0H12 EVFED 457 461 40 0.7 20 0.2 40 0.8 20 0
a Location of the peptide in protein structure.b Number of residues in the beginning and in the end of the peptide.c Percentage of deuterium uptake in Apo-TR.d Percentage of deuterium uptake in TR�T3.e Percentage of deuterium uptake in TR�NH3.f Deuterium uptake difference percentage between Apo-TR and TR�T3.g Deuterium uptake difference percentage between Apo-TR and TR�NH3.
22 Figueira et al. Agonist and Antagonist Conformation of TR�1 Mol Endocrinol, January 2011, 25(1):15–31

of the ligand, the N terminus of H3, H11, the loop be-tween H11-H12 and H12; 3) marked increases in solventprotection of several regions of protein that are distantfrom the LBP, including H9 and H11; 4) increased solventexposure of H0/H1 with ligand.
Several regions of the TR protein did exhibit differ-ences in deuterium exchange rates with NH3 vs. T3 (Ta-ble 1). Most strikingly, the C-terminal part of H3 (aminoacids 279-285) appeared well protected from solvent inthe presence of NH3 but not T3. There were also modestincreases in protection in the nearby H4 region (aminoacids 290-295) with NH3 vs. T3. These regions were alsowell protected from solvent in apo-TR, suggesting thatNH3-TR conformation resembles apo-TR conformationat this location. NH3 also gave better protection of sev-eral regions near to the LBP relative to T3, including thecenter of H1, the loop between H2 and H3, the N termi-nus of H6 and S2–S4. Conversely, there was increasedsolvent exposure of the C terminus of H6 (amino acids313-317) and the C terminus of H11 with NH3 relative toT3. These variations probably reflect differences in bind-ing mode of the two ligands (see Discussion). Finally,there were differences in regions that are relatively distantfrom the LBP; NH3 increased solvent protection of H10relative to apo-TR, but the degree of protection was lessthan with T3. This implies differences in dimer surfaceconfiguration with T3 vs. NH3.
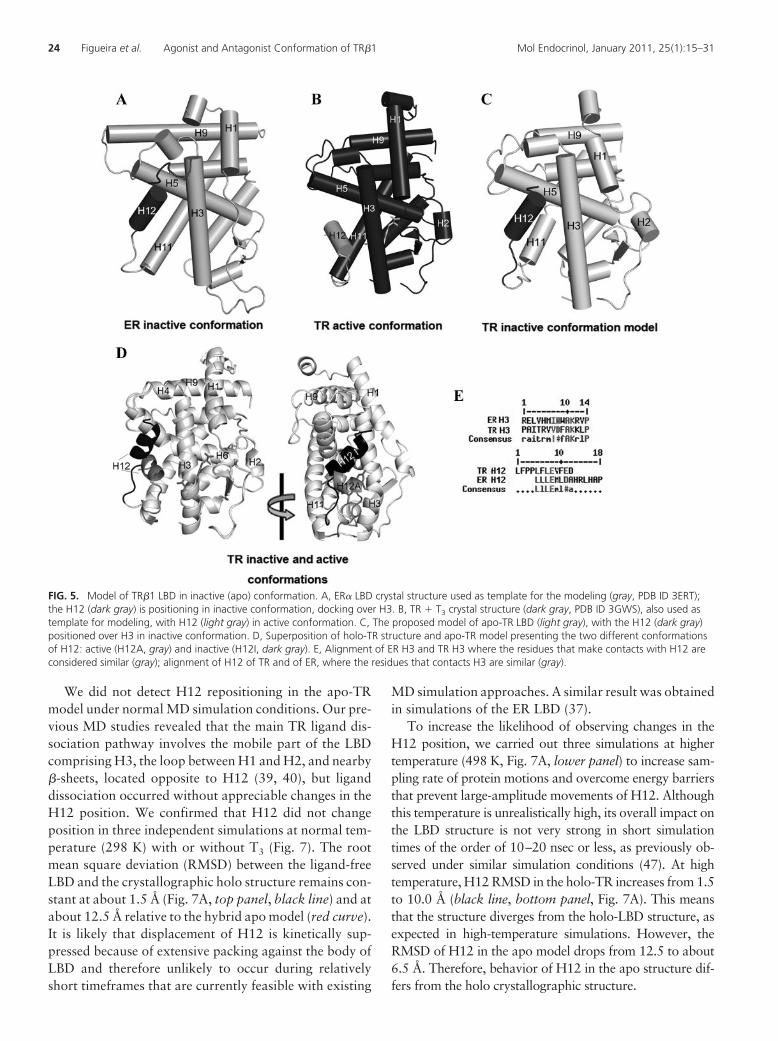
Model of TR�1 LBD in inactive conformationsuggests that H12 docks over H3
Differences between deuteration rates obtained withdifferent TR complexes in the H3–H5 region are shown inFig. 4 (A–C). Comparison of deuteration in apo-TR andT3-TR complexes or NH3-TR and T3-TR complexes (Fig.4D) highlight the fact that there is increased protection ofthe upper part of H3 in the absence of ligand or the pres-ence of the antagonist.
Because NR H12 docks over the H3–H5 region in thepresence of some antagonists (14, 18, 28, 42, 43), weasked whether similar interactions could account for T3-dependent increases in solvent accessibility of the C-ter-minal part of H3. We created hybrid structural modelsconsisting of the H0 to H11 of TR LBD�T3 [Protein DataBank (PDB) ID 3GWS] (10) and H12 from an ER�-an-tagonist structure with an inactive H12 conformation(the ER-hydroxytamoxifen complex (PDB ID 3ERT) (43)(Fig. 5, A and B). This model shows that H12 binds to thesame part of TR H3 that exhibits increased solvent expo-sure with T3 (Fig. 5, C and D); this corresponds to theupper part of the coactivator/corepressor binding surface.Alignment of TR and ER sequences reveals only 23.7%identity and 58% similarity between LBDs and betweenthe two regions that interact in our apo-TR model, the
C-terminal portion of H3, and center of H12 (not shown).Nevertheless, specific residues from TR and ER H3 andH12 that are predicted to interact are conserved (Fig. 5E).
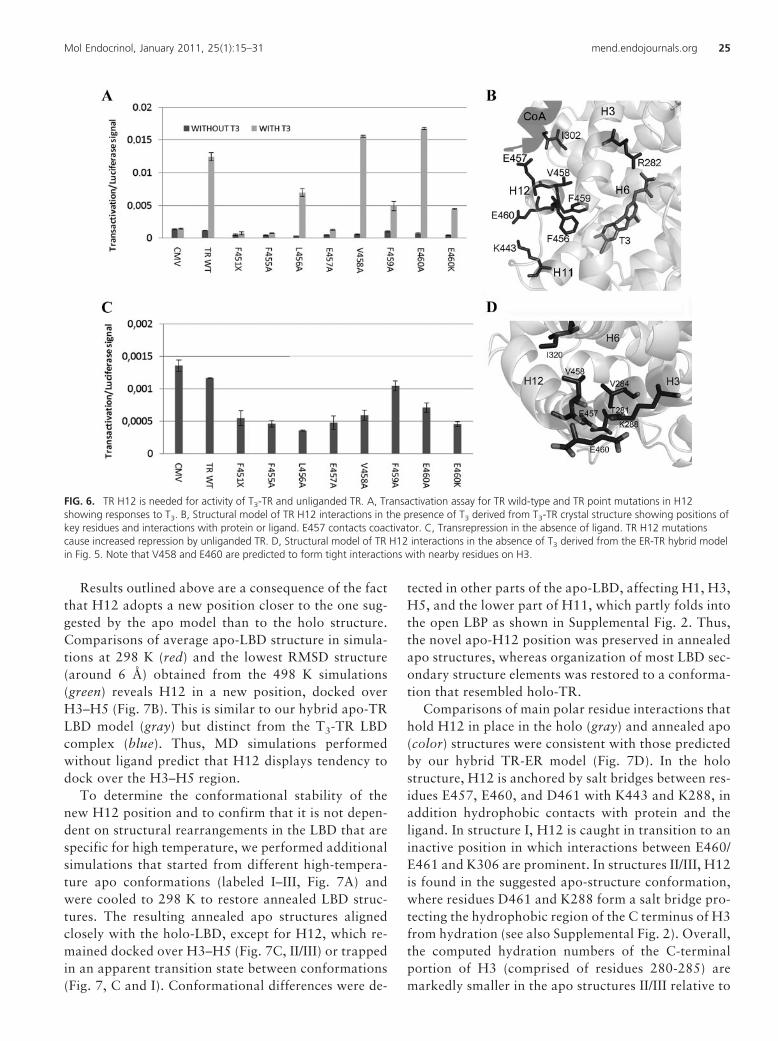
Because the TR-ER hybrid model predicts that TRH12 is required for optimal T3 response and masking ofthe corepressor binding surface at H3–H5, we mutatedTR� H12 and tested activity of mutant TRs in transacti-vation assays with or without T3 (Fig. 6 and Table 2). Asexpected, the deletion mutant F451X (which removesH12) eliminated the T3 response at a standard T3-induc-ible reporter (Fig. 6A). Ala substitutions at F455, L456,E457, and F459 reduced or eliminated the T3 response,whereas similar mutations at V458 and E460 modestlyincreased activity. This is consistent with the knownstructure of the T3-TR complex and previous functionalanalysis (Fig. 6B); residues that are required for the T3 re-sponse contact the hormone (F455 and F459), play a role inpacking of H12 against H3–H5 (L456), or contact coacti-vator (E457), whereas residues that are dispensable forthe T3 response (V458 and E460) are partly or com-pletely solvent exposed and make only weak side-chaincontacts with nearby residues (I302 on H5 and K443 inH11, respectively).
The same mutations exhibited different effects on un-liganded TRs. TR�451X showed increased transrepres-sion relative to unliganded wild-type TR (Fig. 6C), con-sistent with the idea that the corepressor binding surfaceis fully exposed and that TR H12 masks the corepressorbinding surface in vivo in the absence of ligand (18, 44–46). More surprisingly, TR H12 mutations, includingTR�V458A and E460A mutations that showed increasedT3 response, exhibited a similar phenotype in the absenceof ligand. Our TR-ER hybrid model (Fig. 6D) predictsthat H12 is buried in the cleft between H3 and H5, withH12 residues in contact with the floor of the cleft (L456,E457, and F459) or side chains of amino acids that sur-round the cleft (V458 and E460). Thus, multiple H12amino acids are required to suppress transrepression ca-pacity of unliganded TR, and we suggest that this require-ment is consistent with the model in Fig. 5, which predictsthat multiple H12 amino acids participate in interactionswith the H3–H5 hydrophobic cleft.
MD simulations support the new apo-TRstructure model
Our structural model for apo-TR illustrates one possi-ble H12 conformation that explains experimental resultsfrom H/D exchange. To explore the likelihood that H12will adopt this position without ligand, we performed aseries of MD simulations, starting from the active confor-mation of the TR LBD, but with ligand removed.
Mol Endocrinol, January 2011, 25(1):15–31 mend.endojournals.org 23
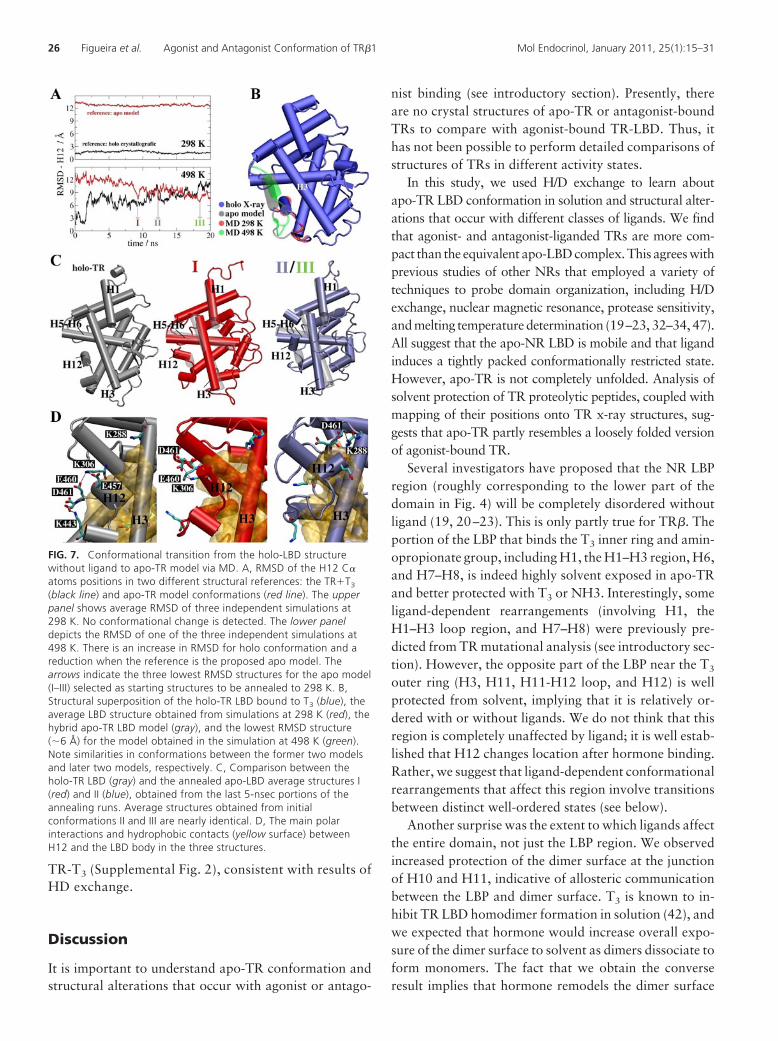
We did not detect H12 repositioning in the apo-TRmodel under normal MD simulation conditions. Our pre-vious MD studies revealed that the main TR ligand dis-sociation pathway involves the mobile part of the LBDcomprising H3, the loop between H1 and H2, and nearby�-sheets, located opposite to H12 (39, 40), but liganddissociation occurred without appreciable changes in theH12 position. We confirmed that H12 did not changeposition in three independent simulations at normal tem-perature (298 K) with or without T3 (Fig. 7). The rootmean square deviation (RMSD) between the ligand-freeLBD and the crystallographic holo structure remains con-stant at about 1.5 Å (Fig. 7A, top panel, black line) and atabout 12.5 Å relative to the hybrid apo model (red curve).It is likely that displacement of H12 is kinetically sup-pressed because of extensive packing against the body ofLBD and therefore unlikely to occur during relativelyshort timeframes that are currently feasible with existing
MD simulation approaches. A similar result was obtainedin simulations of the ER LBD (37).
To increase the likelihood of observing changes in theH12 position, we carried out three simulations at highertemperature (498 K, Fig. 7A, lower panel) to increase sam-pling rate of protein motions and overcome energy barriersthat prevent large-amplitude movements of H12. Althoughthis temperature is unrealistically high, its overall impact onthe LBD structure is not very strong in short simulationtimes of the order of 10–20 nsec or less, as previously ob-served under similar simulation conditions (47). At hightemperature, H12 RMSD in the holo-TR increases from 1.5to 10.0 Å (black line, bottom panel, Fig. 7A). This meansthat the structure diverges from the holo-LBD structure, asexpected in high-temperature simulations. However, theRMSD of H12 in the apo model drops from 12.5 to about6.5 Å. Therefore, behavior of H12 in the apo structure dif-fers from the holo crystallographic structure.
FIG. 5. Model of TR�1 LBD in inactive (apo) conformation. A, ER� LBD crystal structure used as template for the modeling (gray, PDB ID 3ERT);the H12 (dark gray) is positioning in inactive conformation, docking over H3. B, TR � T3 crystal structure (dark gray, PDB ID 3GWS), also used astemplate for modeling, with H12 (light gray) in active conformation. C, The proposed model of apo-TR LBD (light gray), with the H12 (dark gray)positioned over H3 in inactive conformation. D, Superposition of holo-TR structure and apo-TR model presenting the two different conformationsof H12: active (H12A, gray) and inactive (H12I, dark gray). E, Alignment of ER H3 and TR H3 where the residues that make contacts with H12 areconsidered similar (gray); alignment of H12 of TR and of ER, where the residues that contacts H3 are similar (gray).
24 Figueira et al. Agonist and Antagonist Conformation of TR�1 Mol Endocrinol, January 2011, 25(1):15–31
Results outlined above are a consequence of the factthat H12 adopts a new position closer to the one sug-gested by the apo model than to the holo structure.Comparisons of average apo-LBD structure in simula-tions at 298 K (red) and the lowest RMSD structure(around 6 Å) obtained from the 498 K simulations(green) reveals H12 in a new position, docked overH3–H5 (Fig. 7B). This is similar to our hybrid apo-TRLBD model (gray) but distinct from the T3-TR LBDcomplex (blue). Thus, MD simulations performedwithout ligand predict that H12 displays tendency todock over the H3–H5 region.
To determine the conformational stability of thenew H12 position and to confirm that it is not depen-dent on structural rearrangements in the LBD that arespecific for high temperature, we performed additionalsimulations that started from different high-tempera-ture apo conformations (labeled I–III, Fig. 7A) andwere cooled to 298 K to restore annealed LBD struc-tures. The resulting annealed apo structures alignedclosely with the holo-LBD, except for H12, which re-mained docked over H3–H5 (Fig. 7C, II/III) or trappedin an apparent transition state between conformations(Fig. 7, C and I). Conformational differences were de-
tected in other parts of the apo-LBD, affecting H1, H3,H5, and the lower part of H11, which partly folds intothe open LBP as shown in Supplemental Fig. 2. Thus,the novel apo-H12 position was preserved in annealedapo structures, whereas organization of most LBD sec-ondary structure elements was restored to a conforma-tion that resembled holo-TR.
Comparisons of main polar residue interactions thathold H12 in place in the holo (gray) and annealed apo(color) structures were consistent with those predictedby our hybrid TR-ER model (Fig. 7D). In the holostructure, H12 is anchored by salt bridges between res-idues E457, E460, and D461 with K443 and K288, inaddition hydrophobic contacts with protein and theligand. In structure I, H12 is caught in transition to aninactive position in which interactions between E460/E461 and K306 are prominent. In structures II/III, H12is found in the suggested apo-structure conformation,where residues D461 and K288 form a salt bridge pro-tecting the hydrophobic region of the C terminus of H3from hydration (see also Supplemental Fig. 2). Overall,the computed hydration numbers of the C-terminalportion of H3 (comprised of residues 280-285) aremarkedly smaller in the apo structures II/III relative to
FIG. 6. TR H12 is needed for activity of T3-TR and unliganded TR. A, Transactivation assay for TR wild-type and TR point mutations in H12showing responses to T3. B, Structural model of TR H12 interactions in the presence of T3 derived from T3-TR crystal structure showing positions ofkey residues and interactions with protein or ligand. E457 contacts coactivator. C, Transrepression in the absence of ligand. TR H12 mutationscause increased repression by unliganded TR. D, Structural model of TR H12 interactions in the absence of T3 derived from the ER-TR hybrid modelin Fig. 5. Note that V458 and E460 are predicted to form tight interactions with nearby residues on H3.
Mol Endocrinol, January 2011, 25(1):15–31 mend.endojournals.org 25
TR-T3 (Supplemental Fig. 2), consistent with results ofHD exchange.
Discussion
It is important to understand apo-TR conformation andstructural alterations that occur with agonist or antago-
nist binding (see introductory section). Presently, thereare no crystal structures of apo-TR or antagonist-boundTRs to compare with agonist-bound TR-LBD. Thus, ithas not been possible to perform detailed comparisons ofstructures of TRs in different activity states.
In this study, we used H/D exchange to learn aboutapo-TR LBD conformation in solution and structural alter-ations that occur with different classes of ligands. We findthat agonist- and antagonist-liganded TRs are more com-pact than the equivalent apo-LBD complex. This agrees withprevious studies of other NRs that employed a variety oftechniques to probe domain organization, including H/Dexchange, nuclear magnetic resonance, protease sensitivity,and melting temperature determination (19–23, 32–34, 47).All suggest that the apo-NR LBD is mobile and that ligandinduces a tightly packed conformationally restricted state.However, apo-TR is not completely unfolded. Analysis ofsolvent protection of TR proteolytic peptides, coupled withmapping of their positions onto TR x-ray structures, sug-gests that apo-TR partly resembles a loosely folded versionof agonist-bound TR.
Several investigators have proposed that the NR LBPregion (roughly corresponding to the lower part of thedomain in Fig. 4) will be completely disordered withoutligand (19, 20–23). This is only partly true for TR�. Theportion of the LBP that binds the T3 inner ring and amin-opropionate group, including H1, the H1–H3 region, H6,and H7–H8, is indeed highly solvent exposed in apo-TRand better protected with T3 or NH3. Interestingly, someligand-dependent rearrangements (involving H1, theH1–H3 loop region, and H7–H8) were previously pre-dicted from TR mutational analysis (see introductory sec-tion). However, the opposite part of the LBP near the T3
outer ring (H3, H11, H11-H12 loop, and H12) is wellprotected from solvent, implying that it is relatively or-dered with or without ligands. We do not think that thisregion is completely unaffected by ligand; it is well estab-lished that H12 changes location after hormone binding.Rather, we suggest that ligand-dependent conformationalrearrangements that affect this region involve transitionsbetween distinct well-ordered states (see below).
Another surprise was the extent to which ligands affectthe entire domain, not just the LBP region. We observedincreased protection of the dimer surface at the junctionof H10 and H11, indicative of allosteric communicationbetween the LBP and dimer surface. T3 is known to in-hibit TR LBD homodimer formation in solution (42), andwe expected that hormone would increase overall expo-sure of the dimer surface to solvent as dimers dissociate toform monomers. The fact that we obtain the converseresult implies that hormone remodels the dimer surface
FIG. 7. Conformational transition from the holo-LBD structurewithout ligand to apo-TR model via MD. A, RMSD of the H12 C�atoms positions in two different structural references: the TR�T3
(black line) and apo-TR model conformations (red line). The upperpanel shows average RMSD of three independent simulations at298 K. No conformational change is detected. The lower paneldepicts the RMSD of one of the three independent simulations at498 K. There is an increase in RMSD for holo conformation and areduction when the reference is the proposed apo model. Thearrows indicate the three lowest RMSD structures for the apo model(I–III) selected as starting structures to be annealed to 298 K. B,Structural superposition of the holo-TR LBD bound to T3 (blue), theaverage LBD structure obtained from simulations at 298 K (red), thehybrid apo-TR LBD model (gray), and the lowest RMSD structure(�6 Å) for the model obtained in the simulation at 498 K (green).Note similarities in conformations between the former two modelsand later two models, respectively. C, Comparison between theholo-TR LBD (gray) and the annealed apo-LBD average structures I(red) and II (blue), obtained from the last 5-nsec portions of theannealing runs. Average structures obtained from initialconformations II and III are nearly identical. D, The main polarinteractions and hydrophobic contacts (yellow surface) betweenH12 and the LBD body in the three structures.
26 Figueira et al. Agonist and Antagonist Conformation of TR�1 Mol Endocrinol, January 2011, 25(1):15–31
itself and that tight packing of this region of protein isincompatible with homodimer formation.
Additional ligand-dependent increases in solvent pro-tection involve H4 and H9. We have not uncovered afunction for this region of TR, but the analogous region ofthe androgen receptor is needed for transcriptional activ-ity (48). Ligand also decreased solvent protection of thehinge and N terminus of H1, implying that the TR hingeis packed against the LBD without hormone and exposedwith ligands (24–26). We have previously suggested (onthe basis of low-resolution x-ray structural models of TRdimers and tetramers in solution (10, 42) that differencesin LBD conformation affect hinge organization. Our H/Dexchange data support this idea and raise the possibilitythat ligand-dependent changes in hinge position couldcommunicate information about LBD conformation tothe nearby DBD.
The most striking ligand-dependent alteration in TRconformation involves the C terminus of H3; T3 greatlyincreases solvent accessibility of this region relative toapo-TR and the NH3-TR complex. Although T3 coulddirectly increase the mobility of the AF-2 surface, wethink that the simplest explanation for this result is thatH12 packs against H3 without ligand and that T3 in-creases solvent accessibility by altering H12 position sothat it adopts the position similar to that observed inTR-T3 crystal structures. This hypothesis is attractive forseveral reasons. First, ER H12 adopts a similar position inER-antagonist x-ray structures (14, 17, 28, 38), as shownin our hybrid TR-ER model in Fig. 5. Second, it wouldexplain why H12 and nearby regions of the TR LBP areprotected in the apo state; H12 adopts an ordered anddiscrete conformation packed against H3. Third, individ-ual H12 residues play different roles with or without hor-mone, suggesting that H12 adopts different positions inthe apo-TR and T3-TR complex. The fact that all C-ter-minal amino acids are required for suppression of unli-ganded TR activity implies that they are required fordocking of H12 into the cleft and occlusion of the core-pressor binding site in vivo. H/D exchange results withNH3 support this notion. Although T3 and NH3 induceda more compact overall LBD structure, NH3 did not in-crease solvent exposure of this segment of TR H3. Thus,we predict that NH3 changes LBD conformation but doesnot alter H12 position relative to apo-TR; if H12 is in-deed docked over the H3–H5 region in the presence ofNH3, this result would explain why NH3 blocks bothcoactivator and corepressor binding.
Apart from differences in H3 solvent accessibility, fewaspects of TR conformation appear different with T3 andNH3. There were subtle differences in solvent protectionpattern that can be attributed to differences in ligand-
binding mode. Several regions of TR near the LBP exhib-ited increased solvent exposure with T3 relative to NH3,including the C terminus of H1, part of the loop betweenS1 and H3, the S2–S4 region, and H8. Conversely, the Cterminus of H6 was solvent exposed with NH3 and less sowith T3. We cannot explain these effects without detailedTR-NH3 atomic structures, but the fact that these pep-tides lie near the T3 aminopropionate group suggests thatconformational differences are related to the shorter, neg-atively charged carboxylic acid substituent at this posi-tion in NH3. However, other differences may reflect vari-ations in LBD allosteric communication. Unlike T3, NH3did not induce complete protection of the dimer surface atC terminus of H10 and the H10–H11 loop. This obser-vation has a functional correlate; NH3 does not inhibitTR-TR dimer formation as efficiently as T3 (27). Althoughwe cannot eliminate the possibility that some NH3-specificeffects on TR conformation contribute to its antagonist ac-tions, we nevertheless note that the largest difference be-tween T3 and NH3 involves H3 and propose that specificchanges in H12 position and AF-2 surface conformation aremost important for the ability of NH3 to block TR activity,exactly as predicted by the extension hypothesis (18).
Our model of apo-TR H12 position has implicationsfor current hypotheses about TR/corepressor interac-tions. The TR LBD corepressor binding surface is com-posed of hydrophobic residues from H3, H5, and H6(49). Thus, packing of H12 over H3 should block core-pressor binding. This agrees with experimental observa-tions; H12 truncation enhances apo-TR/corepressor in-teractions in solution (41). Moreover, NH3 prevents TRinteractions with corepressors (50). Additionally, pointmutations that are predicted to interfere with contactsbetween H12 and H3–H5 enhance unliganded TR activ-ity, consistent with the idea that inhibit TR H12 interac-tions with this region of the LBD surface and expose thecorepressor binding site in vivo. MD simulations also lendsupport to hypothesis by revealing spontaneous, nonin-duced, H12 conformational transitions from ligand-freeholo-TR LBD to structures very similar to the proposedapo-TR LBD model, in which the corepressor bindingsurface will be occluded.
Finally, it is interesting to compare H/D exchange re-sults for TRs with published studies for other NRs.Whereas we observed strong solvent protection of TRH11 and H12 in the absence and presence of differentligands, other groups observed that glucocorticoid recep-tor H11 and H12 becomes more exposed with antagonist(RU486) relative to agonist and that RXR agonists de-creased deuterium incorporation into H11 but not H12(21, 23). These studies suggest that there are consider-able differences between NRs in terms of response of
Mol Endocrinol, January 2011, 25(1):15–31 mend.endojournals.org 27
H11–H12 to ligands. It will be important to under-stand these influences to design ligands to control TRand NR activity.
Materials and Methods
Protein expression and purificationHuman TR� LBD (residues 209-461), fused in frame to the C
terminus of a poly-histidine (his) tag in a pET dueT plasmid(Novagen, Darmstadt, Germany), was expressed in the Esche-richia coli strain BL21 (DE3) as described (51). After purifica-tion, protein buffer was changed to 50 mM ammonium acetate(pH 7.0) using a HiTrap desalting column (GE Healthcare, Pis-cataway, NJ) because we found that this buffer provided bestresults for mass spectroscopic analysis. To produce ligandedTRs, T3 (Sigma Chemical Co., St. Louis, MO) or NH3 wasadded in a 3-fold molar excess and incubated for 1 h at 4 C. Theprotein was concentrated up to 12-fold by ultrafiltration (Ami-con Ultra 10MWCO; Millipore, Billerica, MA). Protein concen-tration was determined by Bradford assay, and purity was as-sessed by Coomassie Blue-stained SDS-PAGE.
Sample preparation and H/D exchangeH/D exchange was initiated with TR�1 LBD by 3.5-fold
dilution of the protein in the same buffer in D2O (pD 7.0) at 25C with or without ligands (�70% D2O). The samples wereincubated for various times (1, 3, 8, 15, 60, 180, and 300 min),at which point 70-�l TR aliquots were added to 60 �l of 20 mM
Na�-phosphate buffer to quench the reaction (pH 2.5). Thesamples were immediately applied onto a Quattro II triple-qua-drupole mass spectrometer (Micromass, Altrincham, UK),equipped with a standard electrospray ionization source, or di-gested with pepsin (1 mol enzyme per 10 TR protein) at � 0 Cfor 5 min and then applied to the mass spectrometer as above.
Sequence identification ofpepsin-generated peptides
Deuterium level for each peptide was determined from thedifferences in centroid masses between the deuterated and non-deuterated fragments. The nondigested protein, after deutera-tion, was used as a control, being compared with the total deu-terium incorporated into the peptides, to estimate deuteriumloss during the protein digestion. This procedure was applied toboth nonliganded and liganded protein.
Data analysisThe MS-Digest software (52) was used to identify the se-
quence of selected peptide ions and to calculate the proteinmolecular weight to compare these data with those acquiredfrom deconvolution of each spectra measurement for all sam-ples. Total H/D exchange was calculated as the total number ofpeptides bound plus one N-terminal hydrogen per peptide mi-nus the number of proline residues. The secondary structure ofthe protein was calculated by the DSSP program (53). Deutera-tion rates and hydrophobicity were plotted using TexShade soft-ware (54).
Model buildingAn apo-TR�1 LBD model was built using both ER� LBD
structure complexed with antagonist 4-hydroxytamoxifen (PDB
ID 3ERT) (38) and the TR�1 LBD structure (PDB ID 3GWS)(10) as templates. The sequences were aligned using ClustalWsoftware (55). For the alignment, we used the entire sequence ofTR�1 LBD, part of TR�1 structure, from helix 0 to helix 11(PDB ID 3GWS), and the ER� structure in inactive conforma-tion (PDB ID 3ERT) to modify the conformation of helix 12.The model was constructed using MODELLER 9v4 software(56). For a given alignment, 10 model structures were built andevaluated with the PROCHECK software suite (57). All modelswere similar, and only the best-evaluated model was retainedafter the analysis.
Mutations and transactivation analysesThe plasmids pCMV-TR�1, pCMV-TR�1 mutants, and
TRE-F2-2x1 luciferase reporter for mammals transcription as-says were described previously (58, 59). New TR mutants re-ported in the present study (pCMX vectors) were created fromexisting vectors using QuikChange site-directed mutagenesiskits (Stratagene, La Jolla, CA). The mutations were verified byDNA sequencing.
For transactivation assays, HeLa cells were seeded into 24-well plates at a density of 1�105 cells per well and grown in10% FBS-DMEM under 95% air and 5% CO2 at 37 C over-night with 2 mM glutamine and 50 �g/ml streptomycin. The cellswere then cotransfected with 10 ng of pCMV-TR�1 and with100 nM TRE (F2) linked with luciferase reporter. The plasmidpRL containing the Renilla luciferase gene was transfected si-multaneously and used as a control. TransFectin� lipid reagent(Bio-Rad, Hercules, CA) was mixed with plasmids in DMEMand incubated at room temperature for 20 min before adding tothe culture medium. The ratio of DNA (micrograms) to Trans-Fectin (microliters) was 1:3 (wt/vol). T3 was subsequently addedto the culture medium 4 h later and was incubated with the cellsovernight. For activation assays, the ligand concentration in thecultures was kept at 10�7 M.
For luciferase assays, the cell monolayer was washed withPBS and harvested with lysis buffer (dual-luciferase reporterassay system; Promega, Madison, WI) and measured in a Safire2
luminescent counter (Tecan, Durham, NC). Renilla luciferaseactivity was measured in the same lysate to adjust variationcaused by transfection efficiencies. Luciferase assays were per-formed as previously described (58, 59).
MD simulationsThe complete simulated systems were built with Packmol
(60, 61), containing the LBD of TR�, water, and one counterionfor each charged residue for electroneutrality. We used a cubicbox with 16,600 water molecules with side dimensions of 81 Å.The average thickness of the LBD hydration layer is approxi-mately 25 Å. The initial protein structure was the T3-TR� LBDcomplex in the holo conformation (PDB ID 3GWS) (10), fromwhich the ligand was deleted.
All simulations were performed with NAMD (62), apply-ing periodic boundary conditions, a time step of 2.0 fsec, andCHARMM parameters (63). The TIP3P model was used forwater (64). All hydrogen-to-heavy-atom bonds were kept rigid.A 14-Å cutoff with smooth switching function starting at 12 Åwas used for the van der Waals interactions, whereas electro-static forces were treated via the particle mesh Ewald method(65). Energy minimization was performed as follows. The en-ergy of the system was minimized by 700 conjugate gradient(CG) steps keeping all protein atoms fixed, except the modeled
28 Figueira et al. Agonist and Antagonist Conformation of TR�1 Mol Endocrinol, January 2011, 25(1):15–31

regions, which were always allowed to move. Fixing only the C�atoms, another 500 CG steps were performed. Finally, 300 CGsteps were carried out without any restrictions.
After this procedure, 22-nsec MD simulations were per-formed under constant number of particles, temperature, andpressure conditions (NpT ensemble) at 298 K and 1 bar, withvelocity rescaling every 2 psec and Langevin barostat withdamping coefficient of 5 psec�1. The first 2 nsec were discardedfor equilibration of the system. We carried out three indepen-dent simulations with this protocol. To capture events of signif-icant conformational changes during the course of the simulatedprotein motions, we performed a set of three additional simu-lations of the same system at the canonical ensemble with con-stant temperature of 498 K and 1 g/cm3 density (see for instanceRef. 47). The initial configurations for these runs, taken fromthe last step of 298 K simulations, were thermalized at 498 Kby rescaling atomic velocities every 0.1 psec with a Berendsenthermostat during 500 psec before starting the set of 20-nsecproduction runs.
We characterized the helix H12 conformation with theRMSD computed by aligning each frame to two different refer-ences (the holo-TR LBD and the proposed ER-TR hybridmodel) with the algorithm described by Kearsley (66). The in-dependent structures with lowest RMSD relative to the hybridmodel were used as starting configurations for 298 K anneal-ing simulations. These runs lasted for about 20 nsec each. Theaverage apo structures shown in Fig. 7, C and D, and Sup-plemental Fig. 2 were obtained from the last 5-nsec portion ofthese trajectories.
Acknowledgments
We thank J. R. C. Muniz for helping us with TexShade software.
Address all correspondence and requests for reprints to: IgorPolikarpov, Universidade de Sao Paulo, Departamento Física eInformatica, Instituto de Física, Avenida Trabalhador Saocarlense,400, Sao Carlos, SP, Brazil 13560-970. E-mail: [email protected].
This work was supported by the Conselho Nacional de Des-envolvimento Científico e Tecnologico (CNPq) IP (300220/96-0), by Fundacao de Amparo a Pesquisa do Estado de Sao Paulo(FAPESP) Grants 03/09462-5, 06/00182-8, and 08/00078-1and National Institutes of Health Grants DK41482 and 51281to J.D.B.
Disclosure Summary: The authors have nothing to disclose.
References
1. Laudet V, Gronemeyer H 1995 The nuclear receptors facts book.London: Academic Press; 1–109
2. Glass CK, Rosenfeld MG 2000 The corregulator exchange in tran-scriptional functions of nuclear receptors. Genes Dev 14:121–141
3. Lazar MA, Chin WW 1990 Nuclear thyroid receptor. J Clin Invest86:1777–1782
4. Ribeiro RC, Apriletti JW, Wagner RL, West BL, Feng W, Huber R,Kushner PJ, Nilsson S, Scanlan T, Fletterick RJ, Schaufele F, BaxterJD 1998 Mechanisms of thyroid hormone action: insights fromx-ray crystallographic and functional studies. Recent Prog HormRes 53:351–394
5. Swanson EA, Gloss B, Belke DD, Kaneshige M, Cheng SY,Dillmann WH 2003 Cardiac expression and function of thyroidhormone receptor and its mutant. Endocrinology 144:4820–4825
6. Baxter JD, Dillmann WH, West BL, Huber R, Furlow JD, FletterickRJ, Webb P, Apriletti JW, Scanlan TS 2001 Selective modulation ofthyroid hormone receptor action. J Steroid Biochem Mol Biol 76:31–42
7. Nagy L, Schwabe JWR 2004 Mechanism of the nuclear receptormolecular switch. Trends Biochem Sci 29:317–324
8. Wagner RL, Huber BR, Shiau AK, Kelly A, Cunha Lima ST,Scanlan TS, Apriletti JW, Baxter JD, West BL, Fletterick RJ 2001Hormone selectivity in thyroid hormone receptors. Mol Endocrinol15:398–410
9. Darimont BD, Wagner RL, Apriletti JW, Stallcup MR, Kushner PJ,Baxter JD, Fletterick RJ, Yamamoto KR 1998 Structure and spec-ificity of nuclear receptor-coactivator. Genes Dev 12:3343–3356
10. Nascimento AS, Dias SM, Nunes FM, Aparício R, Ambrosio AL,Bleicher L, Figueira AC, Santos MA, de Oliveira Neto M, Fischer H,Togashi M, Craievich AF, Garratt RC, Baxter JD, Webb P, Polikar-pov I 2006 Structural rearrangements in the thyroid hormone re-ceptor hinge domain and their putative role in the receptor function.J Mol Biol 360:586–598
11. Togashi M, Borngraeber S, Sandler B, Fletterick RJ, Webb P,Baxter JD 2005 Conformational adaptation of nuclear receptorligand binding domains to agonists: potential for novel approachesto ligand design. J Steroid Biochem Mol Biol 93:127–137
12. Ribeiro RC, Feng W, Wagner RL, Costa CH, Pereira AC, AprilettiJW, Fletterick RJ, Baxter JD 2001 Definition of the surface in thethyroid hormone receptor ligand binding domain for association ashomodimers and heterodimers with retinoid X receptor. J BiolChem 276:14987–14995
13. Watkins RE, Wisely GB, Moore LB, Collins JL, Lambert MH,Williams SP, Willson TM, Kliewer SA, Redinbo MR 2001 Thehuman nuclear xenobiotic receptor PXR: structural determinantsof directed promiscuity. Science 292:2329–2333
14. Pike AC, Brzozowski AM, Hubbard RE, Bonn T, Thorsell AG,Engstrom O, Ljunggren J, Gustafsson JA, Carlquist M 1999 Struc-ture of the ligand-binding domain of oestrogen receptor � in thepresence of a partial agonist and a full antagonist. EMBO J 18:4608–4618
15. Wurtz JM, Bourguet W, Renaud JP, Vivat V, Chambon P, Moras D,Gronemeyer H 1996 A canonical structure for the ligand bindingdomain of nuclear receptors. Nat Struct Biol 3:87–94
16. Bourguet W, Ruff M, Chambon P, Gronemeyer H, Moras D 1995Crystal structure of the ligand-binding domain of the human nu-clear receptor RXR-R. Nature 375:377–382
17. Heldring N, Pawson T, McDonnell D, Treuter E, Gustafsson JA,Pike AC 2007 Structural insights into corepressor recognition byantagonist-bound estrogen receptors. J Biol Chem 282:10449–10455
18. Webb P, Nguyen NH, Chiellini G, Yoshihara HA, Cunha Lima ST,Apriletti JW, Ribeiro RC, Marimuthu A, West BL, Goede P,Mellstrom K, Nilsson S, Kushner PJ, Fletterick RJ, Scanlan TS,Baxter JD 2002 Design of thyroid receptor antagonists from firstprinciples. J Steroid Biochem Mol Biol 83:59–73
19. Kosztin D, Izrailev S, Schulten K 1999 Unbinding of retinoic acidfrom its receptor studied by steered molecular dynamics. Biophys J76:188–197
20. Johnson BA, Wilson EM, Li Y, Moller DE, Smith RG, Zhou G 2000Ligand-induced stabilization of PPAR� monitored by NMR spec-troscopy: implications for nuclear receptor activation. J Mol Biol298:187–194
21. Hamuro Y, Coales SJ, Morrow JA, Molnar KS, Tuske SJ, SouthernMR, Griffin PR 2006 Hydrogen/deuterium exchange (H/D-Ex) ofPPAR� LBD in the presence of various modulators. Protein Sci15:1883–1892
22. Frego L, Davidson W 2006 Conformational changes of the glu-cocorticoid receptor ligand binding domain induced by ligand andcofactor binding, and the location of cofactor binding sites deter-
Mol Endocrinol, January 2011, 25(1):15–31 mend.endojournals.org 29

mined by hydrogen/deuterium exchange mass spectrometry. Pro-tein Sci 15:722–730
23. Yan X, Broderick D, Leid ME, Schimerlik MI, Deinzer ML 2003Dynamics and ligand-induced solvent accessibility changes in hu-man retinoid X receptor homodimer determined by hydrogen deu-terium exchange and mass spectrometry. Biochemistry 43:909–917
24. Pissios P, Tzameli I, Kushner P, Moore DD 2000 Dynamic stabili-zation of nuclear receptor ligand binding domains by hormone orcorepressor binding. Mol Cell 6:245–253
25. Huber BR, Sandler B, West BL, Cunha Lima ST, Nguyen HT,Apriletti JW, Baxter JD, Fletterick RJ 2003 Two resistance to thy-roid hormone mutants with impaired hormone binding. Mol En-docrinol 17:643–652
26. Huber BR, Desclozeaux M, West BL, Cunha-Lima ST, NguyenHT, Baxter JD, Ingraham HA, Fletterick RJ 2003 Thyroid hor-mone receptor-� mutations conferring hormone resistance and re-duced corepressor release exhibit decreased stability in the N-ter-minal ligand-binding domain. Mol Endocrinol 17:107–116
27. Shah V, Nguyen P, Nguyen NH, Togashi M, Scanlan TS, BaxterJD, Webb P 2008 Complex actions of thyroid hormone receptorantagonist NH3 on gene promoters in different cell lines. Mol CellEndocrinol 296:69–77
28. Brzozowski AM, Pike AC, Dauter Z, Hubbard RE, Bonn T,Engstrom O, Ohman L, Greene GL, Gustafsson JA, Carlquist M1997 Molecular basis of agonism and antagonism in the estrogenreceptor. Nature 389:753–758
29. Engen JR, Gmeiner WH, Smithgall TE, Smith DL 1999 Hydrogenexchange shows peptide binding stabilizes motions in Hck SH2.Biochemistry 38:8926–8935
30. Chalmers MJ, Busby SA, Pascal BD, He Y, Hendrickson CL,Marshall AG, Griffin PR 2006 Probing protein ligand interactionsby automated hydrogen/deuterium exchange mass spectrometry.Anal Chem 78:1005–1014
31. Englander JJ., Del Mar C, Li W, Englander SW, Kim JS, Stranz DD,Hamuro Y, Woods Jr VL 2003 Protein structure change studied byhydrogen-deuterium exchange, functional labeling, and mass spec-trometry. Proc Natl Acad Sci USA 100:7057–7062
32. Dai SY, Burris TP, Dodge JA, Montrose-Rafizadeh C, Wang Y,Pascal BD, Chalmers MJ, Griffin PR 2009 Unique ligand bindingpatterns between estrogen receptor � and � revealed by hydrogen-deuterium exchange. Biochemistry 48:9668–9676
33. Yan X, Perez E, Leid M, Schimerlik MI, de Lera AR, Deinzer ML2007 Deuterium exchange and mass spectrometry reveal the inter-action differences of two synthetic modulators of RXR LBD. Pro-tein Sci 16:2491–2501
34. Chandra V, Huang P, Hamuro Y, Raghuram S, Wang Y, Burris TP,Rastinejad F 2008 Structure of the intact PPAR-�-RXR-� nuclearreceptor complex on DNA. Nature 456:350–356
35. Elhaji YA, Stoica I, Dennis S, Purisima EO, Lumbroso R, Beitel LK,Trifiro MA 2006 Impaired helix 12 dynamics due to proline 892substitutions in the androgen receptor are associated with completeandrogen insensitivity. Hum Mol Genet 15:921–931
36. McGee TD, Edwards J, Roitberg AE 2008 Preliminary moleculardynamic simulations of estrogen receptor � ligand binding domainfrom antagonist to apo. Int J Environ Res Public Health 5:111–114
37. Celik L, Lund JD, Schiøtt B 2007 Conformational dynamics of theestrogen receptor �: molecular dynamics simulations of the influ-ence of binding site structure on protein dynamics. Biochemistry46:1743–1758
38. Sonoda MT, Martínez L, Webb P, Skaf MS, Polikarpov I 2008Ligand dissociation from estrogen receptor is mediated by receptordimerization: evidence from molecular dynamics simulations. MolEndocrinol 22:1565–1578
39. Martínez L, Webb P, Polikarpov I, Skaf MS 2006 Molecular Dy-namics simulations of ligand dissociation from thyroid hormonereceptors: evidence of the likeliest escape pathway and its implica-tions for the design of novel ligands. J Med Chem 49:23–26
40. Martínez L, Sonoda MT, Webb P, Baxter JD, Skaf MS, Polikarpov
I 2005 Molecular dynamics simulations reveal multiple pathwaysof ligand dissociation from thyroid hormone receptors. Biophys J89:2011–2023
41. Martínez L, Nascimento AS, Nunes FM, Phillips K, Aparicio R,Dias SM, Figueira ACM, Lin JH, Nguyen P, Apriletti JW, Neves FA,Baxter JD, Webb P, Skaf MS, Polikarpov I 2009 Gaining ligandselectivity in thyroid hormone receptors via entropy. Proc NatlAcad Sci USA 106:20717–20722
42. Figueira AC, Neto Mde O, Bernardes A, Dias SM, Craievich AF,Baxter JD, Webb P, Polikarpov I 2007 Low-resolution structures ofthyroid hormone receptor dimers and tetramers in solution. Bio-chemistry 46:1273–1283
43. Shiau AK, Barstad D, Loria PM, Cheng L, Kushner PJ, Agard DA,Greene GL 1998 The structural basis of estrogen receptor/coacti-vator recognition and the antagonism of this interaction by tamox-ifen. Cell 95:927–937
44. Zhang J, Hu X, Lazar MA 1999 A novel role for helix 12 of retinoidX receptor in regulating repression. Mol Cell Biol 19:6448–6457
45. Marimuthu A, Feng W, Tagami T, Nguyen H, Jameson JL, Flett-erick RJ, Baxter JD, West BL 2002 TR surfaces and conformationsrequired to bind nuclear receptor corepressor. Mol Endocrinol 16:271–286
46. Togashi M, Nguyen P, Fletterick R, Baxter JD, Webb P 2005 Re-arrangements in thyroid hormone receptor charge clusters that sta-bilize bound 3,5�,5-triiodo-L-thyronine and inhibit homodimer for-mation. J Biol Chem 280:25665–25673
47. Martínez L, Souza PC, Garcia W, Batista FA, Portugal RV,Nascimento AS, Nakahira M, Lima LM, Polikarpov I, Skaf MS2010 On the denaturation mechanisms of the ligand binding do-main of thyroid hormone receptors. J Phys Chem B 114:1529–1540
48. Estebanez-Perpina E, Arnold LA, Arnold AA, Nguyen P, RodriguesED, Mar E, Bateman R, Pallai P, Shokat KM, Baxter JD, Guy RK,Webb P, Fletterick RJ 2007 A surface on the androgen receptor thatallosterically regulates coactivator binding. Proc Natl Acad Sci USA104:16074–16079
49. Wagner RL, Apriletti JW, McGrath ME, West BL, Baxter JD,Fletterick RJ 1995 A structural role for hormone in the thyroidhormone receptor. Nature 378:690–697
50. Nguyen NH, Apriletti JW, Cunha Lima ST, Webb P, Baxter JD,Scanlan TS 2002 Rational design and synthesis of a novel thyroidhormone antagonist that blocks coactivator recruitment. J MedChem 45:3310–3320
51. Figueira AC, Dias SM, Santos MA, Apriletti JW, Baxter JD, WebbP, Neves FA, Simeoni LA, Ribeiro RC, Polikarpov I 2006 Humanthyroid receptor forms tetramers in solution, which dissociate intodimers upon ligand binding. Cell Biochem Biophys 44:453–462
52. Clauser KM, Baker P, Burlingame AL 1999 Role of accurate massmeasurement (�/� 10 ppm) in protein identification strategies em-ploying MS or MS/MS and database searching. Anal Chem 71:2871–2882
53. Kabsch W, Sander C 1983 Dictionary of protein secondary struc-ture: pattern recognition of hydrogen-bonded and geometrical fea-tures. Biopolymers 22:2577–2637
54. Beitz E 2000 TeXshade: shading and labeling of multiple sequencealignments using LaTeX2e. Bioinformatics 16:135–139
55. Thompson JD, Higgins DG, Gibson TJ 1994 CLUSTAL W: im-proving the sensitivity of progressive multiple sequence alignmentthrough sequence weighting, position-specific gap penalties andweight matrix choice. Nucleic Acids Res 22:4673–4680
56. Sali A, Blundell TL 1993 Comparative protein modeling by satis-faction of spatial restraints. J Mol Biol 234:779–815
57. Laskowski RA, MacArthur MW, Moss DS, Thornton JM 1993PROCHECK: a program to check the stereochemical quality ofprotein structures. J Appl Crystallogr 26:283–291
58. Feng W, Ribeiro RCJ, Wagner RL, Nguyen H, Apriletti JW,Fletterick RJ, Baxter JD, Kushner PJ, West BL 1998 Hormone-dependent coactivator binding to a hydrophobic cleft on nuclearreceptors. Science 5370:1747–1749
30 Figueira et al. Agonist and Antagonist Conformation of TR�1 Mol Endocrinol, January 2011, 25(1):15–31

59. Velasco LF, Togashi M, Walfish PG, Pessanha RP, Moura FN,Barra GB, Nguyen P, Rebong R, Yuan C, Simeoni LA, Ribeiro RC,Baxter JD, Webb P, Neves FA 2007 Thyroid hormone responseelement organization dictates the composition of active receptor.J Biol Chem 282:12458–12466
60. Martínez JM, Martínez L 2003 Packing optimization for auto-mated generation of complex system’s initial configurations formolecular dynamics and docking. J Comput Chem 24:819–825
61. Martínez L, Andrade R, Birgin EG, Martínez JM 2009 A packagefor building initial configurations for molecular dynamics simula-tions. J Comput Chem 30:2157–2164
62. Phillips JC, Braun R, Wang W, Gumbart J, Tajkhorshid E, Villa E,Chipot C, Skeel RD, Kale L, Schulten K 2005 Scalable moleculardynamics with NAMD. J Comput Chem 26:1781–1802
63. MacKerell AD, Bashford D, Bellott M, Dunbrack RL, Evanseck JD,
Field MJ, Fischer S, Gao J, Guo H, Ha S, Joseph-McCarthy D,Kuchnir L, Kuczera K, Lau FTK, Mattos C, Michnick S, Ngo T,Nguyen DT, Prodhom B, Reiher WE, Roux B, Schlenkrich M,Smith JC, Stote R, Straub J, Watanabe M, Wiorkiewicz-Kuczera J,Yin D, Karplus M 1998 All-atom empirical potential for molecularmodeling and dynamics studies of proteins. J Phys Chem B 102:3586–3616
64. Jorgensen WL, Chandrasekhar J, Madura JD, Impey RW, Klein ML1983 Comparison of simple potential functions for simulating liq-uid water. J Chem Phys 79:926–935
65. Darden T, York D, Pedersen L 1993 Particle mesh Ewald: anNlog(N) method for Ewald sums in large systems. J Chem Phys98:10089–10092
66. Kearsley SK 1989 On the orthogonal transformation used for struc-tural comparisons. Acta Cryst A 45:208–210
Go to the Translational Research in Endocrinology & Metabolism site for a collection
of articles from The Endocrine Society journals www.endojournals.org/trem
Mol Endocrinol, January 2011, 25(1):15–31 mend.endojournals.org 31


