ANALYSIS OF AGENCY COSTS ATTRIBUTABLE TO THE …
86
Transcript of ANALYSIS OF AGENCY COSTS ATTRIBUTABLE TO THE …


The National Oceanic and Atmospheric Administration (NOAA), organized in 1970, has evolved into an agency which establishes national policies and manages and conserves our oceanic, coastal, and atmospheric resources. An organizational element within NOAA, the Office of Fisheries is responsible for fisheries policy and the direction of the National Marine Fisheries Service (NMFS).
In addition to its formal publications, the NMFS uses the NOAA Technical Memorandum series to issue informal scientific and technical publications when complete formal review and editorial processing are not appropriate or feasible. Documents within this series, however, reflect sound professional work and may be referenced in the formal scientific and technical literature.

NOAA Technical Memorandum NMFS This TM series is used for documentation and timely communication of preliminaty results, interim reports. or special purpose information. The TMs have not received complete formal review, editorial control, or detailed editing.
OCTOBER 1997
ANALYSIS OF AGENCY COSTS ATTRlBUTABLE
TO THE RECOVERY PLAN FOR
SACRAMENTO RIVER WINTER-RUN CHINOOK SALMON
Cynthia Thomson
Natianal Marine Fisheries Service, NOAA Southwest Fisheries Science Center
Tiburon Laboratory 3150 Paradise Drive
Tiburon, California 94920
Mailing address: Institute of Marine Sciences, EMS Building A-31 6 University of California Santa Cruz, California 95064
NOAA-TM-N M FS-S WFSC-249
U.S. DEPARTMENT OF COMMERCE William M. Daley, Secretary National Oceanic and Atmospheric Administration D. James Baker, Under Secretary for Oceans and Atmosphere National Marine Fisheries Service Rolland A. Schmitten, Assistant Administrator for Fisheries
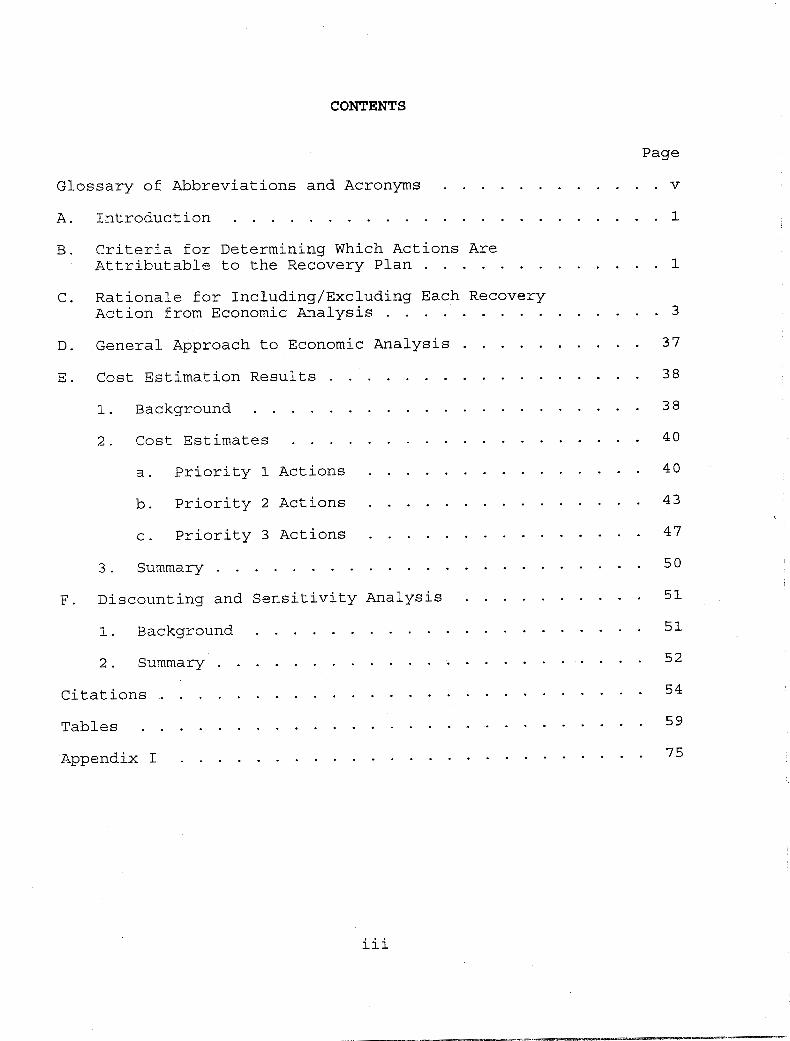
CONTENTS
Page
. . . . . . . . . . . . v Glossary of Abbreviations and Acronyms
A . Introduction 1 . . . . . . . . . . . . . . . . . . . . . . . B . Criteria for Determining Which Actions Are
Attributable to the Recovery Plan . . . . . . . . . . . . . 1
C . Rationale for Including/Excluding Each Recovery Action from Economic Analysis . . . . . . . . . . . . . . . 3
D . General Approach to Economic Analysis . . . . . . . . . . 37 E . Cost Estimation Results 38
2 . Cost Estimates . . . . . . . . . . . . . . . . . . . 40 a . Priority 1 Actions . . . . . . . . . . . . . . . 40 b . Priority 2 Actions . . . . . . . . . . . . . . . 43 c . Priority 3 Actions . . . . . . . . . . . . . . . 47
. . . . . . . . . . . . . . . . . 1 . Background 38 . . . . . . . . . . . . . . . . . . . . .
3 . Summary 50
F . Discounting and Sensitivity Analysis . . . . . . . . . . 51 . . . . . . . . . . . . . . . . . . . . . . .
1 . Background . . . . . . . . . . . . . . . . . . . . . 51 2 . Summary 52
Citations 54
Tables 59
Appendix1 75
. . . . . . . . . . . . . . . . . . . . . . . . . . . . . . . . . . . . . . . . . . . . . . . . .
. . . . . . . . . . . . . . . . . . . . . . . . . . . . . . . . . . . . . . . . . . . . . . . . . . . .
iii

GLOSSARY OF ABBREVIATIONS AND ACRONYMS
ACID ACOE ARMP BMP BO CEQA CERCLA
cfs CNFH CVP CVPIA CVRWQCB CWA CWT DAFRP DFG DPR DWR EIS EPA ESA FMP FWS GCID IEP LTMS MSFCMA
NFH NMFS NPDES OPR PFMC PPL RBDD RWQCB SFEI SFEP SFBRWQCB SMSCS SWP SWRCB TCD uc USBR USGS
Anderson-Cottonwood Irrigation District Army Corps of Engineers Aggregate Resource Management Plan Best Management Practice Biological Opinion California Environmental Quality Act Comprehensive Environmental Response, Compensation and
Cubic feet per second Coleman National Fish Hatchery Central Valley Project Central Valley Project Improvement Act Central Valley Regional Water Quality Control Board Clean Water Act Coded Wire Tag Draft Anadromous Fish Restoration Program Department of Fish and Game Department of Pesticide Regulation Department of Water Resources Environmental Impact Statement Environmental. Protection Agency Endangered Species Act Fishery Management Plan Fish and Wildlife Service Glenn-Colusa Irrigation District Interagency Ecological Program Long-Term Management Strategy Magnuson-Stevens Fishery Conservation and Management
National Fish Hatchery National Marine Fisheries Service National Pollution Discharge Elimination System Governor’s Office of Planning and Research Pacific Fishery Management Council Priority Pollutant List Red Bluff Diversion Dam Regional Water Quality Control Board San Francisco Estuary Institutte San Francisco Estuary Project San Francisco Bay Regional Water Quality Control Board Suisun Marsh Salinity Control Structure State Water Project State Water Resources Control Board Temperature Control Device University of California U.S. Bureau of Reclamation U.S. Geological Survey
Liability Act
Act
V

A. INTRODUCTION
In August 1989, the National Marine Fisheries Service (NMFS) published an emergency rule to list Sacramento River winter-run chinook as "threatened" under the Endangered Species Act (ESA) . In April 1990, the NMFS extended the emergency rule to ensure continued protection of the run until the final rule was published in November 1990. In June 1992, the American Fisheries Society petitioned the NMFS to reclassify winter-run chinook as llendangered,lT which the NMFS did in January 1994.
Concurrent with the emergency listing of the winter run as threatened in August 1989, NMFS also designated critical habitat for the population. In accordance with the ESA requirement that the Secretary of the Interior "shall take into consideration the economic impact, and any other relevant impact, of specifying any particular area as critical habitat," an economic analysis of the critical habitat designation was completed in 1991 (Hydrosphere 1991). This report provides an additional economic analysis to comply with the ESA provision that the recovery plan include Ilestimates of time required and the cost to carry out those measures needed to achieve the plan's goal and to achieve intermediate steps toward that goal.'I
Section B of this report lays out some general criteria for determining which actions in the Recovery Plan are directly attributable to the Plan and therefore warrant inclusion in the economic analysis. Section C evaluates each action in the Plan in terms of the criteria laid out in Section B. Section D discusses the general approach and assumptions underlying the economic analysis, Section E the actual cost estimates, and Section F the sensitivity analysis. Appendix I provides additional elaboration on the various non-ESA laws, regulations and programs referred to in the main body of the report.
B. CRITERIA FOR DETERMINING WHICH ACTIONS ARE ATTRIBUTABLE TO THE RECOVERY PLAN
The Sacramento watershed provides habitat for numerous resident and anadromous species, including commercially and recreationally valuable finfish and shellfish, as well as listed species.such as winter-run chinook and Delta smelt. The watershed also supports a wide variety of human activities, such as agriculture, hydropower generation, fishing, flood control and recreation. The watershed is highly managed, reflecting the extensive and often competing uses of watershed resources.
*In that same month, the state of California listed the winter-run chinook as "endangeredrt under its Endangered Species Act.

Since the listing of winter-run chinook under the ESA, of Section 7 and Section 10 consultations have occurred to ensure that operations of water projects, hatcheries, and the like do not jeopardize the continued existence of the species. the salmon conservation measures currently ongoing in the Sacramento watershed were initiated to comply with terms and conditions of Biological Opinions3 (BOs) arising from various ESA consultations. Other ongoing activities to protect fish and wildlife (including but not necessarily limited to winter-run salmon) are attributable to laws, regulations and programs other than the ESA.
Actions included in the Winter-Run Recovery Plan can be categorized as follows:
a number
Some of
(1) under existing laws, regulations and programs. These include actions arising not only from non-ESA mandates but also from BOs associated with Section 7 and Section 10 consultations on the winter run;
( 2 ) actions expressed in the Plan as general statements of policy which agencies utilize as guidance in carrying out their specific responsibilities; and
( 3 ) specific activities which agencies may implement under existing mandates, but which are not definitely planned or underway.
specific activities which are being planned/implemented
The purpose of the economic analysis is to estimate costs associated with implementing the Winter-Run Recovery Plan. Actions in the first two categories are not included in the analysis, since they are already being planned or implemented independently of the Recovery Plan. is limited to category ( 3 ) actions, on the assumption that their inclusion in the Recovery Plan will provide an impetus for their implementation.
The exclusion of category (1) and ( 2 ) actions from the economic analysis should not be construed to imply that they are less important to winter-run recovery than category ( 3 ) actions. In fact, some of the actions excluded from the economic analysis are
Thus the economic analysis
3Biological Opinions specify terms and conditions under which an activity can proceed so as not to "jeopardize the continued existence of a listed species or result in the destruction or adverse modification of its critical habitat."
2

given higher priority in the Recovery Plan (in terms of their importance to winter-run recovery) than some of the included actions.
C. ECONOMIC ANALYSIS
RATIONALE FOR INCLUDING/EXCLUDING EACH RECOVERY ACTION FROM
This section evaluates each specific action in the Recovery Plan in terms of whether it meets the criteria for inclusion in the economic analysis, i.e., whether it belongs in categories (1) or ( 2 ) , or category ( 3 ) as described in Section B. Accompanying text under each action describes existing mandates for each action (where applicable) and provides justification for the categorization used.4 In cases where only part of an action is attributable to the Recovery Plan, only the attributable portion (which is underlined for emphasis) is reflected in the economic analysis.
GOAL I: PROTECT AND RESTORE SPAWNING AND REARING HABITAT.
Objective 1: Provide suitable water temperatures for spawning, egg incubation and juvenile rearing between Keswick Dam and Red Bluff -PRIORITY 1.
Action 1 - Catesorv (l)-: Operate the Central Valley Project (CVP) to consistently attain the State Water Resource Control Board's (SWRCB's) Order 90-5 for water temperature objectives to the extent possible under different storage and runoff conditions.
In 1990, the State Water Resources Control Board issued Order 90-5, requiring operation of "Keswick Dam, Shasta Dam, and the Spring Creek Power Plant to meet a daily average water temperature of 56'F in the Sacramento River at Red Bluff Diversion Dam during periods when higher temperatures will be detrimental to the fishery" (SWRCB 1990, p. 54).
Order 90-5 was reaffirmed in the NMFS' 1993 BO on the CVP and the State Water Project (SWP), which states that the "Bureau [of Reclamation] must maintain daily average water temperature in the Sacramento River at no more than 56'F within the winter-run chinook salmon spawning grounds below Keswick Dam . . . I ' (NMFS 1993b, p. 53). This temperature objective can also be found in the Draft Anadromous Fish Restoration Plan (DAFRP) developed by the U . S . Fish and Wildlife Service (FWS), which specifies as a
4For many recovery actions, more than one mandate was found to be relevant--a reflection of the multiplicity and overlapping nature of restoration programs fo r the Sacramento watershed.

high priority action for the upper Sacramento to "continue to maintain water temperatures at or below 56'F from Keswick Dam to Bend Bridge to the extent controllable, consistent with the 1993 Biological Opinion for winter-run chinook salmon and with SWRCB Order 90-5" (FWS 1995, p. 29).
Action 2 - Catesorv (1): Install and operate a structural temperature control device at Shasta Dam in conjunction with modifications to CVP operations.
The Shasta Temperature Control Device (TCD) facilitates maintenance of water temperatures necessary for winter-run survival by allowing the U.S. Bureau of Reclamation (USBR) to release cold water from lower reservoir levels into the Sacramento River without bypassing the power inlet. The SWRCB's Order 90-5 specified a time schedule for construction of the TCD (SWRCB 1990, pp. 55-56). Section 3406(b) (6) of the Central Valley Project Improvement Act (CVPIA), which includes a provision to Ifinstall and operate a structural temperature control device at Shasta Dam . . . to assist in the Secretary's efforts to control water temperatures in the upper Sacramento River in order to protect anadromous fish in the upper Sacramento River" (U.S. Congress 1992, p. 15). Construction of the TCD is currently underway.
Need for the TCD is further iterated in
Action 3 - Catesories (l), ( 3) : Operate and maintain temperature control curtains as permanent installations in Whiskeytown and Lewiston reservoirs, and investigate installing an additional temperature curtain on the upstream side of Lewiston Reservoir.
Temperature control curtains have been installed and are in operation at Whiskeytown and Lewiston. Investisation of an additional temperature curtain on the upstream side of Lewiston Reservoir is a new recommendation attributable to this Recovery Plan.
Action 4 - Catesorv (1): Actively regulate the river/reservoir system using a comprehensive temperature monitoring program, integrated with a calibrated daily time-step temperature model.
The SWRCB's Order 90-5 requires a "monitoring and reporting program" (SWRCB 1990, p. 56) at designated stations in the Sacramento watershed to ensure compliance with temperature and other water quality conditions specified in the Order. As required by Order 90-5, a comprehensive model is being developed at the University of California (UC) at Davis which relates water temperature to various natural and man-made factors.
4

Objective 2. Mountain Mine - PRIORITY 1.
Reduce plollution in the Sacramento River from Iron
All five actions included under this objective are mandated by a number of existing laws, regulations and programs. Iron Mountain Mine, which has been designated a Superfund site, is targeted for cleanup under the Comprehensive Environmental Response, Compensation and Liability Act (CERCLA) ; the Environmental Protection Agency (EPA) is taking measures to ensure source control. The 1993 Action Plan developed by the California Department of Fish and Game (DFG) ranks as high priority an action to Itcontrol effluent from Iron Mt. Mine Superfund site until Basin Plan objectives are met" (DFG 1993, p. VII-17). The NMFS' 1993 BO on the CVP/SWP mandates that "the Bureau [of Reclamation] must operate the Spring Creek Debris Dam and Shasta Dam season to minimize chronic exposure of metal concentrations on adult and juvenile winter-run chinook salmon and eliminate potential scouring of toxic metal-laden sediments in Keswick Reservoir" (NMFS 199333, p. 67). The FWS' DAFRP includes as a high priority action for the upper Sacramento to "remedy water quality problems from toxic discharges associated with Iron Mountain Mine and water quality problems associated with metal sludges in Keswick Reservoir, consistent with the Comprehensive Environmental Response, Compensation, and Liability Act and the Clean Water Act" (FWS 1995, p. 30).
Action 1 - Catesorv (1): Remedy pollution problems from Iron Mountain Mine to meet Basin Plan standards during the winter-run chinook incubation period.
Action 2 - Catesorv (1) : Develop, implement, and monitor reliable and proven remedies that ensure continued treatment and control of heavy metal waste prior to discharge to the Sacramento River.
Action 3 - Catesory (11.: Develop, implement, and monitor remedies that dilute heavy metal waste discharge into the Sacramento River through effective water management.
Ac,tion 4 - Catesorv 111.: Eliminate scouring of toxic metal-laden sediments in the Spring Creek and Keswick Reservoirs.
Action 5 - Catesorv (1): Monitor metal concentrations and waste flows using approved standard methods.
Objective 3. Provide optimum flows in the Sacramento River between Keswick D a m and Chipps Island - PRIORITY 2. Action 1 - Cateqorv (1): As an interim measure, maintain flows of 5,000 to 5,500 cfs from October through April when possible without compromising carryover storage. When these flows cannot be achieved, continue to operate the CVP and SWP to meet flow
5

-
reduction rates and minimum flows as identified in the 1993 BO for Operation of the Federal CVP and the California SWP.
The NMFS' 1993 BO on the CVP/SWP specifies minimum flows and reduction rates for the protection of winter-run chinook. Specifically, it states that "The Bureau must maintain a minimum flow of 3,250 cfs from Keswick Dam to the Sacramento River from October 1 through March 31" (NMFS 1993b, p. 52). The BO further states that "For reduction of Keswick Dam releases to levels between 3,999 cfs and 3,250 cfs, flows must not be decreased by more than 100 cfs each night" (op. &., p. 53).
The FWS' DAFRP specifies a minimum flow schedule at Keswick Dam (ranging from 3,250 to 5,500 cfs) which varies with the level of carryover storage in Shasta Reservoir. consistent with the minimum flows specified in the NMFS' 1993 BO and also elaborates on minimum flows at higher levels of carryover storage.
The schedule is
for the upper Sacramento River.
This action is mandated under a number of non-ESA laws, regulations and programs. For instance:
(a) The SWRCB's Order 90-5 specifies minimum flows at Keswick Dam and Red Bluff Diversion Dam (RBDD) necessary to maintain fish and wildlife, and also specifies release rates (ramping) from Keswick Dam to minimize stranding of salmon (SWRCB 1990, pp. 60-61).
(b) in the CVPIA. Section 3406(b)(8) of the CVPIA requires the Secretary of the Interior to "make use of short pulses of increased water flows to increase the survival of migrating anadromous fish moving into and through the Sacramento-San Joaquin Delta and Central Valley rivers and streams" (U.S. Congress 1992, p. 16). Section 3406(b) (9) includes a requirement to "develop and implement a program to eliminate, to the extent possible, losses of anadromous fish due to flow fluctuations caused by the operation of any Central Valley Project storage or re-regulating facility" (s. &., p. 16).
(c) The FWS' DAFRP designates the following measures as high priority for the upper Sacramento: schedule for flow changes that avoids, to the extent controllable, dewatering redds and isolating or stranding juvenile anadromous salmonids, consistent with SWRCB Order 90-5" (FWS 1995, p. 29). Also, flcontinue study to refine a river regulation program that balances fish habitats with
The concerns addressed in Order 90-5 are also addressed
"Implement a
6

the flow regime and addresses temperature, flushing flows, attraction flows, emigration, channel and riparian corridor maintenance" (OB. &., p. 31).
(d) instream flow, seasonal fluctuations and ramping rates for the Sacramento River as recommended by DFG . . . I 1 (DFG 1993, p. V11-18), "complete the Sacramento River instream flow study" (op. u., p. VII-lg), and Irevaluate the effectiveness of spring pulse flows on the survival of juvenile anadromous fish" (a. u., p. VII-19).
Action 3 - Cateqory (1): Eliminate adverse fluctuations by modifying the Anderson-Cottonwood Irrigation District's (ACID's) dam operations, or modifying or replacing the facility.
Installation, removal or adjustment of the flashboards at the ACID's dam requires that Sacramento River flows be temporarily reduced from 10,000-15,000 cfs to about 6,000 cfs. Such reduced flows can disrupt salmon spawning activity, dewater redds and strand fish in side-channel areas. A number of laws, regulations and programs require that this situation be remedied. For instance:
The DFG's 1993 Action Plan includes measures to Ifadopt
(a) Section 34061b) (17) of the CVPIA requires that the Secretary of Interior "direct and implement a program to resolve . . . upstream stranding problems related to Anderson- Cottonwood Irrigation District Diversion Dam operations" ( U . S . Congress 1992, p. 18).
(b) The FWS' DAFRP identifies as a medium priority action for the upper Sacramento to "implement operational modifications to Anderson-Cottonwood Irrigation District's diversion dam to eliminate passage and stranding problems for chinook salmon and steelhead adults and early life stages . . . I 1 (FWS 1995, p. 31).
(c) The DFG's 1993 Action Plan includes a recommendation to "correct fish passage and fluctuation problems at Anderson- Cottonwood Irrigation District's diversion damf1 (DFG 1993, p. VII-17).
Some interim measures have been taken to reduce extreme flow fluctuations at the ACID's dam. A feasibility study has been completed which identifies operational changes to the dam that will serve to reduce impacts on chinook salmon.
Action 4 - Catesory (1): Complete an inventory and assessment of all water withdrawal sites that affect critical habitat, and take action to conserve irrigation water and increase stream flows.
7

I
The DFG has completed an inventory of surface water withdrawal sites. The SWRCB also has extensive information on surface and groundwater withdrawal sites. developing recommendations to improve ecosystem health and water quality in the Bay/Delta. The SWRCB is expected to play a major role in implementing CALFED's recommendations.
Objective 4. Preserve and restore riparian habitat and meander belts along the Sacramento River and the Sacramento-San Joaquin Delta - PRIORITY 2. Action 1 - Catesory ( 2 ) : Avoid any loss or additional fragmen- tation of the riparian habitat in acreage, lineal coverage, or habitat value, and provide in-kind mitigation when such losses are unavoidable.
CALFED' is in the process of
This action reiterates a policy included in the San Francisco Estuary Project's (SFEP's) Comprehensive Conservation and Management Plan, to "protect existing shaded riverine aquatic habitats to ensure no net l o s s of acreage, lineal coverage, and habitat value within the Estuary . . . . "(SFEP 1993, p. 85). This "no net loss1f concept is also reflected in Section 3406(a) (3) of the CVPIA, which states that "the mitigation for fish and wildlife losses incurred as a result of construction, operation, or maintenance of the Central Valley Project shall be based on the replacement of ecologically equivalent habitat . . . I 1 (U.S. Congress 1992, p. 11). The NMFS is also concerned with upholding this policy in its advisory capacity with regard to issuance of dredging permits by the Army Corps of Engineers (ACOE) under Section 404 of the Clean Water Act (CWA).
Action 2 - Catesory (1): Assess riparian habitat along the Sacramento River from Keswick Dam to Chipps Island and along Delta waterways within the rearing and migratory corridor of juvenile winter-run chinook salmon.
A Geographic Information System inventory of riparian habitat on the upper Sacramento River between Keswick and Verona was funded with monies provided by California Senate Bill 1086 (Upper Sacramento R.iver Advisory Council 1989). CALFED is expected to sponsor a full assessment of habitat in the Bay/Delta system not covered by SB 1086.
Action 3 - Catesorv (1): Develop and implement a Sacramento River and Delta Riparian Habitat Restoration and Management Plan.
'CALFED is a consortium of state and federal management and regulatory responsibilities in the Bay-Delta.
agencies with San Francisco

A number of restoration plans covering the river and delta are in various stages of development/implementation. For instance:
(a) The Upper Sacramento River Fisheries and Riparian Habitat Management Plan includes findings and recommendations for restoring riparian habitat on the Sacramento River between Keswick and Verona Sacramento River Advisory Council 1989).
(b) The DFG's 1993 Action Plan describes needs of Central Valley anadromous fish habitat and identifies and prioritizes specific actions to meet those needs. The Plan includes such restoration measures as: "establish and maintain a Sacramento River meander belt and limit future bank protection to protect instream and riparian habitat," 'Iremove Sacramento River bank rip-rap and restore riparian wetland and anadromous fish habitat,!! "continue acquisition of land and conservation easements to protect the riparian corridor,11 "continue planting riparian vegetation," and "seek general plan amendments to establish protection zones for riparian vegetation" (DFG 1993, pp. VII-176~18). Progress towards Plan implementation is described in DFG (1995).
(Upper
(c) The FWS' DAFRP attaches high priority to riparian habitat restoration. One such DAFRP action is to "pursue opportunities to create a meander belt from Keswick Dam to Chico landing to recruit gravel and large woody debris, to moderate temperatures and to enhance nutrient input" (FWS 1995, p. 30). The DAFRP also includes a number of high priority evaluations relevant to habitat restoration: For instance, restore riparian vegetation from Keswick Dam to Chico Landing that are consistent with the overall river regulation plan" (qp. &. , p. 31) ; "identify opportunities for restoring riparian forests in channelized sections of the upper mainstem Sacramento River that are appropriate with flood control and other water management constraints" (a. u., p. 32); "evaluate potential benefits and opportunities to increase salmonid production through improved riparian habitats in the Delta" (a. u., p. 88); and "evaluate riparian restoration opportunities, such as conservation easements, that are coordinated with restoration of rearing habitats and consistent with flood control and other objectives" (z. &., p. 89).
(d) CALFED is evaluating a number of alternative approaches to Delta water conveyance and storage. Each approach includes a common ecosystem quality program which, when completed, is expected to provide significant habitat improvement in the San Francisco Bay/Delta (CALFED 1996a, 199633).
"eva1uat.e opportunities to incorporate flows to
9

(e) The SWRCB's Water Quality Control Plan for the Bay/Delta Estuary includes a recommendation to llimplement actions needed to restore and preserve marsh, riparian and upland habitat in and upstream of the Deltal) (SWRCB 1995, p. 38).
Action 4 - Cateqorv (3): and/or amend the Sacramento River Flood Control and Sacramento Bank Protection projects to recognize and ensure the protection of riparian habitat values for fish and wildlife.
Encourage Congress to reauthorize
The ACOE provides mitigation for fish and wildlife losses associated with operation of the Flood Control and Bank Protection projects. legislation for the projects are needed which explicitly authorize the incorporation of wildlife protection features into project design.
Objective 5. 2.
Action 1 - Cateqory (2): habitat in either acreage or habitat value, and provide in-kind mitigation when losses are unavoidable.
This action is similar to Action 1.3.1 except that it refers to tidal marsh rather than riparian habitat. this action represents a general policy for which implementation is an ongoing responsibility under a number of existing mandates, including Section 404 of the CWA,
Action 2 - Cateqorv (1): Conserve and restore tidal marsh and shallow water habitat within winter-run chinook salmon rearing and migratory habitats.
The FWS' opportunities to create tidal shallow-water habitat to increase rearing habitat for anadromous fish in the Delta" p. 89). Estuary includes a broader recommendation to "implement actions needed to restore and preserve marsh, in and upstream of the Delta" Restoration activities are also expected to be implemented by CALFED, although specific plans have not yet been made.
Objective 6. agricultural sources - PRIORITY 2.
However, changes in the enabling
Preserve and restore tidal marsh habitat - PRIORITY
Avoid further loss of tidal marsh
Like Action 1.3.1,
DAFRP identifies as high priority a need to "evaluate
The SWRCB's Water Quality Control Plan for the Bay/Delta
riparian and upland habitat
(FWS 1995,
(SWRCB 1995, p. 38).
Reduce pollution from industrial, municipal, and
Action 1 - Cateqorv (1): Control contaminant input from Colusa Basin Drain into the Sacramento River.
The Colusa Basin Drain captures water from the Tehama-Colusa and Glenn-Colusa irrigation districts and discharges it into the
10

Sacramento River at Knights Landing. It is the largest source of agricultural return flows to the Sacramento River, major contributor of warm water and a major source of pesticides, turbidity, suspended sediments, dissolved solids, nutrients and trace metals. Colusa Basin Drain is included on the list of federal water quality limited waterbodies maintained by the Central Valley Regional Water Quality Control Board (CVRWQCB). The SWRCB's Nonpoint Source Management Plan directs the CVRWQCB to "work with local water agencies to reduce the volume of irrigation return flows by increasing tailwater recycling and effluent spreading on fallow fields, primarily in the Colusa Basin Drainage" (SWRCB 1988, p. 28).
and is thus a
Action 2 - Catesory ( 2 1 : Reduce contaminant input to the Sacramento River, Delta, and San Francisco Bay from municipal treatment plants.
Discharges from municipal treatment plants are subject to permitting requirements under the National Pollution Discharge Elimination System (NPDES), established under the CWA. Treatment plants are also required to meet water quality objectives established in Regional Water Quality Control Plans (RWQCBs) and implemented through waste discharge requirements.
Action 3 - Catesory ( 2 ) : Control contaminant inputs to the Sacramento River system by constructing and operating stormwater treatment facilities and implementing industrial Best Management Practices (BMPs) for stormwater and erosion control.
Discharges from storm drains are subject to NPDES permitting requirements, as established under the CWA. BMPs may also be required to control nonpoint source discharges from ancillary industrial activities.
Action 4 - Catesory (1): Reduce selenium discharge into the North Bay to levels which protect winter-run chinook and their Prey - Industrial facilities are mandated to comply with selenium discharge standards est.ablished by the EPA and the San Francisco Bay Regional Water Quality Control Board (SFBRWQCB).
Action 5 - Catesories (l), ( 3) : Conduct an assessment/monitoring program of contaminant input from other major agricultural drainages in the Sacramento River watershed.
This action gives top priority to Sutter Bypass, Butte Slough, Reclamation District 108 and Jack Slough. The list of federal water quality limited wfaterbodies maintained under Section 303 the CWA by the CVRWQCB includes Butte Slough. Since the Board not required to address agricultural drainages that are not listed, it does not have a program to evaluate them. Thus the
of is
11

portion of this action pertainins to assessment/monitorinq prosrams for Sutter Bypass, Reclamation District 108 and Jack Slouqh is attributable to the Recovery Plan.
Action 6 - Catesory (1): Monitor the contaminant input from dormant orchard spraying in the Sacramento River.
This action is being implemented by the California Department of Pesticide Regulation (DPR) .
Action 7 - Catesory (3): Monitor contaminant inputs from rice stubble decomposition flooding and waterfowl habitat development and remedy as- needed.
Although contaminant monitoring is conducted during the spring months (when pesticides are being applied to the rice fields), it does not occur during the winter months--when rice stubble decomposition flooding occurs.
Objective 7. River watershed and the Sacramento-San Joaquin D e l t a , and San Francisco Bay-Estuary - PRIORITY 2.
Action 1 - Catesories (l), ( 3 ) : Establish, implement, enforce, and monitor temperature, dissolved oxygen and salinity water quality standards and objectives for the Sacramento River, the Sacramento-San Joaquin Delta, and San Francisco Bay that protect all life history stages of chinook salmon and their prey.
Water temperature standards specified in the Basin Plan and Water Rights Order 90-5 (s56'F from Keswick Dam to Hamilton City and s60'F below Hamilton City and throughout the Sacramento/San Joaquin Delta) are deemed adequate to protect chinook salmon. In Water Rights Order 95-6, the SWRCB addresses salinity standards for Suisun Marsh in the context of operation of the CVP and the SWP. The Suisun Ecological Workgroup, an multi- organization group convened by the SWRCB, will be conducting a scientific review of the salinity standards, with one component of the review being consideration of adverse impacts on winter- run chinook,
Provide suitable water quality in the Sacramento
Existing standards for dissolved oxygen are deemed adequate to protect the winter run in some but not all areas of the Sacramento River and Delta. In order to ensure adequate protection for winter-run chinook, this action recommends a chanse in the dissolved oxyqen standard from 25 mq/l to 27 ms/l on a year-round basis in Georsiana Sloush, Montezuma Sloush, Three Mile Slouqh, the lower San Joaquin River from its confluence with Mokelumne River to the Antioch Bridse, lower Old River and Middle River.
12

Action 2 - Cateqorv (1): objectives for priority pollutants similar to those in the revoked Inland Surface Water Plan and the Enclosed Bays and Estuaries Plan, which protect all life history stages of chinook salmon and their prey.
Establish numeric water quality
The SWRCB is working on the supporting documentation needed to reinstate the water quality objectives in the Inland Surface Water Plan and the Enclosed Bays and Estuaries Plan, which were rescinded due to litigation. the EPA to develop a California Toxics Rule to ensure water quality protection. in the spring of 1997.
Rescission of these Plans prompted
The EPA's Rule is expected to be published
Action 3 - Cateqorv ( 2 1 : Implement, enforce and monitor all water quality objectives necessary for the protection of fishery uses through the waste discharge permitting process.
The vehicle for implementation of this action is the NPDES, established under the CWA.
Action 4 - Cateqories (l), ( 3) : Establish numeric water quality objectives for pesticides, herbicides, and organic and inorganic compounds to protect all life stages of chinook salmon and their Prey *
The specific compounds named in this action include methyl parathion, diazinon, tributyltin, chlorpyrifos, carbofuran, malathion, molybdenum, boron, acrolein, ethyl parathion and triazines. Methyl parathion was banned by the EPA in 1991; acrolein is on the Priority Pollutant List. The remaining nine compounds, however, are not being addressed at the federal or state level. Even reinstatement of the Inland Surface Waters and Enclosed Bays and Estuaries Plans (as recommended under Action 1.7.2 above) will not suffice to address these compounds, since they are not included in either of those Plans. Thus establishment of water quality obiectives for the comDounds identified in this action (other than methyl parathion and acrolein) is attributable to the Recovery Plan.
Objective 8. Protect and maintain gravel resources in the Sacramento River and it,s tributaries between Keswick Dam and R e d Bluff - PRIORITY 3.
Action 1 - Cateqorv (1): Restore, replenish, and monitor spawning gravel in the Sacramento River.
A number of gravel restoration projects have been completed or are underway on the Sacramento River. Gravel replenishment is mandated by a number of laws, regulations and programs. For instance :
13

(a) The DFG's 1993 Action Plan includes two measures to ensure adequate spawning gravel on the mainstem Sacramento: "Develop and implement a continuing program for the purpose of restoring and replenishing, as needed, spawning gravel lost due to the construction and operation of CVP dams, bank protection projects, and other actions that have reduced the availability of spawning gravel and rearing habitat in the Sacramento River from Keswick Dam to RBDD" (DFG 1993, p. VII-18) and "Continue monitoring upper Sacramento River spawning gravel restorationf1 (op. u., p. VII-19). (b) Section 3406(b) (13) of the CVPIA directs the Secretary of the Interior to "develop and implement a continuing program for the purpose of restoring and replenishing, as needed, spawning gravel lost due to the construction and operation of Central Valley Project dams, bank protection projects and other actions that have reduced the availability of spawning gravel and rearing habitat in the Upper Sacramento River from Keswick Dam to Red Bluff Diversion Dam . . . I 1 (U.S. Congress 1992, p. 17).
(c) The FWS' DAFRP specifies as a high priority action for the upper Sacramento to "develop and implement a program for restoring and replenishing spawning gravel, where appropriate, in the Sacramento River" (FWS 1995, p . 31).
(d) The SWRCB's 1995 Water Quality Control Plan for the Bay/Delta Estuary includes a recommendation to "expand the gravel replacement and maintenance programs for salmonid spawning habitat" (SWRCB 1995, p. 37).
Action 2 - Catesories (11, ( 3): Develop and implement a plan to protect all natural sources of spawning gravel in the high water channels and along the flood plains of the Sacramento River and its tributaries.
The need to protect spawning gravel is recognized in the FWS' DAFRP in the form of a high priority action to llestablish limits on instream gravel mining operations by working with state and local agencies to protect spawning gravel and enhance recruitment of spawning gravel to the Sacramento River in the valley sections of Cottonwood Creek" (FWS 1995, p. 37). This action also specifically calls for development of Assresate Resource Manasement Plans (ARMPs) for Shasta and Tehama counties.
Action 3 - Cateqorv (2): Control excessive silt discharges to protect spawning gravel in the mainstem by protecting watersheds in the Sacramento River system.
T h e FWS' DAFRP attaches high priority to controlling sedimentation on Sacramento River tributaries. Some of the actions identified in this regard are to "develop an erosion
14

control and stream corridor protection program to prevent habitat degradation due to sedimentation and urbanization [on Clear Creek]" (FWS 1995, p. 35); !'work with Tehama County to develop an erosion control ordinance to minimize sediment input into Elder Creek" (op. u., p. 42) ; "identify and evaluate restoring highly erodable watershed areas [on Thomes Creek]" (op. &., p. 45); "cooperate with local landowners to encourage revegetation of denuded stream reaches and establish a protected riparian strip [on Big Chico Creek]" (op. &., p. 49); "cleanse spawning gravel of fine sediments and prevent sedimentation of spawning gravel [on the Mokelumne River]Ir (op. &., p. 68); and "rehabilitate damaged areas and remedy incompatible land practices to reduce sedimentation and instream water temperatures [on the Consumnes River]" (op. &., p. 71).
Another mandate to control siltation is the SWRCB's Nonpoint Source Management Plan, which instructs the CVRWQCB to "investigate potential problems and require appropriate mitigation action (which may include BMP's [Best Management Practices]) to control erosion/sedimentation problems from various land disturbing activitiesfr (SWRCB 1988, p. 27).
Objective 9. Reduce habitat loss, entrainment, and pollution from dredging and dredge disposal operations - PRIORITY 3. Action 1 - Catesory (2)- : Conduct dredging and disposal operations to minimize entrainment of juvenile winter-run chinook salmon, habitat loss, and water quality degradation.
The NMFS routinely considers impacts on winter-run chinook and their habitat in reviewing Section 404 dredging permits issued by the ACOE. The NMFS also evaluates proposals for in-Bay dredge disposal in accordance with guidelines established by the EPA in 1992 for ocean disposal (EPA 1992).
Action 2 - Catesorv (1): Minimize the volume of dredge material disposed into the San Francisco Bay and Estuary.
The Long-Term Managemen.t Strategy (LTMS) is a federal/state cooperative effort to provide a regional plan for the disposal of dredged materials from San Francisco Bay. The two goals of the LTMS are to minimize in-Bay disposal and increase beneficial reuse of dredge spoils. A Draft Environmental Impact Statement (EIS) fo r the LTMS has been prepared which evaluates various disposal options. All of the options considered would significantly reduce in-Bay disposal relative to the status quo; the preferred option provides for least in-Bay disposal and maximum beneficial reuse. The Final EIS and management plan are expected to be completed in the fall of 1997.
15

GOAL 11. IMPROVE SURVIVAL OF DOWNSTREAM MIGRANTS.
Objective 1. inadequately screened diversions on the Sacramento River, Sacramento-San Joaquin Delta, and Suisun Marsh - PRIORITY 1.
Maximize survival of juveniles at unscreened or
Action 1 - Cateqory (1): Develop and implement a comprehensive plan to install positive barrier fish screens at unscreened or poorly screened diversions on the Sacramento River, Sacramento- San Joaquin Delta, and Suisun Marsh sloughs.
Screening of diversions is mandated by a number of existing laws, regulations and programs. For instance:
(a) Section 3406(b) (21) of the CVPIA directs the Secretary of the Interior to "assist the state of California in efforts to develop and implement measures to avoid losses of juvenile anadromous fish resulting from unscreened or inadequately screened diversions on the Sacramento and San Joaquin rivers, their tributaries, the Sacramento-San Joaquin Delta, and the Suisun Marsh. Such measures shall include but shall not be limited to construction of screens on unscreened diversions, rehabilitation of existing screens replacement of existing non-functioning screens, and relocation of diversions to less fishery-sensitive areas" (U.S. Congress 1992, p. 19). Section 3406(b) (4) and Section 3406(b) (5) address the need for fish screens at the Tracy Pumping Plant and Contra Costa Canal Pumping Plan No. 1 respectively.
(b) The FWS' DAFRP includes a number of medium priority screening actions for the upper Sacramento. These include actions to "continue to implement the Anadromous Fish Screen Program" (FWS 1995, p. 30), and ll...structural modifications to improve the strength of the fish screens [at the ACID diversion dam]" (op. &., p. 31). With regard to Battle Creek, the DAFRP includes an action to "construct fish screens on all PG&E diversions after both phases of upstream actions . . . are completed and fish ladders on Coleman Powerhouse and Eagle Canyon Diversion Dams are opened" (z. u., p. 40). (c) The NMFS' 1993 BO on the CVP/SWP specifies screening requirements, as follows: "The Bureau must prevent entrainment of winter-run chinook salmon fry and juveniles at the intakes of the existing 125 cfs pumps at Red Bluff Diversion Dam" (NMFS 1993b, p. 6 9 ) . Additionally, "the Bureau in coordination with the California Department of Water Resources must develop and implement a demonstration screening program designed to promote the advancement of state-of-the-art positive-barrier screening technology at small unscreened diversions along the Sacramento River and within Delta waterways" (op. &. , p . 71).
16

(d) The 1993 DFG Action Plan attaches high priority to an action to "screen the larger diversions on the Sacramento River" (DFG 1993, p. VII-17).
(e) The DFG's 19134 Fish Screen Action Plan established a priority order for screening diversions. The Plan states that "diversions in the critical habitat of winter run chinook salmon would take precedence over all other diversions.. . I 1 (DFG 1994, p . 1) . (f) The SWRCB's WR 95-1 includes several screening recommendations, namely to "reduce losses of all stages of fishes to unscreened water diversions1' (SWRCB 1995, p. 34), and "reduce entrainment by, and improve fish survival at, the SWP and CVP export facilities...i1 (op. &., p. 35).
(9) All alternatives being considered by CALFED for Delta water conveyance and storage include a common Ecosystem Restoration Program. According to CALFED, "A priority of fish screening needs f o r existing Bay-Delta system diversions will be developed and included in the common Ecosystem Restoration Program for each alternative. This will include screening needs within the Delta and on the upstream Sacramento and San Joaquin rivers and tributaries . . . . For all three alternatives, fish screen improvements are included at existing Project Pumps" (CALFED 1996b, second unnumbered page).
Action 2 - Cateqory (3): Evaluate water rights for operators initiating diversions in the winter for rice stubble decomposition and waterfowl habitat development.
Due to air pollution concerns, the customary practice of burning rice stubble is being phased out and replaced by winter flooding of rice fields, which allows more natural decomposition of stubble. The timing and magnitude of Sacramento River water diversions for rice stubble decomposition coincides with the rearing and migration period of juvenile winter-run chinook. This action requests that the SWRCB determine whether such diversions constitute a new water right subject to screening requirements.
Action 3 - Cateqorv (3)-: Promulgate and implement a Federal Rule to require the screening of water diversions in the critical habitat and natural migratory pathways of winter-run chinook salmon.
While a number of mandates exist for screening of water diversions (see Action II.1.1), there is no Federal Rule that requires this specifica.lly for the benefit of winter-run chinook.
17
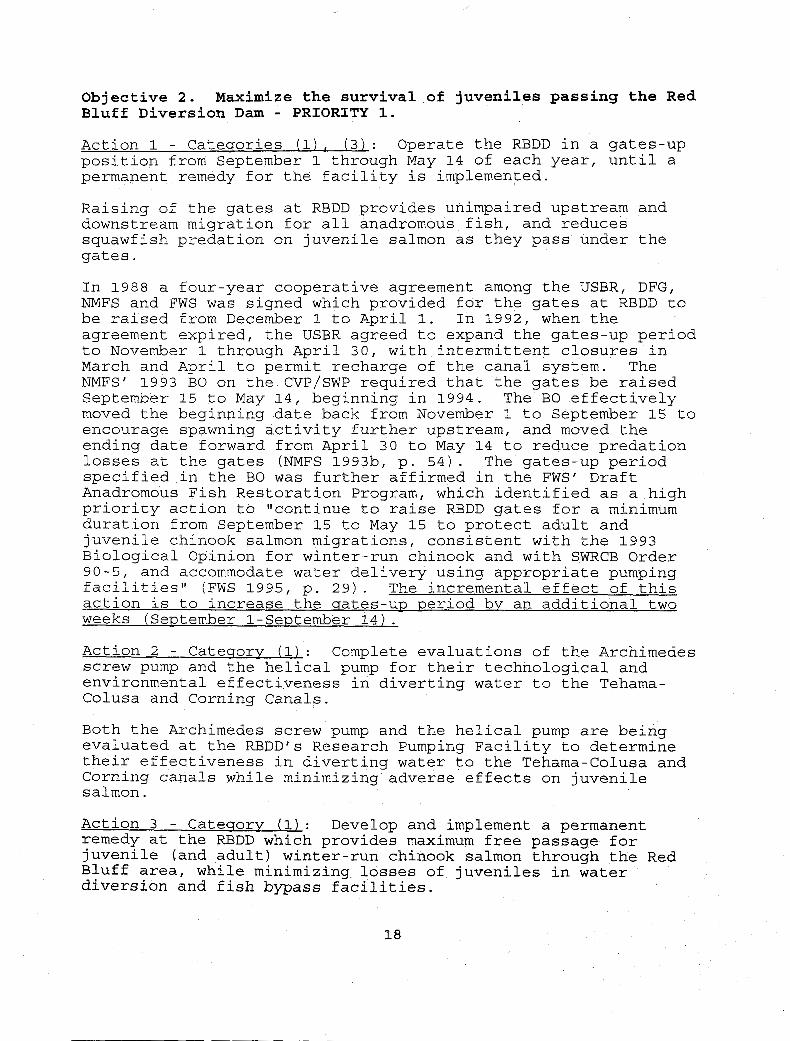
Objective 2. Bluff Diversion Dam - PRIORITY 1. Action 1 - Catesories (11, ( 3): Operate the RBDD in a gates-up position from September 1 through May 14 of each year, until a permanent remedy for the facility is implemented.
Raising of the gates at RBDD provides unimpaired upstream and downstream migration for all anadromous fish, and reduces squawfish predation on juvenile salmon as they pass under the gates.
In 1988 a four-year cooperative agreement among the USBR, DFG, NMFS and FWS was signed which provided for the gates at RBDD to be raised from December 1 to April 1. In 1992, when the agreement expired, the USBR agreed to expand the gates-up period to November 1 through April 30, with intermittent closures in March and April to permit recharge of the canal system. The NMFS' 1993 BO on the CVP/SWP required that the gates be raised September 15 to May 14, beginning in 1994. The BO effectively moved the beginning date back from November 1 to September 15 to encourage spawning activity further upstream, and moved the ending date forward from April 30 to May 14 to reduce predation losses at the gates (NMFS 1993b, p. 54). The gates-up period specified in the BO was further affirmed in the FWS' Draft Anadromous Fish Restoration Program, which identified as a high priority action to I1continue to raise RBDD gates for a minimum duration from September 15 to May 15 to protect adult and juvenile chinook salmon migrations, consistent with the 1993 Biological Opinion for winter-run chinook and with SWRCB Order 90-5, and accommodate water delivery using appropriate pumping facilities1' (FWS 1995, p. 29). The incremental effect of this action is to increase the sates-up period bv an additional two weeks (September 1-Segtember 14).
Action 2 - Catesorv (1): Complete evaluations of the Archimedes screw pump and the helical pump for their technological and environmental effectiveness in diverting water to the Tehama- Colusa and Corning Canals.
Both the Archimedes screw pump and the helical pump are being evaluated at the RBDD's Research Pumping Facility to determine their effectiveness in diverting water to the Tehama-Colusa and Corning canals while minimizing adverse effects on juvenile salmon.
Maximize the survival of juveniles passing the Red
Action 3 - Catesorv (1): Develop and implement a permanent remedy at the RBDD which provides maximum free passage for juvenile (and adult) winter-run chinook salmon through the Red Bluff area, while minimizing losses of juveniles in water diversion and fish bypass facilities.

The need for a permanent remedy for fish passage problems at RBDD is addressed by a number of existing laws, regulations and programs. For instance:
(a) Section 3406(b) (10) of the CVPIA directs the Secretary of the Interior to "develop and implement measures to minimize fish passage problems for adult and juvenile anadromous fish at the Red Bluff Diversion Dam in a manner that provides for the use of associated Central Valley Project conveyance facilities for delivery of water to the Sacramento Valley National Wildlife Refuge complex . . . I i (U.S. Congress 1992, p . 16).
(b) The DFG's 19913 Action Plan specifies as high priority an action to "develop and implement permanent measures to minimize fish passage problems for adult and juvenile anadromous fish at the RBDD in a manner that provides for the use of associated CVP conveyance facilities for delivery of water to the Sacramento Valley National Wildlife Refuge complex" (DFG 1993, p . VII-17).
(c) A high priority evaluation for the upper Sacramento specified in the FWS' DAFRP is to "continue the evaluation to identify solutions to passage at RBDD, including measures to improve passage whenever the RBDD gates are closed" (FWS 1995, p . 31).
In 1995 the FWS and USBR entered into a cooperative arrangement to address the fish passage problem at RBDD. A number of studies related to this issue have been completed or are in progress.
Objective 3. Maximize survival of juvenile winter-run chinook salmon passing the Glenn-Colusa Irrigation District's Hamilton City Pumping Plant - PRIORITY 1. Action 1 - Category (1): For the interim, the Glen-Colusa Irrigation District should maximize the survival of juvenile winter-run chinook by operating the Hamilton City facility as described in the Federal Joint Stipulated Agreement until a new water diversion and fish screening facility is constructed and operational.
A Federal Joint Stipulated Agreement--signed by the Glen-Colusa Irrigation District (GCID), Department of Justice, DFG and USBR-- specifies requirements at GCID to protect winter run.
Action 2 - Cateqory (1): Design and construct new positive barrier fish screens at the GCID's Hamilton City Pumping Plant which meet NMFS and DFG screening and bypass criteria.
Due to significant hydraulic changes in the Sacramento River since construction of the original fish screens at the GCID
19

Pumping Plant, the elevation of the entrance to the diversion has been lowered by three feet. area of screen surfaces and increased velocity through the screens, resulting in impingement of juvenile fish. Bypass flows are insufficient to allow juveniles to return to the river.
A number of existing laws, regulations and programs recognize the need for adequate fish screens at GCID.
This has decreased the effective
For instance:
(a) Section 3406(b) (20) of the CVPIA directs the Secretary of the Interior to lfparticipate with the State of California and other federal agencies in the implementation of the on- going programs to mitigate fully for the fishery impacts associated with operations of the Glenn-Colusa Irrigation District's Hamilton City Pumping Plant. Such participation shall include replacement of the defective fish screens and fish recovery facilities associated with the Hamilton City Pumping Plant" (U.S. Congress, pp. 18-19).
(b) The NMFS' 1993 BO on the GCID states that "GCID shall pursue, in good faith, a long-term solution for protecting winter-run chinook salmon at its Hamilton City pumping facility. have as its goal the implementation of state-of-the-art fish screening technology and conformance with all fish screen criteria as specified by the Southwest Region, NMFS" (NMFS 1993a, p. 13).
(c) The DFG's 1993 Action Plan states that "a permanent solution to the problem [entrainment at GCID] is needed, not only to protect winter-run chinook, but all other migratory fish as well. An environmental impact report is being prepared for the permanent solution" (DFG 1993, pp. VII-13 and 14). The DFG goes on to specify as a high priority action to "resolve entrainment problems at the Glenn-Colusa Irrigation District's Hamilton City Pumping Plant" (op.
The long-term fishery conservation measure shall
&., p. VII-17).
(d) The FWS' DAFRP identifies as a medium priority action to "implement structural and operational modifications to the Glenn-Colusa Irrigation District's (GCID) water diversion facility to minimize impingement and entrainment of juvenile salmon" (FWS 1995, p . 30).
A draft EIS has been completed which evaluates alternative approaches to addressing the fish passage problem. alternative is expected to be chosen soon, with construction projected to be completed by September 1999.
The preferred

Objective 4. Protect and restore rearing and migratory habitats of winter-run chinook in the lower Sacramento River and Delta to maximize survival of rearing and emigrating fish - PRIORITY 1. Action 1 - Catesorv (2): Implement interim measures to protect rearing and emigrating winter-run chinook salmon from November 1 through April 30.
This action reaffirms the need for ongoing support of protective measures contained in the 1994 Principles for Agreement on Bay- Delta Standards. It a l s o provides guidelines for protecting winter-run chinook during their rearing and migratory stages until a long-term solution is found.
Action 2 - Catesorv (2): For the long-term protection of winter- run chinook salmon, identify and implement actions to significantly improve hydrodynamic conditions in the Delta.
This action reaffirms the importance of evaluating modifications to Delta hydrodynamic conditions in terms of their long-term effects on winter-run chinook. This issue is expected to be addressed in the context of the CALFED Bay-Delta Program.
Action 3 - Cateqory (3): Evaluate the survival of juvenile winter-run chinook salmon in the Delta using experimental mark- recapture experiments with surrogate chinook salmon or other appropriate methodologies. Using data from these studies, develop a model or method which assesses survival under varying hydrologic conditions.
A model relating chinook survival to hydrologic conditions is being developed at the University of California (UC) at Berkeley for the San Joaquin River. Planning is underway to collect the experimental mark-recapture data needed for model estimation. No similar efforts are being undertaken for Sacramento River chinook.
Objective 5. Evaluate and reduce adverse impacts associated with operating the Suisun Marsh Salinity Control Structure - PRIORITY
Action 1 - Catesorv (ll-: Complete the assessment on the operational effects of the Suisun Marsh Salinity Control Structure (SMSCS) on juvenile (and adult) winter-run chinook salmon detailed in the NMFS's BO for the Federal Central Valley and State Water projects.
This action reaffirms the NMFS' 1993 BO on the CVP/SWP, which states that "The California Department of Water Resources in coordination with the Eureau must develop and implement a program of chinook investigqt ions the SMSCS and within Montezuma' Slou .'*Chinook s d l m o nvestigations must be designed
21
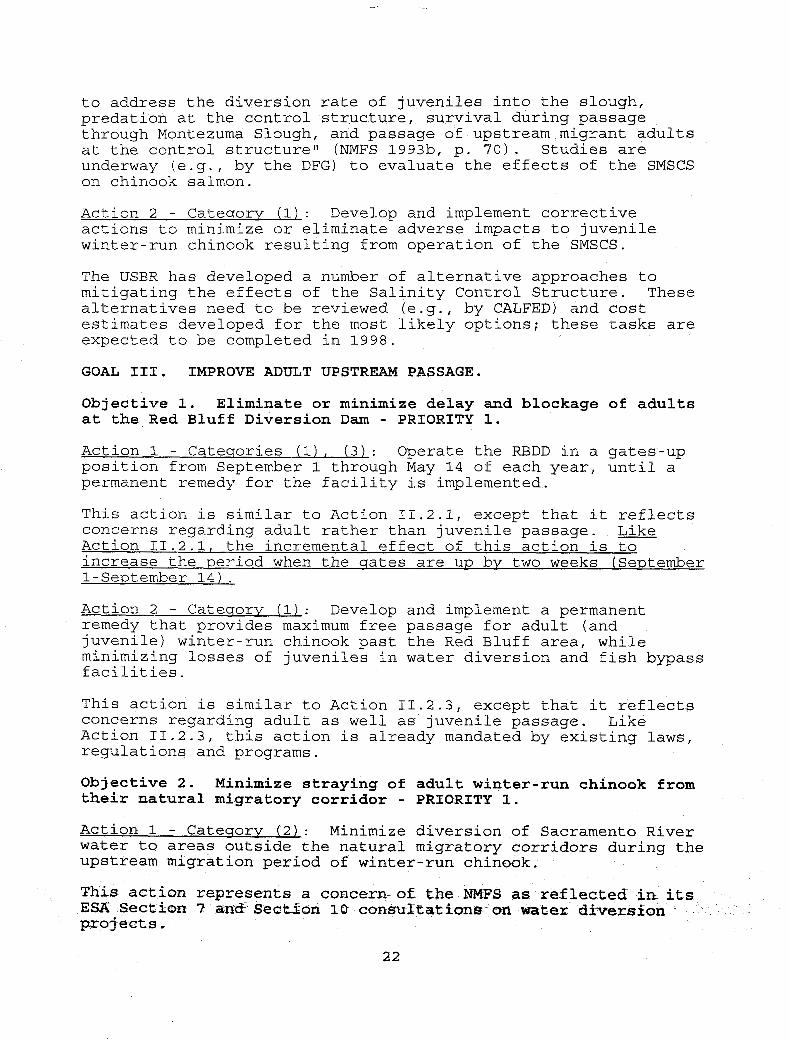
to address the diversion rate of juveniles into the slough, predation at the control structure, survival during passage through Montezuma Slough, and passage of upstream migrant adults at the control structure" (NMFS 1993b, p. 70). Studies are underway (e.g., by the DFG) to evaluate the effects of the SMSCS on chinook salmon.
Action 2 - Cateqorv (1): Develop and implement corrective actions to minimize or eliminate adverse impacts to juvenile winter-run chinook resulting from operation of the SMSCS.
The USBR has developed a number of alternative approaches to mitigating the effects of the Salinity Control Structure. These alternatives need to be reviewed (e.g., by CALFED) and cost estimates developed for the most likely options; these tasks are expected to be completed in 1998.
GOAL 111. IMPROVE ADULT UPSTREAM PASSAGE.
Objective 1. Eliminate or minimize delay and blockage of adults I I at the Red Bluff Diversion Dam - PRIORITY 1.
Action 1 - Cateqories (l), ( 3): Operate the RBDD in a gates-up position from September 1 through May 14 of each year, until a permanent remedy for the facility is implemented.
This action is similar to Action 11.2.1, except that it reflects concerns regarding adult rather than juvenile passage. Like Action 11.2.1, the incremental effect of this action is to increase the period when the qates are up bv two weeks (SeDtember - 1-September 14).
Action 2 - Cateqorv (1): Develop and implement a permanent remedy that provides maximum free passage for adult (and juvenile) winter-run chinook past the Red Bluff area, while minimizing losses of juveniles in water diversion and fish bypass facilities.
This action is similar to Action 11.2.3, except that it reflects concerns regarding adult as well as juvenile passage. Like Action 11.2.3, this action is already mandated by existing laws, regulations and programs.
Objective 2. Minimize straying of adult winter-run chinook from their natural migratory corridor - PRIORITY 1. Action 1 - Cateqorv (2): Minimize diversion of Sacramento River water to areas outside the natural migratory corridors during the upstream migration period of winter-run chinook.
T h i s action represents a concern- of the W F S as reflected i r r i C s ESA Section 3 a m t E S e ~ t i 6 a 10 consuftatbnson water diversion proJecta c
22

Action 2 - Cateqorv ClJ: Develop and implement corrective measures that prevent or reduce the straying of adult fish to the Colusa Basin Drain and the Delta Cross Channel, and allow passage back to the river at the upstream ends of the Sacramento Deep Water Ship Channel and the Sutter and Yolo flood bypass system.
This action is covered by various existing mandates. instance:
For
(a) The DFG's 1993 Action Plan ranks as high priority an action to "manage agricultural return flows from Colusa Drain and Sutter Slough to control water temperatures in the Sacramento River, and install barriers to upstream migration" (DFG 1993, p. VII-17).
(b) Section 3406(e) ( 5 ) of the CVPIA directs the Secretary of the Interior to investigate "measures to provide for modified operations and new or improved control structures at the Delta Cross Channel and Georqiana Sloush to assist in L
the successful migration of anadromous fish" (U. S , Congress 1992, p . 25).
(c) The ACOE is initiating a general review of flood control practices in the Sacramento watershed, including environmental impacts. NMFS participation is being invited, with one topic for consideration being fish passage problems at the Sutter and Yolo bypasses.
(d) The ACOE is considering the possibility of deauthorizing the lock connecting the Sacramento Deep Water Ship Channel with the Sacramento River (ACOE 1996). A major issue in this regard is the impact on fish passage. The ACOE is planning a full evaluation of the options associated with this issue.
Objective 3. at the ACID dam on the Sacramento River - PRIORITY 2.
Eliminate or minimize delay and blockage of adults
Action 1 - Cateqorv (1 ;L : Complete a feasibility study to identify, develop and evaluate alternatives to resolving fish passage problems at the ACID dam.
The fish ladder at the ACID dam is too narrow and flows are too low (60 cfs) to fully attract and pass upstream-migrating fish when the dam is in place April-October. A feasibility study is underway to address the issue of fish passage.
Action 2 - Cateqorv (1): Develop and implement permanent structural and operational remedies which minimize or eliminate adult passage problems at the ACID diversion dam or eliminate passage problems throu restoration of the natural channel.
2 3

,
This action is mandated by Section 3406(b) (17) of the CVPIA, which directs the Secretary of Interior to "direct and implement a program to resolve fishery passage problems at the Anderson- Cottonwood Irrigation District Diversion Dam . . . " (U.S. Congress 1992, p. 18). The FWS' DAFRP designates as a medium priority action to "implement operational modifications to Anderson- Cottonwood Irrigation District's (ACID) diversion dam to eliminate passage and stranding problems for chinook salmon and steelhead adults and early life stages . . . ' I (FWS 1995, p. 31).
Objective 4. Suisun Marsh - PRIORITY 2.
Evaluate and correct adult passage problems in the
Action 1 - Cateqorv (1): Complete evaluations to assess the effects of SMSCS operations on adult chinook migration.
Like Action 11.5.1, this action is mandated by the NMFS' 1993 BO on the CVP/SWP.
Action 2 - Cateqory (1): Develop and implement corrective actions which minimize delay and blockage of adult (and juvenile) winter-run chinook at the SMSCS.
Efforts to address this action (as well as the similar Action 11.5.2) are underway at the USBR.
Objective 5. the Keswick Dam Stilling Basin - PRIORITY 3. Action 1 - Cateqorv (1): Monitor the escape channel for its effectiveness in allowing adults to exit from the Keswick Dam stilling basin.
The spillway at Keswick Dam attracts salmon, including winter run, into a stilling basin that becomes isolated from the river when spills cease. Recently a small channel was excavated to allow fish to escape from the spillway back to the main river channel. Creation and monitoring of the escape channel has been mandated by a number of laws, regulations and programs. For instance :
Eliminate entrapment of adult winter-run chinook at
(a) Section 3406 (b) (11) of the CVPIA directs the Secretary of the Interior to "...modify the Keswick Dam Fish Trap to provide for its efficient operation at all project release levels and modify the basin below the Keswick Dam spillway to prevent the trapping of fish" (U.S. Congress 1992, p . 16).
(b) The NMFS' 1993 BO on the CVP/SWP states t h a t the "The Bureau [of Reclamation] must prevent the entrapment Q € winter-run chinook salmon a d u l t s within the stilling basin e€ Ifeswick Dam" (NMFS 1993b, p. 68)-
24-

(c) The DFG's 1993 Action Plan includes as a high priority action to "construct an effective escape channel in the west corner of the Keswick Dam stilling basin to protect salmon and steelhead" (DFG 1993, p. VII-17).
(d) The FWS' DAFRP identifies as a medium priority action to I1construct an escape channel for trapped adult chinook salmon and steelhead from the Keswick Dam stilling basin to the Sacramento Ri-ver, as designed by NMFS and USBRrl (FWS 1995, p. 29).
GOAL IV: PREVENT EXTINCTION THROUGH ARTIFICIAL PRODUCTION PROGRAMS.
Objective 1. run chinook - PRIORITY 3.
Assist in the recovery of Sacramento River winter-
Action 1 - Cateqory (11: The Winter-Run Chinook Salmon Artificial Propagation and Captive Broodstock programs should continue to be evaluated for their effectiveness in supporting the winter-run chinook salmon population.
This action reaffirms the need for evaluation cited in the NMFS' 1994 BO on the Coleman National Fish Hatchery (NFH). Specifically, the BO states that "The modified winter-run chinook salmon artificial propagation program and the proposed captive broodstock program shall remain limited in scope and duration until their effectiveness in enhancing the natural winter-run chinook salmon population without deleterious genetic or ecological effects has been clearly demonstrated (NMFS 1994a, p. 29).
Section 3406(e)(2) of the CVPIA directs the Secretary of the Interior to investigate flopportunities for additional hatchery production to mitigate the impacts of water development and operations on, or enhance efforts to increase Central Valley fisheries; provided, that additional hatchery production shall only be used to supplement or to re-establish natural production while avoiding adverse effects on remaining wild stocks" (U.S. Congress 1992, p. 14).
Action 2 - Cateqorv (ll-: Develop and implement measures that ensure hatchery produced juvenile winter-run chinook salmon imprint on the mainstem Sacramento River.
Hatchery produced winter-run chinook return to spawn in Battle Creek, where the Coleman NFH is located, rather than the mainstem Sacramento. As a result, hatchery-produced adults do not contribute offspring to the wild winter-run spawning population. Alternative release strategies are being explored to ensure that
is discussed in the NMFS' 1994 BO on operation of th leman - sh imprint on the Sacramento River. One s strategy
25
--
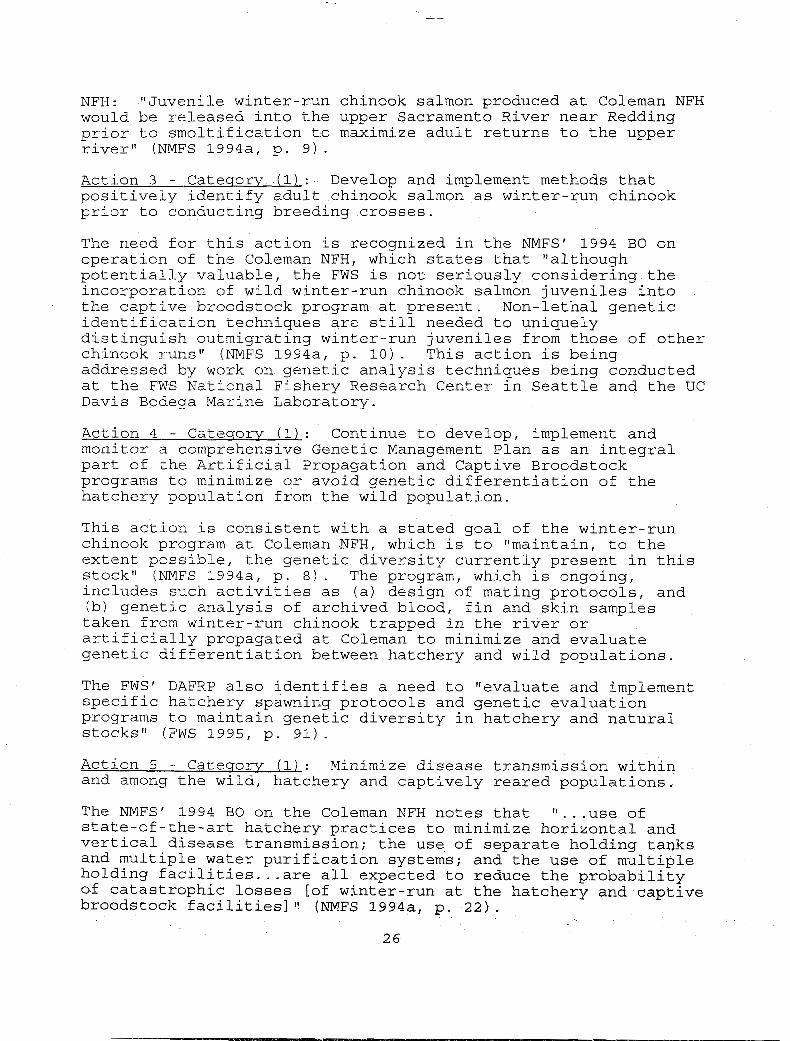
NFH: "Juvenile winter-run chinook salmon produced at Coleman NFH would be released into the upper Sacramento River near Redding prior to smoltification to maximize adult returns to the upper river" (NMFS 1994a, p. 9).
Action 3 - Catesory (1): Develop and implement methods that positively identify adult chinook salmon as winter-run chinook prior to conducting breeding crosses.
The need for this action is recognized in the NMFS' 1994 BO on operation of the Coleman NFH, which states that "although potentially valuable, the FWS is not seriously considering the incorporation of wild winter-run chinook salmon juveniles into the captive broodstock program at present. Non-lethal genetic identification techniques are still needed to uniquely distinguish outmigrating winter-run juveniles from those of other chinook runs" (NMFS 1994a, p. 10). This action is being addressed by work on genetic analysis techniques being conducted at the FWS National Fishery Research Center in Seattle and the UC Davis Bodega Marine Laboratory.
Action 4 - Cateqory (1): Continue to develop, implement and monitor a comprehensive Genetic Management Plan as an integral part of the Artificial Propagation and Captive Broodstock programs to minimize or avoid genetic differentiation of the hatchery population from the wild population.
This action is consistent with a stated goal of the winter-run chinook program at Coleman NFH, which is to "maintain, to the extent possible, the genetic diversity currently present in this stock" (NMFS 1994a, p. 8). The program, which is ongoing, includes such activities as (a) design of mating protocols, and (b) genetic analysis of archived blood, fin and skin samples taken from winter-run chinook trapped in the river or artificially propagated at Coleman to minimize and evaluate genetic differentiation between hatchery and wild populations.
The FWS' DAFRP also identifies a need to "evaluate and implement specific hatchery spawning protocols and genetic evaluation programs to maintain genetic diversity in hatchery and natural stocks" (FWS 1995, p. 91).
Action 5 - Cateqorv (1): Minimize disease transmission within and among the wild, hatchery and captively reared populations.
The NMFS' 1994 BO on the Coleman NFH notes that "...use of state-of-the-art hatchery practices to minimize horizontal and vertical disease transmission; the use of separate holding tanks and multiple water purification systems; and the use of multiple holding facilities . . . are all expected to reduce the probability of catastrophic losses [of winter-run at the hatchery and captive broodstock facilities] I1 (NMES 1994a, p . 2 2 ) .
2 6

The FWS' DAFRP includes several high priority actions and evaluations to reduce disease transmission at Coleman. For instance:
'!Continue to allow adult winter- and spring-run chinook salmon passage above the Coleman National Fish Hatchery (CNFH) weir. After a disease-safe water supply becomes available to the CNFH, allow passage of fall- and late-fall- run chinook salmon and steelhead above the CNFH weir. In the interim, prevent anadromous fish from entering the main hatchery water supply by blocking fish ladders at Wildcat Canyon, Eagle Canyon, and Coleman diversion dams" (FWS 1995, p. 38).
"Evaluate alternatives for providing a disease-safe water supply to CNFH so that winter-, spring- and fall-run chinook salmon and steelhead would have access to an additional 41 miles of Battle Creek habitat" (FWS 1995, p. 41).
Another evaluation included in the DAFRP is to "evaluate the transfer of disease between hatchery and natural stocks" (FWS 1995, p. 91). While the DAFRP recommendations cited in the two previous paragraphs are specific to the Coleman NFH, this is a more general recommendation.
GOAL V. REDUCE HARVEST AND INCIDENTAL TAKE IN COMMERCIAL AND RECREATIONAL FISHERIES.
Objective 1. Reduce adverse impacts of ocean commercial and recreational salmon fisheries - PRIORITY 1.
Action 1 - Cateqorv (11: Reduce ocean harvest rates on winter- run chinook salmon to allow the population to rapidly grow to stable levels and achieve recovery.
The Pacific Fishery Management Council (PFMC) is responsible for managing the ocean salmon fishery according to guidelines and procedures established by the Magnuson-Stevens Fishery Conservation and Management Act (MSFCMA) and for considering impacts of such management measures on listed species such as winter-run chinook (NMFS 1996). In addition to the general mandate provided by the MSFCMA, the NMFS' 1996 BO on the Salmon Fishery Management Plan (FMP) provides more detailed guidance regarding winter-run protection. Specifically, the BO directs that an amendment to the PFMC's Salmon FMP be adopted "to include management objectives for species that are currently listed under the ESA that are consistent with immediate conservation needs and the long-term recovery of listed species" (NMFS 1996, p. 38). The BO further states that "Pending completion of the FMP amendment, NMFS must reduce the incidental harvest of winter-run chinook by a minimum of 50% from the estimated current harvest level of 50% . . . . NMFS believes that a 50% harvest reduction will
27

increase escapement sufficiently to allow the two weak winter-run chinook year classes to increase above the threshold escapement level, and also allow the population to grow towards recovery"
Action 2 - Cateqory (1): Assess the feasibility of using genetic Mixed Stock Analysis to improve estimates of harvest rate on winter-run chinook salmon.
(a. a., pp. 39-40).
This action reaffirms the recommendation in the NMFS' 1996 BO on the Salmon FMP that "NMFS should assess the feasibility of using genetic Mixed Stock Analysis to improve estimates of harvest rate on Sacramento River winter-run chinook salmon" (NMFS 1996, p. 46). Such research is currently underway.
Objective 2. Reduce incidental take from in-river sport fisheries - PRIORITY 3. Action 1 - Cateqories ( 2 1 , ( 3): The NMFS and the DFG should continue monitoring of efforts by State and Federal enforcement personnel to ensure compliance with State fishery regulations.
This action affirms the general need for state and federal agencies to fulfill their responsibilities with regard to monitoring and enforcement of fishery regulations. The action also more specifically directs that "The California Department of Fish and Game should continue their creel census of the Sacramento River sport fishery. This information is necessary to monitor various fisheries' harvest rates and regional use patterns in order to assess the efficacy of regulations in reducing both direct harvest and incidental take of winter-run chinook" (p. 183). In 1994 the DFG terminated the creel census due to lack of funding. Resumption of the census, as recommended in this action, is therefore attributable to the Recovery Plan.
Objective 3. Develop information on the ocean distribution patterns of winter-run chinook - PRIORITY 3. Action 1 - Cateqory (l), ( 3 ) : Continue assessment of coded-wire- tag data collected from ocean salmon landings to develop additional information regarding winter-run chinook distribution patterns in the Pacific Ocean.
This action reaffirms one of the terms and conditions of the NMFS' 1996 BO on the Salmon FMP, namely that "NMFS in cooperation with the affected states and PFMC chair shall sample the fisheries for stock composition including the collection of coded wire tags (CWTs) in all fisheries and other biological information to allow for a thorough post-season analysis of fishery impacts on listed species" (NMFS 1996, p. 43). This action also sgecificallv requests that current samplinq efforts in the Fort Braqq, San Francisco and Monterev areas be increased
28

by 50%; this auqmentation in samplinq is attributable to the Recovery Plan.
GOAL VI: REDUCE IMPACTS OF OTHER FISH AND WILDLIFE MANAGEMENT PROGRAM.
Objective 1. bass management and restoration programs - PRIORITY 3.
Minimize impacts from the State and Federal striped
Action 1 - Cateqories (l), ( 2): Review and evaluate the effects of predation on the winter-run chinook population.
Evaluating the effects of striped bass predation on winter-run chinook is an ongoing responsibility of the NMFS under Sections 7 and 10 of the ESA. This recovery action also includes more specific requirements for investigations and a literature review, which is already mandated by the NMFS' 1995 BO on the Striped Bass Management Program, as follows:
!!The California Department of Fish and Game must develop information to improve understanding of the interaction of striped bass and juvenile chinook salmon within the Central Valley. A thorough literature review of predation on chinook salmon populations should be conducted, and used to assess potential predation levels within the Sacramento River and Delta. 1996, in consultation with NMFS, comprehensive laboratory and field investigations on predation impacts of striped bass on winter-run chinook salmon, and, if feasible, implement them by July 1997" (NMFS 1995, p. 20).
In addition, the DFG must evaluate by July
Action 2 - Cateqory (2): Develop and implement appropriate interim and long-term measures to minimize program impacts on winter-run chinook.
The NMFS' 1995 BO on t.he Striped Bass Management Program pertains only to program implementation in 1995 and 1996. The NMFS addressed the need for a longer term evaluation of the program by indicating in the cover letter accompanying the BO that "Since any stocking activities beyond 1996 are more appropriately addressed in an ESA Section 10 incidental take permit issued to the State, the terms and conditions of the incidental take statement also require that DFG obtain an incidental take permit under Section 10 of the ESA before continuing with its striped bass stocking program after 1996" (NMFS 1995, p. 2 ) . Thus this action is an ongoing responsibility of the NMFS under Section 10 of the ESA.
29

Objective 2. steelhead hatchery programs - PRIORITY 3.
Action 1 - Cateqory ( 2 ) : Evaluate impacts and develop, implement and monitor measures to reduce incidental take resulting from State-operated hatchery programs.
This action is an ongoing responsibility of the NMFS under Section 10 of the ESA.
Minimize impacts of State and Federal salmon and
Action 2 - Cateqorv (1): Continue to implement and monitor measures to reduce incidental take of winter-run chinook resulting from operation of Coleman National Fish Hatchery (NFH).
The NMFS' 1994 BO on the Coleman NFH specifies two terms and conditions relevant to this action:
"TO ensure incidental take of wild winter-run chinook salmon is minimized, Coleman NFH production goals for species other than winter-run chinook salmon should not be increased above the current levels that are described in the biological assessment prepared by the FWS" (NMFS 1994a, p. 34).
"The FWS shall prepare an investigation plan that evaluates the feasibility of conducting field and other studies to assess the extent to which the production and release of fall-run chinook, late-fall run chinook salmon, and steelhead trout at Coleman NFH adversely affect the wild winter-run chinook salmon population . . . . If the results from these studies indicate that the incidental take of winter- run chinook salmon is greater than anticipated, the FWS shall reinitiate consultation" (NMFS 1994a, p. 3 5 ) .
In its Water Quality Control Plan for the Bay/Delta Estuary, the SWRCB recommends that "the DFG, NMFS and FWS should: (1) carefully examine and periodically reexamine the role and contribution of existing hatchery production for various fish species (e.g., chinook salmon, steelhead trout, striped bass) and experimental hatchery programs (e.g., Delta smelt), including a consideration of the need for genetic diversity and maintaining integrity of different salmon runs . . . and ( 3 ) with the USBR, take steps to rehabilitate the Coleman Fish Hatchery ...I1 (SWRCB 1995, pp. 3 6 - 3 7 ) .
The FWS' includes the following action for Battle Creek: IIScreen tailrace of Coleman Powerhouse to eliminate attraction of adult chinook salmon and steelhead into an area with little spawning habitat and great potential for entrainment into the CNFH water supply" (FWS 1995, p. 40).
Action 3 - Cateqories (l), ( 3 ) : Reduce likelihood of disease transmission from hatchery populations to wild winter-run chinook.
3€J

The NMFS' 1994 BO on the Coleman NFH reaffirms the importance of specific ongoing actions to reduce disease transmission at the hatchery. For instance, the BO notes that "...use of state-of- the-art hatchery practices to minimize horizontal and vertical disease transmission; the use of separate holding tanks and multiple water purification systems; and the use of multiple holding facilities . . . are all expected to reduce the probability of catastrophic losses [of winter run at the hatchery and captive broodstock fa~ilitiesl~~ (NMFS 1994a, p. 2 2 ) .
The FWS' identifies a need to Ilevaluate the transfer of disease between hatchery and natural stocks11 (FWS 1995, p. 91). While the DAFRP recognizes the need for evaluation at all hatcheries (not just Coleman), it does not call for implementation of evaluation results. Thus the portion of this action attributable to the Recovery Plan--over and above practices already beinq undertaken at Coleman and the evaluation mandated in the DAFRP-- is implementation of practices to reduce disease transmission at hatcheries other than Coleman.
Objective 3. Reduce impacts from other fish and wildlife management programs - PRIORITY 3. Action 1 - Cateqory ( 2 1 : State and Federal fish and wildlife management programs should be reviewed to minimize their impacts on winter-run chinook.
This action is an ongoing responsibility of the NMFS under Sections 7 and 10 of the ESA.
Objective 4. Prevent the introduction and establishment of non- indigenous aquatic species - PRIORITY 3. Action 1 - Cateqorv (1) : Develop, implement and enforce regulations to control discharge of ship ballast water within the estuary and adjacent waters.
The need to control ballast water discharges is acknowledged in the SWRCB's Water Quality Control Plan for the Bay/Delta Estuary, which includes a recommendation to "reduce the impacts of introduced species on native species in the Estuary . . . . The DFG, FWS and NMFS should . . . determine where ballast water can be released without posing a threat of infestation or spread of aquatic nuisance species, and limit the release of ballast water to those areas (by new legislation, if needed) . . . I 1 (SWRCB 1995, p . 36).
State Assembly Bill 3207 requires vessel operators carrying ballast water to submit: a report to the DFG indicating compliance with "Guidelines for Preventing the Introduction of Unwanted Aquatic Organisms and Pathogens from Ships' Ballast Water and Sediment Discharges.
31

The National Invasive Species Act, enacted in 1996, requires the Secretary of Transportation to develop voluntary guidelines to prevent the introduction and spread of non-indigenous species into U.S. waters. The Act identifies exchange of ballast water on the high seas as the primary means of prevention. Secretary is also required to monitor compliance with voluntary guidelines and is given authority to promulgate region-specific regulations, if compliance is deemed inadequate (U.S. Congress 1996).
The
Action 2 - Cateqorv (1): Develop and implement measures to avoid introductions, particularly by the zebra mussel, via overland transportation vectors and other transport vectors.
The California Department of Food and Agriculture inspects trailered boats at State border inspection stations. Boats suspected of carrying zebra mussels cannot be launched in the state without prior inspection and approval from the DFG.
Action 3 - Cateqorv ( 2 ) : Prohibit the intentional introduction of aquatic non-indigenous species into the Sacramento River watershed and estuary.
This action reaffirms a recommendation in the SWRCB's Water Quality Control Plan for the Bay/Delta Estuary, which states that "...the California Fish and Game Commission should deny all requests for the introduction of new aquatic species into the watershed of the Bay-Delta Estuary unless it finds, based on strong, reliable evidence, that an introduction will not have deleterious effects on native species" (SWRCB 1995, p. 36). This action is being implemented by the Commission, which has adopted a restrictive policy with regard to introduction of exotic species.
Action 4 - Cateqorv (3) : Develop programs to educate the public about the problems with non-indigenous species and their incidental transport or introduction.
Although some public education does occur with regard to species and habitat conservation (e.g., programs sponsored by the DFG's Conservation and Education Branch), these programs do not generally include exotic species introductions.
Action 5 - Cateqory (1): Identify high-risk potential invaders and implement measures to avoid their introduction.
This action is consistent with the general recommendation in the SWRCB's Water Quality Control Plan for the Bay/Delta Estuary to "reduce the impacts of introduced species on native species in the Estuary . . . . The DFG, FWS and NMFS should ...p ursue programs to determine the impacts of introduced species, including striped bass, on the native aquatic resources of the Estuary, and the
3 2

potential benefits of control measures . . . ' I (SWRCB 1995, p , 3 6 ) . The California Code of Regulations includes a lengthy list of prohibited species, which is updated on a regular basis.
GOAL VII. IMPROVE UNDERSTANDING OF LIFE HISTORY 2UD HABITAT REQUIREMENTS.
Objective 1. requirements of winter-run chinook - PRIORITY 1.
Develop information of life cycle and habitat
Action 1 - Catesorv (l): Develop and implement research programs to further determine life history and habitat requirements of winter-run chinook.
The specific research needs identified in this action and efforts to address them are as follows:
0 spatial and temporal distribution of winter-run chinook in the river, Delta and estuary
The FWS is conducting studies to evaluate the temporal and spatial distribution of all races of juvenile chinook in the lower Sacramento River and the Delta.
habitat requirements during spawning, rearing and migration, including dietary needs, the abundance of their preferred prey items, and the effects of habitat alteration such as rip-rap on food availability
The FWS is conducting studies on habitat requirements for fall-run chinook. Expansion of the studies to other runs is being considered.
0 juvenile chinook survival rates in Sacramento River reaches, Delta waterways and Suisun and San Pablo Bays
The FWS, under the auspices of the Interagency Ecological Program (IEP), continues to maintain its lengthy time-series on juvenile survival rates. Because the numbers of hatchery-reared winter-run chinook are insufficient to conduct mark-recapture experiments, winter-run survival is estimated using the late fall run as a surrogate.
0 temperature tolerances of chinook salmon
This issue has been studied extensively, most commonly in connection with hatchery operations.
0 environmental factors influencing outmigration
This issue is being addressed as part of a multiyear contaminant study being conducted by the NMFS.
3 3

0 microhabitat use and feeding behavior of juvenile chinook in the river, delta and estuary
Research of this type is being conducted by the FWS on the Sacramento River.
physical condition of juvenile chinook salmon upon leaving the San Francisco Bay
This issue is being addressed as part of the same multiyear contaminant study referred to in the fifth bullet under this action.
0 the effects of estuarine and ocean environmental variability on salmon abundance.
The NMFS is conducting a study of the effects of ocean environmental variability on salmon abundance. The FWS, under the auspices of the IEP, makes estimates of relative abundance in the estuary. The Department of Water Resources (DWR) routinely collects extensive water quality data both by boat and at stationary onshore sites in the estuary. The San Francisco Estuary Institute (SFEI), under the auspices of its Regional Monitoring Program, routinely collects data on trace metals and organic contaminants in water, sediment and biotic tissue in the estuary.
Objective 2. Develop information for use as management tools - PRIORITY 1.
Action 1 - Cateqory (1): Develop alternative methods and procedures to estimate annual abundance and genetically effective population size of winter-run chinook returning to the upper Sacramento River.
The NMFS, FWS and others are exploring alternative methods of estimating annual abundance. Methods of estimating genetically effective population size are being studied at the UC Davis Bodega Marir-e Laboratory.
Action 2 - Cateqory (1): Develop alternative method for identifying juvenile winter-run chinook.
This action is being addressed by genetic analysis techniques being conducted at the FWS National Fishery Research Center in Seattle and work funded by the DWR at the UC Davis Bodega Marine Laboratory.
Action 3 - Cateqory ( 3 ) : Develop a winter-run chinook salmon life cycle model.
34

The NMFS' 1996 BO on the Salmon FMP advises that "NMFS should develop a life cycle model for the Sacramento River winter-run chinook salmon" (NMFS 1996, p. 46); this advice, however, is expressed as a recommendation rather than a more binding term or condition. Model development is needed to facilitate a systematic approach to recovery efforts.
Action 4 - Cateqories (I), ( 3): Develop a Delta hydrodynamic and individual run model.
A hydrodynamic model has been developed at UC Davis to describe the effect of flows on water temperature in the Sacramento River and Delta. An individual-based chinook salmon model is being added to the hydrodynamic model, which could form the basis for an individual run/hydrodynamic model. Additional commitment of resources would be needed to make the model applicable to a specific individual run, as called for in this action.
Action 5 - Cateqory (3): Develop an analysis to determine the probability of persistence of winter-run chinook with respect to survival.
Although a qualitative assessment of this type was conducted as part of the development of the Winter-Run Recovery Plan, additional quantitative analysis is needed.
Objective 3. Evaluate re-establishing additional natural winter- run chinook populations - PRIORITY 2.
Action 1 - Catesories, (l), ( 3) : Conduct feasibility analysis of establishing viable, naturally self-sustaining populations in other rivers and creeks within the Sacramento River watershed.
The FWS' DAFRP includes, as a high priority need for Battle Creek, an action to "evaluate the feasibility of establishing a naturally spawning population of winter-run chinook salmon" (FWS 1995, p. 41). Similar evaluations are not underway or even mandated for other rivers and creeks within the Sacramento River watershed and are therefore attributable to the Recovery Plan.
Action 2 - Catesory (a: Based on information from feasibility analysis, develop and implement recommendations for establishing supplemental winter-run chinook populations.
Implementation of this action is contingent on the outcome of the feasibility analysis called for in Action VII.3.1.
Objective 4. Evaluate additional factors that may affect the recovery of winter-rum chinook - PRIORITY 3.
Action 1 - Catesories (l), ( 3): Evaluate water quality impacts on winter-run chinook.
3 5

,
This action includes the following specific research needs:
0 Determine the impacts of toxic substances in the Sacramento River on chinook salmon and their prey.
Some research of this type has been conducted (e.g., to support development of water quality standards). However, since research conducted thus far does not comprehensively address toxic substance impacts, it is reasonable to attribute at least some research in this area to the Recovery Plan.
0 Complete studies initiated by the NMFS on contaminant levels and associated biochemical effects on emigrating juvenile chinook in San Francisco Bay.
The NMFS study involves collection of water quality data at various locations in the Bay, as well as collection and laboratory analysis of fish samples. The study will also likely utilize water quality and contaminant data being collected as part of other programs (e.g., by DWR and SFEI). The study, which is in its second year, is expected to continue for an additional three years.
0 Develop chronic toxicity data on the sensitivity of chinook salmon to copper, cadmium, zinc, polychlorinated biphenyls, polynuclear aromatic hydrocarbons, chlorinated hydrocarbons and pesticides.
A number of studies on the chronic toxicity of metals have been conducted (e.g., by DFG). However, since studies on other compounds (e.q., hydrocarbons, pesticides) are more limited, it was considered reasonable to attribute at least some research on those compounds to the Recoverv Plan.
0 Develop and implement studies to monitor effects of turbidity, suspended sediments and sedimentation on chinook salmon.
Chinook salmon are most sensitive to sedimentation at their earliest life stages. Given that the effect of sedimentation on egg survival has been extensively studied, sedimentation studies will not be attributed to the Recovery Plan. Turbidity and suspended sediments, however, have a wider range of potential effects (e.g., damage to gill tissue, diminution of disease resistance or feeding effectiveness). Given the broad ranqe of such effects and the unevenness with which they have been addressed by prior research, it was considered reasonable to attribute at least some
3 6

research on turbidity and suspended sediments to the Recovery Plan.
0 Develop and implement studies to determine the impacts of dredge spoil disposal on winter-run chinook passing through San Francisco Bay.
Studies of this type remain larselv undone and are therefore attributable to the Recovery Plan.
Action 2 - Cateqory (1): Evaluate juvenile entrainment to flood bypasses, and assess the impacts of flood control operations on juvenile chinook.
As indicated under Action 111.2.2, the ACOE is initiating a general review of flood control practices in the Sacramento watershed, including impacts on chinook salmon. Juvenile entrainment is also a topic of concern for the Bay-Delta Program, whose goal is to develop a long-term solution to restore ecological health and improve water management in the Bay-Delta.
Action 3 - Catesorv (1): Evaluate entrainment of juvenile chinook to the Sacramento Deep Water Ship Channel.
This action is similar to Action 111.2.2 except that it pertains to entrainment of juvenile rather than adult fish.
Action 4 - Catesories (11, ( 3): Assess diseases found in both hatchery and natural chinook populations in the Sacramento River.
The first part of this action calls for a multiyear survey of pathogens in juvenile chinook. A study of this type for fall-run fish is already underway at the FWS California-Nevada Fish Health Center. The DFG also does extensive disease assessment at its hatcheries on Battle Creek and the Feather and American Rivers.
The second part of this action calls for studies to determine if environmental conditions induce stress in juvenile chinook. The types of laboratory analyses needed to address this issue are not beins planned or conducted and are therefore attributable to the Recovery Plan.
D. GENERAL APPROACH TO ECONOMIC ANALYSIS
The purpose of the economic analysis is to estimate the government agency costs of implementing those actions (or portions thereof) described in Section C as being attributable to the Recovery Plan. Some of the actions attributable to the Recovery Plan benefit not only winter-run chinook but also other fish and wildlife--suggesting perhaps that the cost of such actions should be on:Ly partially attributed to winter-run
3 7

recovery. However, just as this economic analysis completely excludes the cost of actions that are not attributable to the Recovery Plan (even though they provide some benefits to winter- run chinook), the analysis also fully reflects the cost of actions which are attributable to the Plan (even if they provide benefits to fish and wildlife other than the winter run). Including the entire cost of actions attributable to the Recovery Plan in this analysis ensures consistency of the analytical approach, and also avoids the predicament of having to arbitrarily allocate such costs between the winter run and other fish and wildlife.
The costs associated with each recovery action are expressed in terms of their present discounted value. Specifically, the total cost of recovery action j extending over a period of T years (PVj) was calculated in discounted terms as:
T PV. = E c j t / [ (l+r)tI ,
J t=O
where C. is the cost of action j in year t, and r is the discountt rate (Osrsl).
Discounting translates outlays made in various future years to an equivalent present value. This is accomplished by weighting expenditures in different years to reflect the fact that a dollar spent in one year is "equivalent" to less than a dollar spent in the next year. This weighting reflects declines in the purchasing power of the dollar (inflation), as well as the "opportunity cost" associated with spending money earlier rather than investing it for later use. The annual cost estimates used in this analysis are corrected for inflation prior to discounting. Thus the appropriate discount rate is a llrealll rather than a "nominal" rate, i.e., it is intended to reflect opportunity cost net of inflation. All cost estimates included in this analysis reflect the purchasing power of the dollar in 1997.
E. COST ESTIMATION RESULTS
E.l. BACKGROUND
The approach to cost estimation varied, depending on the degree of specificity with which each action was described in the Recovery Plan and the extent to which prior experience and information regarding similar activities could be brought to bear on the cost estimates. For instance:
(i) In some cases, cost estimates were customized to the specific requirements of the action and were broken down by
3 8

category (e.g., labor hours--including overhead rates, contracts, travel and/or equipment) . 6
(ii) Other actions were costed in a more approximate manner on the basis of past experience with other activities of similar type and magnitude (e.g., by assuming that the recovery action would require the same level of funding over the same number of years as the prior similar activity). This more approximate approach was taken only if there was some reasonable basis for the assumed similarities between the recovery action being costed and the prior activity and if the more precise approach described in (i) above was not feasible.
(iii) as general areas of research than as narrowly defined projects. necessarily based on arbitrary assumptions regarding the scope and scale of the research being called for in the action.
Some actions were described in the Recovery Plan more
Cost estimation for these types of actions was
(iv) Several of the actions involve implementation of findings from proposed or ongoing evaluations. Implementation costs associated with these types of actions are acknowledged but could not be estimated, since the findings upon which such cost estimates would be based are not yet available.
Costs were estimated in consultation with agency/university personnel with expertise in the relevant areas. Some of this expert advice was accompanied by caveats of the following type:
The context in which a recovery action is expected to occur has a bearing on the magnitude and uncertainty of the cost estimates. For instance, because of regulatory requirements--e.g., California Environmental Quality Act (CEQA) (OPR 19921, National Environmental Policy Act (U.S. Congress 1969)--implementation of some actions will require extensive preparation of scientific, environmental and economic analyses and formal solicitation and consideration of public input. Both the cost and time frame for meeting such requirements may be highly uncertain--depending on the magnitude and technical complexity of the issue being addressed, the state of existing knowledge regarding the issue, the potential environmental and economic effects, and the extent of public controversy and/or litigation. Even for actions that are not subject to extensive regulatory requirements, the
‘Equipment costs were included if the equipment was integral to implementation of the action (e.g, boats/vehicles used for field sampling).
3 9

potential for controversy may compound the uncertainties inherent in the cost estimates.
Some of the recovery actions, particularly those involving regulatory changes or investigations of potential solutions to a problem, may require extensive collection and synthesis of information. Such fact-finding, which may be costly, informs the decision-making process but does not ensure any particular outcome. Even if significant costs are incurred, there is no guarantee that the policymaker will implement a regulatory change or select a solution to a problem that is consistent with the course of action recommended in the Recovery Plan.
E.2. COST ESTIMATES
According to the results of Section C, 23 (30%) of the 77 actions included in the Recovery Plan are attributable, either wholly or in part, to the Plan. cost estimates associated with each of these 23 actions. In cases where only a portion of an action is attributable to the Plan, only the attributable portion is reflected in the descrip- tion of the action and the associated cost estimate. The cost estimates for actions designated Priority 1 in the Recovery Plan are described in Section E.2.a and summarized quantitatively in Table E-la. Sirni-lar information is provided in Section E.2.b and Table E-2b for Priority 2 actions and in Section E.2.c and Table E-lc f o r Priority 3 actions.
This section describes the basis for the
7
E . 2 . a . PRIORITY 1 ACTIONS
Action 1.1.3 - Investiqate additional temDerature control curtain on upstream side of Lewiston.
Laboratory test results are available which demonstrate the extent of mixing that occurs when cold water is added to a warm water pool (like Lewiston). This information, combined with data on the operation of existing curtains on Lewiston, could be used to conduct the investigation called for in this action. The cost of synthesizing the available information is estimated at $5K (source : USBR) .
7As indicated in Section D, the cost estimates include only agency outlays. While such outlays are a fairly accurate reflection of total costs for some actions, other actions are likely to involve significant private costs which are not reflected in this analysis.
4 0

Action 11.1.2 - Evaluate water riqhts for operators initiatinq diversions for rice stubble decomposition and waterfowl habitat development.
This action would involve establishment of conditions for permit applications for rice stubble decomposition. This would likely require supporting analysis (as required by CEQA) and a hearing of the SWRCB. The total cost (consisting largely of salaries and overhead for engineering, environmental, legal and Board personnel) is estimated at $150K-$500K. Given the SWRCB's workload, time to completion is estimated to be five years (source: SWRCB). Table E-la represents the midpoint ($325K) of the range of cost estimates ($150K-$500K), distributed equally over five years ($65K/year) .
The cost estimate for this action presented in
Action 11.1.3 - Develop and implement Federal Rule requirinq screenins of water diversions.
Development of the Federal Ruble is expected to cost about $100K and take about one year to complete. labor, overhead and travel needed to fulfill federal regulatory requirements (e.g., National Environmental Policy Act), including preparation of the necessary supporting analyses and solicitation of and response to public input.
This estimate includes
The likely effect of the Federal Rule would be to establish an order of priority for screening and perhaps also accelerate the pace at which screening would otherwise occur. Given the NMFS' significant and ongoing involvement in design, review, inspection and monitoring of fish screening projects, the cost of implementing the Rule over and above what the agency already spends in this area would likely be modest. Thus the incremental agency cost associated with implementing the Rule is expected to be negligible (source: NMFS).
Action 11.2.1 - Raise sates at Red Bluff Diversion Dam durinq September 1-14 to facilitate passaqe of juvenile chinook.
When the gates at the RBDD are lowered, the water level at Lake Red Bluff rises, thereby allowing water to enter the Tehama- Colusa Canal by gravity. be delivered in this manner and must instead be pumped. provisions of existxng water contracts, the incremental cost associated with such pumping would be passed on to water users. To the extent that raising the gates also affects the volume of water deliveries, water users would also bear the cost of reduced deliveries. This action may also affect recreational activity at Lake Red Bluff. However, agency costs associated with raising the gates an additional two weeks are expected to be negligible (source : USBR) .
When the gates are raised, water cannot Under
41

Action 11.4.3 - Develog model to assess juvenile survival under varvinq hvdroloqic conditions.
Planning is underway to develop and estimate a model of this type for the San Joaquin River. based on experimental data gathered by deliberately modifying water project operations and using techniques such as mark- recapture to evaluate effects on salmon survival. collection is expected to occur over an extended number of years, in order to ensure that the effects of varying types of water years are captured in the sample. Assuming that six years of experimental data will be adequate for model estimation, the cost associated with estimating survival rates reading CWTs, etc.) over the entire sample period is expected to be close to $1 million. Since certain types of water years will not be conducive to experimentation, ten years are expected to elapse before the requisite six years worth of data are obtained (source: EPA). Relative to the cost of experimental data collection, the cost of data analysis is expected to be quite modest , i. e., $20K-$40K (source: UC Berkeley) .
Model estimation is expected to be
Data
(marking the fish,
For purposes of this analysis, the costs associated with mark- recapture experiments on the San Joaquin are assumed to also apply to the Sacramento River system. Specifically, it is assumed that experimental data collection would occur in six out of ten years at a total cost of $1 million, analysis would cost an additional $20K-$40K. Although the data collection on the San Joaquin is expected to be funded largely by water developers, this analysis assumes that data collection on the Sacramento would be funded from public rather than private monies. For purposes of Table E-la, the distribution of agency outlays over the study period is assumed to include $167K/year for experimental data collection in Years 1, 3, 5, 6, 8, and 10, and $30K in Year 11 for data analysis.
and that data
The changes in instream flow and Delta exports called f o r as part of the San Joaquin experiment are expected to impact water deliveries from that system. this recovery action would similarly impact deliveries on the Sacramento. These types of impacts, though potentially significant, are outside the scope of this analysis, which focuses on public rather than private costs.
The data collection called for in
This action is similar to Action 11.2.1 except that it pertains to adult rather than juvenile passage. Action 11.2.1 also covers this action.
The cost estimate for
42

Action VII.2.3 - Develop winter-run chinook life history model.
The cost of this action is estimated to be $75K in Year 1 for initial model development and $2OK/year in Years 2-3 for model runs and evaluation (source: UC Davis).
Action VII.2.4 - Develop Delta hvdrodynamic and individual run model.
This action is estimated to cost $100K and to be completed within a one-year period (source: UC Davis).
Action VII.2.5 - Analysis on Probability of persistence.
This action is estimated to cost $20K and to be completed within a one-year period (source: NMFS).
E . 2 . b . PRIORITY 2 ACTIONS
Action 1.4.4 - Encouraqe Conqress to reauthorize and/or amend the Sacramento River Flood Control and Sacramento Bank Protection projects to ensure i2rotection of fish and wildlife habitat.
This action would likely involve input into the reauthorization process by NMFS Congressional liaison staff when the enabling legislation for the projects comes up for reauthorization. The cost is estimated to be negligible (source: NMFS) .
Action 1.6.5 - Assess/monitor contaminant input from Sutter BvDass, Reclamation District 108 and Jack Slouqh.
Assuming that sampling would occur twice monthly at each of the three sites at a cost of $300/sample for pesticide analysis and $350/sample for bioassays, the annual cost of analyzing samples would be $650/sample x 24 samples/site x 3 sites = $46,800. Assuming that collection of samples at the three sites would be accomplished by one person during an eight-hour day at a rate of $20/hour, 24 times a year, the annual cost of sample collection would be $2O/hour x 8 hours/day x 24 days/year = $3,840. Thus the annual cost of implementing this action is estimated to be $50,640 (source: CVRWQCB) . Action 1.6.7 - Monitor contaminant input from rice stubble decomposition floodinq and waterfowl habitat development.
Currently the CVRWQCB monitors contaminant input from rice fields 2-3 times weekly at three locations in the spring months, pesticides are being applied to the fields. Relative to the current spring monitoring schedule, winter monitoring would likely occur at more sites, since site selection in the spring is informed by historical data on trends and "hot spots," which are not available for the winter months.
when
Winter monitoring would
43

also likely occur more intermittently, depending on the frequency of storm events causing significant runoff from the fields. cost estimate associated with this action assumes that monitoring would be required approximately once weekly for eight weeks during the winter months at a cost per monitoring event of $2,000 for laboratory work, $800 for labor and $30 for vehicle mileage. An additional one-time cost of $500 for report preparation would also be incurred at the end of the season. Based on these assumptions, the monitoring cost per season is estimated to be $16,000 (lab work) + $6,400 (labor) + $240 (mileage) + $500 (report preparation) = $23 , I40 (source: CVRWQCB) . Action 1.7.1 - Increase dissolved oxvqen standard in Georqiana Slouqh, Montezuma Slouqh, Three Mile Slouqh, the lower San JoaQuin River from its confluence with the Mokelumne River to the Antioch Bridse, lower Old River and Middle River.
Some of the areas named in this action are near Stockton, which is experiencing difficulty meeting the current dissolved oxygen standard. While some of this difficulty may be traced to an identifiable source, natural phenomena such as algae blooms also contribute to the problem. In other areas (e.g., Georgiana and Montezuma Sloughs), no identifiable sources are present, so any change in dissolved oxygen levels would have to be addressed by flows.
The
The cost of implementing this action--estimated at $500K expended over a three-year period--consists largely of preparation of a Basin Plan amendment by the CVRWQCB. be viewed as conservative, since it assumes that the Plan amendment would not involve a change in water rights or generate extensive public controversy. Should this assumption be incorrect, implementing this action would likely require considerable additional involvement by the State and Regional Water Boards and their staffs at a significant increase in cost (source : CVRWQCB) .
Action 1.7.4 - Establish water Quality obiectives for diazinon, tribultvltin, chlorpvrifos, carbofuran, malathion, molybdenum, boron, ethyl parathion and triazines.
Establishing water quality objectives for the compounds identified in this action would likely require that amendments be made to the Basin Plans f o r the Central Valley and San Francisco regions. parathion, carbofuran and malathion in an upcoming amendment to its Basin Plan. Thus, for the Central Valley region, only the cost of establishing objectives for the remaining six compounds (tributyltin, chlorpyrifos, molybdenum, boron, ethyl parathion and triazines) would be attributable to the Recovery Plan.
This cost estimate should
The CVRWQCB is already planning to address ethyl
44

The cost of a Basin Plan amendment for the Central Valley region was estimated on the basis of assumptions that reflect customary procedures for establishing water quality objectives for agricultural compounds. typically requires that multiyear monitoring be conducted to evaluate the extent of the problem and identify potential sources and solutions; responsibility for monitoring is typically shared by the CVRWQCB and the DPR. the presence of a problem, the DPR would proceed with development of a water quality standard appropriate for aquatic life protection (customarily done by the DFG under contract to the DPR). An implementation program would also be developed that identifies BMPs appropriate for meeting the standards developed by DFG. Once developed, the standards and implementation program would be incorporated into a Basin Plan amendment. The amendment, along with supporting scientific, environmental and economic analyses, would be submitted to the SWRCB for review and approval. The EPA would also be involved in reviewing those portions of the Plan amendment which fall within its jurisdiction.
Establishment of such objectives
Assuming that monitoring confirms
Based on the procedure outlined above, the cost per compound associated with incorporating water quality standards into a Basin Plan amendment for the Central Valley region, up to and including approval by the SWRCB, was estimated as follows: (1) $13OK/year in Years 1-4 for monitoring ($80K for samples and $50K for staff time by tlne CVRWQCB and the DPR), (2) $100K in Year 2 to establish the waiter quality standard, (3) $100K in Year 2 to develop an implementation plan, and (4) $100K in Year 5 for preparation of the 13asin Plan amendment, including all supporting analyses, as well as public hearings, review and approval by the SWRCB. Multiplying the cost per compound ($130Kx4 + $100K + $100K + $100K = $820K) by the number of compounds for which objectives would be needed (Le., six compounds) yields a total cost to State agencies of $4,920,000 over a five-year period (source : CVRWQCB) .
The San Francisco Bay Regional Water Quality Control Board (SFBRWQCB), which recently completed an amendment to its Basin Plan, does not have any actions pending that would address the compounds identified in this action. A future amendment to address all nine cornpounds, up to and including review and approval by the SWRCB, is estimated to cost $600K-$1,800K and take 3-4 years to accomplish. Although implementation of this recovery action would require that the SFBRWQCB address more compounds in its Basin Plan amendment than the CVRWQCB, the cost of a San Francisco amendment would likely be less. The SFBRWQCB has a monitoring program in place which already covers three of the nine compounds, and the incremental cost of expanding the program to cover the remaining six compounds would be relatively modest. Also, since agricultural activity is more limited in San Francisco relative to the Central Valley, standards for the
4 5
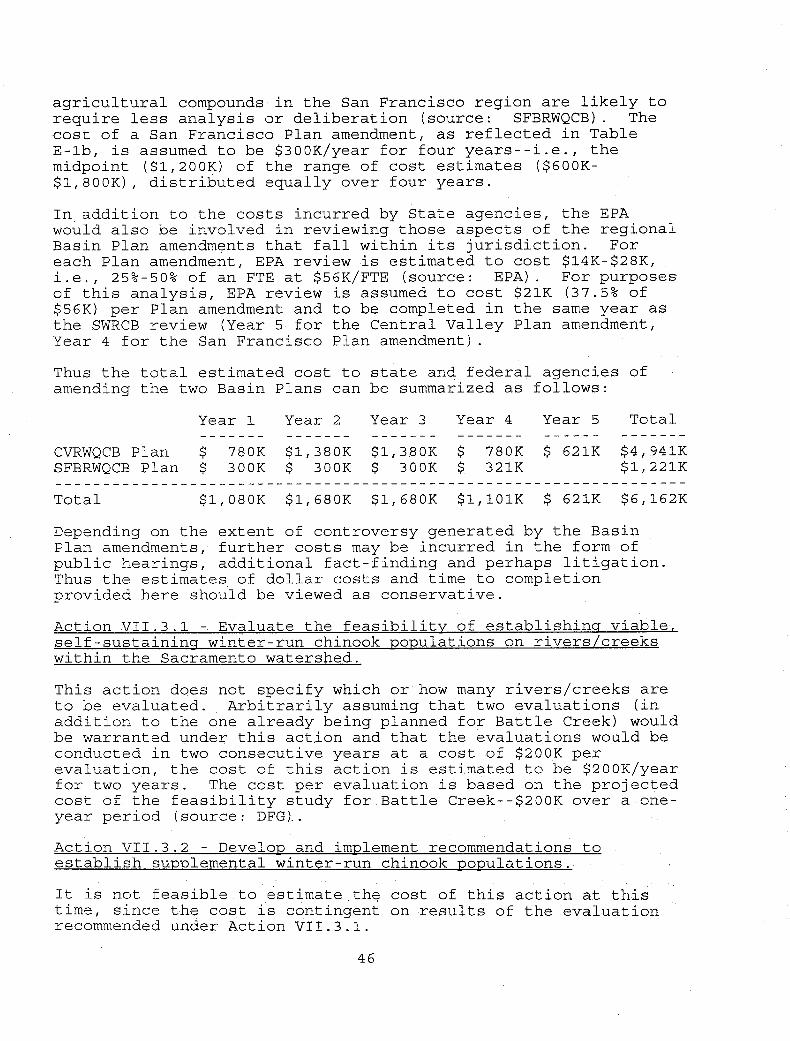
agricultural compounds in the San Francisco region are likely to require less analysis or deliberation (source: SFBRWQCB) . The cost of a San Francisco Plan amendment, as reflected in Table E-lb, is assumed to be $3OOK/year for four years--i.e., the midpoint ($1,20OK) of the range of cost estimates ($600K- $1,80OK), distributed equally over four years.
In addition to the costs incurred by State agencies, the EPA would also be involved in reviewing those aspects of the regional Basin Plan amendments that fall within its jurisdiction. For each Plan amendment, EPA review is estimated to cost $14K-$28K, i.e., 25%-50% of an FTE at $56K/FTE (source: EPA). For purposes of this analysis, EPA review is assumed to cost $21K (37.5% of $56K) per Plan amendment and to be completed in the same year as the SWRCB review (Year 5 for the Central Valley Plan amendment, Year 4 for the San Francisco Plan amendment).
Thus the total estimated cost to state and federal agencies of amending the two Basin Plans can be summarized as follows:
Year 1 Year 2 Year 3 Year 4 Year 5 Total _ - - _ - - - _ _ _ _ _ _ _ _ _ _ _ _ _ _ _ _ _ _ _ _ _ _ _ _ _ _ _ _ _ _ _ _ _ _
CVRWQCB Plan $ 780K $1,38OK $1,38OK $ 780K $ 621K $4,94lK SFBRWQCB Plan $ 300K $ 300K $ 300K $ 321K $1,22lK
Total $1,08OK $1,68OK $1,68OK $1,10lK $ 621K $6,162K _ _ - _ _ _ _ _ _ _ _ _ _ _ _ _ _ _ _ _ _ _ _ _ _ _ _ _ _ _ _ _ _ _ _ _ _ _ _ _ - - - _ - - - _ - - - - _ - - - - - - - _ - - _ - -
Depending on the extent of controversy generated by the Basin Plan amendments, further costs may be incurred in the form of public hearings, additional fact-finding and perhaps litigation. Thus the estimates of dollar costs and time to completion provided here should be viewed as conservative.
Action VII.3.1 - Evaluate the feasibility of establishins viable, self-sustainins winter-run chinook populations on rivers/creeks within the Sacramento watershed.
This action does not specify which or how many rivers/creeks are to be evaluated. Arbitrarily assuming that two evaluations (in addition to the one already being planned for Battle Creek) would be warranted under this action and that the evaluations would be conducted in two consecutive years at a cost of $200K per evaluation, the cost of this action is estimated to be $2OOK/year for two years. The cost per evaluation is based on the projected cost of the feasibility study for Battle Creek--$2OOK over a one- year period (source: DFG) .
Action VII.3.2 - Develop and implement recommendations to establish supplemental winter-run chinook DoDulations.
It is not feasible to estimate the cost of this action at this time, since the cost is contingent on results of the evaluation recommended under Action VII.3.1.
46

E . 2 . c . PRIORITY 3 ACTIONS
Action 1.8.2 - Develop ARMPs for Shasta and Tehama counties.
Cost estimates for Aggregate Resource Management Plans (ARMPs) completed in various central and northern California counties range from less than $100K to well over $1,00OK. The differences in cost can be attributed to a number of factors, including (a) the extent to which the necessary technical information was already available or had to be funded as part of Plan development, (b) the extent to which preparation of the Plan was done solely by the County Planning Department and its paid consultants or was partially funded by interested private parties (e.g., environmental and mining interests), (c) the scope and complexity of the Plan (e.g., whether it covered the entire county versus a single river or creek), and (d) the amount of controversy surrounding the Plan.
An approximate assessment of the circumstances of Shasta and Tehama counties relative to the above factors suggests that development of an ARMP for each county would cost approximately $300K-$500K and take two years to complete (source: Planning Departments at Shasta, Tehama and other central/northern California counties). The cost estimate for both ARMPs, as presented in Table E-lc, is $400K/year for two years. Each of these annual estimates represents the midpoint ($400K) of the range of cost estimates ($300K-$500K) per Plan, multiplied by 50% to reflect the fact that the cost would be evenly divided between the two years it would take for Plan development, and multiplied again by the number of plans (2).
Action V.2.1 - Resume DFG creel census for Sacramento River.
The DFG creel census (which was discontinued in 1994) covered the Sacramento, American, Feather and Yuba Rivers. The cost of reinstating the Sacramento River portion of the census is estimated to be $250K/year for labor and operating costs and an additional $200K every four years for replacement of boats and vehicles used in the census (source: DFG).
Action V.3.1 - Increase CWT samplins efforts by 50% in Fort Brass, San Francisco and Monterey areas.
The incremental cost associated with increased sampling is estimated to be $7OK/year (source: DFG).
Action VI.2.3 - Reduce disease transmission at hatcheries other than Coleman.
It is not feasible to estimate the cost of this action at this time, since the cost is contingent on results of an evaluation mandated by the FWSI DAFRP.
4 7

Action VI.4.4 - Public education resardins transport of exotic species.
This action could be accomplished by modest augmentations to existing public education efforts. For instance, information regarding this issue might be included in press releases routinely issued as part of the DFG's Conservation and Education Program. Thus the cost of this action is expected to be negligible.
Action VII.4.1
Determine the impacts of toxic substances in the Sacramento River on chinook salmon and their prey.
The cost of determining the impact of a toxic substance on an organism can range from virtually nothing (if the impact can be ascertained from a literature review) to hundreds of thousands of dollars--depending on the state of existing knowledge, the pattern of exposure, and other factors. Analysis of this type might typically involve toxicity testing to determine the sensitivity of the organism to the substance, monitoring to determine the extent of the organismIs exposure, and analysis of the organism's sensitivity relative to its exposure (source: DFG).
The cost of implementing this action is highly uncertain, given the wide range of cost estimates associated with testing a single toxic substance and the lack of direction in the Recovery Plan regarding the number of toxic substances and prey items to be considered under this action. Assuming that evaluation would be warranted for five toxic substances with regard to their effects on chinook salmon and one prey item, at a cost of $100K per evaluation, the total cost of implementing this action is estimated to be $IOOK/evaluation x 10 evaluations (five for chinook and five for the prey item) = $1,00OK. Assuming that these evaluations would occur over a period of five years, the cost per year is estimated to be $200K. It is important to note that this cost estimate is based on highly arbitrary assumptions regarding the numbers of substances and species to be tested.
Develop chronic toxicity data on the sensitivity of chinook salmon to PCBs, hydrocarbons and pesticides.
Chronic toxicity tests for salmon customarily focus on early life stages, when sensitivity is likely to be greatest. Generally, the cost of evaluating the effect of one toxic substance for an early life stage (including both data collection and analysis) can be expected to range from $ 3 . 5 K to $20K, with 60-90 days typically needed to complete a single test (source: DFG) .
4 8

The Recovery Plan does not provide guidance regarding the number of compounds to be considered under this action. Assuming that five compounds would warrant testing at a cost of $3.5K-$20K per test, the total cost of testing would be $17.5K-$100K. Taking the approximate midpoint of this range ($60K) and assuming that testing of the five compounds would be completed over a period of two years, the cost per year is estimated to be $30K. cost estimate is based on a highly arbitrary assumption regarding the number of compounds to be tested under this action.
It is important to note that this
Develop and implement studies to monitor effects of turbidity and suspended sediments on chinook salmon.
Turbidity and suspended sediments can have a variety of effects on chiinook salmon. does not provide direction regarding the types of effects to be considered under this action, the cost of this action was estimated on tlhe basis of one specific, arbitrarily chosen type of field study, as follows:
Given that the Recovery Plan
The cost of monitoring can be expected to vary, depending on whether the purpose is to evaluate the integrated effects of the watershed (which would require sediment monitoring at the mouth of the river) or the effect of conditions on the river itself (which would require monitoring at representa- tive reaches of the river). monitor would be to obtain aerial photographs and calibrate them to actual ground samples. The cost of aerial photography is estimated to be $3K-$4K. Assuming that ground sampling would occur at three of the existing gauging stations maintained by the U.S. Geological Survey (USGS) on the Sacramento River, the cost of obtaining daily data on total sediment load is estimated to be $3OK/year for each station. Direct observation would also be desirable to evaluate whether sedimentation during high flows originates from localized or distant sources. Direct observation at the three gauging stations during a high flow period would likely involve three persons and one boat at a cost of $2K/week. Laboratory analysis of the 100+ samples gathered during that week would cost $50/sample. Thus the total cost of implementing this action is estimated at: $3K-$4K (for aerial photos) + $90K (for daily data from three gauging stations) + $7K (for one week of direct sampling--$2K for personnel/boat and $5K for laboratory analysis of samples) = $100K (source: USGS). Table E-lc reflects the assumption that three years of monitoring would be adequate to address this action.
Assuming the latter, one way to
Develop and implement studies to evaluate effect of dredse spoil disposal on winter run in S.F. Bay.
49

The sampling and assays needed to implement this action are estimated to cost $250K expended over a three-year study period (source: UC Davis Bodega Marine Lab).
Given all the above, the total cost of implementing the research projects included under this action can be summarized as follows:
Project Year 1 Year 2 Year 3 Year 4 Year 5 Total - - - - - - - - _ _ _ _ _ _ _ _ _ _ _ _ _ _ _ _ _ _ _ _ _ _ _ _ _ _ _ _ _ _ _ _ _ _ _ _ _ _ _ _ _ _ - - - - Toxic effects $ 200K $ 200K $ 200K $ 200K $ 200K $1,00OK Chronic effects 30K 30K 60K Susp sediments lOOK lOOK lOOK 300K
250K Dredge spoils 90K 80K 80K
Total $ 420K $410K $ 380K $ 200K $ 200K $1,610K _ - _ _ - - _ _ _ _ _ _ _ _ _ _ _ _ _ _ _ _ _ _ _ _ _ _ _ _ _ _ _ _ _ _ _ _ _ _ - - - - - - - - - - - - - - - - - - - - - - - - - - -
Action VII.4.4. Determine if environmental conditions (temperature, water quality, toxicants) in winter-run rearinq areas induce stress in juveniles.
Analysis of stress-inducing effects in juvenile chinook is complicated by a lack of consensus regarding which biomarkers are most appropriate for measuring stress. Another complication is the difficulty of isolating the contribution of any given factor to the level of stress observed, since measurements associated with any given biomarker are likely to reflect the composite effect of all sources of stress at the time the sample is taken.
Assuming that evaluation of 1-5 environmental factors would be warranted under this action, collection of data on these 1-5 factors plus associated measurements of stress from fish samples is projected to cost $5OK-$lOOK/year and to be required for 1-3 years (source: NMFS) . Based on these assumptions, the cost of implementing this action is reported in Table E-lc to include $75K/year (the midpoint of the $50K-$100K estimate for annual data collection) in Years 1-2 and $75K for analysis in Year 3.
E.3. SUMMARY
Undiscounted agency outlays needed to implement the Recovery Plan are estimated to total $17,117K-$21,456K. This estimate includes $1,697K for Priority 1 actions, $8,024K-$8,764K for Priority 2 actions, and $7,395K-$10,995K for Priority 3 actions (Table E - 2 ) . The lower bound cost estimates for Priority 2 and 3 actions are based on the assumption of 13 years to winter-run recovery, while the upper bound assumes 23 years to recovery. Agency outlays for Priority 1 actions are invariant with respect to the recovery period, since all Priority 1 actions are expected to be completed within 13 years. Priority 1 actions are expected to account for less than 10% of total agency outlays attributable to the Recovery Plan; the remaining 90% is accounted for, in roughly equal proportions, by Priority 2 and 3 actions.
50

According to Table E-3, 15 of the 23 recovery actions attributable to the Recovery Plan will individually require at least $100K in agency outlays (under the Ilmedian” assumption of 18 years to recovery). Two of the 15 actions--Action 1.7.4 (Priority 2) and Action V.2.1 (Priority 3)--will each require over $5 million; together these two actions account for 59% of combined agency outlays in all three priority categories. Relative to their own respective priority categories, Action 1.7.4 is expected to comprise 73% of total Priority 2 costs and Action V.2.1 to comprise 58% of total Priority 3 costs. For Priority 1, Action 11.4.3 is the most costly item, comprising 61% of total costs for that category.
Five of the 15 recovery actions included in Table E-3 Actions 11.1.2, 1.7.4, 1.6.5, 1.7.1 and 1.6.7) will require significant involvement by the State and Regional Water Boards. Together these actions are expected to require a minimum outlay of $8.3M by the responsible state and federal agencies. An additional six actions (i.e., Actions 11.4.3, VII.2.3, VII.2.4, VII.3.1, VII.4.1 and VII.4.4) will involve research and evaluation of various types at an associated agency cost of
(i.e.,
r n n
F. DISCOUNTING AND SENSITIVITY ANALYSIS
F.l. BACKGRQUND
Discounting of all costs documented in Section E was conducted in accordance with the equation on page 38 of Section D. Additional analysis was then conducted to evaluate the sensitivity of the results to certain parameter values.
Specifically, for a given time path of expenditures, total discounted costs are expected to be smaller, the higher the discount rate. choice of discount rate, sensitivity analysis was used to evaluate the effect of three alternative discount rates (r=3%, 4%, 5%) on the cost estimates.
Given the lack of definitive guidance regarding
As illustrated by the equation on page 38 of Section D, the further into the future a cost is incurred, the smaller the weight it receives :in the calculation of total discounted costs. Thus, the calculation is affected not only by the dollar amounts involved but also by the specific years over which the dollars are expended. For instance:
Some of the recovery actions (e.g., research projects) are expected to be completed before the winter run has fully recovered, while others (e.g., monitoring contaminants) may
51

be needed throughout the period of recovery. Due to uncertainties regarding time to recovery, the economic analysis evaluates three alternative assumptions regarding recovery time (13, 18 and 23 years). Thirteen years reflects the time to recovery projected in the Recovery Plan (Sacramento Winter-Run Chinook Salmon Recovery Team 1996, p. 123).
Although timely implementation of recovery actions is desirable, funding of actions may be delayed for a variety of reasons, such as funding shortages or agency workload. For actions involving implementation of ongoing research or evaluation, it may not even be appropriate to initiate funding until the results of such research/evaluation become available. To determine the effect of uncertainties of this type, the economic analysis evaluates two alternative assumptions regarding the year in which funding is initiated (1997 and 2000).
F.2. SUMMARY
Table F-la summarizes the discounted cost estimates associated with each priority category under three alternative assumptions regarding the number of years to winter-run recovery and assuming a discount rate of 3%. Tables F-lb and F-lc provide estimates similar to those in Table F-la except that they assume alternative discount rates of 4% and 5% respectively. All three tables are based on the assumption that all actions are initially funded in the year 1997. The cost estimates in Tables F-2a through F-2c correspond to those in Tables F-la through F-lc respectively, except that all actions are assumed to be initially funded in the year 2000. F-2c are summarized in Table F-3.
The results from Tables F-la through
According to Table F-3, estimates of discounted cost ranged from $1.3M to $1.5M for Priority 1 actions, $6.3M to $8.OM for Priority 2 actions, and $5.2M to $8.7M for Priority 3 actions-- depending on the assumptions regarding discount rate, time to recovery and initial year of funding. Because discounting effectively attaches declining weights to costs incurred further into the future, the discounted cost estimates presented in Table F-3 are uniformly lower than their corresponding undiscounted counterparts in Table E-2.
As indicated in Table F-3, increasing the discount rate from 3% to 5% (all else being equal) causes the cost estimates to decrease by 4%-14%. Changing the initial year of funding from 1997 to 2000 (all else being equal) caused the cost estimates to decrease by 8%-14%. Increasing the time to recovery from 13 to 23 years (all else being equal) has varying effects, depending on the priority category being considered. Specifically, while it has no effect on the cost estimates for Priority 1 actions and
52

causes only a modest (4%-6%) increase in Priority 2 costs, it causes Priority 3 costs to increase by 25%-33%. As noted previously in this analysis, the invariance of Priority 1 costs with regard to time to recovery is due to the fact that all Priority 1 actions are expected to be completed within 13 years (13 years being the minimum time to recovery evaluated in the sensitivity analysis). the Priority 3 cost estimates in this regard is largely due to the fact that the Priority 3 category is dominated by Action V.2.1 (see Table E - 3 ) , implementation of which is expected to involve a recurring annual outlay of hundreds of thousands of dollars over the entire recovery period (see Table E-lc).
The comparatively greater sensitivity of
Although the 25%-33% difference in Priority 3 costs associated with varying the time to recovery is notable relative to other results of the sensitivity analysis, this difference is probably modest relative to other types of uncertainty in the cost estimates. For instance, as noted in Section E.2, to the extent that actions attributable to the Recovery Plan generate significant public controversy, they are likely to require agency outlays well beyond the amounts reported in this analysis. Given that the cost estimates presented here are more likely to be biased downward than upward, the most realistic estimates of agency outlays provided in the sensitivity analysis are probably those based on the assumptions that produce the highest cost estimates (i.e., r=3%, time to recovery = 23 years and to = 0). Based on these assunnptions, agency outlays attributable to the Winter-Run Recovery Plan are estimated to total $18.2M: $1.5M for Priority 1 actions, $8.OM for Priority 2 actions and $8.7M for Priority 3 actions (Table F-3).
53
CITATIONS
Army Corps of Engineers. 1996. Deauthorization of the William G. Stone Lock, Barge Canal, and Bascule Bridge - Initial Appraisal Report.
Biosystems Analysis, Inc. 1991. Hydrologic and Fall-Run Chinook Salmon Population Dynamics Assessment for the Evaluation of Economic Impacts of Alternatives for Designation of Winter-Run Chinook Salmon Critical Habitat in the Sacramento River.
I Brown, Randall L. and Sheila Greene. I 1992. Biological Assessment - Effects of Central Valley
I Chinook Salmon. California Department of Water Resources. Project and State Water Project Delta Operations on Winter-Run
CALFED Bay Delta Program. 1996. Phase I Final Report.
CALFED Bay Delta Program. 1996. Preliminary Draft Phase I1 Alternatives.
California Department of Fish and Game. 1994. Fish Screen Action Plan.
California Department of Fish and Game. 1993. Restoring Central Valley Streams: A Plan for Action
California Department of Fish and Game. 1995. Restoring Central Valley Streams: A Plan for Action - Status of Implementation.
California Department of Water Resources. 1994. The Use of Alternative Gravel Sources for Fishery Restoration and Riparian Habitat Enhancement, Shasta and Tehama Counties, California.
California Regional Water Quality Control Board - Central Valley Region.
July 1995 (updated April 1996). A Compilation of Water Quality Goals.
Environmental Protection Agency. 1992. Environmental Impact Statement (EIS) for San Francisco
I Bay Deep Water Dredged Material Disposal Site Designation. i
5.4

Environmental Protection Agency. 1995. Water Quality Standards for Surface Waters of the Sacramento and San Joaquin Rivers, and San Francisco Bay and Delta, California; Final Rule. 40 CFR Part 131. Federal Register 60 (15) :4664-4709.
Fish and Wildlife Service. 1995. Draft Anadromous Fish Restoration Plan: A Plan to Increase Natural Production of Anadromous Fish in the Central Valley of California.
Governor's Office of Planning and Research. 1992. California Environmental Quality Act: Statutes and Guidelines.
Hydrosphere. 1991. Evaluation of Economic Impacts of Alternatives for Designation of Winter-Run Chinook Salmon Critical Habitat in the Sacramento Rriver.
National Marine Fisheries Service. 1991. Maintenance Dredging and Seasonal Construction and Removal of an Earthfill Weir and Implementation of Fishery Protection Measures. Endangered Species Act Section 7 Consultation - Biological Opinion with U.S. Army Corps of Engineers. Public Notice No. 8900254 (Glenn-Colusa Irrigation District, 1/10/90) .
National Marine Fisheries Service. 1992. Dredging and Placement of Fill in 1.5 Miles of the West Channel of the Sacramento River for Channel Maintenance and Fish Protection. Endangered Species Act Section 7 Consultation - Bi-ological Opinion with U.S. Army Corps of Engineers. Public Notice No. 199200284 (Glenn-Colusa Irrigation District, 4/15/92) .
National Marine Fisheries Service. 1993a. Dredging and Placement of Fill in 1.5 Miles of the West Channel of the Sacramento River for Channel Maintenance and Fish Protection. Endangered Species Act Section 7 Consultation - Biological Opinion with U.S. Army Corps of Engineers. Public Notice No. 199200729 (Glenn-Colusa Irrigation District, 10/2/92).
National Marine Fisheries Service. 1993b. Central Valley Project, Long-Term Operations. Endangered Species Act Section 7 Consultation - Biological Opinion with Mid-Pacific Region, Bureau of Reclamation.
5 5

National Marine Fisheries Service. 1994a. Artificial Propagation of Non-Listed Salmonids at Coleman National Fish Hatchery from January 1, 1994, through December 31, 1996; Issuance of Modifications to ESA Section 10 Permit #747 for Direct Taking of Winter-Run Chinook Salmon for Artificial Propagation and Captive Broodstock Programs. Endangered Species Act Section 7 Consultation - Biological Opinion with U.S. Fish and Wildlife Service and National Marine Fisheries Service.
National Marine Fisheries Service. 199433. Periodic Maintenance Activities Primarily for Private Waterfowl Clubs in Suisun Marsh. Endangered Species Act Section 7 Consultation - Biological Opinion with U.S. Army Corps of Engineers.
National Marine Fisheries Service. 1995. Implementation of the California Department of Fish and Game Striped Bass Management Program in 1995 and 1996. Endangered Species Act Section 7 Consultation - Biological Opinion with U.S. Bureau of Reclamation.
National Marine Fisheries Service. 1996. The Fishery Management Plan for Commercial and Recreational Salmon Fisheries off the Coasts of Washington, Oregon, and California of the Pacific Fishery Management Council. Endangered Species Act Section 7 Consultation - Biological Opinion with National Marine Fisheries Service, Northwest and Southwest Regional Fishery Management Divisions
National Marine Fisheries Service. 1996. Magnuson-Stevens Fishery Conservation and Management Act, Public Law 94-265, As Amended Through October 11, 1996. N O M Technical Memorandum NMFS-F/SPO-23.
Pacific Fishery Management Council. 1978. Fishery Management Plan for the Commercial and Recreational Salmon Fisheries off the Coasts of Washington, Oregon and California. Portland, Oregon.
Sacramento Winter-Run Chinook Salmon Recovery Team. 1996. Recommendations for the Recovery of the Sacramento River Winter-run Chinook Salmon. Prepared under the direction of National Marine Fisheries Service, Southwest Region, Long Beach, California.
San Francisco Estuary Project. 1993. Comprehensive Conservation and Management Plan.
State Water Resources Control Board. 1988. Nonpoint Source Management Plan.
56

State Water Resources Control Board. 1990. Protection and Setting a Schedule for Completion of Tasks. Order WR 90-5.
Order Setting Terms and Conditions for Fishery
State Water Resources Control Board. 1993a. California Inland Surface Waters Plan: Water Quality Control Plan for Inland Surface Waters of California. 93-4 WQ .
State Water Resources Control Board. 199333. Estuaries of California. 93-5WQ.
Water Quality Control Plan for Enclosed Bays and
State Water Resources Control Board. 1995a. Water Quality Control Plan for the San Francisco Bay/Sacramento-San Joaquin Delta Estuary. 95-1WR.
State Water Resources Control Board. 199533. Order Regarding Petition for Changes in Water Rights That Authorize Diversion and Use of Waters Affecting the San Francisco Bay/Saeramento-San Joaquin Delta Estuary. Order WR 95-6.
Upper Sacramento River Fisheries and Riparian Habitat Advisory Council.
1989. Upper Sacramento River Fisheries and Riparian Habitat Management Plan. Prepared for The Resources Agency, State of California.
U.S. Bureau of Reclamation. 1992. Long-Term Central Valley Project Operations Criteria and Plan (CVP-OCAP) .
U.S. Congress. 1992. Central Valley Project Improvement Act. Title 34, Public Law 102-575.
U.S. Congress. 1982. The Clean Water Act, As Amended Through December 1981. Public Law 97-117. Serial No. 97-8. U.S. Government Printing Office, Washington, D.C.
U. S . Congress. 1980. Comprehensive Environmental Response, Compensation and Liability Act.
U.S. Congress. 1988. Endangered Species Act of 1973 As Amended Through 1988. Public Law 100-478.

U.S. Congress. 1969. National Environmental Policy Act. Public Law 91-190.
U.S. Congress. 1996. National Invasive Species Act. Public Law 101-646.
5 8

Table E-la. Estimates of undiscounted cost (in 1997$) for each Priority 1 action attributable to the Recovery Plan, by year.'
Goal.Obiective.Action
Year (t)
0 1 2 3 4 5 6 7 8 9 10 11 12 13 14 15 16 17 18 19 20 21 22
Sum : Yrs 0-12 Yrs 0-17 Yrs 0-22
1.1.3. 11.1.2. 11.1.3. 11.2.1. 11.4.3.
5K $ 325K $ lOOK $ 5K $ 325K $ 100K $ 5K $ 325K $ lOOK $
OK $ OK OK OK OK OK OK OK OK OK OK OK OK OK OK OK OK OK OK OK OK OK OK
167K OK
167K OK
167K 167K
OK 167K OK
167K 3 OK
- -
OK $ 1,032K OK $ 1,032K OK $ 1,032K
5 9

Table E-la. Continued.
Sum : Yrs 0-12 Yrs 0-17 Yrs 0-22
’ Further
i
Year (t)
0 1 2 3 4 5 6 7 8 9 10 11 12 13 14 15 16 17 18 19 20 21 22
OK $ 115K $ lOOK $ 20K $ 1,697K OK $ 115K $ lOOK $ 20K $ 1,697K OK $ 115K $ lOOK $ 20K $ 1,697K
elaboration of these cost estimates is provided in Section E.2.a. - - denotes years following completion of action.
Summation of costs over time periods 0-12, 0-17 and 0-22 reflects alternative assumptions regarding time to recovery of 13, 18 and 23 years respectively.
60

Table E-lb. Estimates of undiscounted cost (in 1997$) for each Priority 2 action attributable to the Recovery Plan, by year. 1
Goal.Obiective.Action
Year (t)
0
2 3 4 5 6 7 8 9 10 11 12 13 14 15 16 17 18 19 20 21 22
Sum : Yrs 0-12 Yrs 0-17 Yrs 0-22
1.6.5. 1.6.7. 1.7.1. 1.7.4. 1.4.4.
OK $ 51K $ 23K $ 200K $ 1,080K 1,680K - _ 51K 23K 150K
- _ 51K 23K 150K 1,680K 51K 23K _ _ 1, lOlK
$
- -
51K 51K 51K 51K 51K 51K 51K 51K 51K 51K 51K 51K 51K 51K 51K 51K 51K 51K 51K
23K 23K 23K 23K 23K 23K 23K 23K 23K 23K 23K 23K 23K 23K 23K 23K 23K 23K 23K
621K - -
OK $ 663K $ 299K $ 500K $ 6,162K OK $ 918K $ 414K $ 500K $ 6,162K OK $ 1,173K $ 529K $ 500K $ 6,162K
61

Table E-lb. Continued.
Year (t)
0 1 2 3 4 5 6 7 8 9
1 0 11 1 2 1 3 1 4 1 5 1 6 1 7 1 8 1 9 2 0 2 1 2 2
Sum : Yrs 0 - 1 2 Yrs 0 - 1 7 Yrs 0 - 2 2
' Further
Goal.Obiective.Action
VI1 . 3 . 1 .
$ 400K $ 400K $ 400K
elaborat i
UII . 3 . 2 . TOTAL
cost $ 1 , 5 5 4 K unknown , 2 , 104K cont in- 1 , 9 0 4 K gent on 1 , 1 7 5 K outcome 695K of 74K Action 74K VI1 . 3 . 1 . 74K
74K 74K 74K 74K 74K 74K 74K 74K 74K 74K 74K 74K 74K 74K 74K
n.a. n.a. n.a.
n of th
$ 8 , 0 2 4 K $ 8 , 3 9 4 K $ 8 , 7 6 4 K
se cost estimates is provided in Section E . 2 .b.
' Summation of costs over time periods 0 - 1 2 , 0 - 1 7 and 0 - 2 2 reflects alternative assumptions regarding time to recovery of 1 3 , 18 and 2 3 years respectively. lfn.a.If denotes "not available".
- - denotes years following completion of action.
6 2
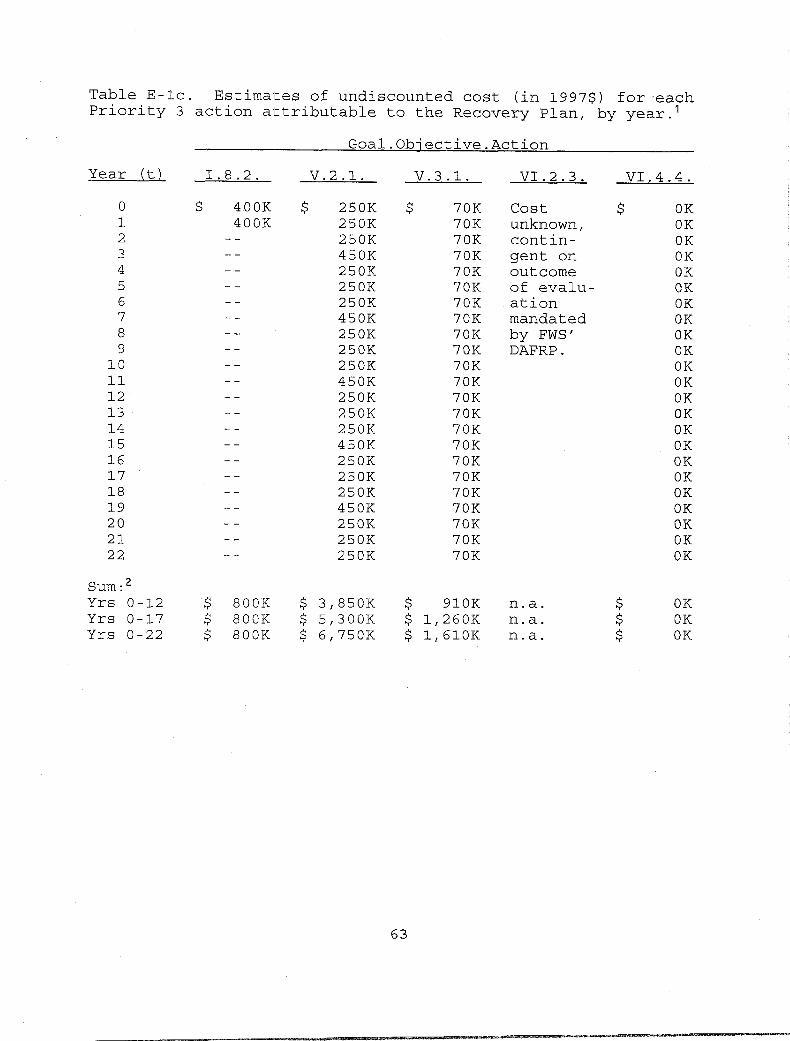
Table E-lc. Estimates of undiscounted cost (in 1997$) for,each Priority 3 action attributable to the Recovery Plan, by year. 1
Goal.Obiective.Action
Year (t)
0 1 2 3 4 5 6 7 8 9 10 11 12 13 14 15 16 17 18 19 20 21 22
Sum : Yrs 0-12 Yrs 0-17 Yrs 0-22
v.2.1.
$ 250K 250K 250K 450K 250K 250K 250K 450K 250K 250K 250K 450K 250K 250K 250K 450K 250K 250K 250K 450K 250K 250K 250K
$ 3,850K $ 5,300K $ 6,750K
v.3.1.
$ 70K 70K 70K 70K 70K 70K 70K 70K 70K 70K 70K 70K 70K 70K 70K 70K 70K 70K 70K 70K 70K 70K 70K
$ 910K $ 1,260K $ 1,610K
VI . 2 . 3 . VI .4 -4.
cost $ unknown, contin- gent on out come of evalu- ation mandated by FWS’ DAFRP .
OK OK OK OK OK OK OK OK OK OK OK OK OK OK OK OK OK OK OK OK OK OK OK
n.a. $ OK n.a. $ OK n.a. $ OK
6 3

Table E-lc. Continued.
Year (t)
0 1 2 3 4 5 6 7 8 9 10 11 12 13 14 15 16 17 18 19 20 21 22
Sum : Yrs 0-12 Yrs 0-17 Yrs 0-22
Goal.Obiective.Action
VI1 .4.1.
$ 420K 410K 380K 200K 200K
_ _
$ 1,610K $ 1,610K $ 1,610K
VI1 .4.4.
$ 225K $ 225K $ 225K
Further elaboration of these
Total
$ 1,215K 1,205K 775K 720K 520K 320K 320K 520K 320K 320K 320K 520K 320K 320K 320K 520K 320K 320K 320K 520K 320K 320K 320K
$ 7,395K $ 9,195K $10 , 995K
cost estimates is provided in Section E. 2. c. - - denotes years following completion of action.
Summation of costs over time periods 0-12, 0-17 and 0-22 reflects alternative.assumptions regarding time to recovery of 13, 18 and 23 years respectively. lrn.a.If denotes Itnot available".
64

Table E - 2 . Estimated undiscounted agency outlays (in 1 9 9 7 s ) for all actions attributable to the Recovery Plan, by priority category, based on alternative assumptions regarding years to recovery. 1
Assumed Years Priority 1 Priority 2 Priority 3 to Recovery Actions Actions Act ions Total
- - _ - - - - - - _ _ _ _ _ _ - _ _ _ _ _ - _ - _ - - - _ _ _ _ _ _ _ - - _ _ _ - - - - - - - - - - - _ _ _
13 $ 1 , 6 9 7 K $ 8 , 0 2 4 K $ 7 , 3 9 5 K $ 1 7 , 1 1 6 K 1 8 I., 6 9 7 K 8 , 3 9 4 K 9 , 1 9 5 K 1 9 , 2 8 6 K 2 3 1 , 6 9 7 K 8 , 7 6 4 K 1 0 , 9 9 5 K 2 1 , 4 5 6 K
’ Based on results from Tables E-la through E-lc.
6 5
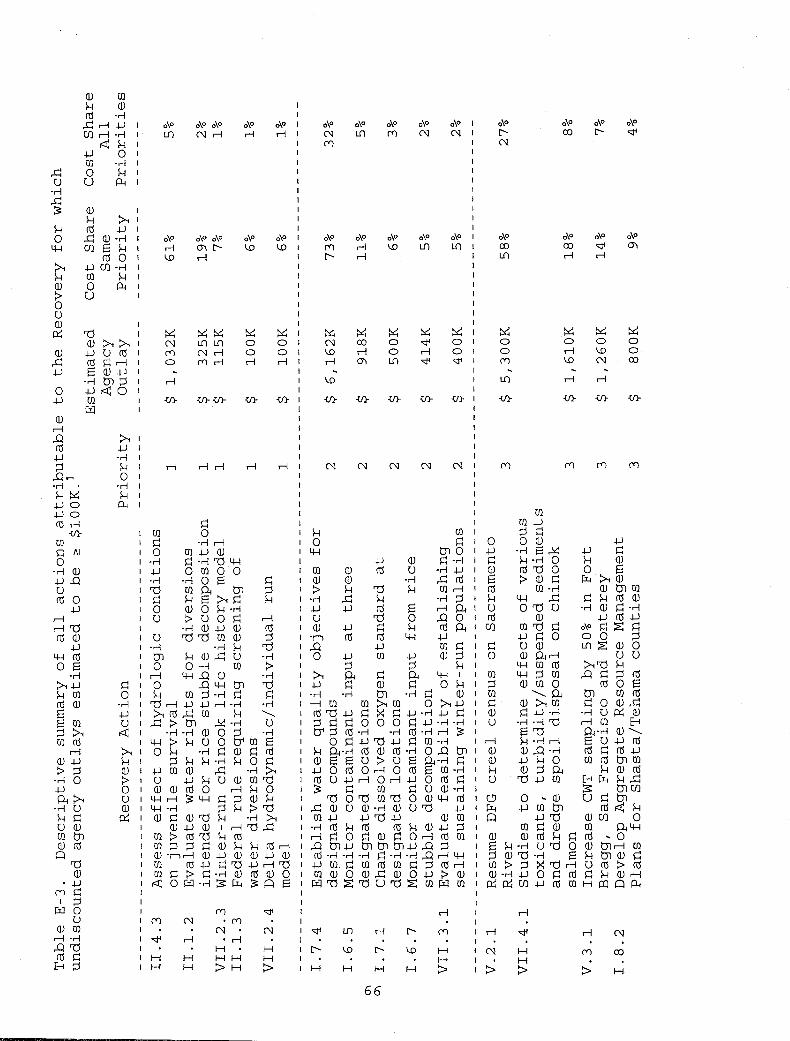
d u -rl A 3 k 0 w
2 $ a,
u a, p: a, s c, 0 c,
a, d A a LI
m w
I I I I I I I I I I I I I I I I I I I I I I I I I I I I I I I I I I I I
m d 0 .ri c, -ri a $2 0 u u -4 tn 0 ri 0 k a x d L U 0
c, u a, w w a, m m a, m 2
d 0
-rl ri m c , a ,: -d a o m 0 -4 0 E
a , O k s u o -ri a, c, aa m
-4 k a,& O r i W A
Q W m 3-rl
r i c , c , r i
5: 2 h
I
o\o o\o I o\o o\o o\o o\o o\o I o\o
i m I N I I I I I I I I I I I I I I I I I I
r l r l ~ ~ m m ~ w i r
o\o o\o I o\o o\o o\o o\o o\o I o\o u ) w l m d w L n L n l a
l b r l I L n I I I I I I I I I I I I I I
g l ? c , 1 z z g z l ? c , l g
r l r l l r l c n m e e i m
O 0 l N C O O e 0 l O o o l ~ r l o r l o l o
I . I l u ) 1 1 0 I I
u t u t l u ) . u l u t u t u ) . l u). I I I I I I I I I I I I
I I I I I I I I I I m
.
r l r l l w h l N N w l m
G 3 k d a 3 a
-rl 3 -4 a d
-ri \ u -ri
5 E: h a 0 k a h d a c, d a, n
ri a, a 0 E
l I I I I I I I I I I I I I I I I I I I I I I I I I I I I I I I I I I I I I 1 I
I I I
I I I I I I I I I I I I I I I I I I I I I I I I I I I I I I I I I I I I I
0 c, d a,
k u a m d 0 m
5
2 G a, u d a, a, k u a kl
a, E
n
2 2
k
-4 : Pi
m 3 0 .d k # ? w 0
m c, u a, w w a, a d -4
a, 4J a, a 0 c, m a, -4 a 3 c, m
Fi
t, d a, E A
-rl 0 Q O a,,: m -4 d a u
a, a,: e o a, a4 m a 3 m m o \a hu) L) -4 -4 a a -d d Q -4 k O 3 a c , m - a ,
m t n c,a d a , cbk u a
-rl x a 0 6
o\o o\* o\o c o r e
m m m
d 2 d a m
66

O\O
rl
O\O
cv
W
sr: C -d
67

Table F-la. Estimates of present discounted cost (in 1997$) for all Priority 1, 2 and 3 actions attributable to the Recovery Plan, is 1997 (to=O) .
assuming discount rate of 3% and initial year of funding 1
Year (t)
0 1 2 3 4 5 6 7 8 9 10 11 12 13 14 15 16 17 18 19 20 21 22
Sum:' Yrs 0-12 Yrs 0-17 Yrs 0-22
Priority 1
$ 532.0K 82.5K 237.5K 59.5K 206.1K 144.1K 0. OK
135.8K 0. OK
128. OK 22.3K O.OK 0. OK 0. OK 0. OK 0. OK 0. OK 0. OK O.OK 0. OK 0. OK 0. OK O.OK
$ 1,547.8K 1,547.8K 1,547.8K
Priority 2
$ 1,554.0K 2 , 042.7K 1,794.7K 1,075. OK 617.5K 63.8K 62. OK 60.2K 58.4K 56.7K 55.1K 53.5K 51.9K 50.4K 48.9K 47.5K 46.1K 44.8K 43.5K 42.2K 41. OK 39.8K 38.6K
$ 7,545.7K 7,783.4K 7,988.5K
Priority 3
$ 1,215.OK 1,169.9K 730.5K 658.9K 462. OK 276. OK 268. OK 422.8K 252.6K 245.3K 238.1K 375.7K 224.4K 217.9K 211.6K 333.8K 199.4K 193.6K 188. OK 296.5K 177.2K 172. OK 167. OK
$ 6,539.2K 7,695.5K 8,696.2K
Total
$ 3,301.OK 3,295.1K 2,762.7K 1,793.7K 1,285.6K 483.9K 330.OK 618.8K 311. OK 430. OK 315.5K 429.1K 276.3K 268.3K 260.5K 381.3K 245.5K 238.4K 231.4K 338.7K 218.1K 211.8K 205.6K
$15,632.8K 17,026.8K 18,232.5K
PVit)--the present discounted cost of all priority i actions (i=l ,...,3) in year t (t=0, . . . , 22)--was calculated according to the formula:
where Ci, is the undiscounted cost of all priority i actions in year t, and r is the assumed discount rate (3%). The estimate for C,, t (t=O,. . . ,221 in Table E-la; C,, and CSt were similarly obtained from Tables E-lb and E-lc respectively. Thus, for example, PV,,
used in this table corresponds to the row total for year
= C12/(1.032) = 252/(1.03') = 237.5.
Summation of discounted costs over time periods 0-12, 0-17 and 0-22 respectively reflects the assumption that funding for each recovery action is initiated in the year 1997 ( t o = O ) and that recovery is achieved 13, 18 and 23 years thereafter.
68

Table F-lb. Estimates of present discounted cost (in 1997$) for all Priority 1, 2 and 3 actions attributable to the Recovery Plan, assuming discount rate of 4% and initial year of funding is 1997 ( t o = O ) . ' Year (t)
0 1 2 3 4 5 6 7 8 9 10 11 12 13 14 15 16 17 18 19 20 21 22
Sum : Yrs 0-12 Yrs 0-17 Yrs 0-22
Prioritv 1
$ 532.0K 81.7K 233. OK 57.8K 198.3K 137.3K O.OK
126.9K 0. OK
117.3K 20.3K 0. OK 0. OK 0. OK 0. OK O.OK 0. OK 0. OK O.OK 0. OK 0. OK 0. OK 0. OK
$ 1,504.6K $ 1,504.6K $ 1,504.6K
Priority 2
$ 1,554.0K 2,023.1K 1,760.4K 1,044.6K 594 .lK 60.8K 58.5K 56.2K 54.1K 52. OK 50. OK 48.1K 46.2K 44.4K 42.7K 41.1K 39.5K 38. OK 36.5K 35.1K 33.8K 32.5K 31.2K
$ 7,402.0K $ 7,607.7K $ 7,776.9K
Priority 3
$ 1,215.OK 1,158.7K 716.5K 640.1K 444.5K 263. OK 252.9K 395.2K 233.8K 224.8K 216.2K 337.8K 199.9K 192.2K 184.8K 288.7K 170.9K 164.3K 158. OK 246.8K 146. OK 140.4K 135. OK
$ 6,298.3K $ 7,299.2K $ 8,125.4K
Total
$ 3,301.OK 3,263.5K 2 , 709.9K 1,742.4K 1,236.9K 461.1K 311.4K 578.3K 287.9K 394.2K 286.4K 385.9K 246.1K 236.6K 227.5K 329.8K 210.4K 202.3K 194.5K 281.9K 179.8K 172.9K 166.3K
$15,204.9K $16,411.5K $17,406.9K
PVit--the present discounted cost of all priority i actions (i=l ,...,3) in year t (t=0, . . . , 22)--was calculated according to the formula:
PV,, = tit/ [ (l+r) t I ,
where Cit is the undiscounted cost of all priority i actions in year t, and r is the assumed discount rate (4%). The estimate for C,, t (t=O,. . . ,22) in Table E-la; C2t and Cgt were similarly obtained from Tables E-lb and E-lc respectively. Thus, for example, PV,,
used in this' t.able corresponds to the row total for year
= C12/(l.042) = 252/(1.04,) = 233.0.
Summation of discounted costs over time periods 0-12, 0-17 and 0-22 respectively reflects the assumption that funding for each recovery action is initiated in the year 1997 (t,=O) and that recovery is achieved 13, 18 and 23 years thereafter.
69

Table F-lc. Estimates of present discounted cost (in 1997$) fo r all Priority 1, 2 and 3 Plan, assuming discount 1997 (to=O). 1
Year (t)
0 1 2 3 4 5 6 7 8 9 10 11 12 13 14 15 16 17 18 19 20 21 22
Sum : * Yrs 0-12 Yrs 0-17 Yrs 0-22
Priority 1
$ 532.0K 81.OK 228.6K 56.1K 190.9K 130.8K O.OK
118.7K O.OK
107.6K 18.4K 0. OK O.OK O.OK 0. OK 0. OK 0. OK 0. OK 0. OK 0. OK O.OK 0. OK 0. OK
$ 1,464.1K $ 1,464.1K $ 1,464.1K
actions attributable to the rate of 5% and
Priority 2
$ 1,554.0K 2,003.8K 1,727. OK 1,015. OK 571.8K 58. OK 55.2K 52.6K 50.1K 47.7K 45.4K 43.3K 41.2K 39.2K 37.4K 35.6K 33.9K 32.3K 30.7K 29.3K 27.9K 26.6K 25.3K
$ 7,265.1K $ 7,443.5K $ 7,583.2K
initial year
Priority 3
$ 1,215.OK 1,147.6K 702.9K 622. OK 427.8K [email protected] 238.8K 369.6K 216.6K 206.3K 196.5K 304. OK 178.2K 169.7K 161.6K 250.1K 146.6K 139.6K 133. OK 205.8K 120.6K 114.9K 109.4K
$ 6,075.9K $ 6,943.6K $ 7,627.2K
Recovery of funding is
Total
$ 3,301.OK 3 , 232.4K 2,658.5K 1,693 .1K 1,190.5K 439.6K 294. OK 540.8K 266.7K 361.6K 260.3K 347.3K 219.4K 208.9K 199. OK 285.7K 180.5K 171.9K 163.7K 235.1K 148.5K 141.4K 134.7K
$14,805.1K $15,851.2K $16,674.6K
’ (i=l, . . . , 3) in year t (t=O, . . . , 22)--was calculated according to the formula:
PVit)--the present discounted cost of all priority i actions
where Cit is the undiscounted cost of all priority i actions in year t, and r is the assumed discount rate (5%). The estimate for C1, used in this table corresponds to the row total for year t (t=O, . . . ,22) in Table E-la; CZt and C3t were similarly obtained from Tables E-lb and E-lc respectively. Thus, for example, PV,, = C,,/(1.05*) = 252/(1.05,) = 228.6.
Summation of discounted costs over time periods 0-12, 0-17 and 0-22 respectively reflects the assumption that funding for each recovery action is initiated in the year 1997 (to=O) and that recovery is achieved 13, 18 and 23 years thereafter.
70

Table F-2a . Estimates of present discounted cost (in 1 9 9 7 Q ) for
Plan, assuming discount rate of 3% and 2 0 0 0 (to=3). 1
initial year all Priority 1, 2 and 3 actions attributable to the
Year (t)
3 4 5 6 7 8 9
1 0 11 1 2 1 3 1 4 15 1 6 1 7 1 8 1 9 2 0 2 1 22 2 3 2 4 2 5
Sum : Yrs 3-15 Yrs 3 - 2 0 Yrs 3-25
Priority 1
$ 4 8 6 . 9 K 7 5 . 5 K
2 1 7 . 4 K 5 4 . 4 K
1 8 8 . 6 K 1 3 1 . 8 K
0 . OK 1 2 4 . 3 K
O . O K 1 1 7 . 1 K
2 0 . 4 K 0 . OK 0 . OK 0 . OK 0 . OK O . O K 0 . OK 0 . OK 0 . OK 0 . OK O . O K 0 . OK 0 . OK
$ 1 , 4 1 6 . 5 X $ 1 , 4 1 6 . 5 K $ 1 , 4 1 6 . 5 K
Priority 2
$ 1 , 4 2 2 . 1 K 1 , 8 6 9 . 4 K 1 , 6 4 2 . 4 K
9 8 4 . OK 5 6 5 . 1 K
5 8 . 4 K 5 6 . 7 K 5 5 . 1 K 5 3 . 5 K 5 1 . 9 K 5 0 . 4 K 4 8 . 9 K 4 7 . 5 K 4 6 . 1 K 4 4 . 8 K 4 3 . 5 K 4 2 . 2 K 4 1 . O K 3 9 . 8 K 3 8 . 6 K 3 7 . 5 K 3 6 . 4 K 3 5 . 3 K
$ 6 , 9 0 5 . 4 K $ 7 , 1 2 2 . 9 K $ 7 , 3 1 0 . 6 K
Priority 3
$ 1 , 1 1 1 . 9 K 1 , 0 7 0 . 6 K
6 6 8 . 5 K 6 0 3 . OK 4 2 2 . 8 K 2 5 2 . 6 K 2 4 5 . 3 K 3 8 6 . 9 K 2 3 1 . 2 K 2 2 4 . 4 K 2 1 7 . 9 K 3 4 3 . 8 K 2 0 5 . 4 K 1 9 9 . 4 K 1 9 3 . 6 K 3 0 5 . 4 K 1 8 2 . 5 K 1 7 7 . 2 K 1 7 2 . OK 2 7 1 . 4 K 1 6 2 . 1 K 1 5 7 . 4 K 1 5 2 . 8 K
$ 5 , 9 8 4 . 3 K $ 7 , 0 4 2 . 5 K $ 7 , 9 5 8 . 3 K
’ PV,+)--the present discounted cost of all priority
Re cove ry of funding is
Total
$ 3 , 0 2 0 . 9 K 3 , 0 1 5 . 5 K 2 , 5 2 8 . 3 K 1 , 6 4 1 . 5 K 1 , 1 7 6 . 5 K
4 4 2 . 9 K 3 0 2 . OK 5 6 6 . 3 K 2 8 4 , 6 K 3 9 3 . 5 K 2 8 8 . 7 K 3 9 2 . 7 K 2 5 2 . 9 K 2 4 5 . 5 K 2 3 8 . 4 K 3 4 8 . 9 K 2 2 4 . 7 K 2 1 8 . 1 K 2 1 1 . 8 K 3 1 0 . OK 1 9 9 . 6 K 1 9 3 . 8 K 1 8 8 . 2 K
$ 1 4 , 3 0 6 . 2 K $ 1 5 , 5 8 1 . 9 # $ 1 6 , 6 8 5 . 3 K
i actions I .
(i=l,. . . , 3 ) in year t ( t = 3 , . . . , 251 --was calculated according to the formula:
pvi, = ci,/ (l+r) t I , where Ci, is the undiscounted cost of all priority i actions in year t, and r is the assumed discount rate ( 3 % ) . The estimate for C,, t-3 ( t = 3 , . . . , 2 5 1 in Table E-la; C2, and C,, were similarly obtained from Tables E-lb and E-lc respectively. Thus, for example, PV,, = C , , / ( 1 . 0 3 4 ) = 85 / (1 .03 , ) = 7 5 . 5 .
0 - 2 2 respectively reflects the assumption that funding for each recovery action is initiated in the year 2 0 0 0 (t0=3) and that recovery is achieved 13 , 1 8 and 23 years thereafter.
used in this table corresponds to the r o w total for year
Summation of discounted costs over time periods 0 - 1 2 , 0 - 1 7 and
7 1

Table F-2b . Estimates of present discounted cost (in 1 9 9 7 $ ) for
1
all Priority 1, 2 and 3 Plan, assuming discount 2 0 0 0 ( t , = 3 ) . 1
Year (t)
3 4 5 6 7 8 9
1 0 11 1 2 1 3 1 4 15 1 6 1 7 1 8 1 9 2 0 2 1 22 2 3 2 4 2 5
Sum : Yrs 3-15 Yrs 3 - 2 0 Yrs 3-25
Prioritv 1
$ 4 7 2 . 9 K 7 2 . 7 K
2 0 7 . 1 K 5 1 . 4 K
1 7 6 . 3 K 1 2 2 . OK
0 . OK 1 1 2 . 8 K
0 . OK 1 0 4 . 3 K
1 8 . OK O . O K 0 . OK 0 . OK O . O K O . O K O . O K O . O K 0 . OK 0 . OK 0 . OK 0 . OK 0 . OK
$ 1 , 3 3 7 . 6 K $ 1 , 3 3 7 . 6 K $ 1 , 3 3 7 . 6 K
actions attributable to the rate of 4 % and
Priority 2
$ 1 , 3 8 1 . 5 K 1 , 7 9 8 . 5 K 1 , 5 6 4 . 9 K
9 2 8 . 6 K 5 2 8 . 1 K
5 4 . 1 K 5 2 . OK 5 0 . OK 4 8 . 1 K 4 6 . 2 K 4 4 . 4 K 4 2 . 7 K 4 1 . 1 K 3 9 . 5 K 38 . OK 3 6 . 5 K 3 5 . 1 K 3 3 . 8 K 3 2 . 5 K 3 1 . 2 K 3 0 . OK 2 8 . 9 K 2 7 . 8 K
$ 6 , 5 8 0 . 3 K $ 6 , 7 6 3 . 3 K $ 6 , 9 1 3 . 6 K
initial year
Priority 3
$ 1 , 0 8 0 . 1 K 1 , 0 3 0 . O K
6 3 7 . OK 5 6 9 . OK 3 9 5 . 2 K 2 3 3 . 8 K 2 2 4 . 8 K 3 5 1 . 3 K 2 0 7 . 9 K 1 9 9 . 9 K 1 9 2 . 2 K 3 0 0 . 3 K 1 7 7 . 7 K 1 7 0 . 9 K 1 6 4 . 3 K 2 5 6 . 7 K 1 5 1 . 9 K 1 4 6 . OK 1 4 0 . 4 K 2 1 9 . 4 K 1 2 9 . 8 K 1 2 4 . 8 K 1 2 0 . OK
$ 5 , 5 9 9 . 2 K $ 6 , 4 8 8 . 9 K $ 7 , 2 2 3 . 5 K
Recovery of funding is
Total
$ 2 , 9 3 4 . 6 K 2 , 9 0 1 . 2 K 2 , 4 0 9 . 1 K 1 , 5 4 9 . 0 K 1 , 0 9 9 . 6 K
4 0 9 . 9 K 2 7 6 . 8 K 5 1 4 . 1 K 2 5 5 . 9 K 3 5 0 . 4 K 2 5 4 . 6 K 3 4 3 . OK 2 1 8 . 8 K 2 1 0 . 4 K 2 0 2 . 3 K 2 9 3 . 2 K 187 . OK 1 7 9 . 8 K 1 7 2 . 9 K 2 5 0 . 6 K 1 5 9 . 9 K 1 5 3 . 7 K 1 4 7 . 8 K
$ 1 3 , 1 7 1 . 1 K $ 1 4 , 5 8 9 . 8 K $ 1 5 , 4 7 4 . 7 K
PVi,)--the present discounted cost of all priority i actions (i=1 , . . . , 3 ) in year t ( t = 3 , . . . , 25)--was calculated according to the formula:
PV,, = tit/ [ (l+r) t I ,
where C i t is the undiscounted cost of all priority i actions in year t, and r is the assumed discount rate ( 3 % ) . The estimate for C1, used in this table corresponds to the row total for year t - 3 ( t = 3 , . . . , 2 5 ) in Table E-la; CEt and C3t were similarly obtained from Tables E-lb and E-lc respectively. Thus, for example, PV,, = C l l / ( 1 . 0 3 4 ) = 8 5 / ( 1 . 0 3 4 ) = 7 2 . 7 .
0 - 2 2 respectively reflects the assumption that funding for each recovery action is initiated in the year 2000 ( t o = 3 ) and that recovery is achieved 1 3 , 18 and 23 years thereafter.
Summation of discounted costs over time periods 0 - 1 2 , 0 - 1 7 and
72

Table F - 2 c . Estimates of present discounted cost (in 1997$) for all Priority 1, 2 and 3 actions attributable to the Recovery Plan, assuming disccunt rate of 5% and initial year of funding is 2 0 0 0 ( t o = 3 ) . 1
Year (t)
3 4 5 6 7 8 9
1 0 11 1 2 1 3 1 4 1 5 1 6 1 7 18 1 9 2 0 2 1 2 2 2 3 2 4 2 5
Pr i or i t v~
$ 4 5 9 . 6 K 6 9 . 9 K
1 9 7 . 4 K 4 8 . 5 K
1 6 4 . 9 K 1 1 3 . OK
0 . OK 1 0 2 . 5 K
O . O K 9 3 . OK 1 5 . 9 K
0 . OK 0 . OK 0 . OK 0. OK 0 . OK 0 . OK 0 . OK 0 . O K O . O K 0 . OK 0 . OK 0 . OK
Priority 2
$ 1 , 3 4 2 . 4 K 1 , 7 3 1 . OK 1 , 4 9 1 . 8 K
8 7 6 . 8 K 4 9 3 . 9 K
5 0 . 1 K 4 7 . 7 K 4 5 . 4 K 4 3 . 3 K 4 1 . 2 K 3 9 . 2 K 3 7 . 4 K 3 5 . 6 K 3 3 . 9 K 3 2 . 3 K 3 0 . 7 K 2 9 . 3 K 2 7 . 9 K 2 6 . 6 K 2 5 . 3 K 2 4 . 1 K 2 2 . 9 K 2 1 . 9 K
Priority 3
$ 1 , 0 4 9 . 6 K 9 9 1 . 4 K 6 0 7 . 2 K 5 3 7 . 3 K 3 6 9 . 6 K 2 1 6 . 6 K 2 0 6 . 3 K 3 1 9 . 2 K 1 8 7 . 1 K 1 7 8 . 2 K 1 6 9 . 7 K 2 6 2 . 6 K 1 5 3 . 9 K 1 4 6 . 6 K 1 3 9 . 6 K 2 1 6 . 1 K 1 2 6 . 1 K 1 2 0 . 6 K 1 1 4 . 9 K 1 7 7 . 8 K 1 0 4 . 2 K
9 9 . 2 K 9 4 . 5 K
Total
$ 2 , 8 5 1 . 5 K 2 , 7 9 2 . 3 K 2 , 2 9 6 . 5 K 1 , 4 6 2 . 6 K 1 , 0 2 8 . 4 K
3 7 9 . 7 K 2 5 4 . OK 4 6 7 . 2 K 2 3 0 . 4 K 3 1 2 . 4 K 2 2 4 . 9 K 3 0 0 . OK l 8 9 . 5 K 1 8 0 . 5 K 1 7 1 . 9 K 2 4 6 . 8 K 1 5 5 . 9 K 1 4 8 . 5 K 1 4 1 . 4 K 2 0 3 . 1 K 1 2 8 . 3 K 1 2 2 . 2 K 1 1 6 . 3 K
Sum : Yrs 3-15 $ 1 , 2 6 4 . 8 K $ 6 , 2 7 5 . 8 K $ 5 , 2 4 8 . 6 K $ 1 2 , 7 8 9 . 2 K Yrs 3 - 2 0 $ 1 , 2 6 4 . 8 K $ 6 , 4 2 9 . 9 K $ 5 , 9 9 8 . 1 K $13 , 6 9 2 . 9 K Yrs 3 - 2 5 $ 1 , 2 6 4 . 8 K $ 6 , 5 5 0 . 7 K $ 6 , 5 8 8 . 7 K $ 1 4 , 4 0 4 . 1 K
PV,,)--the present discounted cost of all priority i actions (i=l / . . . , 3 ) in year t ( t = 3 , . . . , 25)--was calculated according to the formula:
Pv,, = tit/[ (l+r) t 1
where C,, is the undiscounted cost of all priority i actions in year t, and r is the assumed discount rate ( 3 % ) . The estimate for C,, used in this table corresponds to the row total for year t - 3 ( t = 3 , . . . , 2 5 ) in ‘Table E-la; C,, and C,, were similarly obtained from Tables E-lb and E-lc respectively. Thus, for example, PV,, = C , , / ( 1 . 0 3 4 ) = 8 5 / ( 1 . 0 3 , ) = 6 9 . 9 .
13-22 respectively reflects the assumption that funding for each recovery action is iinitiated in the year 2 0 0 0 recovery is achieved 1 3 , 1 8 and 2 3 years thereafter.
Summation of discounted costs over time periods 0 - 1 2 , 0 -17 and
( t 0 = 3 ) and that
73

Table F-3 . Estimates of present discounted cost (in 1 9 9 7 $ ) for all Priority 1, 2 , and 3 actions attributable to the Recovery Plan, under alternative assumptions regarding discount rate ( 3 % , 4 % and 5 % ) , time to recovery ( 1 3 , 1 8 and 2 3 years), and initial year of funding ( 1 9 9 7 and 2 0 0 0 ,
Discount Rate
3% 4 % 5%
Discount Rate
3% 4 % 5%
Discount Rate
3% 4 % 5%
Discount Rate
3% 4 % 5%
- - 1 i.e. , t,=O and t0=3) . Priority 1 Actions
Time to Recovery (tw=O) Time to Recovery ( t ,=3 1 3 years 1 8 years 23 years 13 years 18 years 2 3 years
$ 1 , 5 4 8 K $ 1 , 5 4 8 K $ 1 , 5 4 8 K $ 1 , 4 1 7 K $ 1 , 4 1 7 K $ 1 , 4 1 7 K $ 1 , 5 0 5 K $ 1 , 5 0 5 K $ 1 , 5 0 5 K $ 1 , 3 3 8 K $ 1 , 3 3 8 K $ 1 , 3 3 8 K $ 1 , 4 6 4 K $ 1 , 4 6 4 K $ 1 , 4 6 4 K $ 1 , 2 6 5 K $1, 2 6 5 K $1, 2 6 5 K
Priority 2 Actions Time to Recovery (t,,=O) Time to Recovery (t =3
1 3 years 1 8 vears 23 years 1 3 years 1 8 years 23-s $ 7 , 5 4 6 K $ 7 , 7 8 3 K $ 7 , 9 8 9 K $ 6 , 9 0 5 K $ 7 , 1 2 3 K $ 7 , 3 1 1 K $ 7 , 4 0 2 K $ 7 , 6 0 8 K $ 7 , 7 7 7 K $6 , 5 8 0 K $6 , 7 6 3 K $6 , 9 1 4 K $ 7 , 2 6 5 K $ 7 , 4 4 4 K $ 7 , 5 8 3 K $ 6 , 2 7 6 K $ 6 , 4 3 O K $ 6 , 5 5 1 K
Priority 3 Actions Time to Recovery (to=O) Time to Recovery (t =3
1 3 vears 1 8 years 2 3 years 13 years 1 8 years 23=s $ 6 , 5 3 9 K $ 7 , 6 9 6 K $ 8 , 6 9 6 K $ 5 , 9 8 4 K $ 7 , 0 4 3 K $ 7 , 9 5 8 K $ 6 , 2 9 8 K $ 7 , 2 9 9 K $ 8 , 1 2 5 K $ 5 , 5 9 9 K $ 6 , 4 8 9 K $ 7 , 2 2 4 K $ 6 , 0 9 6 K $ 6 , 9 4 4 K $ 7 , 6 2 7 K $ 5 , 2 4 9 K $ 5 , 9 9 8 K $ 6 , 5 8 9 K
All Actions Time to Recovery (to=O) Time to Recovery (t =3
1 3 years 1 8 years 2 3 years 13 years 1 8 years 23%~ $ 1 5 , 6 3 3 K $ 1 7 , 0 2 7 K $ 1 8 , 2 3 3 K $ 1 4 , 3 0 6 K $ 1 5 , 5 8 2 K $ 1 6 , 6 8 5 K $ 1 5 , 2 0 5 K $ 1 6 , 4 1 2 K $ 1 7 , 4 0 7 K $ 1 3 , 1 7 1 K $ 1 4 , 7 9 O K $ 1 5 , 4 7 5 K $ 1 4 , 8 0 5 K $ 1 5 , 8 5 l K $ 1 6 , 6 7 5 K $ 1 2 , 7 8 9 K $ 1 3 , 6 9 3 K $ 1 4 , 4 0 4 K
’ Cost estimates were obtained from Tables F-la through F - l c and Tables F-2a through F-2c . Estimates in the former three tables are based on the assumption that funding is initiated in 1 9 9 7 (to=O); estimates in the latter three tables assume funding is initiated in 2 0 0 0 (t0=3).
74

APPENDIX I
The following is a brief description of various non-ESA laws, regulations and progirams, presented in roughly chronologically order according to year of initial implementation. laws, regulations and programs are discussed the main body of this report in terms of their relationship to specific actions in the Recovery Plan.
National Environmental Policv Act: Policy Act, enacted by the U . S . Congress in 1969, requires that legislative proposals and other major federal actions significantly affecting the quality of the environment include a detailed statement on the environmental impact of the proposed action. The Act also requires the federal official responsible for the proposed action to consult with federal agencies having jurisdiction or special expertise with regard to any environmental impact.
All of these
The National Environmental
Porter-Coloqne Water Oualitv Control Act: Act, adopted by the California Legislature in 1969, mandates a statewide program of water quality control. implementing the Act belongs to the State Water Resources Control Board (SWRCB) and nine Regional Water Quality Control Boards (RWQCBs). compliance with provisions of the federal Clean Water Act. Responsibilities of the SWRCB include issuance of Water Quality Control Plans (e.g., SWRCB 1988 and SWRCB 1995a) and water rights orders (e.g., SWRCB 1990, SWRCB 1995b). Responsibilities of the RWQCBs include development and amendment of Basin Plans which provide water quality standards and implementation programs that are appropriate to regional conditions.
The Porter-Cologne
Responsibility for
The SWRCB is also responsible for ensuring state
Interaqencv Ecolosical Procram: The Interagency Ecological Program (IEP) for the San Francisco Bay/Sacramento-San Joaquin Estuary was established in 1971 to develop a better understanding of the Estuary's ecology and the effects of the Central Valley Project (CVP) and the State Water Project (SWP) on physical, chemical and biological conditions in the estuary. The IEP includes three state agencies (Department of Water Resources, Department of Fish a:nd Game, State Water Resources Control Board), six federal agencies (Fish and Wildlife Service, Bureau of Reclamation, Geological Survey, Army Corps of Engineers, National Marine Fisheries Service, Enviranmental Protection Agency), and one non-government organization ( S F E I ) . Numerous data collections and studies have been and continue to be conducted under the auspices of the IEP.
Clean Water Act: The Clean Water Act (CWA) was enacted by the U.S. Congress in 197.2 "...to restore and maintain the chemical, physical, and biological integrity of the Natfon's water." The CWA has been amended several times since, most recently in 1993.
75

I
Under the CWA, states are given the responsibility of identifying designated uses for waterbodies and adopting water quality objectives to protect all such uses. Protection Agency is authorized to review and approve or disapprove of water quality objectives adopted by the states. In California, the SWRCB shares authority to implement the CWA and the state Porter-Cologne Water Quality Control Act with the nine RWQCBs. Each RWQCB is responsible for preparing a Basin Plan for its regional watershed that identifies designated uses, water quality objectives to protect those uses, and strategies and timetables for achieving objectives. Sections of the CWA which are most relevant to the analysis in this report can be briefly described as follows:
The federal Environmental
Title 111, Section 301 makes any discharge of pollutants unlawful unless it complies with provisions of the CWA. It establishes a Priority Pollutant List (PPL) and procedures for adding and removing substances from the PPL. Section 307 describes factors which EPA must consider in setting effluent standards for pollutants on the PPL.
Title 111, Section 303 requires states to identify waterbodies that cannot meet water quality standards even after municipal and industrial dischargers meet minimum standards of pollution control; states must also develop a schedule for contaminant load reduction for such waterbodies.
Title 111, Section 319, added as an amendment to the Act in 1987, requires the states to establish a program to address nonpoint source management problems.
Title 111, Section 320, also added as an amendment in 1987, allows state governors to request EPA support in producing water quality control plans for estuaries within their state.
Title IV established a permitting program known as the National Pollution Discharge Elimination System (NPDES) . It requires all point source dischargers to obtain an NPDES permit and comply with conditions of the permit, with violators subject to civil and criminal penalties. This permit program is the key to enforcing the effluent limits and water quality standards of the Act. As allowed under Title IV, the State and RWQCBs have taken on many of the permitting responsibilities in California that would otherwise be assumed by the U.S. EPA.
Title IV, Section 404 authorizes the ACOE to manage discharge of dredged material through a special permit process. Permit applicants are required to satisfy conditions preventing unacceptable impacts to the aquatic environment, including release of pollutants during dredging and disposal of material. The EPA works with the ACOE in providing guidelines
76

for the Section 404 permit program and can veto permits.which do not meet guidelines.
San Francisco Estuarv Project: Section 3 2 0 of the federal CWA designated San Francisco Bay as one of eleven top priority estuaries in need of a water quality control plan. provided impetus for creation of the San Francisco Estuary Project (SFEP) --a five-year cooperative effort by environmental, social and economic interests to Ifpromote effective management of the San Francisco Bay-Delta Estuary and to restore and maintain its water quality and natural resources." Committee has prepared a Comprehensive Conservation Management Plan.
Section 3 2 0
The SFEP's Management
Maqnuson-Stevens Fishery Conservation and Manaqement Act: The Magnuson-Stevens Fishery Conservation and Management Act is the name given to the 1996 reauthorization of the Magnuson Fishery Conservation and Management Act, which was originally enacted by the U.S. Congress in 1976. The goal of the Act is "...to conserve and manage the fishery resources found off the coasts of the United States, and the anadromous species and Continental Shelf fishery resources of the United States." The Pacific Fishery Management Council (PFMC), one of the regional councils created by the Act, is responsible for managing the ocean salmon fisheries in Washington, Oregon and California. Salmon regulations are developed in accordance with the PFMC's Fishery Manaqement Plan for the Commercial and Recreational Salmon Fisheries off the Coasts of Washinqton, Oreson and California (PFMC 1978) and subsequent amendments to the Plan.
ComDrehensive Environmental Response, Compensation and Liability Act: The Comprehensive Environmental Response, Compensation and Liability Act (CERCLA) was enacted by the U.S. Congress in 1980. CERCLA authorized creation of a "Superfund", financed by a tax on chemicals and administered by the EPA, to pay for cleanup of hazardous waste sites. CERCLA also authorizes trustees of injured resources to seek compensation for restoration and interim lost use of injured resources from potentially responsible parties.
California Environmental Ouality Act: The California Environmental Quality Act, originally enacted in 1986 by the California Legislature, requires public agencies to consider alternatives to proposed actions affecting the environment in terms of qualitative as well as economic factors and long-term as well as short-term benefits and costs. The Act further requires public agencies to mitigate or avoid significant environmental effects when feasible, and provides conditions under which an action can proceed when mitigation is not feasible.
Upper Sacramento River Fisheries and Riparian Habitat Manatsement Plan: Senate B i l l 1086, enacted by the State Legislature in
77

1986, called for an inventory of riparian habitat on the upper Sacramento and development of an Upper Sacramento River Fisheries and Riparian Habitat Management Plan. The Plan, which was developed by the Upper Sacramento River Fisheries and Riparian Habitat Advisory Council, includes findings and recommendations for restoring riparian habitat on the Sacramento River between Keswick and Verona.
Restorins Central Vallev Streams: A Plan for Action: The Salmon, Steelhead Trout, and Anadromous Fisheries Program Act, otherwise known as Senate Bill 2261, was enacted by the State Senate in 1988. The Act mandated a goal to "...double the current natural production of salmon and steelhead trout resources . . . ' I by the end of the century and required that a plan be developed to meet that goal. In 1992 the Governor or California issued a water policy statement to protect and restore aquatic ecosystems that support fish and wildlife. In 1993, the DFG completed Restorins Central Vallev Streams: A Plan for Action, a document which includes numerous actions to further the State-legislated policy of doubling anadromous populations.
Lons-Term Manasement Stratesv Proqram: The Long-Term Management Strategy Program was initiated in 1990 by four federal/state agencies for the purpose of providing a regional plan for the disposal of dredged materials from San Francisco Bay over the next 50 years. Engineers, the U.S. Environmental Protection Agency, the San Francisco Bay Regional Water Quality Control Board and the San Francisco Bay Conservation and Development Commission.
National Invasive Species Act: The Nonindigenous Aquatic Nuisance Prevention and Control Act, authorized in 1990, was reauthorized and amended in 1996 as the National Invasive Species Act. The Act, as reauthorized, requires the Secretary of Transportation to develop voluntary guidelines to prevent the introduction and spread of nonindigenous species into U.S. waters, and identifies exchange of ballast water on the high seas as the primary means of prevention. The Secretary is also required to monitor compliance with voluntary guidelines and is given authority to promulgate region-specific regulations, if compliance is deemed inadequate.
The lead agencies include the U.S. Army Corps of
Central Valley Project Imorovement Act: In 1992, the U.S. Congress enacted Public Law 102-575, which contains 40 separate titles pertaining to water resource projects throughout the West. Title 34, known as the Central Valley Project Improvement Act (CVPIA), mandates changes in the management of the CVP for the protection, restoration and enhancement of fish and wildlife. Among other provisions, the CVPIA specifies numerous restoration activities intended to double natural anadromous fish production from average levels during 1967-1991 by the year 2002. The CVPIA specifies that 800,000 acre-feet of CVP yield be dedicated
78

annually for such restoration. Additionally, it establishes a Restoration Fund consisting of annual payments by CVP beneficiaries and donations from other sources. It authorizes the Secretary of the Interior to appropriate up to $50 million per year from the Fund for habitat restoration and water and land acquisitions.
San Francisco Estuary Institute (SFEI) - Resional Monitorinq Proqram: The SFEI is a private non-profit organization whose goal is to "provide the scientific understanding necessary to manage the complex and biologically rich San Francisco Estuary." Through its Regional Monitoring Program, the SFEI conducts routine water and sediment sampling in the estuary for over 100 compounds, including trace metals, petroleum hydrocarbons, pesticides and chlorinated hydrocarbons. The program, which was initiated in 1993, is funded by almost 70 organizations/agencies as conditions of permits issued by the SWRCB.
CALFED: established as part of a Framework Agreement signed in June 1994 by the Governor of California and the Secretary of the Interior. The Bay-Delta Accord was signed by consortium members in December 1994 to met two goals of the Framework Agreement: water quality standards for the Bay-Delta and to better coordinate operations of the SWP and the CVP. Program was created to address the third goal of the Framework Agreement: health and improve water management in the Bay-Delta.
Working with stakeholders, the Bay-Delta Program is developing and evaluating three alternative approaches to Delta conveyance and water storage: existing, through Delta modification, dual system. Each approach incorporates four common programs: water use efficiency, water quality, system vulnerability, ecosystem quality. The ecosystem quality program is expected to provide significant habitat improvement in the Bay/Delta.
CALFED is a consortium of state and federal agencies'
to provide
The Bay-Delta
to develop a long-term solution to restore ecological
Fish Screen Action Pla: Screen Action Plan, which establishes an order of priority for dealing with unscreeined diversions. priority to diversions within the critical habitat of federal listed species or the essential habitat of state listed species.
In 1994 the DFG developed its Fish
The Plan gives highest
'Member agencies include the California Department of Fish and Game, California Department of Water Resources, State Water Resources Control Board, U.S. Environmental Protection Agency, U.S. Fish and Wildlife Service, U.S. Bureau of Reclamation and U.S, National Marine Fisheries Service. The U.S. Army Corps of Engineers participates as a cooperating agency.
79

Draft Anadromous Fish Restoration Proqram: In accordance with Section 3406(b)(1) of the CVPIA, which directs the Secretary of the Interior to develop and implement a program that ensures doubling of natural anadromous fish production by the year 2002, the Fish and Wildlife Service drafted the Anadromous Fish Restoration Plan. The Plan, which includes numerous specific actions and evaluations, was distributed for public comment in December 1995.
8 0

RECENT TECHNICAL MEMORANDUMS
Copies of this and other NOAA Technical Memorandums are available from the National Technical Information Service, 5285 Port Royal Road, Springfield, VA 22167. Paper copies vary in price. Microfiche copies cost $9.00. Recent issues of NOAA Technical Memorandums from the NMFS Southwest Fisheries Science Center are listed below: NOAA-TM-NMFS-SWFSC- 239 Changing oceans and changing fisheries: Environmental data for fisheries
research and management. A workshop. G. BOEHLERT and J.D. SCHUMACHER, (Editors) (April 1997)
240 Documentation of California’s commercial market sampling data entry and expansion programs. D.E. PEARSON and B. ERWIN (April 1997)
241 The Hawaiian monk seal in the Northwestern Hawaiian Islands, 1995. T.C. JOHANOS and T.J. RAGEN (June 1997)
242 Plankton sampling during the whale habitat and prey study 10 July- 4 August 1996. W.A. ARMSTRONG and S.E. SMITH (July 1997)
243 Benthic Invertebrates of four Southern California marine habitats prior to onset of ocean warming in 1976, with lists of fish predators. J.R. CHESS and E.S. HOBSON (August 1997)
244 Fishes collected by midwater trawls during two cruises of the David Sfarr Jordan in the Northeastern Pacific Ocean, April-June and September-October, 1972 J.L. BUTLER, H.G. MOSER, W. WATSON, D.A. AMBROSE, S.R. CHARTER, and E.M. SANDKNO? (September 1997)
245 Mapping benthic habitats and ocean currents in the vicinity of Central California’s Big Creek Ecological Reserve M. YOKLAVICH, R. STARR, J. STEGER, H.G. GREENE, F. SCHWING, and C. MALZONE (September 1997)
246 The physical oceanography off the Central California coast during May-June, 1996: A summary of CTD data from pelagic juvenile rockfish surveys. K.M. SAKUMA, F.B. SCHWING, K. BALTZ, D. ROBERTS, and S. RALSTON (September 1997)
247 Killer whales of California and Western Mexico: A catalog of photo-identified individuals. N.A. BLACK, A. SCHULMAN-JANIGER, R.L. TERNULLO, and M. GUERRERO RUlZ (September 1997)
248 U.S. Pacific Marine Mammal Stock Assessments: 1996 J. BARLOW, K.A. FORNEY, P.S. HILL, R.L. BROWNELL, JR., J.B. CARRETTA, D.P. DeMASTER, F. JULIAN, M.S. LOWRY, T. RAGEN, and R.R. REEVES (October 1997)