
ANALYSIS OF ACCELERANTS IN FIRE DEBRIS BY CAPILLARY GAS ... · PDF fileBY CAPILLARY GAS LIQUID...
136
ANALYSIS OF ACCELERANTS IN FIRE DEBRIS BY CAPILLARY GAS LIQUID CHROMATOGRAPHY ANTHONY D. CAFE B. APP. SC. (HONS). (NSWIT) DEPARTMENT OF MATERIAL SCIENCE UNIVERSITY OF TECHNOLOGY SYDNEY JUNE, 1988.
Transcript of ANALYSIS OF ACCELERANTS IN FIRE DEBRIS BY CAPILLARY GAS ... · PDF fileBY CAPILLARY GAS LIQUID...
ANALYSIS OF ACCELERANTS IN FIRE DEBRIS
BY CAPILLARY GAS LIQUID CHROMATOGRAPHY
ANTHONY D. CAFE
B. APP. SC. (HONS). (NSWIT)
DEPARTMENT OF MATERIAL SCIENCE UNIVERSITY OF TECHNOLOGY SYDNEY
JUNE, 1988.
The experimental work involved in this project has been aimed at
developing an understanding of the problems likely to be
encountered during the routine analysis of fire debris where the
analytical technique is capable of detecting approximately one-
microlitre of an accelerant. This high sensitivity is achieved by
analysing with Capillary Gas Liquid Chromatography a dynamic
headspace extract of the fire debris.
Capillary columns are being used more extensively in G.L.C.
analysis because of their greater resolving power as compared to
packed columns. They have been slowly accepted in routine fire
debris analysis but were used exclusively throughout the project
and were found to give more information in the chromatograms to
aid their interpretation. There has also been reservations about
using techniques that are capable of detecting 1 pL of accelerant
because of the questions of the normal background levels of the
accelerants, the possibility of contamination and the interpretation
of the chromatograms and these three areas were investigated.
Background levels of accelerants on various materials were
monitored, areas where the accidental contamination of the sample
is possible were identified and alternative techniques proposed and
chromatograms using capillary columns of various accelerants,
synthetic and household materials are presented which would aid
the interpretation of a samples' chromatogram. The chemical
characteristics of these materials were also investigated using
specific ion monitoring of the chromatographic analysis.
The efforts of the forensic laboratory are reliant on the quality of
the samples provided so the suitability of a sampling aid the
"Sniffer" was evaluated and the insimment's shortcomings are
discussed.
Techniques of identifying gas odourants utilising the equipment
used for fm debris analysis are also presented which would assist
the investigation of explosions.
The project also investigated the problems of the analytical
discrimination of accelerants when using dynamic headspace
analysis which would aid the interpretation of the chromatograms.
Static headspace analysis was also examined using Tenax
absorption tubes and the method could also be used in the
laboratory to enable greater flexibility of operation.

"Our acts are attached to us
As its glimmer is to phosphorous.
They consume us, it is true,
But they make our splendour."
Andre Gide
ACKNOWLEDGEMENTS;
This project was conducted in the Geronimo Fire Investigation
Laboratory at the University of Technology, Sydney. The
laboratory is managed by Insearch Ltd and was initially funded
with a generous grant from the G.I.O. and N.R.M.A. Insurance
Companies. I would like to express my deepest gratitude to these
companies for their financial and continual support and in
particular the G.I.O. for their scholarship, which allowed me to
financially survive to persist with the project.
The driving force behind the laboratory is my co- supervisor Dr.
R.F.G. MacMillan, Head of the Department of Material Science.
I would like to thank Rob for his vision, resilience and inspiration.
My other co- supervisor, Dr. J.H. Sharp, Senior Lecturer of the
Department of Chemistry has impressed on me a sense of
diligence and finesse in my work which I am greatly indebted to
him for.
Finally I would like to thank all the academic and technical staff
at the University and in particular Mr. Jim Keegan for the
comments and advice he gave.
TABLE OF CONTENTS:
Page
ABSTRACT
ACKNOWLEDGEMENTS
TABLE OF CONTENTS
LIST OF FIGURES
LIST OF TABLES
CHAPTER 1. INTRODUCTION
1.1 Arson Investigation 1.2 Determining the Fire Cause 1.3 The Nature of Accelerants 1.4 Sampling at the Fire Scene 1.5 Control Samples 1.6 Use of the "Sniffer" at the Fire Scene 1.7 The Importance of Accelerant Analysis 1.8 Fire Debris Extraction and Analysis
1.8.1 Extraction Techniques 1.8.2 Properties of Absorbents 1.8.3 Desorption Techniques 1.8.4 Analytical Techniques
(0 Principle of G.L.C.
CMAF'JTR 2. THE EXPERIMENTAL WORK OBJECTIVE
2.1 The Extraction Equipment 2.2 The Analytical Equipment
CHAPTER 3. EXPERIMENTAL RESULTS AND DISCUSSION
3.1 Sampling with a Sniffer 3.2 Contamination of Samples
3.2.1 Precontamination of Containers (0 Analysis of Empty Cans (ii) Cleaning of Cans
3.2.2 Contamination During Transpon and Storage
3.2.3 Contamination During Analysis (0 Investigation of the
Water Trap (ii) Gas Transfer Line Material (iii) Cleaning of the Gas
Transfer Lines (iv) Syringe Cleaning Procedures.
3.3 Discrimination During Extraction. 3.4 Thermal Desorption Using Tenax
(0 Analysis of Petrol (ii) Analysis of Ethanol
3.5 Detection of Gas Odourants 3.5.1 Investigation of a Suitable
Absorbent for the Analysis of Gas 3.5.2 Use of Dragar Tubes OnSi te to
detect Gas Odourants. 3.6 Interpretation of Results
3.6.1 Background Levels of Accelerants 3.6.2 Analysis of the Common Accelerants
(0 Petrol (ii) Petrol Additives (iii) Kerosene (iv) Mineral Turps (v) Diesel
3.6.3 Analysis of the Industrial Solvents (i) Lacquer Thinners (ii) Methylated Spirits (iii) Shell Solvents
3.6.4 Analysis of Common Household Products and Materials (i) Floor Tile Glue (ii) Varnished Wood (iii) Motor Oil (3 Vegetable Oil (v) Aerosol Sprays - Mortein
& WD-40 3.6.5 Analysis of Burnt Synthetic Materials
(0 Nylon (ii) Polyvinylchloride (P.V.C) (iii) Polvethvlene (ivj ~ o i ~ r d ~ y l e n e (v) Polystyrene (vi) Rubber backed carpet (vii) Rubber floor tiles
CHAPTER 4. CONCLUSIONS
BIBLIOGRAPHY
APPENDIX 1 CHROMATOGRAMS OF THE INDUSTRIAL SOLVENTS.
LIST OF FIGURES;
Extraction Equipment
Schematic Diagram of Dynamic Headspace Extraction Equipment
Empty Can Chromatogram
Lined Can vrs Petrol Chromatograms
Plastic Bag Chromatogram
Diesel extracted and sampled at 15, 30, 60 and 90 minutes vrs Diesel Chromatograms
Thermal and Solvent Desorption of Petrol Chromatograms
Thermal and Solvent Desorption of Ethanol Chromatograms
Town Gas Chromatogram
Soil (Ex Motor Yard) vrs Petrol and Diesel Chromatograms
Fresh and Evaporated Petrol Chromatograms
Ion Scans of Petrol Chromatogram
Lead Scans of Petrol Chromatogram
Lead Scans of Extracted Petrol Chromatogram
Leaded and Unleaded Petrol Chromatograms
Kerosene Chromatogram
Ion Scans of Kerosene Chromatogram
Evaporated Kerosene vrs Diesel Chromatograms
Fresh and Evaporated Mineral Turps Chromatograms
Ion Scans of Mineral Turps Chromatogram
Diesel and Evaporated Diesel Chromatograms
Ion Scans of Diesel Chromatogram
Floor Tile Glue vrs Petrol Chromatograms
Varnished Wood vrs Petrol Chromatograms
Motor Oil vrs Kerosene Chromatograms
Vegetable Oil and Rancid Oil Chromatograms
Mortein, W D 4 0 vrs White Spirits Chromatograms
Burnt Nylon Chromatogram
Burnt P.V.C Chromatogram
Ion Scans of Burnt P.V.C Chromatogram
Burnt Polyethylene vrs Kerosene Chromatograms
Ion Scans of Burnt Polyethylene Chromatogram
Burnt Polypropylene Chromatogram
Burnt Polystyrene Chromatogram
Ion Scans of Burnt Polystyrene Chromatogram
Burnt Rubber Backed Carpet vrs Petrol Chromatograms
Ion Scans of Burnt Rubber Backed Carpet Chromatogram
Burnt Rubber Floor Tile Chromatogram
Ion Scans of Burnt Rubber Floor Tile Chromatogram

LIST OF TABLES;
Sniffer Responses for 112 Samples
Drager Tube Responses to H2S, T.H.T., T.B.M. and Diluted Town Gas.
CHAPTER 1. MTRODUCIION:
1.1 ARSON INVESTIGATION
The cost of arson to the Australian community was estimated at
$120 million per annum in 1980/81 [I]. This figure was expected
to increase and concern about the problem has resulted in a
number of steps being taken to reduce the cost.
In N.S.W recently, a Standing Committee on Arson and a local
chapter of the International Association of Arson Investigators
have been formed, with members from the Police and Fire
Fighting Authorities, Forensic Scientists, Insurance Personnel,
Private F i e Investigators, Loss Assessors, Solicitors, Barristers
and Academics.
The lack of a dedicated forensic fire analysis laboratory in N.S.W.,
caused the G.I.O. and NRMA to jointly fund a facility which was
to be established at the University of Technology, Sydney. A
research program was designed to establish procedures for fire
debris analysis based on gas chromatography and to research the
variations in the analytical results which might be found in fire
debris.
The motives to commit arson are numerous and include revenge,

sabotage, pyromania, vandalism and fraud. Because there is
normally little first hand eyewitness evidence, the findings of a
scientific investigation are considered important pieces of
evidence in criminal and civil coun actions.
Internationally, the insurance industry and the public authorities
have financed the scientific research of fire investigation methods
and procedures. Fire cause determination is fundamental in the
prevention of further fires and p m f of arson is essential in
negating fraudulent insurance claims and assisting criminal
investigations.
Fi investigators are educated through on site training and formal
courses that are designed to draw on the appropriate scientific
principles from Engineering, Physics, Chemistry and Materials
Science which assist the investigators' interpretation of fire origin
and propagation.
1.2 DETERMINING THE FIRE CAUSE
The aim of the on- site investigation is to establish beyond
reasonable doubt the cause of the fire by locating the fire origin
from an investigation of the fm debris and remaining building
structure and obtaining physical evidence pertinent to the ignition
source.
Incendiary fires generally involve the utilisation of an agent to
accelerate the intensity of the ignition phase and the rate of spread
of the fm. Such an agent is normally a material which is easily
ignited and highly flammable. Hydrocarbon liquids such as petrol
or kerosene art generally used to ensure that the fire will be
major. Such agents are called accelerants.
A fire of long duration with plenty of fuel and oxygen will leave
little evidence to determine the cause of the fire and any
accelerant that may have been used will be readily consumed. If
the basic structure still remains then the investigator follows the
progress of the fue through his interpretation of the bum patterns
and locates the point of origin. A fire will burn upwards and
outwards, therefore low areas of burning are of special interest to
the investigator. The investigator should attempt to reconstmct
the area, so that burn panems on furniture and surfaces can be
interpreted. Once the area of origin has been determined the
overall degree of the burning may be used to predict the presence
of an accelerant. A rapid and intense fm progress that is
inconsistent with the natural fuel loading present is indicative of
an accelerated fire. Multiple areas of origin generally preclude an
accidental cause of the fire.[2]
The result of any investigation will be greatly enhanced if residual
accelerant can be identified at positions in the fire damaged
smcture at which the natural or normal presence of such a
material is unlikely, e.g., petrol on the floor in the lounge room or
hallway.
Therefore, a major objective in forensic fire cause determination
would be to locate, sample and analyse residual accelerants.
1.3 THE NATURE OF ACCELERANTS
The accelerants most commonly used because of their availability
and flammability are petrol, kerosene, diesel, mineral turps and
methylated spirits. Exotic accelerants such as industrial solvents
are rarely used and if so are readily identified by chemical
analysis because of their similar chemical characteristics to the
common accelerants.
Accelerants can be classified as either mixtures of compounds or
pure compounds. The chromatographic analysis of a pure
compound will feature a single peak while a mixture will give
several peaks that contribute to a fingerprint which is used to
identify the accelerant. The more volatile components of an
accelerant evaporate at a faster rate than the heavier components
so that the overall chemical profile of the accelerant will change
during the fire and before sampling.
The amount of accelerant remaining at the fire scene available for
sampling is governed by the following:
- the initial loading of the accelerant
- the volatility of the accelerant
- the severity of the fire
- the water solubility of the accelerant
- the porosity of the substrate material
- the dryness of the area after the fire
- the elapsed time between the fire and sampling.
Samples of a suspected accelerant are often located at the scene in
a container and are supplied for analysis. Samples of this type
are usually unaffected by evaporation. It is difficult to
conclusively determine if a supplied sample of an accelerant was
the same as that used to initiate or propagate a fire, because of the
universal composition of the common accelerants.
The chemical components of the common accelerants are aliphatic
and aromatic hydrocarbons and oxygenated hydrocarbons such as
alcohols. The oxygenated hydrocarbons are to a degree water
soluble and are therefore washed away during the extinguishing of
the blaze, so that little trace remains.
1.4 SAMPLING AT THE FIRE SCENE.
The investigator samples material and fire debris where he
determines a quantity of accelerant will remain. These are
generally areas of high initial accelerant loadings or low oxygen
availability during and after the fire. The most frequently
sampled item is flooring material such as carpet, underlay and
linoleum. Other areas sampled include interior pot plants or the
soil underneath the structure, where the accelerant may drip
through the floor and be preserved in the cold, damp earth. The
area behind skirting boards are sampled if the accelerant has been
splashed on to the wall. Severely charred timbers do not make
good samples because the timber supports the flame which assists
in the depletion of the accelerant. Wet, spongy material such as
clothing, towelling, bagging and bedding materials, furniture
rubber and foam are ideal materials for sampling because the
accelerant absorbs into the material and the water used to
extinguish the blaze seals in the accelerant and prevents its
evaporation.
1.5 CONTROL SAMPLES,
Control samples or "blanks" generally form pan of the scientific
method of analysis to ensure that materials other than the material
being analysed do not contribute to the identification.
Control samples are sometimes taken at a fire scene away from
the area where an accelerant is suspected and of the same material
as that of the sample. The chromatographic analysis of a control
sample will feature the material's pyrolysis products which are
essentially its thermal molecular fragmentation.
The major problems associated with taking control samples are:-
The amount and proportion of artefacts from pyrolysed
material depends on the degree of buming and it is
difficult to bum in the laboratory or sample a control with
the same degree of buming as the sample.
When sampling ash and debris of uncertain origin a control
sample cannot be expected to be of the same composition.
The investigator may use a false negative from a gas
detector (Sniffer) reading to choose the control.
The findings of an accelerant in a control sample through
poor sample selection would reduce the validity of positive
findings in other samples.
Control Samples are an added expense to the investigator.
The research has shown however, that,
(i) The high resolution of capillary columns and the
increasing use of mass spectrometry gives more
information to the analyst for the correct
interpretation of the chromatograms.
(ii) An experienced analyst equipped with a good
library of chromatograms could readily identify
non-accelerant peaks and fingerprints.
A material such as an unidentifiable or rare plastic may be
sampled as a control but the preferred option would be to take two
or more samples, where accelerant is suspected, of different
background materials.
1.6 USE OF THE "SNIFFER" AT THE FlRE SCENE.
After the investigator has determined the area he feels may
contain accelerant a small sample must be collected for
submission to the laboratory. Portable gas detectors (Sniffers)
can be used at this point to assist the investigator in selecting a
sample with the highest probability of containing an accelerant.
The investigator inserts the probe of the Sniffer in areas such as
freshly lifted carpet or freshly dug soil and notes the instrument's
response either via a meter or alarm.
The instrument monitors the ambient conditions through the
absorption of oxygen on a semiconductor. Any changes in the
oxygen level near the detector will be noted so that the Sniffer
will respond to accelerant vapours. The insaument also responds
to volatile pyrolysis products or entrapped smoke and so is not
specific for accelerant vapours.
The sensitivity of the Sniffer is important and dual sensitivity
instruments are the best to use. When confronted with a material
such as rubber-backed carpet a very sensitive sniffer will give
random positive readings that can confuse the investigator. The
investigator would be better suited using the low sensitivity setting
in this case. In most instances, however, the high sensitivity
setting is used so that debris that contains traces of accelerant,
which are readily detected in the laboratory, is sampled.
Sniffers that use a photoionisation or flame ionisation detector are
generally too expensive and too sensitive for on- site work. They
also suffer from the same lack of specificity as the molecular
absorption detectors. The low cost and robust design of the
molecular absorption detector makes it the most popular for use in
on-site sampling of fire debris.
A positive Sniffer reading is not proof of the presence of an
accelerant nor is a negative reading proof of the absence of an
accelerant. They cannot replace laboratory analysis, but when
used with their shortcomings being understood by the operator,
they should increase the sampling success rate of the investigator.
ERANT ANALYSIS,
The presence and distribution of a flammable liquid at a fire scene
indicates a deliberately lit fire unless it can be readily explained
otherwise. Multiple samples should be taken so that the spread of
the accelerant is ascertained. The analysis identifies the
accelerant which confms the investigator's understanding of the
initiation and propagation of the fire.
The investigator must use laboratory analysis to support his
argument. Opinions and theories can be readily challenged in
court because of the complex and varied nature of fires, but
laboratory evidence is irrefutable proof of the presence of an
accelerant. The laboratory findings may dispute a suspects'
statement so that further investigation would then be implemented.
Prior storage of a flammable liquid could also be proven, which
would contravene the conditions of some insurance contracts.
1.8 FIRE DEBRIS EXTRACTION AND ANALYSIS.
The analysis of accelerants in fire debris constitutes a significant
portion of the routine work at a forensic laboratory and research
has been aimed at investigating new techniques and aiding the
interpretation of the chromatograms. The forensic laboratory uses
techniques similar to those used in the industrial hygiene and
environmental chemishy areas and modifies them because debris
samples are usually of an unknown matrix and saturated with
water.
Environmental and indusmal hygiene research has been directed at
developing increasingly sensitive quantitative methods, but mainly
the qualitative aspect of their work has interested the forensic
research. Using these sensitive techniques can pose problems in
fire debris analysis and lead to false positive conclusions because
of sample contamination through careless transpon and storage
and the application of unsatisfactory laboratory techniques. The
interpretation of the results must be carefully made when sensitive
techniques are used because of complications from pyrolysis
products and the significance of detecting trace amounts of
accelerant components.
Fire debris extraction and analytical techniques have been
developed to improve sample turnover in the laboratory and
to reduce the number of inconclusive findings. The two main
areas of research are to improve extraction techniques, where the
accelerant is separated from the debris, and in the analysis, where
the accelerant is detected and identified.
The simplest and earliest extraction technique used was sampling
a headspace of heated fire debris with a syringe and then injecting
the sample into a G.L.C. for analysis [3]. Heated headspace
analysis is also used for sample screening because it is a simple,
rapid and easy technique to apply. A sample that gives a
negative result when screened by heated headspace would then be
subjected to a more sensitive extraction technique.
Headspace sampling can be made at room temperature or an
elevated temperature to improve the recovery of accelerant. The
technique however, discriminates against the less volatile
components in the sample which will give less data from the
chromatographic analysis for interpretation.
Distillation extractions are also widely used with steam distillation
being the most popular [4]. Distillation involves heating the
sample with an extraction medium and condensing the vapour to
provide a sample of the accelerant in the extraction medium used.
The various mediums that have been used are water, ethanol and
ethylene glycol and also vacuum distillation with subambient
trapping of the volatiles can be used [4]. The accelerant may be
further concentrated by controlled evaporation of the medium or
by solvent extraction from the medium.
Steam distillation can be a lengthy technique and extraction times
of up to 48 hours have been reported as being necessary for some
samples [5]. The technique however, requires considerable clean
up of the apparatus between samples and also considerable
operator attention and so the sample turnover is low .
Solvent extraction is also used and involves soaking the fire debris
in a suitable solvent and then filtering and evaporating the solvent
to concentrate the sample [4]. The advantages of solvent
extraction is that it readily extracts the less volatile components of
an accelerant and therefore does not discriminate [6]. The
technique however, requires the use of high purity solvents which
are expensive and also matrix components such as monomers,
plasticisers, glues and resins are co- extracted which may interfere
with the subsequent analysis. Both distillation and solvent
extraction require further concentration of the raw extracts to
increase the sensitivity of the technique.
Dynamic headspace sampling is widely used for the extraction of
ftre debris and involves continuous sampling by sweeping the
headspace with an inert gas and simultaneously separating and
concentrating the accelerant on to a suitable absorbent. The
sample can be heated on a hotplate or in an oven to increase the
concentration of accelerant vapour in the headspace.
Dynamic headspace sampling's recovery of accelerant is many
times that of a static headspace sample and is a function of the
extraction gas flow rate and the time of extraction. For example,
when extracting using dynamic headspace with 500mls/minute of
nitrogen for 1 hour, 30 litres of headspace will be sampled by the
charcoal. The maximum static headspace sample that can be
taken for analysis by packed column G.L.C. is approximately
IOrnls so dynamic headspace effectively samples 3000 times more
headspace.
Dynamic headspace extraction also has the advantage that the can
is always vented so pressure will not build up in the sample
container when it is heated. Water in the sample will volatilise
and effectively this steam distills the sample. Steam distillation
allows high boiling point compounds to distill at a much lower
temperature. Therefore extracting wet samples at 1500C using
dynamic headspace will result in compounds being recovered that
have a boiling point well in excess of 150W. This allows for a
shorter extraction time and high temperatures that could pyrolyse
some samples are therefore not required.
Activated charcoal is the most commonly used absorbent because
of its affinity for the compounds found in the common accelerants.
It does not absorb air, nitrogen or water vapour so the accelerant is
readily separated from the extraction medium used [7], [8].
The transfer gas used to sweep the headspace to the absorbent is
usually nitrogen or the headspace can be drawn through the
absorbent with a vacuum [9]. The sample can be heated in an
oven or the nitrogen can be preheated before it enters the sample
can [lo]. Microwave ovens have also been used to heat the
sample and the steam generated sweeps the headspace to the
absorbent. This technique is reported to heat the sample fifty
times faster than conventional oven heating with extraction times
reduced by a factor of three [ll].
A major problem of dynamic headspace extraction techniques is
the carry over of contaminants from previous samples through the
gas transfer lines. It was found that by removing the outward gas
transfer line and connecting the charcoal tube directly to the
sample container the contamination problem was reduced [12].
No loss of accelerant from the heated charcoal tube was reported.
Other absorbents that have been used successfully are Tenax G.C.,
and Porapak Q [13], [14]. As well as successfully absorbing
accelerant components, they do not absorb water or nitrogen and
allow the recovery of the accelerant with thermal dessorption.
Absorbents are also used to concentrate the accelerant vapours
through passive diffusion of the accelerant vapour through the
headspace to the absorbent [15], [la, [17]. The absorbent is
mounted on to a suitable support and placed in the sealed fire
debris container and the accelerant vapours in the headspace are
concentrated for a fixed time period on to the absorbent.
Charcoal is again the most popular absorbent and can be mounted
to a ferromagnetic wire with a slurry of soda ash, or a piece of
granular charcoal can be mounted at the end of the wire in a
flattened loop. After the absorption time is completed the wire is
removed and placed into a Curie Point Pyrometer, where rapid
heating thermally desorbs the accelerant vapours which are then
swept onto a chromatographic column for analysis. The
sensitivity of the technique can be increased by increasing the
absorption time in the sample container. Charcoal is the only
absorbent that has been successfully used because other absorbents
are diff~cult to attach to a support. Also the high temperature
needed for rapid thermal transfer to the absorbent to give
successful thermal desorption, breaks down some polymeric
absorbents to give peaks in the blank analysis.
Tenax is a widely used absorbent and can sustain temperatures of
up to 3500C which makes it ideal for rapid thermal desorption
[IS]. It can be used to absorb a static headspace sample from a
syringe or it can be mounted on the sample outlet to absorb a
dynamic headspace sample [14]. Tenax has also been used at the
fire scene to absorb multiple air samples so a profile of accelerant
spread at the fire scene can be ascertained later from laboratory
analysis [IS].
The qualities that enable an absorbent to be used successfully for
accelerant extraction and analysis are its selectivity for the
accelerant components which separates and concentrates the
accelerant from the headspace to yield a sample that is suitable for
introduction to a Capillary Gas Liquid Chromatograph. The
analyst needs to understand the properties of absorbents so that a
suitable absorbent can be selected and the most efficient
desorption technique chosen.
1.8.2 PROPERTIES OF ABSORBENTS,
Absorption columns are essentially a gas chromatography column
packed with a suitable absorbent and operated at ambient
temperature. The camer gas and means of sample introduction is
the atmosphere being sampled. Commonly used absorbents are
charcoal, silica gel, alumina and molecular sieves as well as the
commercial porous polymers such as the Chromosorbs, XAD and
PAR resins, Tenax and the Porapaks [19].
The interactions responsible for absorption are essentially Van der
Waals forces [20]. The chetkcal nature of the absorbent, its pore
size distribution, surface activity and micropore volume affect the
absorption process [21]. Other factors that affect absorption are
the chemical nature and concentration of the absorbate, other
compounds present and the surface area of the absorbent [20].
The porous polymers are manufactured so that the surface is a
collection of microspheres with diameters of approximately
4 10 mm. Between the microspheres are pores where molecules
become trapped thereby being effectively absorbed. The size and
packing factor of the microspheres determines the surface area and
porosity of the absorbent [22]. As the surface area increases, the
pore diameter decreases so that the larger molecules are difficult
to trap in the pores because of poor diffusion in the limited pore
space [23].
Absorbents such as charcoal and silica gel have a constant pore
size that cannot be altered. Porous polymers however, can have a
variety of pore sizes which are controlled in their manufacture by
suspension and polymerisation means [22]. Their chemical nature
can be altered to absorb polar and non-polar compounds whereas
charcoal is unsuitable for trapping very polar compounds in the
presence of water [27].
The porous polymers are manufactured from unsaturated aromatics
such as styrene or divinyl benzene which have a hydrophobic
nature or from acrylic esters which are hydrophilic due to the
carbonyl group in the resin matrix. Allcyl derivatives of benzene,
styrene, naphthalene and biphenyl have been found to come from
some of the XAD resins during desorption which would interfere
during the analysis of some accelerants [24]. The absorbent
therefore must be chosen so that possible impurities are not
compounds of interest.
Charcoal is the most common absorbent used in environmental
and industrial hygiene analysis and absorbs both polar and
non-polar compounds. Higher molecular weight compounds will
displace absorbed lower molecular weight compounds and polar
organic compounds are displaced by non-polar organics [25],
[26]. Water vapour can also strip polar compounds such as
ethanol from charcoal [27].
The collection efficiency of an absorbent for a particular
compound is defined as:
in le t concentration - out le t concentration
in le t concentration
During continued sampling the absorbent capacity will be
exceeded and breakthrough will occur. The volume that has
passed through the collection tube is termed the breakthrough
volume and is related to the retention volume used in conventional
gas chromatography [19].
Breakthrough may be capacitive (weight) or volumetric depending
on the nature of the absorbent. For atmospheres containing a
high concentration of organic vapours the pores of the absorbent
will become filled and capacitive breakthrough will occur due to
saturation. For low concentrations the compound will progress
through the collection tube by virtue of its equilibrium between
the absorbent and gas phase and breakthrough is termed
volumetric. Activated charcoal has an extremely high collection
efficiency and breakthrough is entirely capacitive for most organic
compounds.
Breakthrough is affected by the geometry of the packing tube,
temperature, humidity, flow rate, concentration and other
compounds present [28], [29], [30]. Breakthrough volumes are of
considerable importance to designers of respiratory filters and
industrial absorbent equipment [31].
After absorption the compounds can be recovered by either
thermal or solvent desorption. Desorption efficiencies are
evaluated by injecting or absorbing a known amount of compound
and then desorbing and measuring the recovery.
Thermal desorption is achieved by rapidly heating the absorbent
and then sweeping the compounds into a G.L.C. for analysis. The
adsorbent can be heated in the injection port of the G.L.C. or in a
separate oven. For use with capillary G.L.C. the sample must he
introduced rapidly so efficient heat transfer is essential otherwise
secondary trapping with cyrogenics is necessary.
The desorption efficiency for thermal desorption is directly related
to the collection efficiency and the desorption temperature.
Absorbents with extremely high collection efficiencies such as
charcoal will not rapidly desorb and require secondary on-column
trapping. For thermal desorption the absorbent should be chosen
so that the pore size is not too large, otherwise, absorbed species
penetrate too far making desorption slow. The choice of an
absorbent is often a compromise between the collection and
desorption properties of the absorbent and it must also sustain high
temperatures to give rapid desorption for Capillary G.L.C. [32].
Microwave heating has been used successfully to thermally desorb
accelerants from charcoal. The charcoal can be mounted on to
ferromagnetic wires [15] or packed in tubes [33]. Other
absorbents packed in tubes can also be thermally desorbed with
microwaves [34].
Thermal desorption transfers all of the sample to the G.L.C. and
so is extremely sensitive. For capillary analysis the column could
be easily overloaded and a second analysis would require another
headspace absorption.
Solvent desorption gives a liquid sample that can be reanalysed
many times but only a small amount of the sample is analysed so
that the sensitivity is much less than that for thermal desorption.
However, liquid samples are easily injected into a G.L.C. and
reanalysis enables the operator to optimise the analytical
conditions to improve resolution and the retention time
reproducibility.
Solvent desorption is accomplished by adding a small amount of
solvent to the absorbent and collecting the solvent through
decanting, filtering or centrifuging. For solvent desorption the
Van der Waals forces of absorption must be overcome and the
absorbed compounds must be readily soluble after the solvent
diffuses to the absorption site.
The desired properties of a desorption solvent are:
- the desorption efficiency is high.
- the solvent peak does not obscure areas of interest in the chromatogram
- the solvent is volatile so that further concentration of the sample by evaporation is possible.
- the solvent is relatively cheap, pure. and has a low toxicity.
- the sample is stable on storage.
Solvent desorption efficiency is related to the temperature of
desorption, the solubility of the absorbed species in the solvent,
the collection efficiency and the solvent's ability to displace the
absorbed species at the absorption site.
Carbon disulphide is the most commonly used solvent for the
desorption of charcoal because of its low detector response and
high desorption efficiency. Other solvents that are used are
diethyl ether, pentane, dodecane, the freons and esters. Water,
ethanol and acetone can be used to desorb polar compounds from
silica gel. Very polar compounds such as ethanol have low
desorption efficiencies from charcoal using carbon disulphide
because they are more readily soluble in water if present.
Desorption efficiency of polar compounds can be increased by
adding methanol to the carbon disulphide, however, samples
should be analysed within 4 hours because reactions between
methanol and carbon disulphide are possible [34]. Modification
of the carbon disulphide is also possible using other alcohols to
increase the recovery of polar compounds [38]. Polar and
non-polar compounds can be recovered from charcoal
simultaneously using carbon disulphide and water and analysing
both layers separately [35].
1.8.4 ANALYTICAL TECHNIOUES:
After the sample has been exiracted, the extract is analysed to
detect and identify possible accelerants. Gas Liquid
Chromatography is the most widely used technique but others
have been hied.
Infra Red Spectroscopy has been used but is unsuitable for
analysing complex mixtures such as those recovered from fire
debris samples. When using I.R. solely, the probability of a false
positive result is high [36], [37]. Nuclear Magnetic Resonance
has also been used but the interpretation is difficult for complex
mixtures [38].
Gas Liquid Chromatography is widely used because of its ability
to separate and detect trace amounts of volatile hydrocarbons in
complex mixtures. The analysis gives a reproducible
chromatographic fingerprint for each of the common accelerants
which is used to positively identify accelerants in fire debris.
During the early 1960's 'when G.L.C. was Fust used to analyse fire
debris extracts, packed columns and thermal conductivity detectors
were used. With the introduction of Flame Ionisation Detectors
(F.I.D.) an increased sensitivity of the analysis by a factor of 1OOO
was possible.
The FID uses a hydrogenJoxygen flame to reduce and ionise the
components as they emerge from the column. The ions are
measured by amplifying the current that will pass if a voltage is
applied across the flame. The detector response and time of
elution are registered on a graph to give a chromatogram of the
analysis [32].
Capillary columns are rapidly replacing packed columns for
accelerant analysis. Greater column efficiency is obtainable using
capillary columns because the more permeable open bore allows
the use of longer columns therefore giving greater resolution.
The time of analysis is also much shorter and new manufacturing
techniques have meant more robust and reproducible columns are
available. Injection of a headspace sample on to a capillary
column cannot be made directly because the sudden injection of a
large volume of air (1- 5mls) disturbs the small carrier flow rate
through the column (1- 2rnlslminute) and the resolution is
significantly affected. However, no problems are encountered
with liquid sample injections or thermal desorption provided the
absorbent is suitable and the temperature and heat transfer of the
desorber is high. The higher resolving power of capillary
columns gives more peaks in the chromatogram for interpretation.
Interferent peaks that may obscure an accelerant peak in the
chromatogram are less of a problem with the increased resolution
of capillary columns. Capillary columns were first used for
accelerant analysis in 1977 and were approximately 30 metres
long and the analysis of diesel required approximately 1 hour [39].
Recent advances in column phase bonding has reduced this time
by one-third because the operating temperatures of the column
can be increased.
As well as F.I.D. detectors, mass spectrometers have also been
used to detect and qualitatively identify accelerant peaks in the
chromatogram [40]. As the compounds emerge from the column
the molecules are fragmented and the mass and quantity of each
fragment are measured and used to positively identify the
compound. Aliphatic hydrocarbons are sometimes difficult to
identify because of their simple fragmentation patterns and
chromatographic retention time data must also be used.
Accelerant components such as the aromatic hydrocarbons or
1.8.4.(i)
Gas Liquim
oxygenated solvents are readily identified [37].
Principle of Gas L ip id Chromatography
d Chromatography is essentially a separation technique
where a sample is injected onto a column and the individual
volatile components are then separated in the column and
detected. It was originally used for the separation of gas sample
components but can be equally efficient for liquid sample
separation provided the sample is vapourised first in the heated
injection port at the start of the column.
Gas chromatography uses a stream of canier gas to move the
volatile components along a column. Components that are
readily absorbed in the column are slow to move through and so
emerge from the column later than less absorbed species. On
emerging from the column the components reach a detector that
produces an electrical signal which is amplified and fed to a chart
recorder. The detector signals of the components versus their
time of elution are recorded to give a chromatogram of the
separation. By carefully controlling the gas flow rate through the
column and the temperature of the column, a pure compound
injected into the column will always emerge at the same time.
The time after injection the compound emerges from the column
is called the retention time and is used to qualitatively identify the
component.
The chromatograms obtained can be quite complex depending on
the number of components present in the sample. A short or
inefficient column will not separate or resolve components so
longer columns may be needed. As the resolving power of a
column increases more components are separated from a complex
mixture and more components can be identified by their retention
time. Good resolution is important in fire debris analysis because
accelerants are usually complex mixtures of hydrocarbons
obtained from crude oil and the pyrolysis products obtained from
various background materials found in samples are also complex
and may obscure accelerant peaks in the chromatogram.
Capillary columns are very long and have a much greater
resolving power than packed columns and therefore, separate
complex mixtures more efficiently. For the analysis of pew1 a
chromatogram using a packed column may give only 8-10 distinct
peaks whilst a capillary column will give at least 60 distinct peaks
which will readily enable its identification.
CHAPTER 2. THE EXPERIMENTAL WORK O B J E W
The use and adaptation of techniques from the environmental and
industrial hygiene analytical chemistry fields cannot be made
without a thorough investigation because of the nature of fire
debris samples. Fire debris samples could be considered to be the
most complex and dirty samples encountered by an analytical
chemist. Samples injected into a Capillary G.L.C. for analysis
should be as clean as possible to prevent contamination of the
extremely sensitive and expensive equipment. The interpretation
of the chromatographic results must be made carefully, due to the
consequences of making a false positive finding.
The experimental work involved in this project has been aimed at
developing an understanding of the problems likely to be
encountered during routine fire debris analysis. In all analyses,
the laboratory's efforts are dependent on the quality of the samples
provided, therefore sample collection and storage procedures need
to be investigated. The question of the possible contamination of
a sample can easily reduce the validity of a positive analytical
result. Therefore, the areas where contamination could be a
problem were identified and alternative techniques were proposed.
After the chromatogram is obtained an interpretation of the results
is required. The chromatogram is compared with those fmm a
library of chromatograms of various accelerants. If a particular
accelerant is suspected, a sample of the accelerant is analysed
using the same chromatographic conditions as those used for the
sample. The retention times of the peaks in the samples'
chromatogram are compared to those of the accelerants' and if
equivalent the peak is identified. If the accelerants' components
are present in the samples' chromatogram and in similar
quantitative ratios then the presence of that accelerant is indicated
in the sample. Chromatograms obtained from various synthetic
and household materials are also required in the library so that a
false positive result is not obtained. These accelerants and
materials were analysed by Capillary G.L.C., and their
chromatograms are discussed.
The extraction procedure of dynamic headspace trapping with
charcoal and solvent desorption was investigated in detail. The
use of other adsorbents for fm debris analysis was also
investigated which would enable more flexibility in the laboratory.
Gas Liquid Chromatographs have a range of detectors available.
An Ion Trap Detector (I.T.D.) was used for the analysis of various
samples and the results are presented which would aid
interpretation when using a more common and less expensive
Flame Ionisation Detector. The I.T.D. responds to specific
chemical compounds and therefore identifies the class of
compounds each peak component belongs to. The 1.T.D was also
used to positively identify some compounds by comparing their
fragmentation panern to those of a library of standards.
The forensic laboratory needs to be flexible because complex
situations that require non- routine analysis often arise. Gas
explosions may require laboratory investigation and the detection
of gas odourants can readily identify the gas source. An
investigation was made to develop procedures to detect gas
odourants using the same equipment used for fire debris analysis.
The above work was aimed at presenting an analytical scheme and
an understanding of routine fire debris analysis. The basic
equipment that was found to be required was a forced air oven and
a Capillary G.L.C. with F.I.D. detection and chromatographic Data
Processing Facilities.
2.1 THE EXTRACTION EOUIPMENT
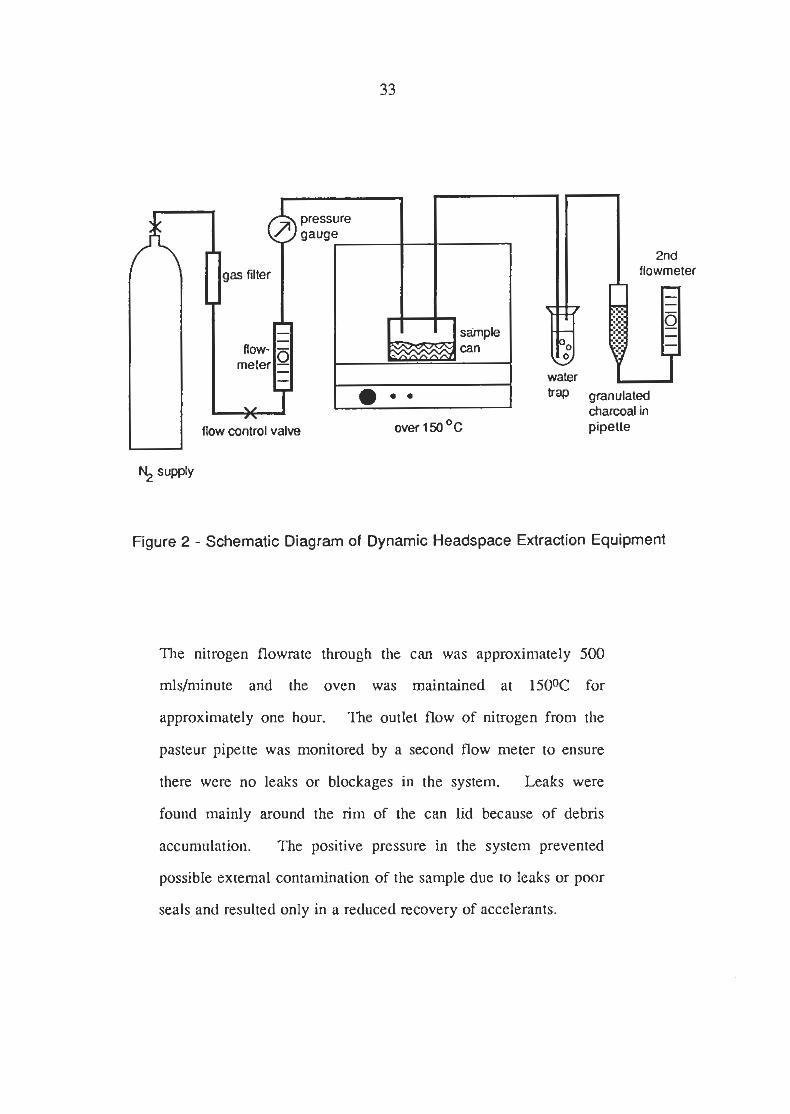
The equipment used for dynamic headspace extraction is
essentially the same as described by Lentini [7] and is shown in
Figure 1. and by a schematic diagram in Figure 2. The nitrogen
used was instmment grade and was regulated and prefiltered
before it entered the sample can by passage through a charcoal
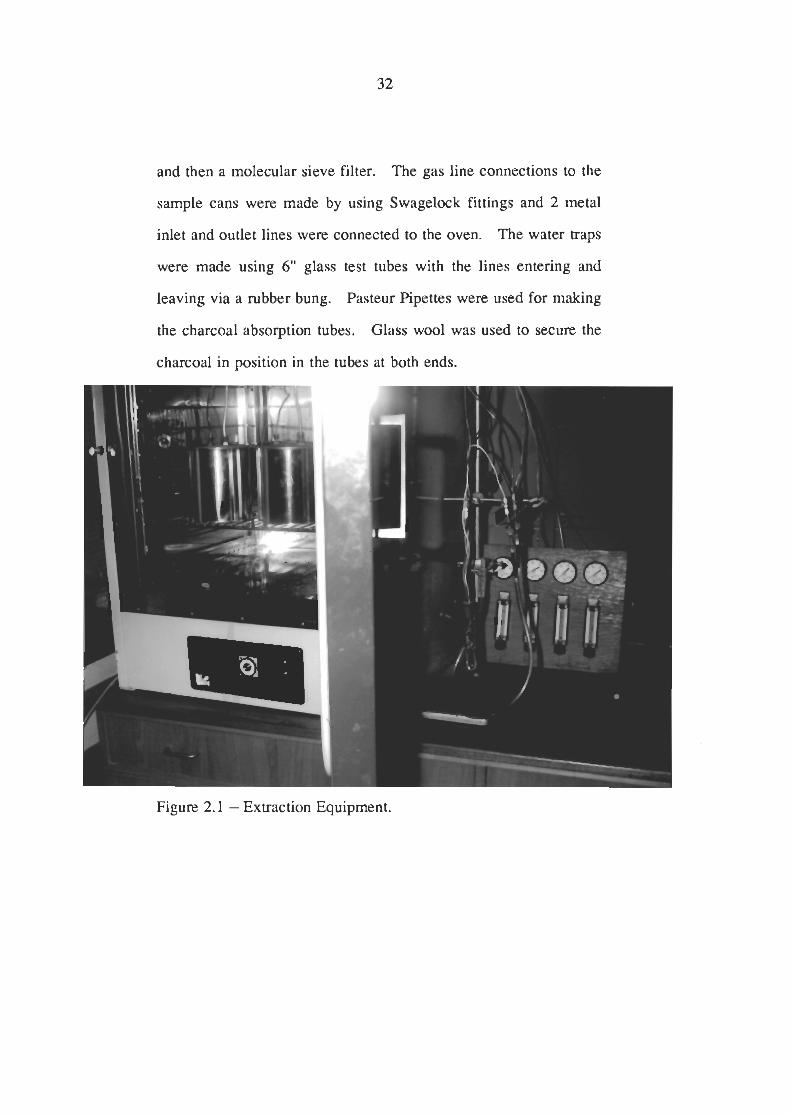
and then a molecular sieve filter. The gas line connections to the
sample cans were made by using Swagelock fittings and 2 metal
inlet and outlet lines were connected to the oven. The water traps
were made using 6" glass test tubes with the lines entering and
leaving via a rubber bung. Pasteur Pipettes were used for making
the charcoal absorption tubes. Glass wool was used to secure the
charcoal in position in the tubes at both ends.
Figure 2.1 - Extraction Equipment.
flow control valve over 1 50 OC pipette
y supply
Figure 2 - Schematic Diagram of Dynamic Headspace Extraction Equipment
The nitrogen flowrate through the can was approximately 500
mlsirninute and the oven was maintained at 150% for
approximately one hour. The outlet flow of nitrogen from the
pasteur pipette was monitored by a second flow meter to ensure
there were no leaks or blockages in the system. Leaks were
found mainly around the rim of the can lid because of debris
accumulation. The positive pressure in the system prevented
possible external contamination of the sample due to leaks or poor
seals and resulted only in a reduced recovery of accelerants.
After extraction the charcoal pipette was removed and allowed to
cool before approximately lml of A.R. grade carbon disulphide
was added and allowed to percolate through the charcoal into a
2ml glass vial. The carbon disulphide was then sucked back up
through the charcoal a number of times before being blown dry
with a rubber teat. Water was added to the vial to seal the carbon
disulphide to prevent loss of the volatile extract.
2.2 THE ANALYTICAL EOUIPMENT
The analytical instrument used for the detection and identification
of possible accelerants in the extracts was a Varian 3400 Gas
Liquid Chromatograph designed for use with capillary columns.
The G.L.C. was fully automated and allowed the user to store up
to 4 sets of operating parameters thus allowing for the rapid and
versatile operation of the machine. The injector system was a
Varian splitkplitless capillary system and the machine was
equipped with both an F.I.D. and E.C.D. detector.
As well as the Varian injector a S.G.E. Unijector was fitted to
enable direct thermal desorption onto the capillary column. Small
bore metal tubes packed with Tenax were used for thermal
desorption and were heated by the injector heating system of the
G.L.C.
The output from the detector was connected to a Varian Vista 402
Data Collection Station which stored the raw chromatographic
data onto floppy disk and simultaneously plotted the
chromatogram. Chromatograms that were off scale could then be
replotted using a higher attenuation setting and so avoiding the
need for reinjection of the sample.
The data station also produced dual plots where the samples'
chromatogram is plotted alongside that from a standard accelerant
so that peak retention times could be easily compared visually.
The replotting allowed the chromatograms to be produced on scale
so the relative ratios of the peak could also be compared during
the interpretation of the results.
The operating conditions of the G.L.C. used were:-
Column - BP- 1 capillary (S.G.E. Australia) 25m, 0.33mm i.d., lpm phase loading.
Oven Conditions - 40% for 2 minute then increased at 100C/minute to 2400C.
Carrier Gas - Hydrogen 8 p.s.i. inlet pressure.
Injector - Split injection (ratio 20:l) at 2400C
Detector - F.I.D. at 240%
Plotter - Vista 402 Thermal Printer.
The attenuation and chart speed were controlled by the Vista 402
and are reprinted at the start of each chromatogram.
As well as using the Varian F.I.D. detector, the capillary column
was connected to a Finnigan Ion Trap Detector (I.T.D.). The
molecules emerging from the column enter the I.T.D. where they
are fragmented and ionised, trapped and then sequentially ejected
out of the trap by changing the applied field. Ejected ions are
then detected by an electron multiplier and the data collected by
an I.B.M. computer. The mass and quantity of the ions are then
used to positively identify the compound emerging from the
column in much the same way as analysis via Mass Spectrometry.
Ions of a specific mass can be monitored so that the detector can
be specific for the different classes of compounds. For example,
aliphatic hydrocarbons will fragment to give ions of mass 29, 43,
57 and 71 and monitoring these ions will give a chromatogram
that essentially detects only aliphatic hydrocarbons. The analysis
of the various accelerants and pyrolysis products from some
synthetic materials was made using the I.T.D. detector with
specific ion monitoring so that the class of compound each peak
component is from could be determined which would assist the
interpretation of the chromatogram when using a simpler F.I.D.
detector.
CHAF'TER 3. EXPERIMENTAL RESULTS
AND DTSCUSSION.
3.1 SAMPLING WllX A SNIFFER.
112 samples of fire debris that were submitted to the laboratory
over a period of six months were screened using a Sniffer before
analysis and the readings evaluated as either positive or negative.
The criteria used for evaluating a positive Sniffer response was the
observation of the acceleration and deceleration of the meter
needle as the detector probe was inserted in and out of the sample
can headspace. The debris was not disturbed for fear of losing
accelerant vapour. The samples were then extracted and analysed
and the analytical result noted.
The fire debris samples were classified according to their overall
composition and the Sniffer results are shown in Table 1, together
with the number of positive analytical results shown in
parenthesis.
The overall percentage of false positive results using the Sniffer
was 32% and false negatives was 22%. Ash and char gave the
most number of false positives. Soil gave the most number of
false negatives because the accelerant is effectively sealed
preventing its volatilization in the sample can at ambient
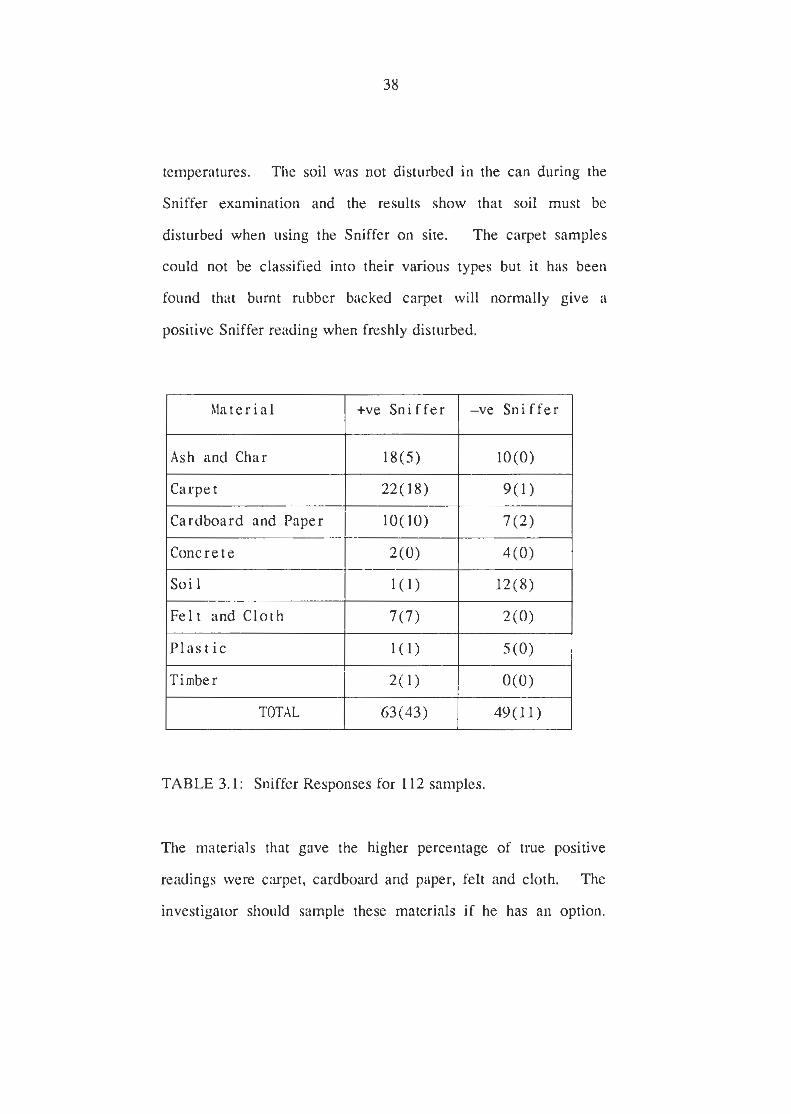
temperatures. The soil was not disturbed in the can during the
Sniffer examination and the results show that soil must be
disturbed when using the Sniffer on site. The carpet samples
could not be classified into their various types but it has been
found that burnt rubber backed carpet will normally give a
positive Sniffer reading when freshly disturbed.
l~ardboard and Paper 1 lO(10) 1 7(2)
Material
Ash and Char
TABLE 3.1: Sniffer Responses for 112 samples.
+ve Sni f fe r
~ 5 )
Timber
TOTAL
The materials that gave the higher percentage of true positive
readings were carpet, cardboard and paper, felt and cloth. The
investigator should sample these materials if he has an option.
-ve Sniffer
10(0)
2(1)
63 (43)
o(0)
49(11)

Burnt timber is not a good material to sample because the timber
supports burning and the amount of accelerant remaining is
significantly reduced.
3.2 CONTAMINATION OF SAMPLES
Because of the high sensitivity of dynamic headspace extraction,
considerable care must be taken to avoid a false positive result
through accidental contamination of the sample. Metal cans are
the best sampling container to use because they are harmonious
with the extraction technique used.
Contamination can occur through poor sampling techniques and
carelessness during extraction. The main areas where
contamination could occur are:-
- hecontamination of the container
- The transport and storage of the sample
- The extraction and analysis of the sample.
3.2.1 PRECONTAMINATION OF CONTAINERS.
Commercial grade paint cans are not guaranteed to be perfectly
clean when supplied and all cans should be inspected internally
before use. Any cans that have odours, stains or traces of oil
present should be immediately rejected.
Cans can be purchased in various sizes and may be either lined or
unlined. Lined cans have an epoxy coating on their inside and
are used for the storage of water based chemicals.
A cleaning method to prepare cans was investigated so the validity
of a positive result could not be questioned as being due to the
possible precontarnination of the sample container.
3.2.1 (i) Analvsis of Emptv Cans.
Six empty lined and unlined cans were extracted in the oven for 1
hour at 15BC. Chromatograms of the extracts were found to be
reproducible in both cases.
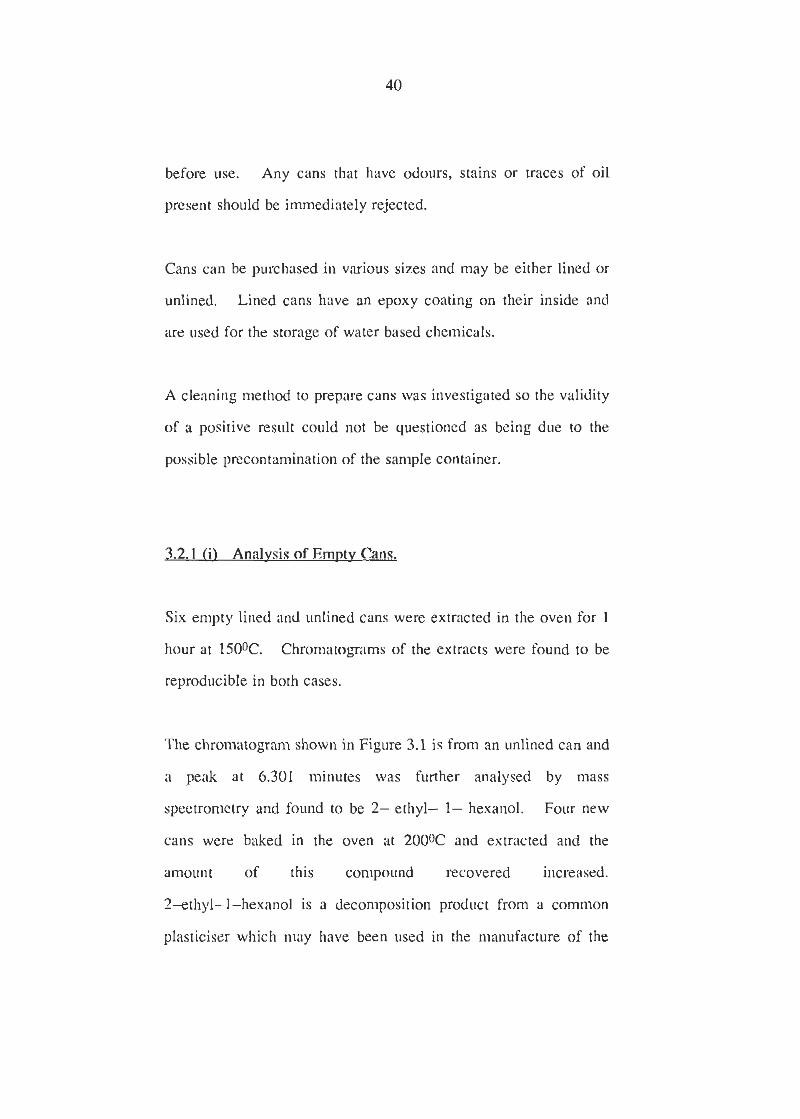
The chromatogram shown in Figure 3.1 is from an unlined can and
a peak at 6.301 minutes was fuxther analysed by mass
spectrometry and found to be 2- ethyl- 1- hexanol. Four new
cans were baked in the oven at 20BC and extracted and the
amount of this compound recovered increased.
2-ethyl-1-hexanol is a decomposition product from a common
plasticiser which may have been used in the manufacture of the
seal found at the base of the can. No amount of pre- washing
could prevent its recovery. Water was added to a can and the
can extracted and the peak was found to be absent. The
temperature inside the can did not exceed lOOOC which would be
the case with a wet fire debris sample.
Figure 3.1 -Empty Can Chromatogram.
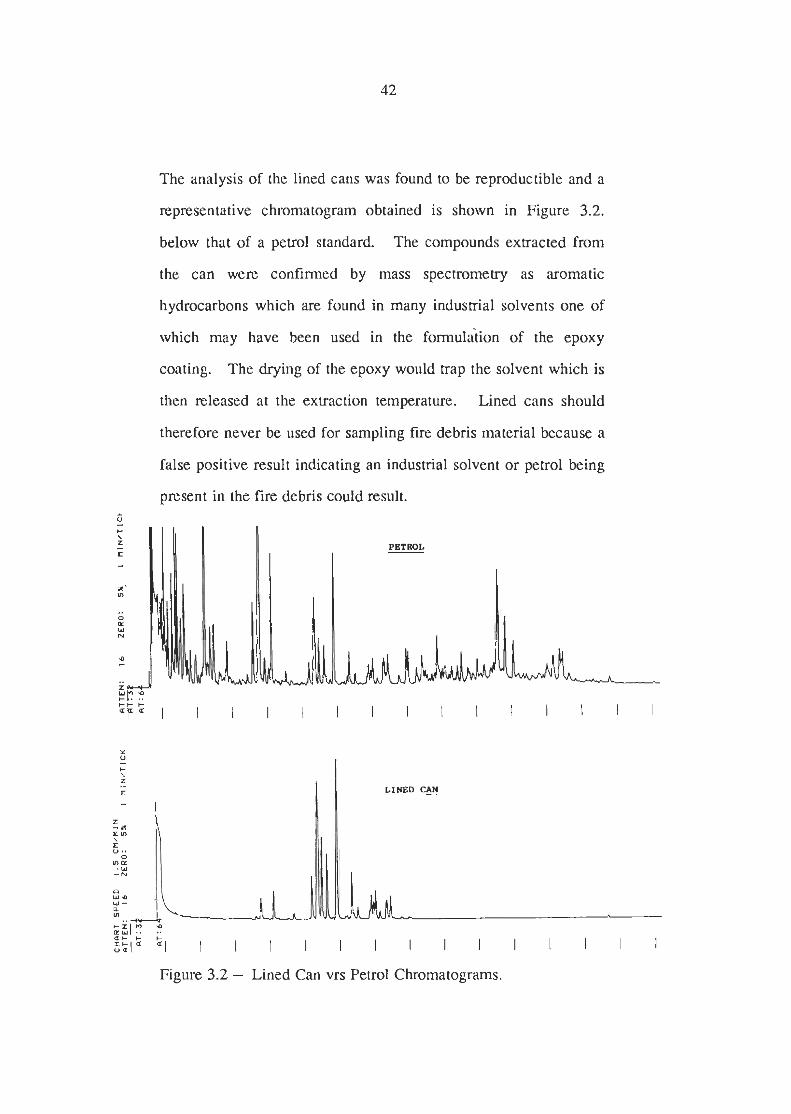
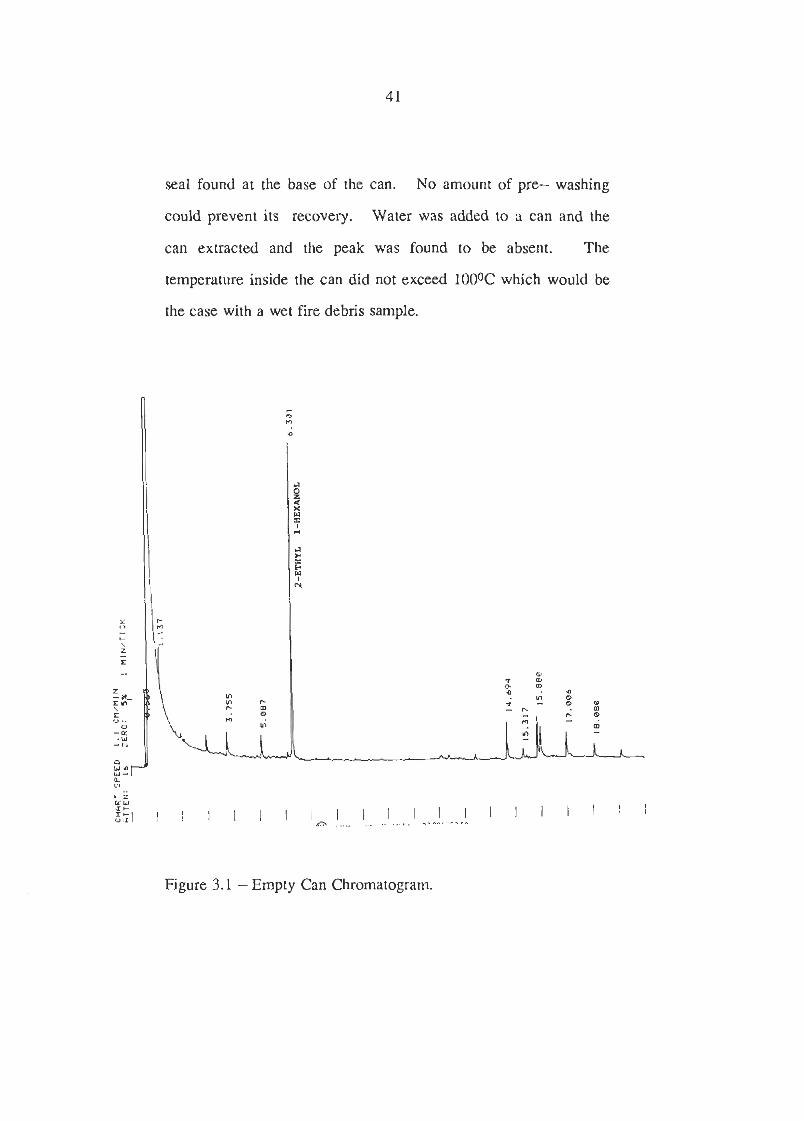
The analysis of the lined cans was found to be reproductible and a
representative chromatogram obtained is shown in Figure 3.2.
below that of a petrol standard. The compounds extracted from
the can were confirmed by mass spectrometry as aromatic
hydrocarbons which are found in many industrial solvents one of
which may have been used in the formulation of the epoxy
coating. The drying of the epoxy would trap the solvent which is
then released at the extraction temperature. Lined cans should
therefore never be used for sampling fire debris material because a
false positive result indicating an industrial solvent or petrol being
present in the fire debris could result.
Figure 3.2 - Lined Can vrs Petrol Chromatograms.
3.2.1 lii) Cleaning of Cans.
Cans should be inspected before use and if no odours or stains are
present then the can should be cleaned and sealed before transport
to the fire scene. Cans were cleaned by washing in warm, dilute
detergent, rinsed and then dried in an oven for 1 hour at 1500C.
then cooled and sealed.
Two unlined cans were purposely contaminated with lml of petrol
and then cleaned in the above manner, extracted and the extracts
analysed. No traces of petrol were detected indicating the
cleaning process to be satisfactory in a worse case situation. A
can that was observed to be contaminated would be discarded by
the investigator and the cleaning procedure is not intended to
allow the recycling of previously used cans.
Eight new cans were cleaned using household washing detergent,
rinsed and dried in both domestic gas and electric ovens. The
cans were extracted and analysed and no extra peaks were found
in the chromatograms. As investigator who does not have access
to a laboratory oven could therefore prepare his cans in his home,
provided the oven is reasonably clean.
3.2.2 CONTAMTNATION DURING TRANSPORT AND
STORAGE.
Problems of leakage and breakage can occur with samples
supplied in plastic bags or glass containers and both these should
not be used for sampling. Extremely wet samples have been
found to cause pinholes in metal cans through rusting so samples
in tins should be delivered promptly to the laboratory. Plastic
bags are sometimes used inside the can to prevent rusting but
these are easily pierced by fire debris.
Two cans containing polyethylene bags were extracted and the
extracts analysed. The chromatogram obtained is shown in
Figure 3.3. The peaks were identified as aliphatic hydrocarbons
by specific ion monitoring and these compounds would distort a
chromatogram obtained from a fire debris sample that contained
diesel or kerosene. Therefore, a fire debris sample supplied in a
tin with a plastic liner would have to be transferred back into the
tin from the plastic bag thereby increasing the possibility of loss of
accelerant, contamination or sample mix-up. Plastic bags offer
no real advantage when used inside a metal can if the sample is
delivered to the laboratory promptly.
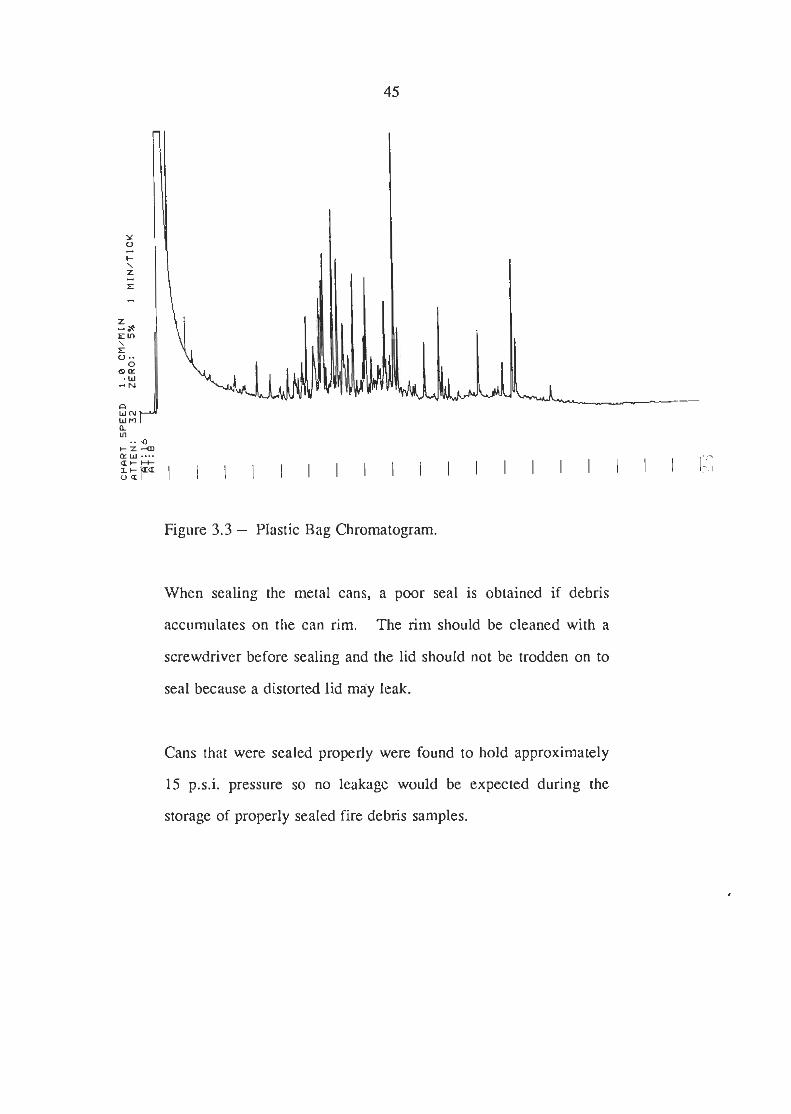
Figure 3.3 - Plastic Bag Chromatogram.
When sealing the metal cans, a poor seal is obtained if debris
accumulates on the can rim. The rim should be cleaned with a
screwdriver before sealing and the lid should not be trodden on to
seal because a distorted lid may leak
Cans that were sealed properly were found to hold approximately
15 p.s.i. pressure so no leakage would be expected during the
storage of properly sealed fire debris samples.
46
3.2.3 CONTAMINATION DURING ANALYSIS.
When a sample has been received in the laboratory it should be
inspected externally for possible leaks, and then opened to observe
the type of debris, and smelt to estimate possible accelerant
loadings. A sample that is heavily loaded with accelerant could
be analysed by a simpler and less time consuming static headspace
technique such as absorption onto Tenax, or extracted after other
samples to prevent the contamination of the gas transfer lines.
A blank analysis should be performed before extraction to detect
any contamination of the equipment. An empty can placed in the
oven and extracted will reveal any contamination of the nitrogen,
gas transfer lines, water trap, charcoal, carbon disulphide and the
syringe. Pipettes and sample vials should be expected to be clean
if they are of suitable laboratory grade and do not represent a
problem of contamination unless an attempt is made to reuse
them.
The gas transfer lines, water trap and syringe can be contaminated
from a previous sample and must be cleaned before use. The gas
transfer lines and water trap were previously cleaned by extracting
a clean metal can containing water which effectively steam
cleaned the lines but this was found to be inadequate after samples
of high accelerant loadings were extracted. An investigation was
made to reduce the possibility of contamination during the
analysis. The two areas which were investigated were the water
trap and the gas transfer lines.
3.2.3 (i) Investigation of the Water Tra~,
The water trap on the gas transfer line from the oven to the
charcoal pipette is intended to prevent water vapour from
condensing on the charcoal which reduces the surface area
available for absorption. Even when using a chilled trap, water
vapour is condensed in the charcoal pipette. Charcoal is used to
absorb organics from water so it was felt the elimination of the
water trap would not affect the recovery of accelerant.
31.11 of petrol was added to two equivalent pieces of carpet and
lOOrnls of water added to each immediately to seal the petrol.
The samples were extracted, one with a chilled water trap and one
without a water trap at all.
The extracts were analysed and the recovery was equivalent in
both cases. The extractions were repeated using kerosene and
likewise the recovery was equivalent in both cases. The large
amount of water vapour condensing and passing through the
charcoal did not affect the recovery of aliphatic and aromatic
hydrocarbons and so the water trap was not used in any further
work.
No problems during the extraction of routine samples have been
encountered since the elimination of the water trap.
3.2.3 (il Gas Transfer Line Material.
Contamination of the gas transfer line occurs after samples with
high accelerant loadings are extracted because of condensation of
the accelerant vapours on the transfer line. Heating the lines and
lagging them would be expensive and result in hot steam
emanating from the water in the sample contacting the charcoal
which would make it difficult changing the hot pipette. An
investigation was made to determine the best available material to
use for the gas transfer line.
Copper, aluminium and teflon were used as the gas transfer line
for the extraction under identical conditions of 0.5mls of petrol
added to three empty cans. The samples were removed and
empty cans were extracted and the extracts analysed. The
chromatograms revealed that the aluminium line remained the
most heavily contaminated whilst the copper and teflon lines were
contaminated to the same degree but much less than the
aluminium. The transparent teflon line allowed the contamination
to be observed as small droplets of petrol concentrated at the
bends in the lines. The procedure was repeated with diesel and
the same results obtained but the contamination was much heavier
because of the lower volatility of diesel.
Aluminium was chosen as the best inlet gas transfer line because it
was more easily manouvered in the oven and contamination was
not a problem before the nitrogen gas reached the sample can.
Copper was chosen as the outlet transfer line because the teflon
was found to become brittle after some time and also copper was
not as readily contaminated as the aluminium.
3.2.3 nii) Cleanine of the Gas Transfer Line,
Steam cleaning of the gas transfer lines required a 1 hour
extraction of a can containing water and was found to be
inadequate especially when samples with high loadings of
accelerant were previously exwacted. Steam cleaning of the lines
for a further six hours was found to still be inadequate when
samples with diesel present were previously extracted. The long
cleaning times significantly reduced sample turnover and a quicker
cleaning method was needed.
0.51111s of petrol and diesel were extracted from wet carpet and
afterwards the lines were washed with approximately 10 mls of
acetone using a plastic wash bottle manually connected to the
copper transfer line inlet in the oven. The acetone was collected
in a residue bottle and the lines were blown dry with nitrogen for
ten minutes. A blank sample was then analysed and the
contamination from the petrol was found to be eliminated. The
contamination from the line of which diesel was extracted was still
present as the acetone did not solubilise the heavier components of
diesel and continual washing with acetone was not successful. A
bunsen burner was then used to heat the entire length of the
copper line to red heat beginning at the inlet and a subsequent
blank analysis revealed the contamination was eliminated.
Several precautions must be made when cleaning the lines using a
bunsen flame because of the fire risks involved. Safety glasses
and disposable gloves must be worn when washing with acetone.
All traces of acetone must be blown dry from the line and the
residue bottle and wash bottle removed away from the area before
the burner is lit. The outlet of the transfer line must be vented to
a fume cupboard when burning so vapours eminating from the line
are drawn away rapidly to prevent ignition. A pressure gauge
should be connected to the system and observed in case a
blockage in the system causes dangerously high pressures.
Acetone was used because it solubilised both water and
hydrocarbons in the transfer line, but other readily available and
inexpensive solvents such as alcohol could be used. A solvent
which does not solubilise the water such as hexane could not clean
the water soluble contaminantes that may be present after the
extraction of some fire debris samples.
3.2.3 (iv) Svrinrre Cleaning Procedures,
After injecting into the G.L.C. the carbon disulphide extract, the
syringe is washed with acetone several times and then inserted
into a heated vacuum syringe cleaner for several minutes. The
cleaning unit heats the syringe needle whilst drawing air through it
and no problems with contamination of the syringe have been
encountered using this technique.
When a sample is extracted in the oven, the more volatile
components from the accelerant will leave the can first and
become absorbed leading to possible analytical discrimination of
the accelerant.
All of the accelerant's components will not be extracted in the
same ratios as that of the pure accelerant and the extraction time
should be as long as possible to recover the heavier components.
Petrol, kerosene, diesel and mineral turps were added to carpet
samples in four separate cans (lml of each) and extracted at
150oC. The charcoal pipette was changed at 15, 30, 60 and 90
minutes and the carbon disulphide extracts analysed.
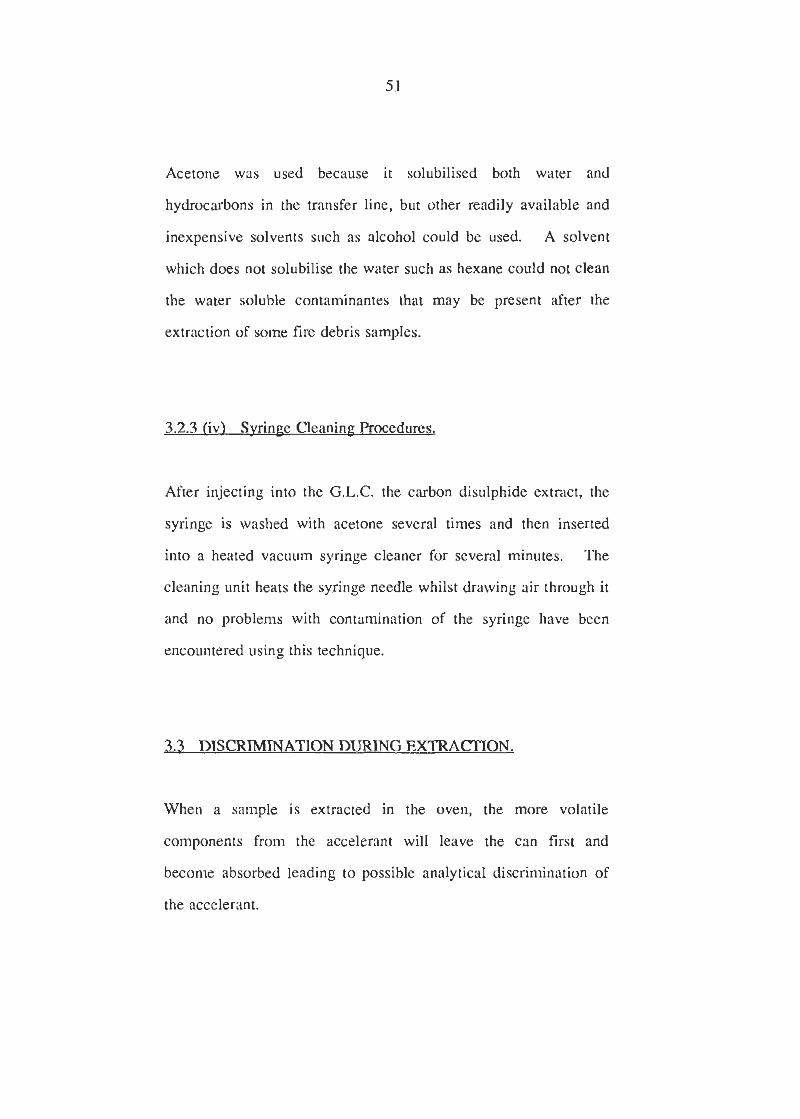
The analysis showed that all four accelerants gave the same trends
in that the lower boiling point components were the fust to be
extracted. The four chromatograms obtained from the diesel
sample are shown in Figure 3.4 with a diesel standard. The
extraction time in the oven should be as long as possible to
prevent discrimination especially if diesel is a suspected
accelerant. Discrimination was not as much a problem with
petrol because it is much more volatile than diesel, but if heavily
evaporated petrol is suspected, as would be the case if the sample
was very dry, then the extraction time should be slightly longer
than normal. The analyst should be aware that the extraction
time of one hour should be increased in the following cases:-
(1) Samples are very wet
(2) Samples are very dry
(3) Samples are char
(4) Diesel is suspected

Dry and char samples need to be extracted for a longer period of
time in the oven because the amount of accelerant present would
be expected to be low. Very wet samples need a longer time in
the oven because the water needs to be vaporised to release the
accelerants.
Figure 3.4 - Diesel Extracted and Sampled at 15, 30, 60 and 90
minutes vrs Diesel Chromatograms.

55
3.4 THERMAL DESORFTION USING TENAX:
Extraction of a sample using static headspace sampling is very
rapid and easily repeated. However, the headspace sample cannot
be injected directly into a Capillary G.L.C. so it must be absorbed
onto an absorbent which is packed into a tube that is suitable to be
thermally desorbed in the injection port of the G.L.C. The tubes
are placed directly into the heated injection port and sealed and
the camer gas passes directly through the heated tube and sweeps
the desorbed compounds directly onto the column.
3,4(il Analvsis of Petrol
1pL of pea01 was added to some wet carpet in a can and 5 mLs
of headspace was taken at room temperature and adsorbed onto
Tenax, housed in an S.G.E. Unijector tube. The tube was
desorbed at 2800C with 10 p.s.i. of hydrogen in the injection port
of the G.L.C. The carpet sample was then extracted using normal
dynamic headspace extraction onto charcoal and desorbed with
Carbon Disulphide and analysed using the same G.L.C. operating
parameters as used for the thermal desorption. The
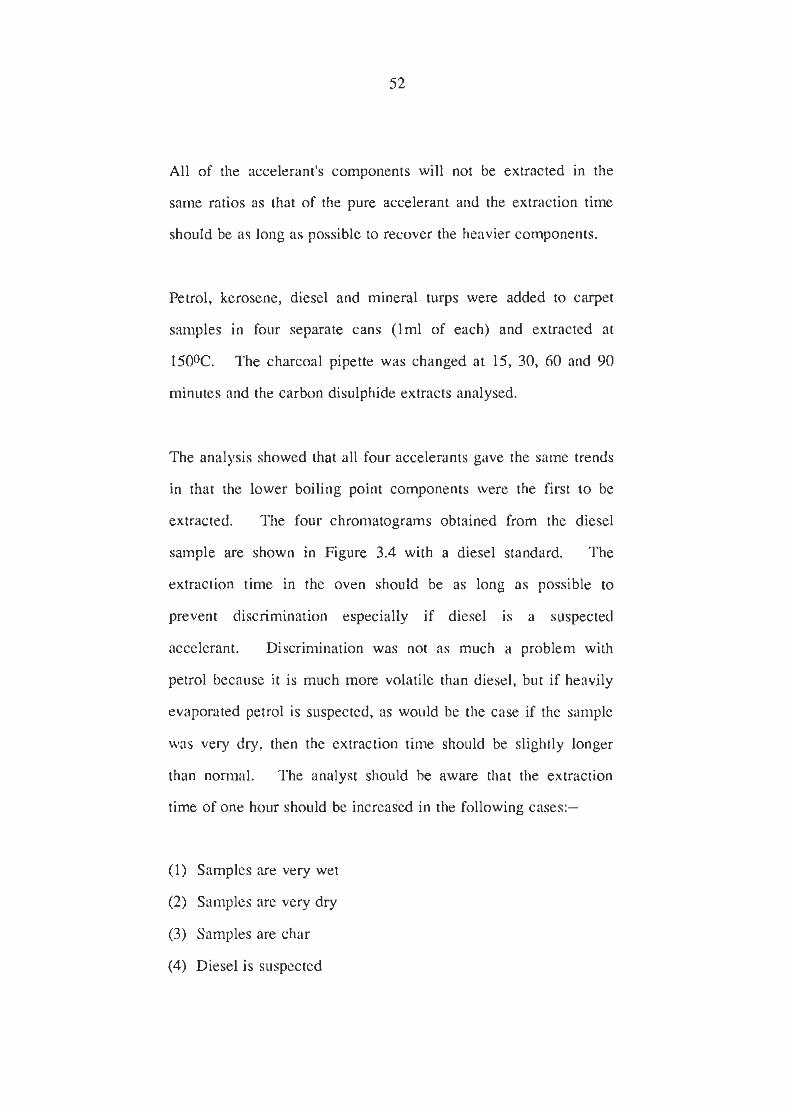
chromatograms produced are shown in Figure 3.5 and show the
sensitivities of the two techniques being approximately equal.
The recovery of both techniques can be increased by taking larger
headspace samples.
CHART SPEED IITTEN: 86
1.s Crnll l l" ZERO: 5% I MINXTICK
Figure 3.5 -Thermal and Solvent Desorption of Petrol Headspace.
Thermal Desorption does not give a solvent peak to obscure the
volatile component of petrol. However these more volatile
components will normally be absent in a f i sample. Thermal
Desorption also does not give an extract that can be stored for
later analysis or by mass spectroscopy and the reproducibility of
the retention time is not as good as for liquid injections.
3.4(ii) Analvsis of Ethanol
1pL of ethanol was added to a piece of wet carpet and a 5 mL
static headspace sample was absorbed onto Tenax. The Tenax
was thermally desorbed but no ethanol was detected. 8pL of
ethanol
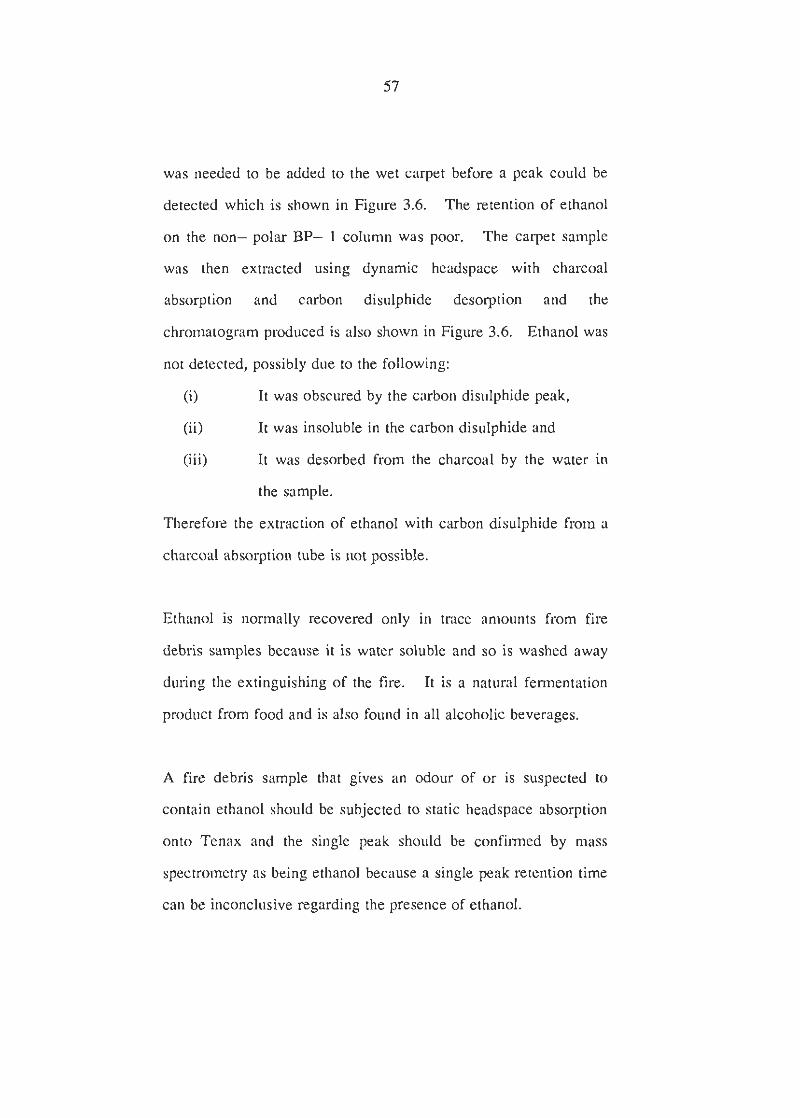
was needed to be added to the wet carpet before a peak could be
detected which is shown in Figure 3.6. The retention of ethanol
on the non- polar BP- 1 column was poor. The carpet sample
was then extracted using dynamic headspace with charcoal
absorption and carbon disulphide desorption and the
chromatogram produced is also shown in Figure 3.6. Ethanol was
not detected, possibly due to the following:
(i) It was obscured by the carbon disulphide peak,
(ii) It was insoluble in the carbon disulphide and
(iii) It was desorbed from the charcoal by the water in
the sample.
Therefore the extraction of ethanol with carbon disulphide from a
charcoal absorption tube is not possible.
Ethanol is normally recovered only in trace amounts from fire
debris samples because it is water soluble and so is washed away
during the extinguishing of the fire. It is a natural fermentation
product from food and is also found in all alcoholic beverages.
A fire debris sample that gives an odour of or is suspected to
contain ethanol should be subjected to static headspace absorption
onto Tenax and the single peak should be confirmed by mass
spectromehy as being ethanol because a single peak retention time
can be inconclusive regarding the presence of ethanol.
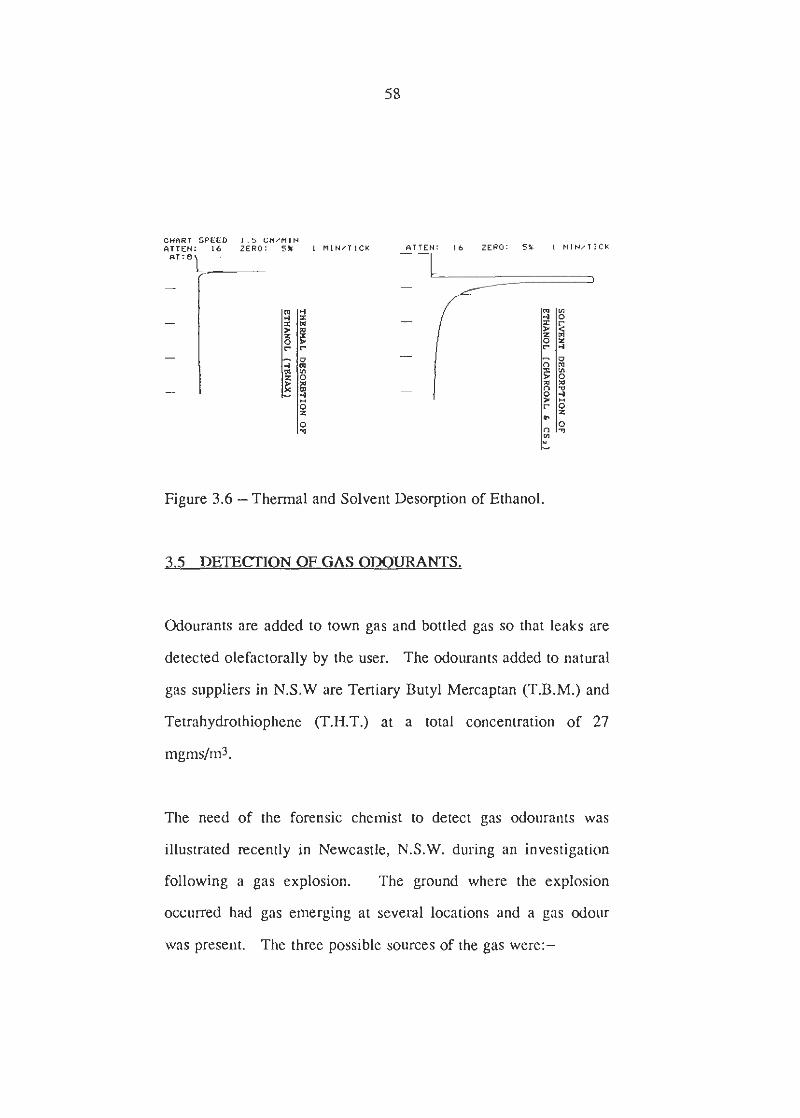
CHaRT SPEED 1.5 C I l l R l M r?TTEN: 16 ZERO: 5% 1 MINITICK -Rrrs\ -
ATTEN: 16 ZEPO: 5% 1 M l N l T l C K
- -1
Figure 3.6 -Thermal and Solvent Desorption of Ethanol.
2 5 DETECTION OF GAS ODOURANTS.
Odourants are added to town gas and bottled gas so that leaks are
detected olefactorally by the user. The odourants added to natural
gas suppliers in N.S.W are Tertiary Butyl Mercaptan (T.B.M.) and
Tetrahydrothiophene (TILT.) at a total concentration of 27
mgmsIm3.
The need of the forensic chemist to detect gas odourants was
illustrated recently in Newcastle, N.S.W. during an investigation
following a gas explosion. The ground where the explosion
occurred had gas emerging at several locations and a gas odour
was present. The three possible sources of the gas were:-
- leaking town gas
- natural gas that may have been released from the
local coal seams
- sewerage gas from a redundant sewerage works
nearby
All three sources were possible because the underground area
contained old mine and ventilation shafts, tunnels used for military
purposes during WWII and sewerage pipes. The d o u r detected
could have been town gas odourants or hydrogen sulphide. The
detection of T.B.M. or T.H.T. would identify town gas as the
source and gas samples were taken for laboratory analysis. No
T.B.M. or T.H.T. was detected in the samples.
The analytical results were questioned because of the possibility
that the odourants had adsorbed onto the glass wall of the sample
container. Also the normal method of analysing odourants in gas
by packed column G.L.C. with a sulphur specific detector may not
have been sensitive enough because the air samples were diluted
to 5% methane and normal gas samples are analysed at 95%
methane. A method of concentrating the odourants on site by
using a suitable absorbent with an air sampling pump would
increase the recovery of odourants. The fixing of the odourants
onto an absorbent would also mean less equipment to be
transported to the site. An investigation was made to develop a
suitable qualitative analytical method which uses equipment
readily available at a fire investigation laboratory.
3.5.1 INVESTIGATION OF A SUITABLE ABSORBENT FOR
THE ANALYSIS OF GAS,
Headspace absorption tubes packed with Tenax were tested for
absorbing gas samples but were found to require at least 8 p.s.i
pressure to push the air sample through the tube because of the
low permeability of the packing. No portable air pump could be
found to pump to 8 p.s.i. so thermal desorption tubes could not be
used.
Charcoal packed in glass tubes was found to be reasonable
permeable and therefore suitable for use with a portable air pump
for sampling the gas. The charcoal was desorbed with carbon
disulphide and the extract analysed by Capillary G.L.C. with an
F.I.D. detector. The chromatogram obtained is shown in Figure
3.7 and is complex due to the absorption of hydrocarbons together
with the odourants. The sample was reanalysed using an Ion
Trap Detector and both aliphatic and aromatic hydrocarbons were
identified by specific ion monitoring. A library search was made
of the other peaks and a T.H.T. peak was identified and is marked
on Figure 3.7. T.B.M. could not be identified and may have been

obscured by the carbon disulphide peak. The method was used
for sampling air near a gas leak and the chromatographic
fingerprint obtained was used to positively identify the gas. The
sampling time and flow rate of the portable pump was
approximately 1 hour and 500mls/minute.
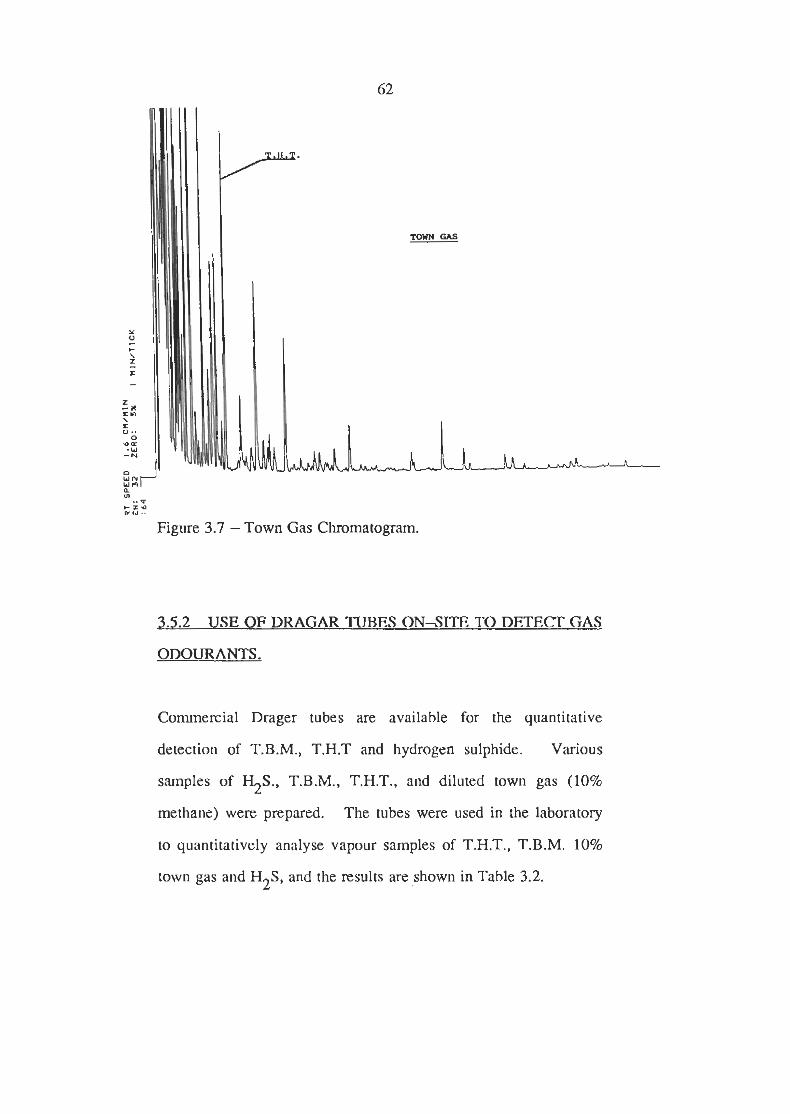
L LA-
Figure 3.7 - Town Gas Chromatogram.
3.5.2 USE OF DRAGAR TUBES ONSITE TO DETECT GAS
ODOURANTS.
Commercial Drager tubes are available for the quantitative
detection of T.B.M., T.H.T and hydrogen sulphide. Various
samples of H.S., T.B.M., T.H.T., and diluted town gas (10%
methane) were prepared. The tubes were used in the laboratory
to quantitatively analyse vapour samples of T.H.T., T.B.M. 10%
town gas and H2S, and the results are shown in Table 3.2.
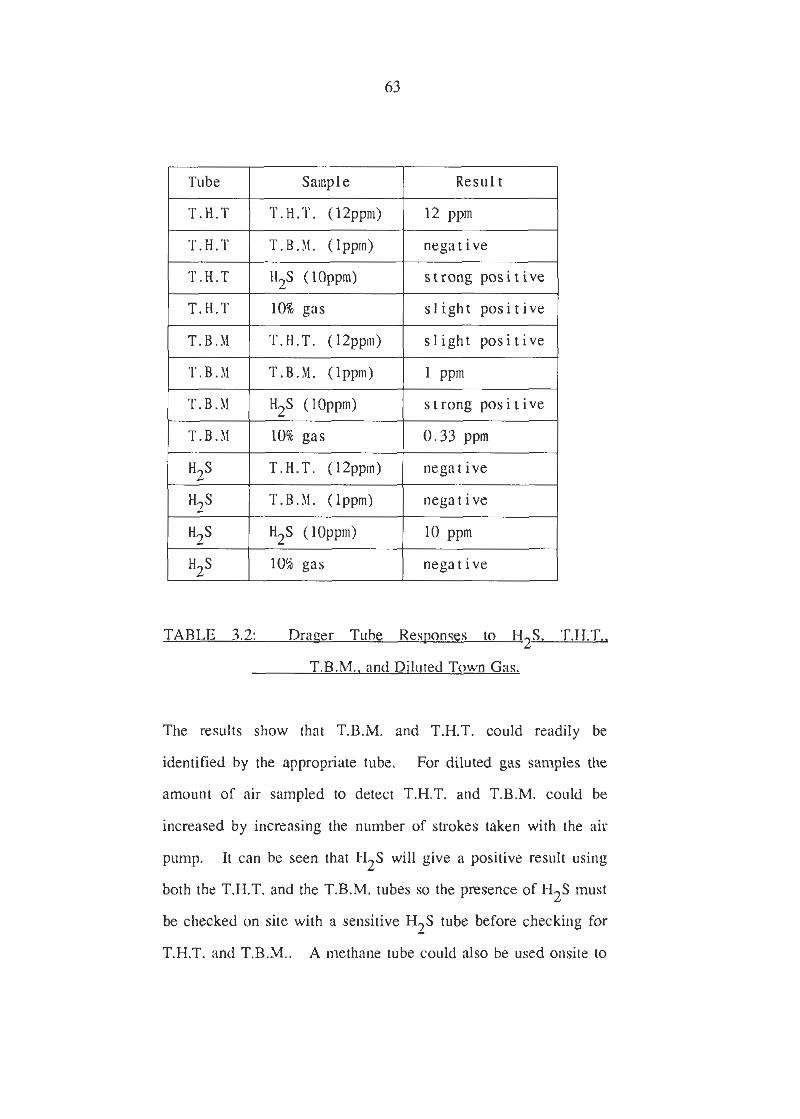
I T.H.T I T.B.M. (lppm) I negative I
Tube
T.H.T
I T.H.T I 10% gas I s l ight posi t ive I
Sample
T.H.T. (llppm)
T.H.T I H ~ S (10ppm)
Result
12 PPm
strong posi t ive
1 T.B.M 1 10% gas 1 0.33ppm I
s l igh t posi t ive
1 PPm
7 -
T.B.M
T.B.M
T.B.M
-
T.H.T. (12ppm)
T.B.M. (Ippm)
strong posi t ive
10% gas negative I
-
H2S
H2S
TABLE 3.2: Draner Tube Resaonses to H2S. T.H.T..
T.B.M.. and Diluted Town Gas,
The results show that T.B.M. and T.H.T. could readily be
--
T.H.T. (12ppm)
T.B.M. (lppm)
identified by the appropriate tube. For diluted gas samples the
amount of air sampled to detect T.H.T. and T.B.M. could be
increased by increasing the number of swokes taken with the air
pump. It can be seen that H2S will give a positive result using
both the T.H.T. and the T.B.M. tubes so the presence of H2S must
be checked on site with a sensitive H2S tube before checking for
T.H.T. and T.B.M.. A methane tube could also be used onsite to
nega t ive
negative

determine the approximate gas concenaation in the air so that the
appropriate amount of air sampled for the quantitative analysis of
T.H.T. and T.B.M. could be estimated.
The Drager tube results if positive for gas odourants can be
verified by absorbing the gas samples onto charcoal and analysing
the samples as outlined previously in section 3.5.1.
3.6 INTERPRETATION OF RESULTS;
The interpretation of the chromatogram is made to determine
whether an accelerant was present in the sample and then to
identify it. A library file of chromatograms obtained from the
analysis of various accelerants is used to select and identify the
accelerant and a standard accelerant sample is then analysed under
identical chromatographic conditions to those used for the
samples' analysis. The chromatograms are then compared and the
retention time data of the peaks are used to c o n f m the presence
of the accelerant' components which collectively identifies the
accelerant.
The interpretation must be made by an experienced analyst with
the aid of a comprehensive library that should include
chromatograms from the following:-
- the common accelerants
- the industrial solvents
- burnt synthetic materials
- common household products and materials
The analyst should also be aware of the sensitivity of the
extraction and analytical techniques he uses when interpreting
chromatograms. Background levels of accelerant components in
various materials could present a problem when using extremely
sensitive techniques and levels should be established by the
analyst. Various materials and accelerants were analysed and the
chromatograms obtained are presented to assist interpretation. As
well as using F.I.D. detection, an I.T.D. detector was also used
with specific ion monitoring.
Liquid samples were added to carbon disulphide (approximately
5pL to 1 rnL of CS2) and solid samples were burnt and extracted
using dynamic headspace and desorbed with carbon disulphide.
26.1 BACKGROUND LEVELS OF ACCn.ERANTS.
The detection of O.1pL of petrol in fire debris is readily possible
when using dynamic headspace absorption with Capillary G.L.C.,
and less if more headspace is sampled or the extract concentrated.
The question posed when these extremely small quantities of
accelerants are found is what normal background levels of petrol
and other possible accelerants on various materials is to be
expected.
Car flooring materials were used to investigate normal background
levels because of their continual exposure to an environment
where petrol is stored. Twenty samples of car flooring materials
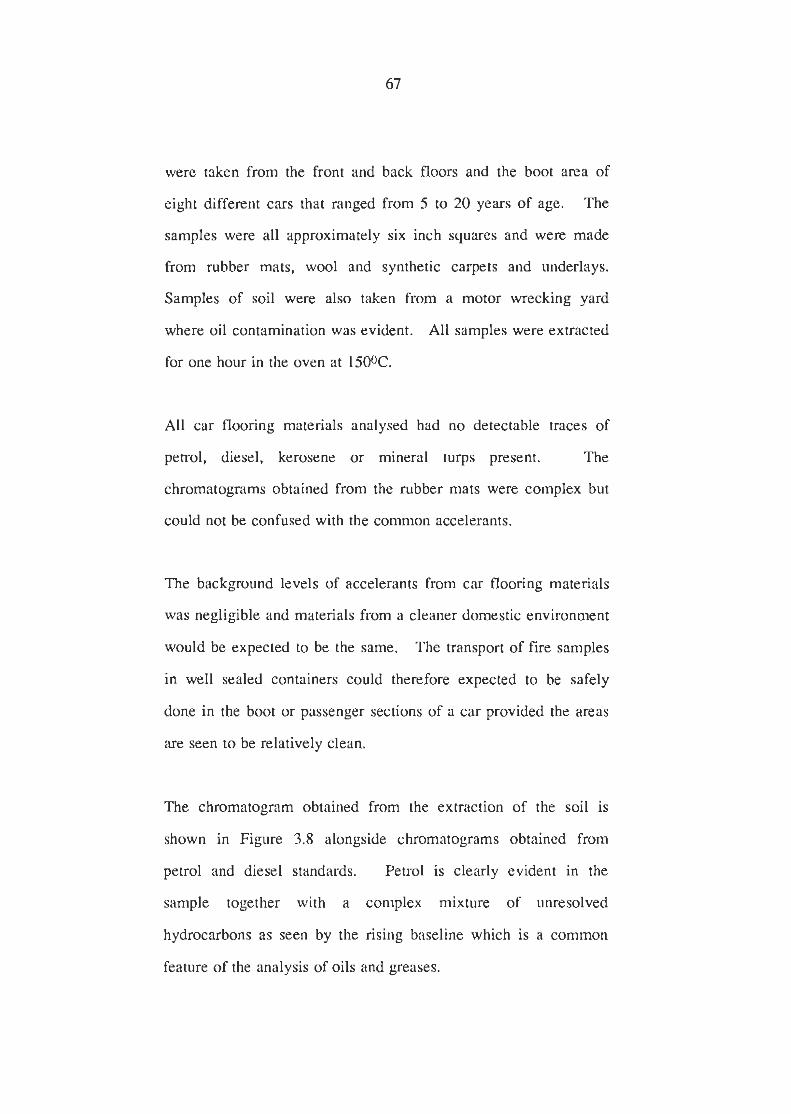
were taken from the front and back floors and the boot area of
eight different cars that ranged from 5 to 20 years of age. The
samples were all approximately six inch squares and were made
from rubber mats, wool and synthetic carpets and underlays.
Samples of soil were also taken from a motor wrecking yard
where oil contamination was evident. All samples were extracted
for one hour in the oven at 1500C.
All car flooring materials analysed had no detectable traces of
petrol, diesel, kerosene or mineral turps present. The
chromatograms obtained from the ~ b b e r mats were complex but
could not be confused with the common accelerants.
The background levels of accelerants from car flooring materials
was negligible and materials from a cleaner domestic environment
would be expected to be the same. The transport of fire samples
in well sealed containers could therefore expected to be safely
done in the boot or passenger sections of a car provided the areas
are seen to be relatively clean.
The chromatogram obtained from the extraction of the soil is
shown in Figure 3.8 alongside chromatograms obtained from
petrol and diesel standards. Petrol is clearly evident in the
sample together with a complex mixture of unresolved
hydrocarbons as seen by the rising baseline which is a common
feature of the analysis of oils and greases.
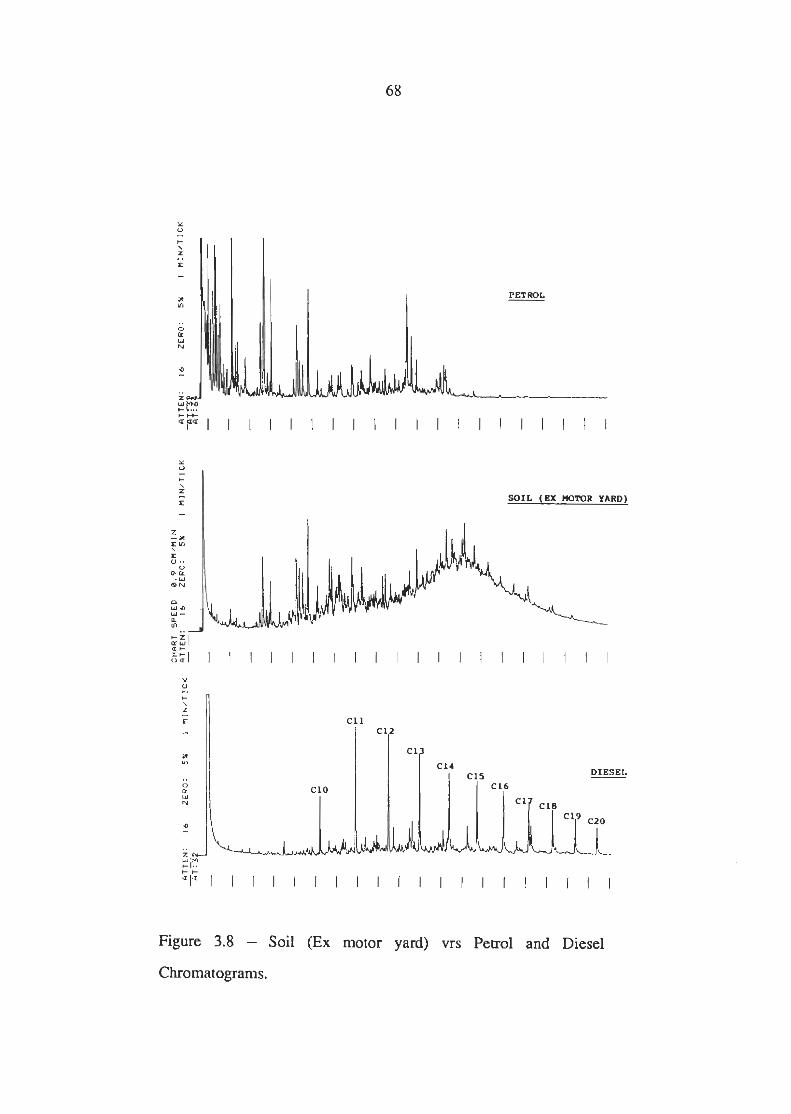
SOIL (EX K I X l R YARD)
Figure 3.8 - Soil (Ex motor yard) vrs Petrol and Diesel
Chromatograms.
The analysis of the soil shows that it is a good adsorbent medium
for hydrocarbons and they readily persist despite the effect of rain
and sun. Samples of soil or concrete taken from areas where cars
have been garaged or where oil or petrol may have been
previously stored may have traces of hydrocarbons present that
give analysis consistent with those from the common accelerants.
Samples of river sand from an environment where boat and ferry
traffic were heavy have also been found during routine analysis to
contain trace amounts of hydrocarbons believed to have originated
from oil or diesel. Soil samples taken from under houses have
been found to contain no traces of accelerants.
3.6.2 ANALYSTS OF THE COMMON ACCELERANTS,
The most common accelerants found in fire debris samples are:-
- Petrol
- Kerosene
- Mineral Turps
- Diesel
All are readily available to the fire setter and should be the fust
chromatograms checked when the interpretation of the samples'
chromatogram is made.
Petrol is produced from the reformation of crude oil where the
conversion of aliphatic to aromatic hydrocarbons is made. The
most basic aromatic hydrocarbon is benzene and the addition to
benzene of a methyl group produces toluene. Aliphatic groups
further added to the benzene ring produces the dimethylbenzenes
(xylenes) and other higher molecular weight aromatic compounds.
Figure 3.9 is a chromatogram from fresh petrol and shown above
is evaporated petrol. Most fire debris samples would be expected
to contain petrol evaporated to a certain degree because of the
high volatility of the lower molecular weight components of
petrol. The complexity of the chromatogram indicates petrol is
composed of a wide range of different compounds. Shown in
Figure 3.10 (a and b) are the simulated ion scans from an analysis
of petrol which indicates the general class of compound each peak
component is from. The ion scans shown and the class of
compounds they indicate are:
TOT Total Ion Scan
MA3 55,69 alicyclic and olefinic hydrocarbons
57,71 aliphatic hydrocarbons (evaporated and fresh
petrol shown)
91, 105 aromatic hydrocarbons
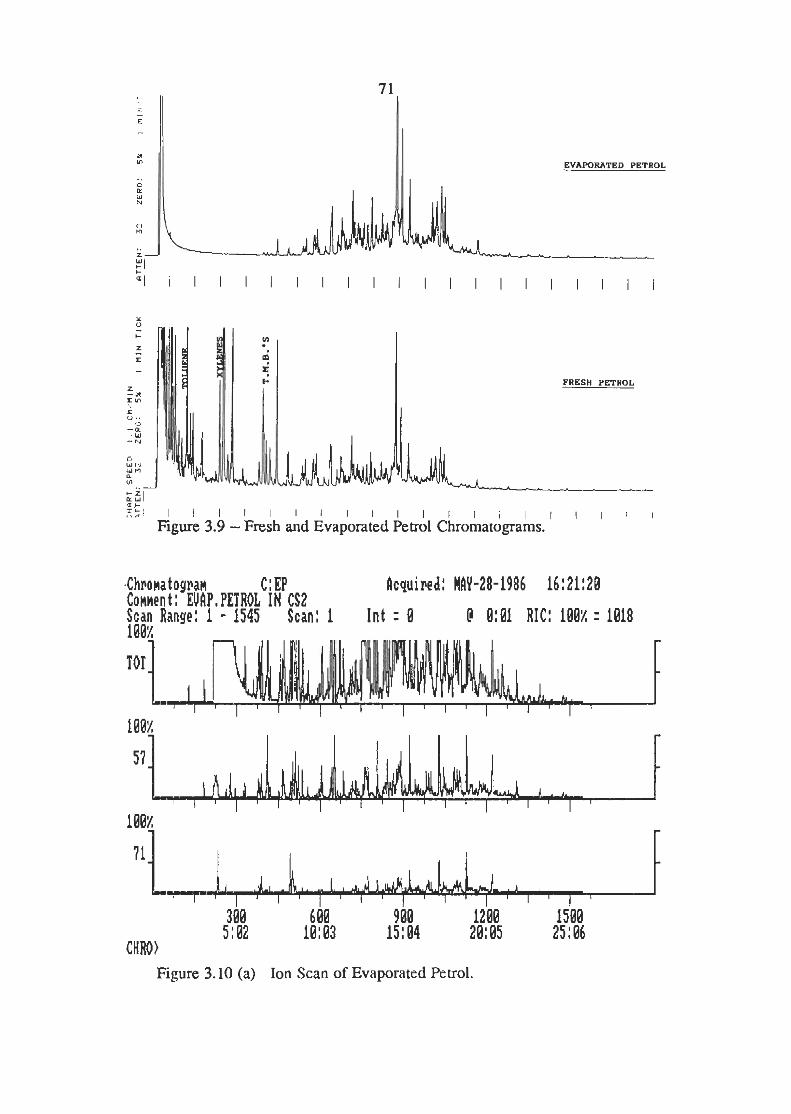
EVAPORATKD PETROL
x
FRESH PF5ROL
I :HI < + " I I I I I I I I I I I I I I I I I I I I
Rgure 3.9 -Fresh and Evaporated Petrol 6hmatograms.
.Ch~ona towan C: EP Ilcquired: HIlY-28-1986 16:21:20 Connent: EUIlP.PETROL IN CS2 Scan Range: 1 - 1545 Scan: 1 Int : 0 ! 0:01 RIC: l0Pd : 1018 188~
TOT
Figure 3.10 (a) Ion Scan of Evaporated Petrol.
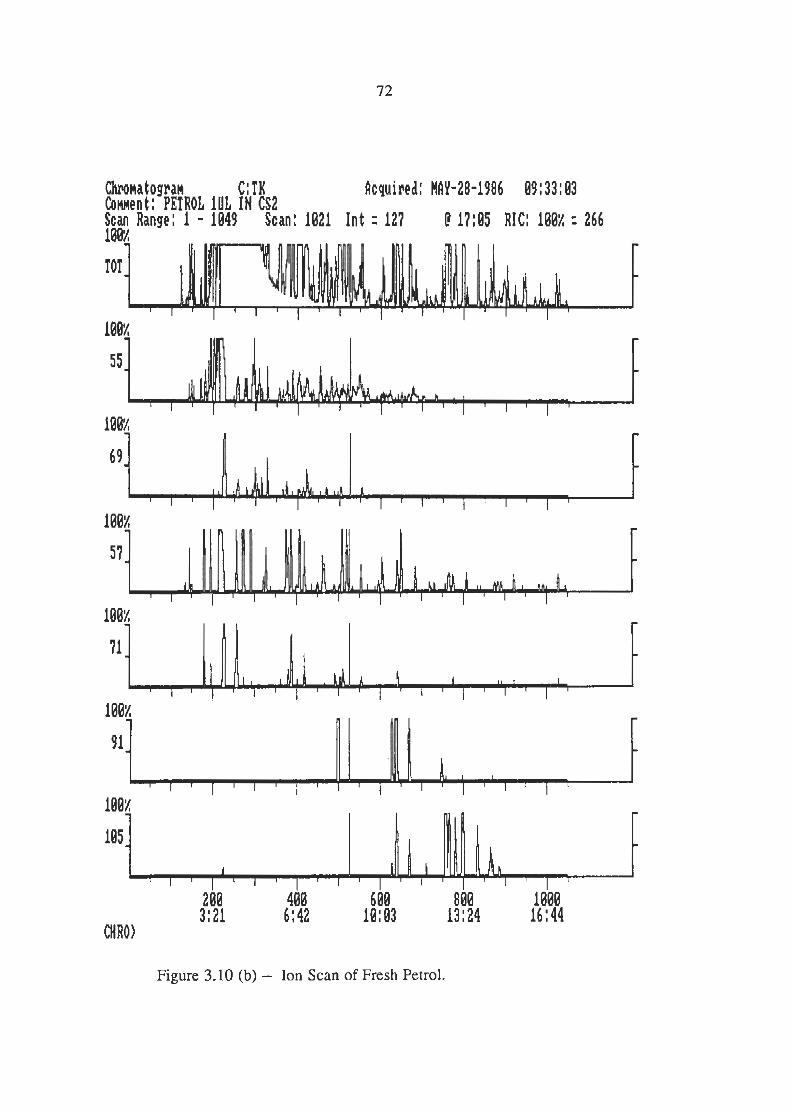
Chro~atoyra~ C: IK Acquired: 11-28-1986 09:33:03 C o ~ ~ e n t : PETROL IUL IN CS2 Scan R a m : 1 - 1049 Scan: 1021 I n t : 127 @ 17:.05 RIC: ll0X : 266
Figure 3.10 (b) - Ion Scan of Fresh Petrol.
Petrol can be seen to be composed of aliphatic and aromatic
hydrocarbons, the aliphatics composing the lighter fraction of
petrol and the heavier fraction of evaporated petrol.
An attempt was made to characterise two stroke petrol but the
chromatogram obtained was identical to that of normal petrol.
The oil added to normal petrol to produce two stroke mix is very
heavy and did not elute from the column. It therefore would not
be extracted from the sample in an oven at 1500C.
3.6.2 lii) Analysis of the Additives in Petrol.
The main additives in petrol are the organelead compounds tetra
ethyl and tetra methyl lead. They are added to improve the
octane rating of petrol, however, unleaded petrol is also available
which uses various other compounds as additives to improve their
octane ratings.
The lead additives are readily detected by an F.I.D. detector but
they normally appear in the chromatogram obscured by other
peaks and also are present only in trace amounts. An attempt was
made to detect the lead compounds with an I.T.D. detector.
A chromatogram using the I.T.D. was obtained from fresh petrol
(5pL in lml of CS2) is shown in Figure 3.11. Selective ion
monitoring was used to eliminate any signal obtained from the
aromatic compounds in petrol. The two peaks were positively
identified as tetra methyl and tetra ethyl lead respectively. 20 pL
of petrol was added to a can and then extracted and a
chromatogram was obtained using the same analytical conditions
as the petrol sample run previously. The chromatogram obtained
is shown in Figure 3.12 and the lead compounds were not
detected. The extraction was repeated but again the results were
the same. The lead compounds were not recovered from the can
having possibly decomposed at some stage during the extraction.
Therefore the confirmation of petrol by identification of the lead
additives in the carbon disulphide extract cannot be made
successfully using dynamic headspace extraction with carbon
disulphide elution. Solvent extraction would recover the lead
compounds from the debris and further concentration of the
solvent would be necessary before injection into the G.L.C. to
increase the sensitivity of the analysis.
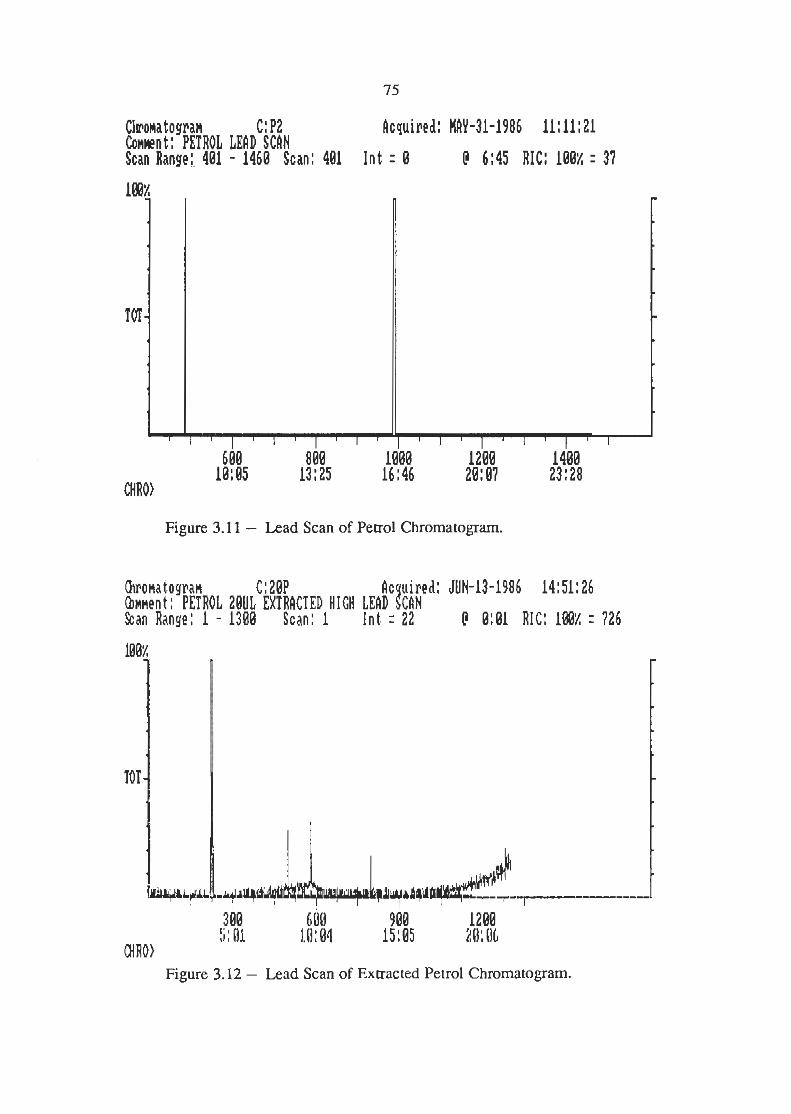
Chrowatogra~ C: P2 Acquired: NRY-31-1986 11: 11:21 Co~wnt: PETROL L B D SCBN Scan Range: 401 - 1460 Scan: 401 Int = 0 @ 6:45 RIC: 10Bt: : 37
Figure 3.11 - Lead Scan of Petrol Chromatogram.
Q r o ~ a t o g r a ~ C: 20P LC uired: JUN-13-1986 14:51:26 b n ~ e n t : PETROL 2 0 ~ ~ EXTRBCFED HIGH L E ~ D SCAN Scan Range: 1 - 1300 Scan: 1 lnt - 22 @ 0:0l RIC: 1BBx : 726
188;: -
TOT-
!!I
-
1 y h ] I 4 4 & - '
380 trUO 900 1200 :i : M. 1.0 : 04 15:u5 2n: oh
MRO) Figure 3.12 - Lead Scan of Extracted Petrol Chromatogram.
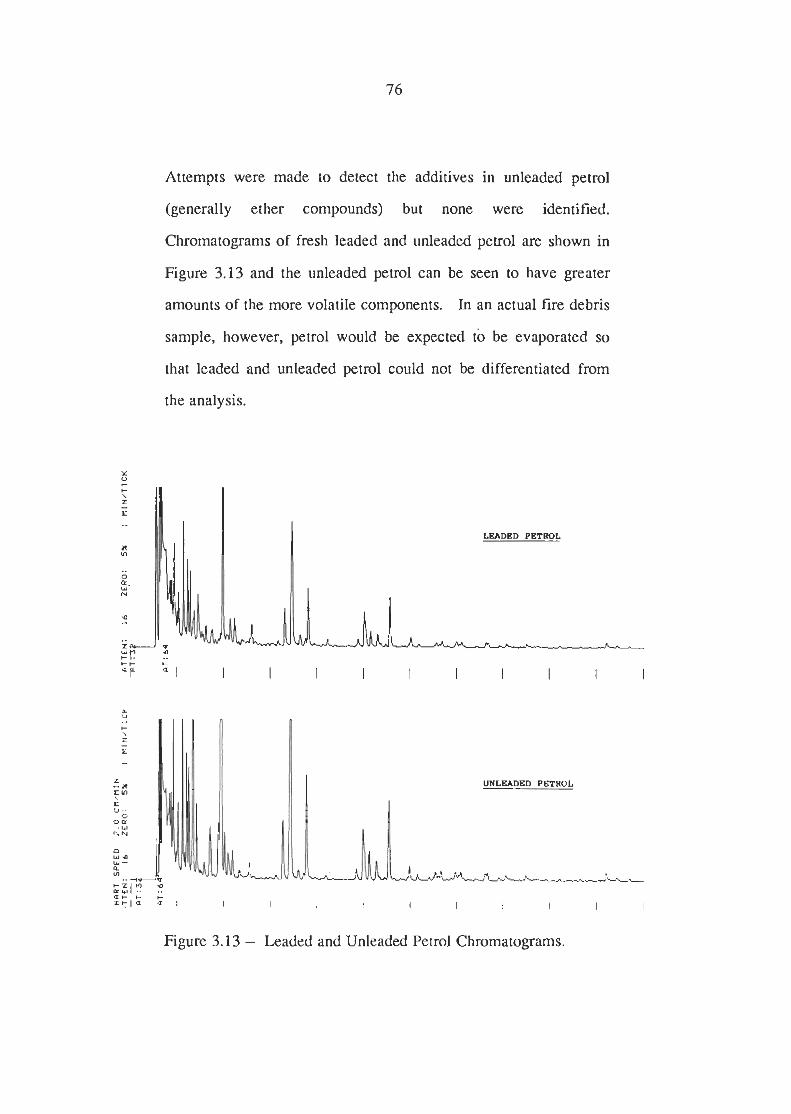
Attempts were made to detect the additives in unleaded petrol
(generally ether compounds) but none were identified.
Chromatograms of fresh leaded and unleaded petrol are shown in
Figure 3.13 and the unleaded peml can be seen to have greater
amounts of the more volatile components. In an actual fire debris
sample, however, petrol would be expected to be evaporated so
that leaded and unleaded petrol could not be differentiated from
the analysis.
LKADB) PETROL
Figure 3.13 - Leaded and Unleaded Petrol Chromatograms.
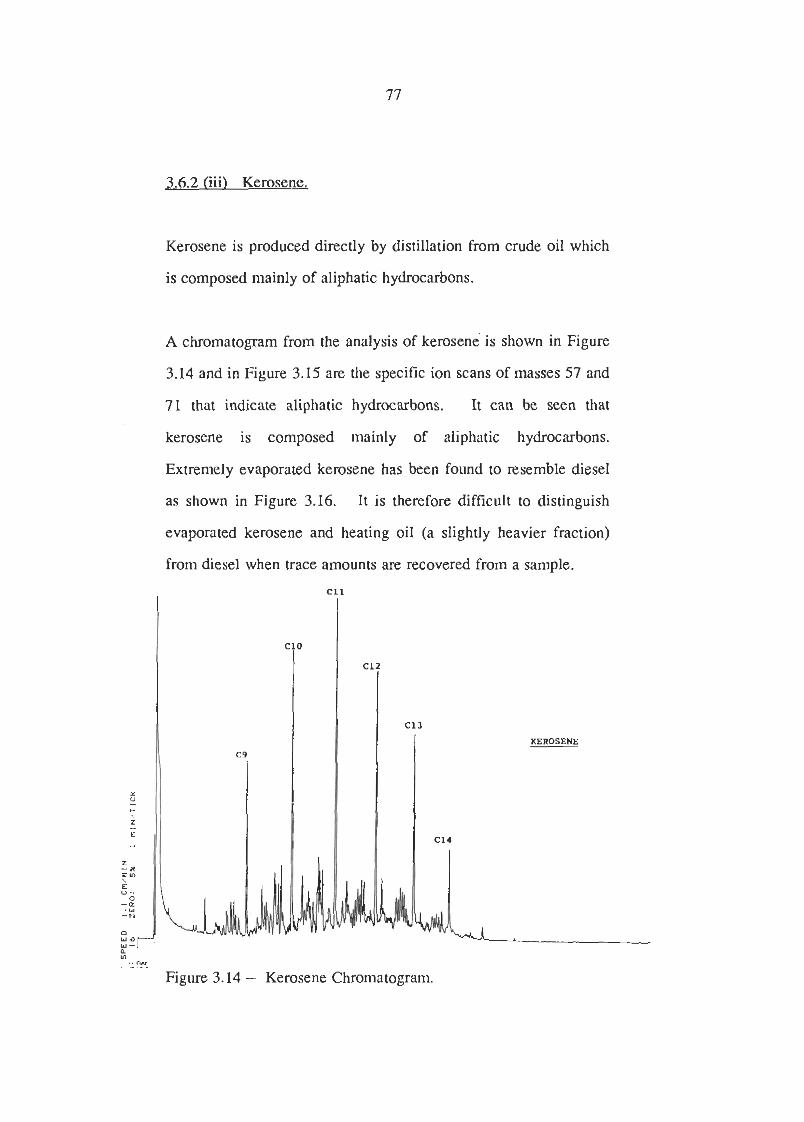
3.6.2 Cii) Kerosene.
Kerosene is produced directly by distillation from crude oil which
is composed mainly of aliphatic hydrocarbons.
A chromatogram from the analysis of kerosene is shown in Figure
3.14 and in Figure 3.15 are the specific ion scans of masses 57 and
71 that indicate aliphatic hydrocarbons. It can be seen that
kerosene is composed mainly of aliphatic hydrocarbons.
Extremely evaporated kerosene has been found to resemble diesel
as shown in Figure 3.16. It is therefore difficult to distinguish
evaporated kerosene and heating oil (a slightly heavier fraction)
from diesel when trace amounts am recovered from a sample.
Figure 3.14 - Kerosene Chromatogram.
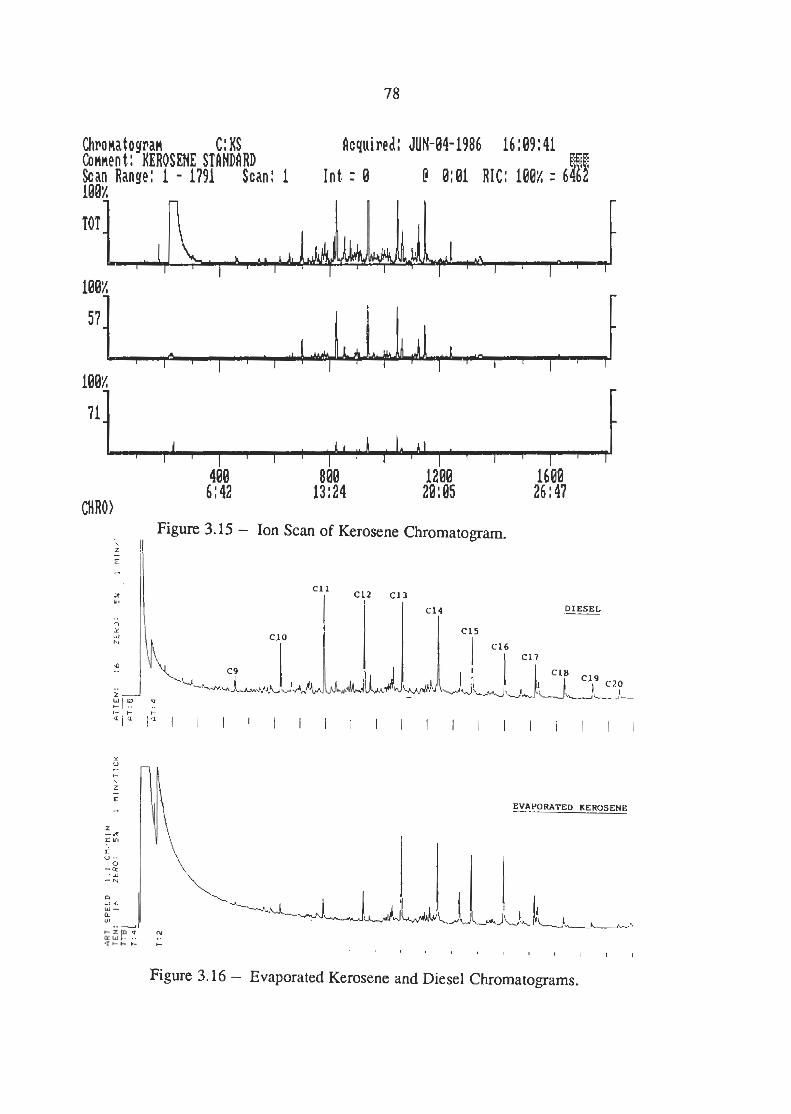
Chro~atogm~ C: KS Icquired: JUN-04-1986 16:09:41 Com~ent : KEROSENE STINDIRD Scan Range: 1 - 1791 Scan: i Int : B e e:ei RIG: ieex : 64 9 100
TOT
Rgure 3.15 - Ion Scan of Kerosene Chromatogram.
EVAPORATED KEROSENE
I . Figure 3.16 - Evaporated Kerosene and Diesel Chromatogmns.
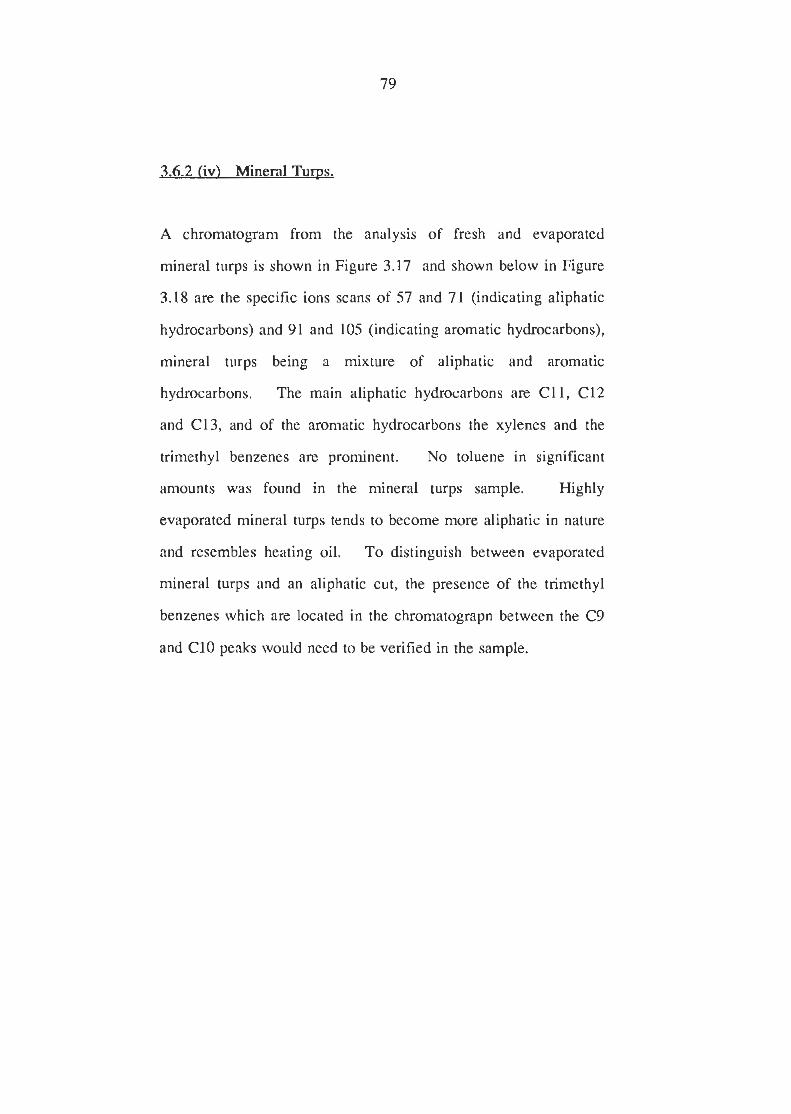
26.2 (ivl Mineral T q s .
A chromatogram from the analysis of fresh and evaporated
mineral turps is shown in Figure 3.17 and shown below in Figure
3.18 are the specific ions scans of 57 and 71 (indicating aliphatic
hydrocarbons) and 91 and 105 (indicating aromatic hydrocarbons),
mineral turps being a mixture of aliphatic and aromatic
hydrocarbons. The main aliphatic hydrocarbons are C11, C12
and C13, and of the aromatic hydrocarbons the xylenes and the
trimethyl benzenes are prominent. No toluene in significant
amounts was found in the mineral turps sample. Highly
evaporated mineral turps tends to become more aliphatic in nature
and resembles heating oil. To distinguish between evaporated
mineral turps and an aliphatic cut, the presence of the trimethyl
benzenes which are located in the chromatograpn between the C9
and C10 peaks would need to be verified in the sample.
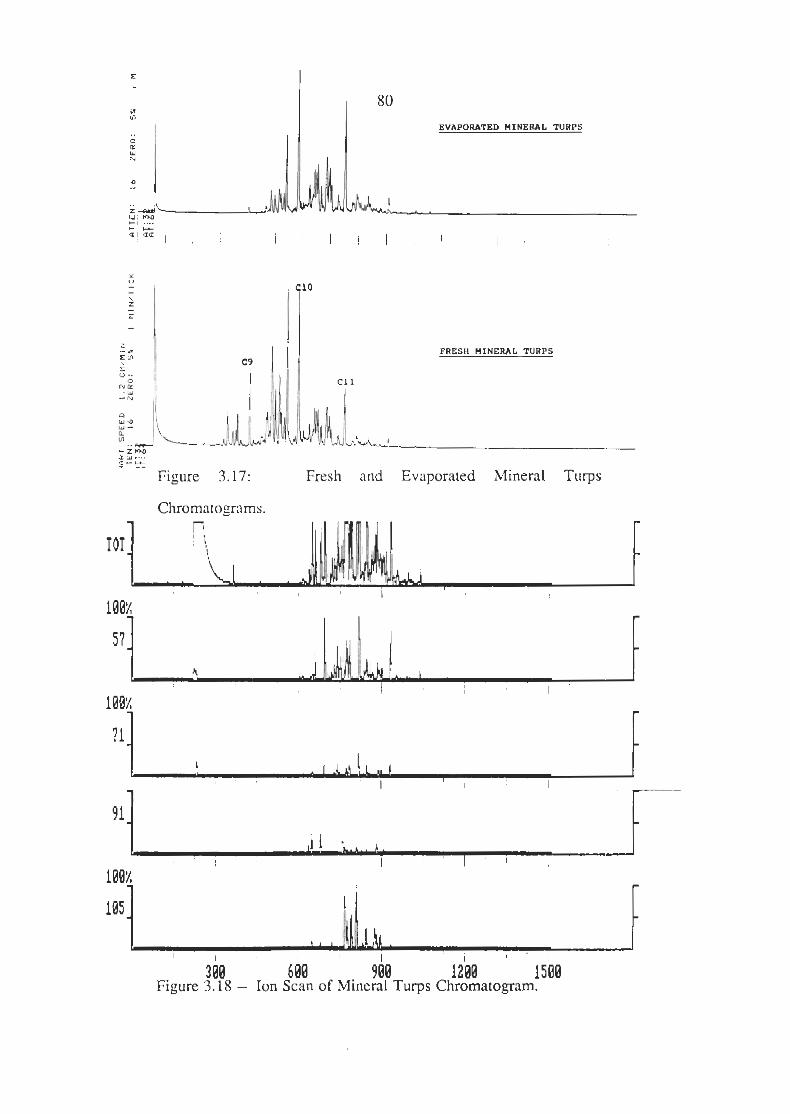
Chromatograms.
I FRESH NINBRAL TURPS
Fresh and Evaporated Mineral Turps
6a0 15'00 Figure 3.18 - Ion Scan of Mineral Turps Chromatogram.
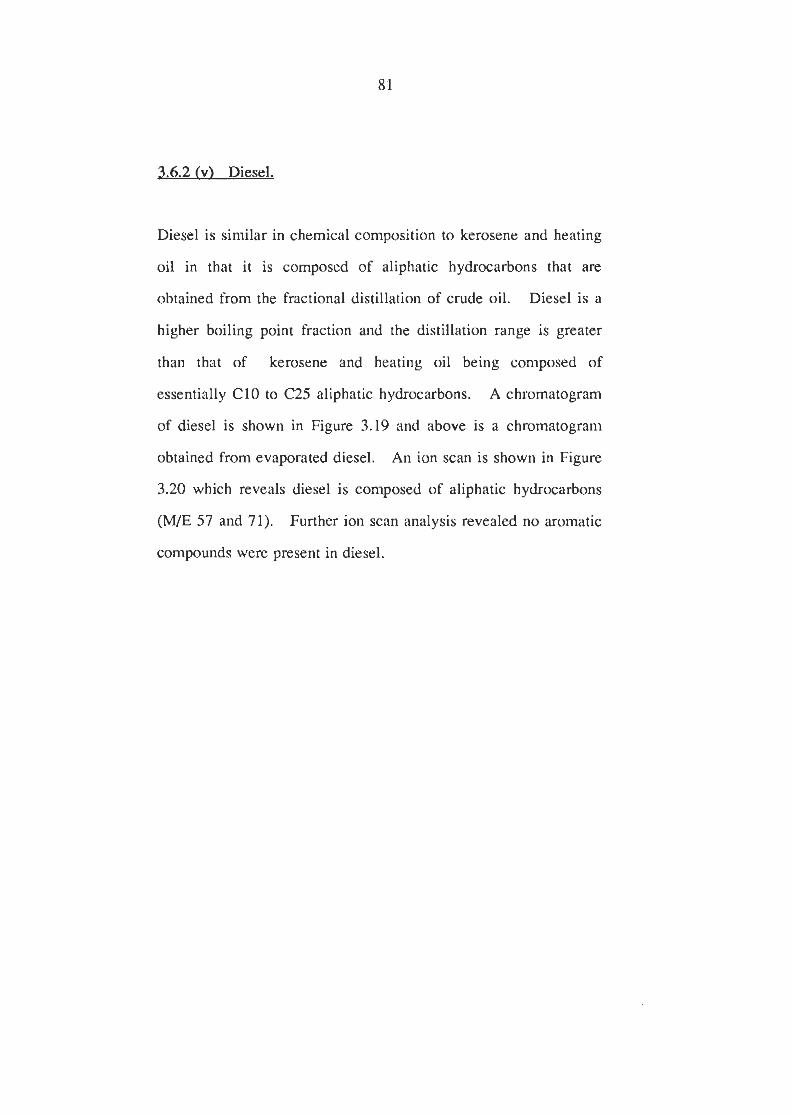
3.6.2 M Diesel.
Diesel is similar in chemical composition to kerosene and heating
oil in that it is composed of aliphatic hydrocarbons that are
obtained from the fractional distillation of crude oil. Diesel is a
higher boiling point fraction and the distillation range is greater
than that of kerosene and heating oil being composed of
essentially C10 to C25 aliphatic hydrocarbons. A chromatogram
of diesel is shown in Figure 3.19 and above is a chromatogram
obtained from evaporated diesel. An ion scan is shown in Figure
3.20 which reveals diesel is composed of aliphatic hydrocarbons
(M/E 57 and 71). Further ion scan analysis revealed no aromatic
compounds were present in diesel.

Figure 3.19 - Diesel and Evaporated Diesel Chromatograms.
Olronatogra~ C: DL Acquired: JUN-04-1986 15 : 19: 46 Connent: D I E M STRNDBRD Scan Range: 1 -1980 Scan: 1 I n t : 0 ! 0:01 RIC: 188% : 100
TOT
Figure 3.20 - Ion Scan of Diesel Chromatogram.
3.6.3 ANALYSIS OF THE INDUSTRIAL SOLVENTS
The industrial solvents can be used as accelerants because they
have the same flammability as the common accelerants but they
are not as readily available to the arsonist. The industrial
solvents are usually derived from the same feedstock as the
common accelerants and are similar in chemical composition in
that they are composed of aliphatic or aromatic hydrocarbons.
Oxygenated hydrocarbons are also available and are usually more
water soluble than the common accelerants so that they can be
readily washed away from the fire scene leaving little mace
remaining.
Generally, solvent manufacturers duplicate each others product,
the only difference being the brand name. A variety of industrial
solvents were analysed as both fresh and evaporated and ion scans
were also obtained to determine the general composition of each
solvent.
The solvents analysed were:-
- Lacquer Thinners
- Methylated Spirits
- Shellsol A
- Shell 1552
- Shell SS926
- Shell X2
- Shell X4
- Shell X55
- Shell X95
- White Spirits
- Shell clean SS1626
The chromatograms and relevant ion scans are shown in Appendix
1.
The main features of the chromatograms are:
Lacquer thinners is a mixture of aromatic and aliphatic
hydrocarbons as well as some oxygenated hydrocarbons such as
ketones, acetates and alcohols. The esters give a distinctive
d o u r to the solvent that could readily be detected olefactorally at
the f i i scene. The alcohols present would make lacquer thinners
more water soluble than the common accelerants but traces would
be expected to remain at the fire scene.
Methylated Spirits is pure ethanol with various denaturants added
depending on the intended use. Methanol is added to commercial
grades and MIBK, florescene and bitrex to retail methylated
spirits. Various other denaturants are sometimes used.
The denaturants with the exception of methanol are present in
minute quantities that would not be expected to be recovered from
fire debris samples. As previously discussed Methylated Spirits
cannot be detected using charcoal and carbon disulphide and
headspace sampling onto Tenax with thermal desorption must be
used.
Ethanol is also present in alcohol cleaning agents and is a
fermentation product from many foods and products. The
investigator should bear this in mind when taking samples and
notify the analyst of any possible contamination of samples.
3.6.3 liii) Shell Solvents.
The solvents were either aliphatic or aromatic hydrocarbons or a
mixture of both. They could readily be confused in their analysis
with some of the common accelerants if they were evaporated.
White spirits, for example, is very similar to kerosene but has a
narrower boiling point range. Some grades do however have
aromatics present that could distinguish them from kerosene.
Because some of the evaporated industrial solvents are similar in
their analysis to some of the common accelerants it is difficult to
positively distinguish between the two. However, a
chromatogram consistant with either would indicate an accelerant
present unless otherwise explained.
3.6.4 ANALYSTS OF COMMON HOUSEHOLD PRODUCTS
AND MATEIUALS,
Many household products and building materials use petroleum
based products in their formulation and the extraction and analysis
of these materials may give chromatograms that could wrongly be
interpreted as an accelerant having been present. Petroleum
based solvents are used in the formulation of paints, varnishes,
aerosols, cleaning chemicals, adhesives and household insecticides
so all fire debris should be inspected and smelt for any evidence
of these products before analysis. Taking control samples may
not be possible at the fire scene so if there is any possibility of
these products being present in the sample, it should be
communicated by the investigator to the analyst.
A variety of household products were extracted and analysed and
the chromatograms obtained. It is difficult to prepare a complete
library of chromatograms of the various household and building
products because of the multitude of products available and their
variable formulations according to brand types. The samples
analysed were:-
- floor tile glue
- varnished wood
- motor oil
- household insecticides
- vegetable oil
- brake fluid
- WD-40
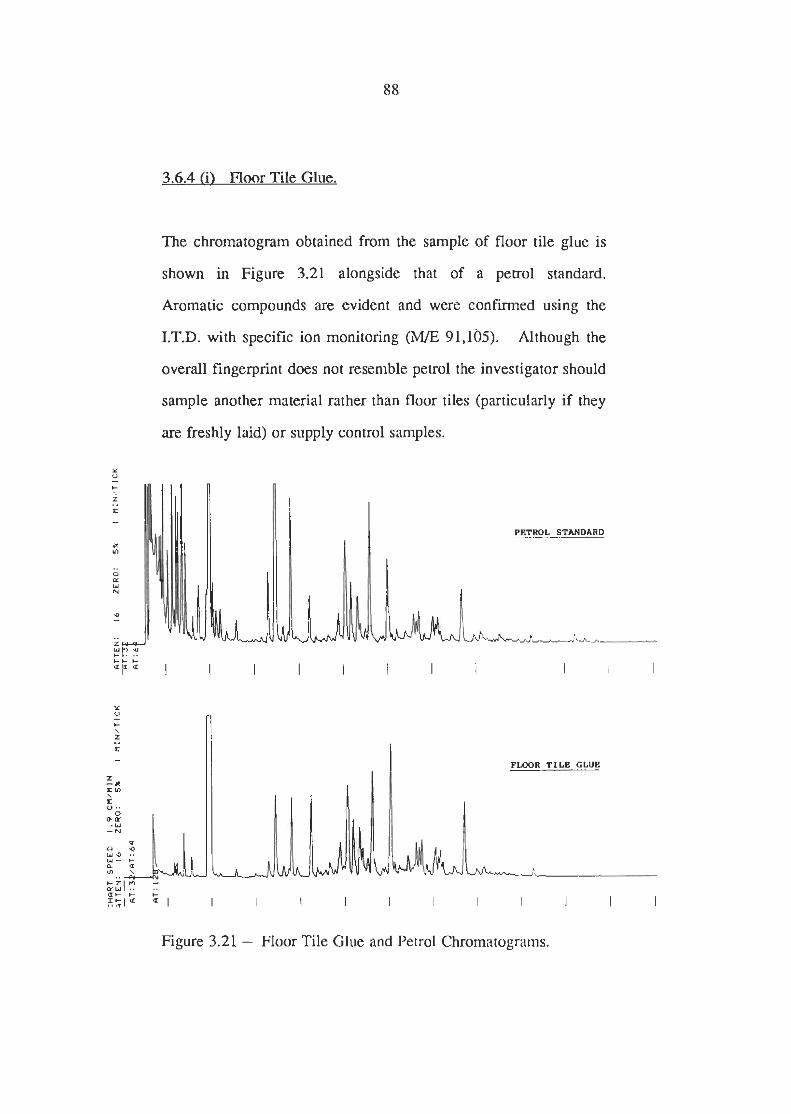
3.6.4 (i'l Floor T i e Glue.
The chromatogram obtained from the sample of floor tile glue is
shown in Figure 3.21 alongside that of a petrol standard.
Aromatic compounds are evident and were conf i ied using the
I.T.D. with specific ion monitoring (ME 91.105). Although the
overall fingerprint does not resemble petrol the investigator should
sample another material rather than floor tiles (particularly if they
are freshly laid) or supply control samples.
PKTWL STANDARD
P U O R TILE GLUE
( C C
I : I I I I I I I I I I I I
Figure 3.21 - Floor Tile Glue and Petrol Chromatograms.
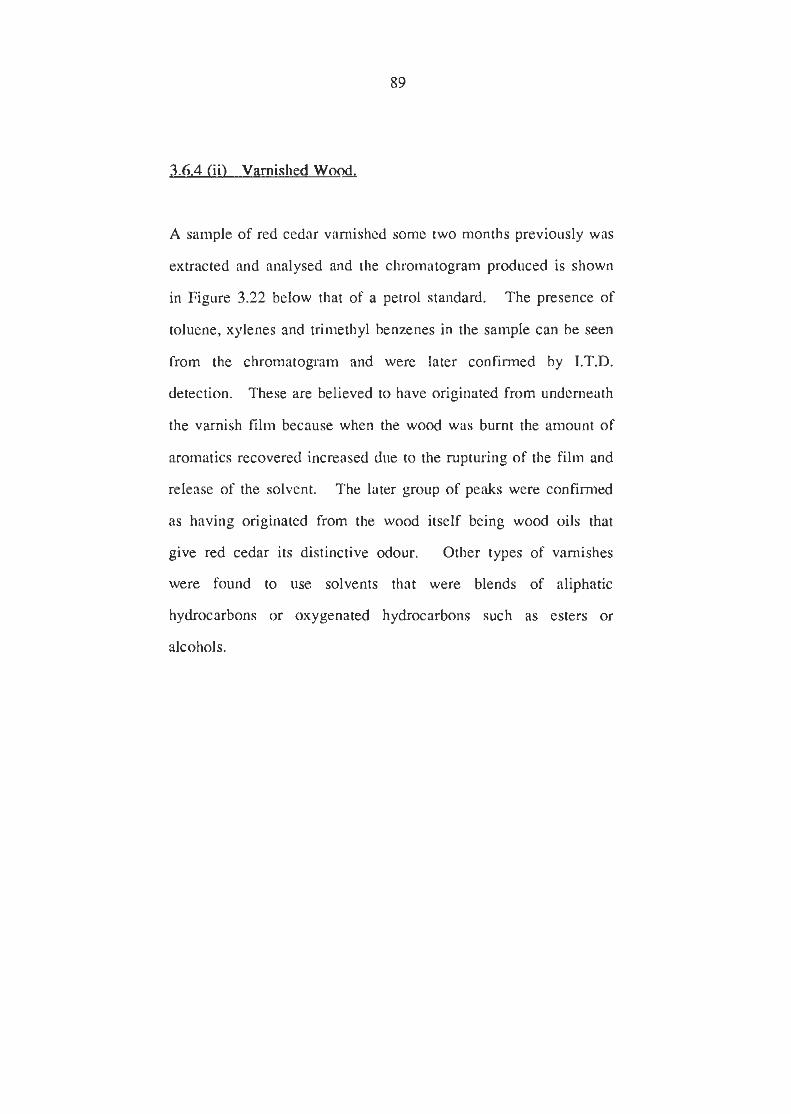
3.6.4 lii) Varnished Wood.
A sample of red cedar varnished some two months previously was
extracted and analysed and the chromatogram produced is shown
in Figure 3.22 below that of a petrol standard. The presence of
toluene, xylenes and trimethyl benzenes in the sample can be seen
from the chromatogram and were later confirmed by I.T.D.
detection. These are believed to have originated from underneath
the varnish film because when the wood was burnt the amount of
aromatics recovered increased due to the rupturing of the film and
release of the solvent. The later group of peaks were confirmed
as having originated from the wood itself being wood oils that
give red cedar its distinctive odour. Other types of varnishes
were found to use solvents that were blends of aliphatic
hydrocarbons or oxygenated hydrocarbons such as esters or
alcohols.
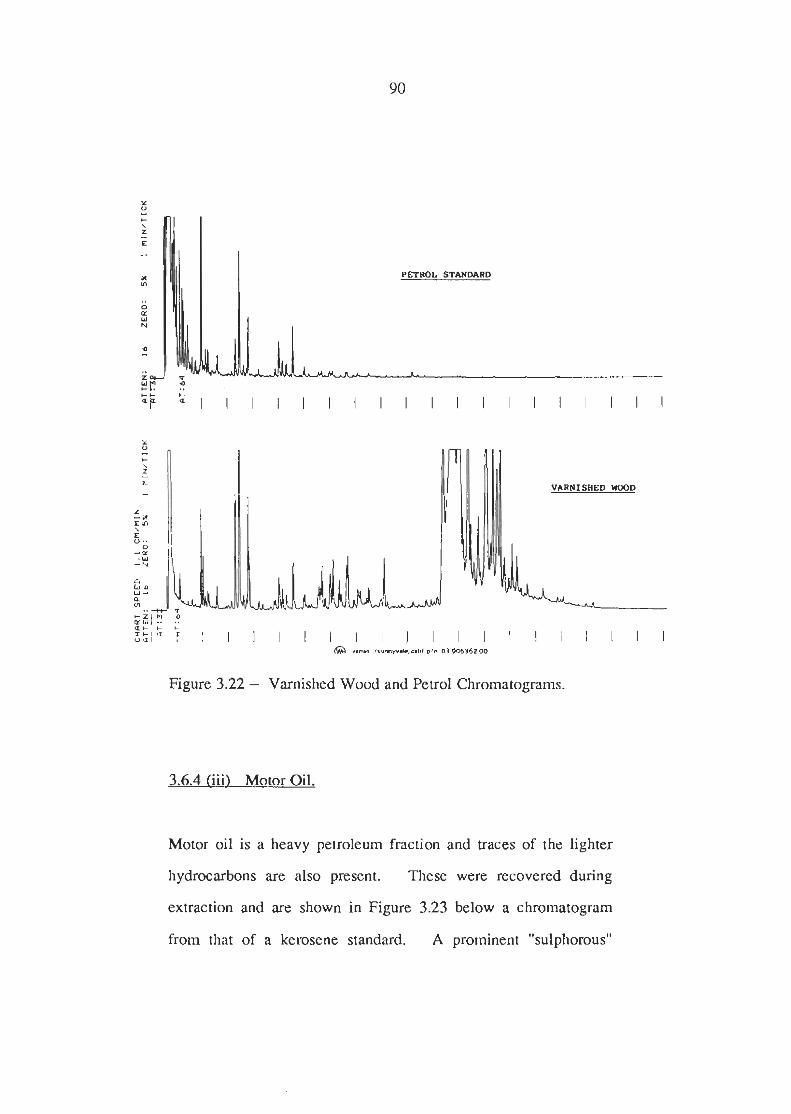
PAWL STANDARD
Figure 3.22 - Varnished Wood and Petrol Chromatograms.
3.6.4 (iii) Motor Oil,
Motor oil is a heavy petroleum fraction and traces of the lighter
hydrocarbons are also present. These were recovered during
extraction and are shown in Figure 3.23 below a chromatogram
from that of a kerosene standard. A prominent "sulphorous"
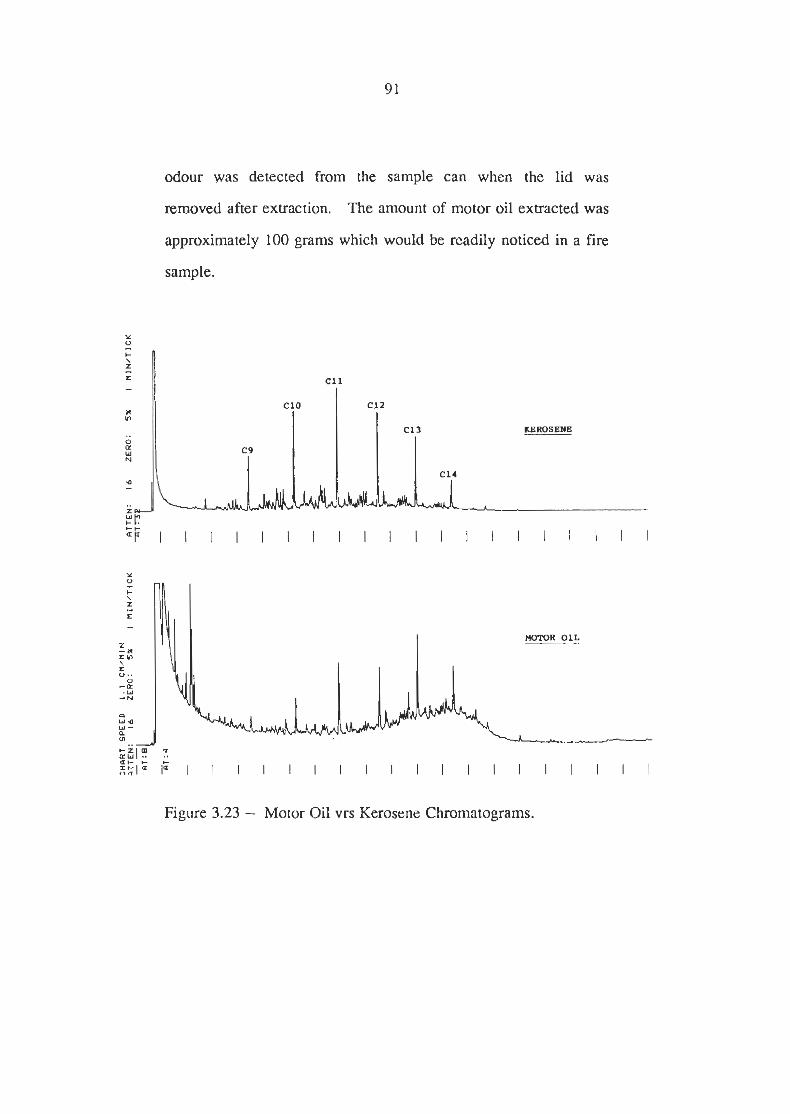
odour was detected from the sample can when the lid was
removed after extraction. The amount of motor oil extracted was
approximately 100 grams which would be readily noticed in a fin
sample.
r n R OIL
Figure 3.23 - Motor Oil vrs Kerosene Chromatograms.
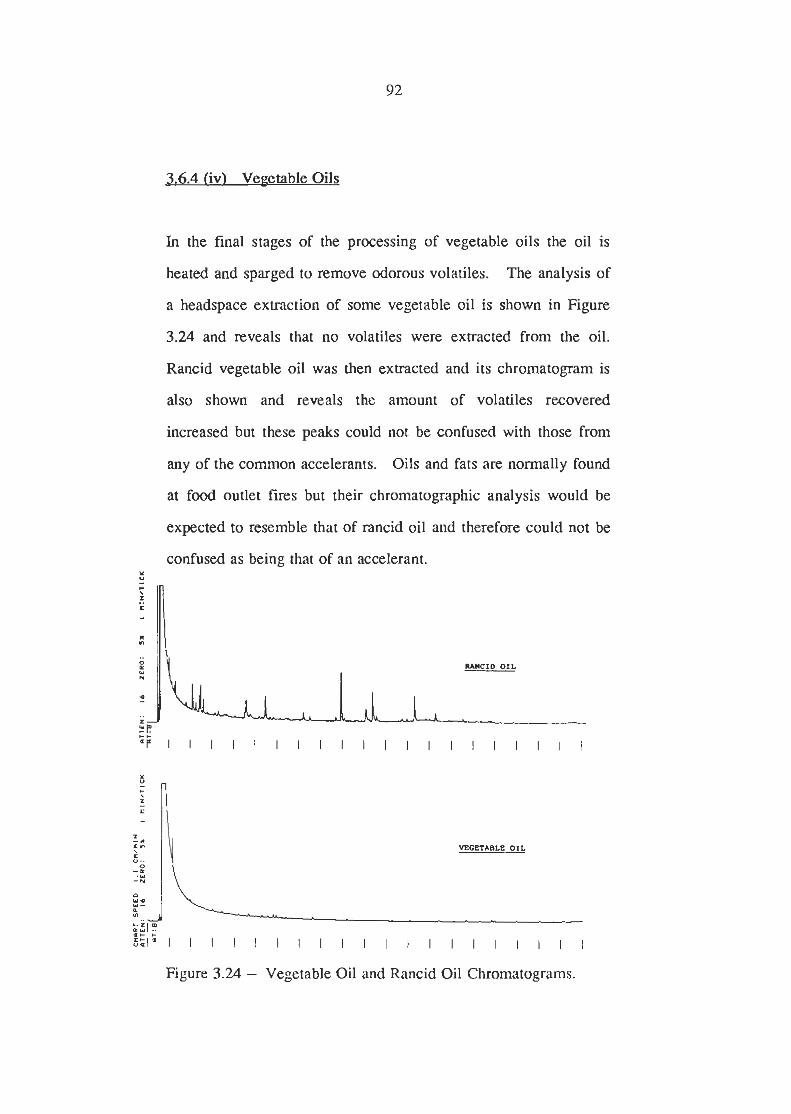
3.6.4 (iv) Veeetable Oils
In the final stages of the processing of vegetable oils the oil is
heated and sparged to remove odorous volatiles. The analysis of
a headspace exmction of some vegetable oil is shown in Figure
3.24 and reveals that no volatiles were extracted from the oil.
Rancid vegetable oil was then extracted and its chromatogram is
also shown and reveals the amount of volatiles recovered
increased but these peaks could not be confused with those from
any of the common accelerants. Oils and fats are normally found
at food outlet fires but their chromatographic analysis would be
expected to resemble that of rancid oil and therefore could not be
confused as being that of an accelerant.
Figure 3.24 - Vegetable Oil and Rancid Oil Chromatograms.
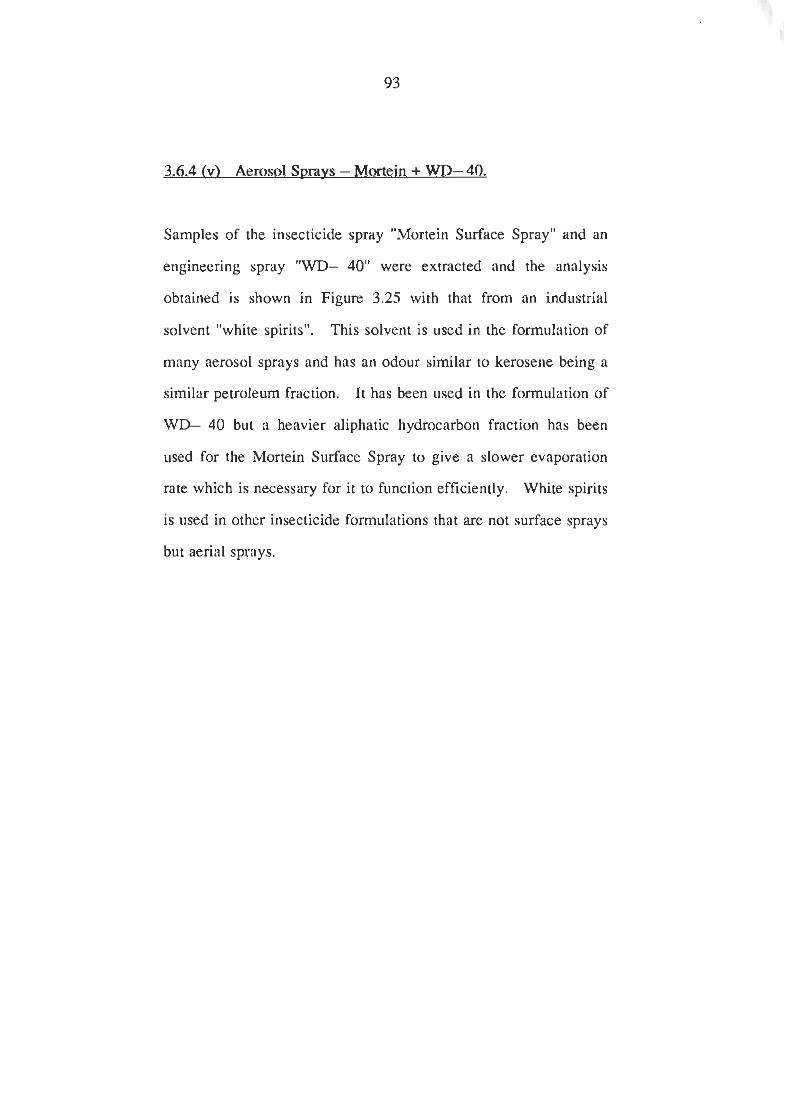
3.6.4 iv) Aerosol Svrays - Mortein + WLL 40.
Samples of the insecticide spray "Mortein Surface Spray" and an
engineering spray "WD- 4 0 were extracted and the analysis
obtained is shown in Figure 3.25 with that from an industrial
solvent "white spirits". This solvent is used in the formulation of
many aerosol sprays and has an odour similar to kerosene being a
similar petroleum fraction. It has been used in the formulation of
WD- 40 but a heavier aliphatic hydrocarbon fraction has been
used for the Mortein Surface Spray to give a slower evaporation
rate which is necessary for it to function efficiently. White spirits
is used in other insecticide formulations that are not surface sprays
but aerial sprays.
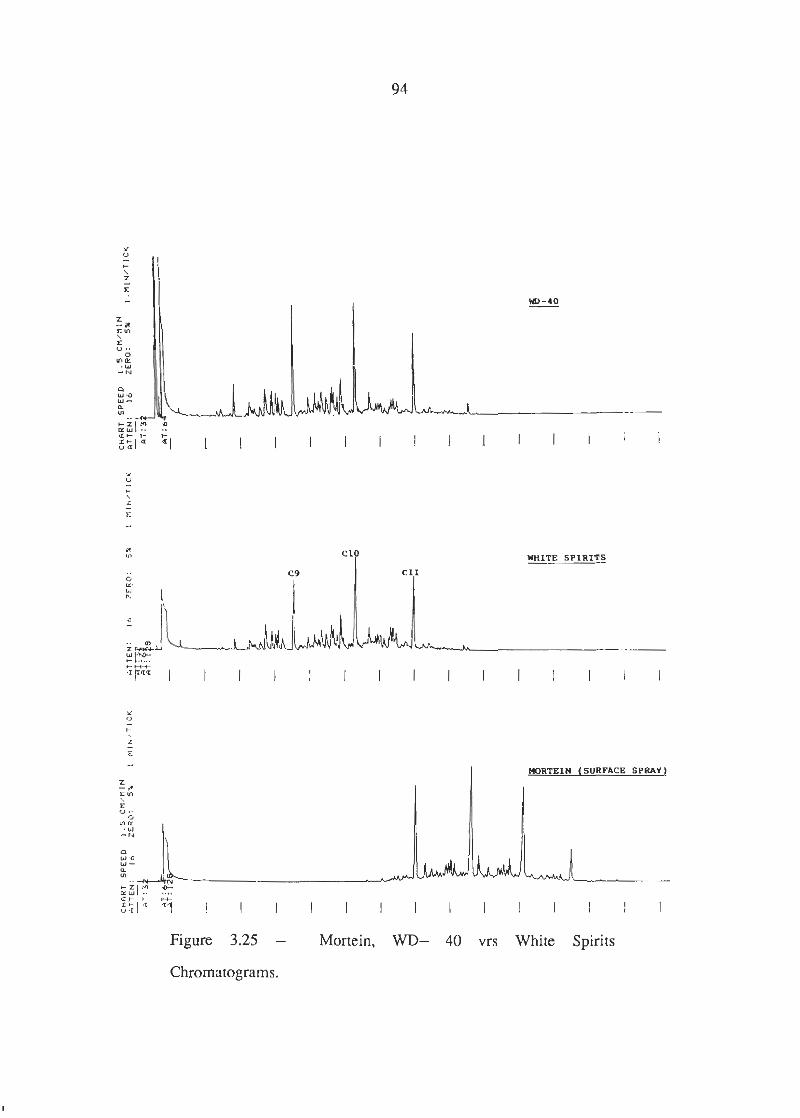
"P WHITE SPIRITS
Figure 3.25 - Mortein, WD- 40 vrs White Spirits
Chromatograms.

3.6.5 ANALYSIS OF BURNT SYNTHETIC MATERIALS.
Plastics are produced from the polymerisation of monomers into
longer chain polymers. The burning of these plastics results in
the cleavage of the molecules to yield volatile pyrolysis products
that are readily extracted from fire debris containing plastics.
The monomers used in the manufacture of plastics are commonly
derived from petroleum products and their pyrolysis products are
often aliphatic and aromatic hydrocarbons which are found in the
common accelerants.
Samples of various plastics were obtained and burnt with a bunsen
burner and then extracted and the chromatograms obtained. The
samples were also analysed using an I.T.D. detector and specific
ion mass chromatograms obtained.
The following samples were burnt and analysed.
- Nylon
- Polyvinylchloride (P.V.C.)
- Polyethylene
- Polypropylene
- Polystyrene
- Rubber carpet backing
- Rubber floor tile
3.6.5 (i) Nvlon.
The chromatograph obtained from the exmction of burnt nylon is
shown in Figure 3.26. The chromatogram was compared to those
of the common accelerants but no possibility of peak matching
was found therefore it could not be confused with any of the
common accelerants.
B u m mum
Figure 3.26 - Burnt Nylon Chromatogram.
3.6.5 (ii) Polyvinylchloride (P.V.C.).
The chromatogram obtained from burnt P.V.C. is shown in Figure
3.27 and below in Figure 3.28 is the specific ion scans of masses
57 and 71 (indicating aliphatic hydrocarbons). P.V.C. could not
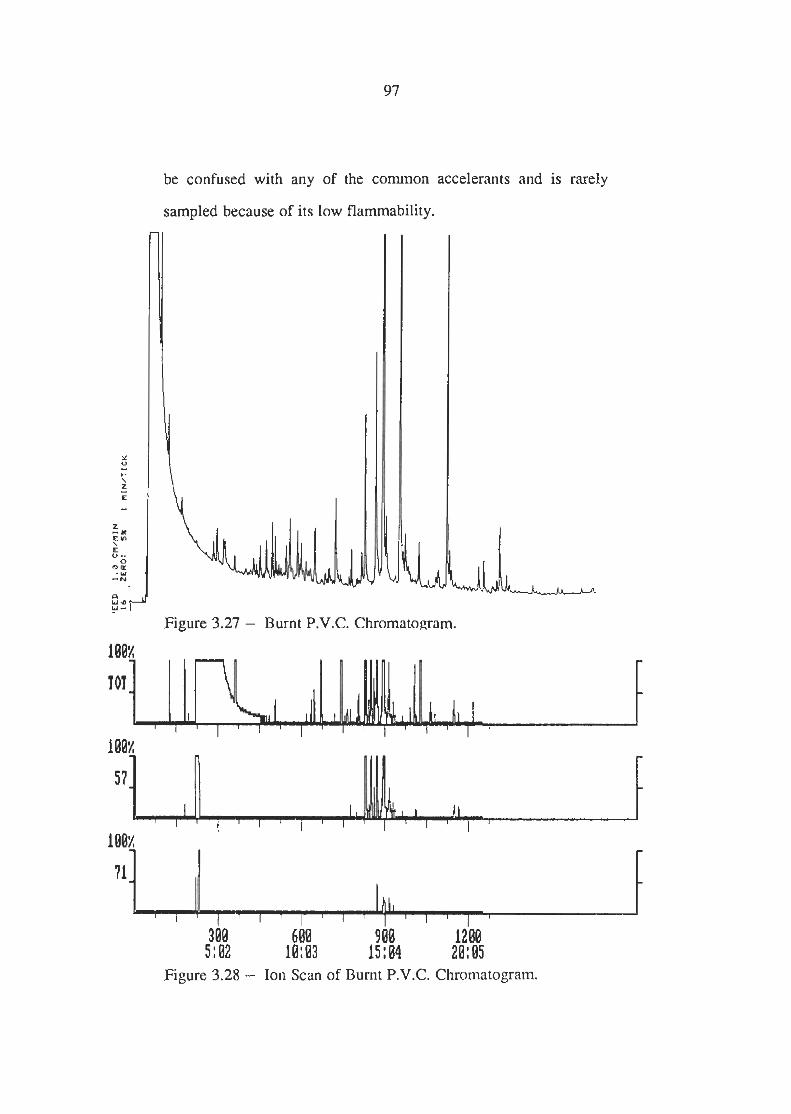
97
be confused with any of the common accelerants and is rarely
sampled because of its low flammability.
Figure 3.27 - Burnt P.V.C Chromatomam.
108%
TOT
l0ex
1 5:02 300 10: 600 03 900 1200
15:04 20:05 Figure 3.28 - Ion Scan of Burnt P.V.C. Chromatogram.
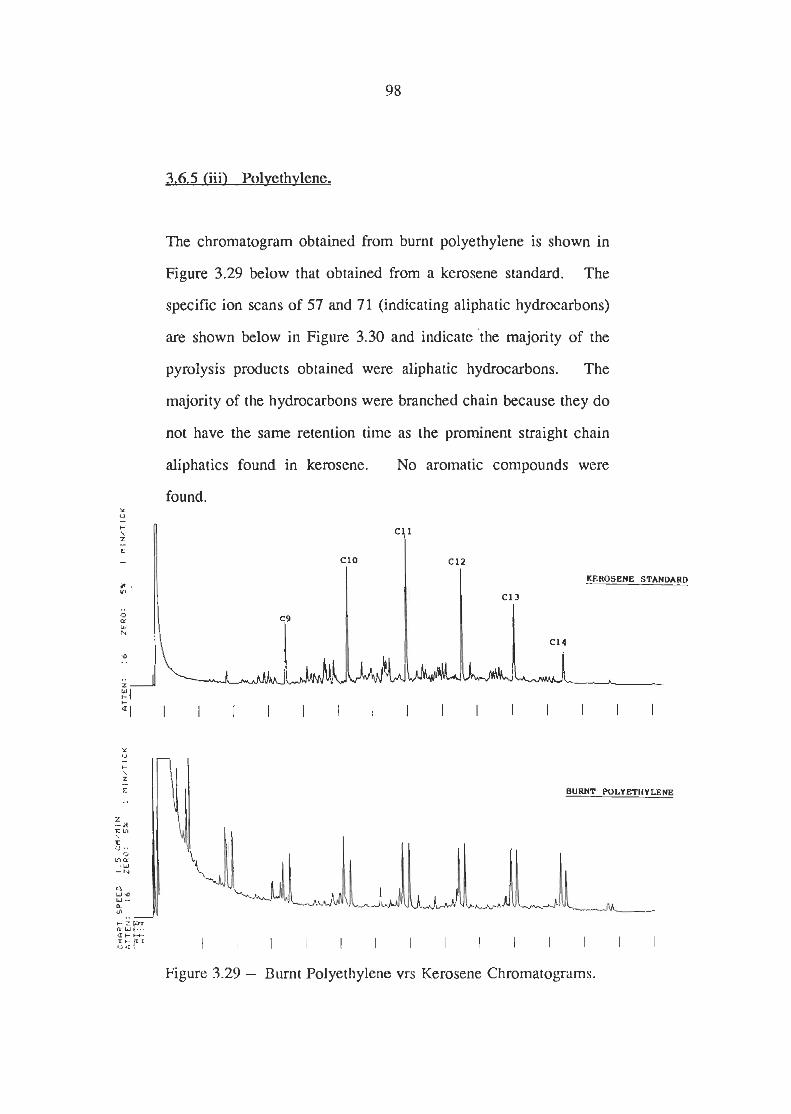
3.6.5 (ii) Polvethvlene,
The chromatogram obtained from burnt polyethylene is shown in
Figure 3.29 below that obtained from a kerosene standard. The
specific ion scans of 57 and 71 (indicating aliphatic hydrocarbons)
are shown below in Figure 3.30 and indicate 'the majority of the
pyrolysis products obtained were aliphatic hydrocarbons. The
majority of the hydrocarbons were branched chain because they do
not have the same retention time as the prominent straight chain
aliphatics found in kerosene. No aromatic compounds were
found.
Figure 3.29 - Burnt Polyethylene vrs Kerosene Chromatograms.
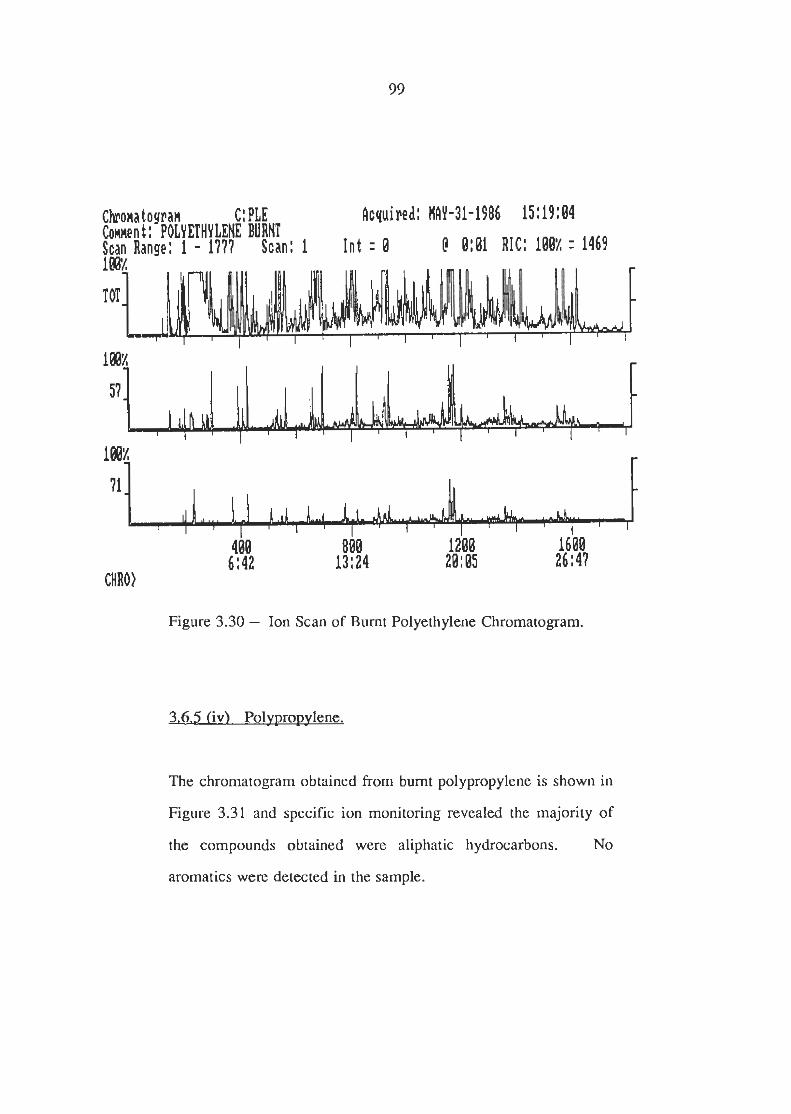
C h n a t o g r a ~ C: PLE Acquired: NAY-31-1986 15:19:04 Co~nen t : POLYETHYLEN BURNT Scan Range: 1 - 1177 Scan: 1 I n t : 0 ! 0:0l RIC: l00'L : 1469 188
TOT
I
Figure 3.30 - Ion Scan of Burnt Polyethylene Chromatogram
The chromatogram obtained from burnt polypropylene is shown in
Figure 3.31 and specific ion monitoring revealed the majority of
the compounds obtained were aliphatic hydrocarbons. No
aromatics were detected in the sample.
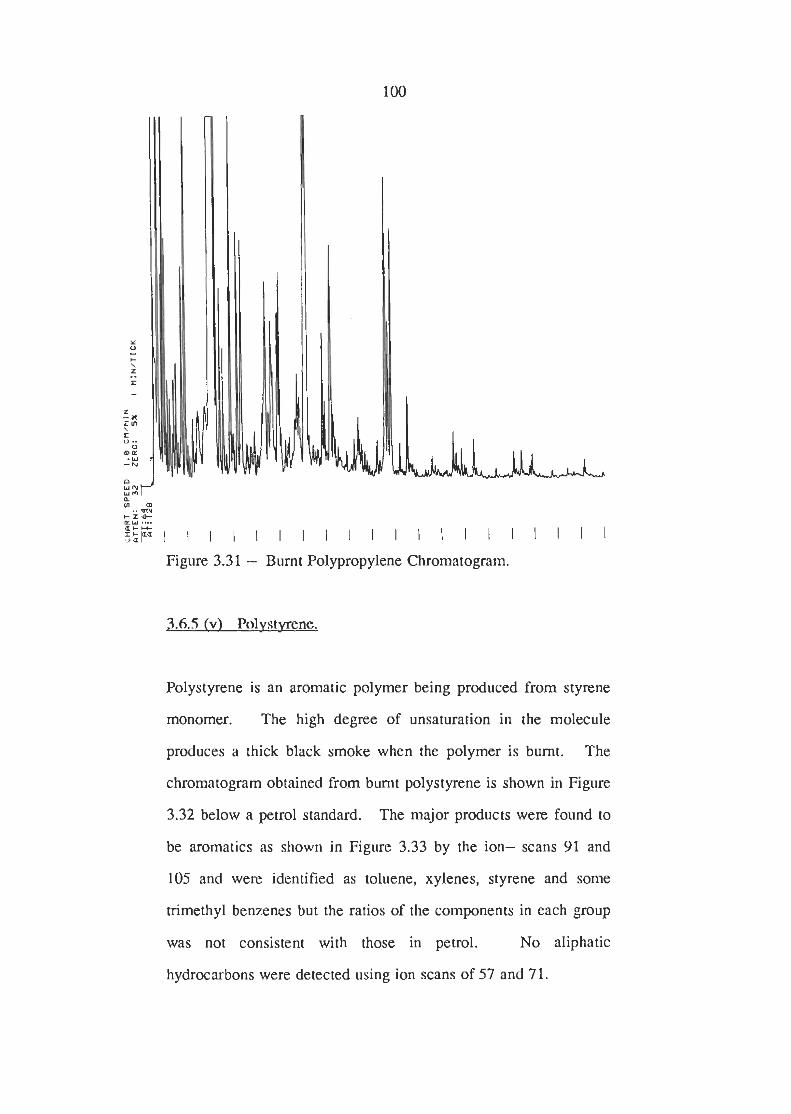
Figure 3.31 - Burnt Polypropylene Chromatogram.
Polystyrene is an aromatic polymer being produced from styrene
monomer. The high degree of unsaturation in the molecule
produces a thick black smoke when the polymer is burnt. The
chromatogram obtained from bumt polystyrene is shown in Figure
3.32 below a petrol standard. The major products were found to
be aromatics as shown in Figure 3.33 by the ion- scans 91 and
105 and were identified as toluene, xylenes, styrene and some
aimethyl benzenes but the ratios of the components in each group
was not consistent with those in petrol. No aliphatic
hydrocarbons were detected using ion scans of 57 and 71.
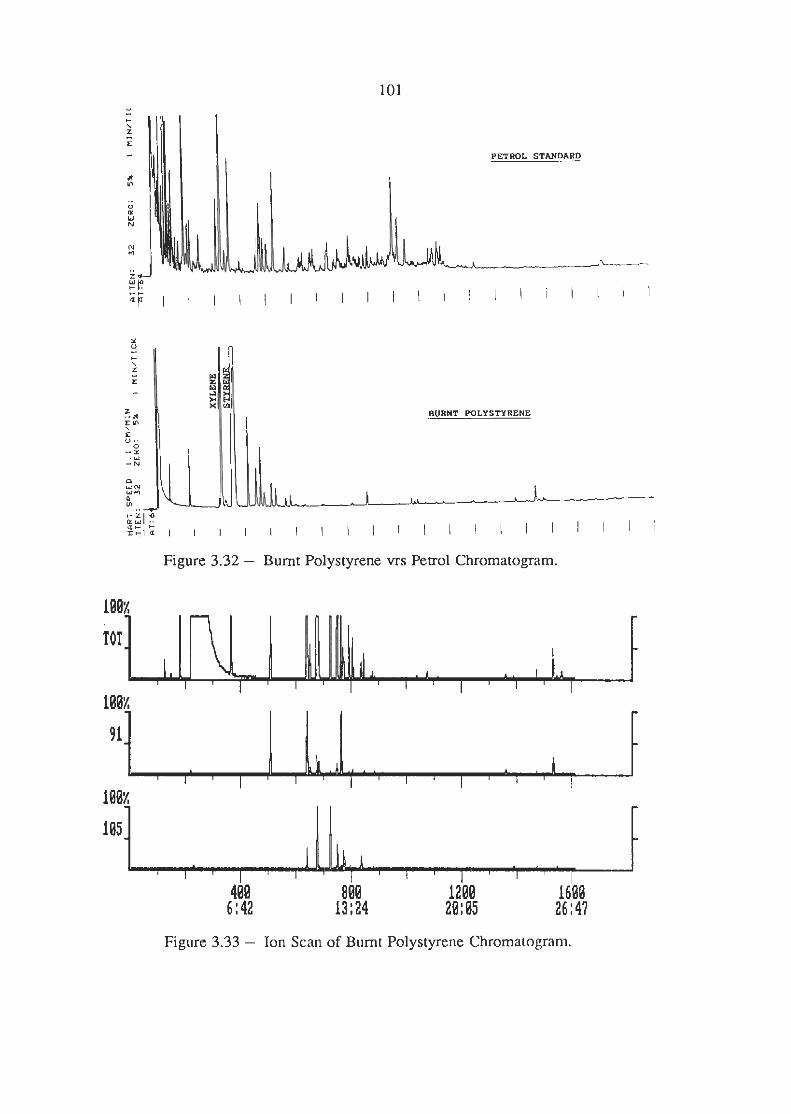
u - + \
z E P - Y
E E X POLYSRUEIIE E YI \
x 0 ..
0 -* .w - N
0
w l l u." L I. rn I W C Z I (I m w
I I I I I I I I I I I I I I I I I I I ~ ~
Figure 3.32 - Burnt Polystyrene vrs Petrol Chromatogram.
-
TOT
ln& 91.
I i ; dl:
I I I
l0%L
l E 5 5 6:42 400 13:24 800 1288 1600
20:05 26:47
Figure 3.33 - Ion Scan of Burnt Polystyrene Chromatogram.

3.6.5 (vi) Rubber Backed Camt.
The burning of rubber is usually accompanied by black smoke and
the residue contains significant quantities of pyrolysis products as
evident by the d o u r and Sniffer response at a fire scene. The
chromatogram obtained from burnt rubber backed carpet is shown
in Figure 3.34 below that of a petrol standard. Shown in Figure
3.35 are the specific ion scans of 91 and 105 that c o n f m the
presence of the aromatic compounds and reveals toluene and the
xylenes present. The xylenes are not in the same ratios as those
found in petrol and the trimethyl benzenes were found to be
absent. The ion scans of 57 and 71 are also shown and reveal the
latter peaks to be aliphatic hydrocarbons. Other samples of
rubber backed carpet were burnt to a greater degree and then
extracted and the amount of pyrolysis products increased but were
still in approximately the same ratios and could not be confused
with petrol.
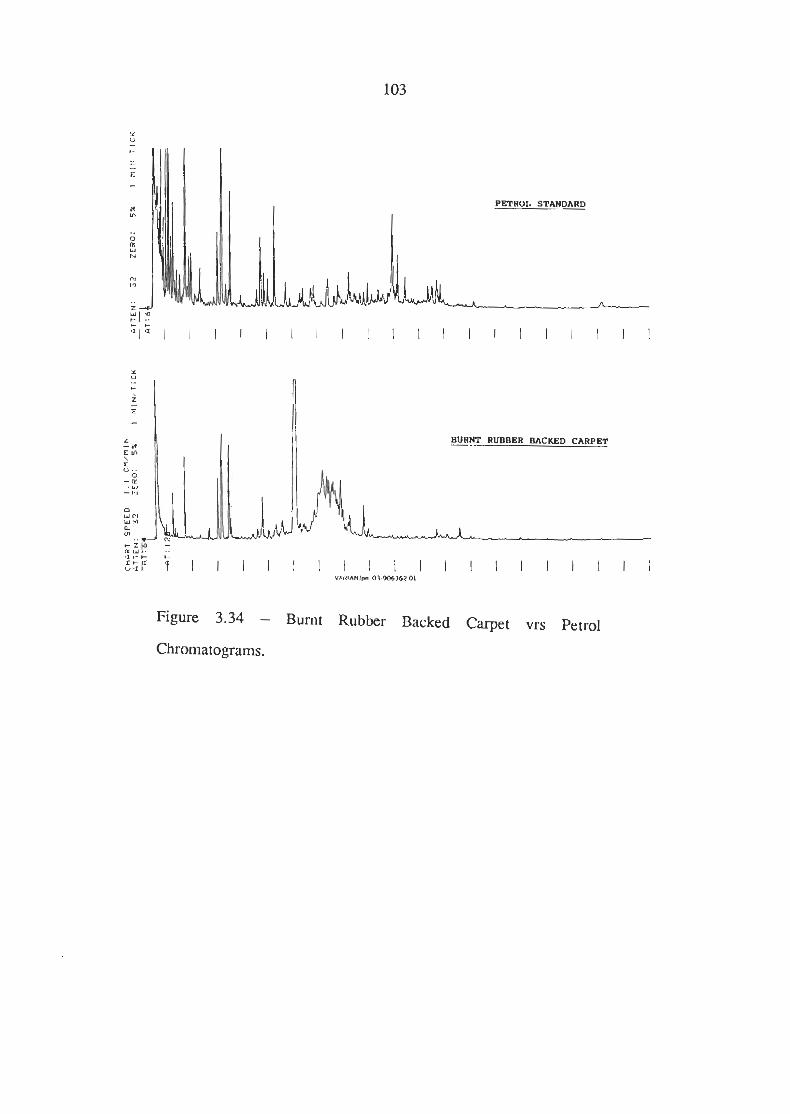
PETROL STANDARD
BURNT RUBBER B I C W D CARPET
Figure 3.34 - Burnt Rubber Backed Carpet vrs Petrol
Chromatograms.
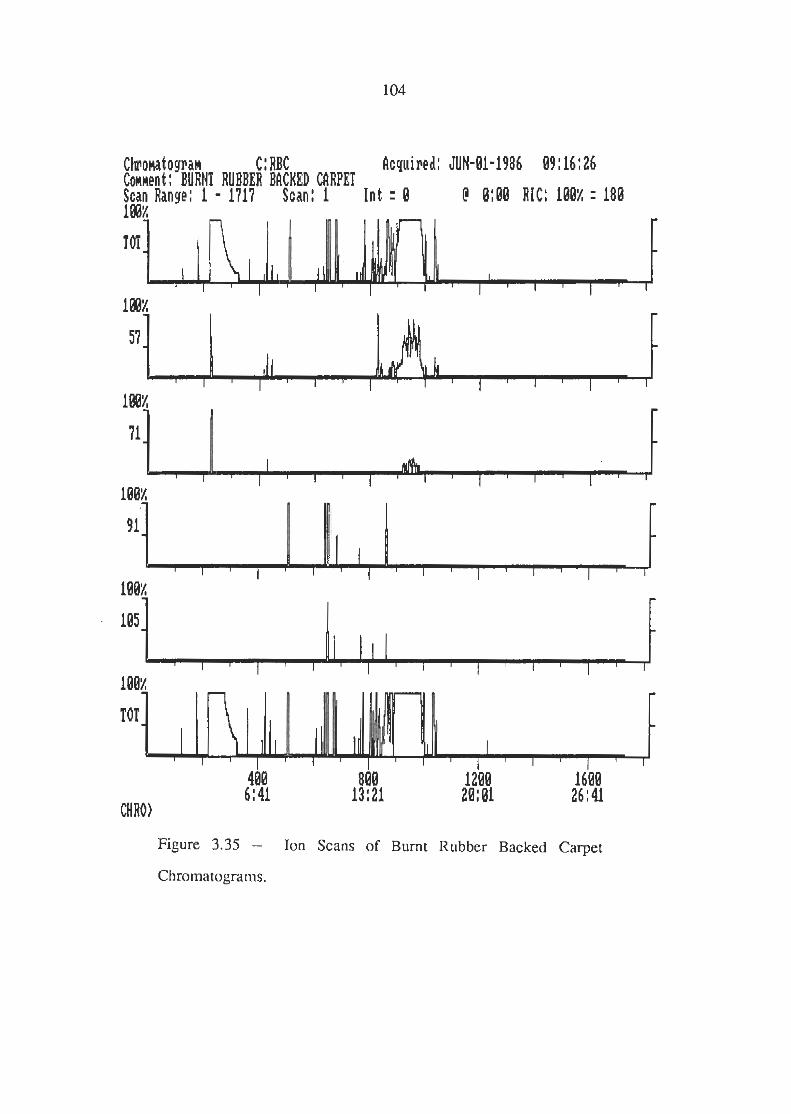
C l r o ~ a t o y r a ~ C: RBC Lcquired: JUN-01-1986 09:16:26 Con~ent: BURNT RUBBER BBCKED CLRPET Scan Range: 1 - 1717 Scan: 1 In t : 0 @ 0:00 RIC: 100'~ - 180 1BB
TOT
Figure 3.35 - Ion Scans of Burnt Rubber Backed Carpet
Chromatograms.
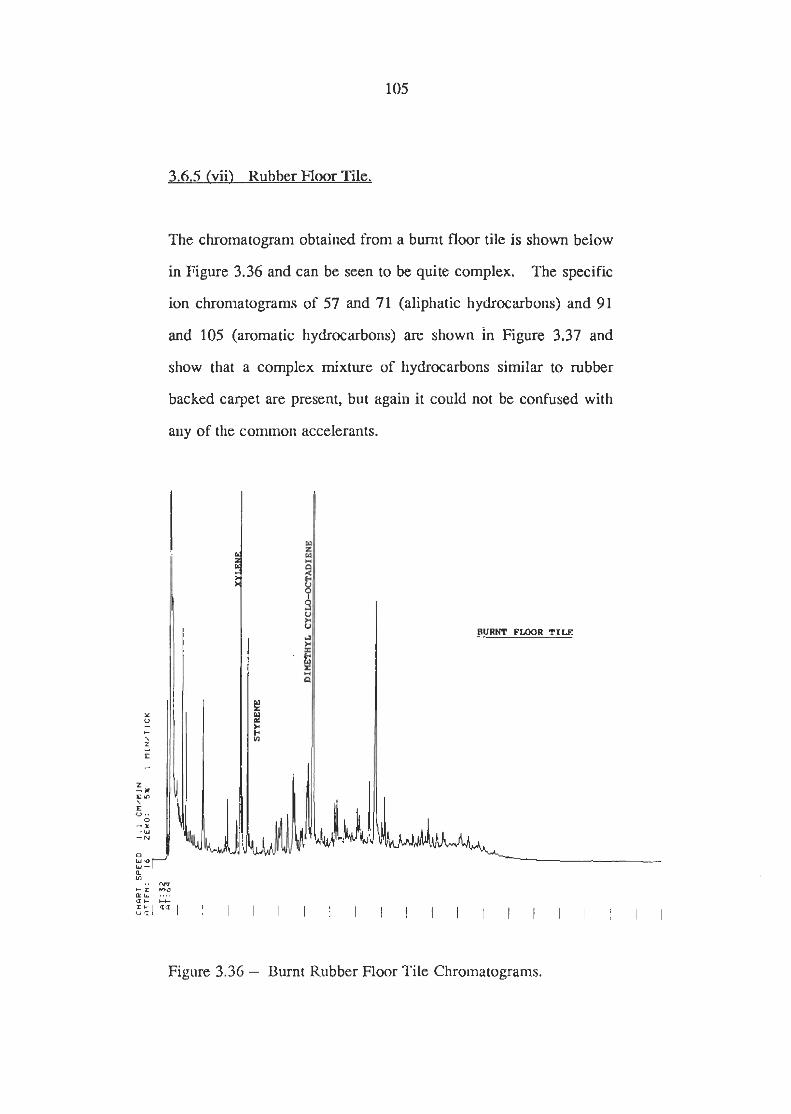
105
3.6.5 ivii) Rubber Floor Tie.
The chromatogram obtained from a burnt floor tile is shown below
in Figure 3.36 and can be seen to be quite complex. The specific
ion chromatograms of 57 and 71 (aliphatic hydrocarbons) and 91
and 105 (aromatic hydrocarbons) are shown in Figurc 3.37 and
show that a complex mixture of hydrocarbons similar to rubber
backed carpet are present, but again it could not be confused with
any of the common accelerants.
Figure 3.36 - Burnt Rubber Floor Tile Chromatograms.
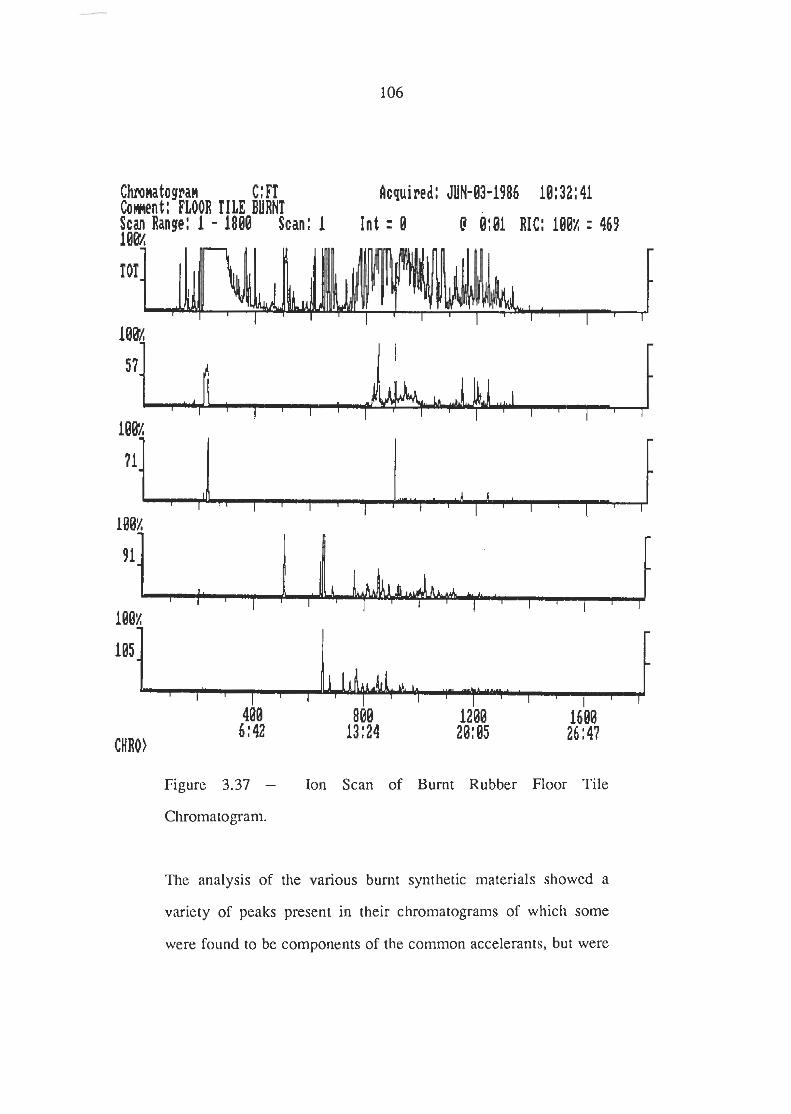
Chkatoyrafi C: FT Lcquired: JUN-83-1986 11:32:41 Corment : FLOOR TILE BURNT Scan Range: 1 - 1801 Scan: I lnt = 0 ! 0:01 RIC: lli" = 469 188:
1 lBB!
115- - I I
I I I I I
411 I
801 6342
1210 13:24
1610 CHRO)
20:05 26:47
Figure 3.37 - Ion Scan of Burnt Rubber Floor Tile
Chromatogram.
The analysis of the various burnt synthetic materials showed a
variety of peaks present in their chromatograms of which some
were found to be components of the common accelerants, but were

not in the same ratios, and hence, could not be confused with the
common accelerant.
The synthetic materials tested were chosen because they are
commonly found at fire scenes but new synthetic materials should
be burnt and analysed to update the analyst' library.
CHAPTER 4. CONcLUsIONs
Dynamic headspace sampling with Capillary G.L.C. analysis will
successfully analyse fire debris for accelerants and is capable of
detecting a microlitre of accelerant.
The use of these extremely sensitive laboratory techniques must be
made carefully because of the consequence of obtaining a false
positive result. The possibility of the accidental contamination
of a sample through poor sampling and laboratory techniques
needs to be minimised. The research has shown the sample
containers can be cleaned before use and should be sealed before
transport to the fire scene. Samples should then be delivered to
the laboratory and analysed promptly. The laboratory equipment
should be cleaned before use and blank samples analysed regularly
to check for any possible contamination. The extraction
equipment can be cleaned by washing with acetone and heating
the gas transfer lines with a bunsen burner.
The interpretation of the chromatograms must be made carefully
using a library of chromatograms composed of the common
accelerants, industrial solvents, common household materials and
bumt synthetic materials. The analysis of numerous burnt
synthetic materials was found to be distinct from the common
accelerants. The common accelerants were found
.to change during evaporation making it sometimes difficult to
distinguish between those composed entirely of an aliphatic
hydrocarbon fraction. Ethanol could not be detected in fire debris
using charcoal absorption extraction techniques and alternative
analytical techniques were needed.
The background level of accelerants in the environment is
dependent of the history of the sample material. Traces of petrol
and aliphatic hydrocarbons were found in soil from a motor
wrecking yard, however, no traces were found in numerous car
flooring materials indicating none would be expected from a
domestic environment.
Gas odourants could also be detected using the same equipment as
that used for f ie debris analysis which would assist the
investigation of suspected gas explosions.
BIBLIOGRAPHY
Evans, J.S. "Arson in Australia. Dimensions of the Problem and Resources to Cope." National Conference on Arson, Australian Institute of Criminology, Canberra, April 26 to 29, 1983.
P I Kirk, P.L. Fire Investigation 1st Edition, 1969, J. Wiley and Sons.
P I Ettling, B.V., and Adams, M.F. "The Study of Accelerant Residues in Fire Remains" Journal of Forensic Science. Vol. 13., No. I., 1968, pp76-89.
141 Midkiff, C.R. "Separation and Concentration of Flammable Liquid in Arson Evidence." Arson Analytical Newsletter. Vol. 2., Pt. 6., 1978,
pp 8-20.
Camp, M.J. "Analytical Techniques in Arson Investigation." Analytical Chemistry. Vol. 52., No. 3., 1980, pp 423A-426A.
Midkiff, C.R., and Washington, W.D. "Gas Chromatographic Determination of Traces of Accelerants in Physical Evidence." Journal of the AOAC. Vol. 5 5 , No. 4.. 1972, pp 840-845.
Lentini, J.L. "Analytical Scheme for Detection of Accelerant Residues in Fire Debris." F i e and Arson Investigator. Jan-Mar, 1982, pp 9-12.
Tate, D.R. "ATF Charcoal Tube Method for Extracting Accelerants from Fire Debris."
Tontarski, R.E., and Strobel, R.A. "Automated Sampling and Computer Assisted Identification of Hydrocarbon Accelerants." Journal of Forensic Science. Vol. 27., No. 3.. 1982, pp 710-714.
Chrostowski, J.E., and Holmes, R.N. "Collection and Determination of Accelerant Vapours from Arson Debris." Arson Analytical Newsletter. Vol. 3.. Pt. 5., 1979, pp 1-77.
Higgins, K.M., Higgins M.K., et. al. "High Speed Extraction of Accelerants from Arson Debris." Joumal of Forensic Science. Vol. 29., No. 3.. 1984, pp 874-880.
Klosterman, J.P. "Simplified Techniques for Charcoal AbsorptionElution of Arson Samples." Arson Analytical Newsletter. Vol. 7., No. 2., 1983, pp 44-47.
Andrasko, J. "The Collection and Detection of Accelerant Vapours Using Porous Polymers and Curie Point Pyrolysis Wires Coated with Active Carbon." Joumal of Forensic Science. Vol. 28., No. 2.. 1983, pp 330-344.
Russell, L. W, "The Concentration and Analysis of Volatile Hydrocarbons in Fire Debris Using TenaxaC." Journal of Forensic Science Society. Vol. 21.. 1981, pp 3 17-326.
Twibell, JD., and Home, J.M. "Novel Method for Direct Analysis of Hydrocarbons in Crime Investigation and Air Pollution Studies." Nature. Vol. 268., August 1977.
Twibell, J.D., Home, J.M., and Smalldon, KW. "A Splitless Curie Point Pyrolysis Capillary Inlet System for Use with the Adsorption Wire Technique of Vapour Analysis." Chromatographia. Vol. 14., No. 6.. 1981, pp 366-370.
Juhala, J.A. "A Method of Absorption of Flammable Vapours by Direct Insertion of Activated Charcoal into the Debris Sample." A.T.F. Arson Accelerant Detection Course Handout NO. 7. pp 4.100-4.114.
Saferstein, R., and Park, S.A. "Application of Dynamic Headspace Analysis to Laboratory and Field Arson Investigations." Journal of Forensic Science. Vol. 27., No. 3., 1982, pp 484-494.
Mieure, J.P. "Porous Polymer Sorbents for Analysis of Organic Air Pollutants." Monsato Research Center, St. Louis, Missouri.
Gustafson, R.L., and Paleos, J. "Interactions Responsible for the Selective Adsorption of Organics on Organic Surfaces." Chapter 10, Organic Compounds in Aquatic Environments by Faust, S.D., and Hunter, J.V.
Dave, S.B. "A Comparison of the Chromatographic Properties of Porous Polymers." Joumal of Chromatographic Science. Vol. 7.. 1969, pp 39-49.
Stevens, B.W., and Kerner, J.W. "Recovering Organic Materials from Wastewater." Chemical Engineering. Feb. 1975, pp 84-87.
Kennedy, D.C., "Macroreticular Polymeric Absorbents." I&E.C. Prod. R.&D. Vol. 12., 1973, pp 56-61.
Hunt, G.T., Pangaro, N., and Zelenski, S.G. "The Chemical Characterisation of Potential Organic Interferences in Two Commercially Available Polymeric Absorbents." Analytical Letters. Vol. 13(A7), 1980, pp521-528.
Grob, K., and Grob. G. "Gas Liquid Chromatographic - Mass Spectometric Investigation of C6 - C20 Organic Compounds in an Urban Atmosphere." Joumal of Chromatography. Vol. 62., 1971, pp 1-13.
Goller, J.W. "Displacement of Polar by Non-Polar Organic Vapours in Sampling Systems." Journal of American Industrial Hygiene Association. Vol. 46., No. 3., 1985, pp 170-173.
W'I Kim, N.S., Geraci, C.L., and Kupal, R.E. "Solid Sorbent Tube Sampling and Ion Chromatographic Analysis of Formaldehyde." Journal of American Industrial Hygiene Association. Vol. 41., NO. 5., 1980, pp 334-339.
[281 Clark, A.I., McIntyre, A.E., Lester, J.N., and Perry, R. "Evaluation of a Tenax GC Sampling Procedure for Collection and Analysis of Vehicle-Related Aromatic and Halogenated Hydrocarbons in Ambient Air." Journal of Chromatography. Vol. 252., 1982, pp 147-157.
[291 Brown, R.H., and Purnell, C.J. "Collection and Analysis of Trace Organic Vapour Pollutants in Ambient Atmospheres." Journal of Chromatography. Vol. 178.. 1979, pp 79-90.
[301 Bertoni, G., Bmner, F., Liberti, A., and Perrino, C. "Some Critical Parameters in Collection, Recovery and Gas Chromatographic Analysis of Organic Pollutants in Ambient Air Using Light Adsorbents." Journal of Chromatography, Vol. 203., 1981, pp 263-270.
[311 Greebner, 0.. and Burgess, W.A. "Calculation of Adsorption Breakthrough Curves in Air Cleaning and Sampling Devices." Environmental Science and Technology. Vol. 15, No. 11, 1981, pp 13461351.
[321 "High Resolution Gas Chromatography" 2nd Edition, R.R. Freeman.
[331 Neu, H.J., Merz, W., and Panzel, H. "A Novel Technique for Thermal Desorption from Active Charcoal." Journal of High Resolution Chromatography and Chromatography Communications. Vol. 5., 1982, pp 382-384.
Melcher, R.G., Langner, R.R., and Kagel, R.O. "Criteria for the Evaluation of Methods for the Collection of Organic Pollutants in Air Using Solid Sorbents." - . - . . - -. . .
Journal of American Industrial Hygiene Association. Vol. 39., 1978, pp 349-361.
[351 Languardt, P.W., and Melcher, R.G. "Simultaneous Determination of Polar and Non-Polar Solvents in Air Using a Two Phase Desorption from Charcoal." Journal of American Industrial Hygiene Association. Vol. 40., 1979.
[36] Kantrowitz, J.D. "Expert Testimony and Scientific Evidence in Arson Related Cases." Journal of Forensic Science. Vol. 26., No. I., 1981, pp 142-152.
[371 Store, I.C., Lomonte, J.N., Fletcher, L.A., and Lowry, W.T. "Accelerant Detection in Fire Residues." Journal of Forensic Science. Vol. 23, No. 1.. 1978, pp 78-83.
[381 Bryce, K.L., Stone, I.C., and Daugherty, K.E. "Analysis of Fire Debris by Nuclear Magnetic Resonance S~ectrosco~v." Journal of ~6rensic sctldnce. Vol. 26., No. 4., 1981, pp 678485.
[391 Armstrong, A.T., and Wittkower, RS. "Identification of Accelerants in Fire Residues by Capillary Column Gas Chromatography." Journal of Forensic Science. Vol. 23., No. 4., 1978, pp 662471.
[~OI Mach, M.H., "Gas Chromatography - Mass Spectromeny of Simulated Arson Residue Using Gasoline as an
-
Accelerant." Journal of Forensic Science. Vol. 22., No. 2., 1977, pp 348-357.
APPENDIX 1
CHROMATOGRAM OF THE INDUSTRIAL SOLVENTS
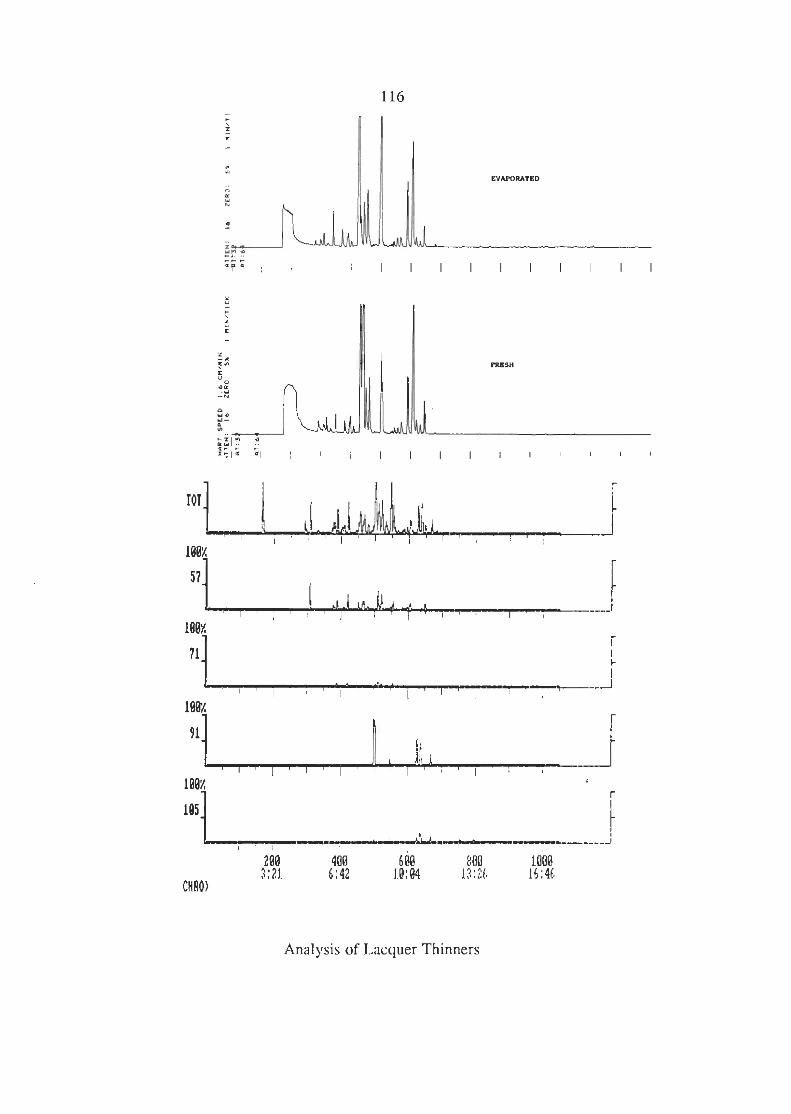
Analysis of Lacquer Thinners
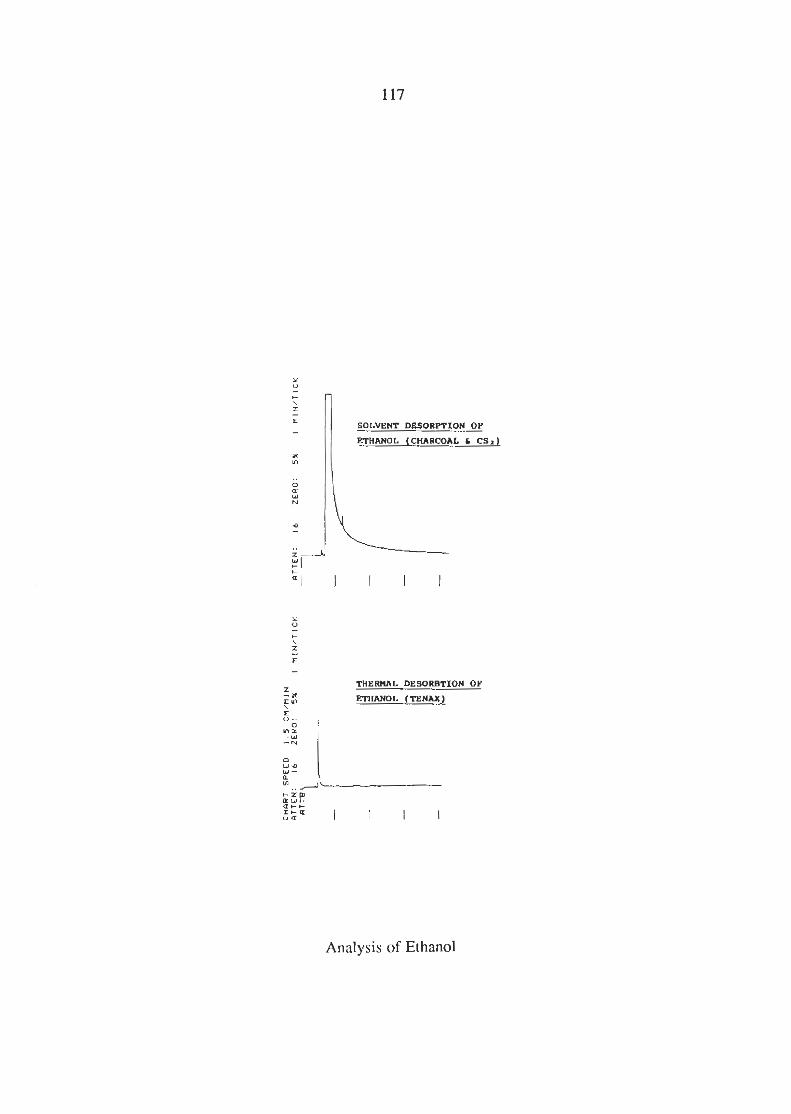
SOLVBWC DBSORPTIOU OF
ETHANOL (CHARCOAL L CS.1
Analysis of Ethanol
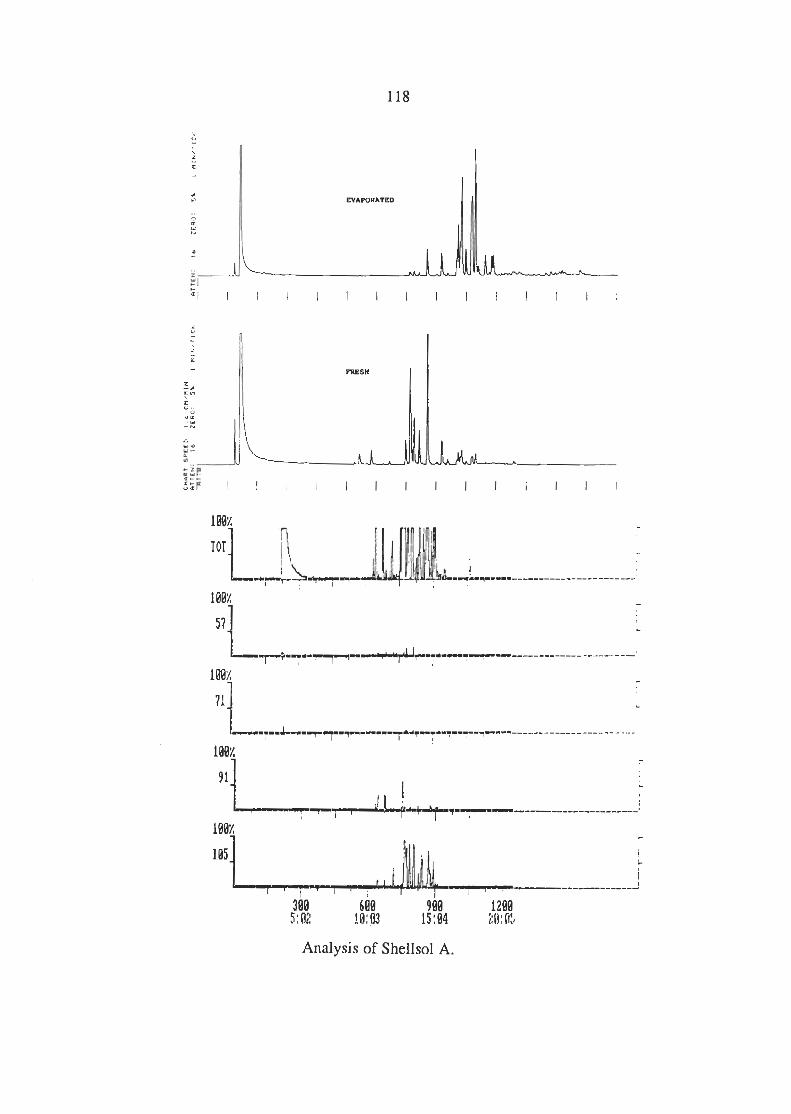
Analysis of Shellsol A.
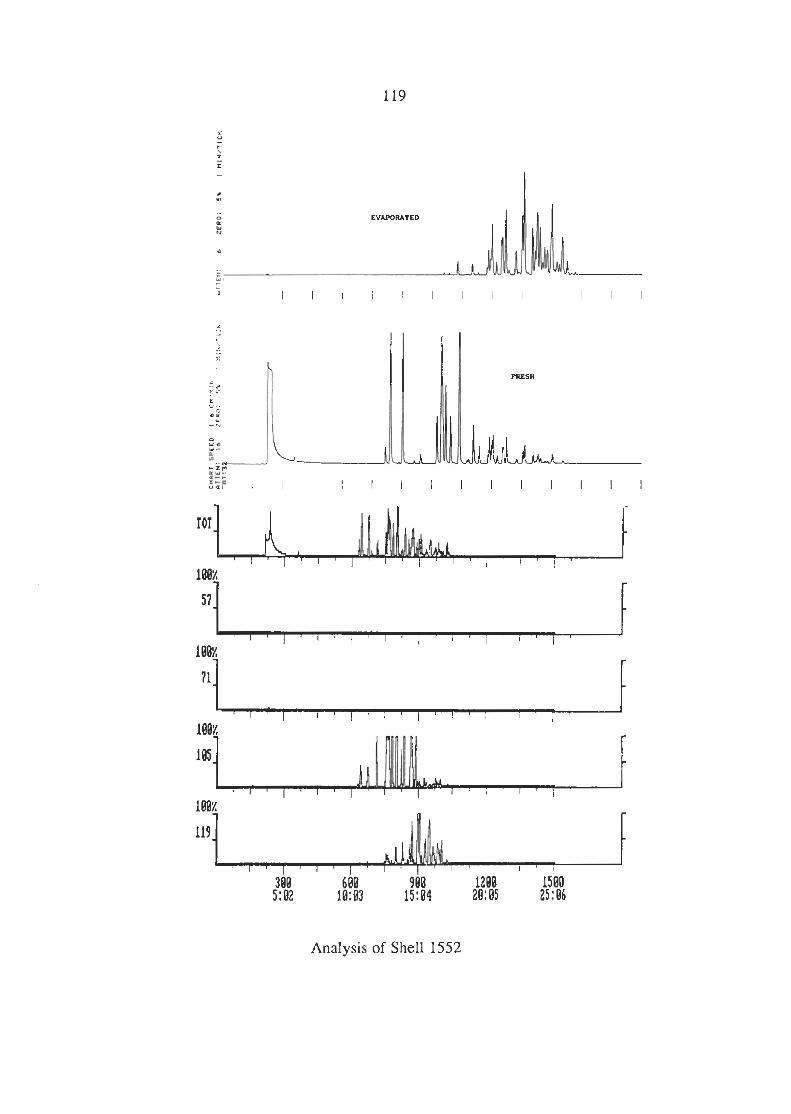
Analysis of Shell 1552
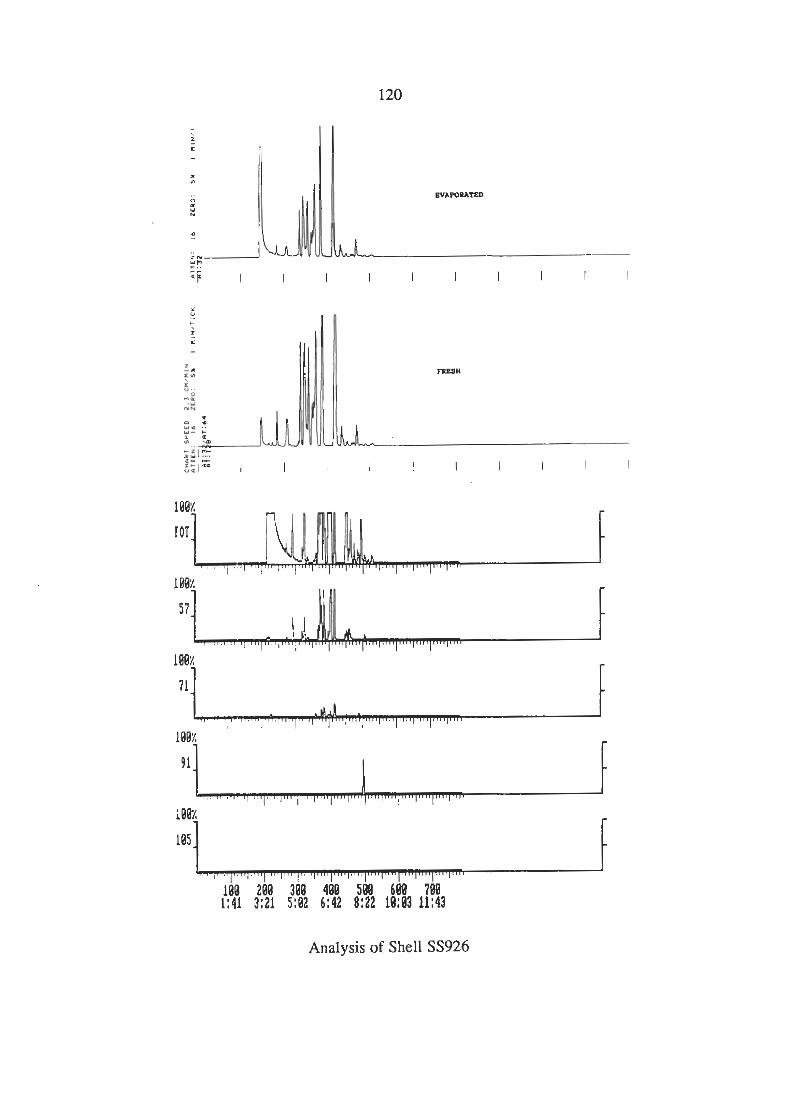
Analysis of Shell SS926
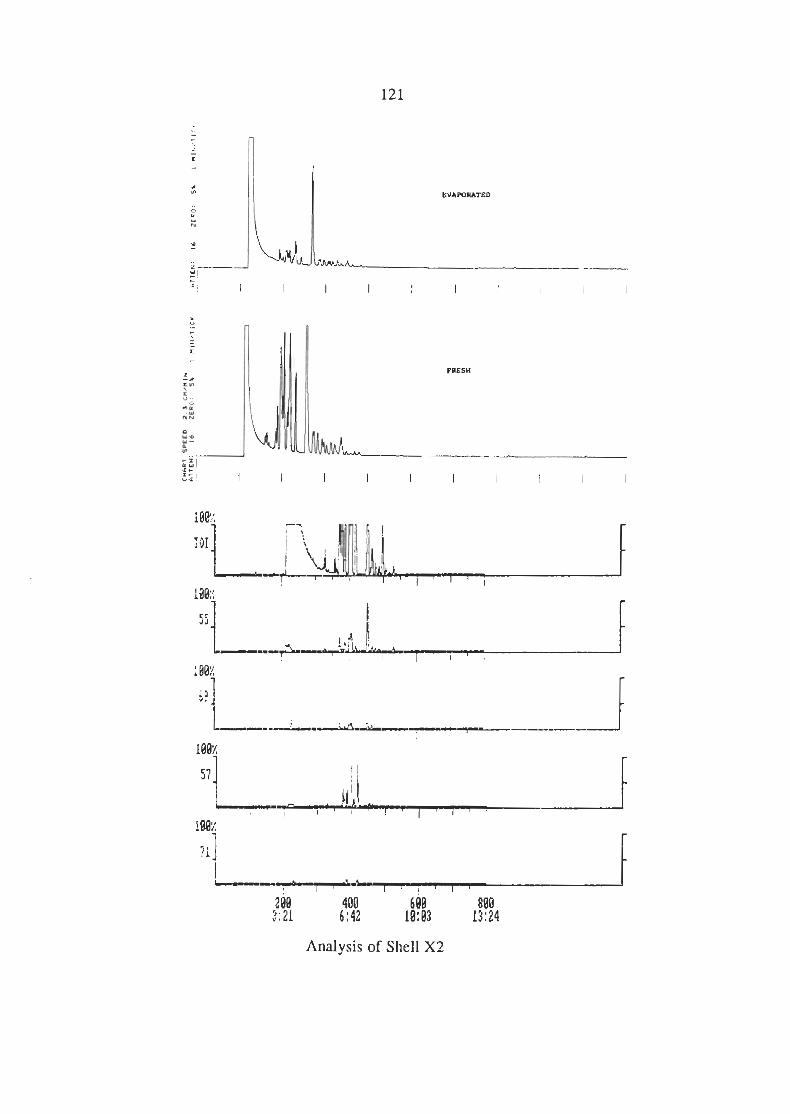
Analysis of Shell X2

ibronatograri C: X4 lcquind: JUN-17-1986 13:84:54 Cosnent : SHELL SOLUENT XI Stan Rioge: 1 - 600 Scan: 1 Int : B F 0:81 RIC: IBBL : 6559
l a b 1 r
Analysis of Shell X4
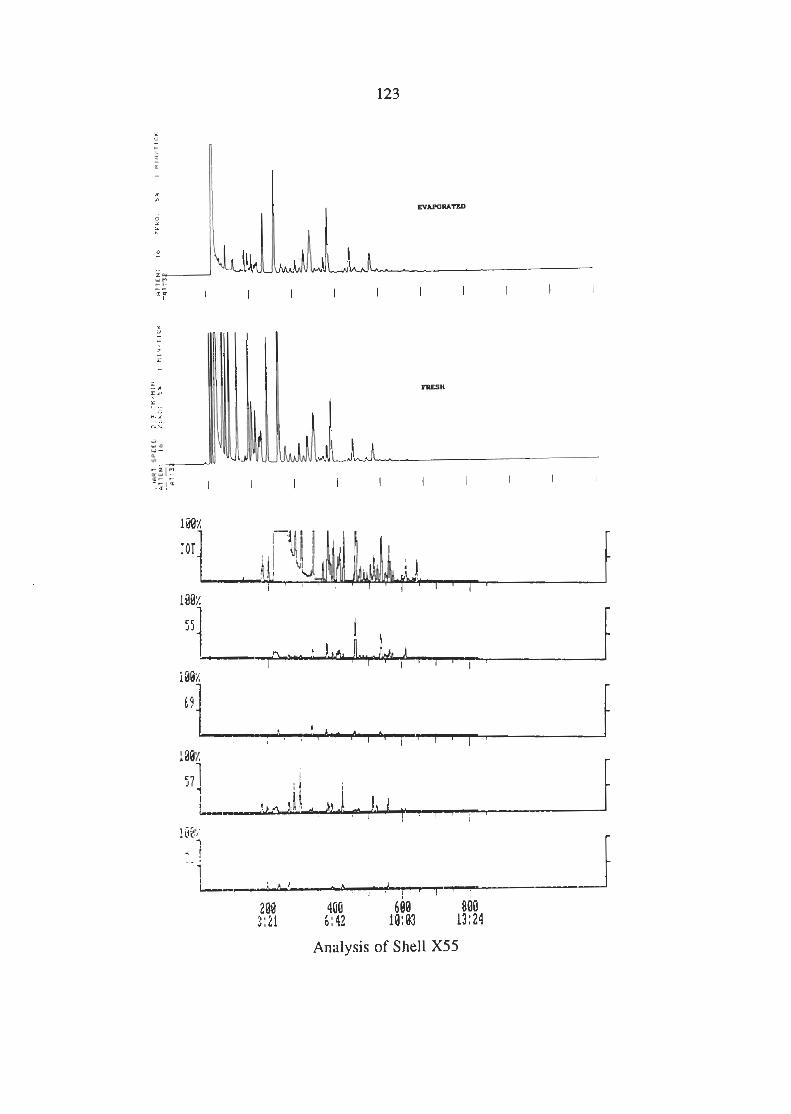
Analysis of Shell X55
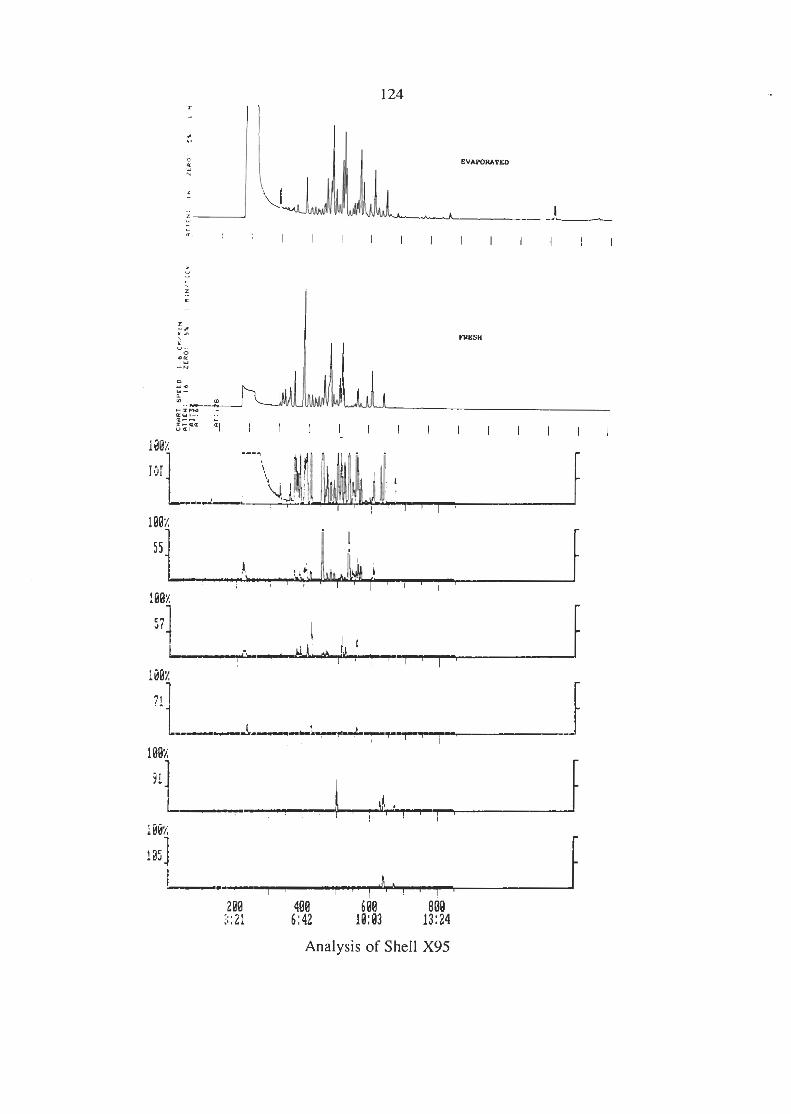
F
I aez - 7!.
I I 1 I - 1 " 1 1 '
1N& q ? , ,
-
iN&
1851
I 1 .
-
1 ' I ' I ' I ' I ' 200 400 6BB 888 :: 21 6 42 1k03 13:24
Analysis of Shell X95
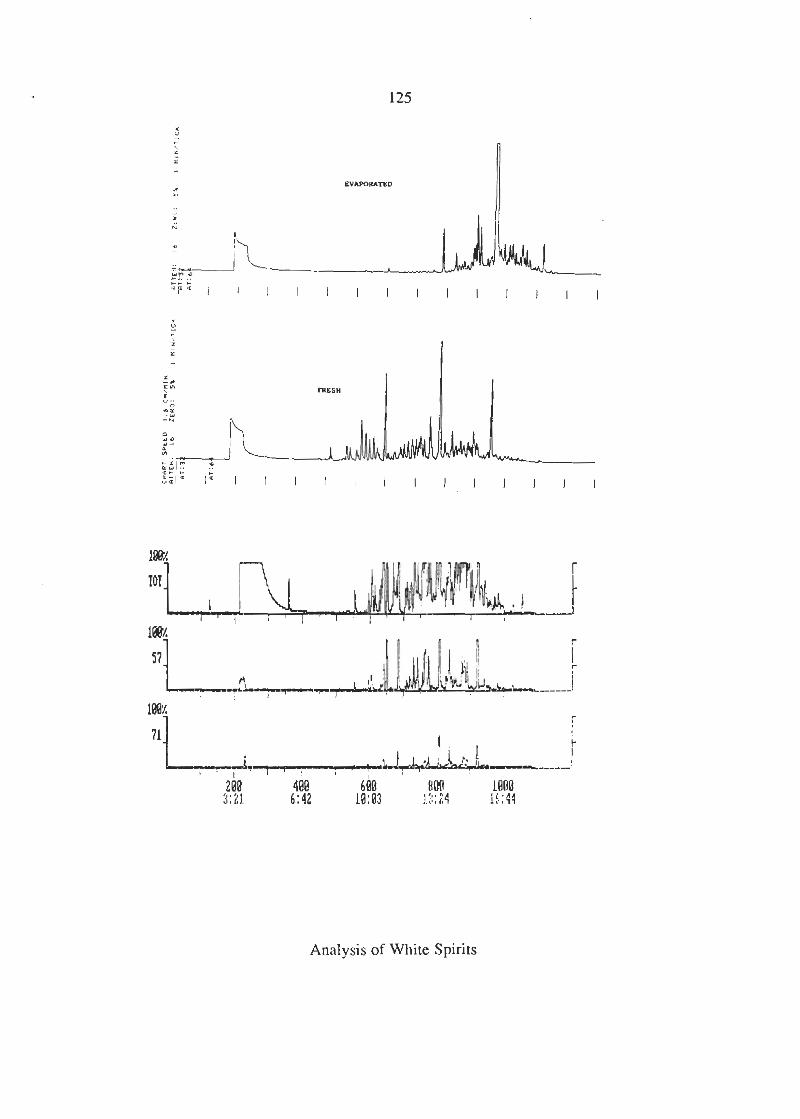
I
200 188 688 ROO 1000 I
3 : i J 6:42 1@:83 1,:;: ?4 1(:$4
Analysis of White Spirits
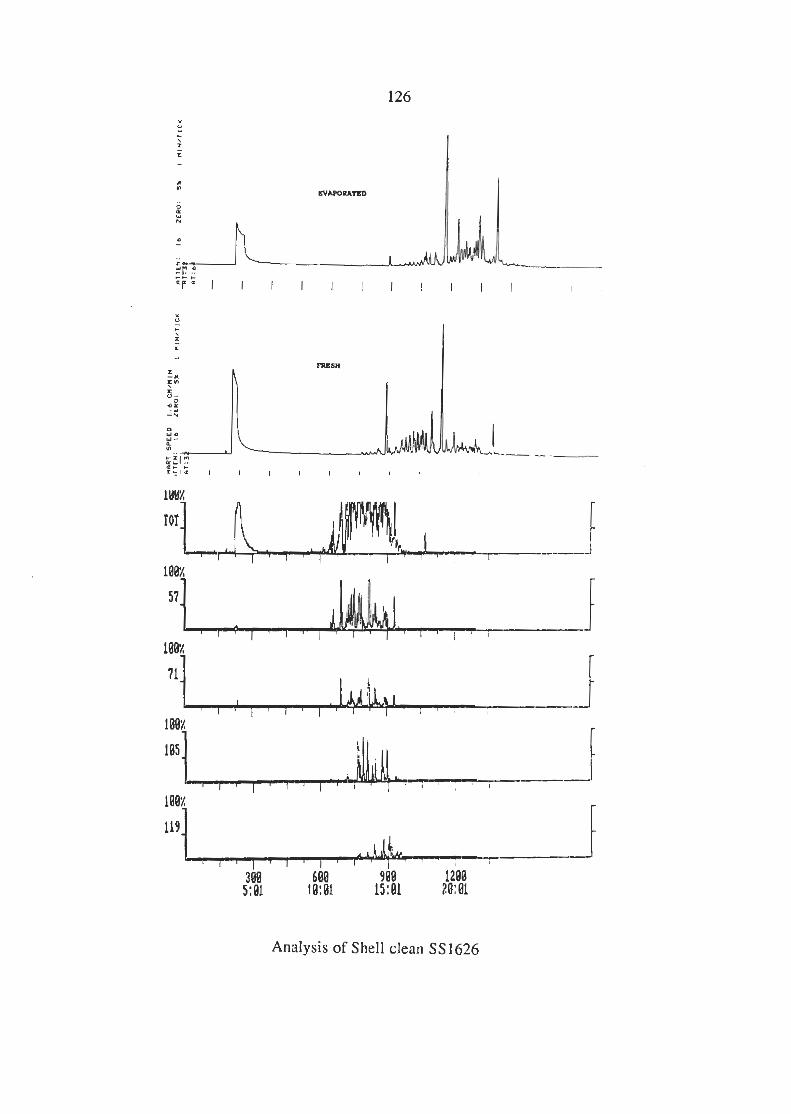
Analysis of Shell clean SS1626