Analysis Insights, August 2015: Sustainable Transportation … · · 2015-08-12ANALYSIS INSIGHTS...
8
NREL is a national laboratory of the U.S. Department of Energy, Office of Energy Efficiency and Renewable Energy, operated by the Alliance for Sustainable Energy, LLC. NREL/BR-6A20-64046 AUGUST 2015 ANALYSIS INSIGHTS SUSTAINABLE TRANSPORTATION Moving People and Goods in Ways that are Cleaner, Greener, Smarter
Transcript of Analysis Insights, August 2015: Sustainable Transportation … · · 2015-08-12ANALYSIS INSIGHTS...
NREL is a national laboratory of the U.S. Department of Energy, Office of Energy Efficiency and Renewable Energy, operated by the Alliance for Sustainable Energy, LLC.
NREL/BR-6A20-64046
AU G U S T 2 0 1 5A N A LY S I S I N S I G H T S
SUSTAINABLE TRANSPORTATIONMoving People and Goods in Ways that are Cleaner, Greener, Smarter

2 SUSTAINABLE TRANSPORTATION
Moving people and goods from point A to B has never been easier, but our current transportation systems also take a toll on our environment. Transportation currently accounts for 71% of total U.S. petroleum use and 33% of the nation’s total carbon emissions. With new technology, can we make our transportation system cleaner and more cost effective? NREL is applying its analytical expertise and imagination to do just that. Solutions start with systems thinking. Connecting the dots between physical components—vehicles, fueling stations, and highways—and institutional components—traffic laws, regulations, and vehicle standards—helps illuminate solutions that address the needs of the transportation system’s many stakeholders.
Our three-pronged strategy to reduce the carbon intensity of our transportation systems focuses on:
1. CLEANER FUELS: shifting to renewable alternatives can reduce carbon intensity of transportation fuels
2. GREENER VEHICLES: increasing vehicle efficiency through advanced combustion technologies and electrified drive trains can reduce energy intensity of transportation modes
3. SMARTER NETWORKS: planning for non-motorized transportation options and implementing “smart” technologies in the transportation infrastructure can improve transportation service while reducing vehicle miles traveled (VMT).
MOVING PEOPLE AND GOODS IN WAYS THAT ARE CLEANER, GREENER, SMARTER
A U G U S T 2 0 1 5A N A LY S I S I N S I G H T S
Figure 1. Combining clean fuels, greener vehicles, and smarter networks to reduce the CO2 emissions of the transportation sector.
Smart Cities
IntelligentHighways
RoadwayControl andReporting
Non-Motorized Alternatives
E�cientCombustion
Hybrid (ICE-Electric)
Plug-inElectric
Fuel Cell
LightweightMaterials
Greener Vehicles
Smarter Infrastructure Networks
Cleaner Fuels
Reduce CO2
EmissionsReduce
Petroleum Use
Technologies for each goal
(VMT/Person)
(Energy/VMT)
(C02 /E
nergy)
Biofuels
Hydrogen
Electricity
Increase E�ciency &
Electrification
Increase System
E�ciencies & Expand Alternatives
Redu
ce C
arbon - I
ntensity of Fuels
Goals for the future
Stakeholders impacted
Regulators
State & Local Governments
Policymakers
Federal Agencies
Environmental Organizations
Fleet Managers
Transportation Planners
Grid Operators
Vehicle Manufacturers
Drivers
Farmers/Forest Managers
Fuel Distributers
Oil & Gas Companies
Fuel Producers
Pipeline Operators
Commuters
Network (Road, Rails, Wire) Developers
Tra�c Managers
Urban Planners
FUTURE VISION FOR SUSTAINABLE TRANSPORTATION
3SUSTAINABLE TRANSPORTATION
Reimagining Transportation: Increased Mobility, Decreased Emissions and Petroleum Use
NREL works to diversify transportation energy sources to reduce petroleum consumption and promote U.S. energy security. The lab’s work to improve the sustainability of transportation systems supports U.S. efforts to reduce GHG emissions 80% below 2005 levels by 2050.
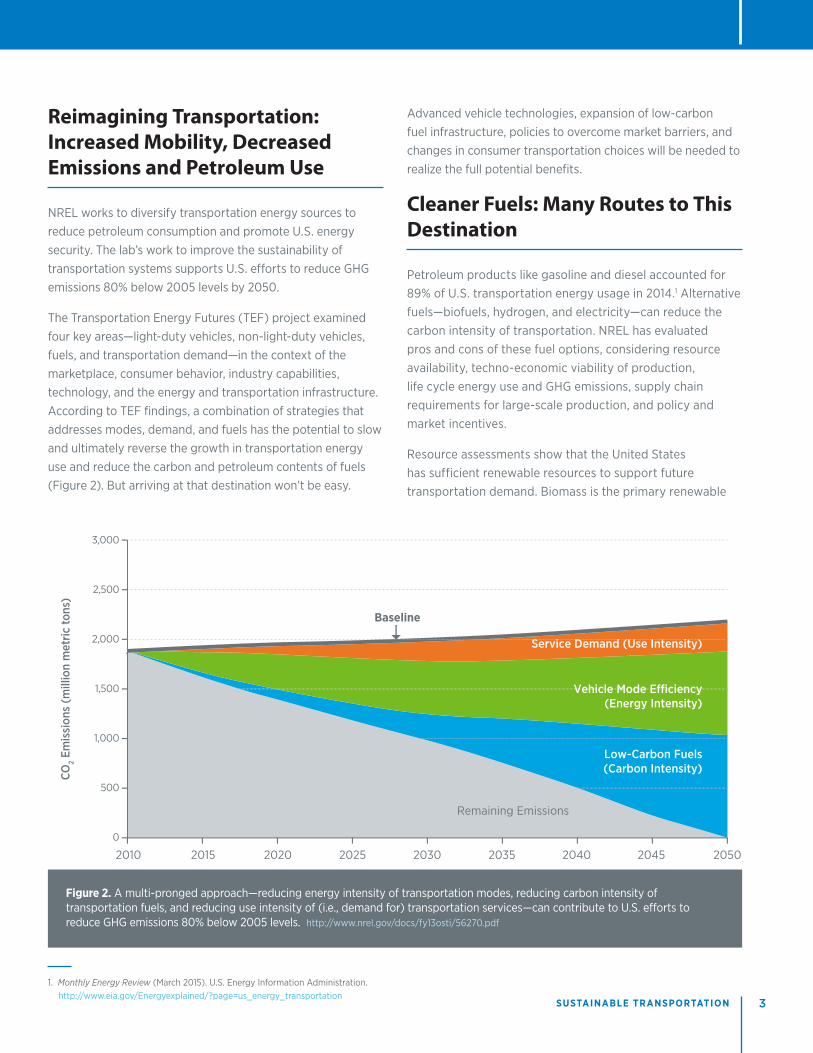
The Transportation Energy Futures (TEF) project examined four key areas—light-duty vehicles, non-light-duty vehicles, fuels, and transportation demand—in the context of the marketplace, consumer behavior, industry capabilities, technology, and the energy and transportation infrastructure. According to TEF findings, a combination of strategies that addresses modes, demand, and fuels has the potential to slow and ultimately reverse the growth in transportation energy use and reduce the carbon and petroleum contents of fuels (Figure 2). But arriving at that destination won’t be easy.
Advanced vehicle technologies, expansion of low-carbon fuel infrastructure, policies to overcome market barriers, and changes in consumer transportation choices will be needed to realize the full potential benefits.
Cleaner Fuels: Many Routes to This Destination
Petroleum products like gasoline and diesel accounted for 89% of U.S. transportation energy usage in 2014.1 Alternative fuels—biofuels, hydrogen, and electricity—can reduce the carbon intensity of transportation. NREL has evaluated pros and cons of these fuel options, considering resource availability, techno-economic viability of production, life cycle energy use and GHG emissions, supply chain requirements for large-scale production, and policy and market incentives.
Resource assessments show that the United States has sufficient renewable resources to support future transportation demand. Biomass is the primary renewable
Figure 2. A multi-pronged approach—reducing energy intensity of transportation modes, reducing carbon intensity of transportation fuels, and reducing use intensity of (i.e., demand for) transportation services—can contribute to U.S. efforts to reduce GHG emissions 80% below 2005 levels. http://www.nrel.gov/docs/fy13osti/56270.pdf
2,000
2,500
3,000
1,500
1,000
500
0
2010 2015 2020 2025 2030 2035 2040 2045 2050
CO2 E
mis
sion
s (m
illio
n m
etric
tons
)
Service Demand (Use Intensity)
Vehicle Mode E�ciency(Energy Intensity)
Low-Carbon Fuels(Carbon Intensity)
Remaining Emissions
Baseline
1. Monthly Energy Review (March 2015). U.S. Energy Information Administration. http://www.eia.gov/Energyexplained/?page=us_energy_transportation
4 SUSTAINABLE TRANSPORTATION
A U G U S T 2 0 1 5A N A LY S I S I N S I G H T S
resource that can be used to generate liquid fuels suitable for our existing vehicles and infrastructure, and today approximately 10% of all gasoline sold consists of biofuel in the form of ethanol. Although biofuel products and yields vary depending on the feedstock and conversion process, a number of NREL studies have shown that the U.S. potential biomass resource base of 1.3 billion tons is more than adequate to support the estimated future biofuel requirements for a wide range of scenarios. For example, forest resources alone could displace between 4% and 17% of 2011 U.S. annual highway diesel consumption of 36 billion gallons.2
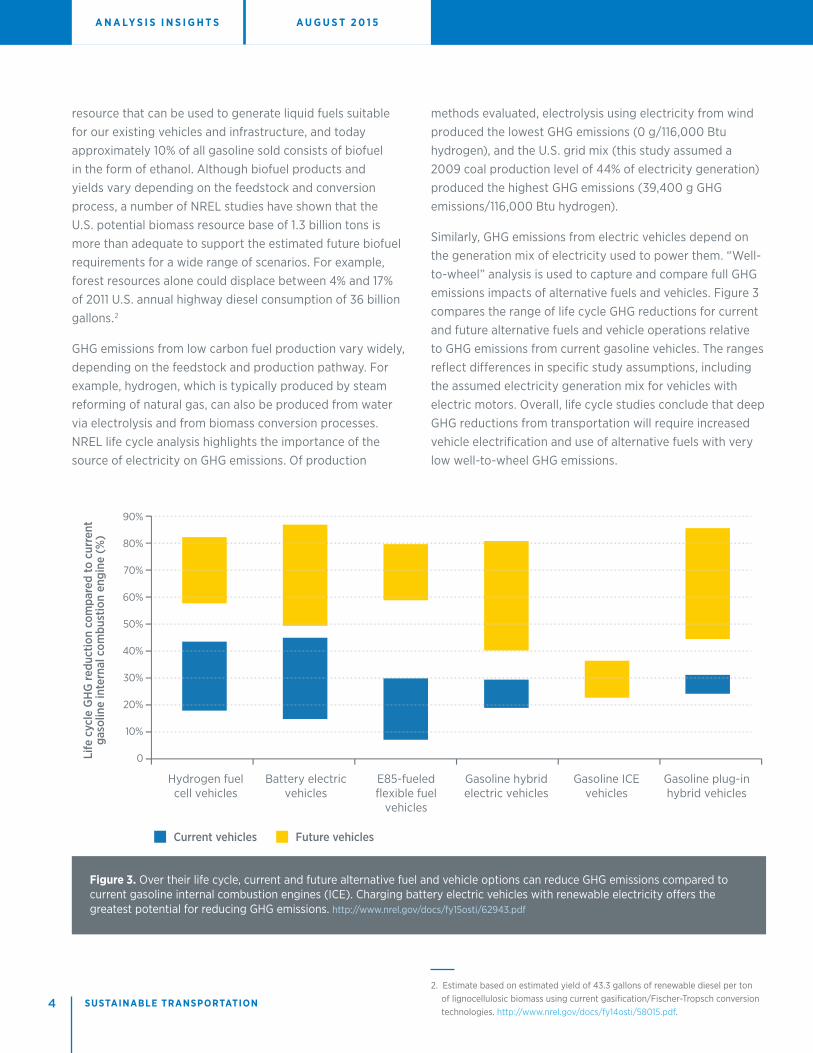
GHG emissions from low carbon fuel production vary widely, depending on the feedstock and production pathway. For example, hydrogen, which is typically produced by steam reforming of natural gas, can also be produced from water via electrolysis and from biomass conversion processes. NREL life cycle analysis highlights the importance of the source of electricity on GHG emissions. Of production
methods evaluated, electrolysis using electricity from wind produced the lowest GHG emissions (0 g/116,000 Btu hydrogen), and the U.S. grid mix (this study assumed a 2009 coal production level of 44% of electricity generation) produced the highest GHG emissions (39,400 g GHG emissions/116,000 Btu hydrogen).
Similarly, GHG emissions from electric vehicles depend on the generation mix of electricity used to power them. “Well-to-wheel” analysis is used to capture and compare full GHG emissions impacts of alternative fuels and vehicles. Figure 3 compares the range of life cycle GHG reductions for current and future alternative fuels and vehicle operations relative to GHG emissions from current gasoline vehicles. The ranges reflect differences in specific study assumptions, including the assumed electricity generation mix for vehicles with electric motors. Overall, life cycle studies conclude that deep GHG reductions from transportation will require increased vehicle electrification and use of alternative fuels with very low well-to-wheel GHG emissions.
0
10%
20%
30%
40%
50%
60%
70%
90%
80%
Current vehicles
Hydrogen fuel cell vehicles
Battery electric vehicles
E85-fueled flexible fuel
vehicles
Gasoline hybrid electric vehicles
Gasoline ICE vehicles
Gasoline plug-in hybrid vehicles
Future vehicles
Life
cyc
le G
HG
redu
ctio
n co
mpa
red
to c
urre
nt
gaso
line
inte
rnal
com
bust
ion
engi
ne (
%)
Figure 3. Over their life cycle, current and future alternative fuel and vehicle options can reduce GHG emissions compared to current gasoline internal combustion engines (ICE). Charging battery electric vehicles with renewable electricity offers the greatest potential for reducing GHG emissions. http://www.nrel.gov/docs/fy15osti/62943.pdf
2. Estimate based on estimated yield of 43.3 gallons of renewable diesel per ton of lignocellulosic biomass using current gasification/Fischer-Tropsch conversion technologies. http://www.nrel.gov/docs/fy14osti/58015.pdf.
5SUSTAINABLE TRANSPORTATION
Greener Vehicles: Co-Development of Vehicles and Infrastructure is Essential for Market Success
Cleaner fuels are only useful if there are vehicles to use them and infrastructure to distribute them. NREL is working to enable adoption of alternative fuel vehicles (AFVs)—powered by biofuels, hydrogen fuel cells, and electricity—by:
• Reducing initial vehicle costs, particularly for fuel cell electric vehicles (FCEVs), plug-in hybrid vehicles (PHEVs), and battery electric vehicles (BEVs)
• Supporting simultaneous deployment of refueling and recharging infrastructure
• Encouraging consumer acceptance of AFVs and refueling systems.
Reducing Initial Costs of Electric Vehicles
Full performance BEVs can cost more than their conventional vehicle counterparts, and the battery packs are a key driver of those costs (see If We Build It…). Several states see electric vehicles as a means of meeting clean air targets and are experimenting with financial incentives—rebates, tax credits, tax exemptions, and high occupancy vehicle lane access—to offset initial costs and encourage consumer adoption. NREL analysis of several such incentives found that, between Q1-2011 and Q1-2014, both tax incentives and prevalence of charging infrastructure are correlated with the number of BEV registrations. In addition, tax credits have a positive impact on BEV adoption and have promoted registration of 700 to 3,500 BEVs in the United States, resulting in an estimated annual abatement of 500 to 2,700 tons of carbon dioxide, since 2011.
Co-Deployment of Vehicles and Refueling Infrastructure
Conventional vehicles are served by an established and extensive fuel infrastructure. Adoption of alternative fuel vehicles and EVs can be encouraged by a comparably ubiquitous low carbon fuel infrastructure providing similar levels of cost, convenience, and reliability to a diverse set of end users who are dispersed across large geographic regions. Widespread deployment of alternative fuel vehicles
that cannot use gasoline or diesel, such as FCEVs or BEVs, will require simultaneous investments in fuel production, delivery, and retail refueling infrastructure.
Changing Consumer Behavior
The refueling choices of federal fleet drivers illustrate the critical role of consumer behavior change in deploying alternative fuel vehicles and expanding use of alternative fuels on a large scale. Over the last 20 years, government alternative fuel vehicle acquisition programs have been successful at deploying flexible fuel vehicles, which can run on gasoline and any blend of gasoline and ethanol, including E85, which contains 51%–83% ethanol. The Energy Policy Act of 2005 requires that all flexible fuel vehicles in the federal fleet use alternative fuels when they are available. But analysis of actual refueling behavior between 2008 and
I F W E B U I L D I T…
Manufacturing capacity for lithium-ion battery (LIB) cells—the core component of LIBs, which are the primary means of powering electric vehicles (EVs)—is heavily concentrated in East Asia. China, Japan, and Korea produce the majority of LIB cells for all applications, but the United States has established a foothold in automotive LIB cell production. The United States hosts 17% of global automotive LIB cell manufacturing capacity, the same market share as Korea.
The Clean Energy Manufacturing Analysis Center (CEMAC), operated by the Joint Institute for Strategic Energy Analysis, is looking at the battery manufacturing supply chain and the role the United States can play as the EV market matures and expands. CEMAC found that scale, yields, and factory utilization levels reduce automotive LIB manufacturing costs significantly and are critical to achieving cost-competitiveness with Asian manufacturers. Historical factors suggest that LIB production will remain concentrated in Asia, but CEMAC analysis indicates that the United States can compete in the growing automotive LIB market in certain circumstances, specifically given equivalent materials costs and 8% or lower cost of capital.
6 SUSTAINABLE TRANSPORTATION
A U G U S T 2 0 1 5A N A LY S I S I N S I G H T S
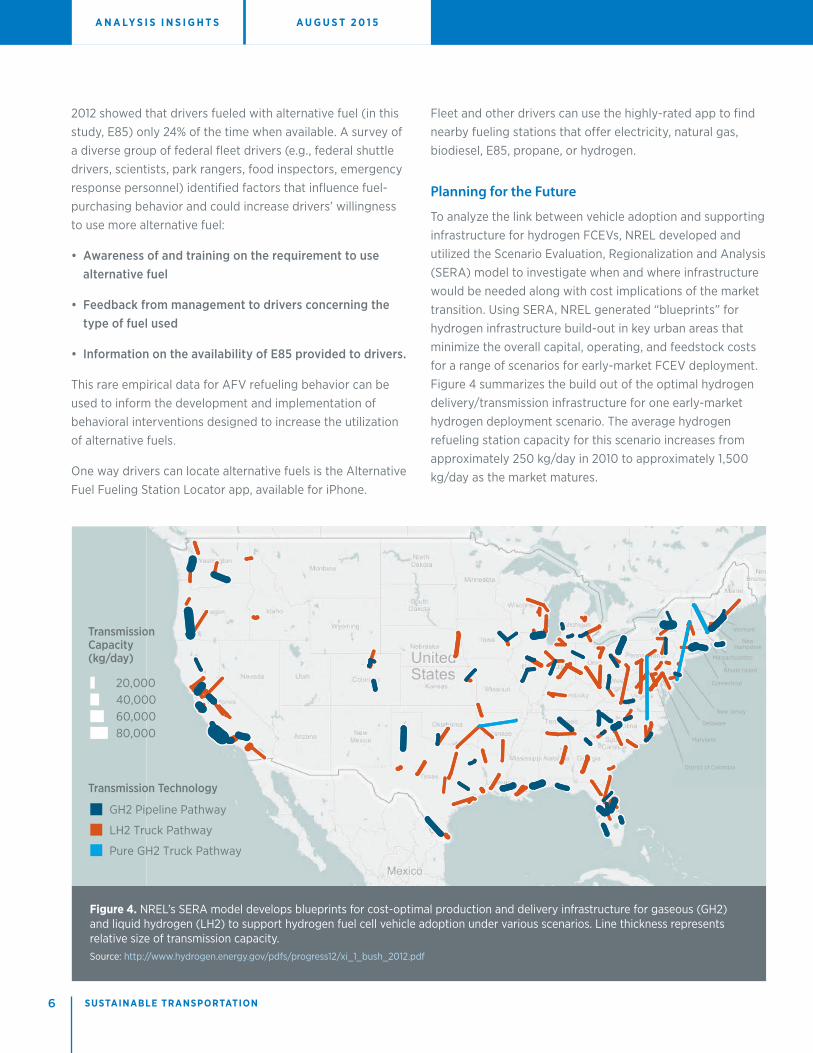
Figure 4. NREL’s SERA model develops blueprints for cost-optimal production and delivery infrastructure for gaseous (GH2) and liquid hydrogen (LH2) to support hydrogen fuel cell vehicle adoption under various scenarios. Line thickness represents relative size of transmission capacity. Source: http://www.hydrogen.energy.gov/pdfs/progress12/xi_1_bush_2012.pdf
2012 showed that drivers fueled with alternative fuel (in this study, E85) only 24% of the time when available. A survey of a diverse group of federal fleet drivers (e.g., federal shuttle drivers, scientists, park rangers, food inspectors, emergency response personnel) identified factors that influence fuel-purchasing behavior and could increase drivers’ willingness to use more alternative fuel:
• Awareness of and training on the requirement to use alternative fuel
• Feedback from management to drivers concerning the type of fuel used
• Information on the availability of E85 provided to drivers.
This rare empirical data for AFV refueling behavior can be used to inform the development and implementation of behavioral interventions designed to increase the utilization of alternative fuels.
One way drivers can locate alternative fuels is the Alternative Fuel Fueling Station Locator app, available for iPhone.
Fleet and other drivers can use the highly-rated app to find nearby fueling stations that offer electricity, natural gas, biodiesel, E85, propane, or hydrogen.
Planning for the Future
To analyze the link between vehicle adoption and supporting infrastructure for hydrogen FCEVs, NREL developed and utilized the Scenario Evaluation, Regionalization and Analysis (SERA) model to investigate when and where infrastructure would be needed along with cost implications of the market transition. Using SERA, NREL generated “blueprints” for hydrogen infrastructure build-out in key urban areas that minimize the overall capital, operating, and feedstock costs for a range of scenarios for early-market FCEV deployment. Figure 4 summarizes the build out of the optimal hydrogen delivery/transmission infrastructure for one early-market hydrogen deployment scenario. The average hydrogen refueling station capacity for this scenario increases from approximately 250 kg/day in 2010 to approximately 1,500 kg/day as the market matures.
Transmission Technology
GH2 Pipeline Pathway
20,00040,00060,00080,000
LH2 Truck Pathway
Pure GH2 Truck Pathway
TransmissionCapacity(kg/day)
Vermont
NewHampshire
Rhode Island
Massachusettes
Connecticut
New Jersey
Delaware
Maryland
District of Colombia
7SUSTAINABLE TRANSPORTATION
Traveling Smarter: Integrated Planning and New Technologies Can Improve Service and Reduce Demand
Technology and planning allow us to work smarter. They can help us travel smarter, too.
Many cities and local governments are already planning for smarter, more sustainable growth to reduce GHG emissions, promote economic growth, and improve quality of life. Common practices include higher density housing and communities, high-quality transit choices, and pedestrian and bicycle corridors. The combination of built environment practices like these have the potential to reduce national transportation energy use by up to 10% by 2050, according to the Transportation Energy Futures study.
NREL tools and toolkits are helping community leaders around the world plan for, implement, and monitor sustainable transportation projects. The transportation toolkit—developed by the Low Emission Development Strategies Global Partnership (LEDS GP) Transport Working Group—provides resources to help national and city leaders and urban planners develop and implement sustainable transportation initiatives. In addition, NREL’s PEV Readiness Scorecard, developed for DOE’s Clean Cities program, helps communities assess their readiness for plug-in electric vehicles and electric vehicle supply equipment. Available online at DOE’s Alternative Fuels Data Center, the scorecard ranks communities in categories like permitting processes for charging equipment installations, incentives and promotions, outreach, coordination with utilities, and infrastructure planning. The tool then provides customized recommendations, resources, and case studies to help communities raise their “readiness scores.”
Planning for the Future
Technologies and integrated networks that connect cars, power grids, and renewable energy sources complement planning efforts by allowing people to make smarter choices for transportation services. NREL studies potential impacts of some of these technologies, including fully automated self-driving vehicles and connected vehicles, which communicate with the driver, other cars on the road, or roadside infrastructure. The energy implications of connected and automated vehicles depend on how we use them.
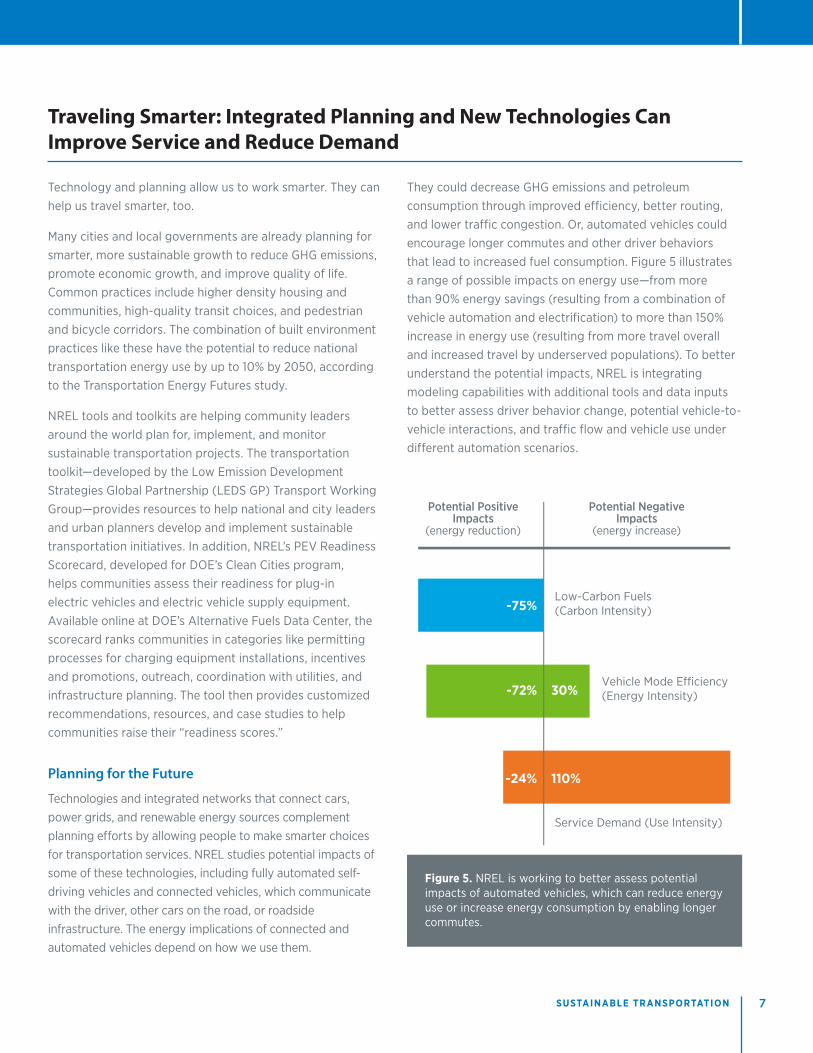
They could decrease GHG emissions and petroleum consumption through improved efficiency, better routing, and lower traffic congestion. Or, automated vehicles could encourage longer commutes and other driver behaviors that lead to increased fuel consumption. Figure 5 illustrates a range of possible impacts on energy use—from more than 90% energy savings (resulting from a combination of vehicle automation and electrification) to more than 150% increase in energy use (resulting from more travel overall and increased travel by underserved populations). To better understand the potential impacts, NREL is integrating modeling capabilities with additional tools and data inputs to better assess driver behavior change, potential vehicle-to-vehicle interactions, and traffic flow and vehicle use under different automation scenarios.
Figure 5. NREL is working to better assess potential impacts of automated vehicles, which can reduce energy use or increase energy consumption by enabling longer commutes.
Potential Positive Impacts
(energy reduction)
Potential NegativeImpacts
(energy increase)
-75%
-72% 30%
-24% 110%
Low-Carbon Fuels(Carbon Intensity)
Vehicle Mode E�ciency (Energy Intensity)
Service Demand (Use Intensity)
F I R S T Q U A R T E RA N A LY S I S I N S I G H T S A U G U S T 2 0 1 5A N A LY S I S I N S I G H T S
National Renewable Energy Laboratory15013 Denver West Parkway, Golden, CO 80401
303-275-3000 • www.nrel.gov
NREL is a national laboratory of the U.S. Department of Energy, Office of Energy Efficiency and Renewable Energy, operated by the Alliance for Sustainable Energy, LLC
Front page photo from Shutterstock (138040406) • NREL/BR-6A20-64046 • August 2015
NREL prints on paper that contains recycled content.
Pathways to Cleaner Transportation
NREL’s analysis is laying out pathways for deep reductions in transportation sector GHG emissions through a combination of cleaner fuels, greener vehicles, and smarter transportation networks.
GeneralSummary of Petroleum and Emissions Reductions TEF http://trb.metapress.com/content/gk34211p45447541/fulltext.pdf
Cleaner Fuels Connectivity and Convergence: Transportation for the 21st Century http://ieeexplore.ieee.org/xpl/articleDetails.jsp?arnumber=6841742
Feasibility of Producing and Using Biomass Based Diesel and Jet Fuel in the United States (2013) http://www.nrel.gov/docs/fy14osti/58015.pdf
Hydrogen Pathways: Updated Cost, Well-to-Wheels Energy Use, and Emissions for the Current Technology Status of Ten Hydrogen Production, Delivery, and Distribution Scenarios (2013) http://www.nrel.gov/docs/fy14osti/60528.pdf
Alt Fueling Station Maps: iTunes Alternative Fuel Fueling Station Locator App https://itunes.apple.com/us/app/alternative-fueling-station/id718577947
Energy Storage for Power Grids and Electric Transportation: A Technology Assessment http://www.fas.org/sgp/crs/misc/R42455.pdf
Transformative Reduction of Transportation Greenhouse Gas Emissions: Opportunities for Change in Technologies and Systems http://www.nrel.gov/docs/fy15osti/62943.pdf
Greener VehiclesRetail Infrastructure Costs Comparison for Hydrogen and Electricity for Light-Duty Vehicles: Preprint (2014) http://www.nrel.gov/docs/fy14osti/60944.pdf
Behavior: Refueling Behavior of Flexible Fuel Vehicle Drivers in the Federal Fleet (2014) http://www.nrel.gov/docs/fy14osti/61777.pdf
Automotive Lithium-ion Batteries and U.S. Supply Chain Considerations http://www.nrel.gov/docs/fy15osti/63354.pdf
Impact of Financial Incentives in Battery EV Market http://www.nrel.gov/docs/fy15osti/63263.pdf
Behavior: Transportation Energy Futures Series: Non-Cost Barriers to Consumer Adoption of New Light-Duty Vehicle Technologies (2013) http://www.nrel.gov/docs/fy13osti/55639.pdf
Vehicles, Fuels, and Fueling InfrastructureScenario Evaluation, Regionalization and Analysis (SERA) Model Progress Report http://www.hydrogen.energy.gov/pdfs/progress10/vii_1_bush.pdf
Transportation Energy Futures Series: Vehicle Technology Deployment Pathways: An Examination of Timing and Investment Constraints (2013) http://www.nrel.gov/docs/fy13osti/55638.pdf
Hydrogen Pathways: Updated Cost, Well-to-Wheels Energy Use, and Emissions (2013) http://www.nrel.gov/docs/fy14osti/60528.pdf
Alternative Fuel Infrastructure Expansion: Costs, Resources, Production Capacity, and Retail Availability for Low-Carbon Scenarios (Transportation Energy Futures Series) http://www.nrel.gov/docs/fy13osti/55640.pdf
Retail Infrastructure Costs Comparison for Hydrogen and Electricity for Light-Duty Vehicles http://www.nrel.gov/docs/fy14osti/60944.pdf
Refueling Behavior of Flexible Fuel Vehicle Drivers in the Federal Fleet http://www.nrel.gov/docs/fy14osti/61777.pdf
Alternative Fueling Station Locator iTunes app https://itunes.apple.com/us/app/alternative-fueling-station/id718577947
Smarter Infrastructure NetworkTransportation Energy Futures Series: Effects of Travel Reduction and Efficient Driving on Transportation: Energy Use and Greenhouse Gas Emissions (2013) http://www.nrel.gov/docs/fy13osti/55635.pdf
Connected and Automated Vehicles: Analysis of Possible Energy impacts of Automated Vehicle (2014) http://dx.doi.org/10.1007/978-3-319-05990-7_13
NREL Research and Thoughts on Connected and Automated Vehicle Energy Impacts (2014) http://www2.epa.gov/sites/production/files/2014-12/documents/gonder_120914.pdf
Modeling the Energy Use of a Connected and Automated Transportation System http://www.nrel.gov/docs/fy14osti/62454.pdf
LEDS Transportation Toolkit http://ledsgp.org/transport
Transportation Energy Futures Series: Effects of the Built Environment on Transportation: Energy Use, Greenhouse Gas Emissions, and Other Factors (2013) http://www.nrel.gov/docs/fy13osti/55634.pdf
Built Environment Analysis Tool: April 2013 http://www.nrel.gov/docs/fy13osti/58552.pdf
Built Environment Energy Analysis Tool Overview (Presentation) (2013) http://www.nrel.gov/docs/fy13osti/58101.pdf
PEV Readiness Scorecard https://www.afdc.energy.gov/pev-readiness