Analysis and Documentation of Progression of Fuchs Corneal ... · Analysis and Documentation of...
5
Analysis and Documentation of Progression of Fuchs Corneal Dystrophy With Retroillumination Photography John D. Gottsch, MD, Olof H. Sundin, MD, Erik V. Rencs, David G. Emmert, Walter J. Stark, MD, Clement J. Cheng, MD, and Gregory W. Schmidt, MD Purpose: Fuchs corneal dystrophy (FCD) is a degenerative disorder of the cornea that is characterized by the progressive accumulation of guttae, which are small excrescences of Descemet_s membrane. We describe a method for documenting the location and number of guttae, and ask whether disease progression can be observed during relatively short periods. Methods: Patients with FCD were imaged by standard retroillumina- tion photography with a slit lamp. Scanned photographs were analyzed by using NIH ImageJ software to determine the number of individual guttae and areas of confluence. Results: In 4 FCD patients, photographs taken 23 to 30 months apart revealed that, once formed, individual guttae and their relative positions persisted during this period. Very few guttae disappeared, and the emergence of many new guttae was observed. Determination of the area with confluent guttae was used to quantify disease stage. Conclusions: Computer-assisted analysis of retroillumination photographs is proposed as an effective way to document the number and distribution of individual guttae. Although the disease typically progresses slowly during decades, we have been able to detect the formation of new guttae within only 2 years. This rapid assessment of disease progression could be used to measure phenotypic differences between genetic subtypes of FCD. It also could provide important baseline information and methodology for clinical trials of therapeutic options, should these become available. (Cornea 2006;25:485Y489) I n Fuchs_ 1 initial description of the dystrophy that today bears his name, he noted a progressive disease of mostly elderly women with roughened epithelial changes. Vogt 2 described the characteristic early feature of the disease as posterior dew-drop-like excrescences, which he later termed guttae. 3 Graves 4 used slit-lamp observation of guttate to describe early accumulation of guttae in the central cornea, peripheral spread in advanced disease, and involvement of the endothelium. He also noted the benefit of retroillumination to demonstrate the extent of posterior corneal involvement. Graves observed 22 cases of Fuchs corneal dystrophy (FCD) during 22 and found that none of these progressed from early to late stages. Goar 5 followed 1 patient during a 4-year period and observed increases in clouding of the posterior cornea with a decrease in vision from 20/40 to 20/70. Krachmer et al 6 studied 64 families with FCD and was able to document that disease severity correlated with increased age of the patient. We have recently obtained similar results for 63 families with late-onset FCD. By using Krachmer_s grading scale, we found a distinct age-severity progression for a single, large family with inherited FCD caused by a mutation in the COL8A2 gene. Two members of this family were evaluated originally with early-stage disease in the 1970s and were found to have late-stage disease when re-examined 29 years later. Krachmer defined 5 grades of disease severity, based on the presence of 912 guttae for the first, with more advanced stages defined by the width of a central region of densely packed, confluent guttae, and distinguished from each other by the width, in millimeters, of this central region. Grade 4 was defined by a region of confluent guttae wider than 5 mm, and grade 5 was defined by further progression to stromal or epithelial edema. This scale has proven to be useful for demonstrating correlations between patient age and the stage of disease in relatively large groups, 6,7 with approximately 5 to 8 years between stages. However, the resolution of this method is not adequate to detect progression of FCD individual patients during short periods, such as 1 or 2 years. In this report, we use retroillumination photography and computer-assisted analysis to follow the persistence and formation of individual guttae. During a span as short as 17 months, we have detected disease progression in single patients. MATERIALS AND METHODS The study protocol was approved by the Joint Committee on Clinical Investigation at The Johns Hopkins University School of Medicine and was in accordance with the tenets of the Declaration of Helsinki. Written, informed consent was obtained from all study participants. Patients were recruited for study after initial evaluations of patients with FCD who presented to the Cornea Service at The Wilmer Ophthalmo- logical Institute. Patient recruitment and participation followed institutional review board-approved procedures. Photographic Documentation After pupillary dilation, patients were positioned for examination of the cornea with reflected light from the CASE REPORT Cornea & Volume 25, Number 4, May 2006 485 From the Center for Corneal Genetics, Cornea and External Disease Service, The Wilmer Eye Institute, The Johns Hopkins University School of Medicine, Baltimore, MD. Received for publication March 11, 2005; accepted June 10, 2005. Supported by the Ernest Hudson Research Fund. Reprints: John D. Gottsch, MD, The Wilmer Eye Institute, The Johns Hopkins Hospital, 600 N. Wolfe Street, Baltimore, MD 21287 (e-mail: [email protected]). Copyright * 2006 by Lippincott Williams & Wilkins Copyr ight © Lippincott Williams & Wilkins. Unauthor iz ed reproduction of this article is prohibited.
Transcript of Analysis and Documentation of Progression of Fuchs Corneal ... · Analysis and Documentation of...
Analysis and Documentation of Progression of FuchsCorneal Dystrophy With Retroillumination PhotographyJohn D. Gottsch, MD, Olof H. Sundin, MD, Erik V. Rencs, David G. Emmert, Walter J. Stark, MD,
Clement J. Cheng, MD, and Gregory W. Schmidt, MD
Purpose: Fuchs corneal dystrophy (FCD) is a degenerative disorder
of the cornea that is characterized by the progressive accumulation of
guttae, which are small excrescences of Descemet_s membrane. We
describe a method for documenting the location and number of
guttae, and ask whether disease progression can be observed during
relatively short periods.
Methods: Patients with FCD were imaged by standard retroillumina-
tion photography with a slit lamp. Scanned photographswere analyzed
by using NIH ImageJ software to determine the number of individual
guttae and areas of confluence.
Results: In 4 FCD patients, photographs taken 23 to 30 months apart
revealed that, once formed, individual guttae and their relative
positions persisted during this period. Very few guttae disappeared,
and the emergence of many new guttae was observed. Determination
of the area with confluent guttae was used to quantify disease stage.
Conclusions: Computer-assisted analysis of retroillumination
photographs is proposed as an effective way to document the number
and distribution of individual guttae. Although the disease typically
progresses slowly during decades, we have been able to detect the
formation of new guttae within only 2 years. This rapid assessment of
disease progression could be used to measure phenotypic differences
between genetic subtypes of FCD. It also could provide important
baseline information and methodology for clinical trials of
therapeutic options, should these become available.
(Cornea 2006;25:485Y489)
In Fuchs_1 initial description of the dystrophy that todaybears his name, he noted a progressive disease of mostly
elderly women with roughened epithelial changes. Vogt2
described the characteristic early feature of the disease asposterior dew-drop-like excrescences, which he later termedguttae.3 Graves4 used slit-lamp observation of guttate todescribe early accumulation of guttae in the central cornea,peripheral spread in advanced disease, and involvement of theendothelium. He also noted the benefit of retroillumination todemonstrate the extent of posterior corneal involvement.Graves observed 22 cases of Fuchs corneal dystrophy (FCD)
during 22 and found that none of these progressed fromearly to late stages. Goar5 followed 1 patient during a 4-yearperiod and observed increases in clouding of the posteriorcornea with a decrease in vision from 20/40 to 20/70.Krachmer et al6 studied 64 families with FCD and was able todocument that disease severity correlated with increased ageof the patient.
We have recently obtained similar results for 63families with late-onset FCD. By using Krachmer_s gradingscale, we found a distinct age-severity progression for asingle, large family with inherited FCD caused by a mutationin the COL8A2 gene. Two members of this family wereevaluated originally with early-stage disease in the 1970s andwere found to have late-stage disease when re-examined29 years later.
Krachmer defined 5 grades of disease severity, based onthe presence of 912 guttae for the first, with more advancedstages defined by the width of a central region of denselypacked, confluent guttae, and distinguished from each other bythe width, in millimeters, of this central region. Grade 4 wasdefined by a region of confluent guttae wider than 5 mm, andgrade 5 was defined by further progression to stromal orepithelial edema. This scale has proven to be useful fordemonstrating correlations between patient age and the stage ofdisease in relatively large groups,6,7 with approximately 5 to8 years between stages. However, the resolution of this methodis not adequate to detect progression of FCD individual patientsduring short periods, such as 1 or 2 years. In this report, we useretroillumination photography and computer-assisted analysisto follow the persistence and formation of individual guttae.During a span as short as 17 months, we have detected diseaseprogression in single patients.
MATERIALS AND METHODSThe study protocol was approved by the Joint Committee
on Clinical Investigation at The Johns Hopkins UniversitySchool ofMedicine andwas in accordancewith the tenets of theDeclaration of Helsinki. Written, informed consent wasobtained from all study participants. Patients were recruitedfor study after initial evaluations of patients with FCD whopresented to the Cornea Service at The Wilmer Ophthalmo-logical Institute. Patient recruitment and participation followedinstitutional review board-approved procedures.
Photographic DocumentationAfter pupillary dilation, patients were positioned for
examination of the cornea with reflected light from the
CASE REPORT
Cornea & Volume 25, Number 4, May 2006 485
From the Center for Corneal Genetics, Cornea and External Disease Service,The Wilmer Eye Institute, The Johns Hopkins University School ofMedicine, Baltimore, MD.
Received for publication March 11, 2005; accepted June 10, 2005.Supported by the Ernest Hudson Research Fund.Reprints: John D. Gottsch, MD, The Wilmer Eye Institute, The Johns
Hopkins Hospital, 600 N. Wolfe Street, Baltimore, MD 21287 (e-mail:[email protected]).
Copyright * 2006 by Lippincott Williams & Wilkins
Copyr ight © Lippincott Williams & Wilkins. Unauthorized reproduction of this article is prohibited.

fundus, in which the angle between the biomicroscope andthe illumination is small. The slit beam is removed as far aspossible from the field by means of an adjustment on the slitlamp.8 Guttae at the level of the endothelium scatter light andare readily visible (narrow arrow) as well as confluent guttae(thick arrow). Photographic documentation of both eyes wasobtained with retroillumination using a Zeiss photo slitlampcamera at 1.6� magnification. For each eye, 6 photographswere taken: 3 with the illumination beam from the right, and3 with the retroillumination beam from the left. Camerasettings included a magnification changer 12� with a 1.6tele-extender in front of the camera back. Flash power was720 watt per second and camera aperture was set at f44.Ektachrome 200 film was used and was processed normally.
Computer-assisted ManualPhotographic Analysis
Analysis of photographs was performed by scanningthe images with 12 to 16 bits per color with a full picturememory size of 35 megabytes per picture with 2� lineaveraging. The scanned illumination photograph werearchived as a JPEG image and analyzed with ImageJsoftware, a public domain Java image processing programby NIH image (http://rsb.info.nih.gov/ij). Using ImageJ, theraw JPEG image is color split. The illumination reflection ismostly in the blue and green splits and can be reduced.
RESULTS
Retroillumination PhotographyRetroillumination photography readily demonstrates
2 main pathologic features: individual, isolated guttae, andareas of coalescence of guttae or confluence (Fig. 1).Confluence is defined as the joining of 2 or more guttae
into a single structure, often with the appearance of a ridge orplateau. Early confluent areas are characterized by extensiveridges, which may be interspersed with individual guttae. Bylate-stage disease, the central confluent area has a finegrained, pock-marked quality, in which no individual,isolated guttae are visible.
ImageJ Analysis of Guttae and Confluent Areasin Photographs
Figure 2 shows how a retroillumination image wasimported into ImageJ, where it was processed to select the redcomponent, which decreased effects of the central reflection.The grayscale image was imported into ImageJ, and using thecrosshair tool, excrescences were marked from the peripheryto centrally. This was continued until all guttae were counted,or until those remaining were confluent, could no longer beindividually counted, and a boundary was established. Thearea within these boundary guttae was outlined by tracing afreehand curve. The number of individual guttae, their x and ycoordinates, and the circumscribed area were recorded (unitsin square pixels).
ImageJ calculated an area of 25,982 square pixels withinthe yellow curve, corresponding to 6.99 mm2 (Fig. 3D). Theconversion of image pixels to millimeters in the cornea wasdeduced from photographs of a 1-mm stage micrometer, whichspanned 61 pixels; 3,721 square pixels in the image
FIGURE 1. Retroillumination photograph. Thin arrow:individual guttae. Thick arrow: confluent guttae.Micrometer calibration gives widest (vertical) dimension ofdisk as 7.88 mm.
FIGURE 2. Example of computer-assisted analysis. A,Retroillumination photograph B, Color split to red, rendered ingrayscale. C, Individually marked guttae with crosshair tool.D, Area of confluent guttae are outlined with yellow curveusing the tracing tool.
Gottsch et al Cornea & Volume 25, Number 4, May 2006
486 * 2006 Lippincott Williams & Wilkins
Copyr ight © Lippincott Williams & Wilkins. Unauthorized reproduction of this article is prohibited.

corresponded to 1 mm2. Once the region of confluence hasbeen identified, this provides a rapid and objective means ofquantifying progression of the disease, which seems associatedwith defective endothelial cell function, which leads to cornealedema in late-stage disease.
Changes in Guttae Over TimeFive eyes of 4 patients with the pathology of FCD were
photographed in 2002 and 2004. Individual guttae weremarked on retroillumination photographs and compared(Fig. 4). In each pair of photographs, all guttata were foundat the same position at both the beginning and end of theperiod. With rare exceptions, there was no clear evidence toindicate that guttae were lost during this period or that theyshifted position relative to their neighbors. This excludesregions of lower photographic quality, in which noconclusions could be drawn. The appearance of new guttaecould be clearly demonstrated during the 2-year period in 3of 4 patients.
Figure 3A, D represents a pair of photographs taken29 months apart. Distinctive radial spokes from cataracts
are visible in the lower right quadrant. A rectangular regionwas selected in the 2002 photograph using patterns of guttaeat the corners and along the edges as landmarks. These samelandmarks were identified in the 2004 photograph andallowed us to redraw the rectangle over the same territory.There was approximately 2% distortion of the vertical andhorizontal dimensions, possibly an optical effect caused byslightly different position of the eye. Great persistence of thepattern of guttae allowed precise placement of the secondrectangle in the 2004 photograph (Fig. 3B, E). Marksindicating individual guttae were replaced with black circlesto indicate guttae that were observed in the correspondingphotographs (Fig. 3C, F). Most of these guttae appeared to besimilar in size. Many seem to be larger at the later date,although cannot be readily quantified.
Of special interest are the cases in which new guttaeappear in the 2004 photograph (green circles, Fig. 3F). In theanalysis of this region, there are 141 persistent or growingguttae and 14 new guttae. Some of these new guttae are quiteprominent (arrow Fig. 3F). In most cases, new guttae appearwithin the existing matrix of individual guttae and ridge-like
FIGURE 3. Constant and variable features ofguttae. FCD patient 1 at age 73 and at age 75.Retroillumination photographs taken29 months apart in 2002 and 2004.Anterior cortical spokes are noted in bothphotographs and serve as landmarks.Progression of guttae are noted at arrows. Theblue circle in C may represent a gutta that hasregressed, cell debris, or some other feature.
Cornea & Volume 25, Number 4, May 2006 Progression of Fuchs Dystrophy
* 2006 Lippincott Williams & Wilkins 487
Copyr ight © Lippincott Williams & Wilkins. Unauthorized reproduction of this article is prohibited.
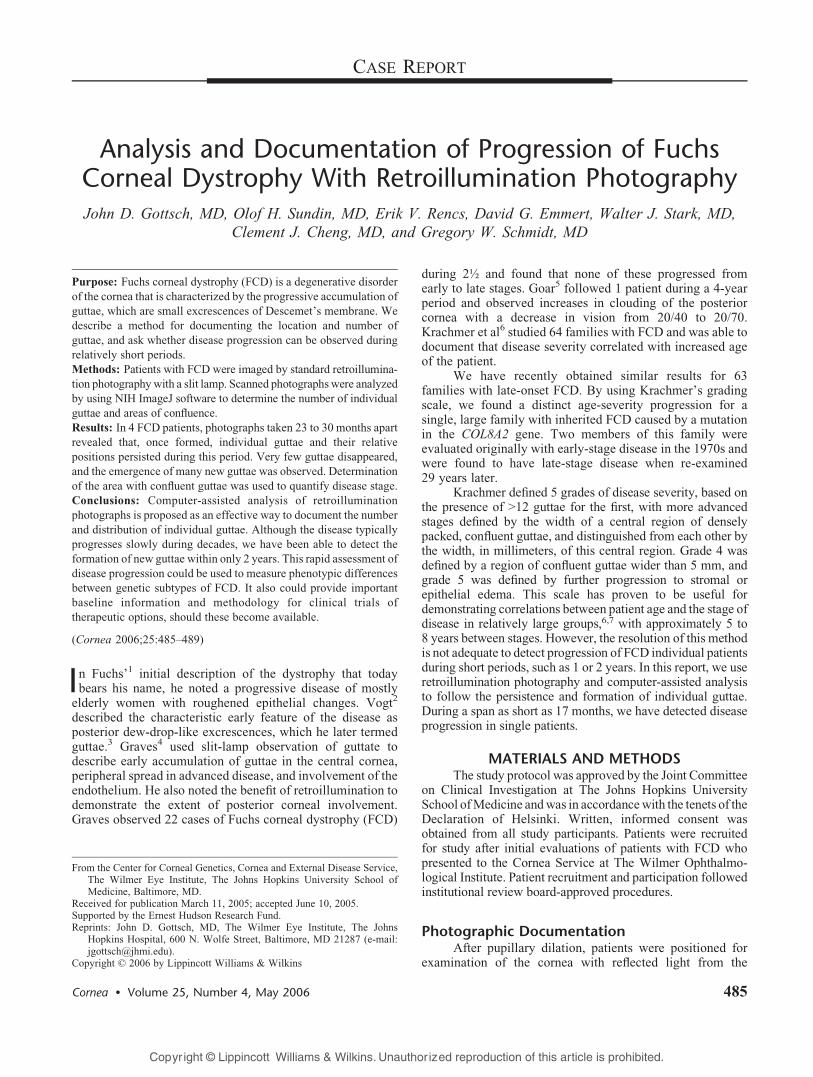
extensions of early confluent guttae. This makes sense interms of ultimate progression of FCD pathology in theposterior cornea toward large regions of densely packedguttae. For this particular region, we observe an approxi-mately 10% increase in the number of guttae during29 months.
DISCUSSIONAs Graves noted more than 75 years ago,4 retro-
illumination slit-lamp observation can provide an excellentview of the extent of guttate changes in a cornea. Wedemonstrate that photographs of the posterior cornea, whichshow individual and confluent guttae, can be readily archived.Later these photographs can be analyzed in different ways toobserve the progression of FCD pathology. Computer-assistedanalysis of retroillumination photographs of FCD may be ofbenefit to readily determine quantitative progression whensuccessive photographs are taken of the same cornea. Theability to follow increases in the number of guttae and the areaof confluence should lead to better understanding of the naturalhistory of the disease.
Currently, we have an incomplete understanding ofthe age of onset and rate of progression of this disease.There are good reasons to believe that yearly examina-tions will provide insight into a number of features of
disease progression, some of which may vary for differentgenes and mutations. Our preliminary studies of the age-severity distribution of patients with adult-onset FCDsuggests an average rate of progression of approximately10 years from early disease to severe mid-stage disease.7
It is important to have a detailed and objective record ofphenotype to reliably identify effects of mutations thatare distinctive to particular genes and to identifyphenotypic variations associated with different mutationsin the same gene. For example, we already have evidencethat a COL8A2 mutation has guttae with a distinctlydifferent phenotype from that of adult-onset disease.7
Such basic phenotypic information represents the down-stream effect of each gene mutation in the disease. It isimportant to capture and record this information as partof initial genetic studies, although the significance ofthese details may not be fully realized until much later.
It is possible that the conception of a steady progressionof FCD is incorrect, and that guttae increase in an episodicfashion. In this case, guttae might be expected to show little orno change during several years and increase suddenly,perhaps in response to environmental factors or aqueoussubstrate levels. On the basis of our observations, neither ofthese models can be excluded. A generally held concept isthat guttae are indelible pathologic features that form andremain static or increase in size during the years. Our
FIGURE 4. New guttae in FCD patients. AYD, Other eye of patient 1 in Figure 3, age 75 years, 29-month interval. EYH, Patient 2, age69 years, 30-month interval. IYL, Patient 3, age 53 years, 30-month interval. MYP, Patient 4, age 75 years, 23-month interval.First 2 columns: 2002 images. Last 2 columns: 2004 images. Region analyzed is marked with a black rectangle. Black arrowsindicate new guttae. White arrows indicate earlier sites corresponding to these new guttae. In patient 4, no new guttaewere observed.
Gottsch et al Cornea & Volume 25, Number 4, May 2006
488 * 2006 Lippincott Williams & Wilkins
Copyr ight © Lippincott Williams & Wilkins. Unauthorized reproduction of this article is prohibited.

evidence from all 4 patients strongly supports this precon-ception. However, it is important to realize that this needs tobe evaluated further in long-term studies. In the small regionexamined in Figure 3, all except for 1 of 141 guttae persisted,and 14 new guttae appeared after 29 months. Although this isconsistent with a gradual progression, it is not known whetherthe rate will be more rapid or slower during an extendedhistory of this region. The fact that we could not findevidence of progression in patient 4 (Fig. 4MYP) opens thepossibility that the number of guttae can remain in apparentstasis for almost 2 years. A difficulty with advanced cases andhighly confluent regions of the cornea is that detecting newguttae, if they occur, is difficult. Earlier stages of the diseaseshould prove to be more amenable to the documentation ofindividual new guttae.
Finally, in all 5 eyes, we observed a tendency of thesuperior cornea to be relatively free of guttae, whereas theinferior cornea is almost completely filled with confluentguttae. Although the numbers are too small to draw generalconclusion, the observation is striking and may be documentedfurther using these methods. If it can be shown that thesuperior cornea is more resistant to FCD pathology,investigation of environmental factors, such as light expo-sure, may be warranted.
A practical rationale for beginning a prospective studyand for developing more quantitative methods for followingdisease progression is that there are currently no adequate
data to counsel patients on how quickly FCD is likely toprogress and how likely a transplant will be needed in thefuture if the disease is left to its natural course. A studyinvolving photographic documentation will enable theexploration of some basic issues of disease progression anddisease prognosis. The natural progression of FCD would beimportant baseline information if therapeutic options becomeavailable and efficacy is to be determined.
REFERENCES1. Fuchs E. Dystrophia epithelialis corneae Graefes. Albrecht von Graefes
Arch Klin Exp Ophthalmol. 1910;76:478Y508.2. Vogt A. Weitere Ergebnisse der Spaltlampenmikroskopie des vordern
Bulbusabschnittes. Albrecht von Graefes Arch Ophthalmol.1921;106:63Y113.
3. Vogt A. Lehrbuch und Atlas der Spaltlampenmikroskopie des lebendenAuges. 1930;1:99.
4. Graves B. A bilateral chronic affection of the endothelial face of thecornea of elderly persons with an account of the technical and clinicalprinciples of its slit-lamp observation. Br J Ophthalmol. 1924;8:502Y544.
5. Goar EL. Dystrophy of the corneal endothelium (Cornea guttae) Withreport of a histological examination. Am J Ophthalmol. 1934;17:215Y221.
6. Krachmer JH, Purcell JJ Jr, Young CW, et al. Corneal endothelialdystrophy. A study of 64 families. Arch Ophthalmol. 1978;96:2036Y2039.
7. Gottsch JD, Sundin OH, Liu SH, et al. Inheritance of a novel COL8A2mutation defines a distinct subtype of Fuchs corneal distrophy.Investig Ophthalmol Vis Sci. 2005;46:1934Y1939.
8. Schmidt TAF On slit lamp biomicroscopy. Doc Ophthalmol.1975;39:117Y153.
Cornea & Volume 25, Number 4, May 2006 Progression of Fuchs Dystrophy
* 2006 Lippincott Williams & Wilkins 489
Copyr ight © Lippincott Williams & Wilkins. Unauthorized reproduction of this article is prohibited.


![REVIEW: Current understanding of the pathogenesis of Fuchs ... · 121700) and posterior polymorphous corneal dystrophy (PPCD, OMIM: 122000) [47,48]. Therefore, it is convenient to](https://static.fdocuments.net/doc/165x107/5f3d70ea18296274994cc8dc/review-current-understanding-of-the-pathogenesis-of-fuchs-121700-and-posterior.jpg)