Analysis and Design of Electoral Systems · Mathematisches Forschungsinstitut Oberwolfach Report...
50
Mathematisches Forschungsinstitut Oberwolfach Report No. 14/2004 Analysis and Design of Electoral Systems Organised by Michel L. Balinski (Paris) Steven J. Brams (New York) Friedrich Pukelsheim (Augsburg) March 7th – March 13th, 2004 Introduction by the Organisers Electoral systems transform numbers into numbers. In order not to be blinded by the intricacies of any particular case, as interesting as particular cases may be, it is imperative to view theses transformations as functions, or as relations, and to study their properties and structure in their full generality. Promoting the mathematical foundations of the topic cannot be a goal in and for itself, but must reflect the practical needs defined by the problems themselves that are tra- ditionally treated by such non-mathematical fields as political science, economics, social choice theory, constitutional law, etc. This diversity was well reflected in the expert fields represented by the conference participants, as well as in the wide range of topics covered. They may broadly be summarized under three headings: (1) voting schemes that aggregate many individual preference rankings of a given set of alternatives into a single global ranking; (2) proportional representation schemes that map vote counts (or population counts) into parliamentary repre- sentation; and (3) the determination of electoral districts that reasonably reflect geographical, political, and social structures.While mathematics at large provides the appropriate language to investigate these problems, the tools that are used draw on specific mathematical fields, including: • discrete mathematics, in that preference rankings are (usually) partial orderings or permutations; • combinatorial optimization, when finitely many units are assigned in a accordance with some optimality criterion;
Transcript of Analysis and Design of Electoral Systems · Mathematisches Forschungsinstitut Oberwolfach Report...

Mathematisches Forschungsinstitut Oberwolfach
Report No. 14/2004
Analysis and Design of Electoral SystemsOrganised by
Michel L. Balinski (Paris)Steven J. Brams (New York)
Friedrich Pukelsheim (Augsburg)
March 7th – March 13th, 2004
Introduction by the Organisers
Electoral systems transform numbers into numbers. In order not to be blindedby the intricacies of any particular case, as interesting as particular cases maybe, it is imperative to view theses transformations as functions, or as relations,and to study their properties and structure in their full generality. Promotingthe mathematical foundations of the topic cannot be a goal in and for itself, butmust reflect the practical needs defined by the problems themselves that are tra-ditionally treated by such non-mathematical fields as political science, economics,social choice theory, constitutional law, etc. This diversity was well reflected inthe expert fields represented by the conference participants, as well as in the widerange of topics covered. They may broadly be summarized under three headings:(1) voting schemes that aggregate many individual preference rankings of a givenset of alternatives into a single global ranking; (2) proportional representationschemes that map vote counts (or population counts) into parliamentary repre-sentation; and (3) the determination of electoral districts that reasonably reflectgeographical, political, and social structures.While mathematics at large providesthe appropriate language to investigate these problems, the tools that are useddraw on specific mathematical fields, including:
• discrete mathematics, in that preference rankings are (usually) partialorderings or permutations;
• combinatorial optimization, when finitely many units are assigned in aaccordance with some optimality criterion;

724 Oberwolfach Report 14/2004
• stochastics, where weights that are virtually continuous (proportions ofvotes) are to be approximated by weights that are intrinsically discrete(numbers of seats); and
• geometry, identifying the intricacies of voting with the symmetry structureof permutation groups, and with the geometry of the probability simplex.
The mathematical analysis of electoral systems has direct repercussions on currentpolitical issues. To mention but three, there is the question whether elections ofthe US president would be less likely to be disputed, and their outcomes consid-ered more legitimate, were he to be elected directly. Another is the analysis ofqualified majority rules in the EU Council of Ministers as stipulated in the draftconstitution proposed by the European Convention 2003. A third relates to devel-oping biproportional apportionment methods that simultaneously accommodatepartisan and regional representation of the entire electorate.
Somewhat unusual for an Oberwolfach conference was the rather broad mix ofparticipants, representing the fields of mathematics, physics, economics, politicalscience, and psychology. It was this breadth that virtually all participants expe-rienced as challenging and fruitful. As always, the atmosphere was congenial forscientific discussions, and the Institute in its Schwarzwald setting made people feelcreative by just being there . . . particularly so, since the sky was blue and the sunwas shining (most of the time).
M.L. BalinskiS.J. BramsF. Pukelsheim

Analysis and Design of Electoral Systems 725
Analysis and Design of Electoral Systems
Table of Contents
Paul EdelmanMeasuring Power in At-Large Representation . . . . . . . . . . . . . . . . . . . . . . . . . . . 727
Remzi Sanver (joint with Steven J. Brams)Voter Souvereignty . . . . . . . . . . . . . . . . . . . . . . . . . . . . . . . . . . . . . . . . . . . . . . . . . . . . . 728
Marc Kilgour (joint with Steven J. Brams and Remzi Sanver)A Minimax Procedure for Negotiating Multilateral Treaties . . . . . . . . . . . . . . 730
Victoriano RamırezFrom Principles of Representation to Electoral Methods . . . . . . . . . . . . . . . . . 732
Friedrich PukelsheimBAZI — A Java Program for Proportional Representation . . . . . . . . . . . . . . 735
Mathias Drton (joint with K. Schuster, F. Pukelsheim and N. R. Draper)Seat Biases of Apportionment Methods for Proportional Representation . . 737
Martin FehndrichNegative Weights of Votes and Overhang Seats in the German FederalElectoral Law . . . . . . . . . . . . . . . . . . . . . . . . . . . . . . . . . . . . . . . . . . . . . . . . . . . . . . . . . . 739
William ZwickerThe Role of the Mean and the Median in Social Choice Theory . . . . . . . . . . 741
Fuad AleskerovFormal Analysis of the Results of Elections . . . . . . . . . . . . . . . . . . . . . . . . . . . . . 742
Hannu NurmiProcedure-Dependence of Electoral Outcomes . . . . . . . . . . . . . . . . . . . . . . . . . . . . 744
Donald G. SaariThe Mathematical Source of Voting Paradoxes . . . . . . . . . . . . . . . . . . . . . . . . . . 745
Christian KlamlerOn the Closeness Aspect of Three Voting Rules: Borda, Copeland andMaximin . . . . . . . . . . . . . . . . . . . . . . . . . . . . . . . . . . . . . . . . . . . . . . . . . . . . . . . . . . . . . . 747
Thomas RatliffSelecting Committees Without Complete Preferences . . . . . . . . . . . . . . . . . . . . 749
Jack H. NagelA Question for Mathematicians: Would Disputed Elections Be(Sufficiently) Less Probable If U.S. Presidents Were Directly Elected? . . . 752
Vincent MerlinProbability Models for the Analysis of Voting Rules in a Federal Union . . 753
726 Oberwolfach Report 14/2004
Michel RegenwetterFoundations of Behavioral Social Choice Research . . . . . . . . . . . . . . . . . . . . . . . 754
Michel Balinski (joint with Mourad Baıou)Matchings and Allocations . . . . . . . . . . . . . . . . . . . . . . . . . . . . . . . . . . . . . . . . . . . . . 757
Moshe MachoverAnalysis of QM Rules in the Draft Constitution for Europe Proposedby the European Convention, 2003 . . . . . . . . . . . . . . . . . . . . . . . . . . . . . . . . . . . . . . 758
Werner KirschThe Treaty of Nice and the Council of Ministers: A MathematicalAnalysis of the Distribution of Power . . . . . . . . . . . . . . . . . . . . . . . . . . . . . . . . . . . 760
Thomas JahnkeAssignments of Seats as a Modelling Example in the Classroom of UpperSecondary Schools . . . . . . . . . . . . . . . . . . . . . . . . . . . . . . . . . . . . . . . . . . . . . . . . . . . . . 761
Bruno Simeone (joint with Isabella Lari and Frederica Ricca)A Weighted Voronoi Diagram Approach to Political Districting . . . . . . . . . . 764
Maurice SallesVoting in Social Choice Theory . . . . . . . . . . . . . . . . . . . . . . . . . . . . . . . . . . . . . . . . . 767
Steven J. Brams (joint with Todd R. Kaplan)Dividing the Indivisible: Procedures for Allocating Cabinet Ministries toPolitical Parties in a Parliamentary System . . . . . . . . . . . . . . . . . . . . . . . . . . . . 768
Analysis and Design of Electoral Systems 727
Abstracts
Measuring Power in At-Large RepresentationPaul Edelman
This talk presents a formal analysis of a voting game inspired by a common typeof local legislature: a legislative body in which some of the seats are allocatedby majority vote in equipopulous districts, and some of the seats are elected byan at-large majority vote. Such legislatures are common in city councils of largemetropolitan areas and county boards. For instance, the Metropolitan Council ofNashville and Davidson County in the state of Tennessee consists of 40 members,5 of whom are at-large and the remaining 35 are elected from separate districts.
The motivation for this study is the question of how to decide how many of eachtype of representative is optimal, given a fixed total number of representatives. Theanalysis will follow in the tradition of Banzhaf [1]. The legislature will be modelledby a weighted voting game and I will compute the power of an individual voter byusing the composition of this weighted voting game with the majority game in eachcomponent. It will be evident by symmetry that the actual Banzhaf power of eachvoter is identical, but the sum of the Banzhaf power over all of the voters, whatFelsenthal and Machover call the sensitivity (see [4, Def. 3.3.1]) of this compositegame, is maximized when the number of at-large representatives is the square-rootof the total number of representatives.
Two novel mathematical issues will arise in the analysis. In the composite gamethat I study, the underlying sets of players are not disjoint and the behaviour ofa player who appears multiple times can be different in different coordinates ofthe game. The usual definition of composition requires disjoint sets of players [5,XI.2.2] or at least that if the player sets are not disjoint then a player must behavethe same way in all coordinates [4, Definition 2.3.12]. To my knowledge there hasnot been a theoretical account of games without these requirements and so I willprovide one.
What is even more interesting is that even though there has not been a theo-retical account, results concerning the Banzhaf measure of such games have beenused. In New York Board of Estimate v. Morris, the U. S. Supreme Court con-siders (and ultimate rejects) a Banzhaf analysis of a composite game involvingthree at-large representatives and separate representatives for each borough [2, p.697]. Banzhaf has considered a districted presidential election game with similarfeatures. Even though in these two different situations the Banzhaf power wascomputed in similar ways, we will see that they are different types of games andperhaps require different measures.
In this talk I will concentrate solely on the game theoretic aspects of this result.In particular I will not enter the fray as to whether the Banzhaf measure is arealistic measure of power in a voting game. What this paper does show is thatthe Banzhaf measure provides a way to give a theoretical justification for a certainnumber of at-large representatives in a legislative body. I know of no other model

728 Oberwolfach Report 14/2004
that does so. In order to do this, a new theoretical account of composite games isrequired.
The results discussed in this talk have recently appeared [3].
References
[1] Banzhaf, J. F. III: Multi-member electoral districts — do they violate the “one man, onevote” principle. Yale L. J. 75 (1966), 1309–1338.
[2] Board of Estimate of City of New York et. al. v. Morris et. al. (1989), 489 US 688.[3] Edelman, Paul H.: Voting power and at-large representation. Math. Soc. Sci. 47 (2004),
219–232.[4] Felsenthal, D. S. and Machover, M.: The Measurement of Voting Power: Theory and
Practice, Problems and Paradoxes. Edward Elgar, Cheltenham 1998.[5] Owen, G.: Game Theory. 3rd ed., Academic Press, San Diego 1995.
Voter SouvereigntyRemzi Sanver
(joint work with Steven J. Brams)
The thesis of this paper is that several outcomes of single-winner elections may beacceptable. Perhaps the most dramatic recent example illustrating this propositionis the 2000 U.S. presidential election, in which George W. Bush won the electoralvote — disputed though it was in Florida — and Al Gore won the popular vote.To be sure, the extreme closeness of this election was unusual. But many elections,especially those with three or more candidates, may have more than one acceptableoutcome. For example, even when there is a Condorcet winner, who can defeatevery other candidate in pairwise contests, there may be a different Borda-countwinner, who on the average is ranked higher than a Condorcet winner. If there isno Condorcet winner because of cyclical majorities, the Condorcet cycle may bebroken at its weakest link to select the strongest candidate in the cycle, who neednot be the Borda winner.
That different voting systems can give different outcomes is, of course, an oldstory. The observation that different outcomes may satisfy different social-choicecriteria is also old hat (Nurmi, 1999, 2002, give many examples). What is new hereis our claim that in an election with three or more candidates, other outcomes —not just the Condorcet winner, the Borda-count winner, or the strongest candidatein a cycle — may be more acceptable to the electorate. In fact, even a Condorcetloser, who would lose in pairwise contests to every other candidate, may turn out tobe the most acceptable candidate. To justify this last statement, we need to definesome measure of “acceptability.” If voters rank candidates from best to worst,where they draw the line in their rankings between acceptable and unacceptablecandidates offers one such measure. It is precisely this information that is elicitedunder approval voting (AV), whereby voters can approve of as many candidates asthey like or consider acceptable. This gives them the opportunity to be sovereignby expressing their approval for any set of candidates, which no other voting system

Analysis and Design of Electoral Systems 729
permits1. Call a candidate a Pareto candidate if there is no other candidate thatall voters rank higher. We demonstrate that candidates selected under AV alwaysinclude at least one Pareto candidate. In fact, AV dominates so-called scoringsystems, including plurality voting (PV) and the Borda count (BC), with respectto the election of Pareto candidates: a Pareto candidate elected by a scoringsystem is always elected by AV for some sincere and admissible strategies, butnot vice versa. This is also true for ranking systems that do not rely on scoring,including the Hare system of single transferable vote (STV) and the majoritariancompromise (MC). But if AV does a better job of finding Pareto candidates, doesntit open the door to a plethora of possibilities? Isnt this a vice rather than a virtue,as some have argued (e.g., Saari and Van Newenhizen, 1988a; Saari, 1994, 2001)?2
This argument might have merit if the plethora of possibilities were haphazardchoices that could easily be upset when voters are manipulative. But we showthat AV often leads to Nash-equilibrium outcomes, from which voters with thesame preferences will have no incentive to depart. Moreover, if voters with differentpreferences are able to coordinate their choices and none has an incentive to depart,AV guarantees the election of a unique Condorcet winner (if one exists).
The latter notion of stability is that of a strong Nash equilibrium, which yieldsoutcomes that are invulnerable to departures by any set of voters. None of theother voting systems we assay guarantees that a unique Condorcet winner, andonly a Condorcet winner, will be a strong Nash equilibrium outcome when votersare sincere. While AV offers this guarantee, however, it also allows for other Nash-equilibrium outcomes, including even a Condorcet loser, who may be the mostacceptable candidate, even in equilibrium. In section 2, we define preferences andstrategies under AV and give an example that illustrates the choice of sincere,admissible strategies. In section 3 we characterize AV outcomes, describing the“critical strategy profile” that produces them, and compare these outcomes withthose given by other voting systems. Among other things, we show that no “fixedrule,” in which voters vote for a predetermined number of candidates, always electsa unique Condorcet winner, suggesting the need for a more flexible system. Thestability of outcomes under the different voting systems is analyzed in section4, where we show that Nash equilibria and strong Nash equilibria may vary fromsystem to system. Also, Condorcet voting systems, which guarantee the election ofCondorcet winners when voters are sincere, may not elect Condorcet candidates in
1Voter sovereignty should be distinguished from Arrow’s (1963) condition of “citizensovereignty,” whereby for any two alternatives a and b, if all voters prefer a to b, a cannotbe prohibited as the social choice. If voters are “sincere,” AV satisfies citizen sovereignty, be-
cause all voters who approve of b will also approve of a. Note that voter sovereignty describesthe behaviour of individual voters whereas citizen sovereignty is a property of a voting system.
2The critique of AV by Saari and Van Newenhizen (1988a) provoked an exchange betweenBrams, Fishburn, and Merrill (1988a, 1988b) and Saari and Van Newenhizen (1988b) overwhether the plethora of AV outcomes more reflected AVs “indeterminacy” (Saari and Van Newen-hizen) or its “responsiveness” (Brams, Merrill, and Fishburn); other critiques of AV are referencedin Brams and Fishburn (2003). Here we argue that which outcome is chosen should depend onvoters judgments about the acceptability of candidates rather than standard social-choice crite-ria, whichas we will show may clash with these judgments.

730 Oberwolfach Report 14/2004
equilibrium. In section 5 we show that rational departures by voters from unstableoutcomes under other voting systems may not induce AV outcomes, but rationaldepartures under AV always do. Hence, outcomes under AV form a closed set.
Nonstrong Nash equilibria might be thought of as possessing a kind of localstability, whereas strong Nash equilibria possess a global stability. These differentkinds of equilibria may coexist, which is to say that which stable outcome is chosenwill depend on which candidates voters consider acceptable and whether theycoordinate their choices. In large-scale public elections, coordination is typicallydone when voters draw inferences from polls, not by face-to-face communication,which is commonplace in smaller settings like committees. That a Condorcetcandidate is a globally stable choice under AV should not be surprising. What ismore surprising is that such a candidate can be upset if (i) coordination is difficultand (ii) many voters consider another candidate more acceptable.
Speaking normatively, we believe that voters should be sovereign, able to expresstheir approval of any set of candidates. Likewise, a voting system should allow forthe possibility of multiple acceptable outcomes, especially in close elections. ThatAV more than other voting systems is responsive in this way we regard as a virtue.That it singles out as strong Nash equilibrium outcomes unique Condorcet winnersmay or may not be desirable. We discuss these and other questions related to thenature of acceptable outcomes in section 6, where we suggest that “acceptability”replace the usual social-choice criteria for assessing the satisfactoriness of electionoutcomes chosen by sovereign voters.
A Minimax Procedure for Negotiating Multilateral TreatiesMarc Kilgour
(joint work with Steven J. Brams and Remzi Sanver)
In this paper we propose a procedure for reaching agreement on multilateraltreaties by finding a compromise that is as close as possible to the preferencesof all negotiating states. By “close” we mean that the maximum (Hamming)distance from the compromise to the position of any negotiator is a minimum.This compromise, which we call a minimax outcome, is most likely to be anacceptable resolution because it leaves no state too aggrieved. We argue also thatit reduces any incentive states might have to misrepresent their preferences toinduce a better outcome and is, therefore, relatively invulnerable to strategizing.
What we propose differs from the usual method of reaching an agreement inmultilateral treaty negotiations. Normally, states vote separately on each provisionof a treaty, often starting from a “single negotiating text.” If a simple or qualifiedmajority supports a provision, it is included in the treaty; otherwise, it is excluded.We call this the Majority Voting (MV ) procedure. MV chooses compromises thatmay differ from minimax outcomes; we show that it produces all outcomes thatminimize the total (or average) distance to the negotiators’ positions, or minisumoutcomes.

Analysis and Design of Electoral Systems 731
Our analysis assumes that negotiations have reached a stage whereby the pro-visions of a treaty in dispute
• can be specified;• are of approximately equal significance to all states;• are relatively independent of each other.
Moreover, we assume that bargaining on all provisions is binary: each provisionmust be included in the final treaty (coded as 1) or rejected (coded as 0). Werecognize that it may be difficult to achieve these conditions in practice, but wesuggest how they might be approximated. Moreover, it is certainly feasible toextend our definitions to non-binary issues, but we do not pursue such an extensionhere.
Assume that a treaty to be negotiated by n states (players, or countries) has kpossible provisions. The possible treaties can therefore be represented as binaryk-vectors, (p1, p2, . . . , pk), where each pi equals 0 or 1. Such binary vectors will becalled combinations. We simplify notation by writing combinations without punc-tuation, so that (1, 1, 0) becomes 110. Note that the total number of combinationsis 2k.
Because the procedure we propose for forging consensus in multilateral treatynegotiations requires bargainers’ preferences as inputs, we begin with a model ofpreferences over combinations. We assume that each state has a most preferredtreaty; we call this combination its ideal point or top preference. We further assumethat the state ranks other combinations according to a spatial model — that is,the ranking of a combination depends only on its distance from the top preference.(As distance between two binary k-vectors, p and q, we use the Hamming distance,d(p, q), which equals the number of components on which p and q differ.) So astate prefers a combination that lies closer to its top preference, and equally preferscombinations that are at equal distances from its top preference. For example, ifk = 2 and a state approves of the first provision but disapproves of the second, itstop preference is 10, and its complete preference ranking is 10 � 11 ∼ 00 � 01,where “�” indicates preference and “∼” indicates indifference.
The procedure we propose for forging consensus in multilateral treaty negotia-tions is based on “fallback bargaining” [1]. Let r be an integer satisfying 0 < r ≤ n.The FBr outcomes are those attained by applying fallback bargaining with pa-rameter r, which is the following procedure (starting with d = 0):
Assume bargainers approve only combinations at distance d orless from their top preferences. If one or more combinations isapproved by at least r bargainers, then those combinations withthe most approvals are the FBr outcomes. If no combination isapproved by at least r bargainers, increase d by 1 and repeat.
Thus, in fallback bargaining each state begins by considering only its most pre-ferred outcome acceptable. If there is not sufficient consensus (as measured by r)in the resulting acceptability sets, the condition is relaxed incrementally; now eachstate finds acceptable not only its top preference, but also any other combination
732 Oberwolfach Report 14/2004
at distance d = 1 from it. Acceptability sets expand in this way until there is someoutcome that is acceptable to at least r states.
Although we discuss all fallback bargaining outcomes, we focus on the case offallback bargaining with unanimity, or r = n, which we show produces exactly theminimax outcomes, and on the comparison of these outcomes with the minisumoutcomes produced by MV . Whereas FBn outcomes are in the Rawlsian traditionof minimizing the largest deviations from a compromise, MV outcomes are in theutilitarian tradition of minimizing average departures.
We examine some of the social-choice properties of these procedures. The firststep in applying any procedure is for the bargainers to report their top prefer-ences; a procedure is manipulable if it may be in a side’s interest to report its toppreference falsely. We show that the MV procedure is non-manipulable, whereasall FBr procedures are vulnerable to manipulation. But in any realistic situationwith incomplete information about the preferences of two or more other parties,FBn would be extremely difficult to manipulate. Moreover, and unlike MV , FBn
is completely unaffected by clones, or duplicates of an existing bargainer.Maximin outcomes seem superior compromises in many bargaining situations,
such as OilPol 54, the 1954 negotiation of n = 32 states over oil-pollution controlson the high seas. This negotiation concerned k = 4 binary issues. Because statescould abstain, as well as vote yes or no, on any provision, it was necessary toextend our preference model to account for issues on which a state expresses nopreference. Using public statements before and during the conference and otherinformation, we were then able to estimate the top preferences of each participant,as well as any indifferences. We then applied the FBn procedure, and found sixminimax outcomes, all of which differed from the MV outcome, which was thehistorical outcome of OilPol 54. We argue that one of these outcomes might havebeen a better choice than the actual outcome, and we suggest approval voting asa way of choosing among the six.
Complex multilateral negotiations frequently involve individual states or over-lapping blocs of states, scores of provisions, and considerable maneuvering by thebargainers to try to achieve a strategic advantage. We believe that our proposedprocedure would encourage them to be honest, render their negotiations moreopen, and make the compromises they achieve as acceptable as possible to allbargainers.
References
[1] Brams, Steven J. and D. Marc Kilgour: Fallback Bargaining. Group Decision and Negotia-tion 10 4 (2001), 287 – 316.
From Principles of Representation to Electoral MethodsVictoriano Ramırez
Politicians habitually establish certain objectives or principles when designingan electoral system. Some of their decisions are influenced by national tradition
Analysis and Design of Electoral Systems 733
and history. The system may be of the majority rule type, proportional, or somemixture thereof, and the design of the electoral circumscriptions may respond topreviously established geographical boundaries or administive distinctions.
One objective that should not be forgotten is that of governability. A Parliamentcomprising a large number of political parties, with the ensuing potential for anumber of winning coalitions, may give way to continual changes of government,and therefore to the instability of the regime, an undesirable consequence in anycase.
Another objective of politicians aiming for systems of proportional representa-tion is to achieve a high proportionality among the global votes for the parties andthe total seats obtained by each. Or, taken one step further, the aim might beto obtain a double proportionality between votes and seats, insofar as the partiesand the circumscriptions are concerned (as in Mexico from 1989 onward). In othercountries, the system of mixed election represents the search for global proportion-ality. Germany is the most distinguished example of this. Despite the fact thathalf their Upper House is chosen in uninominal districts and the rest accordingto the party lists with conditioned proportionality, the German electoral systempresently stands as one guaranteeing high proportionality.
Similarly, in the context of social election, certain prior objectives are usually setforth [6, 7]. When it is necessary to choose a representative, be it the Presidency ofFrance or the position of Rector in a given Spanish University, it would be logicalto establish as a basic principle that the Condorcet winner will be declared thewinner of the election. Many other objectives and principles [1] enter into play aswell in the different electoral processes that take place in modern day democracies.
On occasion however, the various principles established are not entirely com-patible, while at other times there may be different ways of attaining them, somemore satisfactory than others. This is why rigorous analysis is a prerequisitefor any electoral stipulations. Politicians should agree on which objectives andprinciples are the most adequate and appropriate, and in fact they are often thevery persons who establish the rules and define the electoral system. Ignoring orunderestimating the variables involved in electoral processes, together with theirdifferent properties and interrelations, can lead to a failure in achieving the statedobjectives, as well as other unpleasant surprises, such as the discovery that certainlaws are impossible to apply. A good number of contradictions and inconsistenciescan be seen with a careful look at the Mexican Constitutions of 1989 and 1994and the corresponding Electoral Legislation [2]. But these are not the only cases.In many countries there are confusing electoral systems with scarcely acceptableimplications.
I would like to present here several examples of electoral systems under whichthe ultimate consequences are not necessarily a reflection of the original prin-cipals that inspired the electoral design, or which have given rise to unforeseennegative consequences. All the examples refer to different electoral processes thathave taken place within Spain in recent years. In Spain we have two Houses ofParliament: the Congress (Congreso de los Diputados) and the Senate (Senado).
734 Oberwolfach Report 14/2004
The first example is relative to the size of constituencies for the Congressionalelections. The actual Electoral Law of 1985 has led to tremendous differencesbetween the value of a vote from a large constituency or a small one, the latterreaping the relative benefits. The vote of five citizens from Madrid holds as muchelectoral weight as that of one inhabitant of Soria — far from the democraticprincipal of “one person, one vote! We must bear in mind the requirement thateach constituncy should receive at least two seats, and that there is no maximumrestriction, then using the Webster method we obtain an alternative for which theprevious ratio is reduced to 2.6.
The second example is relative to the allotment of Congressional seats to theparties in Spain. Thus, the spanish electoral system produces some importantimbalances between certain regional parties and those national parties that obtainsimilar results insofar as the number of votes. It does not guarantee a significantbonus to the most voted party, although absolute majorities have resulted from halfof the elections held. For example in the last election (March, 2004): the nationalparty IU has obtained 1, 269, 532 votes and 5 seats, the regional party PNV hasobtained 417, 154 votes and 7 seats. Also the winner party, the PSOE has obtained10, 909, 687 votes and 164 seats. In average, each seat of PSOE costs 66, 500 votes,each seat of PNV costs 59, 600 votes and each seat of IU costs 253, 900 votes. It ispossible to define an electoral system that leads to a greater proportionality whileavoiding unfairness such as that cited for the above cases, even offering a bonusto the most voted party in order to contribute to governability [4]. One meanof ensuring high proportionality is to carry out a second allotment reflecting thetotal votes of the parties, with minimal conditioning factors based on the resultsof the initial allotment, as done in Germany.
The third example is the Senatorial election in Spain. In Spain the elections tothe Congress and the Senate are celebrated simultaneously. Most of the senatorsare elected in the same constituencies as the members of Congress. But in this casefour are chosen, regardless of the circumscriptions population. The voters usuallybehave along the same lines as for Congress, despite the fact that the voting systemis very different. In the Senate, there are candidate names from all the parties ona single list, with groupings by party. A maximum of three names for each partyis established, and the voter can mark only up to three candidate names. Thismethod is similar to Approval Voting [3], but the number of candidates who canbe approved, for every elector, is limited to 3. Therefore, most voters choose thosethree names proposed by the party they voted for in the congressional contest. Ifthey opt to mark just one or two names, it would tend to be in favor of the firstcandidate(s) presented by the preferred party for Congress. The consequence ofthat behavior is that the most voted party in the lists for the Congress obtains,systematically, three senators and the second party more voted a senator obtains,independently of the relation of votes between both and with respect to the otherparties.
The strategy of the Spanish in the elections to the Senate meets moreoverreinforced in the university elections, where there is used a method of election very
Analysis and Design of Electoral Systems 735
similar to Approval Voting (with different limitations). If greater proportionalityin the Senate is desired (or in the universities elections), it would be preferable,for a behavior of the voters like the one mentioned previously, to use as methodof social election a Borda-type method with the following weights: 1, . . . , 1/3, . . ..
This paper sheds some critical light on several electoral systems and practicesthat can be seen in Spain (the constituencies size, the advantage of the mainregional parties over the similar national parties, the election of the Senators,the higly manipulable electoral system to determinig university representatives orJuntas). Notwithstanding all these drawbacks, the electoral processes of the Con-gress, the Senate, and the municipal, regional or European elections do functionin a positive sense in that they are applicable in all cases.
On the other hand, I introduce a new property for the proportionality: Limitedloss of seats in coalitions. We put forth that a method has a limited loss of seatsin the case of coalitions: the fusion of 2r or 2r + 1 parties does not entail a loss ofmore than r seats. Then, a necessary condition, for a divisor method, to imply alimited loss of a seat is that
d(s) ∈[s +
12; s + 1
].
(If d(s) = s+t or the fusion is of 2r parties, the previous condition is also sufficient).In accordance with this property and the properties of the parametric methods
[5], I think that the most reasonable option is to use divisor methods of the para-metric family from Webster to Jefferson in approaching problems of proportionalallotment.
References
[1] Balinski, M. L., Young, H. P.: Fair representation: Meeting the ideal of One Man, OneVote. New Haven 1982.
[2] Balinski, M. L., Ramırez, V.: A case study of electoral manipulation: The Mexican laws of1989 and 1994. Electoral Studies 15 (1996), 203–217.
[3] Brams, S. J, Fishburn, P. C.: Approval Voting. Birkhauser Boston 1983.[4] Marquez, M. L., Ramırez, V.: The Spanish electoral system: Proportionality and govern-
ability. Annals of Operations Research (1998), 45–59.[5] Ramırez, V., Marquez, M.L., Perez, R.: Parametric subfamilies of apportionment methods.
Advances in Computational Mathematics, Marcel Dekker (1999) 471–479.[6] Saari, D.: Geometry of voting. Springer 1994.[7] Taylor, A.: Mathematics and politics. Springer 1985.
BAZI — A Java Program for Proportional RepresentationFriedrich Pukelsheim
BAZI is a freely available JAVA-Program, permitting the user to experiment withvarious apportionment methods, and to assess their relative merits on the basis ofreal data rather than abstract theory.
The pertinent theory is available in the seminal monograph [4] by Balinski andYoung. Among all possible apportionment methods, the authors single out two

736 Oberwolfach Report 14/2004
important subclasses. The first class consists of divisor methods, the second ofquota methods. BAZI features just two quota methods, the method of greatestremainders (Hamilton, Hondt, Hagenbach-Bischoff), and the Droop method.
However, a central message of the Balinski/Young monograph is that divisormethods are generally more appropriate for the apportionment problem. Of these,BAZI offers two parametric families, the divisor methods with stationary round-ings, and the divisor methods with powermean roundings; for details see [5, p.357].
The powermean methods are more important from a historical point of view,comprising the five traditional methods of Adams, Dean, Hill, Webster, and Jef-ferson. In contrast, the stationary methods are more amenable to a mathematicalanalysis. BAZI relies on an algorithm [5, p. 378] whose computational complexityis minimum [6, p. 154].
On the computer screen, BAZI comes up with the graphical user interface splitinto three panels, the input field to the left, the methods field in the middle, andthe output field on the right.
The input field invites the user to key in data of his or her own, or to read in adata file that the user has created, or to load data from the extensive data base.
In the methods field the user can select a house size (district magnitude) and,in particular, one or more apportionment methods.
Whenever the user chooses a divisor method, BAZI outputs the resulting ap-portionment along with a pertinent divisor. This way the user may easily confirmthe results with paper and pencil (or a pocket calculator), rather than being forcedto believe what the machine says.
A particular feature of BAZI is that it offers three options for multiple electoraldistricts. The user may choose between (1) separate evaluations for each district,(2) biproportional apportionments using divisor methods, and (3) a variant of thelatter that is specifically tailored to the needs of the new Zurich electoral law of2003.
For these matrix apportionments BAZI uses an algorithm akin to the one re-ported by Balinski and coauthors in [1],[2] and [3]. More precisely, BAZI imple-ments a discrete variant of the iterative proportional fitting procedure, also knownas alternating scaling. A paper to report on the specific properties of the BAZIalgorithm is under preparation.
The BAZI homepage and download site is
www.uni-augsburg.de/bazi.
The site also includes the pseudocode of the program, a detailed description of thedistrict options (1)–(3) mentioned above, and an extensive list on the ProportionalRepresentation literature.
References
[1] Balinski, M.L. / Demange, G.: Algorithms for proportional matrices in reals and integers.Mathematical Programming 45 (1989a), 193–210.
[2] Balinski, M.L. / Demange, G.: An axiomatic approach to proportionality between matrices.Mathematics of Operations Research 14 (1989b), 700–719.

Analysis and Design of Electoral Systems 737
[3] Balinski, M.L. / Rachev, S.T.: Rounding proportions: Methods of rounding. MathematicalScientist 22 (1997), 1–26.
[4] Balinski, M.L. / Young, H.P.: Fair Representation — Meeting the Ideal of One Man, OneVote. Brookings Institution Press, Washington, D.C. Second Edition 2001.
[5] Happacher, M. / Pukelsheim, F.: Rounding Probabilities: Unbiased Multipliers. Statistics& Decisions 14 (1996), 373–382.
[6] Happacher, M. / Pukelsheim, F.: Rounding probabilities: maximum probability and mini-mum complexity multipliers. Journal of Statistical Planning and Inference 85 (2000), 145–158.
Seat Biases of Apportionment Methods for ProportionalRepresentationMathias Drton
(joint work with K. Schuster, F. Pukelsheim and N. R. Draper)
In proportional representation systems, apportionment methods are used to trans-late the electoral votes into specific seat allocations. The seat allocations are ofcourse integer numbers, and the votes are almost continuous quantities, by com-parison. One of the pertinent problems is to measure the effect of the use ofa given apportionment method. Whereas previous studies have made inferencesabout the proportionality of apportionment methods from empirical data, thispaper (Schuster et al. [6]) derives the
information deductively.We concentrate on the three most popular apportionment methods (cf. Balin-
ski/Young [1], Kopfermann [4]):(H) the quota method of greatest remainders (Hamilton, Hare),(W) the divisor method with standard rounding (Webster, Sainte-Lague),(J) and the divisor method with rounding down (Jefferson, Hondt).
Assuming repeated applications of each method, we evaluate the seat biases ofthe various parties. These seat biases are averages, over all possible electoraloutcomes, of the differences between the (integer) seats actually apportioned, andthe (fractional) ideal share of seats that would have been awarded, had fractionalseats been possible.
More formally, we consider � parties, numbered 1, . . . , �, with respective votecounts v1, . . . , v�. In proportional representation, the number of seats allocated toa party ought to be proportional to the relative weight of their vote counts. Hence,if V =
∑�k=1 vk is the total number of votes cast, there is no loss of generality
to convert the vote counts into vote ratios, or weights, wk = vk/V , 1 ≤ k ≤ �.Assuming that the weights w1, . . . , w� follow a uniform distribution over the set ofany � non-negative numbers summing to one, we calculate the average behavior ofthe seat allocations. This distributional assumption can be traced back to Polya[5].
The district magnitude, that is, the total number of seats to be apportionedis denoted by M . The numbers w1M, . . . , w�M are the ideal shares of seats ofparties 1, . . . , �. These would be the “fractional numbers of seats” to which, ideally,

738 Oberwolfach Report 14/2004
each party would be entitled if that were possible. In real life, the parties areapportioned an integral number of seats m1, . . . , m�, using the apportionmentmethod in the applicable electoral law.
A common approach for evaluating the goodness of an apportionment methodis to compare, for each party k, their actual seat allocation mk with their idealshare of seats wkM . This results in the seat excess mk − wkM of party k. Weare interested in whether an apportionment method systematically favors largerover smaller parties. Hence, we condition the averaging process on the event thatparty 1 is largest, party 2 is second-largest, etc., where “largeness” refers to partyweights. Under this condition w1 ≥ . . . ≥ w�, we
study the expected value of the seat excess mk − wkM as a function of thedistrict magnitude M . The resulting quantity
Bk(M) = E[mk − wkM
∣∣w1 ≥ . . . ≥ w�
],
is called the seat bias of the k-th largest party. The standard statistical term“bias” indicates an expected difference between all possible observable values of aquantity and its ideal value. The main results of our paper are formulas for theseat biases, for each party k, under a given apportionment method.
For the quota method of greatest remainders (Hamilton, Hare), the seat biasesBH
k (M) turn out to be identical and slightly positive, for parties k = 1, . . . , � − 1from the largest down to the second-smallest:
BHk (M) =
� + 124M
+ O
(1
M2
),(1)
BH� (M) = −(� − 1)
� + 124M
+ O
(1
M2
).(2)
The �-th, smallest party carries the deficit that balances the positive accumulation.Even though the special role of the smallest party may appear disconcerting, itsseat bias remains so small numerically as to be invisible in practice. Thus thequota method of greatest remainders is practically unbiased.
For the divisor method with standard rounding (Webster, Sainte-Lague), theseat biases of the largest � − 1 parties k = 1, . . . , � − 1 are given in (3), while theseat bias of the �-th, smallest party is given in (4):
BWk (M) =
� + 2�
24M+
� + 224M
�−1∑
j=k
1j
− 1
+ O
(1
M2
),(3)
BW� (M) = −(� − 1)
� + 2�
24M+ O
(1
M2
).(4)
Here a certain amount of balancing goes on between the �−1 largest parties alone.The accumulated contribution of the terms (� + 2
� )/(24M) is evened out by thenegative seat bias of the smallest party. However, all these theoretical seat biasesare so small numerically that we do not consider them practically relevant. Thatis, the Webster seat allocations are practically unbiased.

Analysis and Design of Electoral Systems 739
For the divisor method with rounding down (Jefferson, Hondt) the situationchanges dramatically. The leading term in the seat-bias is independent of thedistrict magnitude M :
(5) BJk(M) =
12
�∑
j=k
1j
− 1
+ O
(1M
).
The remainder term, bounded of order 1/M , appears to be practically irrelevant.Now, the largest party clearly enjoys a positive seat bias and can expectseats in excess of their ideal share. The seat biases become successively smaller,
as we pass from the largest party (k = 1) to the smallest party (k = �). Thebiasedness of Jefferson’s method has been observed over many years on the basisof empirical data, but our formulas permit specific calculations about the numericalsizes of the seat biases. For example, the largest party in a three-party system canexpect five extra seats per twelve elections in excess to their ideal share, under theJefferson method.
Our seat bias results depend on the assumption of uniformly distributed weights.However, Schuster et al. [6] confirm the theoretical findings via empirical datafrom the German State of Bavaria, the Swiss Canton Solothurn, and the U.S.House of Representatives. Furthermore, Schuster et al. [6] give illustrations of theseat biases and provide details on their interpretation. Mathematical details areprovided in Drton and Schwingenschlogl [2, 3].
References
[1] Balinski, M.L. / Young, H.P.: Fair Representation — Meeting the Ideal of One Man, OneVote. Second Edition. Washington D.C. 2001. [Pagination identical with First Edition, NewHaven CT 1982.]
[2] Drton, M. / Schwingenschlogl, U.: Surface Volumes of Rounding Polytopes. Linear Algebraand its Applications 378 (2004), 71–91.
[3] Drton, M. / Schwingenschlogl, U.: Seat allocation distributions and seat bias formulas ofstationary divisor methods for proportional representation. Under preparation (2004).
[4] Kopfermann, K.: Mathematische Aspekte der Wahlverfahren — Mandatsverteilung bei Ab-stimmungen. Mannheim 1991.
[5] Polya, G.: Proportionalwahl und Wahrscheinlichkeitsrechnung. Zeitschrift fur die gesamteStaatswissenschaft 74 (1919), 297–322.
[6] Schuster, K. / Pukelsheim, F. / Drton, M. / Draper, N.R.: Seat biases of apportionmentmethods for proportional representation. Electoral Studies 22 (2003), 651–676.
Negative Weights of Votes and Overhang Seats in the German FederalElectoral Law
Martin Fehndrich
In Elections to the German Bundestag, internal overhang seats cause an effect— negative weight of votes — where a party can get more seats if loosing somevotes, or loose seats because it wins some additional votes [1],[2]. This effect isdemonstrated in the federal German election 2002, where 1000 votes less for the

740 Oberwolfach Report 14/2004
SPD in one federal state would have caused an additional seat for this party. Inthe talk, an overview over the German electoral system is given.
The reasons for Overhang Seats in general are traced back to two mechanisms:many won constituency seats and few party votes. These two mechanisms allowto describe the effect of every parameter of an electoral system on overhang seats.The possible treatments of overhang seats are presented with a view of their effecton disproportionality and additional seats. To prevent disproportionality and anincrease of the house size, respectively, a rule must be defined of not awardingsome of the overhanging constituency seats. Awarding all won constituency seats,one has to make tradeoffs between disproportionality and increasing house size.The biggest increase of house size with no or only a small disproporionality wouldbe reached by awarding additional balance seats (as done in most German federalstates), the biggest disproportionality but no increase of parliament by reducingthe number of seats for the not overhanging parties (as in the Scottish parliamen-tary elections), while just awarding the overhang like in the German Bundestagstays somewhere in the middle. An additional possibility is given in systems withinternal overhang seats, like the German system, where a party can have overhangseats in one federal state, but still list seats in other federal states. In this case aninternal compensation could be used, where proportional seats are at first awardedto justify the constituency seats and than are awarded to a partys lists.
Negative votes are votes in a party election, without ranking, only one ballotand no second ballot.
One simple example for an electoral system allowing votes with a negativeweight of votes is the quota system with largest remainder (named after Hamiltonor Hare-Niemeyer), with a 5%-barring clause and 21 Seats. In an 4-party examplewith A, B 4400 votes, respectively, C 700 votes and D 500 votes, an additional votefor C (coming from nonvoters or D), would actually reduce the number of seatsfor C. Another example for negative votes is the house monotone quota system,described by Balinski and Young [3, Table A7.1/A7.2 p. 140].
A more serious problem with negative votes occurs in the German Bundestagelections. Here a reduction of the votes for the SPD in the federal state of Bran-denburg by 1000 votes in the 2002 election would have caused an additional seatfor this party. The effect is connected with the occurrence of internal overhangseats. Loosing votes in Brandenburg will cause a shift in the proportional seatswithin the party’s federals state lists. Brandenburg would lose a seat in favour ofBremen. But since in Brandenburg there are enough constituency seats, this doesnot hurt Brandenburg’s SPD-list, where then an overhang seat occurs, and in theend there is an additional seat for the SPD. The effect is independent from therounding rule and can occur with Hamilton, Jefferson, Webster or other methods.It occurred in the elections with Jefferson until 1983, before the change to theHamilton system. Even if we think about fractional seats, a vote for an overhang-ing federal list would cause the loss of a fractional part of a seat. The effect issometimes that repeating and predictable that it becomes the best strategy undergame theoretical aspects to vote for the disfavoured and overhanging party rather
Analysis and Design of Electoral Systems 741
than voting for the favoured party. Even in other cases it is a better strategyto vote for a second choice party and not for the probably overhanging favouredlist. The occurrence of this effect in an electoral system is critiqued, because itis against the rule of a direct election and some seats are justified by not givenvotes rather than given votes. There is a qualitative change exceeding the pointof disproportionalty, if a votes weight is not just lower than others, but becomingsmaller than zero. An election under this circumstances seems more a case forgame theorists than an election. There is no reason in sight which could justifythis effect as a trade-off against other favourable properties of an electoral system(as opposed to social choice, where a voter can rank or give more than one vote,allowing similar effects like the no show paradox).
As a solution for the German Electoral System an internal compensation ruleis recommended, which prevents internal overhang seats and with that negativevotes. To reduce some paradoxes one should also change from Hamilton to theWebster (Sainte-Lague) system in the party distribution and sub-distribution.
References
[1] M. Fehndrich: Paradoxien des Bundestags-Wahlsystems, Spektrum der Wissenschaft 2(1999) 70.
[2] http://www.wahlrecht.de
[3] M. Balinski and P. Young: Fair Representation, Washington 2001.
The Role of the Mean and the Median in Social Choice TheoryWilliam Zwicker
A center is a function C that assigns, to each finite set S of points of Rn, a central
point C(S) of the distribution. The mean is the most familiar center, but thereare others. In particular, the mediancentre (the point minimizing the sum of thedistances to members of S) seems attractive; it is one of several generalizations ofthe median to the multivariable context.
Extending work of Saari and Merlin, we show that many familiar voting systems— including Borda count, Condorcet’s method of pairwise majorities, and theKemeny Rule — have alternate descriptions as follows:
(1) Plot the vote v of each voter as a point A(v) in n-space (where the choiceof plotting function A depends on the particular voting system at hand).
(2) Take the mean location q of all points A(v) (counting multiplicity).(3) The outcome is the vote v0 for which A(v0) is closest (in the l2-metric) to
q.In particular, the plot function for the Borda count places rankings at verticesof the permutation polytope, or “permutahedron,” while the Condorcet procedureand Kemeny rule each use the “pairwise comparison cube” discussed by Saari. Theresult for the Kemeny rule is particularly surprising, as the original descriptionemploys a type of median based on the Hamming distance between rankings,whereas the new characterization uses the mean on standard, Euclidean distance.
742 Oberwolfach Report 14/2004
Several properties shared by these voting systems can now be traced to theircommon dependence on the mean.
If we replace the mean with the mediancentre in step (2) of any system, theresult is typically a new system. For example, the Mediancentre Borda seemsinteresting; while it fails to have the consistency property, it is less manipulablethan the standard Borda count, and has the interesting property that when amajority of the voters rank candidates similarly, their favorite will win. Thesedifferences can largely be explained by axiomatic differences between the meanand the mediancentre. In particular, the mean satisfies the property that
C(S + T ) = C(S + kC(T )),
where S and T are multisets of points in Rn (several points may have the same
spatial location), S +T is the union counting multiplicity, T has k points countingmultiplicity, and kC(T ) is the multiset having k points, each located at C(T ).In fact the mean is characterized by this property together with some symmetryand the requirement that C(S) is uniquely defined for all nonempty multisets Sof points of R
n.The corresponding axiom for the mediancentre seems to be
C(S + {p}) = C(S + {p′}),where p is any point not located at C(S + {p}), and p′ is any point on the one-sidedly infinite ray from C(S+{p}) through p (with p′ = C(S+{p}) allowed). Thisproperty, together with some symmetry and the requirement that C(S) be uniquelydefined for all multisets S of points of R
n, except for multisets S containing aneven number of collinear points, implies a spatial majority rule property: C(S) = pwhenever either a strict majority of points are located at p, or exactly half thepoints are at p and the other half are not all located at some common differentlocation. These same three axioms characterize the median in R
1, but we do notknow whether the same is true for R
n.
Formal Analysis of the Results of ElectionsFuad Aleskerov
Four main issues are presented in the paper:(1) Patterning of electoral outcomes,(2) Polarization of electoral outcomes,(3) Disproportionality of a parliament,(4) Power distribution in Russian parliament during 1994–2003.
In the first issue I deal with the following problem: is it possible to find asimilarity of electoral outcomes over several elections, and can we describe thenotion of stability of electoral behavior being based on such similarity?
The approach uses the clustering algorithm applied to all data available onelection outcomes. An important new feature of the algorithm (which is called aclustering of curves algorithm) is that it uses the relations among outcomes, not
Analysis and Design of Electoral Systems 743
the numerical values themselves. The obtained clusters are called patterns, andone can analyze how the districts change their patterns over years. Then one cancall the electoral behavior in a district as a stable one if there are no changes ofpatterns over years.
Using this very approach, Prof. Hannu Nurmi and I have studied the patternsof party competition in British general elections in 1992, 1997 and 2001 over 529constituencies in England, 70 constituencies in Scotland, and 40 constituencies inWales. Only 13 patterns of support distribution are obtained for English con-stituencies, and only 6 of them are sufficient to describe the electoral preferencesdistribution in more than 90% of the constituencies. Concerning the stability ofelectoral outcomes, it has been shown that almost 38% of constituencies have notchanged their preferences over those three general elections. Almost 48% of con-stituencies changed their preference after 1992 elections and then kept stable. Inother words, almost 86% of constituencies can be called stable or semi-stable interms of their electoral outcomes. Approximately the same results are observedfor Scotland and Wales. Next we have studied the stability of electoral outcomesduring last seven municipal elections from 1976 to 2000 in Finland over 452 con-stituences. Naturally, the deviation from the stability is much higher when suchlong period is studied. However, 14% of constituencies are absolutely stable sincethey have not changed their electoral patterns during those 25 years. 51% of con-stituencies can be called semi-stable since they have experienced not more thanone or two changes of patterns over this period, and only 1% of constituencies arecompletely unstable, i.e., they have experienced seven changes of patterns overthese elections. These results are very illustrative for the use of this very powerfulmethod of patterning electoral outcomes.
In the political studies literature one can find very few attempts to study apolarization of society on the basis of electoral outcomes. Such attempt was madeby my B.S. student M. Golubenko and myself. We construct a polarization indexusing an analogy from physics which is called central momentum of forces withrespect to the center of gravity. We consider the parties being positioned overthe left-right position axes, and in each position the mass (percentage of votes forthat party) is concentrated. Then by evaluating the polarization index one canconclude to which extent the electoral preferences are polarized. If there are onlytwo parties with 50% of votes given to each of them, and these parties are located inthe extreme opposite positions of the left-right spectrum, then the polarization ismaximal and equal to 1. On the other hand, if there are several parties positionedat the same place on the left-right scale, never mind where this place is, the value ofpolarization index is equal to 0. We have evaluated the distribution of polarizationover the regions of Russia using electoral outcomes of 1995, 1999 and 2003 generalelections.
There are several well-known indices to evaluate the disproportionality of a par-liament, e.g., Maximum Deviation index, Rae index, Gallagher index, Loosemore-Hanby index, etc. However, none of them take into account the turnout of electionsand the percentage of votes “against all”, which is allowed in Russia. My M.S.
744 Oberwolfach Report 14/2004
student V. Platonov and I have proposed a disproportionality index which is amodification of Loosemore-Hanby’s index and takes into account these additions.We have introduced a new index of disproportionality, that of relative representa-tion. The index shows a percentage of seats in a parliament which a party receivesfor 1% of votes. The evaluation made for several countries (Russia, Finland, Swe-den, Ukraine, Lithuania, Turkey) show that the countries of the former Sovietblock are characterized with higher degree of disproportionality.
The last topic in my paper deals with the study of power distribution in theRussian parliament from 1994 to 2003. We studied Banzhaf and Shapley-Shubikindices on a monthly basis using the MPs’ voting data. The indices have beenevaluated for different scenarios of coalition formation. The model of coalitionformation uses the index of groups positions consistency showing to which extenttwo groups (fractions) of MPs vote similarly. In the first scenario all evidentopponents are excluded from coalitions, in the second scenario all evident andpotential opponents are excluded, and in the third scenario coalitions only withevident allies are allowed. The first scenario is most close to the real coalitionformation in the Russian parliament. The analysis shows, in particular, that dueto the absence of intention to coalesce, the Communist Party during almost allperiod under study has had power near to 0, although there were periods whenthis party controlled more than 30% of seats. The dependence in the changes ofthe power indices distribution is compared with respect to political events duringthis period.
Procedure-Dependence of Electoral OutcomesHannu Nurmi
The theoretical literature abounds examples in which the voting outcomes — win-ners or the ranking of candidates — depends not only on the revealed preferencesof the voters but also on the method used in determining the result. From thelate 18th century, two main intuitive notions have played a prominent role in theliterature, viz. one which maintains that in order to qualify as the winner, a can-didate has to defeat, in pairwise comparisons, all other candidates, and the otherwhich looks for the winner among those candidates that are placed highest on thevoters’ preference rankings. It is well-known that these two intuitive notions arenot equivalent: the candidate that defeats all others in pairwise contests may notbe best in terms of positions in the voters’ preference rankings. But how often dothese two notions conflict in real world elections?
The British parliamentary elections were studied by Colman and Pountney(1978) from the view point of estimating the probability of the Borda effect. Thiseffect occurs whenever the elected candidate would be defeated by some othercandidate in a pairwise comparison by a majority of votes. The British first-past-the-post (FPTP) system makes it possible that such instances occur. The problemis to know how often. Colman and Pountney used the interview data collectedby the British polling organization MORI to construct preference profiles for the

Analysis and Design of Electoral Systems 745
entire electorate. From these they then computed the likelihood of instances of theBorda effect. This paper replicates Colman and Pountney’s study using the dataon the 2001 British parliamentary elections. To get a wider perspective on thevariability of electoral outcomes, we used Saari’s (1995) geometric methodology todetermine the range of all positional voting outcomes in the 2001 elections in allBritish constituencies. It turns out that — under the same assumptions as thosemade in the Colman and Pountney’s study — in 12 constituencies the rankingof candidates could have been completely reversed depending on the voting ruleused. Much more numerous were constituencies, 68 in number, where the actualwinner would have been ranked last by another positional voting procedure. Thefirst and second ranked candidates would have been different depending on votingrule in 49 constituencies.
The second aim of the study is to determine the pattern of party competitionprevailing in British constituencies. In a study conducted together with Aleskerovwe found that the optimal number of party support patterns needed to characterizethe 500+ English constituencies over three most recent parliamentary elections isjust 13. Moreover, about one-third of the constituencies were characterized bythe same support patter over the period of three elections. Less than 10% of theconstituencies were completely volatile in the sense of moving from one patternto another in each election. In Scotland, nearly two-thirds of the constituenciesexperience no change in support pattern in the three elections. Similar study wasconducted on Welsh constituencies. It shows that in terms of support stability,Wales is located between England and Scotland.
References
[1] Colman, A. and Pountney, I.: Borda’s voting paradox: Theoretical likelihood and electoraloccurrences. Behavioral Science 23 (1978), 15–20.
[2] Saari, D. G.: Basic Geometry of Voting. Springer 1995.
The Mathematical Source of Voting ParadoxesDonald G. Saari
The social choice literature has many articles describing certain properties of de-cision rules: often these properties are obtained via the so-called “axiomatic ap-proach.” The thrust of
this talk was to 1) show why the way the “axiomatic approach” is used in thesocial choice literature often has very little, if anything, to do with “axioms” orthe “axiomatic approach,” 2)
explain a way, motivated by the mathematics of “chaotic dynamics,” to identifyall possible consistency properties and paradoxes — both positive and negative —of positional voting methods (and all other rules based on these methods), and 3)identify the source of all possible properties of these voting rules. I had intendedto also discuss how to find all possible strategic settings, who can be

746 Oberwolfach Report 14/2004
strategic, and the possible strategies, for any specified voting rule, but time ranout.
As for the axiomatic approach, I gave someexamples to show how the properties called “axioms” often are merely particular
properties that happen to uniquely identify a particular decision rule. “Uniquelyidentifying” and
“characterizing via axioms” are very different. As an illustration, the two prop-erties “Finnish-American heritage” and a particular “DNA structure” uniquelyidentify me, but they are not
“axioms,” they do not characterize me, and they do not tell you “what you aregetting,” which is the usual claim for the axiomatic approach.
The second part described a way to characterize all possible outcomes. Thiswork was motivated by the clever paradoxical example found by, for example,Brams, Fishburn, Nurmi and many others. The point is that a “paradox” identifiesan unexpected property of a voting rule. For example, the profile where 6 preferACB, 5 prefer BCA, and 4 prefer CBA leads to the plurality ranking of ABC,and the conflicting pairwise rankings of CA, BA, CB. These rankings define theplurality word (ABC, BA, CA, CB), and the word identifies the plurality propertythat the plurality winner can be the Condorcet loser, while the plurality loser canbe the Condorcet winner. In other words, each list of
rankings — each word — that CAN occur defines a property of the voting rule.On the other hand, it turns out that this same list (ABC, BA, CA, CB) can neveroccur with the Borda Count; it can
never be a Borda word. This means that a Borda property is that the Condorcetwinner can never be Borda bottom ranked and the Condorcet loser cannot beBorda top ranked. Namely a listing that cannot occur — that cannot be a word— also defines a property of a voting rule. Consequently, to find all possibleranking properties of all possible positional methods over all possible subsets ofcandidates, we want to find all possible listings of rankings that
could occur over all possible profiles; we want to find all possible words. Doingso directly may be impossible, but by use of notions from chaotic dynamics, thishas been done, and the results are discouraging; e.g., for most collections of votingrules (one for each subset of candidates), anything can happen. Namely, any
listing is a word. The unique voting rule that minimizes (significantly!) thenumber and kinds of listings that can be words is the Borda Count. Thus, thisrule has the largest number
(significantly so) of positive ranking properties.The third topic showed how to construct all possible examples that can occur
with a voting procedure, how to explain all of the “paradoxes”, etc. The way thisis done is to emphasize the profiles rather than the voting outcomes. This is doneby finding configurations of preferences
where it is arguable that the outcome is a tie. The conjecture, which turnedout to be true, is that all possible differences among voting rules can be explained

Analysis and Design of Electoral Systems 747
(and examples constructed) simply by knowing these configurations of preferenceswhere procedures do, or do not, have a complete tie. As an illustration, all possible
properties, differences in outcomes, etc. among three candidate positional vot-ing occur because of the different ways voting rules handle the “reversal configu-rations” such as (ABC, CBA). Here, only the Borda count gives a tie: all otherpositional methods either favor A = C over B, or B over A = C. Indeed, theabove example was created by starting with 1 person preferring ACB and 4
preferring CBA, where the CBA outcome holds for all positional pairwise out-comes. To create the paradox, 5 units of (ACB, BCA) were added: this addingof the reversal components is what caused
the plurality outcome to differ from the pairwise outcomes. Similarly, all possi-ble differences in procedures using pairwise outcomes arise because of “Condorcetprofile components” of the (ABC, BCA, CAB) type. Positional rankings are notaffected, but these components change the pairwise tallies: for any number ofcandidates, it causes all problems with tournaments, agendas,
problems with methods using pairwise outcomes such as the Borda Count andthe Kemeny method, etc... The two configurations of preferences completely de-scribe all possible differences among three candidate decision rules that use pair-wise and/or positional methods; e.g., it explains all possible differences betweenthe Condorcet and Borda winners. Comments were made about results for n > 3candidates.
On the Closeness Aspect of Three Voting Rules: Borda, Copeland andMaximin
Christian Klamler
The purpose of this paper is to provide a comparison of three different votingrules, Borda’s rule, Copeland’s rule and the maximin rule. Borda (1784) suggestedassigning points to the m alternatives in the individual preferences, namely m-1points for the top ranked alternative, m-2 points for the second ranked alternative,down to 0 points for the bottom ranked alternative. Then, for every alternative,one adds up those points over all individuals. The more points an alternativereceives the higher ranked it is in the social preference. Copeland (1951) suggestedcalculating for each alternative the difference between the number of alternativesit beats and the number of alternatives it looses against. Again, the larger thederived number the higher ranked is the alternative in the social preference. Finallythe maximin rule is based on the idea that alternatives should be ranked higherin the social preference the more minimal support they enjoy, i.e. the higher theminimal support over every other alternative.
Usual comparisons of such voting rules focus on non-binary aspects (Laffondet al., 1995), e.g. comparing the actual choices of such voting rules for differentpreference profiles, or calculating the probabilities of voting rules leading to thesame choices (e.g. Gehrlein and Fishburn, 1978, and Tataru and Merlin, 1997).Nurmi (1988, p. 207) provides a possible interpretation of such results by stating
748 Oberwolfach Report 14/2004
that “the estimates concerning the probabilities that two procedures result in dif-ferent choice sets can be viewed as distances between the intuitions.” Moreover headds that “. . . the fact that the Condorcet extension methods (Copeland’s and themax-min method) are pretty close to each other was to be expected.” “Closeness”in this sense means the probability of two voting rules choosing the same winnerat the same preference profile. In contrast, “closeness” could also be reasonablyinterpreted with respect to the distance between the outcomes of the different vot-ing rules, i.e. the difference between the rankings derived from two voting rules.To be more precise, assume a set of alternatives X and two social preferences �,�′
on X. We will consider two social preferences �,�′ as opposed if for all x, y ∈ X,x � y ⇔ y �′ x and for some x, y ∈ X , x � y ⇔ y �′ x. I.e. opposed social prefer-ences are exactly opposite to each other. This paper shows, that in contrast to theconclusions drawn from using a probabilistic approach, “closeness” in the sense ofcomparing social preferences is neither guaranteed for Copeland’s and the max-imin method nor for the Borda and the maximin method. It is proved that thereexist preference profiles for which the Copeland ranking and the Borda rankingare exactly the opposite of the maximin ranking. That the Copeland ranking andthe Borda ranking are opposed has been shown by Saari and Merlin (1996). Sim-ilar comparisons exist for Borda’s rule and simple majority rule. It is well knownthat the Condorcet winner (the alternative that beats every other alternative by asimple majority) is never bottom ranked in the Borda ranking and the Condorcetloser (the alternative beaten by every other alternative) is never top ranked in theBorda ranking (Saari, 1995). Hence, even in cases where the winning alternativesare different, we can ensure a minimal degree of consistency between the rules.However, several recent results (e.g. Ratliff, 2001, 2002 and Klamler 2002) showthat such a relationship does not exist for many other pairs of voting rules.
References
[1] Borda, J.C.: Memoire sur les Elections au Scrutin. In: Histoire de L’Academie Royale desSciences (1784).
[2] Copeland, A.H.: A “reasonable” social welfare function. Notes from a seminar on applica-tions of mathematics to the social sciences, Unviersity of Michigan (1951).
[3] Gehrlein, W.V., Fishburn, P.C.: Coincidence Probabilities for Simple Majority and Posi-tional Voting Rules. Social Science Research 7 (1978), 272–283.
[4] Klamler, C.: The Dodgson ranking and its relation to Kemeny’s method and Slater’s rule.Social Choice and Welfare, forthcoming (2002).
[5] Laffond, G. et. al.: Condorcet choice correspondences: a set-theoretical comparison. Math-ematical Social Sciences 30 (1995), 23–35.
[6] Nurmi, H.: Discrepancies in the outcomes resulting from different voting schemes. Theory
and Decision 25 (1988), 193–208.[7] Ratliff, T.C.: A comparison of Dodgson’s method and Kemeny’s rule. Social Choice and
Welfare 18 (2001), 79–90.[8] Ratliff, T.C.: A comparison of Dodgson’s method and the Borda count. Economic Theory
20 (2002), 357–372.[9] Saari, D.G.: Basic Geometry of Voting. Springer 1995.
[10] Saari, D.G., Merlin, V.R.: The Copeland method I: relationships and the dictionary. Eco-nomic Theory 8 (1996), 51-76.
Analysis and Design of Electoral Systems 749
[11] Tataru, M., Merlin, V.R.: On the relationship of the Condorcet winner and positional votingrules. Mathematical Social Sciences 34 (1997), 81–90.
Selecting Committees Without Complete PreferencesThomas Ratliff
In many ways, the Condorcet criterion is the most natural way to compare can-didates: if one candidate is preferred to every other candidate in head-to-headelections, then it is plausible to argue that this candidate should be the winner.When choosing a committee of size m, we can apply a similar criterion.
Definition 1. Given a profile with n candidates A1, A2, . . . , An, define the Con-dorcet committee of size m to be the set M of m candidates such that Ai ispreferred to Aj in pairwise elections for all Ai ∈ M and all Aj �∈ M .
As we know very well, the Condorcet winner may not exist since there maybe a cycle among the top-ranked candidates, and a cycle involving all candidateswould preclude the existence of a Condorcet committee. Notice that we are merelypartitioning the candidates into two disjoint groups: those on the committee andthose off. We do not care whether we have cycles within the disjoint groups, butonly that those on the committee are preferred to those not on the
committee.When there is no Condorcet winner, Charles Dodgson (aka Lewis Carroll) pro-
posed in 1874 picking the candidate that is “closest” to being a Condorcet winnerby choosing the candidate that requires the fewest adjacent switches in the voters’preferences to become the Condorcet winner. Since he is selecting a single
winner, Dodgson does not care if there is a cycle among the remaining candi-dates; requiring a complete transitive ranking forces more structure than Dodgsonviews as necessary. We can easily adapt Dodgson’s method to measure how far aset of m candidates is from being the Condorcet committee.
Definition 2. In an election with n candidates, define the Dodgson Committee,denoted DCm, to be the set of size m that requires the fewest adjacency switches sothat Ai is preferred to Aj in pairwise elections for all Ai ∈ DCm and all Aj �∈ DCm.
There are, however, several anomalous results that can arise:• The Condorcet winner may be excluded from DCm.• If j �= k, then DCj and DCk may be disjoint or may have any number of
candidates in common.These results can be found in “Some startling inconsistencies when electing com-mittees”, T. Ratliff, Social Choice and Welfare 21 3 (2003), 433–454.
In addition to these inconsistencies, a fundamental objection to selecting acommittee based on the rankings of individual candidates is that this may notactually capture the voters’ preferences. Voters are often concerned with theoverall composition of the committee and consider how the individual memberswill interact. For example, a voter may prefer two candidates in their top-ranked
750 Oberwolfach Report 14/2004
committee because they represent contrasting viewpoints, but would not want onecandidate on the committee without the other. A strict listing of the individualcandidates could not detect such a preference without additional information.
The motivation for considering this issue arose in the spring of 2003 at WheatonCollege in Massachusetts during the selection of three faculty to serve on the searchcommittee for the next president of the college. When Wheaton had last conducteda presidential search in 1992, three men were elected as the faculty representativeson the committee, which was very controversial on the campus. Wheaton has along standing commitment to gender balance and awareness, partially based uponits history as a women’s college (Wheaton began admitting men in 1988). Thefaculty was almost evenly divided between women and men, and the election ofthree men was acceptable to almost no one, including those who were selectedto serve on the committee. The selection was a result of a process that onlyconsidered voters’ preferences for individual candidates and not their preferencesfor the overall composition of the representatives.
The goal was to select one faculty representative from each of the three aca-demic divisions of the college. An initial ballot used approval voting to reducethe field of possible candidates to six, two from each of the divisions, and thefinal ballot allowed the faculty to select their preferred candidate in each division.This approach seems very reasonable on the surface. However, by decomposingthe voters’ preferences of the overall composition of the committee into choiceson individual candidates, the procedure selected candidates that were individu-ally preferred by a majority, but the overall composition was nearly unanimouslyunacceptable.
We should not divorce the voters’ opinions of the overall group into opinions ofindividual candidates. This can be viewed as analogous to some of the objectionsthat are raised to the binary independence axiom in Arrow’s Theorem: If completetransitive rankings of candidates are broken down into comparisons on pairs andthen reassembled to gain an overall ranking, then vital information is lost.
Because of the experience with the selection process in 1992, the faculty atWheaton were open to adopting another voting method in 2003. The facultycommittee responsible for all faculty elections (of which the author is a member)proposed a different method for the final ballot. An approval voting nominatingballot was used as in 1992 to reduce the field to two faculty members from each ofthe three divisions. Since the requirement was that there be one faculty memberfrom each division selected, this left a total of eight possible groups of facultyrepresentatives. The final ballot asked the voters to rank the eight possible groups,and the Borda Count was used to select the winning group.
There are several interesting observations in this election.
• Of the 71 ballots received, only three were disqualified because the voterfailed to rank all eight groups.
• The group selected by the Borda Count was also the Condorcet winner.• The voters’ rankings indicate that their preferences are more complex than
could be detected by a simple listing of the candidates or by simple yes/no

Analysis and Design of Electoral Systems 751
votes on the individual candidates. For approximately half of the voters(35 out of 68), their first place and last place committees were not disjoint.For seven of these voters, their first and last place committees differed bya single candidate.
• There are very few rankings that appear more than once; there are 64distinct rankings from the 68 voters. Even if we restrict to the top threegroupings in each ranking, there are still 45 distinct rankings, and thelargest duplicate ranking had only five voters.
Overall, the Wheaton faculty were very pleased with the process and the out-come. However, several faculty commented that they would have had a difficulttime ranking more than eight options. In general, it will often be impractical toexpect the voters to rank all possible committees since the number of possiblecommittees can be extremely large even for a small number of candidates. Forexample, there are 210 possibilities when selecting a committee of size four froma group of ten candidates.
We define an intermediate approach for selecting a committee that is basedupon each voter ranking their top k committees, for some fixed value of k. Fromthis partial ranking, we want to detect overlap within the ranked committees andto extract groups of candidates that the voters believe would work well together.
Definition 3. Assume that there are n possible candidates for a committee ofsize m and that each of the N voters ranks their top k committees.
Build a weighted graph G with n vertices corresponding to the n candidates.We form a complete graph with edges connecting every pair of vertices, and alsoinclude n loops, one for each vertex. Initially assign a weight of zero to every edgein G, and then determine the weights of the edges by examining the rankings ofeach of the N voters as follows:
• For a voter’s top ranked committee, add k to each edge connecting can-didates listed in the committee, including the loop that connects eachcandidate to itself.
• Apply the same technique to the second ranked committee, except in thiscase we add k − 1 to each edge.
• In general, for the jth ranked committee, add k − j + 1 to the edgescorresponding to this committee.
The (not necessarily unique) winning committee Cm is the subgraph of G with mvertices of maximal weight.
Note that the reason for including the loops is to recognize overlaps in voters’preferences for single candidates as well the overlap in groups of candidates. Alsonotice that we can easily represent G as a symmetric n × n matrix M where the(i, j) entry corresponds to the weight of the edge connecting candidates i and j.
An objection to this approach is that it only detects an overlap in voters’ prefer-ences of single candidates or of pairs of candidates but places no additional weight
752 Oberwolfach Report 14/2004
on triples or quartets of candidates. A natural extension would be to form a hyper-graph that includes all subsets up to size m and weight the hypergraph similarly.
A Question for Mathematicians: Would Disputed Elections Be(Sufficiently) Less Probable If U.S. Presidents Were Directly Elected?
Jack H. Nagel
In the 2000 U.S. presidential election, the very close vote in the pivotal state ofFlorida led to an agonizing recount that was ended by a highly controversial deci-sion of the U.S. Supreme Court. The debacle provoked renewed calls for abolitionof the Electoral College (E.C.). However, defenders of that institution counteredthat the E.C. system, by confining disputed results to just one state (or a smallset of states), renders the problems of disputed outcomes much less severe than itwould be if a national direct vote resulted in an extremely close vote, thus touchingoff a nightmarish Florida-style recount nationwide.
While conceding that a national recount would be worse than one confined toa single state, I conjecture that the E.C. structure makes the probability of such adispute substantially higher than it would be with a national direct vote. As I ama political scientist and not at all a mathematician, I pose the following problemto my mathematical colleagues: Is it the case that
Prob[(V1,N − V2,N ) < TN ] Prob[{sj} : {sj} is critical to a winningcandidate’s Electoral College victory and(V1,j − V2,j) < Tj for all sj],
where V1,N and V2,N are the popular vote totals nationwide of the leading can-didate and the runner-up; {sj} is a set of states with one or more members; V1,j
and V2,j are the candidates popular vote totals in state j; and TN and Tj are votemargins that would “trigger” (either in a mandatory or in a permissive sense)recounts nationally and in state j, respectively.
Currently, 28 states specify recount triggers — 15 for mandatory (automatic)recounts and 13 for margins below which candidates are permitted to request re-counts. The U.S. has never held a nationwide direct election, so TN must be setsomewhat arbitrarily. The analysis might be carried out with several possible val-ues (e.g., 10K, 50K, 100K, and 250K). A key premise, however, is that althoughrecount triggers as absolute numbers may grow with the size of the electorate, asa percentage of the total vote, they decrease. That principal already exists in thelaws of 10 states, which specify that recounts in statewide elections require a mar-gin that is a lower percentage of the vote than recounts in smaller election districts.In addition, when comparing across states, numerical triggers are only modestlyassociated with state populations, and they rise at a decreasing rate. There are,however, two exceptions, both extreme outliers with remarkably liberal triggersfor recount requests (Texas and Illinois). Besides examining legal requirements, I

Analysis and Design of Electoral Systems 753
am also attempting to find out the vote margins in elections where recounts wereactually held, especially in the larger states and particularly in Texas and Illinois.
In addition to seeking the help of a mathematician or statistician for a compar-ison of the two probabilities based on a priori assumptions, I also plan a historicalanalysis based on actual nationwide and state-by-state popular vote margins.
Postscript: I am very pleased to report that the Workshop will result in justthe sort of collaborative effort for which I hoped. Another participant, ProfessorVincent Merlin of the University of Caen, has already conducted closely relatedanalyses concerning the likelihood of “wrong-winner” elections (also known asthe majority paradox or the referendum paradox) under district-based electionstructures like the Electoral College. He has taken an interest in the problemI pose, and we plan to work together on it in June 2004, during a visit he hasscheduled to the U.S.
Probability Models for the Analysis of Voting Rules in a Federal UnionVincent Merlin
In an election between two parties (A and B, Left and Right, Yes and No) itmight be that a party wins in a majority of districts (or states, constituencies,etc...) while it gets less votes than its opponent in the whole country. In SocialChoice Theory, this situation is known as the compound majority paradox, orthe referendum paradox. Although occurrences of such paradoxical results havebeen observed worldwide in political elections (e.g. United States, United King-dom, France), no study evaluates theoretically the likelihood of such situations.We propose three probability models in order to tackle this issue. The first twomodels have been used for a long time in social choice theory to compute the the-oretical likelihood of discrepancies among voting rules in the three candidate case.The Impartial Culture (IC) assumption states that each voter picks randomlyand independently his party affiliation with probability one half. The ImpartialAnonymous Culture (IAC) assume that in each district every result is equallylikely: Party A has the same probability to get 45%, 65% or 100% of the votein a given constituency. However, if the number of districts is large enough, thedistribution of the votes in favor of A in the country will follow a normal distri-bution centered around the point 50%. Thus, both IC and IAC models assumethat the competition between A and B is close in the whole country. The thirdmodel introduce a bias (or shift) in favor of a party. The Biased and RescaledImpartial Anonymous Culture (BRIAC) assumes that the percentage of votes forA in a given district is drawn uniformly on the interval [12 − D + E, 1
2 + D + E].The bias in favor of A is measured by E and the dispersion by D. In fact, theonly key parameter of this model is p = E/D. The value E = 0 gives back theIAC model, up to scaling factor.
For the case where each district has the same (large) population and the ICmodel, our results prove that the likelihood of this paradox is 16.2% in the three-district case and computer simulations show that it rapidly tends to 20,5% when

754 Oberwolfach Report 14/2004
the number of districts increases. The same pattern is observed under the IACassumption: The probability of the paradox is 12.5 % with three districts and weestimates that it tends to 16.5% as the number of districts increases. This proba-bility decreases with the number of states when a candidate receives significativelymore vote than his opponent over the whole country (parameter p of the BRIACmodel). However, p needs to be larger than 0.1 (e.g. 1% bias for ± 10% dispersion)to get a significative result.
In the case of unequal population state, a new question arises : what is theapportionment method which minimizes the probability of the paradox under agiven probability model? Let m = (m1, . . . , mi, . . . mN ) be the vector of thedistribution of the population on the N districts, and ai be the number of mandatesfor district i. More precisely, we assume that ai = mβ
i for the IC case and ai = mαi
for the IAC case. We then run several computer simulations for different values ofthe vector m in order to find the optimal values of α and β. In each case, we findout that the minimal value for the paradox has been obtained around α = 1 for theIAC model, and around β = 0.5 for the IC model. This last result with the IC caseis consistent with some previous results by Felsenthal and Machover on the valueof β that minimizes the mean majority deficit. Computers simulations also tendto show that the probability of the paradox slightly increases as the inequalitiesamong the states in term of population increase.
References
[1] S. Barbera and M. Jackson: On the Weights of Nations: Assigning Voting Power to Het-erogeneous Voters. mimeo, August 2003.
[2] D. Felsenthal and M. Machover: Minimizing the mean majority deficit: The second squareroot rule. Mathematical Social Sciences 37 (1999), 25–37.
[3] V. Merlin, M. Tataru and F. Valognes: On the Probability that all Decision Rules Select theSame Winner. Journal of Mathematical Economics 33 (2000), 183–208.
[4] M. Feix, D. Lepelley, V. Merlin and J.L. Rouet: The Probability of Conflicts in a U.S.Presidential Type Election. Economic Theory (2004).
[5] M. Feix, D. Lepelley, V. Merlin and J.L. Rouet: Fair and Efficient Representation of theCitizens in a Federal Union. mimeo, 2003.
Foundations of Behavioral Social Choice ResearchMichel Regenwetter
This presentation consists of two parts. In the first part, I provide an overviewof a forthcoming book with the same title, co-authored with Bernard Grofman(University of California at Irvine), A.A.J. Marley (University of Victoria) andIlia Tsetlin (INSEAD). This book is a synergetic summary of several underlyingjournal articles [1, 2, 3, 4, 5, 6, 8, 9, 7]. We provide a mathematical modeling andstatistical inference framework
that is tailored towards developing descriptive (as opposed to normative) the-ories of social choice behavior and towards testing them against empirical data.We believe that our work provides a first

Analysis and Design of Electoral Systems 755
systematic attempt towards a formal behavioral theory of social choice behav-ior, in the spirit of behavioral economics and of behavioral decision theory (a laKahneman and Tversky). Our empirical
work on majority rule decision making demonstrates that some influential strandsof theoretical research (the impartial culture assumption, domain restriction condi-tions such as Sen’s value restriction and Black’s single peakedness) are descriptivelyinvalid. I now highlight our six most important contributions.
(1) We argue for the limited theoretical relevance and demonstrate the lackof empirical evidence for cycles in mass electorates by replacing “value
restriction” and similar classic domain restriction conditions, as wellas the “impartial culture” assumption, with more realistic assumptionsabout preference distributions. We show that our behaviorally plausibleconditions, which we validate on empirical data, predict that majority ruledecision making is extremely unlikely
to generate cycles (among sincere preferences) for realistic distributionsin mass electorates. A major implication is that majority rule provides a‘solution’ (in practice) to Arrow’s impossibility theorem.
(2) In order to better integrate social choice research with the other decisionsciences, we expand the classical domains of permissible preference statesby allowing for more general binary preference relations than linear orweak orders and by considering probabilistic representations of preferenceand utility, including a broad range of random utility models.
(3) We develop methodologies to (re)construct preference distributions fromincomplete data, i.e., data which do not provide either complete rankingsor complete sets of pairwise comparisons.
(4) We highlight the dependence of social choice results on assumed modelsof preference or utility.
(5) We develop a statistical sampling and Bayesian inference framework thatusually places tight upper and lower bounds on the probability of anymajority preference relation (cycle or not). We also discuss how suchstatistical considerations of social choice processes dramatically alter thefocus of what are important research questions: For instance, finding thecorrect winner is often more important than worrying about cycles. Sta-tistical and empirical considerations can also reverse some famous policyimplications: For instance, high turnout, not low turnout, as often argued,is desirable when using majority rule.
(6) We demonstrate that in situations where sampling may be involved, mis-representation (i.e., erroneous evaluations) of the majority preferences isa far greater (and much more probable) threat to democratic decisionmaking than majority cycles.
In the second part of the presentation, I give an overview of results from a sys-tematic analysis of American Psychological Association election data under thesingle transferable vote (STV), for four elections, each with five candidates andnearly 20,000 voters. This is collaborative work with graduate students Arthur

756 Oberwolfach Report 14/2004
Kantor (University of Illinois at Urbana-Champaign) and Aeri Kim (University ofIllinois at Urbana-Champaign). A full report on this work will be submitted forpublication in a major research journal. STV is a particularly interesting para-digm for behavioral social choice research because the ballots provide partial orfull preference rankings from the voters. To summarize our main findings: We useseveral methods to infer majority, Borda, plurality, STV, and other social welfareorders from the ballot data. We can report with high statistical confidence thatthere were no majority cycles, that the social welfare orders under majority ruleand Borda were essentially identical, and that STV generates outcomes that areconsistent with both of these classical criteria. Our findings are robust across mul-tiple methods of data analysis. We also discuss the fact that some real world STVelections are tallied in a probabilistic fashion and we compare the probabilistictally to the deterministic ‘genuine STV’ tally as defined by the British ElectoralReform Society.
References
[1] Doignon, J.-P. and Regenwetter, M.: An approval-voting polytope for linear orders. Journalof Mathematical Psychology 41 (1997), 171–188.
[2] Regenwetter, M., Adams, J., and Grofman, B.: On the (sample) Condorcet efficiency ofmajority rule: An alternative view of majority cycles and social homogeneity. Theory andDecision 53 (2002), 153–186.
[3] Regenwetter, M. and Grofman, B.: Approval voting, Borda winners and Condorcet winners:Evidence from seven elections. Management Science 44 (1998), 520–533.
[4] Regenwetter, M. and Grofman, B.: Choosing subsets: A size-independent probabilistic modeland the quest for a social welfare ordering. Social Choice and Welfare 15 (1998), 423–443.bibitemRegenwetter:Grofman:Marley:Tsetlin:2003 Regenwetter, M., Grofman, B., Marley,A., and Tsetlin, I.: Foundations of behavioral social choice research. Cambridge UniversityPress (Political Science Series), forthcoming.
[5] Regenwetter, M., Grofman, B., and Marley, A. A. J.: On the model dependence of majoritypreferences reconstructed from ballot or survey data. Mathematical Social Sciences: specialissue on random utility theory and probabilistic measurement theory 43 (2002), 453–468.
[6] Regenwetter, M., Marley, A. A. J., and Grofman, B.: A general concept of majority rule.Mathematical Social Sciences: special issue on random utility theory and probabilistic mea-surement theory 43 (2002), 407–430.
[7] Regenwetter, M., Marley, A. A. J., and Grofman, B.: General concepts of value restrictionand preference majority. Social Choice and Welfare 21 (2003), 149–173.
[8] Tsetlin, I. and Regenwetter, M.: On the probability of correct or incorrect majority prefer-ence relations. Social Choice and Welfare 20 (2003), 283–306.
[9] Tsetlin, I., Regenwetter, M., and Grofman, B.: The impartial culture maximizes the proba-bility of majority cycles. Social Choice and Welfare 21 (2003), 387–398.

Analysis and Design of Electoral Systems 757
Matchings and AllocationsMichel Balinski
(joint work with Mourad Baıou)
There are two distinct finite sets of agents, the row-agents I (“employees”) andthe column-agents J (“employers”). Each agent has a strict preference order overthe agents of the opposite set. The preferences are collectively called Γ. Eachemployee i ∈ I has s(i) units of work to offer, each employer j ∈ J seeks to obtaind(j) units of work, and π(i, j) ≥ 0 is the maximum number of units that i ∈ I maycontract with j ∈ J . Accordingly, a stable allocation problem [3] is specified by aquadruple (Γ, s, d, π) where Γ is a set of preferences, s > 0 a vector of |I| reals,d > 0 a vector of |J | reals, and π ≥ 0 an |I| by |J | matrix of reals.
Notation. i′ >j i means that agent j ∈ J prefers i′ to i in I, and similarly,j′ >i j means that agent i ∈ I prefers j′ to j in J . If either i ∈ I or j ∈ J
refuses to work with the other, then π(i, j) = 0. The set (i, j>) def= {(i, l) : l >i j}identifies all agents l ∈ J that are strictly preferred by row-agent i to column-agent j; and (i, j≥) def= {(i, l) : l ≥i j} all that are strictly preferred as well as jitself. The sets (i>, j) and (i≥, j) are defined similarly. In general, if S is a set,(r, S) def= {(r, s) : s ∈ S}, and similarly for (S, r); moreover, if y(s), s ∈ S, is a realnumber, then y(S) def=
∑s∈S y(s).
An allocation x =(x(i, j)
)of a problem (Γ, s, d, π) is a set of real-valued num-
bers satisfying
x(i, J) ≤ s(i), all i ∈ I,
x(I, j) ≤ d(j), all j ∈ J,
0 ≤ x(i, j) ≤ π(i, j), all (i, j) ∈ Γ,
called, respectively, the row, the column and the entry constraints. It may beassumed that π(i, j) ≤ min
{s(i), d(j)
}. An allocation x is stable if for every
(i, j) ∈ Γ,
x(i, j) < π(i, j) implies x(i, j≥) = s(i) or x(i≥, j) = d(j).
The recruitment or university admissions problem is an allocation problemwhere the π(i, j) = 0 or 1, the s(i) are positive integers, and the d(j) = 1; and thestable marriage problem is a recruitment problem where in addition the s(i) = 1.There is an extensive literature on these problems (see in particular the book [4]).
In general the set of stable allocations form a nonempty distributive lattice, andthe cardinality of the set may be exponential. However, generically, if the reals s,d, and π are chosen at random, then there exists exactly one stable allocation.
In the presence of many stable solutions it is of interest to determine a specificrule for choosing one. A rule is I-monotonic if when some agent i ∈ I goesup in the rankings of one or several of the agents J then i may only receive abetter allocation. A rule is I-strategy-proof if no subset of agents of I can altertheir preferences (that is, falsify them) and thereby obtain better allocations for

758 Oberwolfach Report 14/2004
themselves. Exactly one and the same rule is characterized by either of these twoproperties [2]. These characterizations have practical applications to recruitmentand admissions problems (for an expository account see [1]).
References
[1] Baıou, Mourad and Michel Balinski: Admissions and recruitment. American MathematicalMonthly 110 (2003), 386–399.
[2] Baıou, Mourad and Michel Balinski: Stable allocation mechanisms. Cahier du Laboratoired’Econometrie de l’Ecole Polytechnique, 2002-9.
[3] Baıou, Mourad and Michel Balinski: The stable allocation (or ordinal transportation) prob-lem. Mathematics of Operations Research 27 (2002), 485–503. Corrected version: 27 (2002),662–680.
[4] Roth, A. E., and M. Sotomayor: Two-Sided Matching: A Study in Game Theoretic Modelingand Analysis. Cambridge University Press, London/New York (1990).
Analysis of QM Rules in the Draft Constitution for Europe Proposedby the European Convention, 2003
Moshe Machover
We analyse and evaluate the qualified majority (QM) decision rules for the Councilof Ministers of the EU that are included in the Draft Constitution for Europeproposed by the European Convention. We use a method similar to the one weused in our paper on the Nice Treaty (Felsenthal and Machover 2001). However, weput a special stress on the power of a voter — in this case a minister representing aMember State on the CM — to block a proposed bill (Colemans “power to preventaction”).
We make a detailed comparison between the decision rule proposed by the DraftConstitution and that included in the Nice Treaty. We show that the former ismuch less equitable than the latter. On the other hand, the former achieves aradical — perhaps too radical — increase in effectiveness by means of a great (butuneven) reduction in blocking powers.
The criteria we use in our evaluation are grouped under two main headings:democratic legitimacy and effectiveness.
Democratic legitimacy. Here we view the CM as the upper tier of a compos-ite two-tier decision-making system. Assuming that each minister votes at the CMaccording to the majority opinion in his/her country, the indirect voters of thiscomposite system are the citizens of the EU, acting via their respective ministers.We use two main criteria for assessing democratic legitimacy.
First, equitability. (Slogan: One Person, One Vote!) According to PenrosesSquare-Root Rule (PSQRR), all EU citizens have equal (indirect) voting power iffthe voting powers of the Member States at the CM are proportional to the squareroot of the size their respective electorates.3
3For a proof, see Felsenthal and Machover (1998, pp. 667). Throughout, by voting power wemean voting power as quantified by the Penrose measure, aka “the absolute Banzhaf index”. Wetake population size as proxy for the size of the electorate.
Analysis and Design of Electoral Systems 759
We measure global deviation of a given QM rule from PSQRR using the indexof distortion D — variously attributed to Loosemore and Hanby (1971) or toDuncan and Duncan (1955) — between the distribution of the relative votingpowers (measured by the normalized Banzhaf index) under the given rule, andthe distribution prescribed by PSQRR. Individual deviations are measured byd := q − 1, where q is the ratio obtained by dividing the relative voting power ofa given Member State under a given rule by the relative power it ought to haveunder PSQRR. In the table below, D as well as max |d| (the maximal value of d)and ran(d) (the range of d, i.e., the difference between the greatest and smallestvalues of d) are given in percentage terms.
Second, majoritarianism. (Slogan: Majority Rule!) In any non-trivial two-tier system such as the one under consideration, it is possible that the decisionat the upper tier may go against the majority of the indirect voters at large.When this happens, the margin by which the majority of citizens opposing thedecision exceeds the minority supporting it is the majority deficit of the decision.(If the decision is not opposed by a majority of the citizens, the majority deficitis 0.) Assuming random voting (independent flipping of true coins), the majoritydeficit is a non-negative random variable. Its expected (mean) value ∆ — themean majority deficit — is a measure of the deviation of the given QM rule frommajoritarianism.
A third putative criterion of democratic legitimacy — maximization of thesum of the citizens voting powers (slogan: Power to the People!) — turns outto be redundant. This is because this sum, denoted by Σ, satisfies the identityΣ = Σmax2∆, where Σmax is the maximal value of Σ, obtained under majority ruleEU-wide direct referendum.4 In fact, our calculation of ∆ uses this very identity.
Effectiveness. Here we view the CM as a decision-making body in its ownright, ignoring its role in the two-tier system. The main measure of effectiveness(or compliance) of a decision rule is Colemans index A (“ability of the collectivityto act”).5 A is the a priori probability that a bill will be approved (rather thanblocked) by the CM. It is given by A := ω/2n, where ω is the number of divisionswhose outcome is positive (= the number of so-called winning coalitions) and nis the number of voters — in our case, Member States. Equivalently, but moresuggestively, we measure resistance to approving a bill in terms of a priori bettingodds against a bill being approved.
Results. Some of our results are summarized in the following table.As we can see, C27 is much less equitable than N27 and even than the present
rule. The present rule has two egregious individual deviations: Germany with20.1% less than its equitable share of voting power, and Luxembourg with 124.1%more than it “deserves; but the overall deviation from equitability, as measured byD, is much worse in the case of C27. The latter over-endows the four largest andsix smallest Member States and under-endows all the rest. The two most egregiouscases are Malta (118.2% too much) and Greece (20.8% too little). On the other
4For a proof, see Felsenthal and Machover (1998, pp. 6061).5Coleman (1971).
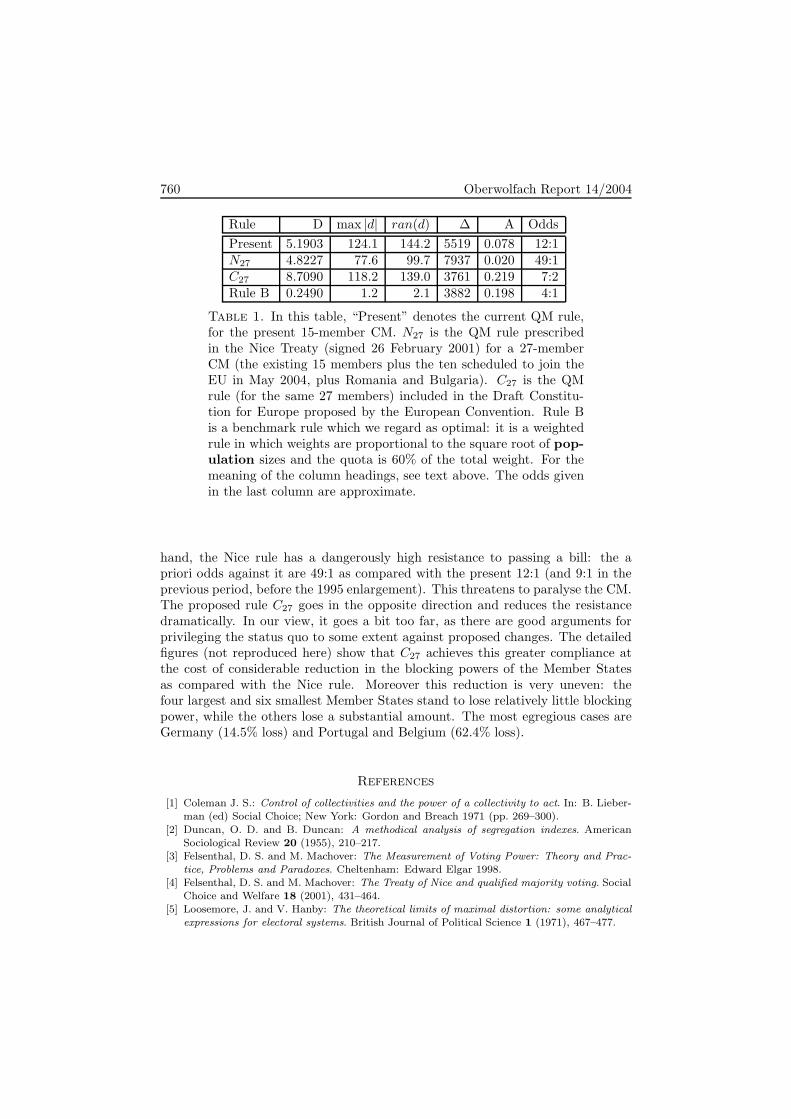
760 Oberwolfach Report 14/2004
Rule D max |d| ran(d) ∆ A OddsPresent 5.1903 124.1 144.2 5519 0.078 12:1N27 4.8227 77.6 99.7 7937 0.020 49:1C27 8.7090 118.2 139.0 3761 0.219 7:2Rule B 0.2490 1.2 2.1 3882 0.198 4:1
Table 1. In this table, “Present” denotes the current QM rule,for the present 15-member CM. N27 is the QM rule prescribedin the Nice Treaty (signed 26 February 2001) for a 27-memberCM (the existing 15 members plus the ten scheduled to join theEU in May 2004, plus Romania and Bulgaria). C27 is the QMrule (for the same 27 members) included in the Draft Constitu-tion for Europe proposed by the European Convention. Rule Bis a benchmark rule which we regard as optimal: it is a weightedrule in which weights are proportional to the square root of pop-ulation sizes and the quota is 60% of the total weight. For themeaning of the column headings, see text above. The odds givenin the last column are approximate.
hand, the Nice rule has a dangerously high resistance to passing a bill: the apriori odds against it are 49:1 as compared with the present 12:1 (and 9:1 in theprevious period, before the 1995 enlargement). This threatens to paralyse the CM.The proposed rule C27 goes in the opposite direction and reduces the resistancedramatically. In our view, it goes a bit too far, as there are good arguments forprivileging the status quo to some extent against proposed changes. The detailedfigures (not reproduced here) show that C27 achieves this greater compliance atthe cost of considerable reduction in the blocking powers of the Member Statesas compared with the Nice rule. Moreover this reduction is very uneven: thefour largest and six smallest Member States stand to lose relatively little blockingpower, while the others lose a substantial amount. The most egregious cases areGermany (14.5% loss) and Portugal and Belgium (62.4% loss).
References
[1] Coleman J. S.: Control of collectivities and the power of a collectivity to act. In: B. Lieber-man (ed) Social Choice; New York: Gordon and Breach 1971 (pp. 269–300).
[2] Duncan, O. D. and B. Duncan: A methodical analysis of segregation indexes. AmericanSociological Review 20 (1955), 210–217.
[3] Felsenthal, D. S. and M. Machover: The Measurement of Voting Power: Theory and Prac-tice, Problems and Paradoxes. Cheltenham: Edward Elgar 1998.
[4] Felsenthal, D. S. and M. Machover: The Treaty of Nice and qualified majority voting. SocialChoice and Welfare 18 (2001), 431–464.
[5] Loosemore, J. and V. Hanby: The theoretical limits of maximal distortion: some analyticalexpressions for electoral systems. British Journal of Political Science 1 (1971), 467–477.
Analysis and Design of Electoral Systems 761
The Treaty of Nice and the Council of Ministers: A MathematicalAnalysis of the Distribution of Power
Werner Kirsch
The treaty of Nice (EU-summit, December 2000) contains a complicated three-step-procedure for decision making in the Council of Ministers of the EU. Fora proposal to pass, the first step requires a majority of countries (8 out of 15states, resp. 13 out of 25). The second step consists of a weighted voting withqualified majority rule. This means that the states are assigned a certain numberof votes (voting weights), which were the result of negotiations on the summit. Forexample, the four biggest states (Germany, France, United Kingdom and Italy)got 29 votes each, Spain and Poland, the next biggest countries, 27 votes each. Toapprove a proposal, more than (about) 70% of the votes are required, the exactthreshold depending on the current number of members of the Union. Whilethese weights are monotone in the countries population, they are pretty arbitraryotherwise, as Germany has more than 82 million citizens, France slightly less than60 million and Poland about 38 million. Mainly to appease Germany, the Nicetreaty contains a third voting step for the Council in which each state has anumber of votes proportional to its population. In this step, a support of 62% ofthe population (as represented by their governments) is required. With its threesteps, a far from transparent way to assign voting weights to the member statesand strange looking thresholds, the Nice procedure is certainly one of the mostcomplicated voting systems in history. For example, without a careful analysis,it is not at all clear to which extent the third step (“population voting”) affectsthe power of the members in the Council. It is, however, easy to see that the firststep of the voting is completely redundant as a qualified majority in the secondstep can only be achieved with a majority of countries. We use the Banzhaf indexto quantify the power distribution in the Council after Nice. If we neglect the“population voting”, the four big states obviously have the same power in thecouncil. It turns out that the third step has virtually no effect on the power of thebig states relative to each other. For example, the Banzhaf index of Germany forthe three-step-voting is only by 10−7 bigger than the one of France, although thepopulation of Germany is by more than one third bigger than the one of France.In other words: on average Germany will take advantage of its bigger populationin one out of ten million votes in the Council! The voting system for the Councilas provided by the Nice treaty seems to be very complicated and based on “smokybackroom negotiations” rather than on rational criteria. Moreover, with a 25 or27 member Union the threshold is so high, that an effective work of the Councilseems impossible.

762 Oberwolfach Report 14/2004
Assignments of Seats as a Modelling Example in the Classroom ofUpper Secondary Schools
Thomas Jahnke
In schools and even — to a certain extent — in universities, mathematics is oftentaught in a bureaucratic manner: getting and exercising and remembering stan-dard procedures and algorithms. Teaching and learning mathematics should bebased on principles like
• posing questions instead of answering them,• active investigations and• exploring and discovering.
Teaching and learning modelling could enrich the usual syllabus by its contents aswell as its methods. While application could be seen as looking from mathematicsto the “real world,” science and technology modelling emphasises the other direc-tion: looking from the real world towards mathematics in order to solve problemsby the use of mathematical knowledge and methods. We cannot define modellingbut we can characterise this activity by some essential points [2]:
• Mathematical modelling consists of applying your mathematical skills toobtain useful answers to real problems.
• Learning to apply mathematical skills is very different from learning math-ematics itself.
• Models are used in a very wide range of applications, some of which initiallydo not appear to be mathematical by nature.
• Models often allow quick and cheap evaluations of alternatives, leading tooptimal solutions which are not otherwise obvious.
• There are no precise rules in mathematical modelling and no ‘correct’answers.• Modelling can be learned only by doing.
While applications of mathematics often turn out to be a very straightforwardapproach from a problem to its unique solution, mathematical modelling is donestep by step in a specific circle.
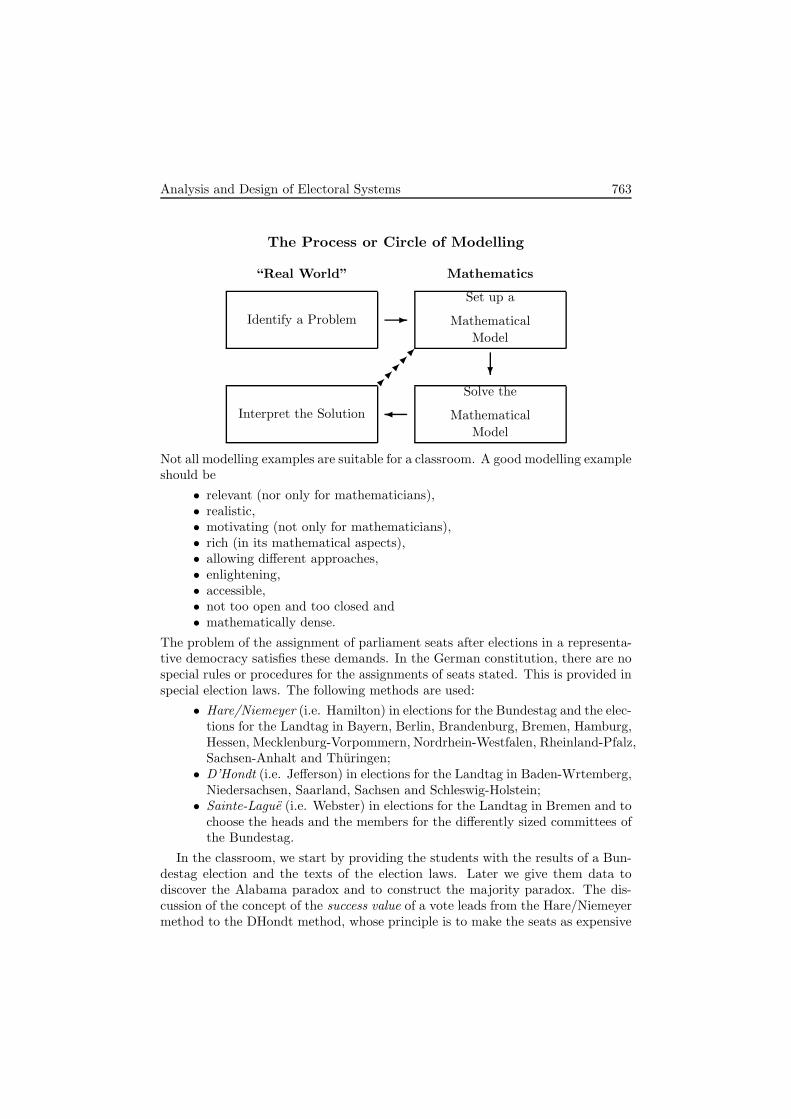
Analysis and Design of Electoral Systems 763
The Process or Circle of Modelling
“Real World” Mathematics
Identify a Problem
Set up a
MathematicalModel
Interpret the Solution
Solve the
MathematicalModel
�
�
������
Not all modelling examples are suitable for a classroom. A good modelling exampleshould be
• relevant (nor only for mathematicians),• realistic,• motivating (not only for mathematicians),• rich (in its mathematical aspects),• allowing different approaches,• enlightening,• accessible,• not too open and too closed and• mathematically dense.
The problem of the assignment of parliament seats after elections in a representa-tive democracy satisfies these demands. In the German constitution, there are nospecial rules or procedures for the assignments of seats stated. This is provided inspecial election laws. The following methods are used:
• Hare/Niemeyer (i.e. Hamilton) in elections for the Bundestag and the elec-tions for the Landtag in Bayern, Berlin, Brandenburg, Bremen, Hamburg,Hessen, Mecklenburg-Vorpommern, Nordrhein-Westfalen, Rheinland-Pfalz,Sachsen-Anhalt and Thuringen;
• D’Hondt (i.e. Jefferson) in elections for the Landtag in Baden-Wrtemberg,Niedersachsen, Saarland, Sachsen and Schleswig-Holstein;
• Sainte-Lague (i.e. Webster) in elections for the Landtag in Bremen and tochoose the heads and the members for the differently sized committees ofthe Bundestag.
In the classroom, we start by providing the students with the results of a Bun-destag election and the texts of the election laws. Later we give them data todiscover the Alabama paradox and to construct the majority paradox. The dis-cussion of the concept of the success value of a vote leads from the Hare/Niemeyermethod to the DHondt method, whose principle is to make the seats as expensive

764 Oberwolfach Report 14/2004
as possible. On the other hand, DHondt violates the upper quota condition andis biased in favour of the bigger parties.
So far, the students have worked on elections laws, procedures, paradox resultsand principles. The floor is now open to see the assignment problem in a moregeneral way:
Given votes v1 + v2 + v3 + . . . + vn = v and seats s1 + s2 + s3 +. . .+ sn = s, make the set (v1; v2; v3; . . . ; vn) as similar as possibleto the set (s1; s2; s3; . . . ; sn).
Now, the students are prepared and able to set up their own research program:(1) Which principles are realising justice the best?(2) Test the principles and discuss their consequences.(3) Find for every principle one or several algorithms to realise it.(4) Construct a procedure fulfilling positive or negative conditions.(5) Find visualisations for the different procedures.
Beside more formal questions likeassign the seats to the parties in a way that
• min{vi/si} is maximal,• |vi/si − v/s| is minimal,• |vi/si − vj/sj| is minimal,
the students discuss the whole modelling process and are asked to write a finalreport presenting their results. They learn modelling and get deep insights aboutthe problem as well as mathematics itself.
References
[1] T. Jahnke (ed.): Wahlen. Mathematik Lehren 88 (1998).[2] D. Edwards, M. Hamson: Guide to mathematical modelling. London 1989.
A Weighted Voronoi Diagram Approach to Political DistrictingBruno Simeone
(joint work with Isabella Lari and Frederica Ricca)
Soon after modern democracies were established, gerrymandering practices, con-sisting of partisan manipulation of electoral district boundaries, began to occur inseveral states and countries. In order to oppose such practices, researchers startedthinking of automatic procedures for political districting, designed so as to be asneutral as possible. Commonly adopted criteria are:
• Integrity: The territory to be subdivided into districts consists of territorialunits (wards, townships, counties, etc.) and each unit cannot be splitbetween two or more districts.
• Contiguity: The units of each district should be geographically contiguous,that is, one can walk from any point in the district to any other point ofit without ever leaving the district.

Analysis and Design of Electoral Systems 765
• Population equality (or population balance): Under the assumption that theelectoral system is majoritarian with single-member districts, all districtsshould have roughly the same population (one man – one vote principle).
• Compactness: Each district should be compact, that is, “closely and neatlypacked together” (Oxford Dictionary). Thus, a round-shaped district isdeemed to be acceptable, while an octopus- or an eel-like one is not.
A broad survey of political districting algorithms is given in (Grilli di Cortonaet al., 1999). Later work focuses on local search (e.g., Ricca and Simeone, 2000;Bozkaya, Erkut, and Laporte, 2003). It is also worth mentioning the branch-and-price approach in (Mehrotra, Johnson, and Nemhauser, 1998). Here we propose anovel approach based on weighted Voronoi regions (or diagrams). This notion isnot new in the literature, especially in the area of computational geometry (see,e.g., Aurenhammer and Edelsbrunner, 1984). What we believe to be new, besidesthe specific application to political districting, is our iterative updating of nodeweights to achieve population balance.
The input to our procedure is the following:• a contiguity graph G = (V, E), whose nodes represent the territorial units
and there is an edge between two nodes if the two corresponding units areneighboring;
• a positive integer r, the number of districts;• a subset S ⊂ V of r nodes, called centers (all remaining nodes will be
called sites);• positive integral node weights pi, i ∈ V , representing territorial unit popu-
lations;• positive real distances di,s for all sites i and all centers s.
We denote by P the mean district population (= (total population)/r).The integrity criterion dictates that a district must be a subset of nodes; ac-
cording to the contiguity criterion, such a subset must be connected.A district map is a partition of V into r connected subsets (the districts),
each containing exactly one center. Given any district map, we denote by Ds
the unique district containing center s. We look for a district map such that,informally speaking, the district population imbalance is small and the districtsare compact enough.
If one takes as districts the ordinary Voronoi regions w.r.t. the distances di,s,a good compactness is usually achieved, but a poor population balance mightensue. In order to re-balance district populations, one would like to promotesite migration out of “heavier” districts (populationwise) and into lighter ones.Then the basic idea is to consider weighted distances d′i,s = ws · di,s, where eachweight ws is proportional to Ps, the population of district Ds; and to perform aVoronoi iteration w.r.t. the biased distances d′i,s. Do this iteratively: at iterationk, k = 1, 2, . . . , two different recursions may be taken into consideration, namely,a static one,
dki,s =
P k−1s
Pd0
i,s , i ∈ V \ S, s ∈ S
766 Oberwolfach Report 14/2004
and a dynamic one,
dki,s =
P k−1s
Pdk−1
i,s , i ∈ V \ S, s ∈ S ,
where, in both cases, d0i,s = di,s, P 0
s is the population of the (ordinary) Voronoiregion containing center s, and P k
s is the population of Ds after iteration k =1, 2, . . .; stop as soon as the districts become stable.
The above sketched algorithm will be called a full transfer one. One may alsoconsider a single transfer version of it, by letting sites migrate from one district toanother one at a time. Here too, one may adopt either the static or the dynamicrecursion defined above. So one gets altogether four variants of the weightedVoronoi algorithm (static/dynamic recursion; full/single transfer).
One possible implementation of the single transfer algorithm is the following:at iteration k, site i is a candidate for migrating from Dq to Dt if:
(1) P k−1t = min{P k−1
s : s = 1, . . . , r}(2) dk
i,t = min{dkj,t : j �∈ Dt}
(3) dki,t < dk
i,q
(4) P kt < P k−1
t
The algorithm stops when the set of candidates is empty.Next, we define four desirable properties to be met by weighted Voronoi algo-
ritms — or at least by some variants of them.(i) Order invariance: dk
i,s < dkj,s ⇐⇒ di,s < dj,s, s ∈ S; i, j ∈ V \ S.
(ii) Re-balancing: At iteration k = 1, 2, . . . , site i migrates from Dq to Dt onlyif P k−1
q > P k−1t .
Definition 1. Given a graph G and any two nodes i, j of G, a geodesic betweeni and j is any shortest path between i and j in G when all edge-lengths are equalto 1. The geometric distance between i and j in G is the number of edges in anygeodesic between i and j.
(iii) Geodesic consistency: At any iteration, if node j belongs to district Ds
and node i lies on any geodesic between j and s, then i also belongs toDs.
One can show that geodesic consistency implies contiguity, but the converse doesnot necessarily hold. Moreover, geodesic consistency holds when the input dis-tances are geometric distances on the contiguity graph G. On the other hand,some counterexamples show that for arbitrary input distances contiguity mightnot hold.
(iv) Finite termination.Finite termination in general is not guaranteed, as shown by counterexamples.However, one can prove that the single transfer dynamic weighted Voronoi algo-rithm, under conditions (1) – (4) above, enjoys finite termination.
The following table shows the results we have obtained so far.
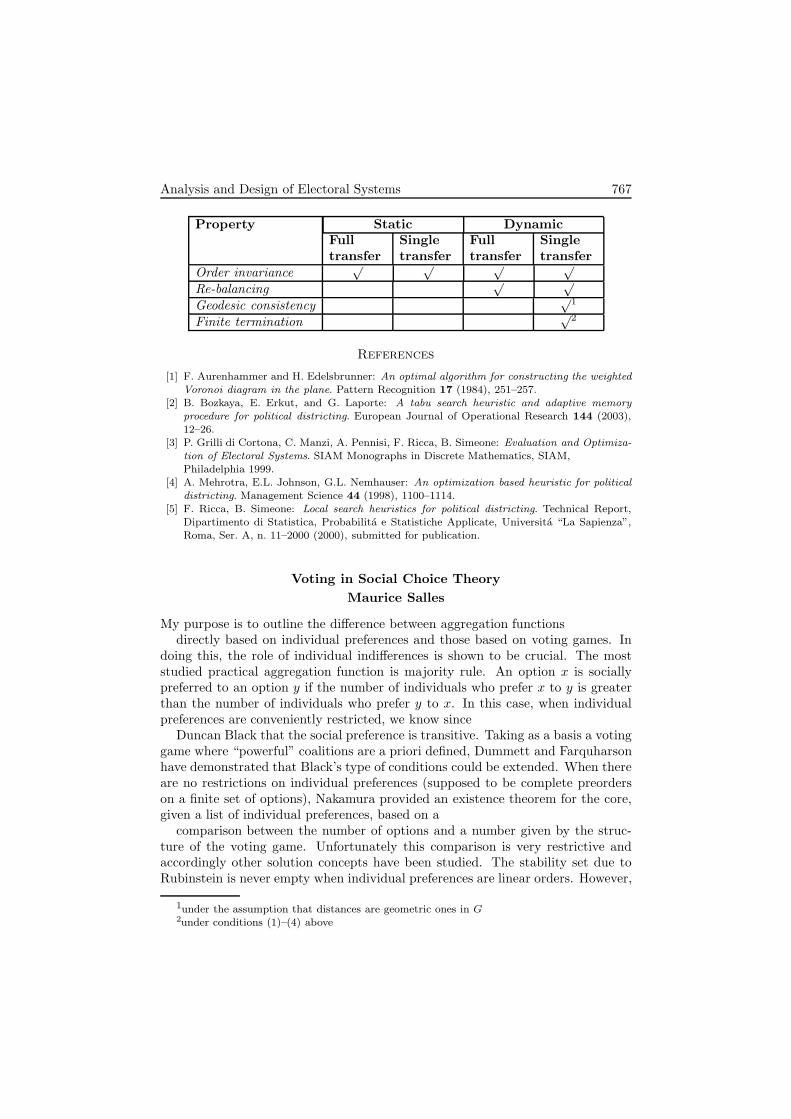
Analysis and Design of Electoral Systems 767
Property Static DynamicFulltransfer
Singletransfer
Fulltransfer
Singletransfer
Order invariance√ √ √ √
Re-balancing√ √
Geodesic consistency√1
Finite termination√2
References
[1] F. Aurenhammer and H. Edelsbrunner: An optimal algorithm for constructing the weightedVoronoi diagram in the plane. Pattern Recognition 17 (1984), 251–257.
[2] B. Bozkaya, E. Erkut, and G. Laporte: A tabu search heuristic and adaptive memoryprocedure for political districting. European Journal of Operational Research 144 (2003),12–26.
[3] P. Grilli di Cortona, C. Manzi, A. Pennisi, F. Ricca, B. Simeone: Evaluation and Optimiza-tion of Electoral Systems. SIAM Monographs in Discrete Mathematics, SIAM,Philadelphia 1999.
[4] A. Mehrotra, E.L. Johnson, G.L. Nemhauser: An optimization based heuristic for politicaldistricting. Management Science 44 (1998), 1100–1114.
[5] F. Ricca, B. Simeone: Local search heuristics for political districting. Technical Report,Dipartimento di Statistica, Probabilita e Statistiche Applicate, Universita “La Sapienza”,Roma, Ser. A, n. 11–2000 (2000), submitted for publication.
Voting in Social Choice TheoryMaurice Salles
My purpose is to outline the difference between aggregation functionsdirectly based on individual preferences and those based on voting games. In
doing this, the role of individual indifferences is shown to be crucial. The moststudied practical aggregation function is majority rule. An option x is sociallypreferred to an option y if the number of individuals who prefer x to y is greaterthan the number of individuals who prefer y to x. In this case, when individualpreferences are conveniently restricted, we know since
Duncan Black that the social preference is transitive. Taking as a basis a votinggame where “powerful” coalitions are a priori defined, Dummett and Farquharsonhave demonstrated that Black’s type of conditions could be extended. When thereare no restrictions on individual preferences (supposed to be complete preorderson a finite set of options), Nakamura provided an existence theorem for the core,given a list of individual preferences, based on a
comparison between the number of options and a number given by the struc-ture of the voting game. Unfortunately this comparison is very restrictive andaccordingly other solution concepts have been studied. The stability set due toRubinstein is never empty when individual preferences are linear orders. However,
1under the assumption that distances are geometric ones in G2under conditions (1)–(4) above
768 Oberwolfach Report 14/2004
this property does not hold when individual preferences are complete preorders.Le Breton and Salles then obtained results using the same number as the
number used by Nakamura. Some other solution concepts are based on binaryrelations that are transitive so that obtaining maximal elements is not a problemwhen the set of options is finite. The interesting mathematical aspects in this caseare due to the consideration of sets of options having a geometrical or topologicalstructure (the problems we are then facing are related to the absence of continuityproperties of the relevant social preference
relation). When the space of options is a compact part of the Euclidean space,the core is non-empty when the dimension of the Euclidean space is convenientlyrestricted (this was shown by Greenberg, and extended by Saari).
Dividing the Indivisible: Procedures for Allocating Cabinet Ministriesto Political Parties in a Parliamentary System
Steven J. Brams(joint work with Todd R. Kaplan)
How coalition governments in parliamentary democracies form and allocate cab-inet ministries to political parties is the subject of a substantial empirical andtheoretical literature. By and large, a rule of proportionality, whereby partiesare given more ministries or more prestigious ministries (e.g., finance, foreign af-fairs, or defense) in proportion to their size, is followed. However, small centristparties that are pivotal in coalitions (e.g., the Free Democrats in Germany) havesuccessfully bargained for larger-than-proportional allocations.
This task is complicated when less-than-compatible parties, like the ChristianDemocrats and the Greens, join the same coalition. While fiscal conservatism andprotecting the environment are often at odds, these parties may still be accommo-dated if, for instance, the Christian Democrats are given the finance ministry andthe Greens the environmental-protection ministry, and each has major influenceover policies in its area.
To facilitate the allocation of cabinet ministries to political parties, we pro-pose procedures that take into account both party interests and party size. Thismechanism shifts the burden of making cabinet choices from the prime ministerdesignate, or formateur, who is usually the leader of the largest party in a coalitiongovernment, to party leaders that join the government. Thereby these proceduresgive party leaders primary responsibility for the make-up of the coalition govern-ment.
We assess the fairness of this procedure, based on different criteria of fairness.Our analysis is inspired by an apportionment method used in Northern Ireland in1999 to determine the sequence in which parties made ministry choices (it has alsobeen used in Danish cities and the German Bundestag). This method works suchthat the largest party in a coalition gets first choice; presumably, it would choosethe position of prime minister. After that, the apportionment method determinesthe order of choice.

Analysis and Design of Electoral Systems 769
For example, suppose there are three parties, ordered by size A > B > C,and there are six ministries to be allocated. If the sequence is ABACBA, A willreceive three ministries, B two ministries, and C one ministry. But beyond thesenumbers, the sequence says that A is entitled to a second choice before C gets afirst choice, and C gets a first choice before B gets a second choice.
If parties have complete information about each others preferences, we showthat it may not be rational for them to choose sincerely — that is, to select theirmost-preferred ministry from those not yet chosen. Rather, a party (e.g., A)may do better postponing a sincere choice and, instead, selecting a less-preferredministry if (i) that ministry might be the next choice of a party that follows it in thesequence (e.g., B or C) and (ii) As sincere choice is not in danger of being selectedby B or C before As turn comes up again. Such sophisticated choices, which takeinto account what other parties desire, can lead to very different allocations fromsincere ones.
If there are only two parties, sophisticated choices and sincere choices both yieldPareto-optimal allocations: No parties, by trading ministries, can do better, basedon their ordinal rankings of ministries. However, this is not true if there are threeor more parties that make sophisticated choices, which was first demonstrated forsequential choices made in professional sports.
What we show here for the first time is the problem of nonmonotonicity: Apolitical party may do worse by choosing earlier in a sequence, independent ofthe Pareto-optimality of the sophisticated choices. Hence, the apparent advantagethat a partys size gives it by placing it early in a sequence can, paradoxically, workto its disadvantage — it may actually get more preferred choices by going later.
Like Pareto-nonoptimal allocations, nonmonotonicity cannot occur if partiesare sincere. Thus, we are led to ask how sincere choices might be recoveredorinduced in the first place if the parties know they “cannot get away with” insincerechoices. While there is an allocation mechanism that makes sincerity optimal fortwo parties, there are difficulties in extending it to more than two parties.
By putting the choice of ministries in the hands of party leaders, these lead-ers are made responsible for their actions. Ultimately, we believe, party leaderswill be more satisfied making their own choices rather than having to bargain forthem. Moreover, this greater satisfaction should translate into more stable coali-tion governments, which is a subject that has been extensively studied by a manyscholars.
The allocation procedures we analyze could go a long way toward minimizingthe horse trading that typically ensues when a formateur bargains with partyleaders over the ministries they will be offered. By cutting down on the rentsextracted in the bargaining process, a coalition government is likely to form moreexpeditiously and be less costly to maintain.
This is not to say that the procedures we discuss solve all problems. Becauseministries are indivisible, there will not generally be a perfect match of the claimsof each party and its allocation. Furthermore, there are certain problems that areineradicable, whatever allocation procedure is used. For example, it may not be

770 Oberwolfach Report 14/2004
possible to eliminate envy among equally entitled parties. Nevertheless, we believethe procedures that we discuss offer a promising start to attenuating conflicts thathave plagued the formation of coalition governments and, not infrequently, led totheir downfall.
Reporter: Johannes Ruckert

Analysis and Design of Electoral Systems 771
Participants
Prof. Dr. Fuad Aleskerov
Institute for Control SciencesRussian Academy of Sciences65 ProfsoyuznayaMoscow, GSP-7 117806 – Russia
Prof. Dr. Michel L. Balinski
Laboratoire d’Econometrie del’Ecole Polytechnique1, rue DescartesF-75005 Paris Cedex 05
Prof. Dr. Steven J. Brams
Department of PoliticsNew York University7th Floor726 BroadwayNew York NY 10003 – USA
Dipl.-Math.oec. Mathias Drton
Department of StatisticsUniversity of WashingtonBox 35 43 22Seattle, WA 98195-4322 – USA
Prof. Dr. Paul H. Edelman
Vanderbilt University Law School131 21st Avenue SouthNashville TN 37203-1181 – USA
Dr. Martin Fehndrich
Schloßstraße 90D–49080 Osnabruck
Prof. Dr. Thomas Jahnke
Institut fur MathematikUniversitat PotsdamPostfach 601553D–14415 Potsdam
Prof. Dr. Marc Kilgour
Department of MathematicsWilfrid Laurier UniversityWaterloo Ontario N2L 3C5 – Canada
Prof. Dr. Werner Kirsch
Mathematisches InstitutRuhr Universitat BochumUniversitatsstraße 150D–44780 Bochum
Mag. Christian Klamler
Institut fur Finanzwissenschaftund Offentliche WirtschaftKarl-Franzens-UniversitatUniversitatsstr. 15/E4A-8010 Graz
Prof. Dr. Moshe Machover
5, Milman RoadQueen’s ParkGB-London NW6 6EN
Prof. Dr. Vincent R. Merlin
Charge de recherche du CNRSUniversity CaenPB 5186F-14032 Caen Cedex
772 Oberwolfach Report 14/2004
Prof. Dr. Jack H. Nagel
Department of Political ScienceUniversity of Pennsylvania208 S. 37th StreetPhiladelphia PA 19104-6215 – USA
Prof. Dr. Hannu Nurmi
Department of Political ScienceUniversity of Turku20014 Turun Yliopisto – Finland
Prof. Dr. Friedrich Pukelsheim
Lehrstuhl fur Stochastik und ihreAnwendungenInstitut fur Mathematik der Univ.Universitatsstr. 14D–86135 Augsburg
Prof. Dr. Victoriano Ramirez
Department of Applied MathematicsUniversity of GranadaEdificio Politecnico, E.T.S.CaminosCampus de Fuente NuevaE-18071 Granada
Prof. Dr. Thomas Ratliff
Department of MathematicsScience Center 101Wheaton CollegeE. Main StreetNorton MA 02766 – USA
Prof. Dr. Michel Regenwetter
Department of PsychologyUniversity of Illinois at Urbana-Ch435 Psychology Building, MC 716603 East Daniel StreetChampaign IL 61820 – USA
Johannes Ruckert
School of Engineering and ScienceInternational University BremenCampus Ring 12D–28759 Bremen
Prof. Dr. Donald G. Saari
Institute for MathematicalBehavioral ScienceUniversity of California2119 Social Science PlazaIrvine CA 92697-5100 – USA
Prof. Dr. Maurice Salles
Institut SCWMRSHUniversite de CaenF-14032 Caen Cedex
Prof. Dr. Remzi Sanver
Istanbul Bilgi UniversityInonu Cad. No. 28KustepeIstanbul 80310 – Turkey
Prof. Dr. Bruno Simeone
Dipart. di Statistica, Probabilitae Statistiche Applicate;Universita degli Studidi Roma”La Sapienza”Piazzale Aldo Moro, 5I-00185 Roma
Prof. Dr. William S. Zwicker
Department of MathematicsUnion CollegeSchenectady, NY 12308 2311 – USA