Analysis and control of edge effects in laser bending
11
Analysis and control of edge effects in laser bending Hong Shen n , Jun Hu, Zhenqiang Yao School of Mechanical Engineering, Shanghai Jiao Tong University, 800 Dongchuan Road, Shanghai 200240, China article info Article history: Received 17 August 2009 Received in revised form 4 November 2009 Accepted 10 November 2009 Available online 3 December 2009 Keywords: Laser forming Edge effects Varying velocity Scanning schemes FEM abstract Laser forming is a spring back free and non-contact forming technique. The process requires no hard tooling or external forces. Bending is achieved by plastic deformation induced by thermal stresses resulting from rapid nonlinear thermal cycles. Laser bending has the potential to deal with materials which are either extremely difficult or impossible to bend mechanically. Numerical and experimental investigations are presented to advance the understanding of the edge effects in the straight line laser bending process under TGM. More insights into the causes of the edge effects are obtained from the numerical results of temperature, bending angle and plastic strain. A total of six varying velocity scanning schemes of numerical and experimental investigation are carried out. It is evident that scanning schemes significantly influence the bending angle distribution along the scan line. In an attempt to reduce the edge effects, the influence of varying velocity scanning schemes has been investigated. The results show that the combination of acceleration and deceleration scanning schemes can minimize the edge effects. By comparing these varying velocity scanning schemes, the staircase varying velocity scanning scheme reduces the edge effects greatly. & 2009 Elsevier Ltd. All rights reserved. 1. Introduction Laser forming that requires no mechanical contact has its origins in sheet bending for ship construction. Laser forming provides a means of processing materials in a novel manner, which would be difficult or impossible using conventional manufacturing methods. Laser forming can use combinations of straight and curve scan lines to produce three dimensional formed components. Laser forming is of significant value to industries that previously relied on expensive stamping dies and presses for prototype evaluations, which include aerospace, automotive, shipbuilding and microelectronics [1,2]. Laser form- ing has been a subject of investigation in the past for many researchers. Application of laser heat source for sheet bending was first attempted by Namba [3,4]. Based on the temperature field generated by the laser scan, Vollertsen proposed three different mechanisms to describe how the metal sheet is formed during a laser forming process [5]. They are named as tempera- ture gradient mechanism (TGM), buckling mechanism (BM) and upsetting mechanism (UM). Nowadays, some numerical models [6–10] and analytical models [11–15] have been built in order to improve the understanding mechanisms and prediction. How- ever, due to the changing mechanical restraint and the tempera- ture distribution, the laser forming process is asymmetrical about the scan line and the bending angle is not constant along the scan line, causing the edge effects [16]. Bao and Yao [17] also considered the curved bending edge as the edge effects. Theoretical analysis by Mucha et al. [18] showed that thickness in the bending edge region increases due to thermal contraction under TGM, and the bending edge of the plate is visibly curved due to thermal contraction in the scanning direction. Numerical and experimental attempts have been made by Bao and Yao [19] to study the edge effects under BM. By comparison of different scan velocities, the non-uniform peak temperature along the scan path caused the bending edge to curve, which led the bending angle variation to occur along the scanning direction. Magee et al. [16] showed that the actual profile of bending angle was dependent on the laser processing parameters employed, as well as the material properties. Attempts have been made to reduce the edge effects by empirically varying traveling velocity along the scan path. However, the numerical analysis of varying velocity scan is not involved and it is impossible to design the scan velocity distribution along the scan line to largely reduce the edge effects. This paper presents numerical and experimental investigations aimed at advancing the understanding of the edge effects in the straight line laser bending process under TGM. Numerical results provide more insights into the causes of the edge effects. The effects of scanning velocity and scan line position on edge effects are investigated. In order to reduce the edge effects, some varying velocity scanning schemes are proposed. The effects of scanning schemes on bending angle distribution along scan line ARTICLE IN PRESS Contents lists available at ScienceDirect journal homepage: www.elsevier.com/locate/optlaseng Optics and Lasers in Engineering 0143-8166/$ - see front matter & 2009 Elsevier Ltd. All rights reserved. doi:10.1016/j.optlaseng.2009.11.005 n Corresponding author. E-mail address: [email protected] (H. Shen). Optics and Lasers in Engineering 48 (2010) 305–315
Transcript of Analysis and control of edge effects in laser bending

ARTICLE IN PRESS
Optics and Lasers in Engineering 48 (2010) 305–315
Contents lists available at ScienceDirect
Optics and Lasers in Engineering
0143-81
doi:10.1
n Corr
E-m
journal homepage: www.elsevier.com/locate/optlaseng
Analysis and control of edge effects in laser bending
Hong Shen n, Jun Hu, Zhenqiang Yao
School of Mechanical Engineering, Shanghai Jiao Tong University, 800 Dongchuan Road, Shanghai 200240, China
a r t i c l e i n f o
Article history:
Received 17 August 2009
Received in revised form
4 November 2009
Accepted 10 November 2009Available online 3 December 2009
Keywords:
Laser forming
Edge effects
Varying velocity
Scanning schemes
FEM
66/$ - see front matter & 2009 Elsevier Ltd. A
016/j.optlaseng.2009.11.005
esponding author.
ail address: [email protected] (H. Shen).
a b s t r a c t
Laser forming is a spring back free and non-contact forming technique. The process requires no hard
tooling or external forces. Bending is achieved by plastic deformation induced by thermal stresses
resulting from rapid nonlinear thermal cycles. Laser bending has the potential to deal with materials
which are either extremely difficult or impossible to bend mechanically. Numerical and experimental
investigations are presented to advance the understanding of the edge effects in the straight line laser
bending process under TGM. More insights into the causes of the edge effects are obtained from the
numerical results of temperature, bending angle and plastic strain. A total of six varying velocity
scanning schemes of numerical and experimental investigation are carried out. It is evident that
scanning schemes significantly influence the bending angle distribution along the scan line. In an
attempt to reduce the edge effects, the influence of varying velocity scanning schemes has been
investigated. The results show that the combination of acceleration and deceleration scanning schemes
can minimize the edge effects. By comparing these varying velocity scanning schemes, the staircase
varying velocity scanning scheme reduces the edge effects greatly.
& 2009 Elsevier Ltd. All rights reserved.
1. Introduction
Laser forming that requires no mechanical contact has itsorigins in sheet bending for ship construction. Laser formingprovides a means of processing materials in a novel manner,which would be difficult or impossible using conventionalmanufacturing methods. Laser forming can use combinations ofstraight and curve scan lines to produce three dimensionalformed components. Laser forming is of significant value toindustries that previously relied on expensive stamping dies andpresses for prototype evaluations, which include aerospace,automotive, shipbuilding and microelectronics [1,2]. Laser form-ing has been a subject of investigation in the past for manyresearchers. Application of laser heat source for sheet bendingwas first attempted by Namba [3,4]. Based on the temperaturefield generated by the laser scan, Vollertsen proposed threedifferent mechanisms to describe how the metal sheet is formedduring a laser forming process [5]. They are named as tempera-ture gradient mechanism (TGM), buckling mechanism (BM) andupsetting mechanism (UM). Nowadays, some numerical models[6–10] and analytical models [11–15] have been built in order toimprove the understanding mechanisms and prediction. How-ever, due to the changing mechanical restraint and the tempera-ture distribution, the laser forming process is asymmetrical about
ll rights reserved.
the scan line and the bending angle is not constant along the scanline, causing the edge effects [16]. Bao and Yao [17] alsoconsidered the curved bending edge as the edge effects.Theoretical analysis by Mucha et al. [18] showed that thicknessin the bending edge region increases due to thermal contractionunder TGM, and the bending edge of the plate is visibly curveddue to thermal contraction in the scanning direction. Numericaland experimental attempts have been made by Bao and Yao [19]to study the edge effects under BM. By comparison of differentscan velocities, the non-uniform peak temperature along the scanpath caused the bending edge to curve, which led the bendingangle variation to occur along the scanning direction. Magee et al.[16] showed that the actual profile of bending angle wasdependent on the laser processing parameters employed, as wellas the material properties. Attempts have been made to reducethe edge effects by empirically varying traveling velocity alongthe scan path. However, the numerical analysis of varying velocityscan is not involved and it is impossible to design the scanvelocity distribution along the scan line to largely reduce the edgeeffects.
This paper presents numerical and experimental investigationsaimed at advancing the understanding of the edge effects in thestraight line laser bending process under TGM. Numerical resultsprovide more insights into the causes of the edge effects.The effects of scanning velocity and scan line position on edgeeffects are investigated. In order to reduce the edge effects, somevarying velocity scanning schemes are proposed. The effects ofscanning schemes on bending angle distribution along scan line

ARTICLE IN PRESS
H. Shen et al. / Optics and Lasers in Engineering 48 (2010) 305–315306
are examined using numerical simulation and experiment.A finite element model for analyzing varying velocity scan isconstructed, taking into account temperature dependent thermaland mechanical properties. The varying velocity scan schemes areinvestigated to minimize the edge effects.
2. Mechanism of the edge effects
The computer simulation of laser forming problems is acomplicated process because it involves many variables such asheat flux of the laser beam, temperature distribution in the plateelements, changes in material properties and the influence ofthermal strains on the plate deformations. The process generally
0 200 400 600 800 1000400
600
800
1000
1200
1400
Spe
cific
hea
t (J/
kg-°
C)
12
12.5
13
13.5
14
14.5
15
15.5
16
The
rmal
exp
ansi
on c
oeffi
cien
t (×1
0-6)
0 200 400 600 800 10000
0.2
0.4
0.6
0.8
1
Red
uctio
n of
yie
ld s
tres
s, σ
y/σ y
o
Temperature (°C)
Temperature (°C)
0 200 400 600 800 1000
Temperature (°C)
Fig. 1. Thermal and mechanical p
includes three distinct components: the modeling of laser beam,the transfer of heat from the laser beam to the plate and theresponse of the plate. The primary objective to conduct suchanalyses is to determine the plastic deformations of the plate andcorresponding residual stresses developed during and after thelaser scanning. In order to calculate the thermo-structuralcoupled field with large plastic deformation, an indirectcoupled-field analysis (i.e., two sequential analyses) is performed,because the heat produced due to plastic deformation is verysmall and can be ignored [20]. A transient thermal analysis wasfirst carried out to determine temperature distribution which wasthen input as a body load for the stress analysis to determine thebending angle. Laser beam was modeled as a moving heat fluxusing area sector approach [21]. ANSYS APDL language was used
0 200 400 600 800 100025
30
35
40
45
50
55
The
rmal
con
duct
ivity
(W
/m-°
C)
0
0.2
0.4
0.6
0.8
1
Red
uctio
n of
You
ngs
mod
ulus
, E/E
o
0 200 400 600 800 10000.2
0.25
0.3
0.35
0.4
0.45
0.5
Poi
sson
’s r
atio
Temperature (°C)
Temperature (°C)
0 200 400 600 800 1000
Temperature (°C)
roperties of low carbon steel.

ARTICLE IN PRESS
0 10 20 30 40 50 60 70 800.77
0.78
0.79
0.8
0.81
0.82
0.83
0.84
0.85
X position (mm)
Ben
ding
ang
le (
°)
Scan direction
Scan lineZ
Y
X
Fig. 3. Laser bending angle along the scan path: (a) transverse strains,
(b) longitudinal strains.
H. Shen et al. / Optics and Lasers in Engineering 48 (2010) 305–315 307
for incorporating the laser beam motion scheme and subsequentapplication of thermal loads in the stress analysis. All exposedsurfaces were subjected to convection. Heat losses due toradiation are very small [22] and therefore were not considered.Temperature dependency of material properties is considered,including specific heat, thermal conductivity, thermal expansioncoefficient, Young’s modulus, yield stress and the Poisson ratio asshown in Fig. 1. The Young’s modulus E0 and the yield stress sy0
are 182 GPa and 193 MPa at room temperature for low carbonsteel (st12), respectively. The analysis of laser forming is carriedout for laser power of 1000 W, scan velocity 30 mm/s and laserbeam diameter of 6 mm. In simulations, the absorption coefficientof the material is used as 0.55.
2.1. Thermal analysis
In Fig. 2(a), it can be seen that the heating and cooling curvesrecorded on the upper surface on the scan line show very highheating and cooling rates. It can be seen that peak temperaturesare only achieved for fractions of a second before being rapidlyquenched by conduction into the surrounding (cold) bulkmaterial. A comparison has been made between thetemperatures realized at the same locations on the upper andlower surfaces. This is consistent with the TGM where a highthermal gradient through the thickness is necessary.
0 10 20 30 40 500
200
400
600
800
1000
Time (s)
0 10 20 30 40 50Time (s)
Tem
pera
ture
(°C
)
0
200
400
600
800
1000
Tem
pera
ture
(°C
)
Top surfaceBottom surface
Entrance
Laser beamScan line
Scan directionExit
Fixed edge
Free edge
Entrance
Middle
Exit
ZY
Y
Fig. 2. (a) Comparison of temperature on top and bottom surface and
(b) temperature histories on three special points along the scanning line and the
coordinates of the entrance, middle point and exit are (0,40,2), (40,40,2) and
(80,40,2), respectively.
Another issue that was observed in these results was thetemperature difference from edge to edge along the scan lineduring laser scanning (Fig. 2(b)). At the first edge a low peaktemperature was observed and at the second edge peaktemperature raises. These can also be compared with the value
10-2 10-1 100 101 102-10
-8
-6
-4
-2
0
2
4
6
Time (s)
Y-di
rect
ion
plas
tic s
trai
n (×
10-3
)
EntranceCenterExit
10-2 10-1 100 101 102-8
-6
-4
-2
0
2
Time (s)
X-d
irect
ion
plas
tic s
trai
n (×
10-3
)
EntranceCenterExit
Fig. 4. Plastic strain of three special points along the scanning path: (a) transverse
strains and (b) longitudinal strains

ARTICLE IN PRESS
H. Shen et al. / Optics and Lasers in Engineering 48 (2010) 305–315308
recorded at the centre of the plate. A possible explanation for thisphenomenon is in the inherent asymmetry of the process, in thatthe heat imparted into the plate as the laser beam traverses acrossit is continually flowing into the cold region ahead of the beam,thus increasing the temperature realized. At the centre of theplate equilibrium conditions are realized (stable peak tempera-ture). However, as the beam reaches the exit edge the heatflowing ahead of the beam cannot travel any further and so a heatbuildup occurs. Hence the peak temperature increases at the exitedge. This non-uniform peak temperature distribution along scanline will influence the bending angle distribution.
Table 1Experimental conditions.
Condition no. P (W) V (mm/s) a (mm) d (mm) Size (mm3)
1 1000 20–60 40 6 80�80�2
2 1000 30 10–50 6 80�80�2
P=laser power, V=scan velocity, a=distance away from the free edge of the plate,
d=laser beam diameter.
15 20 25 30 35 40 45 50 55 60 65
0.4
0.5
0.6
0.7
0.8
0.9
1
1.1
Scan velocity (mm/s)
Ben
ding
ang
le (
°)
SimulationExperimental data
0 10 20 30 40 50 60 70 800.2
0.4
0.6
0.8
1
1.2
1.4
1.6
X position (mm)
Ben
ding
ang
le (
°)
Simulation--20 mm/sExperiment--20 mm/sSimulation--30 mm/sExperiment--30 mm/sSimulation--40 mm/sExperiment--40 mm/sSimulation--50 mm/sExperiment--50 mm/sSimulation--60 mm/sExperiment--60 mm/s
Fig. 5. Bending angle with different scan velocity (P=1000 W, d=6 mm): (a)
average bending angle (b) bending angle variation along the scanning path.
2.2. Deformation analysis
The transient temperature filed obtained from the thermalanalysis is used as thermal loading. The material is assumed to belinearly elastic–perfectly plastic. The Von Mises yield criterion isused to model the onset of plastic. The boundary condition is oneedge of plate fixed and all other surfaces are stress free.
The schematic of the laser forming process is shown in Fig. 3and also shows that the bend angle development is dependent on
20 25 30 35 40 45 50 55 600
0.2
0.4
Exp
erim
enta
l ben
ding
ang
le v
aria
tion
(°)
Scan velocity (mm/s)
0
0.05
0.1
Sim
ulat
ion
bend
ing
angl
e va
riatio
n (°
)
20 25 30 35 40 45 50 55 600.28
0.3
0.32
0.34
0.36
0.38
Rel
ativ
e va
riatio
n of
exp
erim
ent d
ata
Scan velocity (mm/s)
0.07
0.08
0.09
0.1
0.11
0.12
Rel
ativ
e va
riatio
n of
sim
ulat
ion
resu
ltsFig. 6. Comparison of simulation and experiment under different scan velocities
(a) bending angle variatio and (b) relative bending angle variation.
Fig. 7. Samples with different scan line positions.

ARTICLE IN PRESS
H. Shen et al. / Optics and Lasers in Engineering 48 (2010) 305–315 309
the location on the sheet. It can be seen that slightly largerdistortion occurs at the centre of the plate when compared withthe entrance and exit of scan line, and that the end of the scan lineis slightly higher than the entrance of scan line. These resultsoutline the problems of the asymmetry of the process when tryingto produce a symmetrical part.
The bending angle is determined by the transverse plasticstrain which is perpendicular to the scan line direction.In Fig. 4(a), it can be observed that the localized transverseplastic strain cycle varies with position along the scan line onthe sheet. At scan entrance, it can be seen that a compressivecomponent occurs and reverts to a tensile one after the laserbeam passes due to the mechanical effect. During cooling, thecompression exists because of contract of the material. At thecentre of the plate, it can be seen that there is large compressionas the laser beam passes due to the geometry constraint of theplate, and compressive component reduces a little on cooling.The tensile strain, occurring before the laser arrives, could beattributed to mechanical effect, as the compressive plastic strainat the entrance of scan line could causes a tension at the exit.When laser beam reaches, the tensile component reverts to thecompressive one. Differences in residual transverse strain levelscan also be noted in Fig. 4(a) along the scan line. For each ofthe locations, the entrance, the centre and the exit, a compressive
5 10 15 20 25 30 35 40 45 50 550.55
0.6
0.65
0.7
0.75
0.8
0.85
0.9
Scan line position (mm)
Ben
ding
ang
le (
°)
SimulationExperimental data
0 10 20 30 40 50 60 70 800.4
0.5
0.6
0.7
0.8
0.9
1
1.1
X position (mm)
Ben
ding
ang
le (
°)
Simulation--10 mmExperiment--10 mmSimulation--20 mmExperiment--20 mmSimulation--30 mmExperiment--30 mmSimulation--40 mmExperiment--40 mmSimulation--50 mmExperiment--50 mm
Fig. 8. Bending angle under different scan line positions (P=1000 W, v=30 mm/s,
d=6 mm): (a) average bending angle and (b) bending angle variation along the
scanning path.
residual plastic strain can be seen. The highest level is at thecentre and entrance and exit are at different lower residualtransverse strain levels. This demonstrates the effect of theasymmetry of the laser bending process.
The longitudinal strain is parallel to the scan line direction. Theisolated output of longitudinal plastic strain over time at locationson entrance, exit and the centre of the plate along the centre ofthe scan line on the upper surface are given in Fig. 4(b). It can beseen in the figure that compressive component occurs for theselocations as laser beam passes which reduces during cooling.However, residual plastic tension remains at the ends of the scanline, while there is compressive one at the centre of the plate dueto the geometry constraint. The reason is also the mechanicaleffect. This asymmetry in the residual longitudinal plastic strainsalong the scan line also demonstrates the edge effects in laserforming.
2.3. Experimental setup
The straight-line laser bending is schematically shown inFig. 3. The bending angle varies along the scanning path (definedas the X-axis). The direction perpendicular to the scanning pathand within the plate is defined as the Y-axis. The laser processingsystem used in the experiment is a HJ-3000 CO2 laser system,with a maximum output power of 3000 W. A laser displacementsensor is used to measure the z-displacement at differentpositions for calculating the bending angle. The residual stressof the plates was relieved by annealing before the laser process.
0.15
0.2
0.25
0.3
Exp
erim
enta
l ben
ding
ang
le v
aria
tion
(°)
Scan line position (mm)10 15 20 25 30 35 40 45 50
0
0.05
0.1
0.15
Sim
ulat
ion
bend
ing
angl
e va
riatio
n (°
)
0.2
0.3
0.4
0.5
0.6
0.7
Rel
ativ
e va
riatio
n of
exp
erim
ent d
ata
Scan line position (mm)10 15 20 25 30 35 40 45 50
0
0.05
0.1
0.15
0.2
0.25
Rel
ativ
e va
riatio
n of
sim
ulat
ion
resu
lts
Fig. 9. Comparison of simulation and experiment under different scan line
positions (a) bending angle variation and (b) relative bending angle variation.
ARTICLE IN PRESS
H. Shen et al. / Optics and Lasers in Engineering 48 (2010) 305–315310
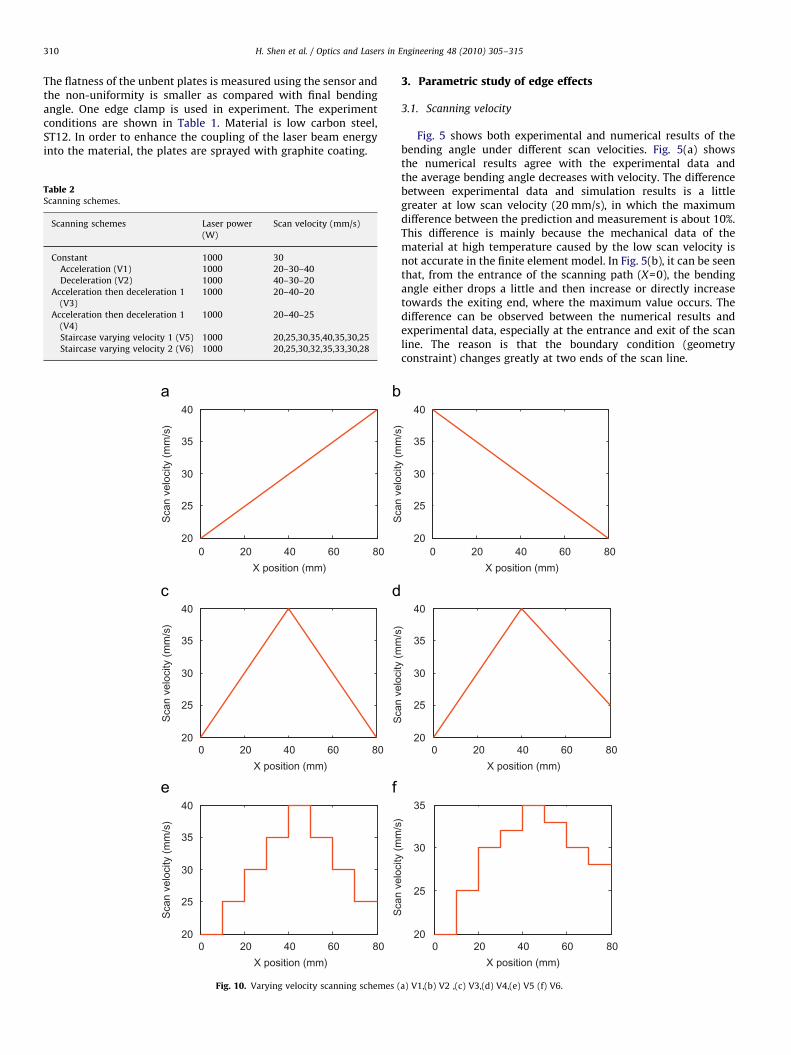
The flatness of the unbent plates is measured using the sensor andthe non-uniformity is smaller as compared with final bendingangle. One edge clamp is used in experiment. The experimentconditions are shown in Table 1. Material is low carbon steel,ST12. In order to enhance the coupling of the laser beam energyinto the material, the plates are sprayed with graphite coating.
Table 2Scanning schemes.
Scanning schemes Laser power
(W)
Scan velocity (mm/s)
Constant 1000 30
Acceleration (V1) 1000 20–30–40
Deceleration (V2) 1000 40–30–20
Acceleration then deceleration 1
(V3)
1000 20–40–20
Acceleration then deceleration 1
(V4)
1000 20–40–25
Staircase varying velocity 1 (V5) 1000 20,25,30,35,40,35,30,25
Staircase varying velocity 2 (V6) 1000 20,25,30,32,35,33,30,28
0 20 40 60 8020
25
30
35
40
X position (mm)
Sca
n ve
loci
ty (
mm
/s)
0 20 40 60 8020
25
30
35
40
X position (mm)
Sca
n ve
loci
ty (
mm
/s)
0 20 40 60 8020
25
30
35
40
X position (mm)
Sca
n ve
loci
ty (
mm
/s)
Fig. 10. Varying velocity scanning schemes (
3. Parametric study of edge effects
3.1. Scanning velocity
Fig. 5 shows both experimental and numerical results of thebending angle under different scan velocities. Fig. 5(a) showsthe numerical results agree with the experimental data andthe average bending angle decreases with velocity. The differencebetween experimental data and simulation results is a littlegreater at low scan velocity (20 mm/s), in which the maximumdifference between the prediction and measurement is about 10%.This difference is mainly because the mechanical data of thematerial at high temperature caused by the low scan velocity isnot accurate in the finite element model. In Fig. 5(b), it can be seenthat, from the entrance of the scanning path (X=0), the bendingangle either drops a little and then increase or directly increasetowards the exiting end, where the maximum value occurs. Thedifference can be observed between the numerical results andexperimental data, especially at the entrance and exit of the scanline. The reason is that the boundary condition (geometryconstraint) changes greatly at two ends of the scan line.
0 20 40 60 8020
25
30
35
40
X position (mm)
Sca
n ve
loci
ty (
mm
/s)
0 20 40 60 8020
25
30
35
40
X position (mm)
Sca
n ve
loci
ty (
mm
/s)
0 20 40 60 8020
25
30
35
X position (mm)
Sca
n ve
loci
ty (
mm
/s)
a) V1,(b) V2 ,(c) V3,(d) V4,(e) V5 (f) V6.

ARTICLE IN PRESS
1
Simulation 20-30-40 mm/s
H. Shen et al. / Optics and Lasers in Engineering 48 (2010) 305–315 311
Fig. 6 shows comparison of experimental and numericalresults of bending angle variation and relative bending anglevariation, respectively. The bending angle variation is defined asthe difference between the maximal and minimal bending anglealong the scanning line for a given condition. The relative bendingangle variation is the ratio of bending angle variation to theaverage bending angle [17]. In Fig. 6(a), it can be seen that theexperimental results of bending angle variation is about 4 timesas compared with simulation results, which demonstrates thatthe FEM cannot well predict the results. The trend of averagebending angle and bending angle variation shows a generalagreement and deceases with the increase of the scan velocity.
0 20 40 60 80700
800
900
1000
1100
X position (mm)
Pea
k te
mpe
ratu
re (
°C) Simulation
Fig. 12. Numerical results of peak temperature alon
Scan line
Fixed edge
20mm60mm
Thermal couple
5 10 15 20 25 30 35 40
50
100
150
200
250
300
350
400
450
Time (s)
Tem
pera
ture
(°C
)
Experiment 20 mmSimulation 20 mmExperiment 60 mmSimulation 60 mm
Fig. 11. (a) Thermal couples distribution and (b) temperature comparison of
experimental data and numerical results under acceleration.
An interesting trend of relative bending angle variation isobserved in Fig. 6(b), which is not consistent with that underBM [14]. The relative bending angle variation drops as scanvelocity increases, reaching the smallest value at scan velocity of30 mm/s, then increases. Relative bending angle variation datadistribution shows quite different with bending angle variation inFig. 6.
0 20 40 60 80600
800
1000
1200
1400
X position (mm)
Pea
k te
mpe
ratu
re (
°C)
g the scan line (V1 and V2) (a) V1 and (b) V2.
0 10 20 30 40 50 60 70 80
0.65
0.7
0.75
0.8
0.85
0.9
0.95
X position (mm)
Ben
ding
ang
le (
°)
Experimental data
0 10 20 30 40 50 60 70 800.65
0.7
0.75
0.8
0.85
0.9
0.95
1
1.05
X position (mm)
Ben
ding
ang
le (
°)
Simulation 40-30-20 mm/sExperimental data
Fig. 13. Bending angle comparison of numerical results and experimental data (V1
and V2) (a) VI and (b) V2.

ARTICLE IN PRESS
0 10 20 30 40 50 60 70 80
0.65
0.7
0.75
0.8
0.85
0.9
0.95
1
X position (mm)
Ben
ding
ang
le (
°)
Simulation V3Experimental data
H. Shen et al. / Optics and Lasers in Engineering 48 (2010) 305–315312
3.2. Scan line position
Numerical simulations and experiments are carried out toinvestigate the influence of scan line positions on the edge effects.As shown in Fig. 7, the scan line is parallel to the free edge, andfour heating line at locations 10, 20, 30 and 50 mm away from thefree edge, respectively (the scan line located at the centre asshown in Fig. 6). It is observed in Fig. 8(a) that a laser scanningline pass creates less bending angle as it is away from the centreof the plate. The reason is mainly because when heat line lies onthe centre of plate compared with those close to the edge, thegeometry constraint is larger, causing more deformation.
Similar to the analysis of bending angle distribution along thescan line with different scan velocities, Fig. 8(b) shows that thebending angle drops a little and then increase and the bendingangle of the exit is always larger than that of the entrance. Thecurves of the scan line position of 20, 30 and 50 mm are very closeand similar. It can be seen that the experimental results ofbending angle variation and relative bending angle variation arelarger than numerical results in Fig. 9. In Fig. 9(a), the bendingangle variation becomes larger as the heating line closes to thefree edge, because transverse constraint is small at thoselocations. This phenomenon causes the larger relative bendingangle variation due to the smaller average bending angle, asshown in Fig. 9(b). Relative bending angle variation of scan line atlocation 10 mm is almost twice as that at location 50 mm, whichshows that the edge effects aggravate when heating lineapproaches to the free edge.
0 10 20 30 40 50 60 70 800.65
0.7
0.75
0.8
0.85
0.9
X position (mm)
Ben
ding
ang
le (
°)
Simulation V4Experimental data
Fig. 15. Bending angle comparison of numerical results and experimental data (V3
and V4) (a) V3 and (b) V4.
4. Varying velocity scan
4.1. Scanning schemes
In an attempt to reduce the edge effects, several scan strategiesare employed. The basic idea is to vary the line energy supplied tothe plate surface to balance mechanical restraint effects. This canbe attempted by altering the laser power and the scan velocity.However, altering laser power may result in the changes of bothresponse time of the laser power and beam diameter [16]. A totalof seven scan schemes (see Table 2): constant velocity,acceleration, deceleration, acceleration then deceleration 1,acceleration then deceleration 2, staircase varying velocity 1 andstaircase varying velocity 2, are investigated for circular laserbeam geometry having a diameter of 6 mm. The seven scanschemes from this point onwards are referred as Constant, V1, V2,V3, V4, V5, V6 and V7, respectively. The latter six ones are varyingvelocity scanning schemes, as shown in Fig. 10. From V1 to V4,
0 20 40 60 80800
900
1000
1100
1200
1300
1400
X position (mm)
Pea
k te
mpe
ratu
re (
°C)
Fig. 14. Peak temperature along the scan
because the NC system cannot carry out the linear varyingvelocity scanning, the average velocity of those at the start andthe end points in each segment is adopted. The scan line isseparated into 8 segments.
Since the analyses of laser forming process are time depen-dent, the finite element analysis model involves the discretizationin space as well as in time. The variation of the scan velocity thuscan be implemented in the program by specifying the dwell times
0 20 40 60 80
800
900
1000
1100
X position (mm)
Pea
k te
mpe
ratu
re (
°C)
line (V3 and V4) (a) V3 and (b) V4.

ARTICLE IN PRESS
H. Shen et al. / Optics and Lasers in Engineering 48 (2010) 305–315 313
on corresponding elements. For example, for a acceleration scanscheme, the dwell time should be T on the first element, (T�t) onthe second element, and [T�(n�1)t] on the nth element.
Nickel chromium–nickel silicon thermal couples are used fortemperature measurement to verify the FEA of temperature field,with an upper limit of 1200 1C. The thermal couple distribution isshown in Fig. 11(a). These couples are spot welded along the scanline at the bottom surface of the plate and 20 and 60 mm awayfrom the start point of the scan line.
0 10 20 30 40 50 60 70 800.4
0.45
0.5
0.55
0.6
0.65
0.7
X position (mm)
Ben
ding
ang
le (
°)
Simulation V5Experimental data
0 10 20 30 40 50 60 70 800.5
0.55
0.6
0.65
0.7
0.75
0.8
X position (mm)
Ben
ding
ang
le (
°)
Simulation V6Experimental data
Fig. 17. Bending angle comparison of numerical results and experimental data (V5
and V6) (a) V5 and (b) V6.
4.2. Results and discussions
In order to validate the FEA of temperature filed induced by thevarying velocity scan, the temperature comparison of numericaland experimental results for acceleration scan at the referencepoints is shown in Fig. 11(b). It can be seen that modeling resultsagree well with the experimental results. The difference duringthe cooling period is mainly due to the linear processing in thenumerical simulation. Fig. 12 shows the peak temperaturedistributions along the scan line under V1 and V2 scan schemes.It can be obviously seen that the trends under those conditionsare inverse. The peak temperature decease due to the increase ofscan velocity under V1 scanning scheme. The correspondingbending angle distribution along the scan line is shown in Fig. 13.It can be observed that the difference between numerical andexperimental results is a little large, especially at the entrance orthe end of the scan line. This is mainly because the scan velocitydifference as described before between numerical simulation andexperiment and the boundary condition of the ends of scan line ismore complicated in experiment than those set in the numericalcalculation. Also, the absorption coefficient of the material varieswith the peak temperature achieved in the process. From thefigure, the bending angle variation demonstrates that the edgeeffects aggravate.
However, the combination of acceleration and decelerationscan may reduce the edge effects. The shape of the peaktemperature distribution along the scan line is similar to theletter ‘V’ under V3 in Fig. 14(a). It can be seen that the bendingangle is slightly reduced, but the bending angle at the end of thescan line still large in Fig. 15(a). Hence, V4 scan scheme isproposed, in which the velocity at the exit of the scanline improves compared with that in V3. The peak temperaturedistribution is more symmetrical, see Fig. 14(b). The temperaturein the centre is low, which is to balance the large geometricalconstraint at this area. Fig. 15(b) shows the bending angledistribution along the scan line under V4 scan scheme, whichdemonstrates that the bending angle variation along the scan lineis reduced. However, the bending angle at the exit is still larger
0 20 40 60 80500
600
700
800
900
1000
1100
X position (mm)
Pea
k te
mpe
ratu
re (
°C)
Fig. 16. Peak temperature along the scan
than the one at the entrance of scan line. Because the bendingangle at the exit is related to the bending angle at the centre, andthe area the high scan velocity scans can be extended when thescan velocity cannot be improved, the scan scheme V5 is proposedand the staircase varying velocity can be carried out by the NCsystem. Fig. 16(a) shows the peak temperature distribution alongthe scan line under V5, indicating symmetrical ‘V’ letter. However,in order to reduce the edge effect, the bending angle at centreshould be improved and the bending angle at the exit should be
0 20 40 60 80600
700
800
900
1000
1100
X position (mm)
Pea
k te
mpe
ratu
re (
°C) Simulation
line (V5 and V6) (a) V5 and (b) V6.

ARTICLE IN PRESS
0 2 4 626
27
28
29
30
31
Varying velocity schemes
Ave
rage
sca
n ve
loci
ty (
mm
/s)
0 2 4 65
10
15
20
25
30
35
Varying velocity schemes
Rel
ativ
e be
ndin
g an
gle
varia
tion
(%)
Fig. 18. (a) Average scan velocity and (b) relative bending angle variation under different scan schemes.
0 1 2 3 4 5 60.5
0.6
0.7
0.8
0.9
1
Exp
erim
enta
l ave
rage
ben
ding
ang
le (
°)
Varying velocity schemes
0.05
0.1
0.15
0.2
0.25
0.3
Exp
erim
enta
l ben
ding
ang
le v
aria
tion
(°)
Fig. 19. Experimental average bending angle and variation bending angle along
the scan path under constant speed and varying velocity schemes.
0 20 40 60 80 100 120 140 160 180 2005.5
6
6.5
7
7.5
8
8.5
9
X position (mm)
Ben
ding
ang
le (
°)
Constant velocityVarying velocity
Fig. 20. Bending angle along the scan line under constant velocity scan and V6
scan schemes.
Fig. 21. Comparison of the result data of two scans.
H. Shen et al. / Optics and Lasers in Engineering 48 (2010) 305–315314
decreased shown in Fig. 17(a). This leads to the temperaturedistribution as shown in Fig. 16(b) under V6 scan scheme. Asexpected, the bending angle along the scan line is almost uniform,so the bending angle variation is reduced greatly in Fig. 17(b).
In order to examine the effects of varying velocity scan on theedge effects, the constant scan is also investigated. Fig. 18(a)shows the average scan velocity under different scan schemes.The average velocity of varying velocity scanning varies from 26.6to 30 mm/s which is marginally less than or equal to the constantspeed 30 mm/s. However, as shown in Fig. 19, the variation of thebending angle and the average bending angle are foundsignificantly different from that under constant scan, althoughthe average velocity is maintained at approximately the samelevel. Besides scan schemes V1 and V2, the bending anglevariation along the scan line is reduced by using varyingvelocity scan compared with using constant speed scan. It canbe obviously seen that the bending angle variation reaches thesmallest value under V6 scan scheme.
Due to the difference of the average bending angle underdifferent scan schemes, the relative bending angle variation isintroduced. Fig. 18(b) shows the trend of relative bending anglevariations is in a good agreement with that of the bending anglevariation. The relative bending angle variation is minimized toabout 7% by using scan scheme V6 from 28.8% under the constantscan. To better show the effect of varying velocity scanningscheme on the edge effects, the plates 200�200�2 mm3 areused and the laser processing parameter are used as V6 with 10repeated scans. Fig. 20 shows the experimental results of constantvelocity scan and V6 scan. It can be obviously seen that thebending angle variation along the scan line is reduced greatly

ARTICLE IN PRESS
H. Shen et al. / Optics and Lasers in Engineering 48 (2010) 305–315 315
using V6 scan. Bending angle variation varies from 1.291 ofconstant speed scan to 0.381 of V6 scan scheme. Correspondingrelative bending angle variation varies from 16% to 5.6%, as shownin Fig. 21.
5. Conclusions
Numerical and experimental investigations have been studiedto understand the edge effects in the straight line laser bendingprocess under TGM. The edge effects are attributed to thedistribution of the peak temperature along the scan line and thegeometry constraint of the plate as it varies with distance fromthe scan path. From the study of the effects of scan velocity andscan line position on the edge effects, the results show that theedge effects is the smallest at scan velocity of 30 mm/s and theedge effects aggravate as scan line approaches to the free edge ofthe plate.
A total of six varying velocity scan schemes have been studiedby numerical and experimental methods. Based on the resultspresented in this paper, it is evident that scanning schemessignificantly influence the bending angle distribution along thescan line. In an attempt to reduce the edge effects, the influence ofvarying velocity scanning schemes has been investigated. Theresults show that the combination of acceleration and decelera-tion scan scheme can minimize the edge effects. By comparingthese varying velocity scanning schemes, the scanning scheme V6of staircase varying velocity reduces the edge effects greatly.However, a lot of further modeling and experimental work isrequired to determine the most optimized scanning scheme forthe edge effects before it can be adopted for industrial use.
Acknowledgements
This work was supported by National Natural ScienceFoundation of China (Grant no. 50905112).
References
[1] Magee J, Watkins KG, Steen WM. Advances in laser forming. J Laser Appl1998;10:235–46.
[2] Edwardson SP, Abed E, Bartkowiak K, Dearden G, Watkins KG. Geometricalinfluences on multi-pass laser forming. J Phys D: Appl Phys 2006;39:382–9.
[3] Namba Y. Laser forming in space. In: Wang CP, editor. Proceedings of theinternational conference of laser and electro optics (ICALEO’85), Boston, MA.Orlando: Laser Institute of America; 1985, p. 403–7.
[4] Namba Y. Laser forming of metals and alloys. In: Proceedings of the LAMP’ 87,Osaka, 1987 p. 601–6.
[5] F. Vollertson. Mechanisms and models for laser forming. In: Proceedingsof the laser assisted net shape engineering conference (LANE 94), 1994p.345–59.
[6] Vollertsen F, Geiger M. FDM and FEM simulation of laser forming: acomparative study. Advanced technology of plasticity, Proceedings ofthe fourth international conference on technology of plasticity. 1993.1793–1798.
[7] Y.C. Hsiao, H. Shimizu, L. Firth, W. Maher and K. Masubuchi.Finite elementmodeling of laser forming. In: Proceedings of the ICALEO, section A, SanDiego,1997p. 31–40.
[8] Kyrsanidi AK, Kermanidis TB, Pantelakis SG. Numerical and experimentalinvestigation of the laser forming process. J Mater Process Technol1999;87:281–90.
[9] Hu Z, Labudovic M, Wang H, Kovacevic R. Computer simulation andexperimental investigation Q2 of sheet metal bending using laser beamscanning. Int J Mach Tool Manuf 2001;41:589–607.
[10] Shen H, Shi YJ, Yao ZQ. Numerical simulation of the laser forming of sheetsusing two simultaneous scans. Comput Mater Sci 2006;37:239–45.
[11] Vollertsen F. An analytical model for laser bending. Lasers Eng 1994;2:261–76.
[12] Kyrsanidi AK, Kermanidis TB, Pantelakis SG. An analytical model for theprediction of distortions caused by the laser forming process. J Mater ProcessTechnol 2000;104:94–102.
[13] Cheng PJ, Lin SC. An analytical model to estimate angle formed by laser.J Mater Process Technol 2001;108:314–9.
[14] Shen H, Yao ZQ, Shi YJ, Hu J. An analytical formula for estimating the bendingangle by laser forming. Proc Inst Mech Eng Part C: J Mech Eng Sci2006;220(2):243–7.
[15] Shen H, Shi YJ, Yao ZQ, Hu J. An analytical model for estimating deformationin laser forming. Comput Mater Sci 2006;37:593–8.
[16] J. Magee, K.G. Watkins, W.M. Steen, N. Calder, J. Sidhu and J. Kirby. Edgeeffects in laser forming, laser assisted net shape engineering 2. In:Proceedings of the LANE’97, Meisenbach Bamberg, 1997p. 399–408.
[17] Bao J, Yao YL. Analysis and prediction of edge effects in laser bending. J ManufSci Eng 2001;123:53–61.
[18] Z. Mucha, J. Hoffman, W. Kalita and S. Mucha. Laser forming of thick freeplate, laser assisted net shape engineering 2. In: Proceedings of the LANE’97,Meisenbach Bamberg,1997p. 383–93.
[19] Bao J, Yao YL. Study of edge effects in laser bending. Int Mech Eng CongrExposition 1999;MED10:941–8.
[20] Structure with Material Nonlinearities and Coupled Field Analysis Guide. In:ANSYS theory manual. ANSYS, Inc.
[21] Safdar S, Li L, Sheikh MA, Schmidt MJ. A thermal history analysis of surfaceheating of mild steel with different laser beam geometries. J Mech Eng SciIMechE Part C 2006;220(10):1549–57.
[22] Yeung KS, Thornton PH. Transient thermal analysis of spot weldingelectrodes. Welding J 1999;78(1):1–6.