Analysing PRISMA data - pd.infn.it€¦ · prisma3 prisma5 prisma2 - neo - bu - control Tape Unit...
33
Overview Detectors DAQ Framework Analysing PRISMA Data Analysing PRISMA data Andrea Latina 1,2 , Bivash R. Behera 2 , Fernando Scarlassara 3 1 Dipartimento di Fisica, Universit` a di Torino 2 INFN, Laboratori Nazionali di Legnaro 3 INFN, Sezione di Padova and Dipartimento di Fisica, Universit` a di Padova Workshop on GASP and PRISMA/CLARA, Mar 3-5 2004, LNL A. Latina, B. R. Behera, F. Scarlassara Analysing PRISMA data
Transcript of Analysing PRISMA data - pd.infn.it€¦ · prisma3 prisma5 prisma2 - neo - bu - control Tape Unit...

OverviewDetectors
DAQ FrameworkAnalysing PRISMA Data
Analysing PRISMA data
Andrea Latina1,2, Bivash R. Behera2, Fernando Scarlassara3
1Dipartimento di Fisica, Universita di Torino
2INFN, Laboratori Nazionali di Legnaro
3INFN, Sezione di Padova and Dipartimento di Fisica, Universita di Padova
Workshop on GASP and PRISMA/CLARA, Mar 3-5 2004, LNL
A. Latina, B. R. Behera, F. Scarlassara Analysing PRISMA data

OverviewDetectors
DAQ FrameworkAnalysing PRISMA Data
Outline
1 Overview of the PRISMA Spectrometer
2 Detectors overview
3 Data Acquisition Framework
4 Analysing PRISMA Data
A. Latina, B. R. Behera, F. Scarlassara Analysing PRISMA data

OverviewDetectors
DAQ FrameworkAnalysing PRISMA Data
Design
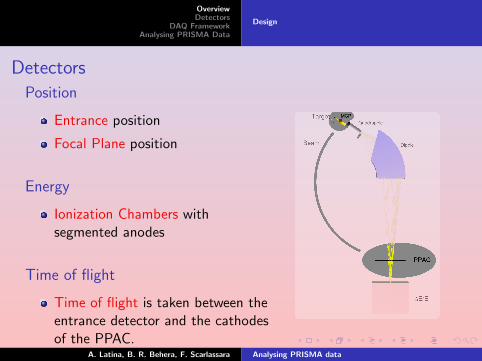
DetectorsPosition
Entrance position
Focal Plane position
Energy
Ionization Chambers withsegmented anodes
Time of flight
Time of flight is taken between theentrance detector and the cathodesof the PPAC.
A. Latina, B. R. Behera, F. Scarlassara Analysing PRISMA data

OverviewDetectors
DAQ FrameworkAnalysing PRISMA Data
Design
DetectorsPosition
Entrance position
Focal Plane position
Energy
Ionization Chambers withsegmented anodes
Time of flight
Time of flight is taken between theentrance detector and the cathodesof the PPAC.
A. Latina, B. R. Behera, F. Scarlassara Analysing PRISMA data

OverviewDetectors
DAQ FrameworkAnalysing PRISMA Data
Entrance DetectorFocal Plane DetectorIonization ChambersElectronics
Entrance Detector
Large area Micro-Channel Plate (MCP1)
entrance position on a 10×8 cm2 area
better than 1 mm resolution
MCP gives x and y
1G.Montagnoli et al., LNL Annual Report 2003, Report LNL-INFN (Rep)
A. Latina, B. R. Behera, F. Scarlassara Analysing PRISMA data

OverviewDetectors
DAQ FrameworkAnalysing PRISMA Data
Entrance DetectorFocal Plane DetectorIonization ChambersElectronics
Focal Plane Detector
10 independent sections of Multiwire PPAC for X
1 section of PPAC for Y
100×13 cm2 area
X resolution 1 mm
Y resolution 2 mm
Fig. Xleft vs. Xright.The positions are read-out using the delay line method.
A. Latina, B. R. Behera, F. Scarlassara Analysing PRISMA data

OverviewDetectors
DAQ FrameworkAnalysing PRISMA Data
Entrance DetectorFocal Plane DetectorIonization ChambersElectronics
Ionization Chambers
An array of 10× 4 ionization chambers, for energy lossmeasurements, is placed 70 cm away from the PPAC.
A
B
0123456789
Beam
D
C
40Ca+208Pb @ 235 MeV
IC’s give the energy and the Z .
A. Latina, B. R. Behera, F. Scarlassara Analysing PRISMA data

OverviewDetectors
DAQ FrameworkAnalysing PRISMA Data
Entrance DetectorFocal Plane DetectorIonization ChambersElectronics
The Electronics must deal with a hundred signals:
From the PRISMA side:
3 + MCP10×2 + 2 + PPAC
10 + TOF
40 + 8 IC+MONITOR = 83
From the CLARA side:
25×4 = 100
A. Latina, B. R. Behera, F. Scarlassara Analysing PRISMA data

OverviewDetectors
DAQ FrameworkAnalysing PRISMA Data
The front-end electronicsPRISMA electronicsThe acquisition farmWhat the user sees
The front-end electronics
• PRISMAThe PRISMA DAQ is based on the VME CAEN modules: one V775 32channels TDC; two V875 peak sensing 32 channels ADC. All these modulesare read-out by a VME CPU.
• CLARADue to the high number of channels involved in the design (25 × 4 = 100detector signals) we use the compact VXI electronics built for the CLOVERdetectors, already used in EUROBALL phase II.
3 VXI crates + spare
3 VXI Resource Managers + spare
3 VXI Read-out cards (VRE) + spare
25 EUROBALL phase II VXI CLOVER cards + spares
A. Latina, B. R. Behera, F. Scarlassara Analysing PRISMA data

OverviewDetectors
DAQ FrameworkAnalysing PRISMA Data
The front-end electronicsPRISMA electronicsThe acquisition farmWhat the user sees
PRISMA Electronics
A. Latina, B. R. Behera, F. Scarlassara Analysing PRISMA data

OverviewDetectors
DAQ FrameworkAnalysing PRISMA Data
The front-end electronicsPRISMA electronicsThe acquisition farmWhat the user sees
The Acquisition Farm
DETECTORS
prisma1
prisma4prisma3
prisma5
prisma2− neo
− bu− control
Tape Unit
Online Offline
pc216 pc217
− HistogramService− OmniNames− d
prismads/prisma−daq DAQ Software/prisma−ware Useful tools (nedit, gv, ...)/prisma−data Acquired DATA/prisma−online Online programs (neo...)/prisma−offline Offline analyses (ReadData, ...)
������������������������������������������
�������������������������
����������������������������
����������
������������������������������������������
�����������������������������������
����������
����������
� � � � � � � � � � � � � � �
�����������������������������������
����������������������������
����������
�����������������������������������
�������������������������
����������������������������
����������
�����������������������������������
�����������������������������������
������������������������
����������
��������������
!!!!!!!!!!!!!!
"""""""""""""
##############
$$$$$$$$$$$$$
%%%%%%%%%%%%%
&&&&&&&&&&&&&
'''''''''''''
(((((((((((((
The CPU is sending the information to a farm of Linux PC’s acting as event builder and processing farm. Thisfarm is connected through the acquisition network to the histogram server, tape server and disk server. In addition,it is possible to use extra Linux computer as spy processors for the on-line analysis.
A. Latina, B. R. Behera, F. Scarlassara Analysing PRISMA data
OverviewDetectors
DAQ FrameworkAnalysing PRISMA Data
The front-end electronicsPRISMA electronicsThe acquisition farmWhat the user sees
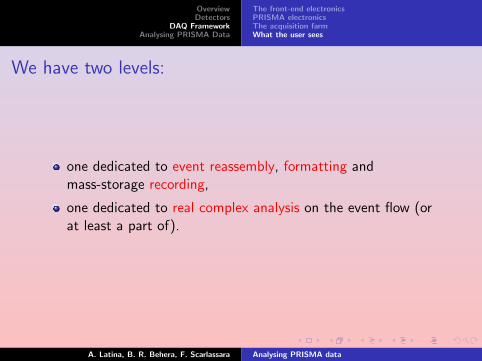
We have two levels:
one dedicated to event reassembly, formatting andmass-storage recording,
one dedicated to real complex analysis on the event flow (orat least a part of).
A. Latina, B. R. Behera, F. Scarlassara Analysing PRISMA data

OverviewDetectors
DAQ FrameworkAnalysing PRISMA Data
The front-end electronicsPRISMA electronicsThe acquisition farmWhat the user sees
What the user sees: Acquisition Level
Acquisition: the event builders and the spies are programmed inC++ and NEO++;
Control: a OCP graphical interface (by N. Marginean) lets youcontrol: the acquisition program, the data taking,either on tape or on disk, the histogram services andthe spy services.
A. Latina, B. R. Behera, F. Scarlassara Analysing PRISMA data

OverviewDetectors
DAQ FrameworkAnalysing PRISMA Data
The front-end electronicsPRISMA electronicsThe acquisition farmWhat the user sees
What the user sees: Analysis Level
The ’Spy Services’ let you process the data without interfere withthe event flow. Spies can, for example:
Histogram: single spectra and matrices (e.g. entrance x vsentrance y , focal plane X vs time of flight, ∆E vs E )are accumulated;
Display: the spectra can be individually displayed on thecomputer screen during the data taking;
Analyse: Doppler Correction, Trajectories Calculations, . . .
A. Latina, B. R. Behera, F. Scarlassara Analysing PRISMA data

OverviewDetectors
DAQ FrameworkAnalysing PRISMA Data
The Online Raw SpectraLinearization: building a Physical EventGating the spectraParticle Identification: Trajectories ReconstructionConclusions
Raw Energy Spectra from Individual Sections of the ICAnodes
During the on-line we accumulate about 180 spectra (PRISMA).
A. Latina, B. R. Behera, F. Scarlassara Analysing PRISMA data

OverviewDetectors
DAQ FrameworkAnalysing PRISMA Data
The Online Raw SpectraLinearization: building a Physical EventGating the spectraParticle Identification: Trajectories ReconstructionConclusions
Building a Physical Event
Despite the huge number of signals, an actual, physical, event is onlycomposed by few parameters:
entrance position x , y (θ, φ)focal plane position X , Ytime of flight tofenergy ∆E , E
Only 7 parameters (besides γ-rays...)
A battery of programs performing linearizations and ADC calibrations has beenwritten.
A. Latina, B. R. Behera, F. Scarlassara Analysing PRISMA data

OverviewDetectors
DAQ FrameworkAnalysing PRISMA Data
The Online Raw SpectraLinearization: building a Physical EventGating the spectraParticle Identification: Trajectories ReconstructionConclusions
Entrance Position Linearization
Calibration RUN, January 28th, 2004:
Linearization of the MCP by means of polynomial interpolations.
A. Latina, B. R. Behera, F. Scarlassara Analysing PRISMA data

OverviewDetectors
DAQ FrameworkAnalysing PRISMA Data
The Online Raw SpectraLinearization: building a Physical EventGating the spectraParticle Identification: Trajectories ReconstructionConclusions
Focal Plane Position Linearisation
The 10 independent sections of the PPAC must be glued together:
X1, X2, X3, . . .
→
X(56Fe + 197Au @ 176 MeV, θPRISMA = 70o)
A. Latina, B. R. Behera, F. Scarlassara Analysing PRISMA data

OverviewDetectors
DAQ FrameworkAnalysing PRISMA Data
The Online Raw SpectraLinearization: building a Physical EventGating the spectraParticle Identification: Trajectories ReconstructionConclusions
Time of Flight Alignment
Nearby sections of the PPAC have different electronic delays:
56Fe + 197Au @ 176 MeV, θPRISMA = 70o
A. Latina, B. R. Behera, F. Scarlassara Analysing PRISMA data

OverviewDetectors
DAQ FrameworkAnalysing PRISMA Data
The Online Raw SpectraLinearization: building a Physical EventGating the spectraParticle Identification: Trajectories ReconstructionConclusions
Time of Flight Alignment: the uncalibrated X-TOF matrix
56Fe + 197Au @ 176 MeV, θPRISMA = 70o
A. Latina, B. R. Behera, F. Scarlassara Analysing PRISMA data

OverviewDetectors
DAQ FrameworkAnalysing PRISMA Data
The Online Raw SpectraLinearization: building a Physical EventGating the spectraParticle Identification: Trajectories ReconstructionConclusions
Time of Flight Alignment: the calibrated X-TOF matrix
MCP
56Fe + 197Au @ 176 MeV, θPRISMA = 70o
A. Latina, B. R. Behera, F. Scarlassara Analysing PRISMA data

OverviewDetectors
DAQ FrameworkAnalysing PRISMA Data
The Online Raw SpectraLinearization: building a Physical EventGating the spectraParticle Identification: Trajectories ReconstructionConclusions
Gating the spectra
It is possible to put conditions on the data, by means of severalprograms:
gateTheta, gatePhi, gateMCP, gatePPAC, etc. etc.
All of them work from the Linux Command Line Interface.
A. Latina, B. R. Behera, F. Scarlassara Analysing PRISMA data

OverviewDetectors
DAQ FrameworkAnalysing PRISMA Data
The Online Raw SpectraLinearization: building a Physical EventGating the spectraParticle Identification: Trajectories ReconstructionConclusions
An example:
$ cat /prisma-data/56Fe+197Au/RUN4 0 | calibrate | gateTheta 70
69.5 70.5 | calibratedHistogrammer
Where we:
1 read the data from disk;
2 calibrate the data in order to get a physical event;
3 put a gate on the entrance θ angle;
4 make the histograms
A. Latina, B. R. Behera, F. Scarlassara Analysing PRISMA data

OverviewDetectors
DAQ FrameworkAnalysing PRISMA Data
The Online Raw SpectraLinearization: building a Physical EventGating the spectraParticle Identification: Trajectories ReconstructionConclusions
MCP gated 56Fe + 197Au, θPRISMA = 70o data, with69.5o < θ < 70.50:
MCP
PPAC X vs PPAC Y ,
PPAC X vs TOF .
A. Latina, B. R. Behera, F. Scarlassara Analysing PRISMA data

OverviewDetectors
DAQ FrameworkAnalysing PRISMA Data
The Online Raw SpectraLinearization: building a Physical EventGating the spectraParticle Identification: Trajectories ReconstructionConclusions
Trajectories Reconstructions
Particle Identification algorithms, based on TrajectoriesReconstruction, are in progress.
We wrote an Ion Tracking Code, that takes into account thePRISMA geometry and the Magnetic Fields, also in the fringingregions.
A. Latina, B. R. Behera, F. Scarlassara Analysing PRISMA data

OverviewDetectors
DAQ FrameworkAnalysing PRISMA Data
The Online Raw SpectraLinearization: building a Physical EventGating the spectraParticle Identification: Trajectories ReconstructionConclusions
A. Latina, B. R. Behera, F. Scarlassara Analysing PRISMA data

OverviewDetectors
DAQ FrameworkAnalysing PRISMA Data
The Online Raw SpectraLinearization: building a Physical EventGating the spectraParticle Identification: Trajectories ReconstructionConclusions
Simulated 56Fe + 197Au @ 176 MeV X-TOF and XYmatrices
X vs. TOF .
X vs. Y .
A. Latina, B. R. Behera, F. Scarlassara Analysing PRISMA data

OverviewDetectors
DAQ FrameworkAnalysing PRISMA Data
The Online Raw SpectraLinearization: building a Physical EventGating the spectraParticle Identification: Trajectories ReconstructionConclusions
Real 56Fe + 197Au @ 176 MeV X-TOF and XY matrices
X vs. TOF .
X vs. Y .
A. Latina, B. R. Behera, F. Scarlassara Analysing PRISMA data

OverviewDetectors
DAQ FrameworkAnalysing PRISMA Data
The Online Raw SpectraLinearization: building a Physical EventGating the spectraParticle Identification: Trajectories ReconstructionConclusions
We are able to predict correctly the calibration data by the simulations, nextstep will by to obtain high resolution mass and Z spectra from theexperimental data with the full solid angle of PRISMA.
We have already been able to get ∆A/A = 250 mass spectra, by a suitablereduction of the PRISMA solid angle.
A. Latina, B. R. Behera, F. Scarlassara Analysing PRISMA data

OverviewDetectors
DAQ FrameworkAnalysing PRISMA Data
The Online Raw SpectraLinearization: building a Physical EventGating the spectraParticle Identification: Trajectories ReconstructionConclusions
A. Latina, B. R. Behera, F. Scarlassara Analysing PRISMA data

OverviewDetectors
DAQ FrameworkAnalysing PRISMA Data
The Online Raw SpectraLinearization: building a Physical EventGating the spectraParticle Identification: Trajectories ReconstructionConclusions
A. Latina, B. R. Behera, F. Scarlassara Analysing PRISMA data