Analysing Ontario Biofuel Options: Greenhouse Gas
42
BIOCAP Canada Foundation – prepared by REAP-Canada Analysing Ontario Biofuel Options: Greenhouse Gas Mitigation Efficiency and Costs Final Report Prepared by R. Samson, S. Bailey Stamler, J. Dooper, S. Mulder, T. Ingram, K. Clark, and C. Ho Lem Resource Efficient Agricultural Production (REAP)-Canada Box 125 Centennial Centre CCB13, Sainte Anne de Bellevue, Quebec, H9X 3V9 Questions? Please contact: David Layzell ([email protected] ) or Roger Samson ([email protected] ) January 18, 2008
Transcript of Analysing Ontario Biofuel Options: Greenhouse Gas

BIOCAP Canada Foundation – prepared by REAP-Canada
Analysing Ontario Biofuel Options: Greenhouse Gas Mitigation
Efficiency and Costs
Final Report
Prepared by
R. Samson, S. Bailey Stamler, J. Dooper, S. Mulder, T. Ingram, K. Clark, and C. Ho Lem
Resource Efficient Agricultural Production (REAP)-Canada
Box 125 Centennial Centre CCB13, Sainte Anne de Bellevue, Quebec, H9X 3V9
Questions? Please contact: David Layzell ([email protected]) or Roger Samson ([email protected])
January 18, 2008

BIOCAP Canada Foundation – prepared by REAP-Canada
BIOCAP Canada Foundation Queen's University,156 Barrie Street, Kingston, Ontario, K7L 3N6 Tel. (6134) 542-0025; Fax (613)-542-0045; www.biocap.ca Contact: Dr. David Layzell; [email protected] From 1998 to 2008, BIOCAP worked in partnership with universities, governments, industry and non-governmental organizations to provide the scientific insights, technologies and policy options supporting Canada’s transition to a sustainable bioeconomy. In March 2008, BIOCAP will cease operations, but the work it initiated will continue in the many research programs, networks and institutes that it helped to create. Resource Efficient Agricultural Production (R.E.A.P.) - Canada Box 125, Centennial Centre CCB13, Ste Anne de Bellevue, Quebec, Canada, H9X 3V9 Tel. (514) 398-7743; Fax (514) 398-7972; www.reap-canada.ca Contact: Mr. Roger Samson; [email protected] REAP-Canada is North America’s most experienced independent research registered not for profit agency in the development of densified agri-fibers as heating fuels with over 20 years of experience collaborating with farmers, government and the private sector to develop and commercialize sustainable agricultural business solutions for Canada’s fuel, fibre and food needs. REAP-Canada has been working since 1991 on bioenergy systems development as a means to control greenhouse gases and enhance product demand for the agricultural sector. REAP-Canada was the first agency in Canada to perform research studies on warm season perennial grasses as energy crops and the first agency in the world to commercially pellet switchgrass and burn it successfully as a heating fuel. REAP-Canada provides services in bioenergy market development and economic forecasting, heat energy demand analysis and projections, biomass combustion efficiency, greenhouse gas accounting and assessments of land-use availability for energy grass production systems. Since 1992, REAP-Canada has been a lead contractor for bioenergy research development in Canada completing over 25 studies on energy crop production, combustion and market potential. In 2005, working with Nott farms of Clinton Ontario, REAP-Canada helped commercialize the first North American use of crop milling residue pellets as a fuel source. Twenty Ontario greenhouses have now switched to agri-fire pellet fuel heating from natural gas and coal heating and a major new industry is under development in Ontario. REAP is a world leader in developing bioenergy opportunities for rural development and greenhouse gas mitigation. In North America, Europe, Asia and Africa, REAP has created projects within the private and public sector to develop and commercialize dedicated bioenergy feedstocks and residues for biofuel applications. REAP is also currently working to develop bio-energy projects with farmers groups in China, Ethiopia, the Gambia and the Philippines.

BIOCAP Canada Foundation – prepared by REAP-Canada
i
Executive Summary Fuels made from biological feedstocks rather than coal, oil or natural gas have attracted widespread interest from policy makers, investors and consumers. A key attraction of biofuels is the promise to address priorities such as energy security, climate change and rural economic development. In recent years, concerns about climate change have taken centre stage, dominating the press, affecting elections in Australia, and winning former U.S. Vice-President Al Gore both an Oscar for Best Documentary Film and the 2007 Nobel Peace Prize.
Given the current importance of the climate change issue, this study compares the cost effectiveness of various alternative energy policy incentives in mitigating greenhouse gas emissions in the Province of Ontario.
The report concludes that solid biofuels offer the least expensive biofuel strategy for government incentives to reduce greenhouse gas emissions in the province of Ontario. Approach The study drew on the scientific literature and government policy documents to calculate two values for Ontario-subsidized liquid transportation fuels (canola-based biodiesel and corn ethanol) and for green power generation (wind, small biomass and photo-voltaic power) alternatives:
1) the dollar cost in subsidies for each unit of energy produced ($/gigajoule), and; 2) the net greenhouse gas savings that would be realized when the alternative energy
source replaced a traditional fossil fuel source per unit of energy produced (kg CO2e/gigajoule).
By combining the two values, the study determined the costs in government subsidies of abating each tonne of CO2e for each of the alternative sources. The study then identified wood or straw pellets as a source of solid biofuel that has the potential to replace coal, but which does not currently receive a subsidy. It was estimated that with a subsidy of $4 per gigajoule, solid biofuels would be able to compete with coal in the current marketplace for the production of industrial heat and power. By combining this value with a calculation of the greenhouse saving associated with the production and use of solid biofuels (kg CO2e/gigajoule), the study again determined the costs to abate each tonne of CO2e from a solid biofuel.
Results The study provided a direct comparison of the relative costs and benefits for climate change of various transportation fuel strategies vs. electricity generation strategies vs. heating fuel strategies, and the results were striking. Although, for example, transportation continues to attract considerable attention, programs to reduce greenhouse gases by creating alternative liquid fuels prove expensive. The price paid in Government of Ontario incentives for a gigajoule of corn ethanol, for example, is reasonably high ($8/GJ), and its effect in mitigating climate change is limited because the amount of
Solid biofuels, low-tech and readily available, emerge as a cost-effective strategy for reducing greenhouse gas emissions.
BIOCAP Canada Foundation – prepared by REAP-Canada
ii
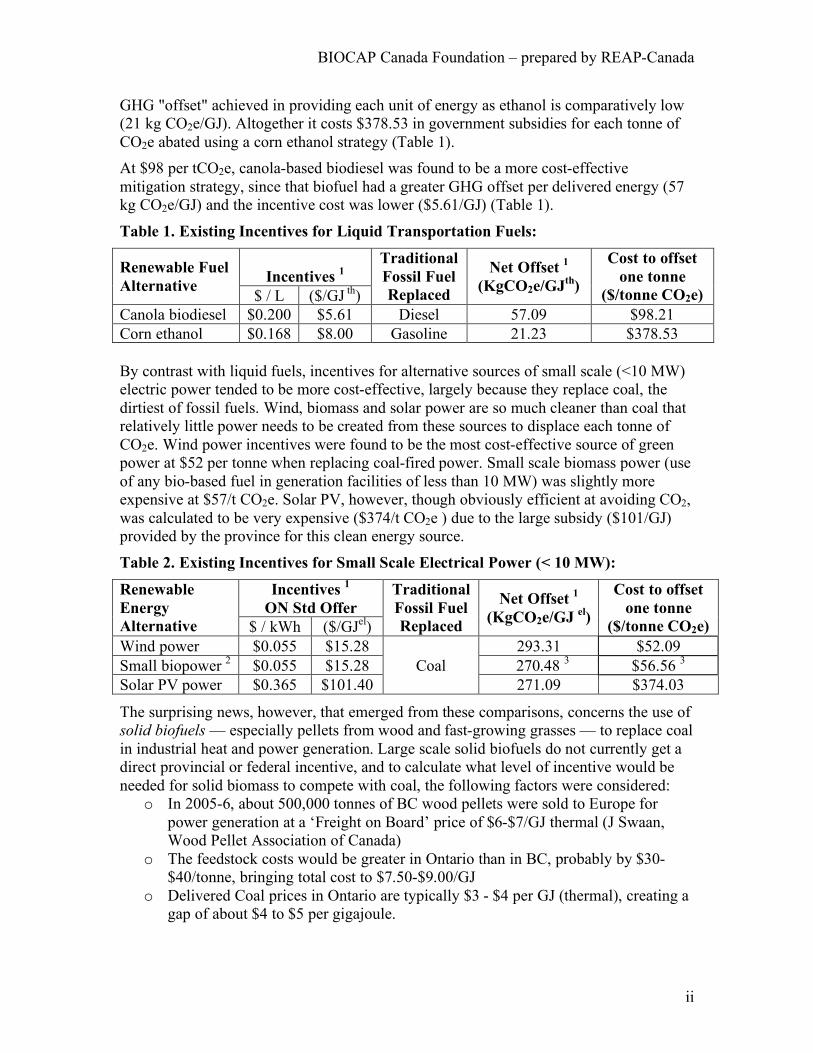
GHG "offset" achieved in providing each unit of energy as ethanol is comparatively low (21 kg CO2e/GJ). Altogether it costs $378.53 in government subsidies for each tonne of CO2e abated using a corn ethanol strategy (Table 1). At $98 per tCO2e, canola-based biodiesel was found to be a more cost-effective mitigation strategy, since that biofuel had a greater GHG offset per delivered energy (57 kg CO2e/GJ) and the incentive cost was lower ($5.61/GJ) (Table 1). Table 1. Existing Incentives for Liquid Transportation Fuels:
Incentives 1 Renewable Fuel
Alternative $ / L ($/GJ th)
Traditional Fossil Fuel Replaced
Net Offset 1 (KgCO2e/GJth)
Cost to offset one tonne
($/tonne CO2e) Canola biodiesel $0.200 $5.61 Diesel 57.09 $98.21 Corn ethanol $0.168 $8.00 Gasoline 21.23 $378.53 By contrast with liquid fuels, incentives for alternative sources of small scale (<10 MW) electric power tended to be more cost-effective, largely because they replace coal, the dirtiest of fossil fuels. Wind, biomass and solar power are so much cleaner than coal that relatively little power needs to be created from these sources to displace each tonne of CO2e. Wind power incentives were found to be the most cost-effective source of green power at $52 per tonne when replacing coal-fired power. Small scale biomass power (use of any bio-based fuel in generation facilities of less than 10 MW) was slightly more expensive at $57/t CO2e. Solar PV, however, though obviously efficient at avoiding CO2, was calculated to be very expensive ($374/t CO2e ) due to the large subsidy ($101/GJ) provided by the province for this clean energy source. Table 2. Existing Incentives for Small Scale Electrical Power (< 10 MW):
Incentives 1 ON Std Offer
Renewable Energy Alternative $ / kWh ($/GJel)
Traditional Fossil Fuel Replaced
Net Offset 1 (KgCO2e/GJ el)
Cost to offset one tonne
($/tonne CO2e) Wind power $0.055 $15.28 293.31 $52.09 Small biopower 2 $0.055 $15.28 270.48 3 $56.56 3 Solar PV power $0.365 $101.40
Coal 271.09 $374.03
The surprising news, however, that emerged from these comparisons, concerns the use of solid biofuels — especially pellets from wood and fast-growing grasses — to replace coal in industrial heat and power generation. Large scale solid biofuels do not currently get a direct provincial or federal incentive, and to calculate what level of incentive would be needed for solid biomass to compete with coal, the following factors were considered:
o In 2005-6, about 500,000 tonnes of BC wood pellets were sold to Europe for power generation at a ‘Freight on Board’ price of $6-$7/GJ thermal (J Swaan, Wood Pellet Association of Canada)
o The feedstock costs would be greater in Ontario than in BC, probably by $30-$40/tonne, bringing total cost to $7.50-$9.00/GJ
o Delivered Coal prices in Ontario are typically $3 - $4 per GJ (thermal), creating a gap of about $4 to $5 per gigajoule.

BIOCAP Canada Foundation – prepared by REAP-Canada
iii
Therefore, it was estimated that an incentive of about $4/GJth would be sufficient to make biomass cost-competitive compared to coal. As the government has done with liquid biofuels, Ontario could implement a solid biofuel standard (e.g. 10%) for coal users in the province.
Given this level of government incentive, possibly coupled to a solid biofuel standard, biomass pellets replacing coal would have a CO2 abatement cost of about $48.26 per tonne CO2e (Table 3), about half the cost of biodiesel and 1/8th the cost of CO2e abatement using corn ethanol (Table 1).
Therefore, solid biofuels targeted at replacing coal offer a significant advantage for reducing greenhouse gas emissions.
Table 3. Proposed Incentive for Solid Biofuels:
Renewable Energy Alternative
Proposed Incentive ($/GJth)
Traditional Fossil Fuel Replaced
Net Offset 1 (KgCO2e/GJth)
Cost to Offset 1 tonne ($/tonne CO2e)
Coal 82.94 3 $48.26 3 Oil 77.73 3 $51.50 3
LNG 61.79 3 $64.80 3
Biomass pellets 2
$4.00
Natural gas 47.40 3 $84.56 3 1see text for calculations 2 biomass pellets include switchgrass, straw and wood 3 average value of all biomass pellet options Conclusions: The report's major discovery, as highlighted by the tables above, is that government incentives applied to large scale solid biofuels would surpass even the most effective existing subsidies — those for wind power — at reducing emissions of greenhouse gases. If green heat programs and large scale power incentives were provided at a rate of $4.00/GJ for biomass pellets, CO2e offsets would be created at a cost of less than $50.00/tonne of CO2e abated when displacing coal. Solid biofuels also have the advantage over wind power in that they can be stored and used for base or peak load in power applications. Moreover, production and transportation of solid biofuels at the necessary scale would provide a major economic stimulation to the rural economy. Ultimately, a solid biofuel incentive would cost 1/2 as much per tonne of CO2e avoided as comparable biodiesel programs, and 1/8th as much as current ethanol programs. The findings suggest that a solid biofuels policy would be an effective and sustainable means to develop the Ontario and Canadian economies. Such a program would support market opportunities for the forestry industry and for farmers with marginal farmlands. It would also reduce the need for coal imports into Ontario and proposed Liquified Natural Gas (LNG) fossil fuel imports into Canada, thus improving Ontario’s and Canada’s trade balances. Beyond the economic co-benefits, incentives for biomass pellets for green heat and electricity generation simply offer a cost-effective strategy for governments to reduce the amount of CO2e going into the atmosphere, while addressing other priorities.
BIOCAP Canada Foundation – prepared by REAP-Canada
iv
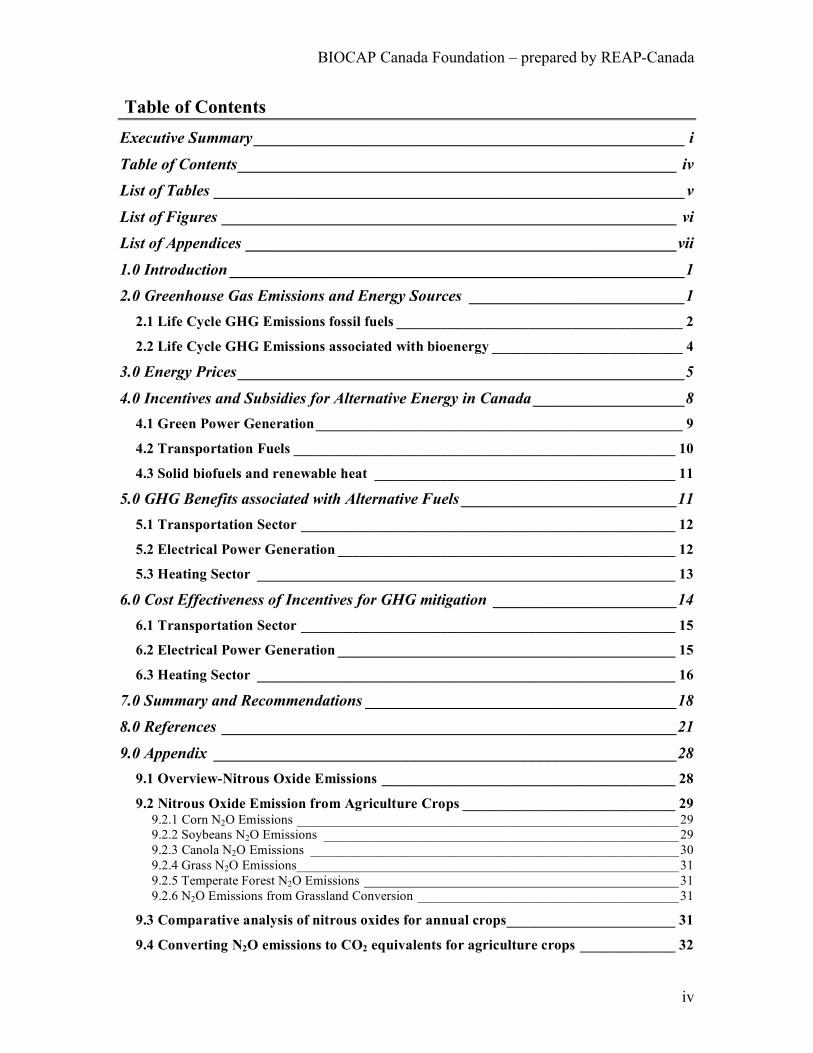
Table of Contents Executive Summary______________________________________________________ i Table of Contents_______________________________________________________ iv List of Tables ___________________________________________________________ v
List of Figures _________________________________________________________ vi List of Appendices ______________________________________________________vii 1.0 Introduction _________________________________________________________1 2.0 Greenhouse Gas Emissions and Energy Sources ___________________________1
2.1 Life Cycle GHG Emissions fossil fuels _______________________________________ 2 2.2 Life Cycle GHG Emissions associated with bioenergy __________________________ 4
3.0 Energy Prices________________________________________________________5
4.0 Incentives and Subsidies for Alternative Energy in Canada___________________8 4.1 Green Power Generation__________________________________________________ 9 4.2 Transportation Fuels ____________________________________________________ 10 4.3 Solid biofuels and renewable heat _________________________________________ 11
5.0 GHG Benefits associated with Alternative Fuels___________________________11 5.1 Transportation Sector ___________________________________________________ 12 5.2 Electrical Power Generation ______________________________________________ 12 5.3 Heating Sector _________________________________________________________ 13
6.0 Cost Effectiveness of Incentives for GHG mitigation _______________________14 6.1 Transportation Sector ___________________________________________________ 15 6.2 Electrical Power Generation ______________________________________________ 15 6.3 Heating Sector _________________________________________________________ 16
7.0 Summary and Recommendations _______________________________________18 8.0 References _________________________________________________________21
9.0 Appendix __________________________________________________________28 9.1 Overview-Nitrous Oxide Emissions ________________________________________ 28 9.2 Nitrous Oxide Emission from Agriculture Crops _____________________________ 29
9.2.1 Corn N2O Emissions _________________________________________________________29 9.2.2 Soybeans N2O Emissions _____________________________________________________29 9.2.3 Canola N2O Emissions _______________________________________________________30 9.2.4 Grass N2O Emissions_________________________________________________________31 9.2.5 Temperate Forest N2O Emissions _______________________________________________31 9.2.6 N2O Emissions from Grassland Conversion _______________________________________31
9.3 Comparative analysis of nitrous oxides for annual crops_______________________ 31 9.4 Converting N2O emissions to CO2 equivalents for agriculture crops _____________ 32

BIOCAP Canada Foundation – prepared by REAP-Canada
v
List of Tables Table 1.Estimated delivered costs of fossil fuels ($/GJ) for the winter season 2007-2008 6 Table 2. Estimated delivered costs of bioenergy feedstocks ($/GJ) in 2007 ___________7 Table 3. Summary of federal and provincial (Ontario) producer incentives for renewable power generation ________________________________________________________9 Table 4. Incentives summary of federal and provincial (Ontario) incentives for the transport sector _________________________________________________________10 Table 5. GHG emissions from the transport sector and savings associated with alternative fuel switching __________________________________________________________12 Table 6. GHG emissions from electrical power generation and savings associated with alternative fuel switching _________________________________________________13 Table 7. GHG emissions from the heating sector and savings associated with alternative fuel switching __________________________________________________________14 Table 8. The cost of fuel switching in the transportation sector using current federal and provincial (Ontario) incentive programs _____________________________________15 Table 9. The cost of fuel switching for electrical power generation using current federal and provincial (Ontario) incentive programs __________________________________16 Table 10. The cost of fuel switching in the heating sector based on proposed incentive program of $2.00-$4.00/GJ _______________________________________________17

BIOCAP Canada Foundation – prepared by REAP-Canada
vi
List of Figures
Figure 1. Life-cycle greenhouse gas emissions of fossil fuels in Canada by sector _____3 Figure 2. Life cycle GHG emissions for bioenergy technologies by sector____________5

BIOCAP Canada Foundation – prepared by REAP-Canada
vii
List of Appendices
Table A1. N2O emissions (kg N2O-N ha-1 y-1) from literature for corn, soybeans, canola and warm- and cool-season grasses _________________________________________30 Figure A1. Comparative nitrous oxide emissions from bioenergy crops_____________32
BIOCAP Canada Foundation – prepared by REAP-Canada
1
1.0 Introduction
Climate change and energy security are amongst the greatest challenges that humanity is likely to face in the 21st century. To encourage the development of clean, climate friendly energy sources, governments around the world have regulated ‘green’ fuel standards and provided tax incentives, capital cost write-downs or other subsidies to support the development and implementation of alternative energy sources. The ultimate objective is to reduce dependence on coal, oil and natural gas, fossil energy resources that have been linked to climate change and – particularly in the case of oil and gas – have given rise to concerns about the security of energy supplies for the present and future generations of Canadians.
An important driver for the development of bioenergy should be the economic competitiveness of various technologies as greenhouse gas mitigation strategies. Thus, it is important that the economics of various solid and liquid biofuel options be compared. There are several factors which are fundamental to the economic competitiveness of various agricultural biomass production and conversion chains to reduce greenhouse gases effectively, including:
1) the quantity of energy (GJ) that a bioenergy chain can produce per hectare; 2) the net GHG offset provided by displacing a GJ of fossil fuel with a GJ of
renewable energy in the same application (fuel switching); 3) the cost of producing the processed bioenergy product relative to the fossil fuel it
is displacing.
This report assesses the cost of various energy feedstocks in units of $/gigajoule (GJ) (Section 3) and then summarizes the current combined incentives being provided by the Canadian federal government and the Ontario provincial government for a range of alternative energies (Section 4). Alternative energies are compared in units of $/GJ of delivered energy and $ per tonne of greenhouse gases (CO2e) avoided. Based on these findings, the report assesses the potential of the various biofuels to contribute to climate change and energy goals, and explores the potential of incentives for solid biofuels on CO2 mitigation costs. The report concludes with recommendations for consideration by policy makers in Canada.
2.0 Greenhouse Gas Emissions and Energy Sources
One of the main rationales for bioenergy development is the GHG mitigation potential of biofuels when replacing fossil fuels in transportation, electrical generation and heating applications. In 2005, Canada generated a total of 747 Mt CO2e, which is approximately 25.3% above the revised 1990 total of 596Mt CO2e and is 32.7% above the Kyoto targets (Environment Canada, 2007a). The transportation sector represented approximately 23.3% of Canada’s total GHG emission inventory in 2005 or 174 Mt CO2e (excluding aviation transportation); while electricity and heat generation produced an estimated 129 Mt CO2e (17.2%) and commercial and residential heating produced 78.8 Mt CO2e, or
BIOCAP Canada Foundation – prepared by REAP-Canada
2
roughly 10.5% (Environment Canada, 2007a). Collectively, these areas represented 51% of Canada’s GHG emissions and are a sizable market for climate friendly solid, liquid, and gaseous biofuels.
2.1 Life Cycle GHG Emissions fossil fuels
Understanding greenhouse gas emissions associated with fossil fuel use and renewable fuels can provide a sound basis for creating effective policy strategies for GHG mitigation in Canada. Monitoring of emissions associated with current fossil and renewable fuels used in Canada continues to improve as global efforts to assess GHG emissions increase. In the case of fossil fuels there are 3 main sources of emissions: emissions from combustion, emissions from production (i.e. fuel production, operations and transportation) and fugitive emissions. (i.e. methane emitted from coal mines). In the case of biofuels, emissions are associated with fuel production and combustion as well as landscape emissions (eg. N2O emissions from N loss).
The greenhouse gas emissions associated with fossil fuel use in Canada by sector are identified in Figure 1. Data for conventional natural gas, heating oil and coal is sourced from Natural Resources Canada GHGenius lifecycle emissions model. GHGenius is a program with a systematic approach to modeling both energy technologies and fuel use. Greenhouse gas emissions are divided by the three sectors: transportation, electrical power and heating. Gasoline and diesel are both similar in terms of the GHGs emitted per GJ at 99.56 kgCO2e/GJ and 98.54 kgCO2e/GJ, respectively. In terms of electrical power, production coal is currently the highest GHG emitting fuel (298.97 kgCO2e/GJ), followed by oil (281.34 kgCO2e/GJ) and natural gas (121.74 kgCO2e/GJ). Commercial and residential heating with natural gas currently have the lowest emissions in Canada at 57.57 kgCO2e/GJ. Imported liquified natural gas (LNG) which was estimated from published reports to be 73.69 kgCO2e/GJ, has a significantly higher GHG footprint than domestic natural gas. Canada’s petroleum mix for heating applications is now 87.90 kgCO2e/GJ, just below coal which is the highest GHG emitting fossil fuel commonly used in Canada at 93.11 kgCO2e/GJ.

BIOCAP Canada Foundation – prepared by REAP-Canada
3
0
50
100
150
200
250
300
Gasolin
e
Die
se
l
Co
al
Oil
Natu
ral
ga
s
Co
al
Heating
oil*
LN
G**
Natu
ral
ga
s
Transportation Electrical power Heating
GH
G e
mis
sio
ns (
Kg
CO
2e/G
J)
Figure 1. Life-cycle greenhouse gas emissions of fossil fuels in Canada by sector *Petroleum value provided here represents typical oil mix in Canada (48% domestic production and 52% international sources) ** Estimate based on studies of Russian gas imports into Europe (Uherek, 2005) and Australian LNG imports into the US (Heede, 2006; Jaramillo et al., 2007). A main trend in GHG emissions from domestically produced fuels is increasing emissions from petroleum based fuels, as conventional oil production is declining while heavy oil production is increasing in Canada. Heavy oil has higher emissions because a) natural gas is used in the tarsands extraction process; or b) oilsands materials located on site are gasified to provide the processing energy for heavy oil production. As can be seen from Figure 1, new-generation oil production in Canada now has GHG emissions approaching coal. Thus for heat applications, heating oil use now approaches coal in terms of its GHG footprint. An important new energy source for Canada is liquefied natural gas (LNG), with projects planned for at least 3 Canadian provinces (Quebec, New Brunswick and British Columbia). There has been little discussion within Canada, however, about the greenhouse gas emissions associated with LNG imports which are planned to be primarily from Russia. The major sources of Russian gas pipeline imports into Germany have been recently studied by a joint Russian/German team and identified to be 73.8 Kg CO2e/GJ (Uherek, 2005) or 18% below the reference value for oil. In the study, 68% of the indirect emissions were found to come from CO2 released from the gas turbines of compressor units providing the energy to move the gas along the pipelines. It is becoming well known that upstream emissions with LNG imports are quite large. LNG imports will significantly increase the carbon footprint of natural gas use in North America due to increased emissions associated with longer distance gas transport in pipelines, LNG liquification, ocean transport and heating during re-gasification. For the purposes of this report a value of 73.7 kg CO2e/GJ is used, providing a GHG loading

BIOCAP Canada Foundation – prepared by REAP-Canada
4
value 28% greater than the emissions of North American produced natural gas which is similar to other estimates (Heede, 2006; Jaramillo et al., 2007; and Uherek, 2005).
2.2 Life Cycle GHG Emissions associated with bioenergy
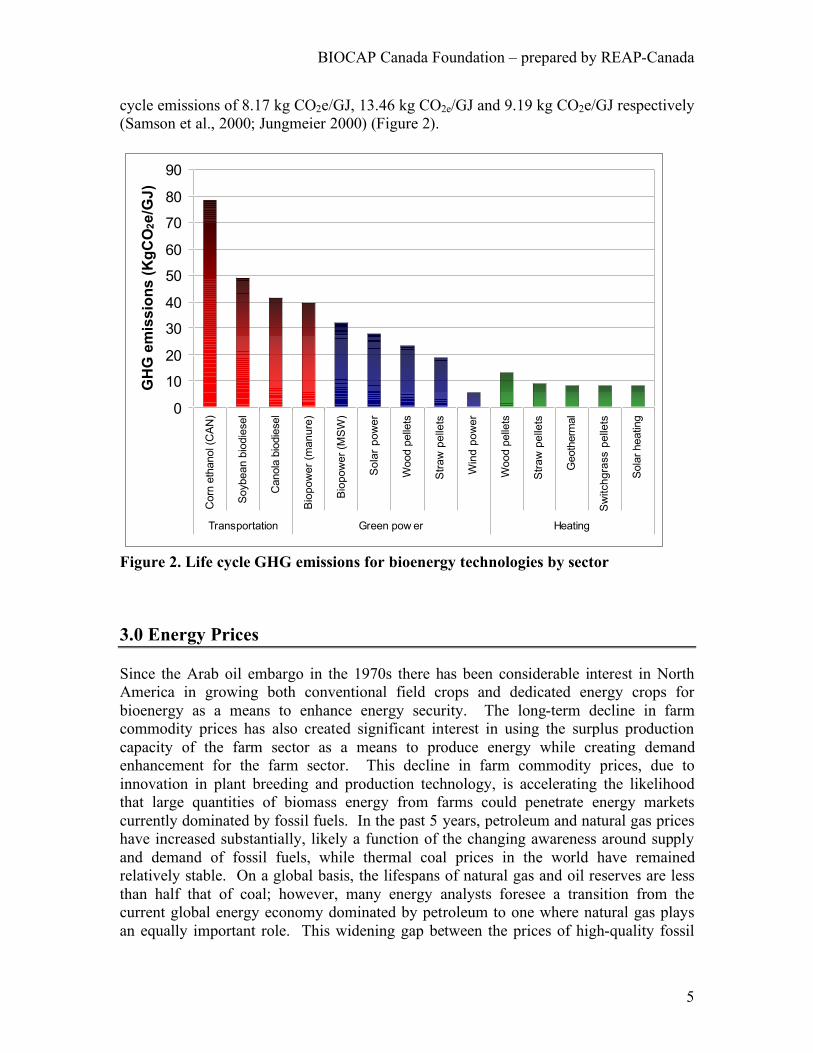
Transportation. Liquid biofuels, specifically ethanol and biodiesel are the two fuel switching options evaluated for offsetting traditional gasoline and diesel within the transportation sector. The energy source used to produce corn ethanol differs between the United States and Canada with the former using predominately coal-fired plants and the latter using natural gas fueled plants. The fuel used to produce ethanol plays a large role in the total GHG emissions. For example corn ethanol produces an estimated 84.90 kg CO2e/GJ in the United States and 62.03 kgCO2e/GJ in Canada (Hill et al., 2006; Energy Information Administration 2006). The difference in fuel consumption during the production of ethanol greatly impacts life-cycle emissions, resulting in the production of 27% more emissions from coal-fired plants. However, when landscape emissions from N2O emissions are also included (see Appendix), an additional 16.4 kg CO2e/ha is associated with each GJ of corn ethanol and the emissions increase to 78.4 kg and 100.3 kg CO2e/ha for corn ethanol in Canada and the US respectively. In Canada this results in a 21% reduction in CO2 emissions relative to gasoline for transport. Recent studies from the US have also found very low GHG offsets from corn ethanol ranging from 15% (Farrell et al., 2006) to 19% (Wang et al., 2007).
In the case of biodiesel, the GHG balances are significantly better as the liquid fuel production process is less energy intensive than the corn ethanol plant which requires fermentation and distillation. The life cycle GHG from soybean biodiesel including N2O emissions are estimated to be 48.8 kg CO2e/GJ in Ontario which is 50% that of diesel. These results are further detailed in the Appendix.
Electrical Power. Six renewable fuel options were evaluated for electrical power fuel switching including wind and solar power, wood and straw pellets and biopower (manure and municipal solid waste). Greenhouse gas emissions associated with wind and solar power production were estimated at 5.56 kg CO2e/GJ and 27.78 kg CO2e/GJ (Gagnon et al., 2002; Banerjee et al., 2006). Wood and straw pellets had estimated GHG life cycle emissions of 23.38 kg CO2e/GJ and 18.89 kg CO2e/GJ for electrical power generation use (Jungmeier 2000; Nielsen 1998). Biopower options with manure (not including manure GHG prevention) and municipal solid waste (MSW) produce 39.44 kg CO2e/GJ and 31.94 kg CO2e/GJ, respectively (Ghafoori et al., 2006; Murphy et al., 2006) (Figure 2).
Heating. The heating sector encompasses commercial, industrial and residential heating applications. Four bioenergy options were considered at potential fuel switching alternatives. They included geothermal, and wood and straw pellets. Switchgrass, a warm season perennial grass, was also considered a viable alternative fuel source for heating in the form of pellets. Geothermal heating options had life cycle emissions of 8.42 kg CO2e/GJ (Pehnt, 2005). Switchgrass, wood and straw pellets had estimated life
BIOCAP Canada Foundation – prepared by REAP-Canada
5
cycle emissions of 8.17 kg CO2e/GJ, 13.46 kg CO2e/GJ and 9.19 kg CO2e/GJ respectively (Samson et al., 2000; Jungmeier 2000) (Figure 2).
0
10
20
30
40
50
60
70
80
90
Corn
eth
anol (C
AN
)
Soybean b
iodie
sel
Canola
bio
die
sel
Bio
po
we
r (m
an
ure
)
Bio
po
we
r (M
SW
)
So
lar
po
we
r
Wood p
elle
ts
Str
aw
pe
llets
Win
d p
ow
er
Wood p
elle
ts
Str
aw
pe
llets
Geoth
erm
al
Sw
itch
gra
ss p
elle
ts
Sola
r heating
Transportation Green pow er Heating
GH
G e
mis
sio
ns (
Kg
CO
2e
/GJ
)
Figure 2. Life cycle GHG emissions for bioenergy technologies by sector
3.0 Energy Prices
Since the Arab oil embargo in the 1970s there has been considerable interest in North America in growing both conventional field crops and dedicated energy crops for bioenergy as a means to enhance energy security. The long-term decline in farm commodity prices has also created significant interest in using the surplus production capacity of the farm sector as a means to produce energy while creating demand enhancement for the farm sector. This decline in farm commodity prices, due to innovation in plant breeding and production technology, is accelerating the likelihood that large quantities of biomass energy from farms could penetrate energy markets currently dominated by fossil fuels. In the past 5 years, petroleum and natural gas prices have increased substantially, likely a function of the changing awareness around supply and demand of fossil fuels, while thermal coal prices in the world have remained relatively stable. On a global basis, the lifespans of natural gas and oil reserves are less than half that of coal; however, many energy analysts foresee a transition from the current global energy economy dominated by petroleum to one where natural gas plays an equally important role. This widening gap between the prices of high-quality fossil
BIOCAP Canada Foundation – prepared by REAP-Canada
6
fuels like natural gas and petroleum versus coal will make fuels of higher quality ideal candidates for displacement by renewables. This growing difference between fossil fuel prices suggests that high-quality fossil fuels will be increasingly utilized for high-end applications such as transportation fuels and industrial products while lower-quality fuels will be increasingly used for low-end thermal applications.
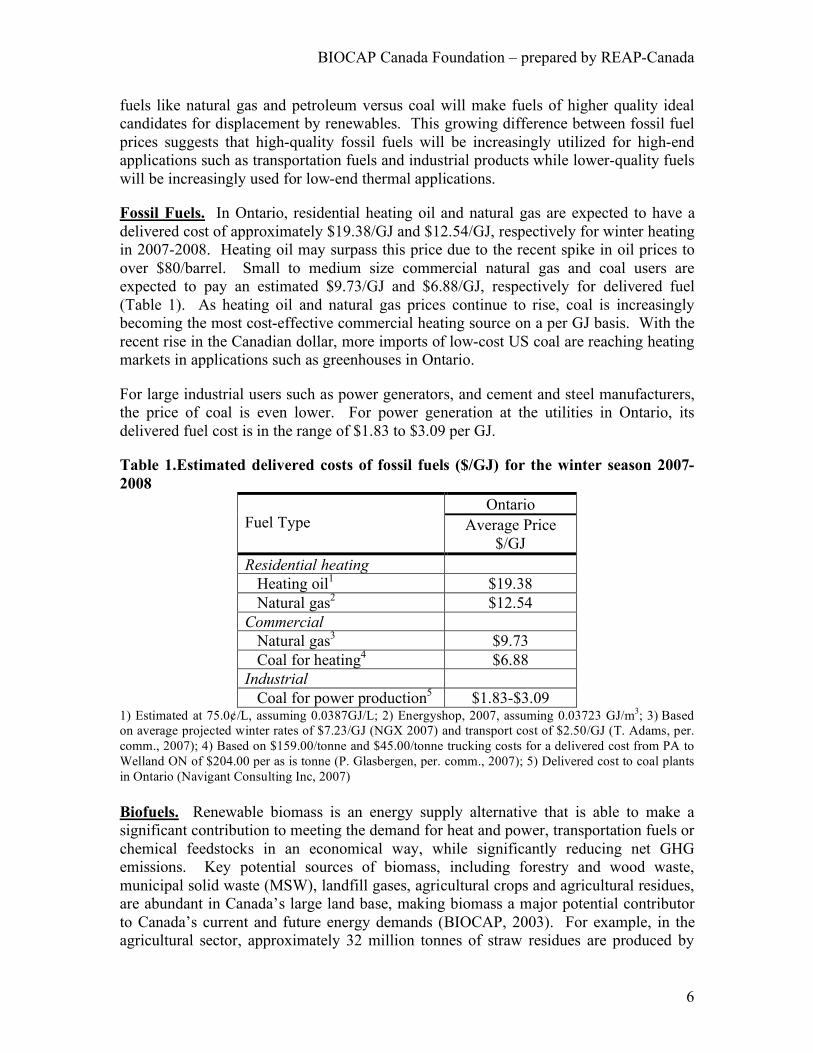
Fossil Fuels. In Ontario, residential heating oil and natural gas are expected to have a delivered cost of approximately $19.38/GJ and $12.54/GJ, respectively for winter heating in 2007-2008. Heating oil may surpass this price due to the recent spike in oil prices to over $80/barrel. Small to medium size commercial natural gas and coal users are expected to pay an estimated $9.73/GJ and $6.88/GJ, respectively for delivered fuel (Table 1). As heating oil and natural gas prices continue to rise, coal is increasingly becoming the most cost-effective commercial heating source on a per GJ basis. With the recent rise in the Canadian dollar, more imports of low-cost US coal are reaching heating markets in applications such as greenhouses in Ontario.
For large industrial users such as power generators, and cement and steel manufacturers, the price of coal is even lower. For power generation at the utilities in Ontario, its delivered fuel cost is in the range of $1.83 to $3.09 per GJ.
Table 1.Estimated delivered costs of fossil fuels ($/GJ) for the winter season 2007-2008
Ontario Fuel Type Average Price
$/GJ Residential heating Heating oil1 $19.38
Natural gas2 $12.54
Commercial Natural gas3 $9.73
Coal for heating4 $6.88
Industrial
Coal for power production5 $1.83-$3.09 1) Estimated at 75.0¢/L, assuming 0.0387GJ/L; 2) Energyshop, 2007, assuming 0.03723 GJ/m3; 3) Based on average projected winter rates of $7.23/GJ (NGX 2007) and transport cost of $2.50/GJ (T. Adams, per. comm., 2007); 4) Based on $159.00/tonne and $45.00/tonne trucking costs for a delivered cost from PA to Welland ON of $204.00 per as is tonne (P. Glasbergen, per. comm., 2007); 5) Delivered cost to coal plants in Ontario (Navigant Consulting Inc, 2007) Biofuels. Renewable biomass is an energy supply alternative that is able to make a significant contribution to meeting the demand for heat and power, transportation fuels or chemical feedstocks in an economical way, while significantly reducing net GHG emissions. Key potential sources of biomass, including forestry and wood waste, municipal solid waste (MSW), landfill gases, agricultural crops and agricultural residues, are abundant in Canada’s large land base, making biomass a major potential contributor to Canada’s current and future energy demands (BIOCAP, 2003). For example, in the agricultural sector, approximately 32 million tonnes of straw residues are produced by
BIOCAP Canada Foundation – prepared by REAP-Canada
7
prairie grain crops each year, generating a prospective 5 million tonnes of available residues if soil fertility is maintained (CANREN, 2003). As well, Canada has 35.9 million hectares of land currently in crops with 68 million hectares of farm land in total (Statistics Canada, 2007). The value of renewable biomass in promoting energy security and decreasing greenhouse gas (GHG) emissions is further strengthened by its potential role in supporting the agricultural sector and in particular, its potential role to increase farm receipts from marginal farmlands.
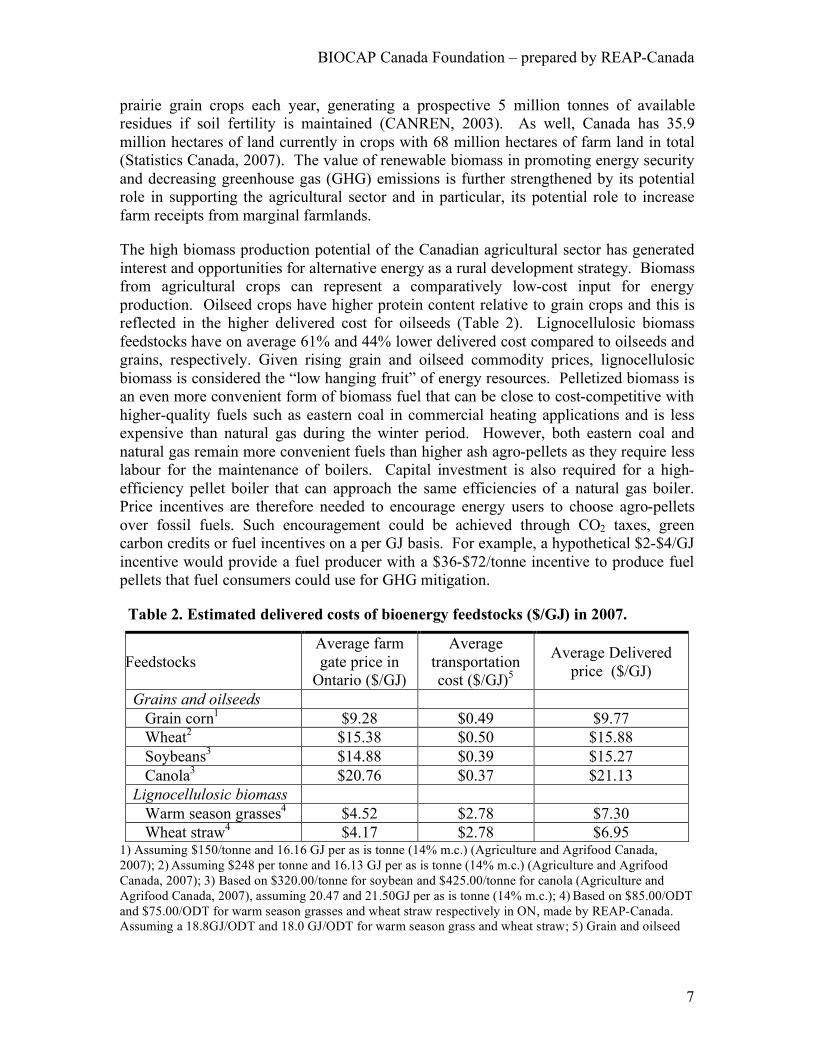
The high biomass production potential of the Canadian agricultural sector has generated interest and opportunities for alternative energy as a rural development strategy. Biomass from agricultural crops can represent a comparatively low-cost input for energy production. Oilseed crops have higher protein content relative to grain crops and this is reflected in the higher delivered cost for oilseeds (Table 2). Lignocellulosic biomass feedstocks have on average 61% and 44% lower delivered cost compared to oilseeds and grains, respectively. Given rising grain and oilseed commodity prices, lignocellulosic biomass is considered the “low hanging fruit” of energy resources. Pelletized biomass is an even more convenient form of biomass fuel that can be close to cost-competitive with higher-quality fuels such as eastern coal in commercial heating applications and is less expensive than natural gas during the winter period. However, both eastern coal and natural gas remain more convenient fuels than higher ash agro-pellets as they require less labour for the maintenance of boilers. Capital investment is also required for a high-efficiency pellet boiler that can approach the same efficiencies of a natural gas boiler. Price incentives are therefore needed to encourage energy users to choose agro-pellets over fossil fuels. Such encouragement could be achieved through CO2 taxes, green carbon credits or fuel incentives on a per GJ basis. For example, a hypothetical $2-$4/GJ incentive would provide a fuel producer with a $36-$72/tonne incentive to produce fuel pellets that fuel consumers could use for GHG mitigation.
Table 2. Estimated delivered costs of bioenergy feedstocks ($/GJ) in 2007.
Fuel TypeggFeedstocks Average farm gate price in
Ontario ($/GJ)
Average transportation cost ($/GJ)5
Average Delivered price ($/GJ)
Grains and oilseeds Grain corn1 $9.28 $0.49 $9.77 Wheat2 $15.38 $0.50 $15.88 Soybeans3 $14.88 $0.39 $15.27 Canola3 $20.76 $0.37 $21.13 Lignocellulosic biomass Warm season grasses4 $4.52 $2.78 $7.30 Wheat straw4 $4.17 $2.78 $6.95
1) Assuming $150/tonne and 16.16 GJ per as is tonne (14% m.c.) (Agriculture and Agrifood Canada, 2007); 2) Assuming $248 per tonne and 16.13 GJ per as is tonne (14% m.c.) (Agriculture and Agrifood Canada, 2007); 3) Based on $320.00/tonne for soybean and $425.00/tonne for canola (Agriculture and Agrifood Canada, 2007), assuming 20.47 and 21.50GJ per as is tonne (14% m.c.); 4) Based on $85.00/ODT and $75.00/ODT for warm season grasses and wheat straw respectively in ON, made by REAP-Canada. Assuming a 18.8GJ/ODT and 18.0 GJ/ODT for warm season grass and wheat straw; 5) Grain and oilseed
BIOCAP Canada Foundation – prepared by REAP-Canada
8
transportation costs estimated at $8.00/tonne and lignocellulosic biomass estimated $50.00/tonne for processing into pellets and transportation. Cost Comparison. On an energy basis, farm gate prices for grain corn prices are lower than residential heating oil and natural gas prices, and similar to commercial natural gas heating prices. Farm gate prices for processed lignocellulosic biomass, however, are similar to delivered costs of commercial coal for heating. Prices for the industrial use of coal for the power generation industry appear to be very economical as large volumes of product can be transported by ship. Larger fuel switching incentives will therefore be required for industrial coal users to switch to biomass. The most logical application for biomass is to produce energy products near the end-use application. As an example, it may be possible that bulk delivery of chopped fibre to a cement factory could help biomass feedstocks be more cost-competitive with coal.
4.0 Incentives and Subsidies for Alternative Energy in Canada
A number of new programs and incentives for renewable energy have recently emerged in Canada or are currently in development. In April 2007, the federal government of Canada announced its new climate change program “Canada ecoTrust for Clean Air and Climate Change” which includes the “ecoAction and ecoEnergy” programs for encouraging the production of renewable energy alternatives (GOC, 2007a). The initiative supports renewable energy, energy efficiency, and alternative technology and transportation endeavours for individual consumers and businesses via subsidies and financial incentives.
Among provinces, incentive programs are highly diverse. At present, the Territories and Atlantic Provinces (with the exception of Nova Scotia) have limited or non-existent incentive programs for renewable fuels, while in Quebec the government has focused on direct investment toward increases in energy efficiency, wind energy and hydro power (GOQ, 2007). Alberta is currently developing a new incentives program, which is expected to be announced by the end of 2007. The importance of energy developments in this province makes it a crucial case for present and future analysis
Ontario. The provincial focus of this report is Ontario, the largest provincial/territorial energy user in Canada (Office of Energy Efficiency, 2007). Ontario has the most extensive current programming with respect to renewable energy. In the following section, current federal and Ontario incentives are reviewed for the electrical power generation, transportation and heat energy sectors. In general, governmental support for renewable energy production includes producer incentives (per kWh or per litre) as well as some form of capital cost incentive.
Other incentives include assistance for business plan development for liquid fuels from the federal government and biogas installations from the province of Ontario (Ontario Ministry of Agriculture, Food and Rural Affairs, 2007). Owners of E85 ethanol fuelled

BIOCAP Canada Foundation – prepared by REAP-Canada
9
vehicles also receive support through grants (Transport Canada, 2007), despite the fact that no E85 is commercially produced in Canada.
4.1 Green Power Generation
Producer Incentives. The Canadian federal government is encouraging the production of 14.3 terrawatt hours (TWh) of new clean electricity under its ecoAction and ecoEnergy policy programs. Renewable power projects such as wind, biomass, low-impact hydro, geothermal, solar, photovoltaic (PV) and ocean energy constructed in the next four years are eligible for an incentive of 1¢/KWh for up to 10 years ending March 31, 2011. Provincially, Ontario’s power generation incentives have been combined into the Standard Offer Program which was launched in November 2006 to support small renewable energy generation facilities (Ontario Power Authority, 2006). Projects eligible for funding under the Standard Offer Program must generate electricity from wind, solar PV, thermal electric solar, renewable biomass, biogas, biofuel, landfill gas or water power. Projects must be located in Ontario, with an installed capacity no larger than 10 MW, and be connected to an eligible electricity system in Ontario. Project developers must furthermore enter into a contract with the Ontario Power Authority for a term of 20 years at a base rate of 11.0¢/KWh for electricity delivered to the grid (with the exception of solar PV which is paid a fixed price of 42.0¢/KWh) (Ontario Power Authority, 2006). Projects that operate reliably during peak hours are paid an additional 3.52¢/KWh for electricity delivered in this time. Rates are to be annually indexed to inflation at 20% of the base rate starting May 1, 2007 (Ontario Power Authority, 2006).
Given the recent emergence of numerous renewable energy incentives, it is important to compare the current and proposed subsidies that are becoming available for renewable electricity generation in Canada. In Table 3, total incentives are calculated for wind, solar, geothermal and biomass technologies, combining federal and province of Ontario data. Total incentives are calculated in terms of $ per kWh and in $ per GJ. The Ontario program was designed to support small power producers and is limited to a 10 MW installed capacity.
Table 3. Summary of federal and provincial (Ontario) producer incentives for renewable power generation
Power Generation (<10MW)
Federal Incentive ($/KWh)
Net incentive associated with ON Standard Offer price1
($/KWh)
Total federal & provincial
Incentive with ON buy rate ($/KWh)
Cost per GJ of incentives2
($/GJ)
Wind $0.01 $0.045 $0.055 $15.28 Renewable biomass $0.01 $0.045 $0.055 $15.28 Biogas $0.01 $0.045 $0.055 $15.28 Solar PV power $0.01 $0.355 $0.365 $101.40 Geothermal $0.01 NA $0.01 $2.78
1) Assuming the net incentive is calculated from the Standard Offer contract price minus the normal Ontario market power price of 6.5¢/KWh; 2) Assuming a conversion factor of 1 GJ= 277.8 KWh for the electricity sector
BIOCAP Canada Foundation – prepared by REAP-Canada
10
Overall, the highest current federal and Ontario provincial incentives equate to $101.40/GJ for solar PV power, which is far from technologically mature. Wind, renewable biomass, biogas and biofuels currently receive a combined value of $15.28/GJ. Geothermal power generation has a federal incentive of $2.78/GJ. There is no Ontario provincial subsidy for this technology. Ontario also has recently begun to offer incentives for business plans and to offset 40% of the capital costs of biogas digesters for farm based digestors (OMAFRA, 2007).
Consumer Incentives. Under the “Canada ecoTrust for Clean Air and Climate Change”, the ecoEnergy retrofit program provides financial support to homeowners, small and medium-sized business, industrial facilities and public institutions to help implement energy savings projects. The program was launched in April of 2007 and is scheduled to end March 31, 2011. Small/medium-sized commercial and institutional buildings, as well as industrial facilities may be eligible for 25% of costs to a maximum of $50,000 for the implementation of energy saving projects (GOC, 2007b).
In Ontario, capital cost subsidization of electricity systems has occurred primarily through tax rebates. Purchasers of solar electric, wind, micro hydro-electric and geothermal energy systems for residential premises can claim a refund of the 8% provincial sales tax for systems purchased on or before November 25, 2007 (Environment Canada, 2007b).
4.2 Transportation Fuels
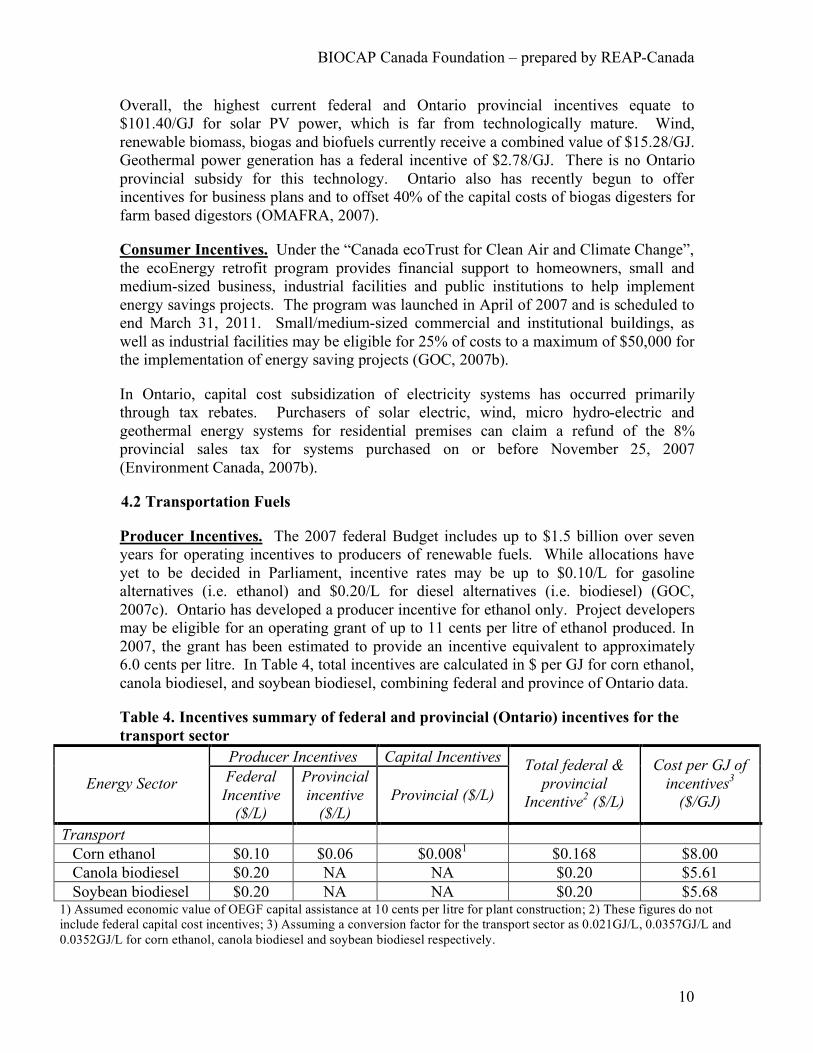
Producer Incentives. The 2007 federal Budget includes up to $1.5 billion over seven years for operating incentives to producers of renewable fuels. While allocations have yet to be decided in Parliament, incentive rates may be up to $0.10/L for gasoline alternatives (i.e. ethanol) and $0.20/L for diesel alternatives (i.e. biodiesel) (GOC, 2007c). Ontario has developed a producer incentive for ethanol only. Project developers may be eligible for an operating grant of up to 11 cents per litre of ethanol produced. In 2007, the grant has been estimated to provide an incentive equivalent to approximately 6.0 cents per litre. In Table 4, total incentives are calculated in $ per GJ for corn ethanol, canola biodiesel, and soybean biodiesel, combining federal and province of Ontario data.
Table 4. Incentives summary of federal and provincial (Ontario) incentives for the transport sector
Producer Incentives Capital Incentives
Energy Sector Federal Incentive
($/L)
Provincial incentive
($/L) Provincial ($/L)
Total federal & provincial
Incentive2 ($/L)
Cost per GJ of incentives3
($/GJ)
Transport Corn ethanol $0.10 $0.06 $0.0081 $0.168 $8.00 Canola biodiesel $0.20 NA NA $0.20 $5.61 Soybean biodiesel $0.20 NA NA $0.20 $5.68
1) Assumed economic value of OEGF capital assistance at 10 cents per litre for plant construction; 2) These figures do not include federal capital cost incentives; 3) Assuming a conversion factor for the transport sector as 0.021GJ/L, 0.0357GJ/L and 0.0352GJ/L for corn ethanol, canola biodiesel and soybean biodiesel respectively.
BIOCAP Canada Foundation – prepared by REAP-Canada
11
Capital Incentives. Within transportation fuels, the federally funded ecoAgriculture Biofuels Capital Initiative is expected to provide $200 million in federal funds for a four-year program ending March 31, 2011 (GOC, 2007d). The initiative provides repayable funds to transportation biofuel production facilities using agricultural feedstocks, for construction or expansion of their facilities. The 2007 budget has also made $500 million available for Sustainable Development Technology Canada (SDTC) to invest with the private sector in the establishment of facilities for next generation renewable fuels from non-food feedstocks (i.e. wheat straw, corn stover, switchgrass and wood residue) (GOC, 2007c). Capital subsidization has also been provided for transportation biofuels in Ontario. In June 2005, the Ontario Government announced the Ontario Ethanol Growth Fund (OEGF), a program allocating $520-million over 12-years to support the production of ethanol fuel in Ontario (Ontario Government, 2007). The OEGF provides capital assistance in the form of capital grants or loan guarantees to eligible new or expanding ethanol plants in the province. Project developers may receive capital assistance of up to 10 cents per litre of the proposed plant capacity (Ontario Government, 2007). Assuming this money was sourced by an investor and paid off over 25 years at 6% annual interest, this capital grant represents an additional subsidy of approximately 0.8 cents per litre of production. 4.3 Solid biofuels and renewable heat
There are limited programs currently available to support green heat in Canada. In most industrialized countries, including Canada, heat related energy applications represent the largest energy demand within the economy and therefore large GHG mitigation potential. Federally, renewable heat incentives for capital costs are offered under the “Canada ecoTrust for Clean Air and Climate Change” for the industrial, commercial and institutional sectors to support the installation of solar space and water heating, as well as assist with the establishment of solar and geothermal technologies in the marketplace. Purchasers of solar heating systems could offset their purchase and installation of a qualifying system by up to 25% (GOC, 2007e).
As with Green Power Generation in Ontario, capital cost subsidization of heat systems has occurred primarily through tax rebates. Purchasers of solar heating and geothermal energy systems for residential premises can claim a refund of the 8% provincial sales tax for systems purchased on or before November 25, 2007 (Environment Canada, 2007b).
5.0 GHG Benefits associated with Alternative Fuels
In this section, traditional fossil fuel uses and their potential alternative offset fuels are broken down into three energy uses: transportation, electrical power and heating. Given the importance of accounting for N2O emissions from agricultural biofuels, life cycle analyses listed in the tables below account for N2O emissions in determining total
BIOCAP Canada Foundation – prepared by REAP-Canada
12
kilograms of CO2 equivalents produced from production. For comparison purposes, all emission estimates presented are in kgCO2e per GJ.
5.1 Transportation Sector
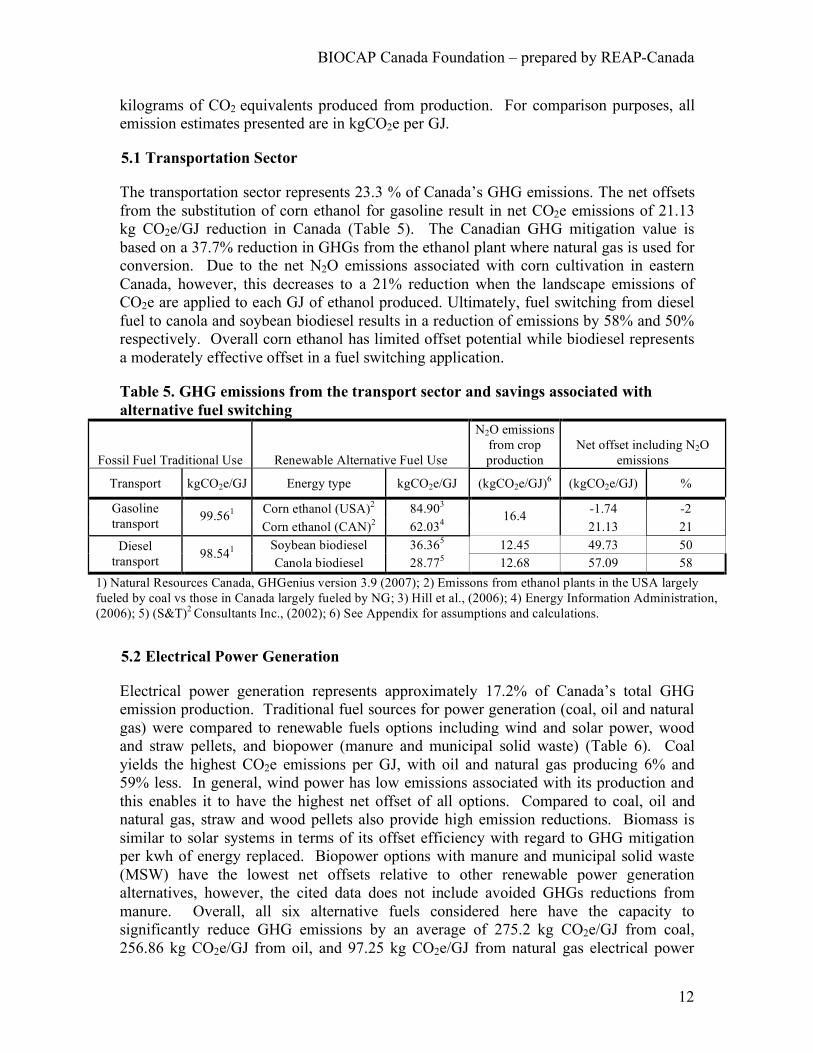
The transportation sector represents 23.3 % of Canada’s GHG emissions. The net offsets from the substitution of corn ethanol for gasoline result in net CO2e emissions of 21.13 kg CO2e/GJ reduction in Canada (Table 5). The Canadian GHG mitigation value is based on a 37.7% reduction in GHGs from the ethanol plant where natural gas is used for conversion. Due to the net N2O emissions associated with corn cultivation in eastern Canada, however, this decreases to a 21% reduction when the landscape emissions of CO2e are applied to each GJ of ethanol produced. Ultimately, fuel switching from diesel fuel to canola and soybean biodiesel results in a reduction of emissions by 58% and 50% respectively. Overall corn ethanol has limited offset potential while biodiesel represents a moderately effective offset in a fuel switching application.
Table 5. GHG emissions from the transport sector and savings associated with alternative fuel switching
Fossil Fuel Traditional Use Renewable Alternative Fuel Use
N2O emissions from crop production
Net offset including N2O emissions
Transport kgCO2e/GJ Energy type kgCO2e/GJ (kgCO2e/GJ)6 (kgCO2e/GJ) %
Corn ethanol (USA)2 84.903 -1.74 -2 Gasoline transport 99.561
Corn ethanol (CAN)2 62.034 16.4
21.13 21 Soybean biodiesel 36.365 12.45 49.73 50 Diesel
transport 98.541 Canola biodiesel 28.775 12.68 57.09 58
1) Natural Resources Canada, GHGenius version 3.9 (2007); 2) Emissons from ethanol plants in the USA largely fueled by coal vs those in Canada largely fueled by NG; 3) Hill et al., (2006); 4) Energy Information Administration, (2006); 5) (S&T)2 Consultants Inc., (2002); 6) See Appendix for assumptions and calculations.
5.2 Electrical Power Generation
Electrical power generation represents approximately 17.2% of Canada’s total GHG emission production. Traditional fuel sources for power generation (coal, oil and natural gas) were compared to renewable fuels options including wind and solar power, wood and straw pellets, and biopower (manure and municipal solid waste) (Table 6). Coal yields the highest CO2e emissions per GJ, with oil and natural gas producing 6% and 59% less. In general, wind power has low emissions associated with its production and this enables it to have the highest net offset of all options. Compared to coal, oil and natural gas, straw and wood pellets also provide high emission reductions. Biomass is similar to solar systems in terms of its offset efficiency with regard to GHG mitigation per kwh of energy replaced. Biopower options with manure and municipal solid waste (MSW) have the lowest net offsets relative to other renewable power generation alternatives, however, the cited data does not include avoided GHGs reductions from manure. Overall, all six alternative fuels considered here have the capacity to significantly reduce GHG emissions by an average of 275.2 kg CO2e/GJ from coal, 256.86 kg CO2e/GJ from oil, and 97.25 kg CO2e/GJ from natural gas electrical power

BIOCAP Canada Foundation – prepared by REAP-Canada
13
generation, averaging 209.77 kg CO2e/GJ reductions for switching from traditional sources. In general, switching from traditional to renewable sources in the power generation sectors shows high net offsets typically above 80%. This is compared to offsets in the transportation sector which are between 21% and 58% for Canadian produced biofuels.
Table 6. GHG emissions from electrical power generation and savings associated with alternative fuel switching
Fossil Fuel Traditional Use Renewable Alternative Fuel Use Net offset
Electrical Power kgCO2e/GJ electricity Energy type kgCO2e/GJelectrical
kgCO2eoffset /GJ %
Wind power 5.562 293.31 98 Solar power 27.783 271.09 91 Wood pellets 23.284 275.59 92 Straw pellets 18.895 279.98 94 Biopower (manure) 39.446 259.43 87
Coal 298.871
Biopower (MSW) 31.947 266.93 89 Wind power 5.56 275.78 98 Solar power 27.78 253.56 90 Wood pellets 23.28 258.06 92 Straw pellets 18.89 262.45 93 Biopower (manure) 39.44 241.90 86
Oil 281.341
Biopower (MSW) 31.94 249.40 89 Wind power 5.56 116.18 95 Solar power 27.78 93.96 77 Wood pellets 23.28 98.46 81 Straw pellets 18.89 102.85 84 Biopower (manure) 39.44 82.30 68
Natural gas 121.741
Biopower (MSW) 31.94 89.80 89 1) Natural Resources Canada, GHGenius version 3.9 (2007); 2) Gagnon et al., (2002); 3) Banerjee et al., (2006); 4) Jungmeier, (2000); 5) Nielsen, (1998); 6) Ghafoori et al., (2006); 7) Murphy et al., (2006)
5.3 Heating Sector
The Canadian industrial, commercial and residential heating sector produces approximately 10.5% of Canada’s total GHG emissions. As with electrical generation, coal, oil, and natural gas are traditional options for heating. While Canada does not yet import liquefied natural gas (LNG), there are numerous proposals to construct LNG import facilities in Atlantic Canada, Quebec and British Columbia. The most advanced project, located in Saint John (NB) is expected to be operational by 2008, and as such, estimates for LNG were developed for this report. LNG has inherently higher emissions, estimated at 28% emissions higher than domestically produced natural gas.
Switchgrass pellets and geothermal systems provide the highest offset potential with average reductions in CO2e emissions of 49.40 kg CO2e/GJ from natural gas, 63.79 kg CO2e/GJ from LNG, 79.73 kg CO2e/GJ from heating oil and 84.94 kg CO2e/GJ from
BIOCAP Canada Foundation – prepared by REAP-Canada
14
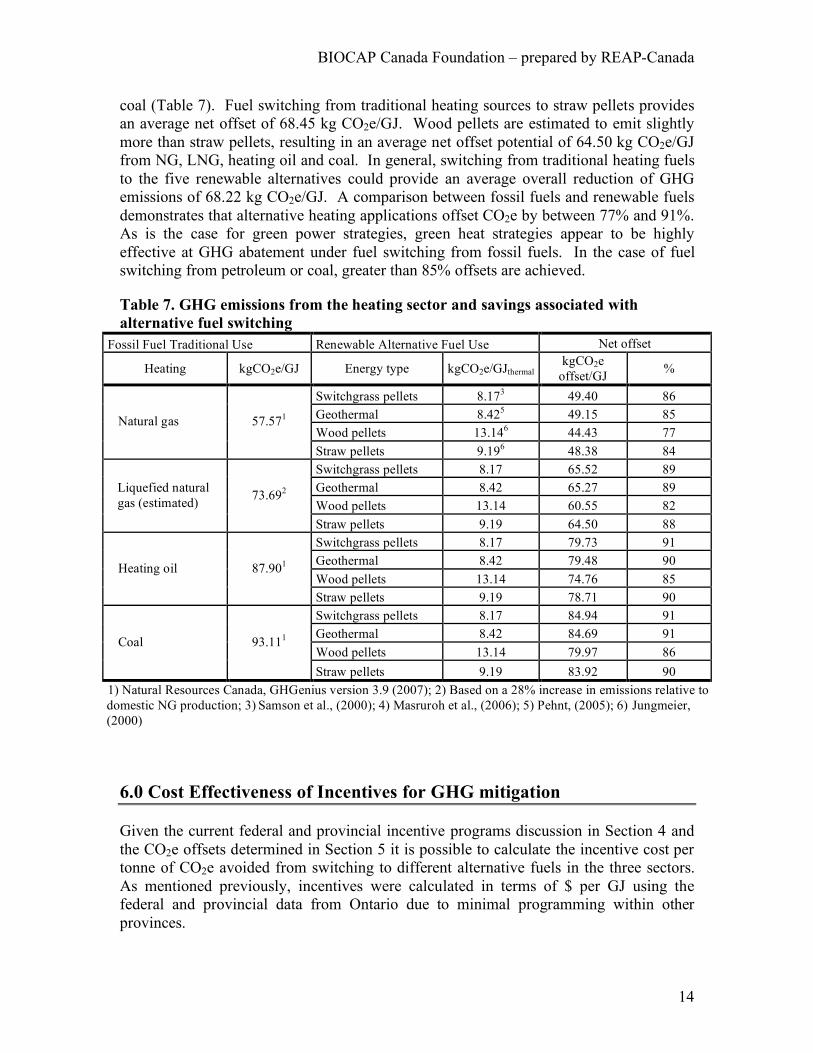
coal (Table 7). Fuel switching from traditional heating sources to straw pellets provides an average net offset of 68.45 kg CO2e/GJ. Wood pellets are estimated to emit slightly more than straw pellets, resulting in an average net offset potential of 64.50 kg CO2e/GJ from NG, LNG, heating oil and coal. In general, switching from traditional heating fuels to the five renewable alternatives could provide an average overall reduction of GHG emissions of 68.22 kg CO2e/GJ. A comparison between fossil fuels and renewable fuels demonstrates that alternative heating applications offset CO2e by between 77% and 91%. As is the case for green power strategies, green heat strategies appear to be highly effective at GHG abatement under fuel switching from fossil fuels. In the case of fuel switching from petroleum or coal, greater than 85% offsets are achieved.
Table 7. GHG emissions from the heating sector and savings associated with alternative fuel switching
Fossil Fuel Traditional Use Renewable Alternative Fuel Use Net offset
Heating kgCO2e/GJ Energy type kgCO2e/GJthermal kgCO2e
offset/GJ %
Switchgrass pellets 8.173 49.40 86 Geothermal 8.425 49.15 85 Wood pellets 13.146 44.43 77
Natural gas 57.571
Straw pellets 9.196 48.38 84 Switchgrass pellets 8.17 65.52 89 Geothermal 8.42 65.27 89 Wood pellets 13.14 60.55 82
Liquefied natural gas (estimated) 73.692
Straw pellets 9.19 64.50 88 Switchgrass pellets 8.17 79.73 91 Geothermal 8.42 79.48 90 Wood pellets 13.14 74.76 85
Heating oil 87.901
Straw pellets 9.19 78.71 90 Switchgrass pellets 8.17 84.94 91 Geothermal 8.42 84.69 91 Wood pellets 13.14 79.97 86
Coal 93.111
Straw pellets 9.19 83.92 90 1) Natural Resources Canada, GHGenius version 3.9 (2007); 2) Based on a 28% increase in emissions relative to domestic NG production; 3) Samson et al., (2000); 4) Masruroh et al., (2006); 5) Pehnt, (2005); 6) Jungmeier, (2000)
6.0 Cost Effectiveness of Incentives for GHG mitigation
Given the current federal and provincial incentive programs discussion in Section 4 and the CO2e offsets determined in Section 5 it is possible to calculate the incentive cost per tonne of CO2e avoided from switching to different alternative fuels in the three sectors. As mentioned previously, incentives were calculated in terms of $ per GJ using the federal and provincial data from Ontario due to minimal programming within other provinces.

BIOCAP Canada Foundation – prepared by REAP-Canada
15
6.1 Transportation Sector
As discussed in section 5.1., net offset potential of liquid biofuels (ethanol and biodiesel) for transportation uses are relatively low from fuel switching compared to electrical power generation and heating applications. This largely explains the poor economic performance of incentives applied to liquid biofuels in terms of GHG abatement. In this analysis, offsetting one tonne of CO2e with canola biodiesel is the least cost intensive incentive at $98.27 per tonne (Table 8). Next lowest in cost is soybean biodiesel at $114.22 per tonne. Incentives for corn ethanol produced in Ontario are the most expensive fuel switching strategy with mitigation costs of $378/tonne of CO2e offset. U.S. corn ethanol has a negative CO2e offset due to the fact that coal emissions from ethanol plants and N2O emissions from corn production combine to cancel any potential GHG benefit from ethanol fuel switching.
Table 8. The cost of fuel switching in the transportation sector using current federal and provincial (Ontario) incentive programs
Traditional Fossil Fuel Renewable Alternative Fuel Use
Net offset Incl. N2O if
applicable1 (kgCO2e/GJ)
Subsidy ($/GJ)2
Cost to offset 1 tonne ($/tonne
CO2e, including N2O if applicable
Corn ethanol (US) -1.74 $6.823 NA Gasoline transport Corn ethanol (Canada) 21.13 $8.00 $378.61 Soybean biodiesel 49.73 $5.68 $114.22 Diesel transport Canola biodiesel 57.09 $5.61 $98.27
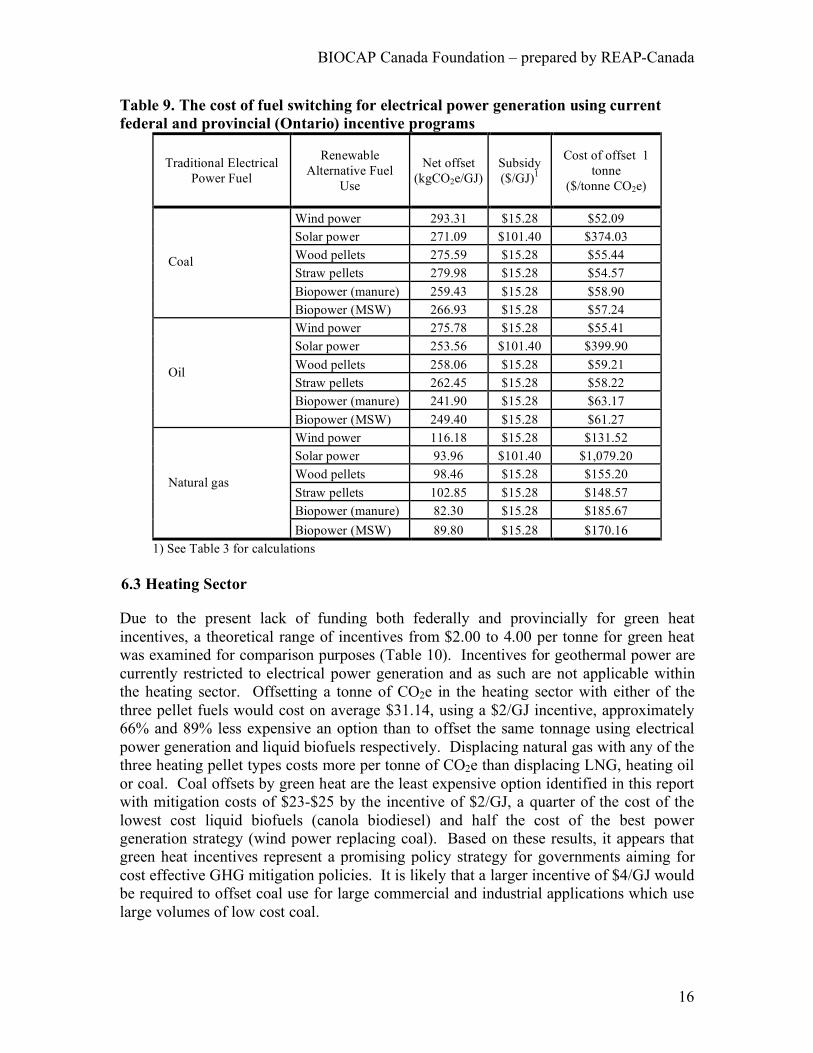
1) N2O emissions are associated with specific crop production and the portion allocated to corn ethanol, soybean biodiesel and canola biodiesel 16.4 kg CO2e/GJ, 12.45 kg CO2e/GJ and 12.68 kg CO2e/GJ respectively.; 2) See Table 4 for calculations; 3) Based on a federal U.S. subsidy of 51¢ per gallon (U.S. Department of Energy Efficiency, 2007b). Converted to Canadian currency with an exchange rate of 1.0528. 6.2 Electrical Power Generation In Ontario, the renewable energy tariff system will provide emission reductions under $60/tonne for most options that displace coal, the main fossil fuel targeted to be replaced in the province. Incentives for wind power substitution for coal power are the least expensive option identified at $52/tonne (Table 9). By comparison, displacing natural gas through fuel switching incentives is relatively expensive. The GHG offsets produced from switching traditional electrical power generation fuel sources to alternative renewable fuels is, on average, 209.77 kg CO2e/GJ (Table 9). It is likely that biomass could be the most economically viable strategy for CO2 offsets in this sector if used in combined heat and power applications.
BIOCAP Canada Foundation – prepared by REAP-Canada
16
Table 9. The cost of fuel switching for electrical power generation using current federal and provincial (Ontario) incentive programs
Traditional Electrical Power Fuel
Renewable Alternative Fuel
Use
Net offset (kgCO2e/GJ)
Subsidy ($/GJ)1
Cost of offset 1 tonne
($/tonne CO2e)
Wind power 293.31 $15.28 $52.09 Solar power 271.09 $101.40 $374.03 Wood pellets 275.59 $15.28 $55.44 Straw pellets 279.98 $15.28 $54.57 Biopower (manure) 259.43 $15.28 $58.90
Coal
Biopower (MSW) 266.93 $15.28 $57.24 Wind power 275.78 $15.28 $55.41 Solar power 253.56 $101.40 $399.90 Wood pellets 258.06 $15.28 $59.21 Straw pellets 262.45 $15.28 $58.22 Biopower (manure) 241.90 $15.28 $63.17
Oil
Biopower (MSW) 249.40 $15.28 $61.27 Wind power 116.18 $15.28 $131.52 Solar power 93.96 $101.40 $1,079.20 Wood pellets 98.46 $15.28 $155.20 Straw pellets 102.85 $15.28 $148.57 Biopower (manure) 82.30 $15.28 $185.67
Natural gas
Biopower (MSW) 89.80 $15.28 $170.16 1) See Table 3 for calculations
6.3 Heating Sector
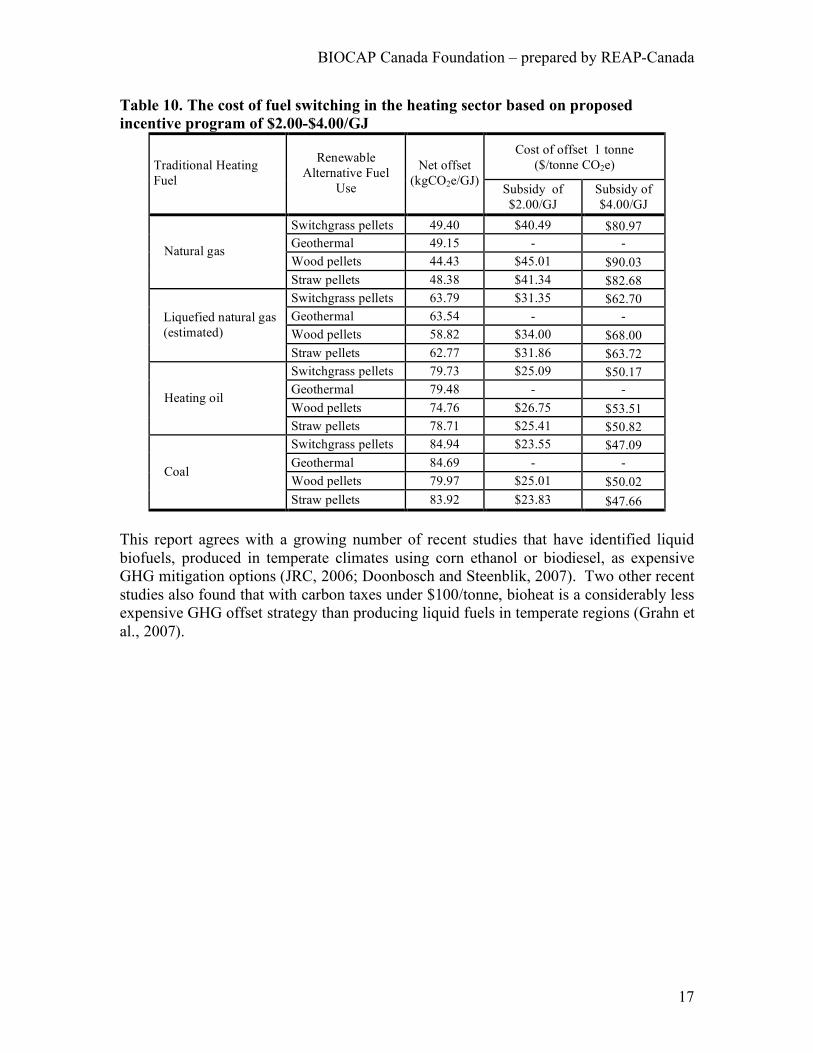
Due to the present lack of funding both federally and provincially for green heat incentives, a theoretical range of incentives from $2.00 to 4.00 per tonne for green heat was examined for comparison purposes (Table 10). Incentives for geothermal power are currently restricted to electrical power generation and as such are not applicable within the heating sector. Offsetting a tonne of CO2e in the heating sector with either of the three pellet fuels would cost on average $31.14, using a $2/GJ incentive, approximately 66% and 89% less expensive an option than to offset the same tonnage using electrical power generation and liquid biofuels respectively. Displacing natural gas with any of the three heating pellet types costs more per tonne of CO2e than displacing LNG, heating oil or coal. Coal offsets by green heat are the least expensive option identified in this report with mitigation costs of $23-$25 by the incentive of $2/GJ, a quarter of the cost of the lowest cost liquid biofuels (canola biodiesel) and half the cost of the best power generation strategy (wind power replacing coal). Based on these results, it appears that green heat incentives represent a promising policy strategy for governments aiming for cost effective GHG mitigation policies. It is likely that a larger incentive of $4/GJ would be required to offset coal use for large commercial and industrial applications which use large volumes of low cost coal.
BIOCAP Canada Foundation – prepared by REAP-Canada
17
Table 10. The cost of fuel switching in the heating sector based on proposed incentive program of $2.00-$4.00/GJ
Cost of offset 1 tonne ($/tonne CO2e) Traditional Heating
Fuel
Renewable Alternative Fuel
Use
Net offset (kgCO2e/GJ)
Subsidy of $2.00/GJ
Subsidy of $4.00/GJ
Switchgrass pellets 49.40 $40.49 $80.97 Geothermal 49.15 - - Wood pellets 44.43 $45.01 $90.03
Natural gas
Straw pellets 48.38 $41.34 $82.68 Switchgrass pellets 63.79 $31.35 $62.70 Geothermal 63.54 - - Wood pellets 58.82 $34.00 $68.00
Liquefied natural gas (estimated)
Straw pellets 62.77 $31.86 $63.72 Switchgrass pellets 79.73 $25.09 $50.17 Geothermal 79.48 - - Wood pellets 74.76 $26.75 $53.51
Heating oil
Straw pellets 78.71 $25.41 $50.82 Switchgrass pellets 84.94 $23.55 $47.09 Geothermal 84.69 - - Wood pellets 79.97 $25.01 $50.02
Coal
Straw pellets 83.92 $23.83 $47.66 This report agrees with a growing number of recent studies that have identified liquid biofuels, produced in temperate climates using corn ethanol or biodiesel, as expensive GHG mitigation options (JRC, 2006; Doonbosch and Steenblik, 2007). Two other recent studies also found that with carbon taxes under $100/tonne, bioheat is a considerably less expensive GHG offset strategy than producing liquid fuels in temperate regions (Grahn et al., 2007).
BIOCAP Canada Foundation – prepared by REAP-Canada
18
7.0 Summary and Recommendations
The profile of GHG emissions of fossil fuels indicates that the GHG footprint of petroleum based fossil fuels is increasing; for example, heating oil now produces GHG emissions similar to those from coal. As well, LNG appears to have an emissions profile that is 28% higher than domestically produced gas and imports of LNG will further reduce Canada’s trade balance. It is evident that a green heat policy could be an effective means to develop the Canadian economy by reducing coal and LNG fossil fuel imports into eastern Canada while also reducing greenhouse gas emissions and providing a stable and sustainable source of energy for the country.
Quantification of GHG emissions from agricultural crops also needs to include the N2O emissions. N2O is the third most important gas monitored under the Kyoto protocol and it plays an important role in the GHG balance for annual grains and oilseeds used in the production of ethanol and biodiesel. N2O emissions are not commonly factored into the energy balances of biomass crops, however, in the case of corn, soybean and canola, an additional 3.0, 1.5 and 1.2 tonnes of N2O-N are produced per hectare per year, respectively. The inclusion of N2O emissions is important to GHG mitigation accounting as well as energy balance equations for biofuel production. The GHG genius model needs updating to reflect the current level of understanding of soil scientists. In eastern Canada there is no scientific support for the supposition that soil carbon sequestering under conservation tillage is effective at offsetting landscape emissions from annual crop biofuel cultivation and farmers continue to use a mix of tillage systems.
Federal and provincial governments within Canada are providing a wide range of incentives and/or subsidies to encourage the development of clean, climate friendly energy sources. The heavy dependence on fossil energy has given rise to concerns not only about the future security of these resources but the impact they play on climate change. In the provincial context, Ontario is the most advanced in the use of green energy incentives.
An examination of the incentive programs for alternative renewable fuels was conducted using Ontario as the test case. Renewable fuel incentives were evaluated on a $ per GJ basis to enable a direct comparison of all technologies. Incentives for green power generation range from $15.28/GJ for wind, biomass, and biogas, to $101.40/GJ for solar power. Liquid biofuels used for transportation have estimated federal and provincial subsidies of $8.00/GJ for corn ethanol and federal incentives of approximately $5.64/GJ for biodiesel. There are currently no incentive programs for green heating applications; however, a suggested incentive of approximately $2.00-$4.00/GJ for switchgrass, wood and straw pellets could provide some level of parity with incentives for green power and liquid biofuels.
Given current alternative renewable incentives, as well as the proposed green heat incentives, it was found that the lowest cost offsets could be achieved by green heat incentives followed by green power incentives to replace coal. The most affordable liquid biofuel (canola biodiesel) offset was 4 times more expensive than the least cost bioheat strategy. However, even with the current incentive of 20 cents per litre,

BIOCAP Canada Foundation – prepared by REAP-Canada
19
making biodiesel from high quality canola and soybean oil at current prices is not likely to be a viable business opportunity. Corn ethanol is one of the least cost effective GHG mitigation policies presently supported in Ontario at $378/tonne CO2e. Given the fact that Canada is a net corn importer, it also appears to be an ineffective rural development strategy relative to supporting use of crops or lands (such as forage land) currently in surplus. The high cost of incentives for offsets from fuel switching fossil fuels to liquid biofuels is largely a function of their low to medium GHG offset potential. Green power and green heat strategies are more cost effective greenhouse gas policies due to their increased effectiveness at reducing GHG emissions when applied in a fuel switching application.
The economic success of bioheat is generated by matching a sustainable low-cost fuel supply with a strong local demand for energy for heat-related energy applications. In many areas of Canada today, there is a strong interest in farmers and rural energy users to replace high cost natural gas, propane and heating oil with bioheat. One challenge facing the emerging agro-pellet industry is that biofuels are competing in an industry that currently does not have an economically level playing field. The strong incentives currently existing in Canada for producing liquid biofuels encourage farmers to produce corn and other annual crops. If similar incentives were available for pellet producers to sell green heat products, the economics of growing and producing biomass crops for agro-pellets would improve considerably.
The economics of biomass are most competitive when substituting for high quality fossil fuels in decentralized applications. Many large industry users presently use large volumes of low-cost coal. As a result, in most instances without incentives, biomass is not as economically competitive in the industrial heat sector where biomass is used to substitute coal. Large industry users of energy such as power plants and steel mills tend to have very large energy demands requiring significant quantities of biomass to meet this demand. A strategic use of bioheat could be to focus primarily on the residential and commercial heat energy applications and to make efforts to create local markets to reduce biomass transport costs while focusing on efficient conversion technologies. A decentralized heat and power strategy from biomass could be the best means to displace conventional energy forms like coal in power generation.
If renewable energy technologies are to create a greater impact on Canada’s greenhouse gas emissions, energy security and rural development, more efficient policy incentives / strategies need to be developed that allow the renewable energy sector to develop equitably and efficiently. Potentially, the most effective mechanism to create CO2 mitigation from renewable energy technologies is to support systems from a results standpoint, managing for the desired outcome of GHG mitigation. This would ensure that the technologies ultimately supported contribute, in a significant way, to GHG mitigation within the country. The corn ethanol policy identified in this report appears to be a high cost GHG offset strategy; other districts of the world suffer similar problems. For example, biogas from maize silage production is heavily supported in Germany, but the combination of N2O losses from maize cultivation (Zwart et al., 2007; Crutzen et al., 2007), and methane leakage from biogas digesters (Borjesson and Berglund, 2006) greatly reduces GHG mitigation benefits.

BIOCAP Canada Foundation – prepared by REAP-Canada
20
There is a tremendous opportunity for Canada to develop its bioeconomy through efficient technology development; however, this technology revolution needs to be facilitated through efficient policy instruments. In reviewing the opportunity for climate change policies to reduce GHG emissions, perhaps the most effective approach would be to create a $25 carbon tax on fossil fuels and a $25 renewable carbon incentive applied across renewable energy technologies. This would create greater parity amongst technologies in the renewable energy marketplace, not heavily burden fossil fuel users and create adequate incentives for industry to fuel switch to renewables. Such a tax / incentive would appear to be a lower-cost GHG emission reduction strategy than what currently exists where incentives are applied by technology.
BIOCAP Canada Foundation – prepared by REAP-Canada
21
8.0 References
Adler, P.R., Del Grosso, S.J., Parton, W.J., 2007. Life-cycle assessment of net greenhouse-gas flux for bioenergy cropping systems. Ecological Applications, 17: 675-691. Agriculture and Agri-Food Canada. 2006. Grains and Oilseeds Outlook. www.agr.gc.ca/mad-dam/index_e.php?s1=pubs&s2=go-co&s3=php&page=go-co_2007-06-29&PHPSESSID=b1543ff1c38bb5a67fac59bfbeb4914a Accessed August 2007. Agriculture and Agri-Food Canada. 2007. Canada:Grains and Oilseed Outlook. September 17, 2007. www.agr.gc.ca/mad-dam/index_e.php?s1=pubs&s2=go-co&s3=php&page=go-co_2007-09-17. Accessed September 2007. Alberta Energy, 2007a. “Biorefining commercialization and market development program guidelines” (May 30, 2007). www.energy.gov.ab.ca/docs/albertaenergy/ BCMDP_Program_guidelines.pdf Alberta Energy, 2007b. “Bioenergy infrastructure development program guidelines” (May 30, 2007). www.energy.gov.ab.ca/docs/albertaenergy/BIDP_program_guidelines .pdf. Accessed July 2007. Alberta Environment, 2002. “Albertan’s Climate Change: Taking Action” (October 2002). www.greenlearning.ca/climate-change/policy/index.php?section=5&sub=3. Accessed July 2007. Beauchamp, E.G. 1997. Nitrous oxide emission from agricultural soils. Canadian Journal of Soil Science, 77: 113-123. BIOCAP, 2003. “A Canadian Biomass Inventory: Feedstocks for a Bio-based Economy” (June 27, 2003). www.biocap.ca/images/pdfs/BIOCAP_Biomass_ Inventory.pdf. Accessed July 2007. Banerjee, S., Duckers, L.J., Blanchard, R., Choudhury, B.K. 2006. Life Cycle analysis of selected solar and wave energy systems. National Conference on Advances in Energy Research (AER 2006) December 4- 5, 2006, IIT Bombay. Börjesson, Pal and Maria Berlund. 2005. Environmental systems analysis of biogas systems – Part I: Fuel-cycle emissions. Biomass and Bioenergy 30: 469-485. Bouwman, A.F., Van der Hoek, K.W., Olivier, J.G.J. 1995. Uncertainties in the global source distribution of nitrous oxide. Journal of Geophysical Research, 100: 2785-2800. Brumme, R., Borken, W., Finke, S. 1999. Hierarchical control on nitrous oxide emission in forest ecosystems. Global Biochemical Cycles, 13: 1137-1148.
BIOCAP Canada Foundation – prepared by REAP-Canada
22
CANREN, 2003. “Biomass in Canada”. www.canren.gc.ca/resou_asse/index.asp?CaID =53. Accessed July 2007. Cates, R.L.Jr., Keeney, D.R., 1987. Nitrous oxide emission from native and reestablished prairies in Southern Wisconsin. American Midland Naturalist, 117: 35-42. Crutzen, P., Mosier, A., Smith, K., and Winiwarter, W. 2007. N2O release from agro-biofuel production negates global warming reduction by replacing fossil fuels. Atmos. Chem. Phys. Discuss. (7), 11191-11205. Doornbosch, R. and Steenblik, R. 2007. Biofuels: Is the cure worse than the disease? Round Table on Sustainable Development Paris, 11-12 September 2007. Organisation for Economic Co-operation and Development. 57pg. www.foeeurope.org/publications /2007/OECD_Biofuels_Cure_Worse_Than_Disease_Sept07.pdf Drury, C.F., Yang, X.M., Reynolds, W.D., McLaughlin, N.B., 2007. Nitrous oxide and carbon dioxide emissions from monoculture and rotational cropping of corn, soybean and winter wheat. Canadian Journal of Soil Science, (In Press). Energy Information Administration (EIA). 2006. Emissions of Greenhouse Gasses in the United States 2005. Energy Information Administration, official energy statistics from the U.S. Government. www.eia.doe.gov/oiaf/1605/ggrpt/index.html. Accessed July 2007. Energyshop. 2007. “Deregulated natural gas prices for your business.” www.energyshop.com/es/prices/AB/gasAB.cfm?ldc_id= 439&v=50000. Accessed July 2007. Environment Canada, 2007a. Information on greenhouse gas sources and sinks. Canada’s 2005 greenhouse gas inventory. www.ec.gc.ca/pdb/ghg/inventory_report/2005/ 2005summary_e.cfm. Accessed September 2007. Environment Canada, 2007b. “The Green Lane: Climate Change - Incentives and Rebates”. http://incentivesandrebates.ca/gc_fi_search_display.asp?id=38&jurisdiction =10&actionArea=0&keyword= - Environment Canada. Accessed July 2007. Farrell, A., Plevin, R., Turner, B., Jones, A., O’Hare, M., and Kammen, D. 2006. Ethanol can contribute to energy and environmental goals. Science 311, 506. Gagnon, L., Belanger, C., and Yohji U., 2002. Life-cycle assessment of electricity generation options: The status of research in year 2001. Energy Policy, 30: 1267-1278. Ghafoori, E., Flynn, P.C., Checkl, N.D. 2006. Global warming impact of electricity generation from beef cattle manure: a life cycle assessment study. International Journal of Green Energy, 3: 257-270.

BIOCAP Canada Foundation – prepared by REAP-Canada
23
Global Resource Efficiency Services Inc., 2007. “Alberta renewable energy and energy efficiency 5 year plan”. Prepared for the Alberta Energy and Utilities Board. 28pp. www3.eub.gov.ab.ca/eub/dds/iar_query/ShowAttachment.aspx?DOCNUM=665612. Accessed July 2007. Goodroad, L.L, Keeney, D.R., 1984. Nitrous oxide emission from forest, marsh, and prairie ecosystems. Journal of Environmental Quality, 13: 448-452. Government of Canada (GOC), 2007a. “EcoEnergy an EcoAction Initiative” (May 25, 2007). www.ecoaction.gc.ca/ecoenergy-ecoenergie/index-eng.cfm GOC, 2007b. “EcoEnergy for Building and Houses” (May 20, 2007). http://oee.nrcan.gc. ca/ corporate/retrofit-summary.cfm?attr=0
GOC, 2007c. “Biofuels – Renewable Fuels”.www.ecoaction.gc.ca/biofuels-biocarburants-eng.cfm
GOC, 2007d. “The ecoAgriculture Biofuels Capital Initiative (ecoABC)” (June 21,2007), www.agr.gc.ca/index_e.php?s1=prog&s2=ecoabc-iieb
GOC, 2007e. “EcoEnergy for Renewable Power” (May 29, 2007). Available at www.ecoaction.gc.ca/ecoenergy-ecoenergie/power-electricite/index-eng.cfm Government of Quebec (GOQ), 2007. “Quebec in Action to Fight Climate Change” www.mddep.gouv.qc.ca/chang-clim/clim-change.pdf Grahn, M., Azar, C., Lindgren, K., Berndes, G., & Gielen, D. (2007). Biomass for heat or as transportation fuel? A comparison between two model-base studies. Biomass & Bioenergy (In press) Grant, B., Smith, W.N., Desjardins, R., Lemke, R., Li, C., 2004. Estimated N2O and CO2 emissions as influenced by agricultural practices in Canada. Climatic Change, 65: 315-332. Gregorich, E.G., Rochette, P., VandenBygaart, A.J. and D.A. Angers. 2005. Greenhouse gas contributions of agricultural soils and potential mitigation practices in Eastern Canada. Soil and Tillage Research 83: 53-72. Hansson, J., Berndes, G., Börjesson, P. 2006. "The prospects for large-scale import of biomass and biofuels into Sweden - a review of critical issues". Energy for Sustainable Development, 1: 82-94. Heede, R. “LNG Supply Chain Greenhouse Gas Emissions for the Cabrillo Deepwater Port: Natural Gas from Australia to California.” Climate Mitigation Services. May 2006. http://edcnet.org/ProgramsPages/LNGrptplusMay06.pdf. Accessed July 2007.
BIOCAP Canada Foundation – prepared by REAP-Canada
24
Helgason, B.L., Janzen, H.H., Chantigny, M.H., Drury, C.F., Ellert, B.H., Gregorich, E.G., Lemke, R.L., Pattey, E., Rochette, P., Wagner-Riddle, C., 2005. Toward improved coefficients for predicting direct N2O emissions from soil in Canadian agrosystems. Nutrient Cycling in Agroecosystems, 72: 87-99.
Hill, J., E. Nelson, D. Tilman, S. Polasky, and D. Tiffany. 2006. Environmental, economic, and energetic costs and benefits of biodiesel and ethanol biofuels. Proceedings from the National Academy of Science, 30:11206-11210. Intergovernmental Panel on Climate Change (IPCC). 1996. Revised 1996 IPCC Guidelines for National Greenhouse Gas Inventories. www.ipcc-nggip.iges.or.jp/public/ gl/invs1.htm IPCC 2001. Climate Change 2001: The Scientific Basis. www.grida.no/climate/ipcc_tar Jaramillo, P., Griffen, M.W., Matthews, H.S., 2007. Comparative life-cycle air emissions of coal, domestic natural gas, LNG, and SNG for electricity generation. Environmental Science and Technology, xx: xx-xx. http://pubs.acs.org/cgi-bin/asap.cgi/esthag/asap/ pdf/es063031o.pdf Joint Research Commission (JRC). 2006. Well to Wheel Up-date 2006. Institute for Environment Sustainability. http://ies.jrc.cec.eu.int/wtw.html. Accessed September 2007. Jongkunst, H.F., Freibauwer, A., Neufeldt, H., Bareth, G., 2006. Nitrous oxide emissions from agricultural land use in Germany- a synthesis of available annual field data. Journal of Plant Nutrition and Soil Science, 169: 341-351. Jungmeier, G., Canella, L., Stiglbrunner, R., Spitzer, J. 2000. LCA for comparison of GHG emissions of bio energy and fossil energy systems. Joanneum Research, Institut für Energieforschung, Graz. Report No.± IEF/B/06-99) Linn, D.M., Doran, J.W., 1984. Effect of water-filled pore space on carbon dioxide and nitrous oxide production in tilled and nontilled soils. Soil Science Society of America Journal, 48: 1267-1272. MacKenzie, A.F., Fan, M.X., Cadrin, F., 1997. Nitrous oxide emission as affected by tillage, corn-soybean-alfalfa rotations and nitrogen fertilization. Canadian Journal of Soil Science, 77: 145-152. Market Division Analysis (MAD), 2007. Selling Price of Bulk Feed Ingredients at Selected Points 2007-07-23. Agriculture and Agri-Food Canada. www.agr.gc.ca/mad-dam/. Accessed July 2007. Mosier, A.R., Parton, W.J., Valentine, D.W., Ojima, D.S., Schimel, D.S., Delgado, J.A., 1996. CH4 and N2O fluxes in the Colorado shortgrass steppe: 1. Impact of landscape and nitrogen addition. Global Biogeochemical Cycles, 10: 387-399.
BIOCAP Canada Foundation – prepared by REAP-Canada
25
Mosier, A.R. 2001. Exchange of gaseous nitrogen compounds between agricultural systems and the atmosphere. Plant and Soil, 228: 17-27. Mummey, D.L., Smith, J.L., Bluhm, G., 1997. Assessment of alternative soil management practices on N2O emissions from US agriculture. Agriculture, Ecosystems and Environment, 70: 79-87. Murphy, J.D. McKogh, E. 2006. The benefits of integrated treatment of wastes for the production of energy. Energy, 31: 294-310. Navigant Consulting Inc. 2007. Ontario wholesale electricity market price forecast. Report to the Ontario Energy Board. April 12, 2007. 29pp. www.oeb.gov.on.ca/ documents/cases/EB-2004-0205/rpp-nci_wholesaleelectricypriceforecastreport_ 20070412.pdf. Accessed July 2007. NGX. 2007. Alberta natural gas settlement prices. www.ngx.com/marketdata/settlements/ IASETTLE.html. Accessed July 2007. Nielsen, P.S., 1996. Life cycle analysis of selected biomass and fossil fuel for energy systems in Denmark and Ghana - with a special focus on greenhouse gas emissions. PhD Thesis, Department of Buildings and Energy. Technical University of Denmark. Natural Resources Canada (NRCAN). 2007. “Statistics and Facts on Forestry” (May 2007). Available at http://www.nrcan.gc.ca/statistics/forestry/default.html. Accessed July 2007. Natural Resources Canada, GHGenius version 3.9. 2007. www.ghgenius.ca/. Accessed July 2007. Office of Energy Efficiency, Natural Resources Canada. 2007. Comprehensive Energy Use Database Tables. http://oee.nrcan.gc.ca/corporate/statistics/neud/dpa/comprehensive _tables/index.cfm?fuseaction=Selector.showTree. Accessed July 2007. Ontario Power Authority, 2006. “Standard Offer Program – Renewable Energy for Small Electricity Generators, An introductory guide.” www.powerauthority.on.ca/sop/Storage /33/2889_SOPBro.pdf. Accessed July 2007. Ontario Government, 2007. “McGuinty Takes Next Step on Cleaner Air” (January 1, 2007). http://ogov.newswire.ca/ontario/GONE/2005/10/07/c8901.html?1match=&lang =_ e.html. Accessed July 2007. Ontario Ministry of Agriculture, Food and Rural Affairs. 2007. Ontario Biogas Systems Financial Assistance Program. www.omafra.gov.on.ca/english/engineer/biogas/index. html. Accessed August 2007.
BIOCAP Canada Foundation – prepared by REAP-Canada
26
Pehnt, M. 2005. Dynamic life cycle assessment (LCA) of renewable energy technologies. Institute for Energy and Environmental Research Heidelberg (Ifeu), Heidelberg, Germany. Rochette, P., Angers, D.A., Bélanger, G., Chantigny, M.H., Prévost, D., Lévesque, G., 2004. Emissions of N2O from alfalfa and soybean crops in Eastern Canada. Soil Science Society of America Journal, 68: 493-506. Samson, R., Drisdelle, M., Mulkins, L., Lapointe, C., Duxbury, P. 2000. The use of switchgrass biofuel pellets as a greenhouse gas offset strategy. Bioenergy 2000. Buffalo, New York. 10pp. Socolow, R.H. 1999. Nitrogen management and the future of food: Lessons from the management of energy and carbon. Proceedings of the National Academy of Science, 96: 6001-6008. Statistics Canada, 2007. “Total farm area, land tenure, and land in crops, by province (1986-2006 Census of Agriculture”. www40.statcan.ca/101/cst01/agrc25a.htm (S&T)2 Consultants Inc. 2002. Assessment of Biodiesel and Ethanol Diesel Blends, Greenhouse Gas Emissions, Exhaust Emissions, And Policy Issues. Prepared for Natural Resources Canada. www.greenfuels.org/biodiesel/pdf/res/200209_Assessment_of_ Biodiesel_and_EDiesel.pdf. Accessed July 2007. Transport Canada. 2007. “EcoTransport – ecoAuto Rebate program”. www.tc.gc.ca/ programs/environment/ecotransport/ecoauto.htm#2007vehicleflexfuel Accessed August 2007. Uherek, E. 2005. Natural gas: Are pipeline leaks warming our planet? Atmospheric Composition Change (ACCENT). www.atmosphere.mpg.de/enid/Nr_3_Sept__2__ 5_methane/energy/R__Methane_emission_from_pipelines_4pd.html Accessed August 2007. U.S. Department of Energy, 2007a. “Biomass Program”. www1.eere.energy. gov/biomass/biofuels_initiative.html. Accessed August 2007. U.S. Department of Energy Efficiency, 2007b. “United States (Federal) Incentives and Laws” Alternative Fuels Data Center. www.eere.energy.gov/afdc/progs/fed_all.cgi? afdc/US/0 Wagner-Riddle, C., Thurtell, G.W., Kidd, G.K., Beauchamp, E.G., Sweetman, R., 1997. Estimates of nitrous oxide emissions from agricultural fields over 28 months. Canadian Journal of Soil Science, 77: 135-144.

BIOCAP Canada Foundation – prepared by REAP-Canada
27
Zwart, Kor, Oudendag, Dity and Peter Kuikman. 2007. “Sustainability of Co-Digestion”. Power point presentation in proceedings of the International Energy Farming Congress (13 March – 15 March), Papenburg, Germany. www.bioenergienoord.nl
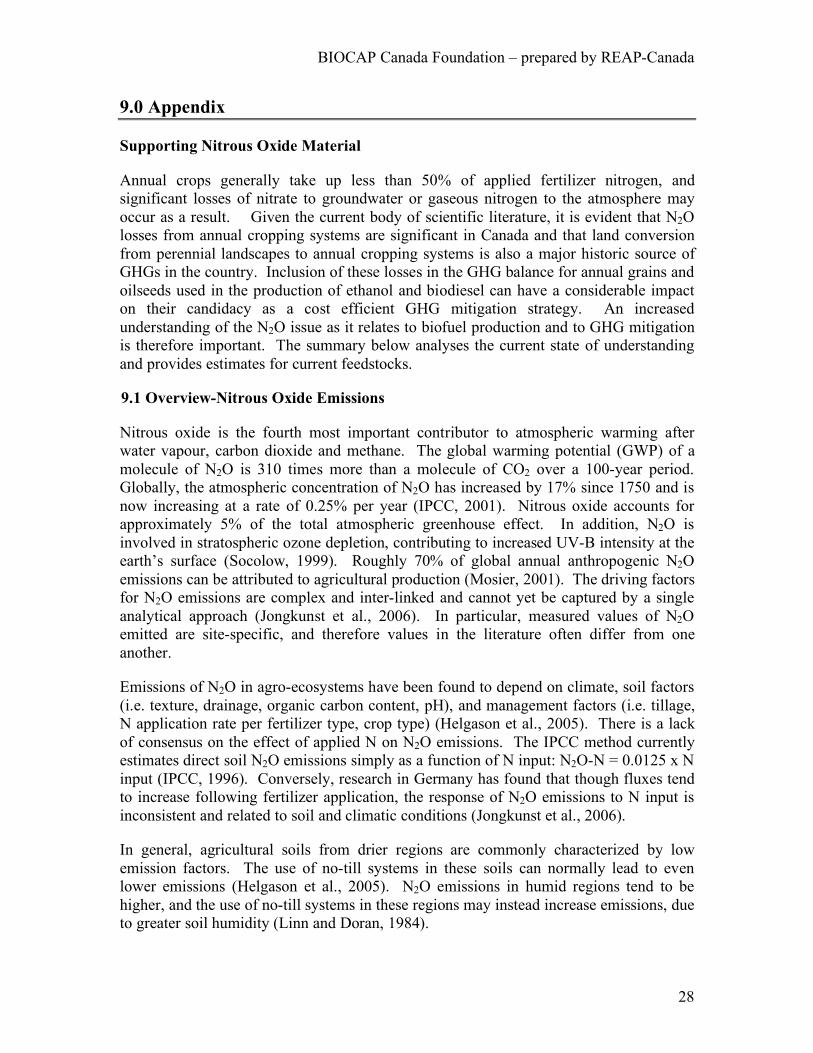
BIOCAP Canada Foundation – prepared by REAP-Canada
28
9.0 Appendix
Supporting Nitrous Oxide Material
Annual crops generally take up less than 50% of applied fertilizer nitrogen, and significant losses of nitrate to groundwater or gaseous nitrogen to the atmosphere may occur as a result. Given the current body of scientific literature, it is evident that N2O losses from annual cropping systems are significant in Canada and that land conversion from perennial landscapes to annual cropping systems is also a major historic source of GHGs in the country. Inclusion of these losses in the GHG balance for annual grains and oilseeds used in the production of ethanol and biodiesel can have a considerable impact on their candidacy as a cost efficient GHG mitigation strategy. An increased understanding of the N2O issue as it relates to biofuel production and to GHG mitigation is therefore important. The summary below analyses the current state of understanding and provides estimates for current feedstocks.
9.1 Overview-Nitrous Oxide Emissions
Nitrous oxide is the fourth most important contributor to atmospheric warming after water vapour, carbon dioxide and methane. The global warming potential (GWP) of a molecule of N2O is 310 times more than a molecule of CO2 over a 100-year period. Globally, the atmospheric concentration of N2O has increased by 17% since 1750 and is now increasing at a rate of 0.25% per year (IPCC, 2001). Nitrous oxide accounts for approximately 5% of the total atmospheric greenhouse effect. In addition, N2O is involved in stratospheric ozone depletion, contributing to increased UV-B intensity at the earth’s surface (Socolow, 1999). Roughly 70% of global annual anthropogenic N2O emissions can be attributed to agricultural production (Mosier, 2001). The driving factors for N2O emissions are complex and inter-linked and cannot yet be captured by a single analytical approach (Jongkunst et al., 2006). In particular, measured values of N2O emitted are site-specific, and therefore values in the literature often differ from one another.
Emissions of N2O in agro-ecosystems have been found to depend on climate, soil factors (i.e. texture, drainage, organic carbon content, pH), and management factors (i.e. tillage, N application rate per fertilizer type, crop type) (Helgason et al., 2005). There is a lack of consensus on the effect of applied N on N2O emissions. The IPCC method currently estimates direct soil N2O emissions simply as a function of N input: N2O-N = 0.0125 x N input (IPCC, 1996). Conversely, research in Germany has found that though fluxes tend to increase following fertilizer application, the response of N2O emissions to N input is inconsistent and related to soil and climatic conditions (Jongkunst et al., 2006).
In general, agricultural soils from drier regions are commonly characterized by low emission factors. The use of no-till systems in these soils can normally lead to even lower emissions (Helgason et al., 2005). N2O emissions in humid regions tend to be higher, and the use of no-till systems in these regions may instead increase emissions, due to greater soil humidity (Linn and Doran, 1984).
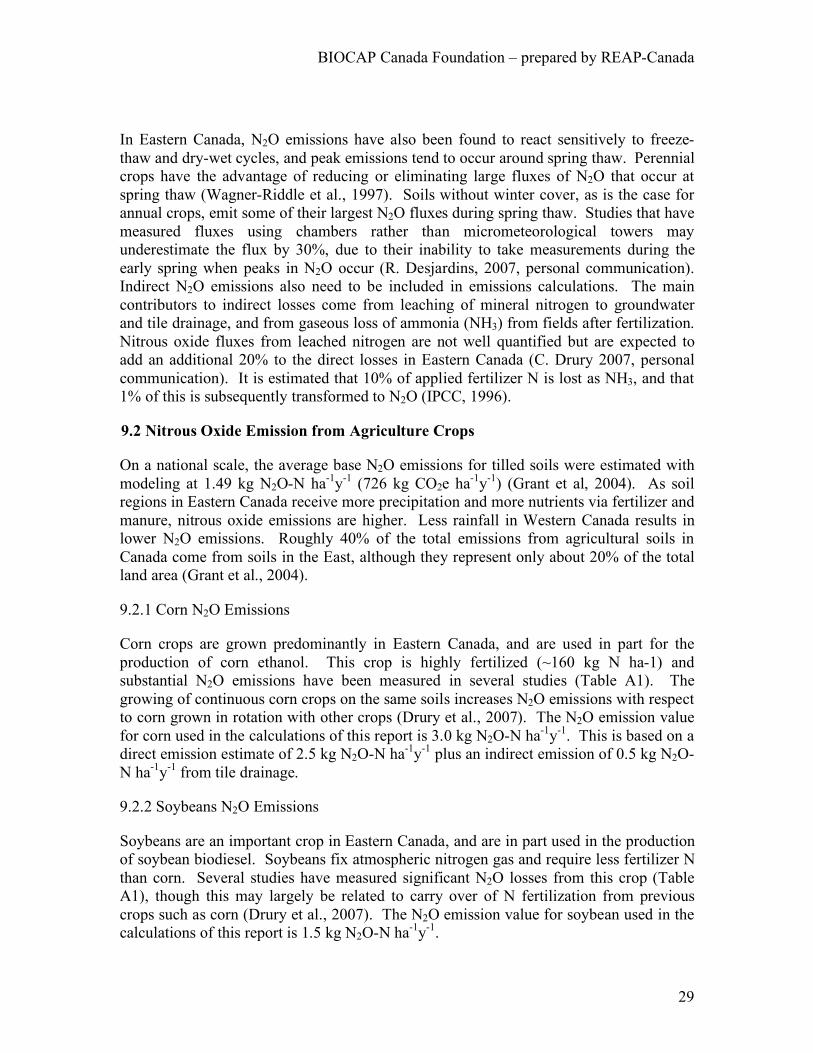
BIOCAP Canada Foundation – prepared by REAP-Canada
29
In Eastern Canada, N2O emissions have also been found to react sensitively to freeze-thaw and dry-wet cycles, and peak emissions tend to occur around spring thaw. Perennial crops have the advantage of reducing or eliminating large fluxes of N2O that occur at spring thaw (Wagner-Riddle et al., 1997). Soils without winter cover, as is the case for annual crops, emit some of their largest N2O fluxes during spring thaw. Studies that have measured fluxes using chambers rather than micrometeorological towers may underestimate the flux by 30%, due to their inability to take measurements during the early spring when peaks in N2O occur (R. Desjardins, 2007, personal communication). Indirect N2O emissions also need to be included in emissions calculations. The main contributors to indirect losses come from leaching of mineral nitrogen to groundwater and tile drainage, and from gaseous loss of ammonia (NH3) from fields after fertilization. Nitrous oxide fluxes from leached nitrogen are not well quantified but are expected to add an additional 20% to the direct losses in Eastern Canada (C. Drury 2007, personal communication). It is estimated that 10% of applied fertilizer N is lost as NH3, and that 1% of this is subsequently transformed to N2O (IPCC, 1996).
9.2 Nitrous Oxide Emission from Agriculture Crops
On a national scale, the average base N2O emissions for tilled soils were estimated with modeling at 1.49 kg N2O-N ha-1y-1 (726 kg CO2e ha-1y-1) (Grant et al, 2004). As soil regions in Eastern Canada receive more precipitation and more nutrients via fertilizer and manure, nitrous oxide emissions are higher. Less rainfall in Western Canada results in lower N2O emissions. Roughly 40% of the total emissions from agricultural soils in Canada come from soils in the East, although they represent only about 20% of the total land area (Grant et al., 2004).
9.2.1 Corn N2O Emissions
Corn crops are grown predominantly in Eastern Canada, and are used in part for the production of corn ethanol. This crop is highly fertilized (~160 kg N ha-1) and substantial N2O emissions have been measured in several studies (Table A1). The growing of continuous corn crops on the same soils increases N2O emissions with respect to corn grown in rotation with other crops (Drury et al., 2007). The N2O emission value for corn used in the calculations of this report is 3.0 kg N2O-N ha-1y-1. This is based on a direct emission estimate of 2.5 kg N2O-N ha-1y-1 plus an indirect emission of 0.5 kg N2O-N ha-1y-1 from tile drainage.
9.2.2 Soybeans N2O Emissions
Soybeans are an important crop in Eastern Canada, and are in part used in the production of soybean biodiesel. Soybeans fix atmospheric nitrogen gas and require less fertilizer N than corn. Several studies have measured significant N2O losses from this crop (Table A1), though this may largely be related to carry over of N fertilization from previous crops such as corn (Drury et al., 2007). The N2O emission value for soybean used in the calculations of this report is 1.5 kg N2O-N ha-1y-1.

BIOCAP Canada Foundation – prepared by REAP-Canada
30
9.2.3 Canola N2O Emissions
The N2O emission value for canola used in the calculations of this report is 1.2 kg N2O-N ha-1y-1. This value is estimated as 20% below the projected national average of 1.49 kg N2O ha-1y-1 for tilled soils. This value requires further analysis, however, as no studies were found on N2O emissions from canola in western Canadian studies. Canola is typically grown on the dark brown and black soils in Western Canada and receives among the highest N rates (typically 60-80 kg N ha-1) of all major field crops in Western Canada. The studies listed in Table A1 were carried out in Ontario and are expected to be higher than emissions from Western Canada where canola is primarily grown.
Table A1. N2O emissions (kg N2O-N ha-1 y-1) from literature for corn, soybeans, canola and warm- and cool-season grasses. Corn* Reference N2O flux Location Notes Beauchamp, 1997 3.1 Elora, ON Wagner-Riddle et al., 1997 2.5 Elora, ON Mummey et al., 1997 2.9 U.S. (average) Simulated; conventional tillage Mummey et al., 1997 3.6 U.S. (average) Simulated; no-till Drury et al. 2007 1.2 Woodslee, ON continuous corn crop Soybeans Reference N2O flux Location Notes Beauchamp, 1997 4.8 Elora, ON Estimate Wagner-Riddle et al., 1997 1.61 Elora, ON MacKenzie et al., 1997 1.23-2.16 Montreal, QC Rochette et al., 2004 0.46-3.08 Quebec, QC Drury et al. 2007 0.24 Woodslee, ON continuous soybean crop Canola† Reference N2O flux Location Notes Beauchamp, 1997 3.6 Elora, ON Estimate Wagner-Riddle et al., 1997 2.8 Elora, ON Cool Season Grass Reference N2O flux Location Notes Beauchamp, 1997 0.3 Elora, ON Unfertilized Kentucky Bluegrass; estimate Wagner-Riddle et al., 1997 -0.07-
0.26 Elora, ON Unfertilized Kentucky Bluegrass
Rochette et al., 2004 0.28-0.38 Québec, QC Unfertilized Timothy Warm Season Grass* Reference N2O flux Location Notes Goodroad and Keeney, 1984 0.19-0.22 SW Wisconsin burned and unburned bluestem and indian
grasses; unfertilized Cates and Keeney, 1987 0.28 SW Wisconsin mixed native prairie grasses; unfertilized Mosier et al., 1996 0.14 Colorado Unfertilized shortgrass steppe Adler et al. 2007 0.98 Pennsylvania Switchgrass; DAYCENT estimate; 56 kg N ha-1 †The estimate for calculations is lower than measured values in Ontario, as most canola is grown in Western Canada where soils are drier and where less N2O is produced.
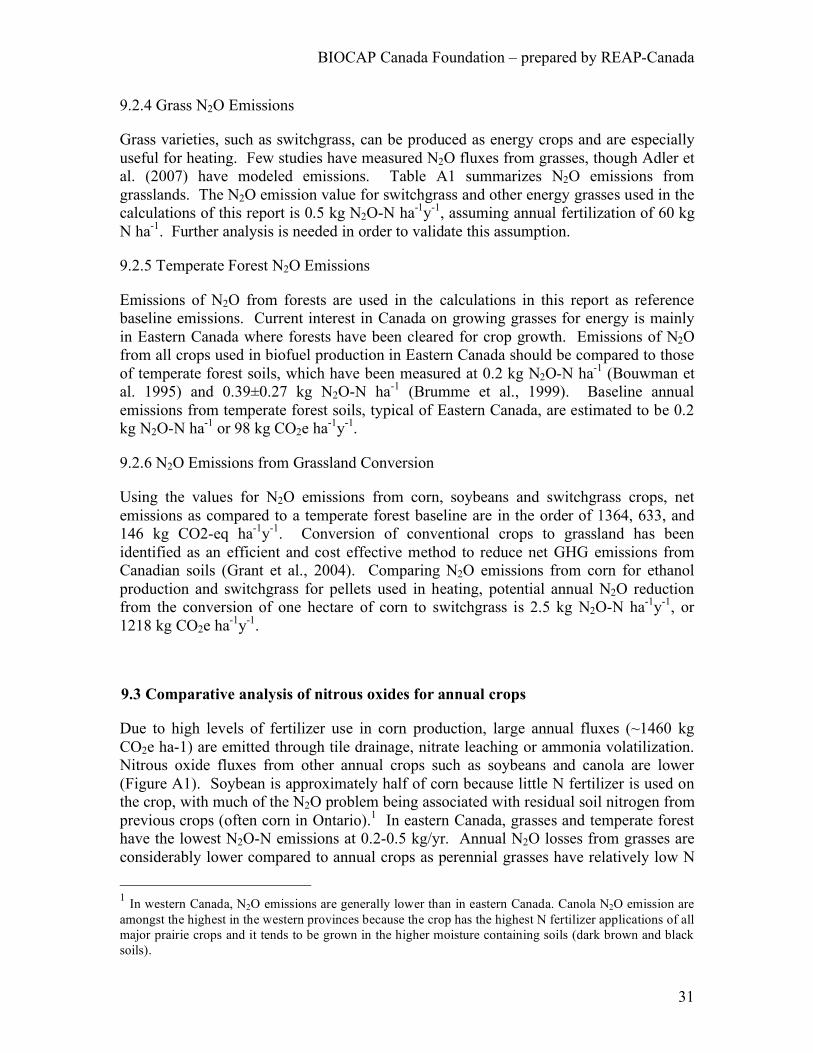
BIOCAP Canada Foundation – prepared by REAP-Canada
31
9.2.4 Grass N2O Emissions
Grass varieties, such as switchgrass, can be produced as energy crops and are especially useful for heating. Few studies have measured N2O fluxes from grasses, though Adler et al. (2007) have modeled emissions. Table A1 summarizes N2O emissions from grasslands. The N2O emission value for switchgrass and other energy grasses used in the calculations of this report is 0.5 kg N2O-N ha-1y-1, assuming annual fertilization of 60 kg N ha-1. Further analysis is needed in order to validate this assumption.
9.2.5 Temperate Forest N2O Emissions
Emissions of N2O from forests are used in the calculations in this report as reference baseline emissions. Current interest in Canada on growing grasses for energy is mainly in Eastern Canada where forests have been cleared for crop growth. Emissions of N2O from all crops used in biofuel production in Eastern Canada should be compared to those of temperate forest soils, which have been measured at 0.2 kg N2O-N ha-1 (Bouwman et al. 1995) and 0.39±0.27 kg N2O-N ha-1 (Brumme et al., 1999). Baseline annual emissions from temperate forest soils, typical of Eastern Canada, are estimated to be 0.2 kg N2O-N ha-1 or 98 kg CO2e ha-1y-1.
9.2.6 N2O Emissions from Grassland Conversion
Using the values for N2O emissions from corn, soybeans and switchgrass crops, net emissions as compared to a temperate forest baseline are in the order of 1364, 633, and 146 kg CO2-eq ha-1y-1. Conversion of conventional crops to grassland has been identified as an efficient and cost effective method to reduce net GHG emissions from Canadian soils (Grant et al., 2004). Comparing N2O emissions from corn for ethanol production and switchgrass for pellets used in heating, potential annual N2O reduction from the conversion of one hectare of corn to switchgrass is 2.5 kg N2O-N ha-1y-1, or 1218 kg CO2e ha-1y-1.
9.3 Comparative analysis of nitrous oxides for annual crops
Due to high levels of fertilizer use in corn production, large annual fluxes (~1460 kg CO2e ha-1) are emitted through tile drainage, nitrate leaching or ammonia volatilization. Nitrous oxide fluxes from other annual crops such as soybeans and canola are lower (Figure A1). Soybean is approximately half of corn because little N fertilizer is used on the crop, with much of the N2O problem being associated with residual soil nitrogen from previous crops (often corn in Ontario).1 In eastern Canada, grasses and temperate forest have the lowest N2O-N emissions at 0.2-0.5 kg/yr. Annual N2O losses from grasses are considerably lower compared to annual crops as perennial grasses have relatively low N
1 In western Canada, N2O emissions are generally lower than in eastern Canada. Canola N2O emission are amongst the highest in the western provinces because the crop has the highest N fertilizer applications of all major prairie crops and it tends to be grown in the higher moisture containing soils (dark brown and black soils).
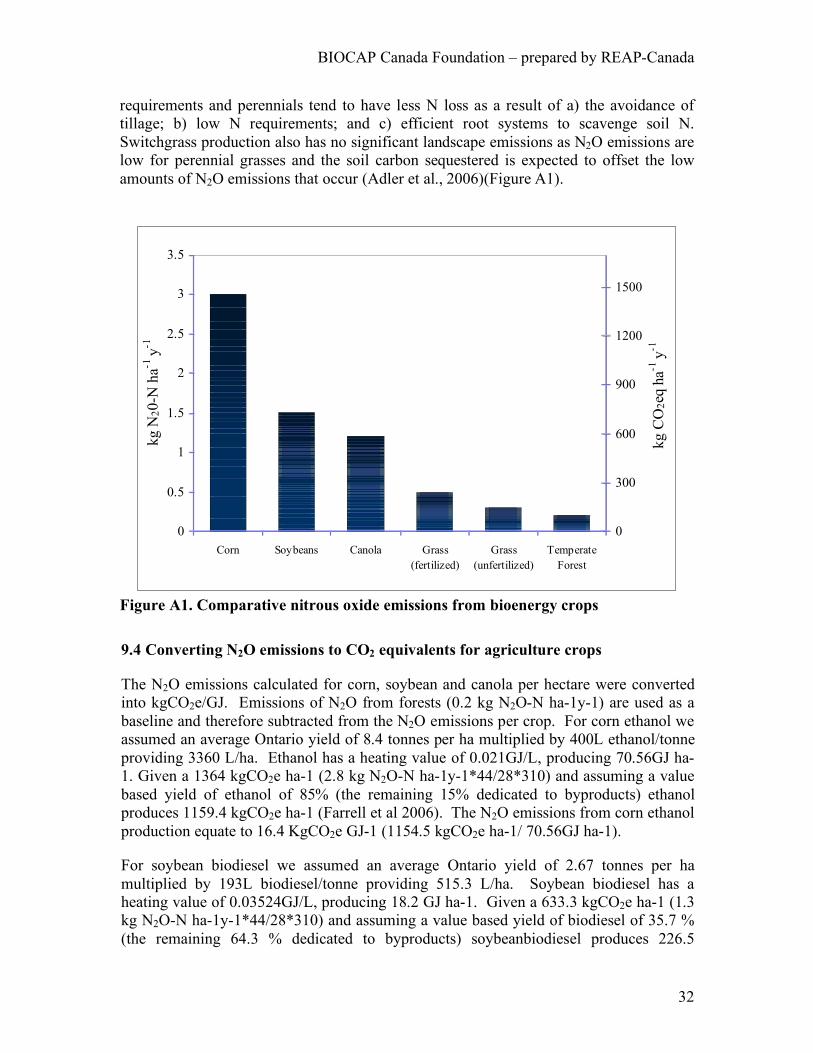
BIOCAP Canada Foundation – prepared by REAP-Canada
32
requirements and perennials tend to have less N loss as a result of a) the avoidance of tillage; b) low N requirements; and c) efficient root systems to scavenge soil N. Switchgrass production also has no significant landscape emissions as N2O emissions are low for perennial grasses and the soil carbon sequestered is expected to offset the low amounts of N2O emissions that occur (Adler et al., 2006)(Figure A1).
0
0.5
1
1.5
2
2.5
3
3.5
Corn Soybeans Canola Grass
(fertilized)
Grass
(unfertilized)
Temperate
Forest
kg N
20-N
ha-1
y-1
0
300
600
900
1200
1500
kg C
O2eq
ha-1
y-1
Figure A1. Comparative nitrous oxide emissions from bioenergy crops 9.4 Converting N2O emissions to CO2 equivalents for agriculture crops
The N2O emissions calculated for corn, soybean and canola per hectare were converted into kgCO2e/GJ. Emissions of N2O from forests (0.2 kg N2O-N ha-1y-1) are used as a baseline and therefore subtracted from the N2O emissions per crop. For corn ethanol we assumed an average Ontario yield of 8.4 tonnes per ha multiplied by 400L ethanol/tonne providing 3360 L/ha. Ethanol has a heating value of 0.021GJ/L, producing 70.56GJ ha-1. Given a 1364 kgCO2e ha-1 (2.8 kg N2O-N ha-1y-1*44/28*310) and assuming a value based yield of ethanol of 85% (the remaining 15% dedicated to byproducts) ethanol produces 1159.4 kgCO2e ha-1 (Farrell et al 2006). The N2O emissions from corn ethanol production equate to 16.4 KgCO2e GJ-1 (1154.5 kgCO2e ha-1/ 70.56GJ ha-1).
For soybean biodiesel we assumed an average Ontario yield of 2.67 tonnes per ha multiplied by 193L biodiesel/tonne providing 515.3 L/ha. Soybean biodiesel has a heating value of 0.03524GJ/L, producing 18.2 GJ ha-1. Given a 633.3 kgCO2e ha-1 (1.3 kg N2O-N ha-1y-1*44/28*310) and assuming a value based yield of biodiesel of 35.7 % (the remaining 64.3 % dedicated to byproducts) soybeanbiodiesel produces 226.5
BIOCAP Canada Foundation – prepared by REAP-Canada
33
kgCO2e ha-1. The N2O emissions from soybean biodiesel production equate to 12.45 KgCO2e GJ-1 (226.5 kgCO2e ha-1/ 18.2 GJ ha-1).
For canola biodiesel we assumed an average Ontario yield of 1.7 tonnes per ha multiplied by 435L biodiesel/tonne providing 740 L/ha. Canola biodiesel has a heating value of 0.0357 GJ/L, producing 26.4 GJ ha-1. Given a 487.14 kgCO2e ha-1 (1.0 kg N2O-N ha-1y-1*44/28*310) and assuming a value based yield of biodiesel of 69% (the remaining 31% dedicated to byproducts) canola biodiesel produces 336 kgCO2e ha-1. The N2O emissions from canola biodiesel production equate to 12.68 KgCO2e GJ-1 (336 kgCO2e ha-1/ 26.4 GJ ha-1).
Examination of current life cycle analyses for agricultural bioenergy crops revealed a lack in quantification of N2O emissions. Nitrous oxide, the third most important gas monitored under the Kyoto protocol can play a large role in the GHG balance for annual grains and oilseeds used in the production of ethanol and biodiesel. In the case of corn, soybean and canola, an additional 3.0, 1.5 and 1.2 tonnes/ha respectively of N2O-N are produced annually. This equates to 16.40, 12.45, and 12.68 kgCO2e ha GJ-1 for corn, soybean and canola. Accurate assessments of biofuels for GHG mitigation accounting must in the future include N2O emissions to capture an accurate energy balance.