Analysing Gasoline - Employing Analytical Gas Chromatography · In the upcoming analysis of super...
14
Analysing Gasoline - Employing Analytical Gas Chromatography Manual by Lucas Bäumel Julius-Maximilians-Universität Würzburg Fakultät für Chemie und Pharmazie Würzburg, 2014
Transcript of Analysing Gasoline - Employing Analytical Gas Chromatography · In the upcoming analysis of super...
Analysing Gasoline -
Employing Analytical Gas
Chromatography
Manual
by Lucas Bäumel
Julius-Maximilians-Universität Würzburg
Fakultät für Chemie und Pharmazie
Würzburg, 2014
Contents:
1. The principles of (Gas-) Chromatography ...................................................................................... 3
1.1 Instrument Overview ..................................................................................................................... 3
1.2 The Chromatographic Process....................................................................................................... 4
1.3 Retention and Retention Time ...................................................................................................... 5
1.4 Selecting a Column ........................................................................................................................ 6
2. Analysing gasoline .................................................................................................................................. 7
2.1 Gasoline and its Origin in Mineral Oils .......................................................................................... 8
2.2 Exercise .......................................................................................................................................... 9
2.3 Experimental setup and procedure ............................................................................................. 10
3. Further Questions on the Subject ................................................................................................... 13
4. Literature ................................................................................................................................................ 14
2
This paper will guide you through an experiment in which it will be your task to analyse petrol for its various components, using a gas chromatograph. It is aimed to give some practical background information about (gas-) chromatography as well as depicting the experimental work itself; but at some points it will also demand independent research in order to answer several study questions.
1. The principles of (Gas-) Chromatography Analytical chromatography in its basic form is a process in which a mixture of substances is separated into its individual components. A typical field of application of gas chromatography is the testing of the purity of a particular substance. In some situations, gas chromatography may help in identifying a compound. It is therefore often used in drug and food analysis and the associated toxicology.
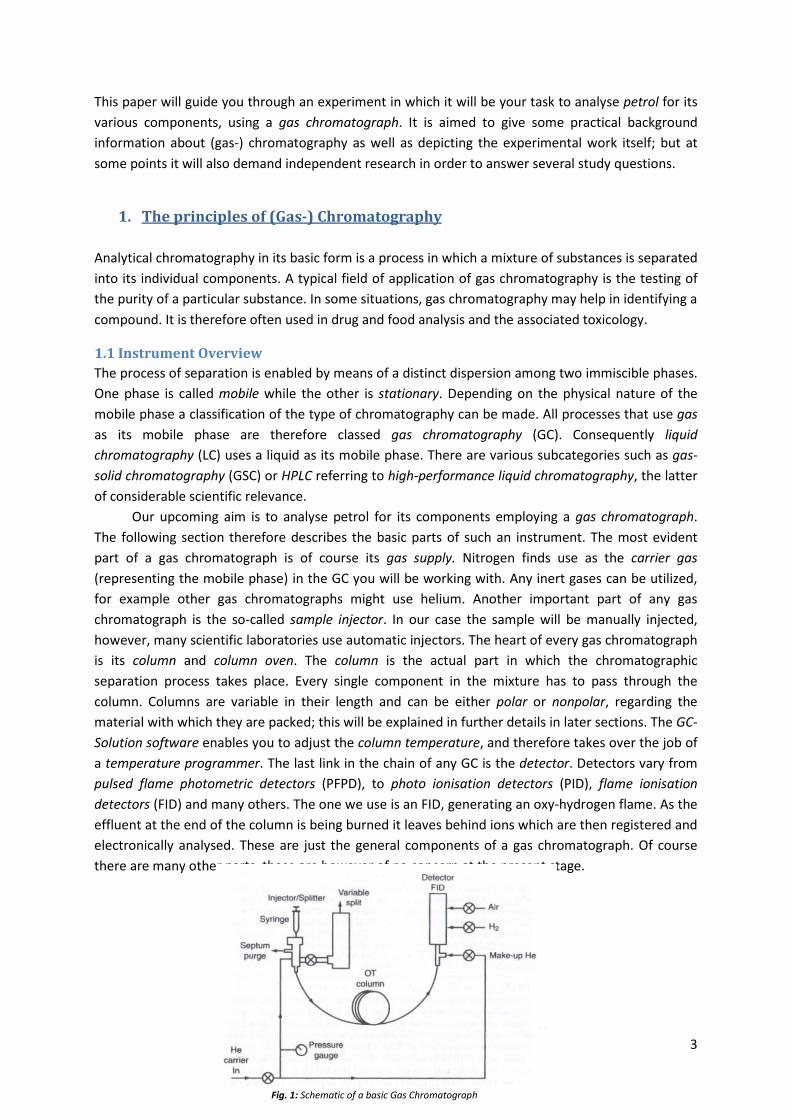
1.1 Instrument Overview The process of separation is enabled by means of a distinct dispersion among two immiscible phases. One phase is called mobile while the other is stationary. Depending on the physical nature of the mobile phase a classification of the type of chromatography can be made. All processes that use gas as its mobile phase are therefore classed gas chromatography (GC). Consequently liquid chromatography (LC) uses a liquid as its mobile phase. There are various subcategories such as gas-solid chromatography (GSC) or HPLC referring to high-performance liquid chromatography, the latter of considerable scientific relevance. Our upcoming aim is to analyse petrol for its components employing a gas chromatograph. The following section therefore describes the basic parts of such an instrument. The most evident part of a gas chromatograph is of course its gas supply. Nitrogen finds use as the carrier gas (representing the mobile phase) in the GC you will be working with. Any inert gases can be utilized, for example other gas chromatographs might use helium. Another important part of any gas chromatograph is the so-called sample injector. In our case the sample will be manually injected, however, many scientific laboratories use automatic injectors. The heart of every gas chromatograph is its column and column oven. The column is the actual part in which the chromatographic separation process takes place. Every single component in the mixture has to pass through the column. Columns are variable in their length and can be either polar or nonpolar, regarding the material with which they are packed; this will be explained in further details in later sections. The GC-Solution software enables you to adjust the column temperature, and therefore takes over the job of a temperature programmer. The last link in the chain of any GC is the detector. Detectors vary from pulsed flame photometric detectors (PFPD), to photo ionisation detectors (PID), flame ionisation detectors (FID) and many others. The one we use is an FID, generating an oxy-hydrogen flame. As the effluent at the end of the column is being burned it leaves behind ions which are then registered and electronically analysed. These are just the general components of a gas chromatograph. Of course there are many other parts, these are however of no concern at the present stage.
Fig. 1: Schematic of a basic Gas Chromatograph
3
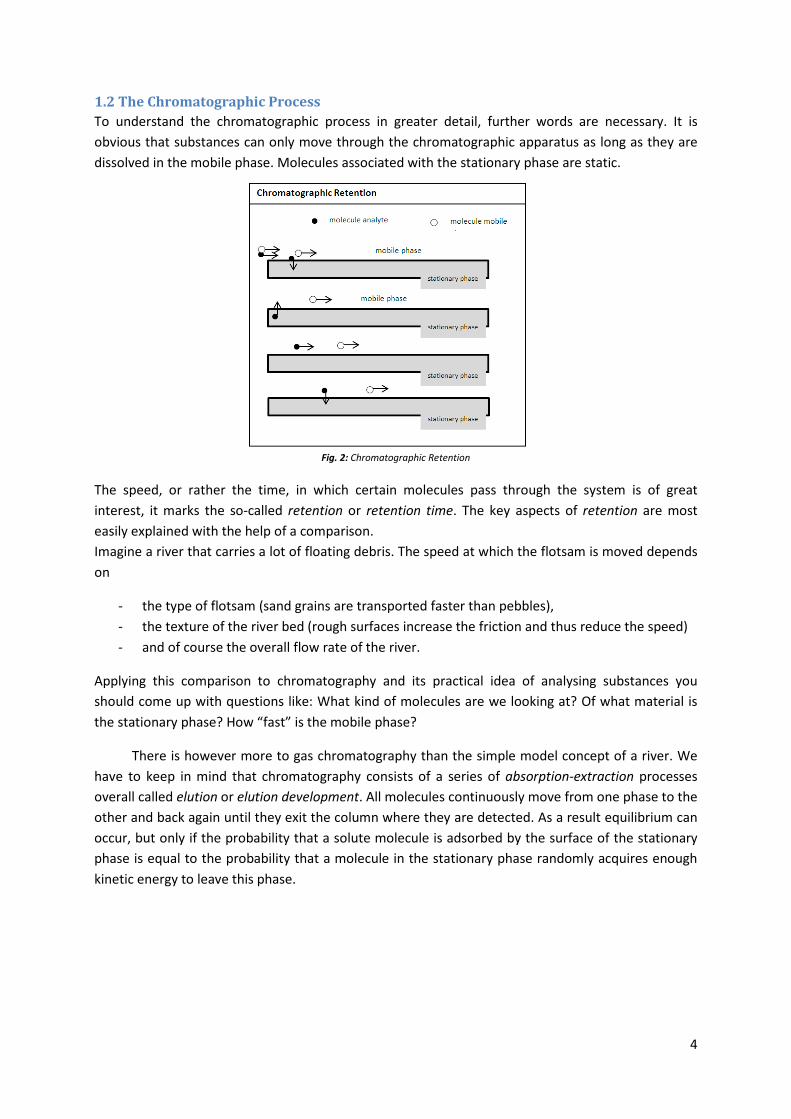
1.2 The Chromatographic Process To understand the chromatographic process in greater detail, further words are necessary. It is obvious that substances can only move through the chromatographic apparatus as long as they are dissolved in the mobile phase. Molecules associated with the stationary phase are static.
Fig. 2: Chromatographic Retention
The speed, or rather the time, in which certain molecules pass through the system is of great interest, it marks the so-called retention or retention time. The key aspects of retention are most easily explained with the help of a comparison. Imagine a river that carries a lot of floating debris. The speed at which the flotsam is moved depends on
- the type of flotsam (sand grains are transported faster than pebbles), - the texture of the river bed (rough surfaces increase the friction and thus reduce the speed) - and of course the overall flow rate of the river.
Applying this comparison to chromatography and its practical idea of analysing substances you should come up with questions like: What kind of molecules are we looking at? Of what material is the stationary phase? How “fast” is the mobile phase?
There is however more to gas chromatography than the simple model concept of a river. We have to keep in mind that chromatography consists of a series of absorption-extraction processes overall called elution or elution development. All molecules continuously move from one phase to the other and back again until they exit the column where they are detected. As a result equilibrium can occur, but only if the probability that a solute molecule is adsorbed by the surface of the stationary phase is equal to the probability that a molecule in the stationary phase randomly acquires enough kinetic energy to leave this phase.
4
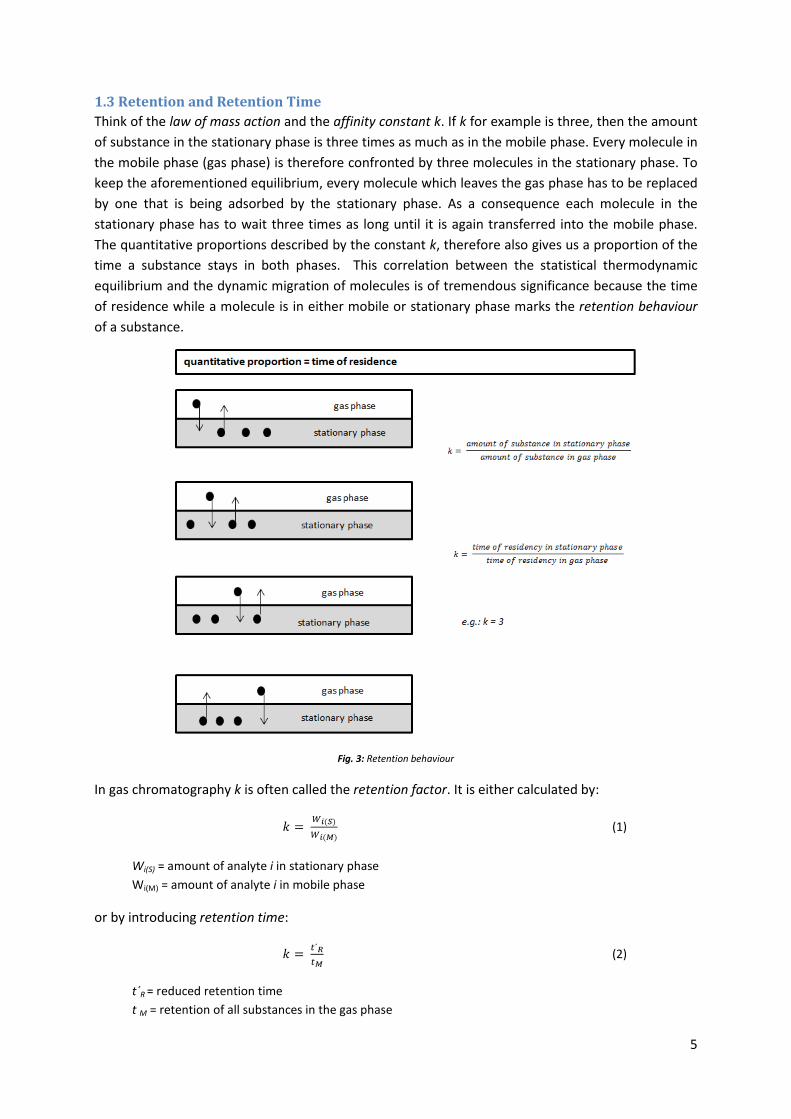
1.3 Retention and Retention Time Think of the law of mass action and the affinity constant k. If k for example is three, then the amount of substance in the stationary phase is three times as much as in the mobile phase. Every molecule in the mobile phase (gas phase) is therefore confronted by three molecules in the stationary phase. To keep the aforementioned equilibrium, every molecule which leaves the gas phase has to be replaced by one that is being adsorbed by the stationary phase. As a consequence each molecule in the stationary phase has to wait three times as long until it is again transferred into the mobile phase. The quantitative proportions described by the constant k, therefore also gives us a proportion of the time a substance stays in both phases. This correlation between the statistical thermodynamic equilibrium and the dynamic migration of molecules is of tremendous significance because the time of residence while a molecule is in either mobile or stationary phase marks the retention behaviour of a substance.
Fig. 3: Retention behaviour
In gas chromatography k is often called the retention factor. It is either calculated by:
𝑘 = 𝑊𝑖(𝑆)
𝑊𝑖(𝑀) (1)
Wi(S) = amount of analyte i in stationary phase Wi(M) = amount of analyte i in mobile phase
or by introducing retention time:
𝑘 = 𝑡´𝑅𝑡𝑀
(2)
t´R = reduced retention time t M = retention of all substances in the gas phase
5
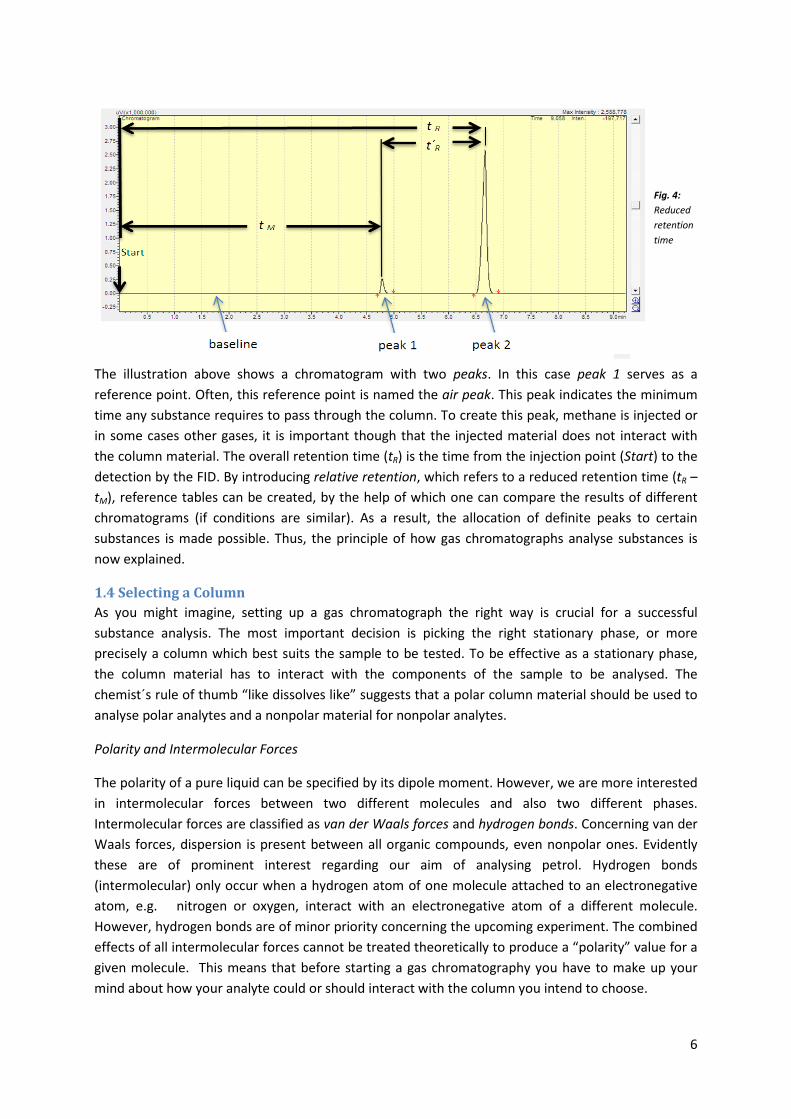
Fig. 4: Reduced retention time
The illustration above shows a chromatogram with two peaks. In this case peak 1 serves as a reference point. Often, this reference point is named the air peak. This peak indicates the minimum time any substance requires to pass through the column. To create this peak, methane is injected or in some cases other gases, it is important though that the injected material does not interact with the column material. The overall retention time (tR) is the time from the injection point (Start) to the detection by the FID. By introducing relative retention, which refers to a reduced retention time (tR – tM), reference tables can be created, by the help of which one can compare the results of different chromatograms (if conditions are similar). As a result, the allocation of definite peaks to certain substances is made possible. Thus, the principle of how gas chromatographs analyse substances is now explained.
1.4 Selecting a Column As you might imagine, setting up a gas chromatograph the right way is crucial for a successful substance analysis. The most important decision is picking the right stationary phase, or more precisely a column which best suits the sample to be tested. To be effective as a stationary phase, the column material has to interact with the components of the sample to be analysed. The chemist´s rule of thumb “like dissolves like” suggests that a polar column material should be used to analyse polar analytes and a nonpolar material for nonpolar analytes.
Polarity and Intermolecular Forces
The polarity of a pure liquid can be specified by its dipole moment. However, we are more interested in intermolecular forces between two different molecules and also two different phases. Intermolecular forces are classified as van der Waals forces and hydrogen bonds. Concerning van der Waals forces, dispersion is present between all organic compounds, even nonpolar ones. Evidently these are of prominent interest regarding our aim of analysing petrol. Hydrogen bonds (intermolecular) only occur when a hydrogen atom of one molecule attached to an electronegative atom, e.g. nitrogen or oxygen, interact with an electronegative atom of a different molecule. However, hydrogen bonds are of minor priority concerning the upcoming experiment. The combined effects of all intermolecular forces cannot be treated theoretically to produce a “polarity” value for a given molecule. This means that before starting a gas chromatography you have to make up your mind about how your analyte could or should interact with the column you intend to choose.
6
Finally the so called separation factor α is also of interest when contemplating intermolecular forces because it is a parameter which contrasts the relative distribution constants. For two adjacent peaks, the separation factor is defined as:
α = 𝑡´𝑅(𝑝𝑒𝑎𝑘2)
𝑡´𝑅(𝑝𝑒𝑎𝑘1)
t´R(peak1)= reduced retention time of peak 1; t´R(peak2)= reduced retention time of peak 2
As such, it represents the relative interaction between each of the solutes and the stationary phase and can be used to express the relative intermolecular forces and the magnitude of their similarity or difference.
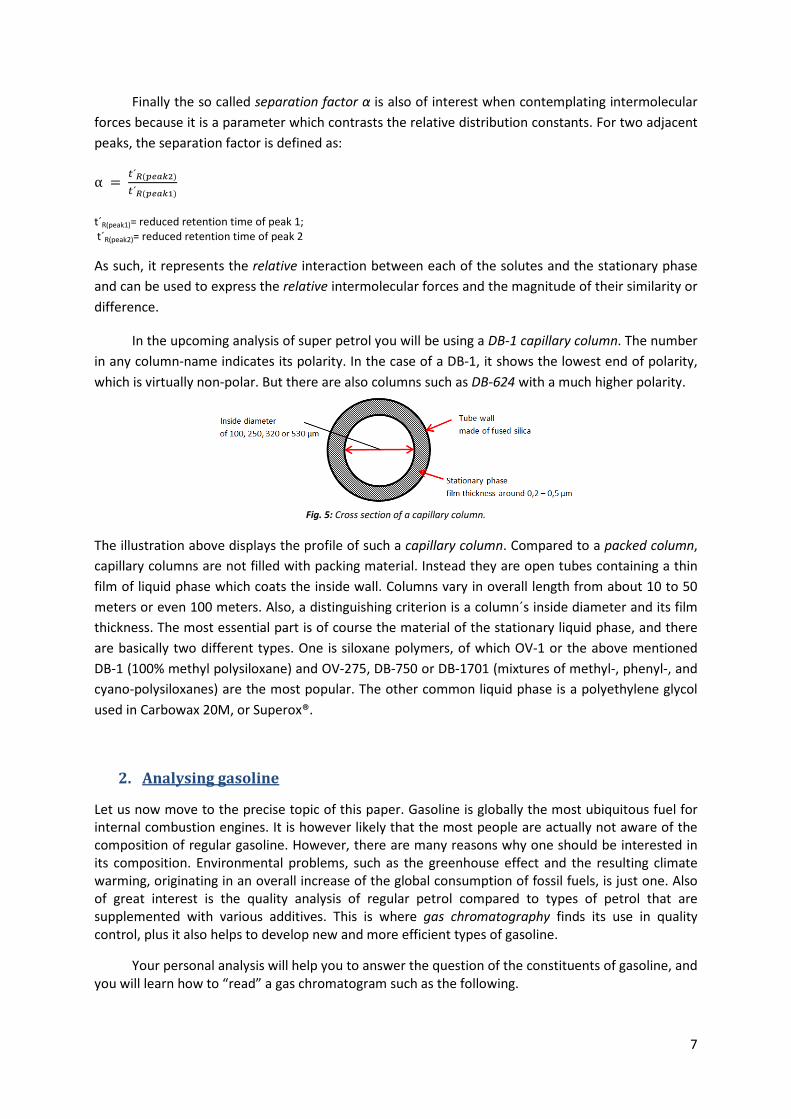
In the upcoming analysis of super petrol you will be using a DB-1 capillary column. The number in any column-name indicates its polarity. In the case of a DB-1, it shows the lowest end of polarity, which is virtually non-polar. But there are also columns such as DB-624 with a much higher polarity.
Fig. 5: Cross section of a capillary column.
The illustration above displays the profile of such a capillary column. Compared to a packed column, capillary columns are not filled with packing material. Instead they are open tubes containing a thin film of liquid phase which coats the inside wall. Columns vary in overall length from about 10 to 50 meters or even 100 meters. Also, a distinguishing criterion is a column´s inside diameter and its film thickness. The most essential part is of course the material of the stationary liquid phase, and there are basically two different types. One is siloxane polymers, of which OV-1 or the above mentioned DB-1 (100% methyl polysiloxane) and OV-275, DB-750 or DB-1701 (mixtures of methyl-, phenyl-, and cyano-polysiloxanes) are the most popular. The other common liquid phase is a polyethylene glycol used in Carbowax 20M, or Superox®.
2. Analysing gasoline
Let us now move to the precise topic of this paper. Gasoline is globally the most ubiquitous fuel for internal combustion engines. It is however likely that the most people are actually not aware of the composition of regular gasoline. However, there are many reasons why one should be interested in its composition. Environmental problems, such as the greenhouse effect and the resulting climate warming, originating in an overall increase of the global consumption of fossil fuels, is just one. Also of great interest is the quality analysis of regular petrol compared to types of petrol that are supplemented with various additives. This is where gas chromatography finds its use in quality control, plus it also helps to develop new and more efficient types of gasoline.
Your personal analysis will help you to answer the question of the constituents of gasoline, and you will learn how to “read” a gas chromatogram such as the following.
7
But before having a closer look at the clutter of peaks given above, there is a short comment concerning the basic chemistry of mineral oils.
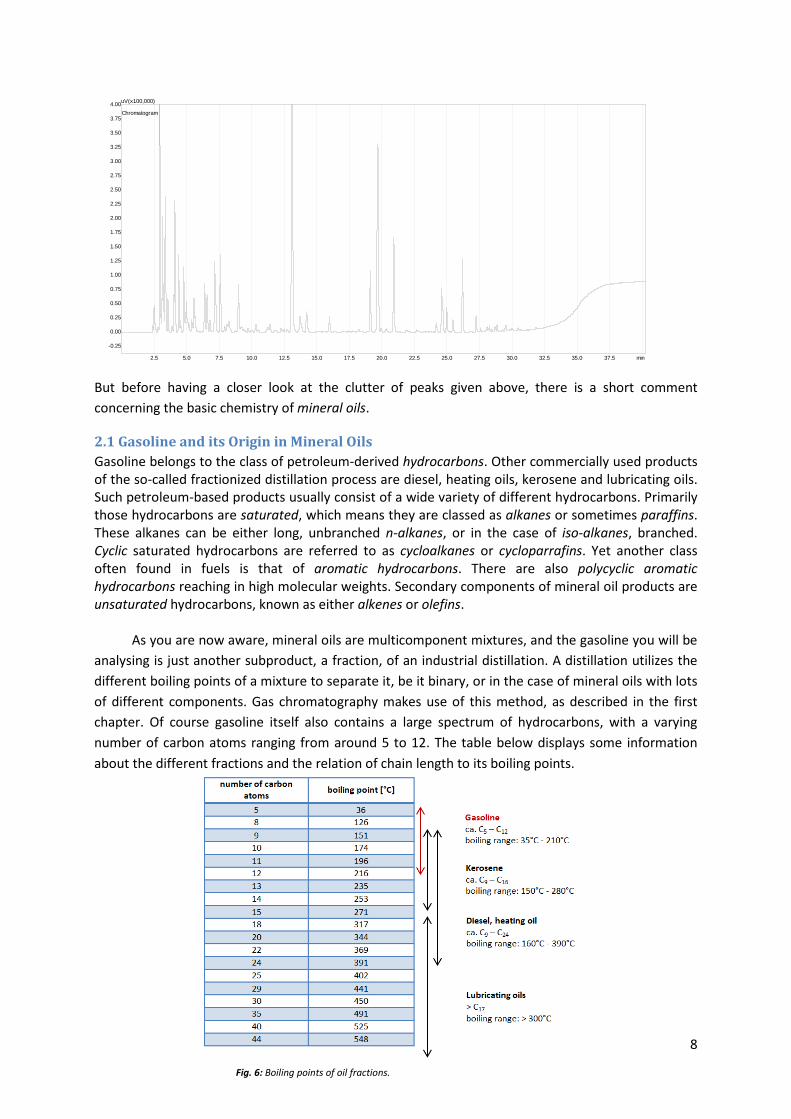
2.1 Gasoline and its Origin in Mineral Oils Gasoline belongs to the class of petroleum-derived hydrocarbons. Other commercially used products of the so-called fractionized distillation process are diesel, heating oils, kerosene and lubricating oils. Such petroleum-based products usually consist of a wide variety of different hydrocarbons. Primarily those hydrocarbons are saturated, which means they are classed as alkanes or sometimes paraffins. These alkanes can be either long, unbranched n-alkanes, or in the case of iso-alkanes, branched. Cyclic saturated hydrocarbons are referred to as cycloalkanes or cycloparrafins. Yet another class often found in fuels is that of aromatic hydrocarbons. There are also polycyclic aromatic hydrocarbons reaching in high molecular weights. Secondary components of mineral oil products are unsaturated hydrocarbons, known as either alkenes or olefins. As you are now aware, mineral oils are multicomponent mixtures, and the gasoline you will be analysing is just another subproduct, a fraction, of an industrial distillation. A distillation utilizes the different boiling points of a mixture to separate it, be it binary, or in the case of mineral oils with lots of different components. Gas chromatography makes use of this method, as described in the first chapter. Of course gasoline itself also contains a large spectrum of hydrocarbons, with a varying number of carbon atoms ranging from around 5 to 12. The table below displays some information about the different fractions and the relation of chain length to its boiling points.
Fig. 6: Boiling points of oil fractions.
8
2.5 5.0 7.5 10.0 12.5 15.0 17.5 20.0 22.5 25.0 27.5 30.0 32.5 35.0 37.5 min
-0.25
0.00
0.25
0.50
0.75
1.00
1.25
1.50
1.75
2.00
2.25
2.50
2.75
3.00
3.25
3.50
3.75
4.00uV(x100,000)
Chromatogram
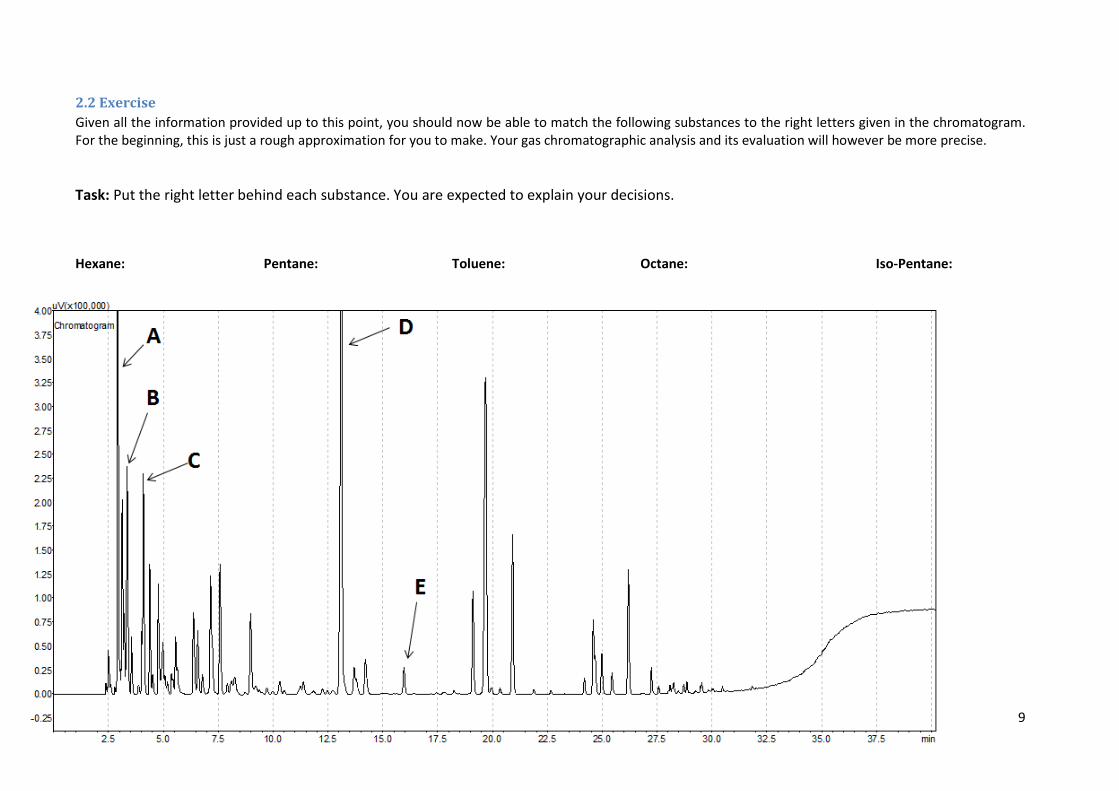
2.2 Exercise Given all the information provided up to this point, you should now be able to match the following substances to the right letters given in the chromatogram. For the beginning, this is just a rough approximation for you to make. Your gas chromatographic analysis and its evaluation will however be more precise.
Task: Put the right letter behind each substance. You are expected to explain your decisions.
Hexane: Pentane: Toluene: Octane: Iso-Pentane:
9
2.3 Experimental setup and procedure Finally, theory is now put into practice. In the following you will find a step-by-step guideline for the analysis of gasoline employing gas chromatography.
A. Task description
Record a chromatogram of the provided gasoline probes. To ensure your results are correct, the whole procedure has to be repeated three times and then checked for reproducibility.
B. Process
Sampling the probes correctly is vital to any analysis. Fill three sample vials, each with around 1.5 mL of substance. Think about a useful labelling system; it should involve the date, an abbreviation of your name and the sample ID.
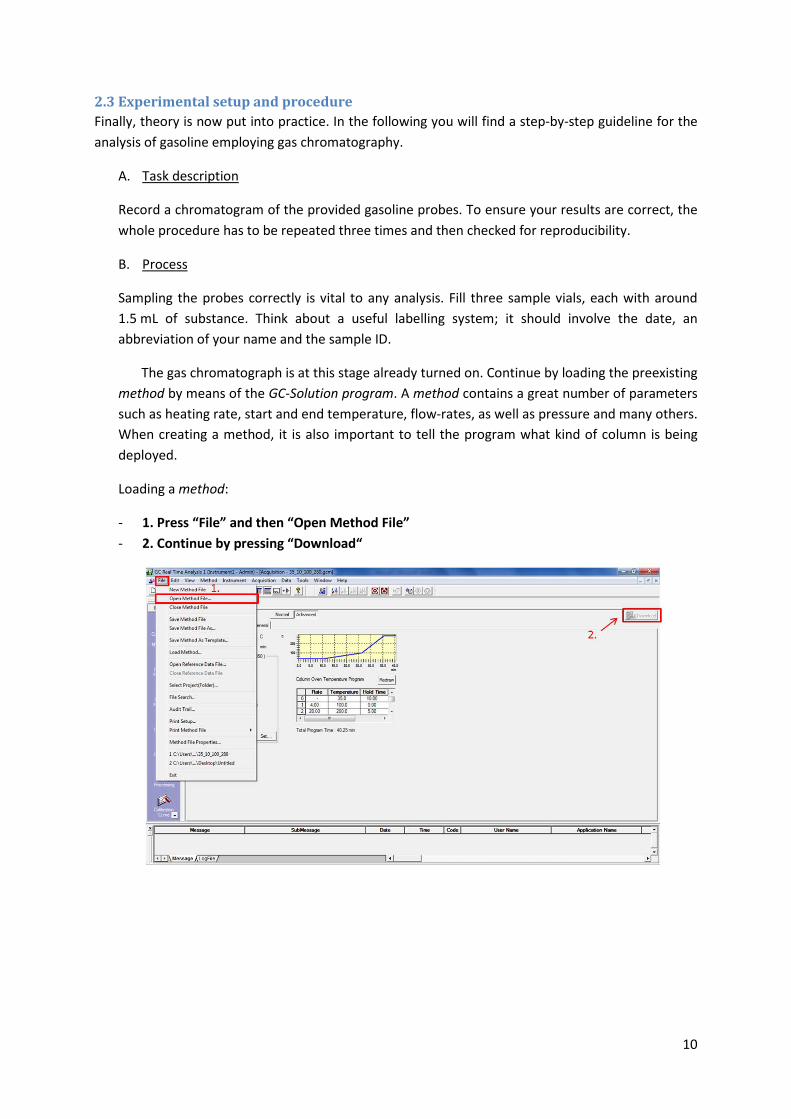
The gas chromatograph is at this stage already turned on. Continue by loading the preexisting method by means of the GC-Solution program. A method contains a great number of parameters such as heating rate, start and end temperature, flow-rates, as well as pressure and many others. When creating a method, it is also important to tell the program what kind of column is being deployed.
Loading a method:
- 1. Press “File” and then “Open Method File” - 2. Continue by pressing “Download“
10
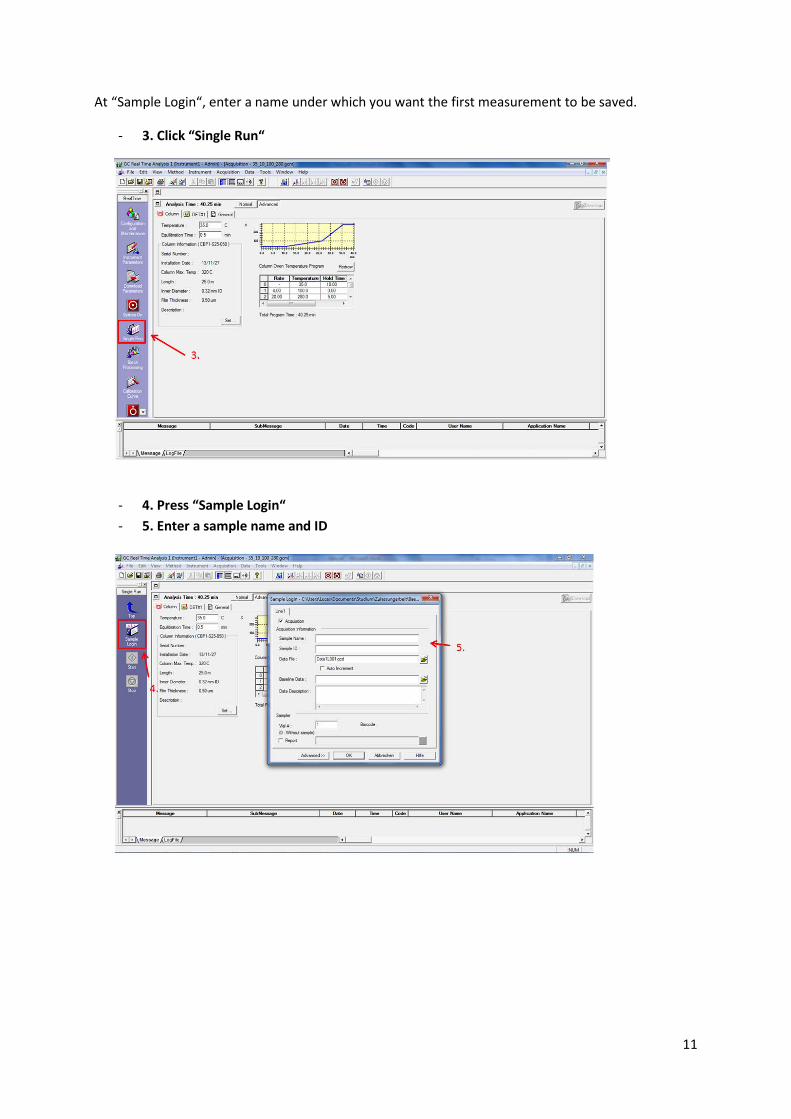
At “Sample Login“, enter a name under which you want the first measurement to be saved.
- 3. Click “Single Run“
- 4. Press “Sample Login“ - 5. Enter a sample name and ID
11
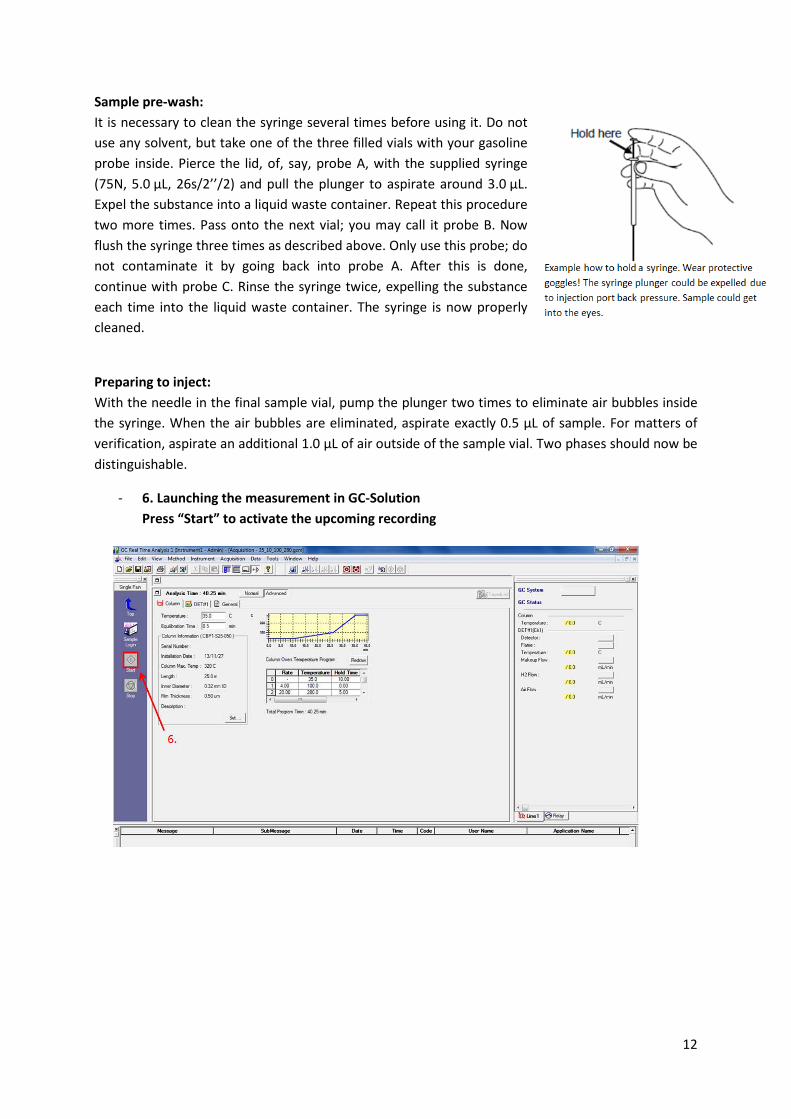
Sample pre-wash: It is necessary to clean the syringe several times before using it. Do not use any solvent, but take one of the three filled vials with your gasoline probe inside. Pierce the lid, of, say, probe A, with the supplied syringe (75N, 5.0 µL, 26s/2’’/2) and pull the plunger to aspirate around 3.0 µL. Expel the substance into a liquid waste container. Repeat this procedure two more times. Pass onto the next vial; you may call it probe B. Now flush the syringe three times as described above. Only use this probe; do not contaminate it by going back into probe A. After this is done, continue with probe C. Rinse the syringe twice, expelling the substance each time into the liquid waste container. The syringe is now properly cleaned.
Preparing to inject: With the needle in the final sample vial, pump the plunger two times to eliminate air bubbles inside the syringe. When the air bubbles are eliminated, aspirate exactly 0.5 µL of sample. For matters of verification, aspirate an additional 1.0 µL of air outside of the sample vial. Two phases should now be distinguishable.
- 6. Launching the measurement in GC-Solution Press “Start” to activate the upcoming recording
12
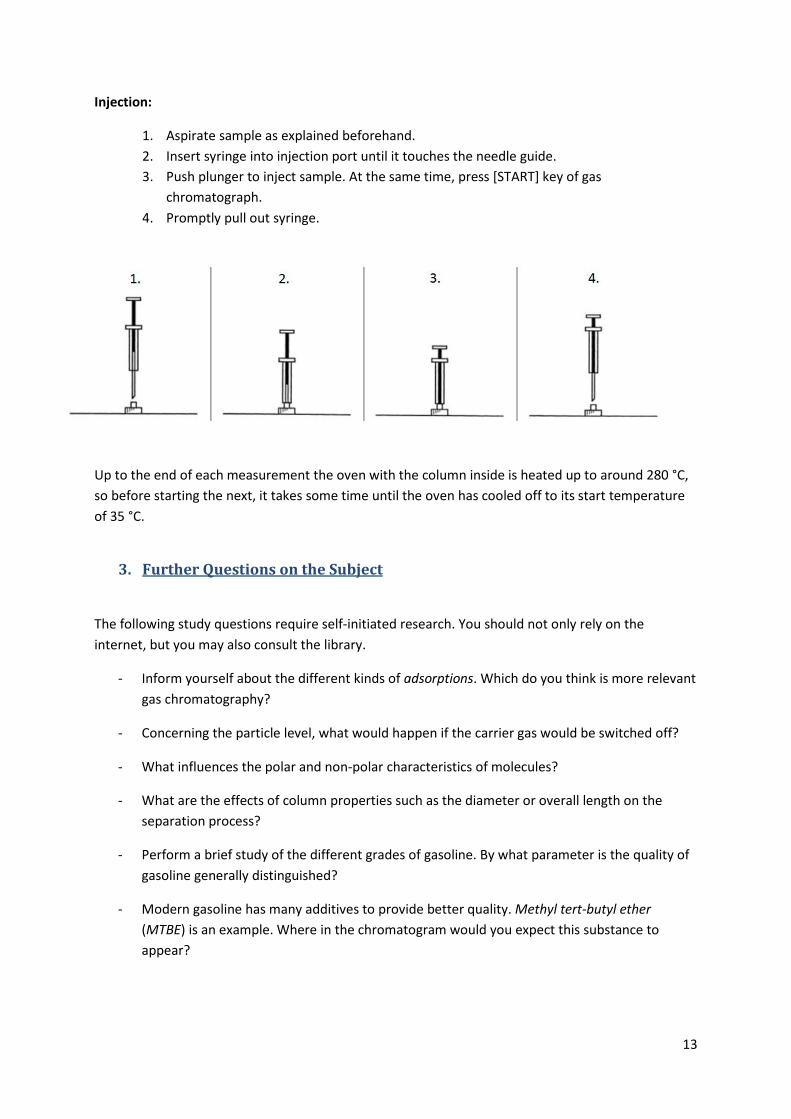
Injection:
1. Aspirate sample as explained beforehand. 2. Insert syringe into injection port until it touches the needle guide. 3. Push plunger to inject sample. At the same time, press [START] key of gas
chromatograph. 4. Promptly pull out syringe.
Up to the end of each measurement the oven with the column inside is heated up to around 280 °C, so before starting the next, it takes some time until the oven has cooled off to its start temperature of 35 °C.
3. Further Questions on the Subject
The following study questions require self-initiated research. You should not only rely on the internet, but you may also consult the library.
- Inform yourself about the different kinds of adsorptions. Which do you think is more relevant gas chromatography?
- Concerning the particle level, what would happen if the carrier gas would be switched off?
- What influences the polar and non-polar characteristics of molecules?
- What are the effects of column properties such as the diameter or overall length on the separation process?
- Perform a brief study of the different grades of gasoline. By what parameter is the quality of gasoline generally distinguished?
- Modern gasoline has many additives to provide better quality. Methyl tert-butyl ether (MTBE) is an example. Where in the chromatogram would you expect this substance to appear?
13
All experiments were performed on Shimadzu GC 2014 gas chromatograph with Agilent DB-1 column (length 30 m, diameter 0.250 mm, film 0.50 µm). Chromatograms were analysed with the Labsolution software 2.3.2.
Literature
B. Kolb, Gaschromatographie in Bildern - Eine Einführung, VCH, Weinheim, 2008.
H. M. McNair, J. M. Miller, Basic Gas Chromatography, Wiley, New York, 1998.
R. P. W. Scott, Introduction to Analytical Gas Chromatography, Marcel Dekker INC., New York, 1998.
14