Analog oscilloscopes, Electronic Measurements Lab -...
10
Electronic Measurements Lab
Transcript of Analog oscilloscopes, Electronic Measurements Lab -...

ANALOG OSCILLOSCOPES
Electronic Measurements Lab
Massimo Ortolano
Giovanni Antonio Costanzo
Federica Cappelluti
POLITECNICO DI TORINO

© 2012 Massimo Ortolano, Giovanni Antonio Costanzo, Federica CappellutiDipartimento di Elettronica e Telecomunicazioni (DET)Politecnico di TorinoCorso Duca degli Abruzzi, 2410129 TorinoItalyEmail:[email protected]
This work is licensed under the Creative Commons Attribution-NonCommercial-ShareAlike 3.0 Un-ported License. To view a copy of this license, visit http://creativecommons.org/licenses/by-nc-sa/3.0/ or send a letter to Creative Commons, 444 Castro Street, Suite 900, Mountain View,California, 94041, USA.
16 15 14 13 12 11 10 09 08 07 8 7
First edition: March 2012
1 Introduction
The objective of this lab is to practice using analog oscilloscopes. You will need the following labor-atory equipment (check http://led.polito.it/main_en/instrumentation.asp for specifica-tions and user’s manuals):
• Bench DC power supply• Signal generator board (LED product)• Bench signal generator• Analog oscilloscope• Breadboard
You will also need the following cables and adaptors:
• 1 banana plug to banana plug cable (figure 1 on the following page)• 1 three-wire power cable (figure 2)• 2 bnc male to bnc male cables (figures 3 and 4)• 1 crocodile clips to bnc male cable (figure 5)• 1 oscilloscope probe (figure 6)
Note: In the following, instrument settings and options will be written in sans-serif typeface, e.g.CH1, GND, #4 etc.
2 Getting started
2.1 A quick tour of the oscilloscope
Power up the oscilloscope: after some diagnostic messages, the oscilloscope’s display should showone or two horizontal lines. Take a look at the oscilloscope’s front panel (do not connect any signal):knobs and buttons are divided in four main functional areas: Trace and read-out, Vertical, Hori-zontal, and Trigger.
Trace and read-out This first section is at the right of the POWER (red) button. A first knob (INTENS)adjusts the trace intensity on the cathode-ray tube display, while a second one (FOCUS) ad-justs the trace focus. These controls must be adjusted to obtain a clear trace, thin and withouthalo (about 0.5mm thick). Below the FOCUS knob, there is a trimming potentiometer (TR)which adjusts the trace rotation and can be used, when necessary, to align the trace to theoscilloscope graticule. The oscilloscope screen is divided in 8 divisions along the vertical axis(Y axis) and 10 divisions along the horizontal axis (X axis).
Vertical In this area you will find the vertical controls, one set of controls for each vertical channel.In fact, this dual oscilloscope has two input channels (CH1 and CH2) that can be connected tothe signal generator output by means of BNC-terminated cables. Turn on both channels. The
2

Figure 1: A banana plug(source: SKS kontakttech-nik GmbH).
Figure 2: Three-wire power cable for the signal gener-ator board.
Figure 3: A bnc male con-nector (source: Digikey).
Figure 4: A bnc male to bncmale cable (source: Thor-labs).
Figure 5: A crocodile(alligator in the US) clip(source: Digikey).
Figure 6: An oscilloscopeprobe (source: Digikey).
Figure 7: Oscilloscopeprobe body.
3

biggest knob (VOLTS/DIV) can be used to change the vertical scale: what are the minimumand maximum values (expressed in V/div) of the vertical scale (look at the front-panel or atthe read-out)? Try the vertical position knob (Y-POS): what happens to the correspondingtrace?Input coupling can be set to DC or AC by pressing the AC/DC button close to the BNC input.Setting the input coupling to AC removes the direct current component (DC) of the inputsignal. Moreover, by pressing and holding the AC/DC, the oscilloscope read-out takes intoaccount the attenuation (a factor of 10) introduced by an oscilloscope probe. In this mode,the read-out of the vertical scale value is multiplied by 10, whether or not a probe is actuallyconnected (check).A channel input can be connected to ground (0V) by pressing the GD button, which is loc-ated close to the corresponding input connector. Press the GD button and centre both tracesvertically on the screen by using the Y-POS knobs. The above operation can be used todefine the 0V reference position for absolute voltage measurements. Rotate the X-POS knobto centre the traces horizontally.
Horizontal In this area you will find the horizontal (time-base) controls. The biggest knob (TIME/DIV)can be used to change the horizontal scale: what are the minimum and maximum values(expressed in s/div) of the horizontal scale (look at the front-panel or at the read-out)? Theread-out shows the horizontal scale (e.g. A:2ms corresponds to 2ms/div).
Trigger In this area you will find the trigger controls, which allow you to set the trigger operatingmode and level (more in 3.2). The trigger section contains four controls:
• SLOPE button;• NM/AT (NORMAL/AUTO) button (same as SLOPE, but you have to press and hold
the button);• LEVEL knob;
• NH TRIG.MODE buttons
Set the trigger mode to AUTO (the green led indicating the NORMAL mode must be off).
2.2 Powering the signal generator board
The signal generator board requires a 12 V dual symmetrical power supply. Therefore:
1 Turn on the DC power supply. Adjust the output voltage of the two main power outputs to12V. Warning: Adjust the output voltage of the laboratory power supply before making anyconnection to the signal generator board.
2 Turn off the DC power supply. Using the banana plug to banana plug cable, connect the twomain power outputs in series: thus, the common point between the two main power outputsbecomes the common ground (common, 0V) of a dual power supply.
3 Using the three-wire power cable, connect the signal generator board to the power supply:red, 12V; black, −12V; and green, 0V. Warning: Do not connect the green cable to the powersupply’s earth ground! The green cable must be connected to the common point between thetwo main power outputs (fig. 8 on the next page).
4 Turn on the power supply: you should read 0 on the board display. Press the UP and DOWNkeys: the displayed digit should change.
4

0 30 0 30
++− −
Figure 8: Powering the signal generator board: at the end of 2.2, the power-supply set-upshould look like the above.
3 Oscilloscope’s settings
3.1 Traces
1 Turn on the CH1 trace and turn off CH2.2 Set the trigger mode to auto, the trigger source to CH1 and the trigger coupling to ac. Set the
trigger level around 0V.3 Set CH1 input coupling to ac. Centre the trace vertically on the screen.4 Using a bnc male to bnc male cable, connect CH1 input to output A of the signal generator
board. Then, select the signal #0.5 Set vertical scale for CH1 in order to expand the trace as much as possible within the display
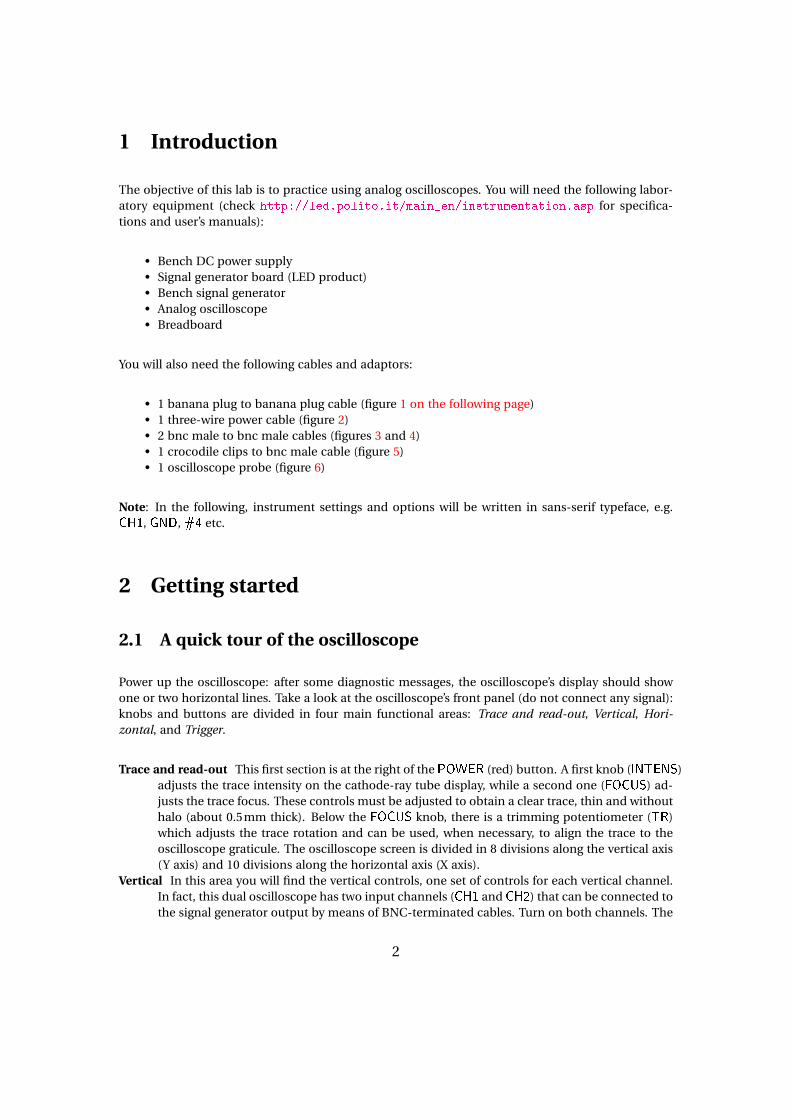
limits (the trace should occupy most of the vertical scale).6 Set the horizontal scale in order to expand a waveform period as much as possible within the
display limits (a single period should occupy most of the horizontal scale).
3.2 Trigger
1 Turn on the CH1 trace and turn off CH2.2 Set the trigger mode to AT, the trigger source to CH1 and the trigger coupling to DC. Set the
trigger level around 0V.3 Set CH1 input coupling to DC. Centre the trace vertically on the screen.4 Using a bnc male to bnc male cable, connect CH1 input to output A of the signal generator
board. Then, select the signal #4.5 Set CH1 vertical scale in order to expand the trace as much as possible within the display
5
limits (the trace should occupy most of the vertical scale).6 Set the horizontal scale in order to expand a waveform period as much as possible within the
display limits (a single period should occupy most of the horizontal scale).7 What happens if you change the trigger level?8 Change the trigger slope: what happens?9 Change the trigger source to CH2: what happens?
10 Change the trigger mode to NM: what happens?
3.3 Alt/Chop
In the alternate mode of operation, the two input signals are traced alternatively on the oscilloscopescreen, which is swept twice by the electron beam: first, the oscilloscope draws the signal from CH1;then, it draws the signal from CH2. Actually, because of phosphor persistence and because the hu-man eye is unable to follow high speed motions, at high horizontal sweeping speeds (i.e. lower than2ms/div), tracing may appear to be simultaneous. On the contrary, when the horizontal sweepingspeed is low (i.e. 200ms/div or less), alternate tracing becomes noticeable. In fact, at an horizontalsweeping speed of 200ms/div, it takes 2s to draw one signal completely (10div×200ms/div = 2s):since phosphors persistence is limited to a few tens of ms, alternate tracing becomes apparent.
In order to overcome this issue, it is possible to switch to the CHOP mode: the electronic beam isswitched between the two channels at a fixed frequency of a few hundreds kilohertz, so that eachchannel is drawn for a short period of time, e.g. CH1 for 10µs and CH2 for the next 10µs. The os-cilloscope automatically selects CHOP or ALT mode, depending on the horizontal scale, in order tooptimise the signal displaying.
To highlight the differences between ALT and CHOP modes:
1 Connect the two input channels to outputs A and B of the signal generator board, selectingsignal #1.
2 Set the horizontal scale to 10ms/div.3 Note that in ALT mode, the two images are drawn consecutively (each one is drawn after the
completion of the other one).4 Press the CHP button: what do you see now?
4 Basic measurements
4.1 Amplitude measurements
1 Set the oscilloscope as in 3.1.2 Measure the peak-to-peak signal amplitude (use the cursors, too).3 Determine the uncertainty of the amplitude measurement (check the oscilloscope’s specific-
ations).
6
4.2 Period and frequency measurements
1 Set the oscilloscope as in 3.1.2 Measure the period T of the signal (use the cursors, too).3 Determine the uncertainty of the period measurement (check the oscilloscope’s specifica-
tions).4 Determine the frequency f = 1/T .5 Determine the uncertainty of the above determined frequency.
4.3 Phase measurements I
1 Turn on both CH1 and CH2.2 Set the trigger mode to auto, the trigger source to CH1 and the trigger coupling to ac. Set the
trigger level around 0V.3 Set the input coupling of both channels to ac. Centre both traces vertically on the screen (be
precise, otherwise you will get a measurement error).4 Using two bnc male to bnc male cables, connect CH1 and CH2 inputs to, respectively, outputsA and B of the signal generator board. Then, select the signal #0.
5 Set the vertical scales of both channels in order to expand the traces as much as possiblewithin the display limits.
6 Set the horizontal scale in order to expand a waveform period as much as possible within thedisplay limits.
7 Determine the phase shift between the two signals (use cursors).8 Determine the uncertainty on the phase shift.
4.4 Phase measurements II (XY mode)
Under the XY mode, the x(t ) signal, connected to CH2 input, drives the horizontal deflection of thelight beam. In this way, the value of y(t ), connected to CH1 input, is represented as a function ofx(t ).
1 Connect the oscilloscope to the signal generator board as in the previous section.2 Press and hold the DUAL button to set the oscilloscope in XY mode: you should see an ellipse,
whose parametric equation can be written as
x(t ) =Vx,p sin(ωt ),
y(t ) =Vy,p sin(ωt +ϕ),(1)
where Vx,p and Vy,p are the peak amplitudes of signals A and B, respectively, while ω= 2π/Tand f = 1/T .In order to centre the ellipse in the cartesian axes origin, you can press the GD buttons asso-ciated to CH1 and CH2; then, by using the Y-POS.I and X-POS knobs, move the point to theaxes origin.
3 From (1) Determine the phase shift between the two signals.4 Is this last measurement compatible with that of the previous section?
7

5 Pulse wave measurements
5.1 Period
1 Turn on the CH1 trace and turn off CH2.2 Set the trigger mode to auto, the trigger source to CH1 and the trigger coupling to dc. Set the
trigger level around 0V.3 Set CH1 input coupling to dc. Centre the trace vertically on the screen.4 Using a bnc male to bnc male cable, connect CH1 input to output B of the signal generator
board. Then, select the signal #4.5 Set CH1 vertical scale in order to expand the trace as much as possible within the display
limits (the trace should occupy most of the vertical scale).6 Set the horizontal scale in order to expand a waveform period as much as possible within
the display limits (a single period should occupy most of the horizontal scale; change thehorizontal position for best results).
7 Measure the signal period T (use the cursors, too).8 Determine the uncertainty of T .
5.2 Pulse width
1 Set the oscilloscope as in 5.1.2 Set the horizontal scale to expand the pulse as much as possible within the display limits. If
necessary, change the horizontal position too.3 Measure the pulse width tw (use the cursors, too).4 Determine the uncertainty of tw.
5.3 Duty cycle
1 From the results of 5.1 and 5.2, determine the duty cycle D = tw/T .2 Determine the uncertainty of D .3 The duty cycle can also be measured with the following method. Set the oscilloscope as in 5.1
and determine D as the ratio of the pulse divisions to the period divisions. Determine theuncertainty of D in this second measurement. Are the two measurements compatible?
5.4 Rise and fall times
1 Set the oscilloscope as in 5.1.2 Set the horizontal scale to expand the pulse rising edge as much as possible within the display
limits.3 Measure the pulse rise time.
8

4 Set the horizontal scale to expand the pulse falling edge as much as possible within the dis-play limits. If necessary, change the horizontal position too.
5 Measure the pulse falling time.
6 Probe
The aim of this section is to show how cable capacitance can affect oscilloscope bandwidth. Theoutput resistance of the generator will be artificially increased to 1kΩ for a more easily observableeffect.
1 Set the bench signal generator for a 1kHz, 1V square wave output.2 Using a bnc male to bnc male cable, connect the signal generator output to one of the two
bnc connectors on the breadboard.3 Connect a 1kΩ resistor in series to the output signal (leave one terminal of the resistor un-
connected).4 Using the bnc male to crocodile clips cable, connect CH1 input to the output signal: tie the
red crocodile clip to the unconnected end of the resistor; connect the black clip to the bncouter conductor (use a wire).
5 Measure the signal rise time.6 Disconnect the bnc male to crocodile clips cable (at both ends) and connect the oscilloscope
using the 10× probe.7 Measure again the signal rise time.8 Comment on the results just obtained.
9