
Analog and Digital Systems of Imaging in Roentgenodiagnosticscdn.intechweb.org/pdfs/23733.pdf ·...
23
8 Analog and Digital Systems of Imaging in Roentgenodiagnostics Dominika Oborska-Kumaszyńska 1 General Radiology, Interventional Radiology and Neuroradiology, University Hospital, Wroclaw, 2 Wolverhampton Royal Hospitals, New Cross Hospital, Medical Physics and Clinical Enngineering Department, Wolverhampton, 1 Poland 2 United Kingdom 1. Introduction In contemporary radiology, the carrier of the diagnostic information is the image, obtained as a result of an X-ray beam transmitted through the patient’s body, with modulation of intensity of X-ry beam and processing of data collected by the image detectors. Depending on the diagnostic method used for image acquisition, signals can be detected with analog (x-ray film) or digital systems (CR, DR and DDR). The imaging systems based on digital presentation of diagnostic image have a dominating advantage in contemporary roentgenodiagnostics. Each of these methods of image acquisition due to its own technological solutions, determines a different quality of imaging (diagnostic data). Owing to that fact, quality control procedures, their scope (range), studied (evaluated) parameters as well as the evaluation of detection efficiency in these diagnostic systems are so much different. 2. Systems of imaging in roentgenodiagnostics Imaging in roentgenodiagnostics in based on three technological solutions of diagnostic data acquisition: • Analog systems: cassette with an intensifying screen, x-ray film, viewing box; • CR systems (Computed Radiography) – cassettes with phosphor imaging plates, CD reader, control station with monitors for description of diagnosed images; • Direct and indirect digital systems (DR and DDR): - imaging panel coated with a layer of scintillation material (e.g. cesium iodide-CsI- famous for being used in image intensifiers), with photodiodes (Si) and an active matrix TFT (Thin Film Transistor- which is an electronically controlled switch) – indirect digital detector, - camera CCD – optical system coated with scintillation layer placed in front of CCD camera (charge-coupled devices) – indirect digital detector - imaging panel with a photoconductors – a layer of amorphous selenium (Se) with an active matrix TFT – indirect digital detector. www.intechopen.com
Transcript of Analog and Digital Systems of Imaging in Roentgenodiagnosticscdn.intechweb.org/pdfs/23733.pdf ·...

8
Analog and Digital Systems of Imaging in Roentgenodiagnostics
Dominika Oborska-Kumaszyńska 1General Radiology, Interventional Radiology and Neuroradiology,
University Hospital, Wroclaw, 2Wolverhampton Royal Hospitals, New Cross Hospital,
Medical Physics and Clinical Enngineering Department, Wolverhampton, 1Poland
2United Kingdom
1. Introduction
In contemporary radiology, the carrier of the diagnostic information is the image, obtained as a result of an X-ray beam transmitted through the patient’s body, with modulation of intensity of X-ry beam and processing of data collected by the image detectors. Depending on the diagnostic method used for image acquisition, signals can be detected with analog (x-ray film) or digital systems (CR, DR and DDR). The imaging systems based on digital presentation of diagnostic image have a dominating advantage in contemporary roentgenodiagnostics. Each of these methods of image acquisition due to its own technological solutions, determines a different quality of imaging (diagnostic data). Owing to that fact, quality control procedures, their scope (range), studied (evaluated) parameters as well as the evaluation of detection efficiency in these diagnostic systems are so much different.
2. Systems of imaging in roentgenodiagnostics
Imaging in roentgenodiagnostics in based on three technological solutions of diagnostic data acquisition: • Analog systems: cassette with an intensifying screen, x-ray film, viewing box; • CR systems (Computed Radiography) – cassettes with phosphor imaging plates, CD
reader, control station with monitors for description of diagnosed images; • Direct and indirect digital systems (DR and DDR):
- imaging panel coated with a layer of scintillation material (e.g. cesium iodide-CsI- famous for being used in image intensifiers), with photodiodes (Si) and an active matrix TFT (Thin Film Transistor- which is an electronically controlled switch) – indirect digital detector,
- camera CCD – optical system coated with scintillation layer placed in front of CCD camera (charge-coupled devices) – indirect digital detector
- imaging panel with a photoconductors – a layer of amorphous selenium (Se) with an active matrix TFT – indirect digital detector.
www.intechopen.com

Wide Spectra of Quality Control
134
Each of above mentioned systems and technological solution is characterized by properties influencing image parameters, both improving their quality, as well as causing the loss or deterioration of the diagnostic information.
A. Analog systems
Analog image detector of an x-ray unit consists of three components: x-ray film, intensifying screen and light-proof housing (cassette). An ancillary part of imaging system is a developing device along with reagents for photochemical processing of x-ray films (developer, fixing agent, water).
protective layer (gelatine)
glue
polymer layer
emulsion (silver halide)
(according to: http://astrophysics.fic.uni.lodz.pl/medtech/)
Fig. 1. Scheme of cross-section through x-ray film
X-ray film is made of a thin, transparent, flexible polyester film (base material of x-ray) and a thin layer of photographic emulsion (Fig. 1). The emulsion is coated with protective polymer layers and with a dulling agent. The photosensitive elements are silver halide microcrystals. If quanta of x-rays or visible light radiation energy emitted by the intensifying screens transfer their energy, as soon as they reach the silver halide crystals. If the energy is sufficient then crystal electron can be transferred from valence band to the conduction band, where it can move freely throughout the crystal. The electron moved until it reaches the place of crystal structure distortion, where it is “trapped”. The presence of the “trapped” electron with a negative electric charge causes the attraction of positively charged silver ions which further leads to origin of a metallic silver atom in that particular place. This place becomes a part of a latent image. As a result of described process, latent image sites may occur on the crystal, large enough (a few up to several metalic silver atoms), large enough for the developer to initiate the process of reduction of the whole crystal to metalic silver. The amount of the developed metallic silver determines the level of optical density, creating a real image on the film. „Revealing” of the image on x-ray film proceeds in the course of photochemical processing. In order to increase the probability of x -ray photos detection the intensifying screens are applied (Fig. 2). The intensifying screens are polymer, on one side coated with scintillation powders (containing phosphor) which contain elements with high atomic number (e.g. calcium tungstate CaWO4, gadolinium oxide sulphide Gd2O2S). In radiographic cassette we may usually find two screens, (an exception make mammographic cassettes with a single intensifying screen), whereas the scintillation layer is directed to inner side of the cassette, where the x-ray film is placed. Applying scintillation materials enables the reduction of radiation doses from 20 to 100 times, depending on type and screen sensitivity.
www.intechopen.com
Analog and Digital Systems of Imaging in Roentgenodiagnostics
135
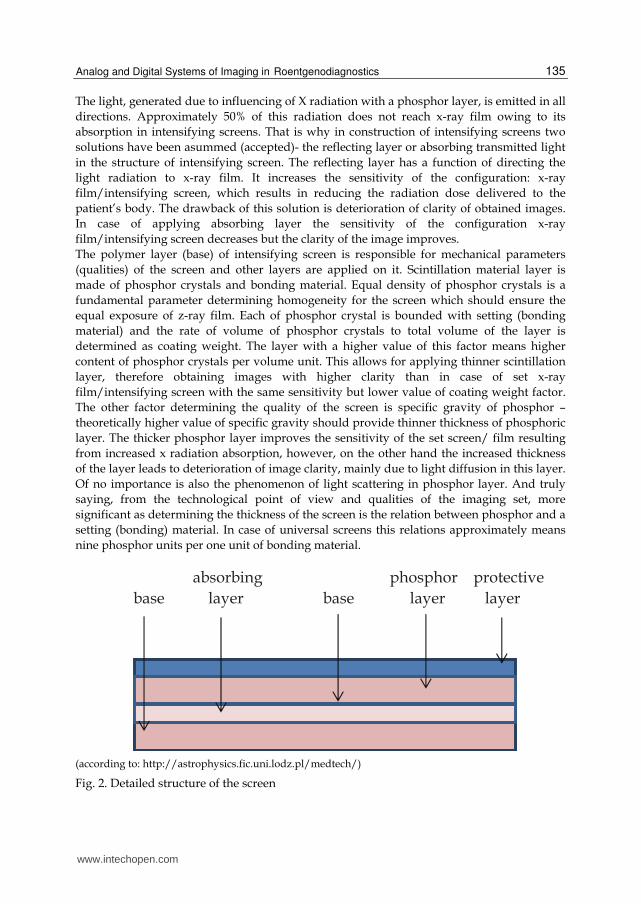
The light, generated due to influencing of X radiation with a phosphor layer, is emitted in all
directions. Approximately 50% of this radiation does not reach x-ray film owing to its
absorption in intensifying screens. That is why in construction of intensifying screens two
solutions have been asummed (accepted)- the reflecting layer or absorbing transmitted light
in the structure of intensifying screen. The reflecting layer has a function of directing the
light radiation to x-ray film. It increases the sensitivity of the configuration: x-ray
film/intensifying screen, which results in reducing the radiation dose delivered to the
patient’s body. The drawback of this solution is deterioration of clarity of obtained images.
In case of applying absorbing layer the sensitivity of the configuration x-ray
film/intensifying screen decreases but the clarity of the image improves.
The polymer layer (base) of intensifying screen is responsible for mechanical parameters
(qualities) of the screen and other layers are applied on it. Scintillation material layer is
made of phosphor crystals and bonding material. Equal density of phosphor crystals is a
fundamental parameter determining homogeneity for the screen which should ensure the
equal exposure of z-ray film. Each of phosphor crystal is bounded with setting (bonding
material) and the rate of volume of phosphor crystals to total volume of the layer is
determined as coating weight. The layer with a higher value of this factor means higher
content of phosphor crystals per volume unit. This allows for applying thinner scintillation
layer, therefore obtaining images with higher clarity than in case of set x-ray
film/intensifying screen with the same sensitivity but lower value of coating weight factor.
The other factor determining the quality of the screen is specific gravity of phosphor –
theoretically higher value of specific gravity should provide thinner thickness of phosphoric
layer. The thicker phosphor layer improves the sensitivity of the set screen/ film resulting
from increased x radiation absorption, however, on the other hand the increased thickness
of the layer leads to deterioration of image clarity, mainly due to light diffusion in this layer.
Of no importance is also the phenomenon of light scattering in phosphor layer. And truly
saying, from the technological point of view and qualities of the imaging set, more
significant as determining the thickness of the screen is the relation between phosphor and a
setting (bonding) material. In case of universal screens this relations approximately means
nine phosphor units per one unit of bonding material.
absorbing phosphor protective
base layer base layer layer
(according to: http://astrophysics.fic.uni.lodz.pl/medtech/)
Fig. 2. Detailed structure of the screen
www.intechopen.com
Wide Spectra of Quality Control
136
Polymer protective layer, protects the scintillation layer against mechanical damages (e.g.
during cleaning the screen) and at the same time prevents from collecting air between the
phosphor layer and x-ray film. In order to provide equal clamp of the x-ray film to the
intensifying screens, the magnetic plate in construction of cassettes is also applied (made on
base of rubber, placed at the bottom side of the cassette) and a steel film. (on the lamp side).
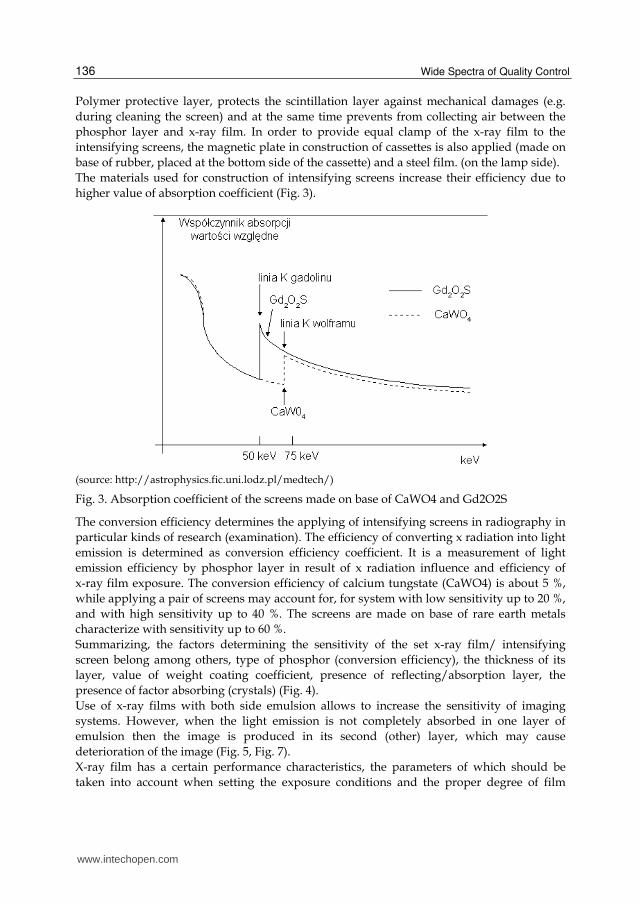
The materials used for construction of intensifying screens increase their efficiency due to
higher value of absorption coefficient (Fig. 3).
(source: http://astrophysics.fic.uni.lodz.pl/medtech/)
Fig. 3. Absorption coefficient of the screens made on base of CaWO4 and Gd2O2S
The conversion efficiency determines the applying of intensifying screens in radiography in
particular kinds of research (examination). The efficiency of converting x radiation into light
emission is determined as conversion efficiency coefficient. It is a measurement of light
emission efficiency by phosphor layer in result of x radiation influence and efficiency of
x-ray film exposure. The conversion efficiency of calcium tungstate (CaWO4) is about 5 %,
while applying a pair of screens may account for, for system with low sensitivity up to 20 %,
and with high sensitivity up to 40 %. The screens are made on base of rare earth metals
characterize with sensitivity up to 60 %.
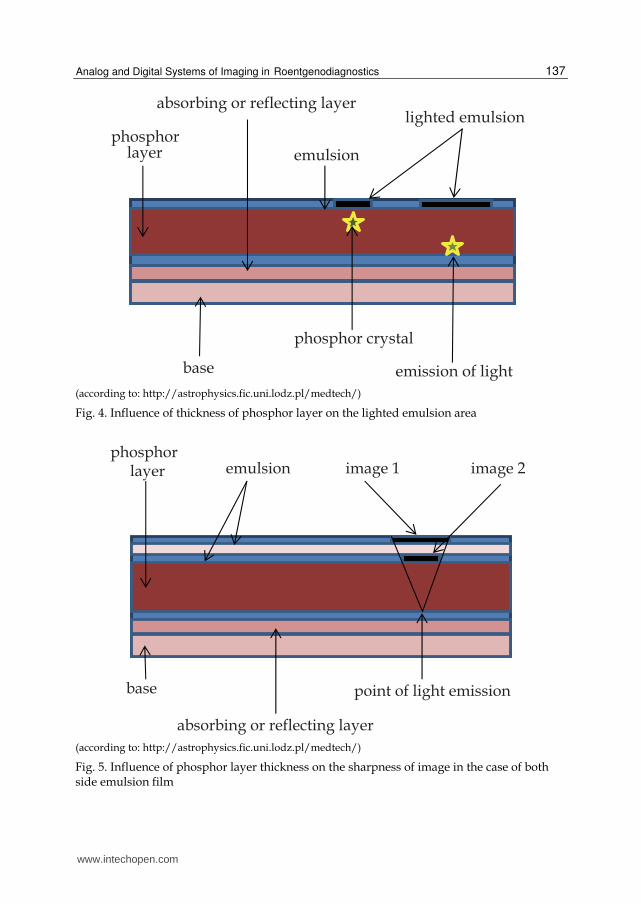
Summarizing, the factors determining the sensitivity of the set x-ray film/ intensifying
screen belong among others, type of phosphor (conversion efficiency), the thickness of its
layer, value of weight coating coefficient, presence of reflecting/absorption layer, the
presence of factor absorbing (crystals) (Fig. 4).
Use of x-ray films with both side emulsion allows to increase the sensitivity of imaging
systems. However, when the light emission is not completely absorbed in one layer of
emulsion then the image is produced in its second (other) layer, which may cause
deterioration of the image (Fig. 5, Fig. 7).
X-ray film has a certain performance characteristics, the parameters of which should be
taken into account when setting the exposure conditions and the proper degree of film
www.intechopen.com
Analog and Digital Systems of Imaging in Roentgenodiagnostics
137
absorbing or reflecting layer
phosphor layer emulsion
base
lighted emulsion
phosphor crystal
emission of light
(according to: http://astrophysics.fic.uni.lodz.pl/medtech/)
Fig. 4. Influence of thickness of phosphor layer on the lighted emulsion area
emulsion image 1 image 2
base
phosphor layer
point of light emission
absorbing or reflecting layer
(according to: http://astrophysics.fic.uni.lodz.pl/medtech/)
Fig. 5. Influence of phosphor layer thickness on the sharpness of image in the case of both side emulsion film
www.intechopen.com

Wide Spectra of Quality Control
138
utilization. Sensitometric properties of light –sensitive materials are determined by the characteristic curve (Fig. 6), which is the graph of function of the optical density over the logarithm of exposure. The exposure (E or H) is the product of illuminance (I) and exposure time (t), and the optical density is the logarithm of the quotient of incident light intensity to intensity transmitted through the exposed x-ray film. Photosensitive material does not react in areas of low exposure, and obtained optical density results from optical density of a base material coated with photosensitive layers (Dp) and from optical density of fog (D0), which added all together, constitutes the minimum optical density (Dmin). With a certain value of exposure, the value of optical density start increasing slowly and converts into the linear dependency with a specific angle of inclination.
Fig. 6. X-ray film optical density curve (response curve)
Then along with increasing of exposure, the increase of density is reduced and characteristic curve reaches parallel line, parallel to the axis of exposure logarithm, at the constant density- the maximum density (Dmax), when the level of reached exposure results in the development of all crystals contained in the layer. The basic sensitometric values determined by characteristic curve are the sensitivity coefficient as well as contrast coefficient.
Sensitivity coefficient
The sensitivity of photographic material is defined as the smallest amount of light required to produce a certain optical density. Its measure is the value of exposure logarithm essential to obtain optical density, which is defined as Dkr = Dmin + 1,0 and for this value the relevant to it, the value of exposure logarithm is read.
www.intechopen.com

Analog and Digital Systems of Imaging in Roentgenodiagnostics
139
Contrast coefficient
The contrast is defined as the measure of differences in optical density in the image and it be calculated from the inclination of rectilinear part of characteristic curve. It is defined as slope in the point (e.g. contrast coefficient α, as trigometric function of inclination angle of tangent in the point of inflection of characteristic curve in closeness of the middle of rectilinear part) or as the average gradient which is determined as trigometric function of inclination angle of the part joining 2 critical points of optical density D1 = Dmin + 0,25 and D2 = Dmin + 2,00 (Fig. 6). The basic values allowing for determining imaging parameters are optical density, contrast and resolution, where: 1. Optical density is the opacity in image and is defined as the value of common logarithm
from converse of transmission coefficient. This coefficient can be recorded as the ratio of light intensity transmitted through certain point to light intensity reaching this point.
.
.
1log log
padaj
przep
ID
T I
⎛ ⎞⎛ ⎞ ⎜ ⎟= =⎜ ⎟ ⎜ ⎟⎝ ⎠ ⎝ ⎠
2. Contrast is a measure of difference in optical density of particular image areas, relevant to differences in density an thickness of tissues visible in the image. The image contrast depends on: energy of radiation, structure of studies tissue or organ, sensitivity of the film and the type of intensifying screen as well as the dose of scattering radiation and optical density fog.
3. Image resolution is determined by the number of pairs of lines per 1 millimetre (no/mm), which may be imaged and possible to recognize as separated structure. Resolution determines the smallest object possible to imaging, at the same time determines the smallest, possible to be recognized, distance between two objects.
X-RayLightscintillation
X-Ray film
Scintillating screen
Line spread function
X-Ray X-Ray
low speed,high resolution
high speed,lowresolution
Line spread function
Screen/film84 μm
(according to: Andrew P. Smith, Fundamental Digital Mammography, Physics, Technology and Practical Considerations)
Fig. 7. Intensifying screen performance – the influence of sensitivity and scattering of imaging system
www.intechopen.com
Wide Spectra of Quality Control
140
x-ray film is the detector with limited capacity of data collection, for which significantly important is the proper optimization of process of image development, starting with proper device setting (exposure management) through the process of photographic proceeding (system sensitivity, artefacts in image, level of noises), illumination conditions of dark room to proper choice of parameters of the whole imaging system (intensifying screens in range of length of emitted light, relevant to parameters of applied x-ray films). Properly setting of elements of diagnostic data development reflects creating the most beneficial conditions for proper image quality (optimization). In analog systems quality and diagnostic evaluation takes place in descriptive rooms with use of viewing box which should absolutely meet parameters values determining respectively the illumination conditions (no more than 50 lx) as well as lumination of emitted light (cd/m2).
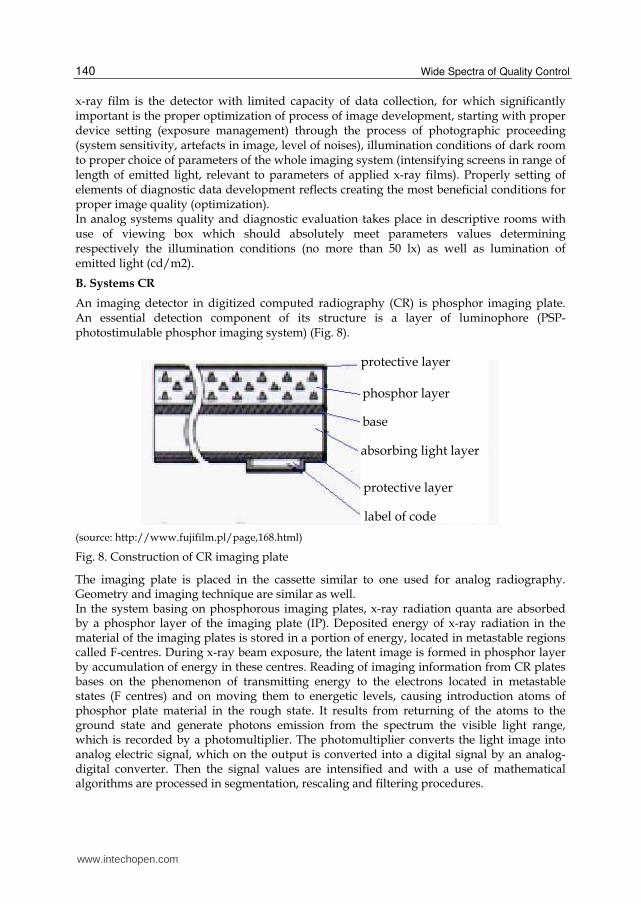
B. Systems CR
An imaging detector in digitized computed radiography (CR) is phosphor imaging plate. An essential detection component of its structure is a layer of luminophore (PSP-photostimulable phosphor imaging system) (Fig. 8).
base
protective layer
phosphor layer
absorbing light layer
protective layer
label of code
(source: http://www.fujifilm.pl/page,168.html)
Fig. 8. Construction of CR imaging plate
The imaging plate is placed in the cassette similar to one used for analog radiography. Geometry and imaging technique are similar as well. In the system basing on phosphorous imaging plates, x-ray radiation quanta are absorbed by a phosphor layer of the imaging plate (IP). Deposited energy of x-ray radiation in the material of the imaging plates is stored in a portion of energy, located in metastable regions called F-centres. During x-ray beam exposure, the latent image is formed in phosphor layer by accumulation of energy in these centres. Reading of imaging information from CR plates bases on the phenomenon of transmitting energy to the electrons located in metastable states (F centres) and on moving them to energetic levels, causing introduction atoms of phosphor plate material in the rough state. It results from returning of the atoms to the ground state and generate photons emission from the spectrum the visible light range, which is recorded by a photomultiplier. The photomultiplier converts the light image into analog electric signal, which on the output is converted into a digital signal by an analog-digital converter. Then the signal values are intensified and with a use of mathematical algorithms are processed in segmentation, rescaling and filtering procedures.
www.intechopen.com
Analog and Digital Systems of Imaging in Roentgenodiagnostics
141
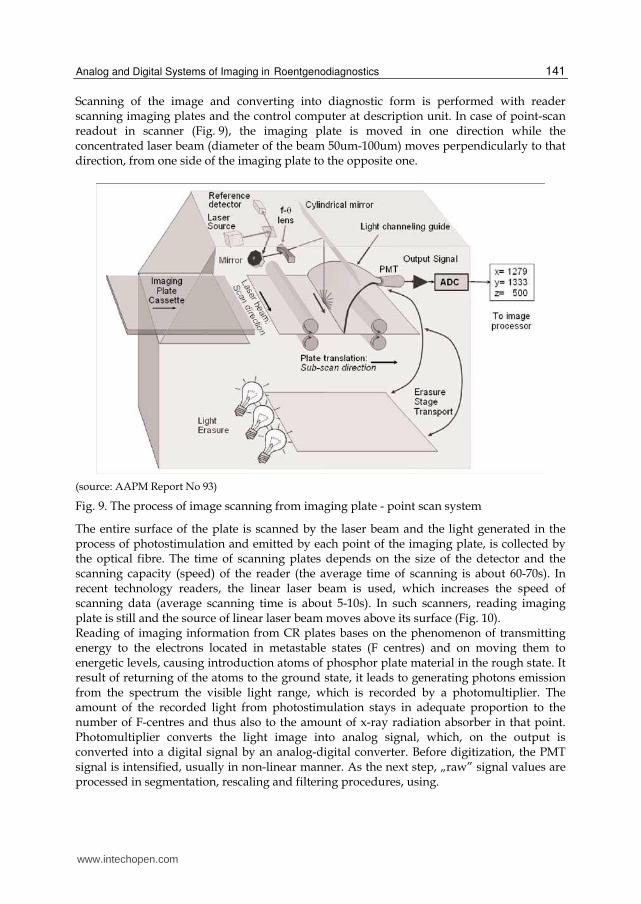
Scanning of the image and converting into diagnostic form is performed with reader scanning imaging plates and the control computer at description unit. In case of point-scan readout in scanner (Fig. 9), the imaging plate is moved in one direction while the concentrated laser beam (diameter of the beam 50um-100um) moves perpendicularly to that direction, from one side of the imaging plate to the opposite one.
(source: AAPM Report No 93)
Fig. 9. The process of image scanning from imaging plate - point scan system
The entire surface of the plate is scanned by the laser beam and the light generated in the process of photostimulation and emitted by each point of the imaging plate, is collected by the optical fibre. The time of scanning plates depends on the size of the detector and the scanning capacity (speed) of the reader (the average time of scanning is about 60-70s). In recent technology readers, the linear laser beam is used, which increases the speed of scanning data (average scanning time is about 5-10s). In such scanners, reading imaging plate is still and the source of linear laser beam moves above its surface (Fig. 10). Reading of imaging information from CR plates bases on the phenomenon of transmitting energy to the electrons located in metastable states (F centres) and on moving them to energetic levels, causing introduction atoms of phosphor plate material in the rough state. It result of returning of the atoms to the ground state, it leads to generating photons emission from the spectrum the visible light range, which is recorded by a photomultiplier. The amount of the recorded light from photostimulation stays in adequate proportion to the number of F-centres and thus also to the amount of x-ray radiation absorber in that point. Photomultiplier converts the light image into analog signal, which, on the output is converted into a digital signal by an analog-digital converter. Before digitization, the PMT signal is intensified, usually in non-linear manner. As the next step, „raw” signal values are processed in segmentation, rescaling and filtering procedures, using.
www.intechopen.com

Wide Spectra of Quality Control
142
In order to optimize the effectiveness of imaging plate utilization within range of exposure, the digitized systems provide the pre-reading procedure, which allows for testing the sensitivity of the signal reading. Initially, a weak beam laser is used for reading a „raw” image data, appropriate reading, sensitivity and exposure conditions are determined basing on analyses of the data obtained, afterwards the proper reading proceeding takes place. The method enables normalization of the luminescence, in which the x-ray mage appears, in order to allow the conversion of digital signals, irrespectively of the object being tested and the x-ray radiation dose.
(source: AAPM Report No 93)
Fig. 10. The process of image scanning from imaging plate - line scan system
After scanning (reading) of imaging plate is completed, the imaging plate is exposed to a visible light emitted, with a high insensitivity beam, by the erasing lamp that „deletes” the x-ray image and makes the imaging plate ready for reuse. In digital radiography in CR systems, the disadvantageous for image acquisition, phenomenon of fading is present i.e. fading of recorded signal, thus the time between exposure of imaging plate and its reading with the reader (scanner) is significant. Typical image recorder loses approximately 25% z of deposited signal in the period of time from 10 minutes to 8 hours after exposure.
C. Digital system: DR and DDR
Imaging system CCD
Detectors in CCD technology are the devices used for image recording, their performance in based on recording the lights emitted from luminophor. Matrix CCD (Charge Coupled Device – the device with coupling load) is made of series of electrodes (light-sensitive components) based on semiconductors base and constituting matrix of capacitors (Fig. 6). the number of components determines the resolution of obtained digital images. The voltage is delivered separately (solely) to each of the electrodes, which enables generating the image detector with particular positioning system. When the surface of CCD
www.intechopen.com
Analog and Digital Systems of Imaging in Roentgenodiagnostics
143
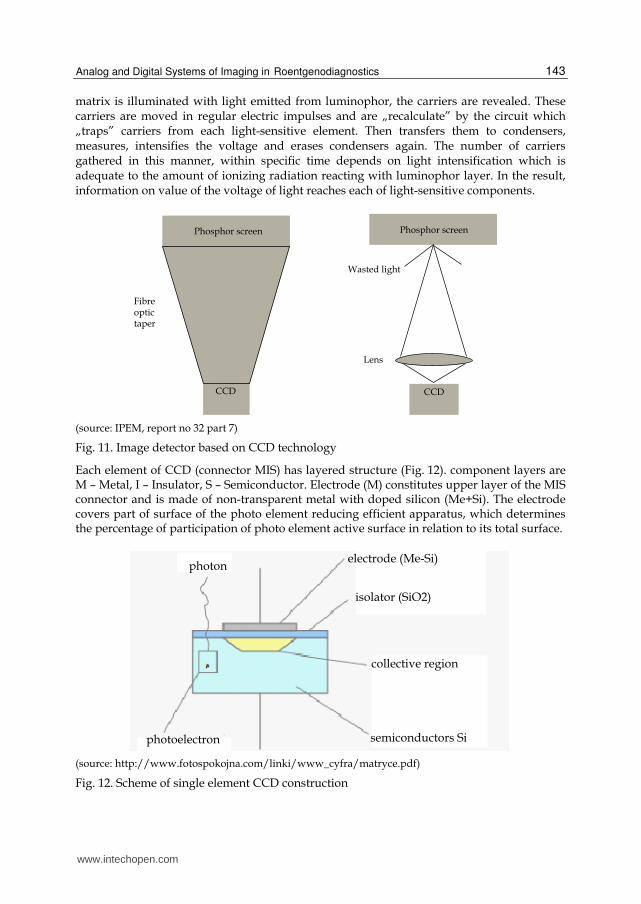
matrix is illuminated with light emitted from luminophor, the carriers are revealed. These carriers are moved in regular electric impulses and are „recalculate” by the circuit which „traps” carriers from each light-sensitive element. Then transfers them to condensers, measures, intensifies the voltage and erases condensers again. The number of carriers gathered in this manner, within specific time depends on light intensification which is adequate to the amount of ionizing radiation reacting with luminophor layer. In the result, information on value of the voltage of light reaches each of light-sensitive components.
Fibreoptictaper
Wasted light
Lens
Phosphor screen Phosphor screen
CCDCCD
(source: IPEM, report no 32 part 7)
Fig. 11. Image detector based on CCD technology
Each element of CCD (connector MIS) has layered structure (Fig. 12). component layers are M – Metal, I – Insulator, S – Semiconductor. Electrode (M) constitutes upper layer of the MIS connector and is made of non-transparent metal with doped silicon (Me+Si). The electrode covers part of surface of the photo element reducing efficient apparatus, which determines the percentage of participation of photo element active surface in relation to its total surface.
photonelectrode (Me-Si)
isolator (SiO2)
collective region
semiconductors Siphotoelectron
(source: http://www.fotospokojna.com/linki/www_cyfra/matryce.pdf)
Fig. 12. Scheme of single element CCD construction
www.intechopen.com

Wide Spectra of Quality Control
144
The function of positive electrode is maintaining of generated during exposure electrons in the region of the photo element (Fig. 12 - collective region). It prevents from arising of phenomenon of blooming, which is blurring of the voltage on the adjoining elements. The effect regards saturation state of detector cell which overload causes effluent of collected voltage to the adjoining cells. Below the positive electrode, there is semitransparent layer of isolator (I) made of silicon dioxide. (SiO2). The function of isolator is to prevent from uncontrollable effluent of the voltage to the electrode. The light- sensitive element of MIS connector is bottom layer of silicon semiconductor (Si). The number of current carrier, released due to reacting of the light with semiconductor layer, is directly proportional to the amount (voltage and time of duration) of falling light. Reading of collected in photo elements of the matrix charges has a sequential character. Along each of matrix columns, the canal CCD is placed, in which charges move in direction to reading recorders. The electrons from the first row of sensors are transmitted to reading recorders and then signal intensifier and analog-digital convertor, where the current signal is digitalized and saved on memory carrier.
Systems DR and DDR (image panels)
In case of radiography with digital image detectors, the most common solution iare panels made of amorphous silicon or selenium (indirect digital systems) and panels based on a matrix made of electrodes separated by a layer of insulator and the active components, such as thin-film transistors. (Fig. 13, Fig. 14).
channel
source
gate isolation
gate
drain
Drain Source
Incident x-rays
CsI(TI) Converter
Photodiode(Storage Capacitor)
GateGlass Substrate
E
TFT
(source: http://astrophysics.fic.uni.lodz.pl/medtech/)
Fig. 13. Structure of thin-film transistor
www.intechopen.com

Analog and Digital Systems of Imaging in Roentgenodiagnostics
145
(source: Mammographic detectors, G. PANAGIOTAKIS UNIV OF PATRAS)
Fig. 14. Detector of the direct digital system: (a) microphotograph, (b) structure of the single pixel of the TFT matrix (c) schematic diagram of the structure of two pixels
The base for indirect digital systems with imaging panels are the detectors which consist of photoconductors, such as amorphous silicon or selenium. Layer of silicon detector contains a matrix of receptors, each equipped with its own control components (transistor or diode)and corresponding to one pixel of the image. Regulating (control) systems are responsible for the process of data reading: line after line, electrical signals are intensified and converted into a digital form. Silicon itself is not sufficiently sensitive to energy of x-rays radiation used in diagnostic imaging. Therefore, silicon layer is covered with a layer of scintillation material such as cesium iodide (CsI), which is characterized by a needle-like structure of a crystal, causing less side scattering of light and higher resolution of the imaging system. The thickness of the CSI crystal with its needle-like structure can be adjusted to the desired sensitivity of the system (ensuring proper level of absorbance of x-ray radiation) with the maintenance of high spatial resolution at the same time.
www.intechopen.com

Wide Spectra of Quality Control
146
Photodiodes (Si:H), located under a layer of scintillation material, convert the optical signal into an electrical signal (charge), which is accumulated in a capacitive element of a pixel. In the direct digital imaging system, the detector is made of photoconductors characterized with a high atomic number (e.g., Se or PbI2), which cover an active area of the matrix. That kind of the structure forms a layer of photoconductor which directly converts x-ray radiation into charge carriers, drifting to collecting electrodes. The main advantage of direct digital systems, comparing to CR systems and indirect DR systems, in terms of image quality, is the lack of effects from the light photons scattering at the detector material. Electric charge, generated as the effect of x-rays radiation, is collected by a single electrode, which makes the side-scatter (diffusion) effect not significant for the process of image creation. Additionally, detector absorption efficiency can be maximized by an appropriate selection of the material of photoconductors, calibration, and a proper thickness of the layer of capacitive elements. An active matrix consists of M x N number of pixels. Each pixel has three basic elements: the TFT switch, pixel electrode and capacitor. Active matrix is determined by the pixel width, width of pixel collection and the distance between pixels (pitch) (d) (Fig. 14). TFT elements function as switches, for each pixel individually, and control the charge. Each line of pixels is simultaneously electronically activated during the reading process. Normally, all TFT elements are deactivated, allowing the accumulation of the charges on pixels electrodes. Data can be obtained by external electronics and controlling of the TFT status by software. Each TFT contains three electrical components: Gate controlling “on” or “off” TFT status, Drain (D) connecting the pixel electrode and the pixel capacitor and Source (S) connected to a collective data transmission line. When the gate line is activated, all the elements of TFT in a particular row are ‘on’ and the charge collected on the electrodes is read from the data line. Parallel data are multiplexed into serial data, discretized and transferred to a computer to create the image (Fig. 15).
driver of raws
multiplexer
gain of charge
A/C
dri
ver
s o
f li
nes
(source: http://astrophysics.fic.uni.lodz.pl/medtech/)
Fig. 15. The structure of the matrix of sensors of displays and the way of controlling the reading structure of the matrix of sensors
www.intechopen.com
Analog and Digital Systems of Imaging in Roentgenodiagnostics
147
The undoubtful advantage of the image acquisition in the digital form is the possibility of
post processing of this image.
3. Image processing
Initial image processing (pre-processing)
Raw image generated by the digital system is the image that does not have any diagnostic
value. It is caused due to wide range of dynamic as well as presence of inhomogeneity of
particular detective components of the image recorder. That is why, initial processing of
the raw material in connected with compensation of artefacts coming from image
detector.
In digital systems (DR) detectors are not homogenous regarding performance of the
particular components, due to differences in intensification of recorded image (offset), the
presence of defected pixels. Inhomogeneity of the detector constitutes the source of the noise
in the image and is some cases geometrical uniformity.
Inhomogeneity in the image may be eliminated by applying proper correction processes:
- offset – „dark current” - generated by electronical components as the additional charge
which without applying map of offset correction would add to the value of the charge,
formed as the result of reacting of x –ray radiation with the detector. Correction of
offset map is produced by signal recording for the image created without participation
(involvement) of x-ray radiation. (black/ dark image).
- intensification – the differences in intensification for particular components of the
detector result from the differences in thickness of phosphorous components, sensitivity
of these elements and the difference of the intensifiers. This effect should not be
reflecting the diagnostic image, therefore the gain map of intensification is applied. The
map of intensification corrections is obtained as the result of averaging of a few flat
images achieved in the result of detector exposure to homogenous beam of x-ray
radiation. In order to obtain homogenous signal from the surface of the whole detector,
recorded values of the signals for its particular components are divided into values
present on gain map of intensification.
- bad pixels – digital detector of the image may have damaged or faulty (broken) detector
components, both as a single as well as the whole lines of these components. The effect
of presence of irregularly working components requires correction and the gain map is
produced („bad pixel map”). Then the dead regions of imaging may be deleted from
the diagnostic image and compensated by the assigning the pixel value as the average
or median of signal from adjoining pixels.
- geometrical uniformity – for the majority of digital systems, imaging systems are not
spatial uniformity in diagnostic images. However, in case of detectors based on CCD
technology, using during forming image, one or more lenses, the clinical image will
be distorted. During calibration of the device, the value of distortion caused by the
lenses, should be measured and should be implemented fixed correlation for each
image.
Diagnostic image processing (post-processing)
The process of initial image processing is used for correction of detectors characteristics. Further image processing is applied for generating the image for presentation and with
www.intechopen.com
Wide Spectra of Quality Control
148
parameters allowing for conducting its clinical evaluation. It is connected with identification of collimation as well as with process of processing special frequency and grey scale. The process of processing in range of frequency (e.g., accumulation of noises, edges enforcement and attaching the imaging net) is a common tool used for improving quality of the image. During the process of processing of the diagnostic image also the transformation of pixel values to new digital values is also performed– LUT („a look-up table”). LUT is mainly applied in two cases: - digital detector usually has much wider dynamic range than the range obtained
intensifications in clinical image, therefore LUT is used for extraction of the range of detector work to clinical signal and its adjustment to displayed grey scale,
- LUT is used for reinforcing the contrast of pixel values applied in clinical conditions. In clinical application non-linear LUT function may be more useful- the most common is correlation curve in shape of letter S (similar to response curve for imaging with radiographic film - OD characteristic curve).
LUT also rescales the pixels vales to the values close to the referencing values, which may sometimes cause data loss between obtained dose by the detector and the vales of grey scale (therefore, the evaluation of this relations is conducted on the image after pre-processing).
4. Factors determining image quality
Detection efficiency (DQE)
Quantitative detection efficiency (DQE) i the parameter describing image receptor regarding its radiation detection efficiency, spatial resolution and the noise. DQE describes relative efficiency of maintaining of SNR level (the ratio of the signal scale to the noise), possibly obtained in imaging process and is defined as SNR2out/SNR2in, where SNR2in is SNR of exposure reaction on the receptor and quantitative equal to the input stream. In this manner, DQE may be expressed as efficiency of transferring SNR through the system and its efficiency reflects the detection quality and image acquisition. For imaging system SF (screen film), CR (phosphor imaging plates) and DR (digital systems), quantum efficiency is determined by the thickness, density and structure (content) of absorber (image detector).
Signal transfer property (STP – signal transfer property)
Signal transfer property (STP), which determines the relations between initial parameters of the detector(usually optical density or pixel value), which is non-changeable parameter) and an air kerma, measured at the entrance of this detector, is a parameter allowing for objective evaluation of image quality. Imaging system must retain linear response or at least possibly linear in order to form proper results for quantitive analysis of the measurements, or it regards simple measurement such as homogeneity or more complex as MTF measurements. In the system is not linear (e.g. logarithmic, quadratic) the relevant inversion of STP function should be applied, corresponding the type of relation of detectors response to obtained radiation dose.
Dose indicator (DDI – Detector dose indicator)
DDI is the parameter characterizing digital form of imaging. The essential benefit of the
digital imaging is separation of acquisition from the image presentation. Most of the digital
www.intechopen.com
Analog and Digital Systems of Imaging in Roentgenodiagnostics
149
detectors have a wide dynamic range and wide exposure range, which ensure good image
quality. However, different exposures values may change in ambiguous way the sensitivity
of the system or cause the increase of the number of situations, in which the dose received
by the patient is not an optimal one. DI indicator is the parameter allowing for determining
the changes in sensitivity of imaging system as well as calibration and system testing AEC
(Automatic Exposure Control). Usually, there i s no linear relationship due to the dose and
for needs of quantitative evaluation requires its transmission to the linear function. DDI is
also the parameter depending on the radiation energy.
Dynamic range
In order to obtain the proper imaging quality in digital radiography, the image detector
must have good contrast resolution in wide range of exposure intensity to X radiation.
Dynamic range of the imaging system is the ratio of the largest and the smallest input
intensities, which can be visualized. The smallest useful value of intensity is limited by the
noise level of the system, while the highest value of intensity depends on detector saturation
level.
Spatial sampling
All digital detectors sample the permanently fluctuating stream of X-rays at the input, at
discrete locations, separated by gaps (pitch). In CR systems, the spacing between samples is
the distance between adjacent positions of the laser beam during reading process from the
imaging plate. In DR systems, pitch is the distance between centers of the spaces separating
each of detecting elements. The spatial frequency in sampling, determines the digital
system’s ability to display high-frequency fluctuations in X-ray stream. If the influence of
radiation stream with the receptor contains data of higher frequency than Nyquista
frequency and the modulation transfer function (MTF) before sampling is not evanescent for
these frequencies, then for low frequency, false noise may appear in the image.
MTF –Modulation Transfer Function
Modulation Transfer Function (MTF) is the response of the imaging system expressed
depending on spatial frequency- i.e. it is the relationship of contrast and spatial frequency to
the contrast for low frequencies (it means where the signal is not clear). Spatial frequency is
expressed in cycles per pixel or pair of lines per millimeter. High spatial frequencies
correspond to recognition of great number of details. MTF is determined with the pixel
value as well as the distance between the centers of adjoining pixels („pixel pitch”)
MTF(u) – sinc(2πΔxu)
where:
Δx – pixel pitch,
u – spatial frequency.
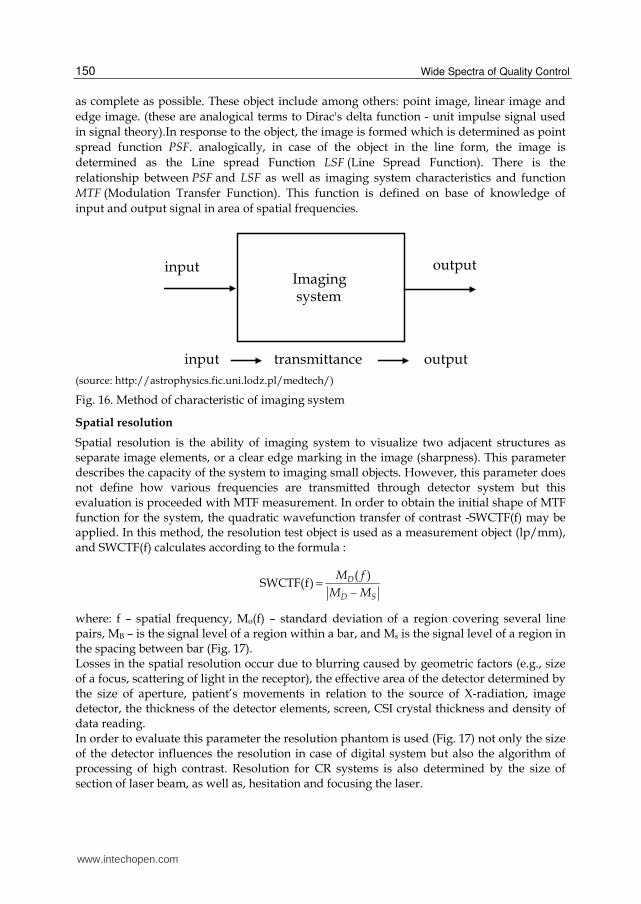
MTF allows to compare in an objective way the qualities of different imaging systems. In
order to perform the comparison, definition of signal transmission from communication
theory is quoted (Fig. 16). if on the input, the proper signal is provided, in case of imaging
the pattern object then on the output its image will be obtained. Comparing of the image, in
the proper manner, with object allows to determine the imaging system characteristics.
Therefore the object should be chosen in the way that the information about the system was
www.intechopen.com
Wide Spectra of Quality Control
150
as complete as possible. These object include among others: point image, linear image and
edge image. (these are analogical terms to Dirac's delta function - unit impulse signal used
in signal theory).In response to the object, the image is formed which is determined as point
spread function PSF. analogically, in case of the object in the line form, the image is
determined as the Line spread Function LSF (Line Spread Function). There is the
relationship between PSF and LSF as well as imaging system characteristics and function
MTF (Modulation Transfer Function). This function is defined on base of knowledge of
input and output signal in area of spatial frequencies.
input outputImaging system
input transmittance output
(source: http://astrophysics.fic.uni.lodz.pl/medtech/)
Fig. 16. Method of characteristic of imaging system
Spatial resolution
Spatial resolution is the ability of imaging system to visualize two adjacent structures as separate image elements, or a clear edge marking in the image (sharpness). This parameter describes the capacity of the system to imaging small objects. However, this parameter does not define how various frequencies are transmitted through detector system but this evaluation is proceeded with MTF measurement. In order to obtain the initial shape of MTF function for the system, the quadratic wavefunction transfer of contrast -SWCTF(f) may be applied. In this method, the resolution test object is used as a measurement object (lp/mm), and SWCTF(f) calculates according to the formula :
( )SWCTF(f) D
D S
M f
M M= −
where: f – spatial frequency, Mo(f) – standard deviation of a region covering several line pairs, MB – is the signal level of a region within a bar, and Ms is the signal level of a region in the spacing between bar (Fig. 17). Losses in the spatial resolution occur due to blurring caused by geometric factors (e.g., size of a focus, scattering of light in the receptor), the effective area of the detector determined by the size of aperture, patient’s movements in relation to the source of X-radiation, image detector, the thickness of the detector elements, screen, CSI crystal thickness and density of data reading. In order to evaluate this parameter the resolution phantom is used (Fig. 17) not only the size of the detector influences the resolution in case of digital system but also the algorithm of processing of high contrast. Resolution for CR systems is also determined by the size of section of laser beam, as well as, hesitation and focusing the laser.
www.intechopen.com

Analog and Digital Systems of Imaging in Roentgenodiagnostics
151
Mo(f)
Ms
MB
(source: IPEM report no 32 part 7)
Fig. 17. High contrast and spatial resolution test object
High contrast spatial resolution
High contrast resolution is determined in CR systems mainly by pixel distribution and value
of sampling of photomultipliers in the reader (the direction of the scanning). Standard
frequency of sampling in case of classic radiography is 5 – 12 pixels/mm, giving in the result
the distribution of pixels in range of 200-80 um and leading to obtaining theoretical
resolution limit 2.5-6 lines/mm. in case of mammographic systems the value of pixels
system is 40 um. Resolution limit should be close to the Nyquist frequency. For smaller
values of pixels distribution, the frequency is often below Nyquist frequency which implies
that there are also other factors determining this parameter, e.g.. screen parameters and
diagnostic workstation, processing process, section of laser beam, light scattering in
phosphor layer etc.. Finally obtained in measurement, value of resolution, should be
compared with Nyquist frequency limit, defined for 45 degrees by expression √2/2*Δp,
where Δp is pixels distribution.
Noise
Noise can be defined as fluctuations in the image, which do not correspond to differences in
X-radiation absorption by objects. A measure of noise may be determined by estimating the
noise power spectrum (NPS), which describes the correlation of spatial frequency and noise.
The noise in the image is dominated by quantum (shot) noise resulting from quantum
fluctuations in the X-ray and data digitization (in case of digital systems). However, all
image receptors contain internal sources of noise, such as noise coming from the film grain
and electronic noise in the CR and DR systems.
www.intechopen.com
Wide Spectra of Quality Control
152
Internal noise of the detector, which has agreed correlation depending on the place on the
receptor, is caused spatial difference in thickness of the intensifying screen in systems in SF,
the efficiency of light detection depending on position in cd readers and the differences in
intensification preintesifier in DR systems.
Deterioration of the image in radiography is also conditioned by the scattering of radiation,
which is another source of noise and contributes to decreasing of image contrast. The
solution to this problem is the use of anti-scatter grids placed in front of the image detector.
Utilization of the grip is particularly important in CR systems due to increase of sensitivity
to scattered radiation of barium halide (edge K approximately is 35 keV), in ratio to system
screens SF and contained in them gadolinium oxide sulphide (edge K approximately is 50
keV). However, in case of scanning systems (scanning with gap field), DR detectors have the
capacity of „deleting” from registration scattered radiation and therefore they do not require
the use of anti-scatter grid.
In most of detectors, the noise of the image is coherent with Poisson distribution (coefficient
b should be 1.0 for Poisson noise in the image):
ν = α* Kb,
where: K=DAK (detector air kerma); ν - variation, α i b - stable.
One of the essential parameters allowing to determine noise component in the image is
defining signal to noise ratio (SNR – signal to noise ratio).
Dark noise (noise characterizing only digital systems, because is connected with electronical
elements) may have a significant participation in image for regions with low level of useful
signal,in particular, that similar to usage signal in registration process is intensified. Image
correction for this parameter threshold contrast happens while adjusting look-up table.
One of advantages of digital imaging is the possibility of digital elimination of internal
noises of image detector in post-processing stage, (obtaining the image with diagnostic
values).
Contrast resolution
Contrast resolution refers to the value of the signal difference between the examined
structure and the surrounding. It is the result of differences in X-ray absorption in the
examined tissues. It is expressed as a relative difference in brightness between the relevant
areas in the digital image shown on the monitor. Radiographic contrast is determined by the
contrast of the object and receptor sensitivity. It is strongly depending on spectrum of x-ray
radiation energy and presence of scattered radiation. However, in digital imaging, contrast
in the image can be changed by setting the visualization parameters, independent of the
acquisition conditions.
Evaluation of the system in range of its capacity of imaging regions with small values of the
signal (small contrast) may be conducted on base of phantom image containing testing
components with different thicknesses and diameters. During tests the visuality of these
parameters in the image is determined and the diagram of detection coefficient id fixed.
High value of coefficients of threshold contrast (HT(A) = 1 / (Ct * √A), where: CT –threshold
contrast; A – region of visible element) is the measurement of high visuality of low contrast
elements, depends on dose therefore imaging of testing object should be conducted for
exposure values from the range of clinically applied doses.
www.intechopen.com
Analog and Digital Systems of Imaging in Roentgenodiagnostics
153
Artefacts
Artefacts are all kinds of disorders appearing in diagnostic region. In case of SF systems
they may be such as all sorts of no homogeneities resulting from developing process or lack
of homogeneity of the film or intensifying screens, additional components in the image
resulting from pollution of the cassettes or defects of intensifying screen. In case of digital
systems apart from, origin of the artefacts in the image results from mainly from defective
work of detector (in case of CR systems additionally the reader), defective processing of the
signal or functioning of reconstruction algorithm. For the imaging systems with imaging plate, the typical artefacts are „Moire patterns” ones – coming from anti-scatter grid; ghost image – resulting from unsuccessful delete of previous image, uniformity of the image; artefacts resulting from faulty cd CR. In case of DR systems, irregularity in the image may appear due to presence of faulty lines/pixels (generally they are eliminated in diagnostic image) in the process of pre- processing). They may also result from „checker board” effect – digital detectors are made of isolate panels, from which image date is connected in one entire part through electronic way. Each of panels also has a few intensifiers coating separated regions of detectors. If the response of any of these intensifiers or panels drifts then it may cause the change in the signal level and creating darker and lighter regions in diagnostic or testing image. Whereas, from combining image data from various detectors regions may result artefacts connected with accumulating of the signals or too big their separation- „stitching artefacts”– between plates of the detector may be potential gaps which size should not be significant from the point of forming diagnostic image (accepted for the general diagnostics is 100um). Artefacts appearing owing to the process of image processing is delay of the image- if the detector was exposed to high radiation exposure then initial image may be temporarily „ burnt” in the detector. Repeated calibration of the detector may cover it. However, after calibration process covered by this process” burnt” region may be revealed in next image. In this situation the detector requires performing another calibration Naturally, the artefacts in diagnostic image may also appear in result of defects of detector components, e.g., damage of phosphor layer - if phosphor or photoconductor disconnect from the TFT matrix or coupling of the light occurs then may appear region with weak signal or blurring region. The only solution in this case id the exchange of the detector.
5. References
[1] AAPM REPORT NO. 93, Acceptance testing and quality control of photostimulable
storage phosphor imaging systems, 2006.
[2] AAPM REPORT NO. 96, The measurement, reporting and management of radiation dose
in CT, 2008.
[3] AAPM REPORT NO. 116,,An exposure indicator for digital radiography, 2009.
[4] AAPM REPORT NO.74, Quality control in diagnostic radiology, 2002. 6) IPEM report no
32 part 7, Measurement of the Performance Characteristics of Diagnostic X –Ray
Systems, Digital Imaging Systems, 2010
[5] B. Pruszyński:,,Diagnostyka obrazowa. Podstawy teoretyczne i metodyka badań”,
PZWL, Warszawa 2001
[6] R. Kowski, M. Kubasiewicz: „Mammografia - podręcznik zachowania standardów
jakości”, Wydawnictwo Lekarskie, ACR, Warszawa 2001
www.intechopen.com

Wide Spectra of Quality Control
154
[7] G. Panagitakis: „Mammographic detectors”,
http://www.hep.upatras.gr/class/download/bio_sim_eik/mammographic_detec
tors.pdf
[8] Practice guideline for digital radiography, ACR practice guideline, 2007 (Res. 42)*
[9] Seibert JA, Ph., D Performance Assessment of DR Systems, UC DavisMedicalCenter
Sacramento, CA, http://www.aapm.org/meetings/03AM/pdf/9787-48370.pdf
[10] http://astrophysics.fic.uni.lodz.pl/medtech/
www.intechopen.com

Wide Spectra of Quality ControlEdited by Dr. Isin Akyar
ISBN 978-953-307-683-6Hard cover, 532 pagesPublisher InTechPublished online 07, July, 2011Published in print edition July, 2011
InTech EuropeUniversity Campus STeP Ri Slavka Krautzeka 83/A 51000 Rijeka, Croatia Phone: +385 (51) 770 447 Fax: +385 (51) 686 166www.intechopen.com
InTech ChinaUnit 405, Office Block, Hotel Equatorial Shanghai No.65, Yan An Road (West), Shanghai, 200040, China
Phone: +86-21-62489820 Fax: +86-21-62489821
Quality control is a standard which certainly has become a style of living. With the improvement of technologyevery day, we meet new and complicated devices and methods in different fields. Quality control explains thedirected use of testing to measure the achievement of a specific standard. It is the process, procedures andauthority used to accept or reject all components, drug product containers, closures, in-process materials,packaging material, labeling and drug products, and the authority to review production records to assure thatno errors have occurred.The quality which is supposed to be achieved is not a concept which can becontrolled by easy, numerical or other means, but it is the control over the intrinsic quality of a test facility andits studies. The aim of this book is to share useful and practical knowledge about quality control in severalfields with the people who want to improve their knowledge.
How to referenceIn order to correctly reference this scholarly work, feel free to copy and paste the following:
Dominika Oborska-Kumaszynska (2011). Analog and Digital Systems of Imaging in Roentgenodiagnostics,Wide Spectra of Quality Control, Dr. Isin Akyar (Ed.), ISBN: 978-953-307-683-6, InTech, Available from:http://www.intechopen.com/books/wide-spectra-of-quality-control/analog-and-digital-systems-of-imaging-in-roentgenodiagnostics


![Ley universitaria 23733[1]](https://static.fdocuments.net/doc/165x107/55ae939a1a28abd25f8b46c2/ley-universitaria-237331.jpg)