Anaerobic Digestion of BMW
312
Anaerobic Digestion of Biodegradable Municipal Wastes: A Review __________________________________________________________________________ _______________________________________________________________________ 1
-
Upload
truongdien -
Category
Documents
-
view
242 -
download
2
Transcript of Anaerobic Digestion of BMW
Anaerobic Digestion of Biodegradable Municipal Wastes: A Review __________________________________________________________________________
_______________________________________________________________________
1
Anaerobic Digestion of Biodegradable Municipal Wastes: A Review __________________________________________________________________________
_______________________________________________________________________
1
LEGAL NOTICE Copyright The contents of this report are Copyright © University of Glamorgan, 2007. All rights reserved. No part of this publication may be reproduced, stored in a retrieval system, or transmitted in any form or by any means without written permission from the publishers. K. D. Monson, S. R. Esteves, A. J. Guwy and R. M. Dinsdale have asserted their right to be identified as the authors of this work in accordance with the Copyright, Designs and Patents Act 1988. Terms of use/Disclaimer The statements and conclusions in this report are those of the authors unless stated otherwise. The report contains information obtained directly from companies that could not be verified through third party sources. The report is impartial and unbiased with regards to technology and technology suppliers, and does not aim to favour one technology or supplier over others. The reporting of commercial products, their sources or their use in connection with the material reported herein is not to be construed as actual or implied endorsement of technology or services. All images are reproduced with the permission of the site/company. The information in this report is supplied in good faith and the University of Glamorgan makes no representation as to its accuracy or content. University of Glamorgan is not liable, so far as law permits, for any expenses or losses including any special, incidental, consequential or similar damage or loss which directly or indirectly arise as a result of using the report or the information available on it.
May 2007 ISBN: 978-1-84054-157-1
Anaerobic Digestion of Biodegradable Municipal Wastes: A Review __________________________________________________________________________
_______________________________________________________________________
2
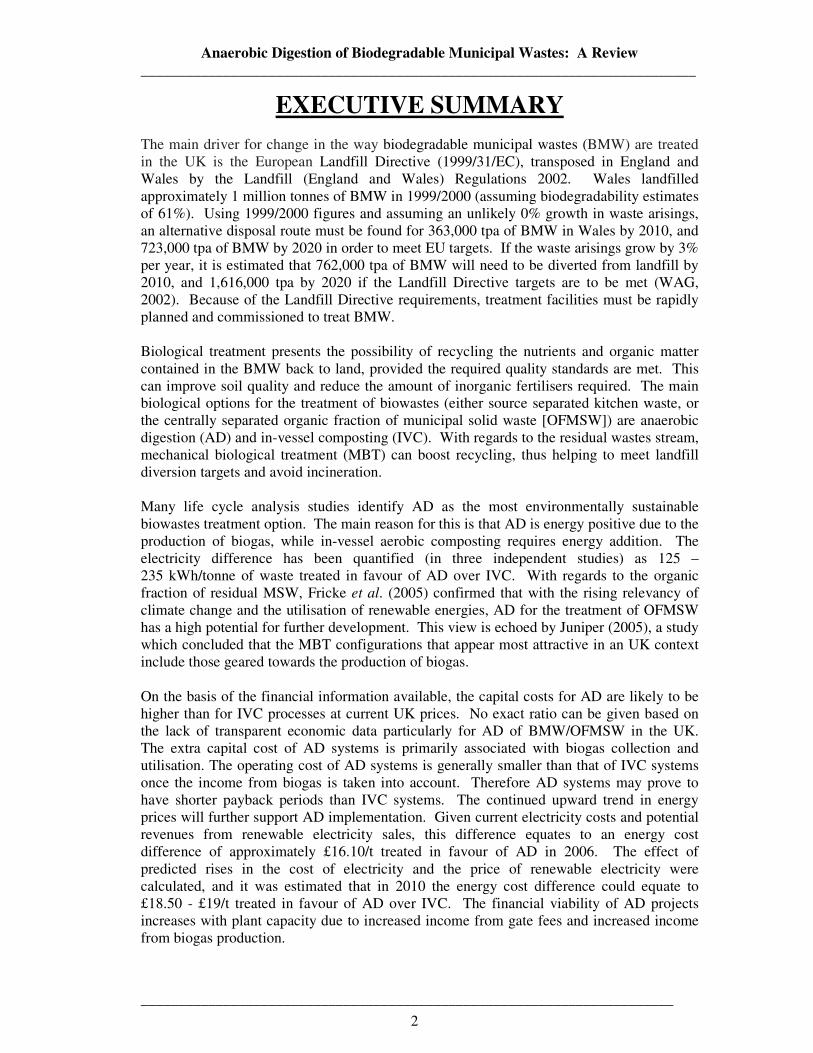
EXECUTIVE SUMMARY
The main driver for change in the way biodegradable municipal wastes (BMW) are treated in the UK is the European Landfill Directive (1999/31/EC), transposed in England and Wales by the Landfill (England and Wales) Regulations 2002. Wales landfilled approximately 1 million tonnes of BMW in 1999/2000 (assuming biodegradability estimates of 61%). Using 1999/2000 figures and assuming an unlikely 0% growth in waste arisings, an alternative disposal route must be found for 363,000 tpa of BMW in Wales by 2010, and 723,000 tpa of BMW by 2020 in order to meet EU targets. If the waste arisings grow by 3% per year, it is estimated that 762,000 tpa of BMW will need to be diverted from landfill by 2010, and 1,616,000 tpa by 2020 if the Landfill Directive targets are to be met (WAG, 2002). Because of the Landfill Directive requirements, treatment facilities must be rapidly planned and commissioned to treat BMW. Biological treatment presents the possibility of recycling the nutrients and organic matter contained in the BMW back to land, provided the required quality standards are met. This can improve soil quality and reduce the amount of inorganic fertilisers required. The main biological options for the treatment of biowastes (either source separated kitchen waste, or the centrally separated organic fraction of municipal solid waste [OFMSW]) are anaerobic digestion (AD) and in-vessel composting (IVC). With regards to the residual wastes stream, mechanical biological treatment (MBT) can boost recycling, thus helping to meet landfill diversion targets and avoid incineration. Many life cycle analysis studies identify AD as the most environmentally sustainable biowastes treatment option. The main reason for this is that AD is energy positive due to the production of biogas, while in-vessel aerobic composting requires energy addition. The electricity difference has been quantified (in three independent studies) as 125 – 235 kWh/tonne of waste treated in favour of AD over IVC. With regards to the organic fraction of residual MSW, Fricke et al. (2005) confirmed that with the rising relevancy of climate change and the utilisation of renewable energies, AD for the treatment of OFMSW has a high potential for further development. This view is echoed by Juniper (2005), a study which concluded that the MBT configurations that appear most attractive in an UK context include those geared towards the production of biogas. On the basis of the financial information available, the capital costs for AD are likely to be higher than for IVC processes at current UK prices. No exact ratio can be given based on the lack of transparent economic data particularly for AD of BMW/OFMSW in the UK. The extra capital cost of AD systems is primarily associated with biogas collection and utilisation. The operating cost of AD systems is generally smaller than that of IVC systems once the income from biogas is taken into account. Therefore AD systems may prove to have shorter payback periods than IVC systems. The continued upward trend in energy prices will further support AD implementation. Given current electricity costs and potential revenues from renewable electricity sales, this difference equates to an energy cost difference of approximately £16.10/t treated in favour of AD in 2006. The effect of predicted rises in the cost of electricity and the price of renewable electricity were calculated, and it was estimated that in 2010 the energy cost difference could equate to £18.50 - £19/t treated in favour of AD over IVC. The financial viability of AD projects increases with plant capacity due to increased income from gate fees and increased income from biogas production.
Anaerobic Digestion of Biodegradable Municipal Wastes: A Review __________________________________________________________________________
_______________________________________________________________________
3
In addition to financial benefits, the use of AD rather than IVC will result in considerable carbon dioxide emission savings from fossil fuel substitution. The average carbon dioxide emission per kWh of electricity produced in the UK is 0.47 kg, after taking into account the different methods of electricity generation (Carbon Calculator website, accessed October 2006). Therefore assuming a difference of 125 – 235 kWh/tonne of waste treated in favour of AD over IVC, carbon dioxide emissions would be reduced by approximately 59 – 110.5 kg CO2 per tonne of BMW/OFMSW treated. For a 100,000 tpa plant, this corresponds to 5900 – 11,050 tpa of carbon dioxide emissions avoided, which over a 20 year operating life corresponds to 118,000 - 221,000 tonnes of carbon dioxide emissions avoided. Anaerobic digestion is a unique technology in that it represents an opportunity to divert BMW from landfill, produce an agriculturally beneficial soil conditioner (depending on the quality of the waste treated) and produce renewable energy. All three of these benefits can significantly reduce greenhouse gas emissions. In addition to BMW treatment, significant possibilities exist to co-digest BMW with other organic wastes, which could tie in other benefits not usually considered relevant to municipal wastes treatment. Anaerobic digesters treating BMW/OFMSW can be used to co-digest other organic wastes, such as sewage sludge, agricultural wastes including manures and spoilt crops, slaughterhouse wastes, industrial organic wastes, and other organic materials available, such as energy crops. Aside from the production of extra biogas (and therefore extra income) and extra soil conditioner (if the quality is high enough) slaughterhouse wastes and industrial organic wastes can attract ever increasing gate fees, further boosting plant economics. The treatment of agricultural wastes can aid nutrient control, reduce odours and improve pathogen reduction in manure. In addition to the production of more biogas (and therefore increased revenue) the possibility of using the renewable heat in district heating schemes or by neighbouring industries can further aid plant economics and reduce fossil fuel use. To date in the UK the uptake of AD to treat BMW/OFMSW has been slow, despite the potential benefits. At present there are only two anaerobic digestion systems operating on municipal wastes in the UK (one in Leicester, treating OFMSW, and one large-pilot scale digester treating source separated kitchen and garden wastes in Shropshire), both of which have been commissioned in the past few years. There are more AD plants treating BMW/OFMSW in the planning and construction phases. In contrast to the UK situation the anaerobic digestion of BMW as a waste management technique has played an important role in the waste strategies of several European nations for some time. The first full scale plants treating OFMSW were commissioned in the late 1980s (in Amiens, France, in 1988 and in Vaasa, Finland, in 1989) and are still successfully operating. As operator knowledge and experience have developed, confidence in the process has grown and more and more anaerobic digestion systems have been commissioned. In continental Europe there are now at least 168 industrial scale anaerobic digesters treating BMW or OFMSW, and the AD of BMW/OFMSW is regarded as an accepted and industrially proven waste management option. This fact is reflected by the large number of plants installed since the year 2000 (at least 35 anaerobic digestion plants treating source separated BMW and at least 40 MBT plants where OFMSW is anaerobically digested). Despite many years of successful operation in continental Europe, the AD of BMW/OFMSW is still regarded as ‘unproven’ in some circles in the UK. The lack of dissemination of the potential benefits and the possibilities of AD for solid wastes treatment to politicians and other decision makers has been identified as one of the major bottlenecks hindering uptake of AD technology (Hartmann and Ahring, 2006).
Anaerobic Digestion of Biodegradable Municipal Wastes: A Review __________________________________________________________________________
_______________________________________________________________________
4
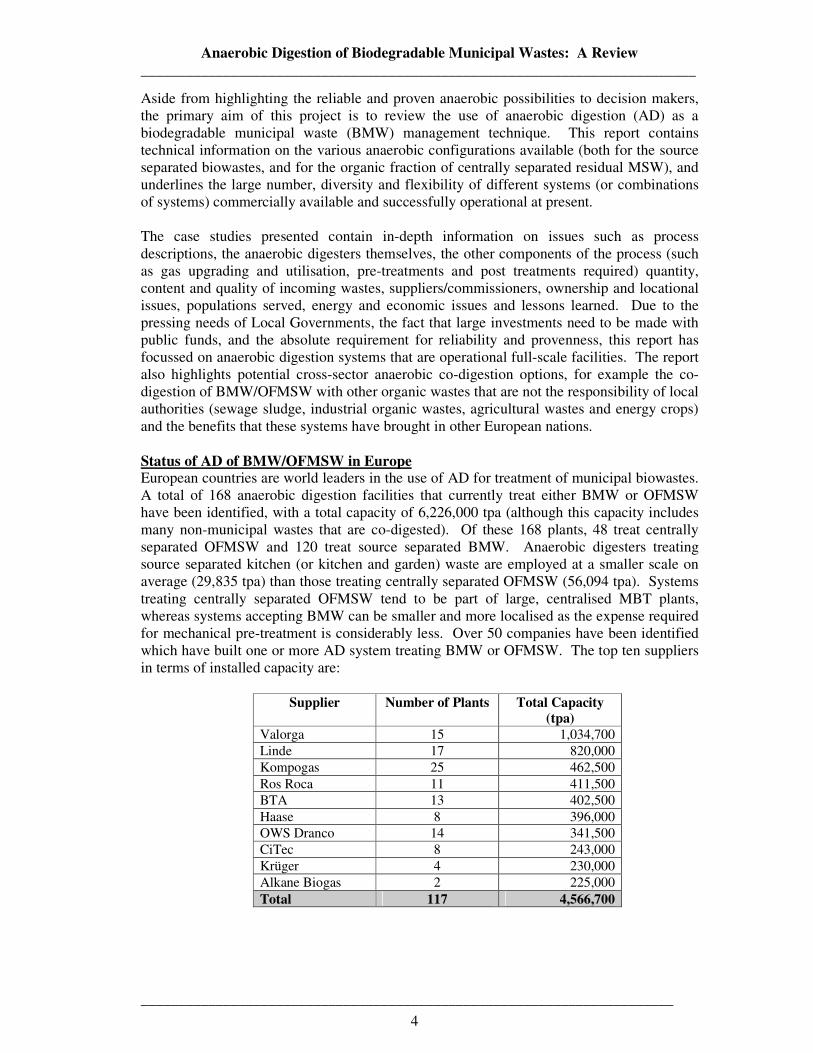
Aside from highlighting the reliable and proven anaerobic possibilities to decision makers, the primary aim of this project is to review the use of anaerobic digestion (AD) as a biodegradable municipal waste (BMW) management technique. This report contains technical information on the various anaerobic configurations available (both for the source separated biowastes, and for the organic fraction of centrally separated residual MSW), and underlines the large number, diversity and flexibility of different systems (or combinations of systems) commercially available and successfully operational at present. The case studies presented contain in-depth information on issues such as process descriptions, the anaerobic digesters themselves, the other components of the process (such as gas upgrading and utilisation, pre-treatments and post treatments required) quantity, content and quality of incoming wastes, suppliers/commissioners, ownership and locational issues, populations served, energy and economic issues and lessons learned. Due to the pressing needs of Local Governments, the fact that large investments need to be made with public funds, and the absolute requirement for reliability and provenness, this report has focussed on anaerobic digestion systems that are operational full-scale facilities. The report also highlights potential cross-sector anaerobic co-digestion options, for example the co-digestion of BMW/OFMSW with other organic wastes that are not the responsibility of local authorities (sewage sludge, industrial organic wastes, agricultural wastes and energy crops) and the benefits that these systems have brought in other European nations. Status of AD of BMW/OFMSW in Europe European countries are world leaders in the use of AD for treatment of municipal biowastes. A total of 168 anaerobic digestion facilities that currently treat either BMW or OFMSW have been identified, with a total capacity of 6,226,000 tpa (although this capacity includes many non-municipal wastes that are co-digested). Of these 168 plants, 48 treat centrally separated OFMSW and 120 treat source separated BMW. Anaerobic digesters treating source separated kitchen (or kitchen and garden) waste are employed at a smaller scale on average (29,835 tpa) than those treating centrally separated OFMSW (56,094 tpa). Systems treating centrally separated OFMSW tend to be part of large, centralised MBT plants, whereas systems accepting BMW can be smaller and more localised as the expense required for mechanical pre-treatment is considerably less. Over 50 companies have been identified which have built one or more AD system treating BMW or OFMSW. The top ten suppliers in terms of installed capacity are:
Supplier Number of Plants Total Capacity (tpa)
Valorga 15 1,034,700 Linde 17 820,000 Kompogas 25 462,500 Ros Roca 11 411,500 BTA 13 402,500 Haase 8 396,000 OWS Dranco 14 341,500 CiTec 8 243,000 Krüger 4 230,000 Alkane Biogas 2 225,000 Total 117 4,566,700
Anaerobic Digestion of Biodegradable Municipal Wastes: A Review __________________________________________________________________________
_______________________________________________________________________
5
Based on a total installed capacity of 6,226,000 tpa, the top ten supplying companies have a market share of 73% (4,566,700 tpa) of the total installed capacity. Kompogas have installed the most plants (25), followed by Linde (17), Valorga (15) and OWS Dranco (14). Although there are anaerobic digesters treating OFMSW that have been running successfully and continuously since the late 1980s, the majority of the development of AD systems accepting BMW or OFMSW has been recent. The total increase in installed capacity since 2000 is around 3,500,000 tpa. In terms of capacity installed since 2000 three companies stand out, Ros Roca with an installed capacity of 622,500 tpa, Valorga with an installed capacity of 560,500 tpa and Linde with an installed capacity of 542,000 tpa. These three companies together have installed 51% of the total AD of municipal organic wastes capacity since the year 2000. In terms of activity in the municipal wastes field in the past six years, five companies stand above the rest of the suppliers. These companies are Kompogas (12 plants built), Ros Roca (11 plants built), Linde (9 plants built), OWS Dranco (7 plants built) and Valorga (7 plants built). All of these companies are currently involved in commissioning new AD of BMW/OFMSW projects, mainly in Europe. Of the 75 plants installed since the year 2000, 35 of these (47%) have been for the treatment of source separated biowastes, and 40 of these (53%) have been for the treatment of centrally separated OFMSW from residual MSW (as part of MBT plants). This even distribution of applications underlines the flexibility of AD systems, and their suitability to treat either source separated organic municipal wastes (to produce usable compost) or to bio-stabilise the organic fraction of residual wastes prior to landfill/thermal treatment. Of the 35 plants installed to treat source separated BMW since 2000, 12 of these (34%) treat only municipal biowastes, while 23 plants (66%) co-digest BMW with other organic wastes. The main wastes co-digested are organic industrial wastes (co-digested at 10 plants), agricultural wastes (co-digested at 4 plants) and sewage sludge (co-digested at 2 plants). The more recent trend is more in favour of co-digestion plants. In 2004, 2005 and in the early parts of 2006, the total number of plants treating source separated BMW installed was 19. Of these, 14 (74%) also accepted other organic wastes, while only 5 (26%) treated BMW alone. Of the 35 anaerobic digesters treating source separated municipal biowaste that have been installed since the year 2000, the plants have been evenly divided between wet digestion systems (18) and dry digestion systems (17). This even distribution mirrors the fact that both wet and dry AD systems have been proven over time to operate successfully. BMW/OFMSW can be treated successfully in both wet and dry systems, but the other available organic wastes (specifically their water content) may prove to be decisive factors in choosing one type of digester over the other. The digesters installed since the year 2000 treating centrally separated OFMSW, 75% (30 of the 40) do not co-digest centrally separated OFMSW with other organic wastes. This is due to the trend towards large centralised MBT plants, particularly in Germany (treating residual municipal waste) and Spain (treating unsorted ‘black bag’ waste). In the 10 (out of a total of 40) plants installed since the year 2000 that do treat other organic wastes, the most common waste co-digested was sewage sludge (co-digested at 5 plants). Of the 40 anaerobic digesters treating centrally separated OFMSW installed since 2000, 29 are ‘wet’ AD systems and 11 are ‘dry’ AD systems.

Anaerobic Digestion of Biodegradable Municipal Wastes: A Review __________________________________________________________________________
_______________________________________________________________________
6
Irrespective of whether they treat BMW or OFMSW, 58 (77%) of the 75 plants built since 2000 operate in the mesophilic temperature range, and 17 (23%) in the thermophilic temperature range. Of the 40 plants installed to treat OFMSW, 36 (90%) operate in the mesophilic temperature range, and 4 (10%) in the thermophilic range. The dominance of processes, treating OFMSW, operating in the mesophilic temperature range is probably because the majority of plants treating OFMSW are wet digestion processes. The lower the total solids content, the more energetically unfavourable it is likely to be to operate in the thermophilic range due to the larger volumes of water that would need to be heated to the higher digestion temperature. With regards to systems treating BMW, more digesters operate in the mesophilic temperature range (22 digesters, or 63%) than in the thermophilic range (13 digesters, or 37%). The higher incidence of thermophilic digesters treating source separated BMW than treating OFMSW (37% compared to 10%) is due to the increased importance attributed to pathogen reduction in systems treating source separated BMW, as the solid output will be intended for land application. As well as decreased retention time attained with improved bacterial activity rate. The high number of thermophilic plants treating source separated BMW is mainly due to Kompogas plants, of which 13 have been built since the year 2000. Germany and Spain have the highest installed AD of BMW/OFMSW capacities (2.29 million tpa and 1.43 million tpa respectively). Between them their installed capacities make up 59% of the total installed capacity in Europe of 6,266,000 tpa. The majority of the anaerobic digester capacity in which source separated biowastes are digested is in Germany (1.8 million tpa of the European total of 3.5 million tpa, which constitutes 51% of the total). Significant digestion capacity has also been installed in Sweden and Switzerland. Spain has the highest installed capacity to treat OFMSW (1.43 million tpa, or 52% of the European total), due to its many large scale centralised MBT plants that incorporate an AD stage. Spain has 18 MBT plants incorporating AD treating OFMSW, with an average capacity of the anaerobic digestion stage of 67,400 tpa. The success of source separation is crucial to the realisation of a quality compost/CLO that can be used on land, and good continuous public education is key to achieving this. Experiences in other countries have shown that the recovery of a good quality source separated organic fraction is possible with significant and continuous expenditure on public education. It has been observed across Europe that the quality of source separation improves with time (as long as public education is ongoing). At the sites visited, the percentages of non-organic contaminants in source separated BMW ranged from less than 0.5% in Västerås (Sweden) to around 10% at Ludlow (UK), although source separation at Ludlow was in the early stages and quality was expected to improve. Provided the quality of the source separation is maintained the CLO from AD will be suitable for land application in the UK. Therefore landfill diversion can be considered to be 95 – 99%, or 100% minus contaminants. AD will produce a similar quality and volume of ‘compost’ to IVC systems (assuming the same wastes are treated), and will therefore incur/generate similar disposal costs or revenues as a similar volume of IVC output. AD has a shorter retention time (even when aerobic post-treatment is required) and therefore requires less space than in-vessel composting to treat the same throughput of wastes. An income from CLO from the AD (or IVC) of BMW may be possible in the UK, but a sustainable income may be unrealistic due to the increasing volumes of CLO available and image concerns over waste derived composts (irrespective of their quality). Markets/disposal routes for CLO should be identified and developed at an early stage in
Anaerobic Digestion of Biodegradable Municipal Wastes: A Review __________________________________________________________________________
_______________________________________________________________________
7
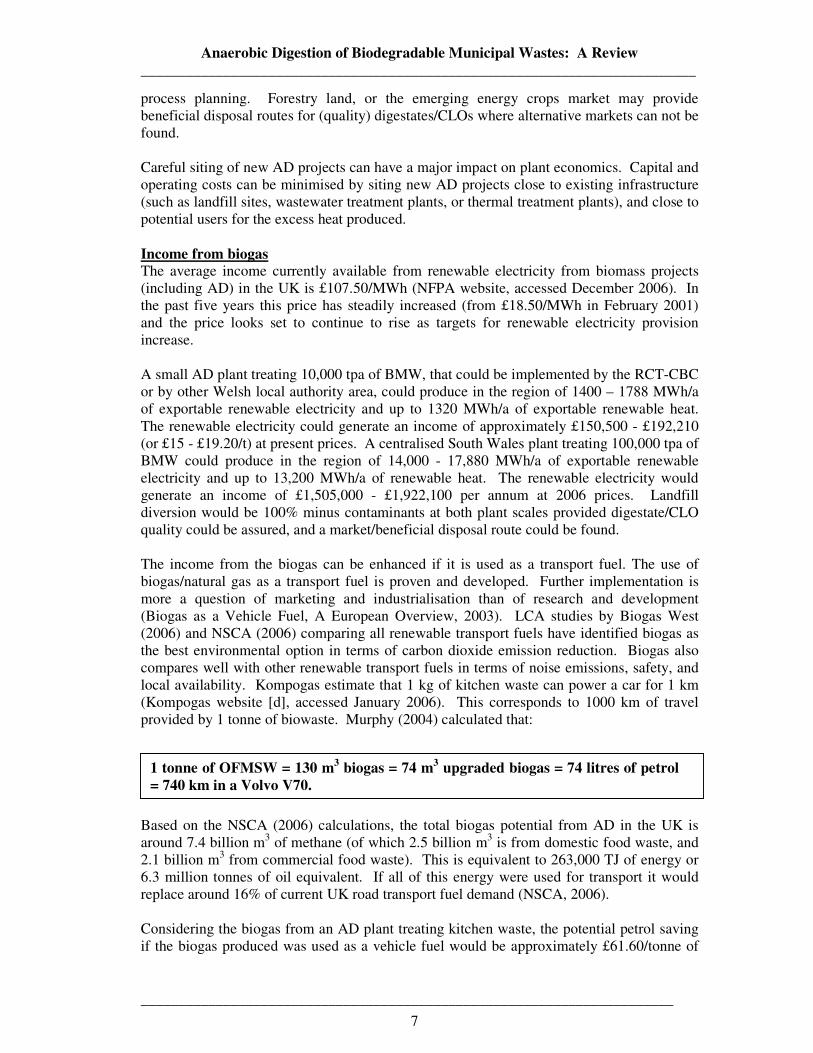
process planning. Forestry land, or the emerging energy crops market may provide beneficial disposal routes for (quality) digestates/CLOs where alternative markets can not be found. Careful siting of new AD projects can have a major impact on plant economics. Capital and operating costs can be minimised by siting new AD projects close to existing infrastructure (such as landfill sites, wastewater treatment plants, or thermal treatment plants), and close to potential users for the excess heat produced. Income from biogas The average income currently available from renewable electricity from biomass projects (including AD) in the UK is £107.50/MWh (NFPA website, accessed December 2006). In the past five years this price has steadily increased (from £18.50/MWh in February 2001) and the price looks set to continue to rise as targets for renewable electricity provision increase. A small AD plant treating 10,000 tpa of BMW, that could be implemented by the RCT-CBC or by other Welsh local authority area, could produce in the region of 1400 – 1788 MWh/a of exportable renewable electricity and up to 1320 MWh/a of exportable renewable heat. The renewable electricity could generate an income of approximately £150,500 - £192,210 (or £15 - £19.20/t) at present prices. A centralised South Wales plant treating 100,000 tpa of BMW could produce in the region of 14,000 - 17,880 MWh/a of exportable renewable electricity and up to 13,200 MWh/a of renewable heat. The renewable electricity would generate an income of £1,505,000 - £1,922,100 per annum at 2006 prices. Landfill diversion would be 100% minus contaminants at both plant scales provided digestate/CLO quality could be assured, and a market/beneficial disposal route could be found. The income from the biogas can be enhanced if it is used as a transport fuel. The use of biogas/natural gas as a transport fuel is proven and developed. Further implementation is more a question of marketing and industrialisation than of research and development (Biogas as a Vehicle Fuel, A European Overview, 2003). LCA studies by Biogas West (2006) and NSCA (2006) comparing all renewable transport fuels have identified biogas as the best environmental option in terms of carbon dioxide emission reduction. Biogas also compares well with other renewable transport fuels in terms of noise emissions, safety, and local availability. Kompogas estimate that 1 kg of kitchen waste can power a car for 1 km (Kompogas website [d], accessed January 2006). This corresponds to 1000 km of travel provided by 1 tonne of biowaste. Murphy (2004) calculated that:
Based on the NSCA (2006) calculations, the total biogas potential from AD in the UK is around 7.4 billion m3 of methane (of which 2.5 billion m3 is from domestic food waste, and 2.1 billion m3 from commercial food waste). This is equivalent to 263,000 TJ of energy or 6.3 million tonnes of oil equivalent. If all of this energy were used for transport it would replace around 16% of current UK road transport fuel demand (NSCA, 2006). Considering the biogas from an AD plant treating kitchen waste, the potential petrol saving if the biogas produced was used as a vehicle fuel would be approximately £61.60/tonne of
1 tonne of OFMSW = 130 m3 biogas = 74 m3 upgraded biogas = 74 litres of petrol = 740 km in a Volvo V70.
Anaerobic Digestion of Biodegradable Municipal Wastes: A Review __________________________________________________________________________
_______________________________________________________________________
8
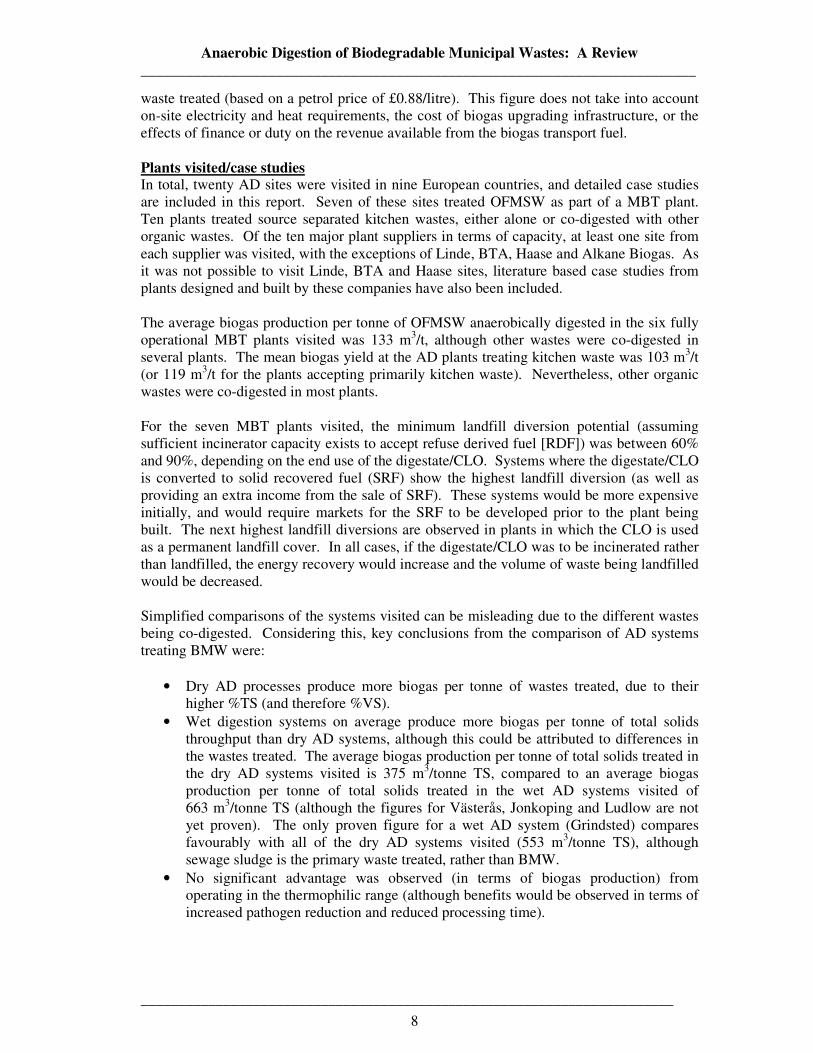
waste treated (based on a petrol price of £0.88/litre). This figure does not take into account on-site electricity and heat requirements, the cost of biogas upgrading infrastructure, or the effects of finance or duty on the revenue available from the biogas transport fuel. Plants visited/case studies In total, twenty AD sites were visited in nine European countries, and detailed case studies are included in this report. Seven of these sites treated OFMSW as part of a MBT plant. Ten plants treated source separated kitchen wastes, either alone or co-digested with other organic wastes. Of the ten major plant suppliers in terms of capacity, at least one site from each supplier was visited, with the exceptions of Linde, BTA, Haase and Alkane Biogas. As it was not possible to visit Linde, BTA and Haase sites, literature based case studies from plants designed and built by these companies have also been included. The average biogas production per tonne of OFMSW anaerobically digested in the six fully operational MBT plants visited was 133 m3/t, although other wastes were co-digested in several plants. The mean biogas yield at the AD plants treating kitchen waste was 103 m3/t (or 119 m3/t for the plants accepting primarily kitchen waste). Nevertheless, other organic wastes were co-digested in most plants. For the seven MBT plants visited, the minimum landfill diversion potential (assuming sufficient incinerator capacity exists to accept refuse derived fuel [RDF]) was between 60% and 90%, depending on the end use of the digestate/CLO. Systems where the digestate/CLO is converted to solid recovered fuel (SRF) show the highest landfill diversion (as well as providing an extra income from the sale of SRF). These systems would be more expensive initially, and would require markets for the SRF to be developed prior to the plant being built. The next highest landfill diversions are observed in plants in which the CLO is used as a permanent landfill cover. In all cases, if the digestate/CLO was to be incinerated rather than landfilled, the energy recovery would increase and the volume of waste being landfilled would be decreased. Simplified comparisons of the systems visited can be misleading due to the different wastes being co-digested. Considering this, key conclusions from the comparison of AD systems treating BMW were:
• Dry AD processes produce more biogas per tonne of wastes treated, due to their higher %TS (and therefore %VS).
• Wet digestion systems on average produce more biogas per tonne of total solids throughput than dry AD systems, although this could be attributed to differences in the wastes treated. The average biogas production per tonne of total solids treated in the dry AD systems visited is 375 m3/tonne TS, compared to an average biogas production per tonne of total solids treated in the wet AD systems visited of 663 m3/tonne TS (although the figures for Västerås, Jonkoping and Ludlow are not yet proven). The only proven figure for a wet AD system (Grindsted) compares favourably with all of the dry AD systems visited (553 m3/tonne TS), although sewage sludge is the primary waste treated, rather than BMW.
• No significant advantage was observed (in terms of biogas production) from operating in the thermophilic range (although benefits would be observed in terms of increased pathogen reduction and reduced processing time).
Anaerobic Digestion of Biodegradable Municipal Wastes: A Review __________________________________________________________________________
_______________________________________________________________________
9
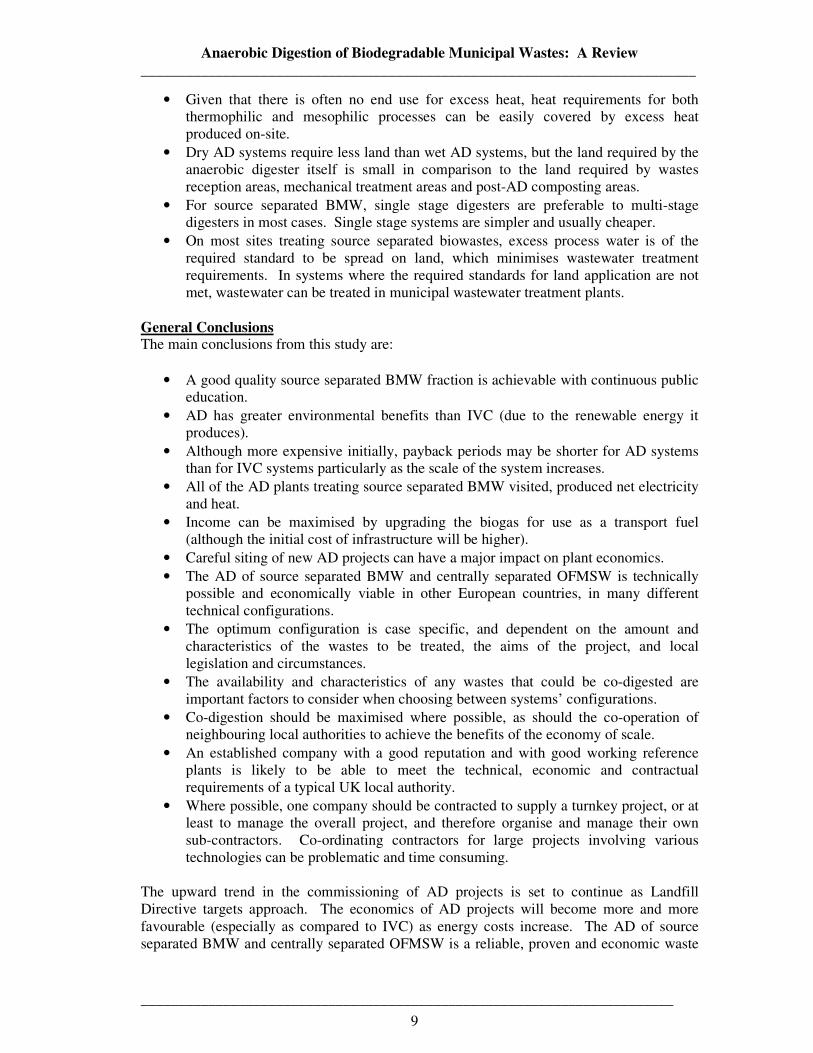
• Given that there is often no end use for excess heat, heat requirements for both thermophilic and mesophilic processes can be easily covered by excess heat produced on-site.
• Dry AD systems require less land than wet AD systems, but the land required by the anaerobic digester itself is small in comparison to the land required by wastes reception areas, mechanical treatment areas and post-AD composting areas.
• For source separated BMW, single stage digesters are preferable to multi-stage digesters in most cases. Single stage systems are simpler and usually cheaper.
• On most sites treating source separated biowastes, excess process water is of the required standard to be spread on land, which minimises wastewater treatment requirements. In systems where the required standards for land application are not met, wastewater can be treated in municipal wastewater treatment plants.
General Conclusions The main conclusions from this study are:
• A good quality source separated BMW fraction is achievable with continuous public education.
• AD has greater environmental benefits than IVC (due to the renewable energy it produces).
• Although more expensive initially, payback periods may be shorter for AD systems than for IVC systems particularly as the scale of the system increases.
• All of the AD plants treating source separated BMW visited, produced net electricity and heat.
• Income can be maximised by upgrading the biogas for use as a transport fuel (although the initial cost of infrastructure will be higher).
• Careful siting of new AD projects can have a major impact on plant economics. • The AD of source separated BMW and centrally separated OFMSW is technically
possible and economically viable in other European countries, in many different technical configurations.
• The optimum configuration is case specific, and dependent on the amount and characteristics of the wastes to be treated, the aims of the project, and local legislation and circumstances.
• The availability and characteristics of any wastes that could be co-digested are important factors to consider when choosing between systems’ configurations.
• Co-digestion should be maximised where possible, as should the co-operation of neighbouring local authorities to achieve the benefits of the economy of scale.
• An established company with a good reputation and with good working reference plants is likely to be able to meet the technical, economic and contractual requirements of a typical UK local authority.
• Where possible, one company should be contracted to supply a turnkey project, or at least to manage the overall project, and therefore organise and manage their own sub-contractors. Co-ordinating contractors for large projects involving various technologies can be problematic and time consuming.
The upward trend in the commissioning of AD projects is set to continue as Landfill Directive targets approach. The economics of AD projects will become more and more favourable (especially as compared to IVC) as energy costs increase. The AD of source separated BMW and centrally separated OFMSW is a reliable, proven and economic waste
Anaerobic Digestion of Biodegradable Municipal Wastes: A Review __________________________________________________________________________
_______________________________________________________________________
10
treatment technique, as can be evidenced by the many successfully operating plants around Europe. Due to its many positive impacts, anaerobic digestion must be considered as a key technology in terms of the movement towards a more sustainable society.
Anaerobic Digestion of Biodegradable Municipal Wastes: A Review __________________________________________________________________________
_______________________________________________________________________
11
ACKNOWLEDGEMENTS
The review project was partly funded by the Welsh Assembly Government and Rhondda Cynon Taff County Borough Council. Many thanks must go to our ‘contacts’ on each site visited throughout Europe. These representatives of AD suppliers or wastes treatment companies kindly committed their time before, during and after the site visits. Thanks are also due to many other contacts throughout the UK and Europe who provided information and advice throughout the project. The authors would also like to acknowledge the information provided on waste management policy and legislation by members of staff of the Infrastructure and Technologies Waste Strategy Branch (Welsh Assembly Government) namely Adrian Jones. The authors would like to sincerely thank Hock Siong Chong for his hard work in putting the DVD together and to Beth Pearce (Copyrights Officer, University of Glamorgan) for her assistance on copyrights issues. Thanks are due to Simon Cullen (Sound Technician, University of Glamorgan) for his expert technical help in producing the audio clips for the DVD in the University of Glamorgan recording studios. Images and information in the DVD are reproduced with kind permission of the following companies:
• Ab ASJ Oy (Stormossen) • Greenfinch • Grindsted Municipality • Horstmann GmbH • ISKA • Intercommunale de Traitement de Dechets (ITRADEC) • Kompogas • LinkoGas AP • OWS Dranco • IGEAN milieu & veiligheid • Ros Roca • Salzburger Abfallbeseitigung (SAB) • Scheidings en Bewekings Installatie Friesland (SBI Friesland) • Summerleaze • Svensk Biogas AP • Svensk Växtkraft AB • Zweckverband Abfallbehandlung Kahlenberg (ZAK)
Anaerobic Digestion of Biodegradable Municipal Wastes: A Review __________________________________________________________________________
_______________________________________________________________________
12
CONTENTS
LEGAL NOTICE ............................................................................................................................................... 1
EXECUTIVE SUMMARY ................................................................................................................................ 2
ACKNOWLEDGEMENTS ............................................................................................................................. 11
CONTENTS ...................................................................................................................................................... 12
LIST OF FIGURES .......................................................................................................................................... 15
LIST OF TABLES ............................................................................................................................................ 24
MAIN ABBREVIATIONS .............................................................................................................................. 27
1.0 INTRODUCTION .............................................................................................................................. 28
2.0 LITERATURE REVIEW .................................................................................................................. 33
2.1 DRIVERS FOR CHANGE ...................................................................................................................... 33 2.2 BIODEGRADABLE MUNICIPAL WASTES TREATMENT OPTIONS ........................................................... 35 2.3 BIOLOGICAL OPTIONS FOR THE TREATMENT OF BIOWASTES ............................................................. 37
2.3.1 Animal By-products Regulations (ABPR) ................................................................................... 37 2.3.2 Comparisons of AD and IVC systems ......................................................................................... 39
2.3.2.2 AD and IVC: An environmental comparison .................................................................................. 39 2.3.2.3 AD and IVC: An economic comparison .......................................................................................... 42 2.3.2.4 Summary of Comparison of AD and IVC ........................................................................................ 51
2.4 BIOLOGY AND TECHNOLOGY OF ANAEROBIC DIGESTION ................................................................ 53 2.4.1 Introduction to the microbiology of anaerobic digestion ........................................................... 53
2.4.1.1 Interspecies hydrogen transfer .......................................................................................................... 58 2.4.1.2 Interspecies formate transfer ............................................................................................................ 58 2.4.1.3 Response of methanogens to stress .................................................................................................. 59
2.4.2 Process Parameters .................................................................................................................... 59 2.4.2.1 Temperature ..................................................................................................................................... 60 2.4.2.2 pH ranges ......................................................................................................................................... 61 2.4.2.3 Buffering capacity ............................................................................................................................ 62 2.4.2.5 Nutrient requirements ....................................................................................................................... 62 2.4.2.6 Toxicity and inhibitory substances ................................................................................................... 63 2.4.2.7 Volatile Fatty Acids (VFAs) and inhibition ..................................................................................... 65 2.4.2.8 Hydraulic retention time (HRT) and solids retention time (SRT) .................................................... 66 2.4.2.9 Feed composition, strength and rate of addition ............................................................................... 67 2.4.2.10 Solids content ................................................................................................................................... 67 2.4.2.11 Mixing .............................................................................................................................................. 68 2.4.2.12 Monitoring and control ..................................................................................................................... 70
2.5 SUITABLE WASTES FOR ANAEROBIC DIGESTION .............................................................................. 71 2.5.1 BMW or OFMSW ........................................................................................................................ 72 2.5.2 Commercial organic waste ......................................................................................................... 73 2.5.3 Organic industrial waste ............................................................................................................ 74 2.5.4 Agricultural wastes (manures, slurries) ..................................................................................... 74 2.5.5 Abattoir wastes ........................................................................................................................... 76 2.5.6 Sewage sludge............................................................................................................................. 76 2.5.7 Energy crops ............................................................................................................................... 77 2.5.8 Glycerol from biodiesel production ............................................................................................ 78
2.6 ANAEROBIC DIGESTION OF MUNICIPAL BIOWASTES – END PRODUCTS ........................................... 78 2.6.1 Biogas ......................................................................................................................................... 78
2.6.1.1 Introduction to biogas ....................................................................................................................... 78 2.6.1.2 Biogas production potentials from different organic wastes ............................................................ 79 2.6.1.3 On-site electricity and heat requirements ......................................................................................... 84 2.6.1.4 Biogas upgrading ............................................................................................................................. 85 2.6.1.5 Biogas utilisation .............................................................................................................................. 86 2.6.1.6 Renewable electricity ....................................................................................................................... 87 2.6.1.7 Renewable heat ................................................................................................................................ 90 2.6.1.8 Biogas as a transport fuel ................................................................................................................. 92
2.6.2 Digestate ................................................................................................................................... 114
Anaerobic Digestion of Biodegradable Municipal Wastes: A Review __________________________________________________________________________
_______________________________________________________________________
13
2.6.2.1 The utilisation of digestate as a solid fuel ...................................................................................... 118 2.6.2.2 Digestate, possible contamination .................................................................................................. 119 2.6.2.3 Digestate, potential future markets and trends................................................................................ 120
2.6.3 AD liquor .................................................................................................................................. 121 2.6.4 Other end products from the anaerobic digestion of municipal biowastes ............................... 122
2.6.4.1 Recyclates from mechanical separation stages ............................................................................... 122 2.6.4.2 Exhaust gases ................................................................................................................................. 122
2.7 TYPES OF ANAEROBIC DIGESTER FOR SOLID WASTES ................................................................... 123 2.7.1 Mesophilic or thermophilic operational temperature ........................................................................... 125 2.7.2 Wet or dry digestion ............................................................................................................................ 126 2.7.3 Single step/multi-step digestion ........................................................................................................... 130 2.7.4 Batch or continuous feeding ................................................................................................................ 132
2.8 OTHER ESSENTIAL PARTS OF ANAEROBIC DIGESTION SYSTEMS TREATING BIODEGRADABLE MUNICIPAL WASTES .................................................................................................................................... 135
2.8.1 Pre-treatment ............................................................................................................................ 136 2.8.2 Post AD treatment .................................................................................................................... 138 2.8.3 De-watering .............................................................................................................................. 139 2.8.4 Aerobic maturation/composting ............................................................................................... 139 2.8.5 Wastewater treatment ............................................................................................................... 140 2.8.6 Biogas de-sulphurisation .......................................................................................................... 140 2.8.7 Biogas utilisation ...................................................................................................................... 140 2.8.8 Exhaust gas treatment/odour control ....................................................................................... 141
2.9 PLANT SITING CONSIDERATIONS .................................................................................................... 142 2.10 INTRODUCTION TO CONTRACTUAL AND FINANCING ISSUES........................................................... 144
3.0 ANAEROBIC DIGESTION TRENDS ........................................................................................... 146 3.1 TRENDS IN NEW AD OF BMW/OFMSW INSTALLATIONS .............................................................. 150
4.0 SUPPLIERS OF AD SYSTEMS TREATING BMW/OFMSW ................................................... 161
4.1 PROFILES OF MAJOR SUPPLIERS ...................................................................................................... 166 4.1.1 BTA ........................................................................................................................................... 166 4.1.2 CiTec......................................................................................................................................... 168 4.1.3 HAASE ...................................................................................................................................... 170 4.1.4 HESE ........................................................................................................................................ 172 4.1.5 ISKA .......................................................................................................................................... 173 4.1.6 Kompogas AG ........................................................................................................................... 174 4.1.7 Krüger....................................................................................................................................... 177 4.1.8 Linde ......................................................................................................................................... 178 4.1.9 OWS Dranco ............................................................................................................................. 180 4.1.10 Ros Roca .............................................................................................................................. 182 4.1.11 Valorga ................................................................................................................................ 184 4.1.12 Other Suppliers .................................................................................................................... 185
5.0 CASE STUDIES ............................................................................................................................... 189
INTRODUCTION TO CASE STUDIES ................................................................................................................. 189 5.1 CASE STUDIES OF SYSTEMS TREATING SOURCE SEPARATED BIOWASTES ........................................ 194
5.1.1 Brecht (IGEAN) Biowaste Treatment Plant .............................................................................. 194 5.1.2 Grindsted Organic Wastes Treatment Plant ............................................................................. 204 5.1.3 Jonkoping (Jonkopings Kommun) Biowastes Treatment Plant ................................................ 221 5.1.4 Ludlow (Greenfinch) Trial Scale Kitchen Waste Treatment Plant ........................................... 235 5.1.5 Kompogas Biowastes Treatment Sites in Zurich ...................................................................... 246
5.1.5.1 Oetwil Am See (Kompogas) Biowastes Treatment Plant ............................................................... 248 5.1.5.2 Niederuzwil (Kompogas) Biowastes Treatment Plant .................................................................... 256 5.1.5.3 Otelfingen (Kompogas) Biowastes Treatment Plant ...................................................................... 264 5.1.5.4 Kompogas Biowaste Treatment Plant Case Studies – Discussions and Conclusions ..................... 274
5.1.6 Salzburg Siggerwiesen Wastes Treatment Site ......................................................................... 278 5.1.7 Vaasa (Stormossen) Wastes Treatment Plant ........................................................................... 298 5.1.8 Västerås (Växtkraft) Biogas Plant ............................................................................................ 316
5.2 CASE STUDIES OF SYSTEMS TREATING CENTRALLY SEPARATED OFMSW AS PART OF A MBT PLANT . ....................................................................................................................................................... 349
5.2.1 Buchen (U-Plus UmweltService AG) MBT Plant ..................................................................... 349
Anaerobic Digestion of Biodegradable Municipal Wastes: A Review __________________________________________________________________________
_______________________________________________________________________
14
5.2.2 Heilbronn (U-Plus UmweltService AG) MBT Plant ................................................................. 363 5.2.3 Heerenveen (SBI Friesland) MBT Plant ................................................................................... 374 5.2.4 Mons (ITRADEC) MBT Plant ................................................................................................... 385 5.2.5 Pohlsche Heide (AML) MBT Plant ........................................................................................... 401 5.2.6 Saschenhagen (AWS) MBT Plant ............................................................................................. 414 5.2.7 Kahlenberg (ZAK) MBT Plant .................................................................................................. 422
5.3 CASE STUDIES FROM OTHER ANAEROBIC WASTES TREATMENT SYSTEMS ....................................... 436 5.3.1 Holsworthy (Summerleaze) Biogas Plant ................................................................................. 436 5.3.2 Linkoping (Svensk Biogas) Biogas Plant .................................................................................. 445 5.3.3 Lintrup (LinkoGas) Biogas Plant ............................................................................................. 455
5.4 LITERATURE BASED CASE STUDIES ................................................................................................. 467 5.4.1 Ypres (IVVO) Biowastes Treatment Plant ................................................................................ 468 5.4.2 Lemgo (Linde) Biowastes Treatment Plant ............................................................................... 472 5.4.3 Lisbon Region (Valorsul) Biowastes Treatment Plant .............................................................. 475 5.4.4 Wels (Linde) Biowastes Treatment Plant .................................................................................. 484 5.4.5 Luebeck (Entsorgungsbetriebe Luebeck) MBT Plant ............................................................... 487
6.0 CRITICAL COMPARISONS OF CASE STUDIES ..................................................................... 493
INTRODUCTION TO COMPARISONS ................................................................................................................ 493 6.1 COMPARING ANAEROBIC DIGESTION SYSTEMS TREATING SOURCE SEPARATED BMW ................... 493
6.1.1 Capital cost comparison for biowastes treatment plants .......................................................... 494 6.1.2 Operating cost comparison for biowastes treatment plants ..................................................... 497 6.1.3 Comparison of biogas production in systems treating source separated biowastes ................. 498 6.1.4 Comparison of energy production in biowastes treatment plants ............................................ 504 6.1.5 Potential incomes from biogas produced ................................................................................. 510 6.1.6 Landfill diversion potential in AD systems treating source separated biowastes ..................... 513 6.1.7 Comparison of water requirements .......................................................................................... 515 6.1.8 Comparison of wastewater production and treatment .............................................................. 516 6.1.9 Space requirements ................................................................................................................... 517 6.1.10 Summary of comparison of AD systems treating source separated BMW ........................... 518
6.2 COMPARISON OF MBT PLANTS TREATING CENTRALLY SEPARATED OFMSW ................................ 521 6.2.1 Comparison of mass balances for MBT plants ......................................................................... 522 6.2.2 Comparison of landfill diversion of MBT plants ...................................................................... 524 6.2.3 Comparison of biogas production for MBT plants ................................................................... 527 6.2.4 Comparison of energy balances for MBT plants ...................................................................... 530 6.2.5 Total energy recovery potential ................................................................................................ 534 6.2.6 Comparison of water requirements and wastewater production for MBT plants ..................... 534 6.2.7 Comparison of space requirements for MBT plants ................................................................. 539 6.2.8 Comparison of residence times for MBT plants ....................................................................... 543 6.2.9 Comparison of capital costs for MBT plants ............................................................................ 545 6.2.10 Comparison of operating costs for MBT plants ................................................................... 548 6.2.11 Summary of comparison of AD systems treating centrally separated OFMSW ................... 551
7.0 POSSIBILITIES FOR BIOLOGICAL TREATMENT OF BMW IN RCT CBC AND SOUTH WALES - UK .................................................................................................................................................. 553
7.1 EXAMPLES OF THE POTENTIAL FOR BIOGAS AS A TRANSPORT FUEL IN AD SYSTEMS TREATING 10,000
TPA AND 100,000 TPA OF KITCHEN WASTES .................................................................................................. 560
8.0 LESSONS LEARNED AND CONCLUSIONS .............................................................................. 564
8.1 LESSONS LEARNED FROM EUROPEAN EXPERIENCES ....................................................................... 564 8.2 CONCLUSIONS ................................................................................................................................ 569
9.0 REFERENCES ................................................................................................................................. 577
APPENDIX 1 .................................................................................................................................................. 598
APPENDIX 2 .................................................................................................................................................. 605
Anaerobic Digestion of Biodegradable Municipal Wastes: A Review __________________________________________________________________________
_______________________________________________________________________
15
LIST OF FIGURES Figure 1 Major steps in anaerobic decomposition (adapted from Gray, 1999)............ 54 Figure 2 Graphical representation of the hydrogen-dependant thermodynamic
favourability of acetogenic oxidations and inorganic respirations associated with the anaerobic degradation of waste organics (from Harper and Pohland, 1986) .......................................................................................................... 56
Figure 3 Average prices for renewable energy from different sources since 2001 ...... 89 Figure 4 Average prices for renewable energy from different sources since 2001 ...... 90 Figure 5 Well to wheel greenhouse gas emissions for a bus (reproduced with
permission from Biogas West, 2006) .......................................................... 95 Figure 6 Well to wheel greenhouse gas emissions for a passenger car (reproduced with
permission from NSCA, 2006) .................................................................... 96 Figure 7 Well to wheel greenhouse gas emissions for a HGV (Reproduced with
permission from NSCA, 2006) .................................................................... 97 Figure 8 Tailpipe emission comparisons compared to petrol (figures from Biogas
Cities, Biogas West) ................................................................................... 98 Figure 9 How many kilometres can a car be driven on biomass from one hectare of
land (Reproduced with permission from Biogas West, 2006) ...................... 99 Figure 10 Bi-fuel Volvo V70 .................................................................................... 104 Figure 11 Biogas train (at Linkoping) ....................................................................... 107 Figure 12 Compressors at Västerås Bus Depot .......................................................... 108 Figure 13 Compressed biogas storage tanks .............................................................. 108 Figure 14 Ventilated gas storage building ................................................................. 109 Figure 15 Overnight ‘docking stations’ at bus depot ................................................. 110 Figure 16 Public biogas filling station at Simsholmen (Jonkoping, Sweden) ............. 111 Figure 17 Closer view of the public biogas filling station at Simsholmen (Jonkoping,
Sweden) .................................................................................................... 111 Figure 18 Biogas re-fuelling station nozzle, and re-fuelling point/petrol cap on bi-fuel
Volvo V70 ................................................................................................ 112 Figure 19 Costs of methane production in terms of petrol equivalent (Biogas West,
2006) ........................................................................................................ 113 Figure 20 Schematic diagram of the closed cycle of AD of biowastes and the three main
steps (A, B and C) of the quality management of digestate (Al Seadi et al., 2001) ........................................................................................................ 116
Figure 21 Annual and cumulative capacity of AD plants treating municipal biowaste installed in Europe .................................................................................... 151
Figure 22 Annual breakdown in Europe of (municipal) wastes treated in AD plants installed since the year 2000 ..................................................................... 151
Figure 23 Number of plants co-digesting BMW with other organic wastes in Europe 152 Figure 24 Number of plants co-digesting centrally separated OFMSW with other
organic wastes .......................................................................................... 153 Figure 25 Wet and dry AD plants treating BMW or OFMSW installed since the year
2000.......................................................................................................... 154 Figure 26 Temperature range of plants installed since the year 2000 in Europe ......... 154 Figure 27 Scale of AD plants treating source separated biowastes in Europe ............. 155 Figure 28 Scale of anaerobic digesters treating BMW, built since the year 2000 in
Europe ...................................................................................................... 156 Figure 29 Scale of AD plants treating OFMSW in Europe ........................................ 157
Anaerobic Digestion of Biodegradable Municipal Wastes: A Review __________________________________________________________________________
_______________________________________________________________________
16
Figure 30 Scale of anaerobic digesters treating OFMSW, built since the year 2000 ... 157 Figure 31 Total AD capacity treating municipal biowastes per country in 2006 ........ 158 Figure 32 Total AD capacity treating source separated BMW per country in 2006 .... 158 Figure 33 Total AD capacity treating centrally separated OFMSW per country in 2006
................................................................................................................. 159 Figure 34 All suppliers of anaerobic digestion plants that treat organic municipal wastes
in Europe .................................................................................................. 161 Figure 35 Installed AD capacity of main anaerobic system suppliers ........................ 162 Figure 36 Number of plants built by major AD suppliers .......................................... 163 Figure 37 Average capacity of a plant built by each of the major suppliers ............... 164 Figure 38 Capacity of plants built in Europe by each supplier since 2000 ................. 165 Figure 39 Number of plants built in Europe by each supplier since 2000 ................... 165 Figure 40 Location of sites visited (map from Wikipedia website, accessed September
2006) ........................................................................................................ 193 Figure 41 Aerial photograph of Brecht (digestion plant 2) (OWS Dranco Promotional
Information) .............................................................................................. 194 Figure 42 Incoming biowastes stream ....................................................................... 195 Figure 43 Brecht digestion plant 2 process flow diagram (OWS Dranco website,
accessed November 2005) ......................................................................... 196 Figure 44 Wastes reception hall ................................................................................ 196 Figure 45 Communiting drum ................................................................................... 197 Figure 46 Inside of communiting drum ..................................................................... 198 Figure 47 Metallic contaminants ............................................................................... 198 Figure 48 Pre-treated waste stream ........................................................................... 199 Figure 49 Dranco anaerobic digester at Brecht .......................................................... 200 Figure 50 Overhead conveyor to in-vessel composting hall ....................................... 201 Figure 51 Inside in-vessel composting hall................................................................ 201 Figure 52 Aerial photograph of Grindsted Wastes and Wastewater Treatment Plant . 204 Figure 53 Paper bags for kitchen waste collection (Bro, 2006) .................................. 205 Figure 54 Paper bags in the wastes reception pit (Bro, 2006) .................................... 206 Figure 55 Grindsted Wastewater and Biowastes Treatment Plant process flow diagram
(Al Seadi et al., 2001) ............................................................................... 207 Figure 56 Wastes treatment plant pre-treatment stages (Bro, 2006) ........................... 208 Figure 57 Industrial wastes reception tank ................................................................ 209 Figure 58 Anaerobic digester and wastes processing buildings .................................. 210 Figure 59 Belt-press .................................................................................................. 211 Figure 60 De-watered digestate ................................................................................. 212 Figure 61 Inside digestate storage building (Bro, 2006) ............................................ 212 Figure 62 Digestate composting and storage hall ...................................................... 213 Figure 63 Tables 9 and 10 from Al Seadi et al. (2001) .............................................. 214 Figure 64 Grindsted wastewater treatment plant: biomass flow diagram and the main
separation steps (A, B, C and D) (Al Seadi et al. 2001) ............................. 215 Figure 65 Torsvik municipal wastes incinerator (biowastes pre-treatment plant on the
left) ........................................................................................................... 223 Figure 66 Torsvik biowastes pre-treatment plant (adjacent to municipal wastes
incinerator) ............................................................................................... 223 Figure 67 Torsvik organic household wastes pre-treatment plant process flow diagram
................................................................................................................. 224 Figure 68 Wastes reception pit at Torsvik ................................................................. 225 Figure 69 Pasteurisation tanks and process water tanks at Torsvik ............................ 226
Anaerobic Digestion of Biodegradable Municipal Wastes: A Review __________________________________________________________________________
_______________________________________________________________________
17
Figure 70 Pre-treated biowaste, as transported to Simsholmen from Torsvik. (Kall, 2006) ........................................................................................................ 226
Figure 71 Anaerobic digesters at Simsholmen ........................................................... 227 Figure 72 Biogas storage unit, before upgrading and compression (foreground), and
anaerobic digesters (background) .............................................................. 229 Figure 73 Biogas upgrading unit at Simsholmen ....................................................... 229 Figure 74 Inside biogas upgrading unit ..................................................................... 230 Figure 75 Upgraded biogas storage at Simsholmen ................................................... 230 Figure 76 Public biogas filling station at Simsholmen (1) ......................................... 231 Figure 77 Public biogas filling station at Simsholmen (2) ......................................... 232 Figure 78 Illustration of aerial view of Ludlow Biowastes Treatment Plant (Greenfinch
website, accessed April 2006) ................................................................... 235 Figure 79 South Shropshire Biogas Plant process flow diagram (Greenfinch website,
accessed July 2006) .................................................................................. 236 Figure 80 South Shropshire biogas plant, artists impression (Greenfinch website,
accessed July 2006) .................................................................................. 237 Figure 81 Weighbridge and entrance to waste reception area .................................... 238 Figure 82 Wastes reception area (mixing tank and ‘Bobcat’) ..................................... 239 Figure 83 Mixing tank (shredder and waste reception area entrance) ......................... 239 Figure 84 Pasteurisation tank (with gas storage tank in background and digester on the
right) ......................................................................................................... 241 Figure 85 Mass balance (Greenfinch website, accessed April 2006) .......................... 242 Figure 86 Pre-treatment at Oetwil Am See ................................................................ 249 Figure 87 Mixing unit ............................................................................................... 249 Figure 88 Food wastes reception tank ....................................................................... 250 Figure 89 Metals removed from food wastes ............................................................. 250 Figure 90 Kompogas anaerobic digester at Oetwil Am See ....................................... 251 Figure 91 Liquid fertiliser storage tank ..................................................................... 252 Figure 92 Covered composting bays ......................................................................... 253 Figure 93 Aerated floors in covered composting bays ............................................... 253 Figure 94 Biogas utilisation unit, containing Jenbacher engine.................................. 254 Figure 95 Wastes reception pit .................................................................................. 256 Figure 96 Mobile shredding unit ............................................................................... 257 Figure 97 Two anaerobic digesters at Niederuzwil .................................................... 258 Figure 98 Screw presses............................................................................................ 259 Figure 99 Covered composting bays ......................................................................... 259 Figure 100 High quality compost for commercial distribution ..................................... 260 Figure 101 Medium quality compost for sale to the public on-site............................... 260 Figure 102 Prices for public compost collection on-site .............................................. 261 Figure 103 Biofilter at Niederuzwil ............................................................................ 262 Figure 104 Kompogas biowastes treatment plant at Otelfingen ................................... 265 Figure 105 Kompogas Visitor Centre at Otelfingen ..................................................... 265 Figure 106 Inside greenhouse at Otelfingen ................................................................ 266 Figure 107 Inside greenhouse at Otelfingen, showing crops growing from digestate ... 266 Figure 108 Wastes reception pit and picking crane...................................................... 267 Figure 109 Thoni in-vessel composting system at Otelfingen ...................................... 268 Figure 110 Public compost pick-up point at Otelfingen ............................................... 269 Figure 111 Final compost from Otelfingen (one of many grades) ................................ 270 Figure 112 Biogas storage at filling station at Otelfingen ............................................ 271 Figure 113 Biogas filling station at Otelfingen ............................................................ 272
Anaerobic Digestion of Biodegradable Municipal Wastes: A Review __________________________________________________________________________
_______________________________________________________________________
18
Figure 114 Mobile shredder ........................................................................................ 274 Figure 115 Mass balance of Kompogas MBT systems, treating residual wastes
(Kompogas website [c], accessed August 2006) ........................................ 277 Figure 116 SAB Siggerwiesen aerial photograph ........................................................ 279 Figure 117 SAB Siggerwiesen MBT and landfill site plan (SAB website, accessed
January 2006) ........................................................................................... 280 Figure 118 ‘Focus: Umwelt’ SAB Siggerwiesen Visitor Centre .................................. 281 Figure 119 Biowaste treatment line process flow diagram (SAB Salzburg website,
accessed January 2006) ............................................................................. 282 Figure 120 Municipal biowaste as delivered to wastes reception pit ............................ 283 Figure 121 Weighbridge ............................................................................................. 284 Figure 122 Wastes reception pit .................................................................................. 285 Figure 123 Manual sorting station ............................................................................... 285 Figure 124 Example of biowaste contaminants ........................................................... 286 Figure 125 Trommel sieve .......................................................................................... 286 Figure 126 Mixing tank and anaerobic digester ........................................................... 288 Figure 127 Dranco digester ......................................................................................... 289 Figure 128 Putzmeister pump ..................................................................................... 290 Figure 129 Screw press de-watering ........................................................................... 291 Figure 130 Screw pump to conveyor belt to in-vessel composter ................................ 292 Figure 131 Final digestate/compost ............................................................................. 292 Figure 132 Mechanical separation and tunnel composting of residual MSW (SAB
website, accessed January 2006) ............................................................... 295 Figure 133 Destination of mechanically separated and composted waste streams (SAB
website, accessed January 2006) ............................................................... 296 Figure 134 Finnish kitchen waste (Akers, 2006) ......................................................... 299 Figure 135 Stormossen and shareholding municipalities ............................................. 299 Figure 136 Contaminants removed from source separated ‘kitchen waste’ .................. 300 Figure 137 Stormossen site layout diagram (Stormossen website, accessed July 2006) 302 Figure 138 Stormossen aerial photograph ................................................................... 303 Figure 139 Stormossen wastes treatment plant ............................................................ 303 Figure 140 Stormossen ‘kitchen wastes’ pre-treatment plant process flow diagram
(Akers, 2006) ............................................................................................ 304 Figure 141 Weighbridge at Stormossen ...................................................................... 305 Figure 142 Wastes reception pit at Stormossen ........................................................... 305 Figure 143 Emergency wastes reception area, dropping into wastes reception pit ........ 306 Figure 144 Mini-crane for removal of large non-organic contaminants ....................... 306 Figure 145 Bottom of the mix-separator ...................................................................... 307 Figure 146 Anaerobic biowaste digester ..................................................................... 308 Figure 147 Biogas storage tank ................................................................................... 309 Figure 148 Pelletised combustible fraction of Vaasa’s waste ....................................... 310 Figure 149 Windrow composting of unsorted MSW and digestate at Stormossen ....... 311 Figure 150 Windrow composting of kitchen waste at Stormossen ............................... 313 Figure 151 Chart showing ownership of the Växtkraft Biogas Plant (Persson, 2006) ... 316 Figure 152 Overall simplification of system (Persson, 2006) ...................................... 317 Figure 153 Location of Växtkraft Biogas Plant in relation to the city of Västerås and the
participating farmers (Agropti Gas Promotional Information) ................... 317 Figure 154 Location of the production sites for biogas and filling stations for vehicles in
Västerås (Agropti Gas Promotional Information) ...................................... 318 Figure 155 Paper kitchen wastes collection bag (Växtkraft Promotional Information) . 323
Anaerobic Digestion of Biodegradable Municipal Wastes: A Review __________________________________________________________________________
_______________________________________________________________________
19
Figure 156 Ventilated kitchen wastes collection bin (Växtkraft Promotional ............... 324 Figure 157 Harvesting ley-crop (Växtkraft Promotional Information) ......................... 324 Figure 158 Harvesting ley-crop (Växtkraft Promotional Information) ......................... 325 Figure 159 Storing ley-crop on-site (Vaxkraft Promotional Information) .................... 325 Figure 160 Storing ley-crop on-site (Vaxkraft Promotional Information) .................... 326 Figure 161 Process flow diagram (Ros Roca website, accessed July 2006) ................. 327 Figure 162 Waste being unloaded in wastes reception area (Pettersson 2006) ............. 328 Figure 163 Wastes reception area ............................................................................... 328 Figure 164 Liquid wastes reception area ..................................................................... 329 Figure 165 Turbomixers ............................................................................................. 329 Figure 166 Pasteurisation tanks ................................................................................... 330 Figure 167 Digestate storage tank, buffer tank, and anaerobic digester at Växtkraft plant
................................................................................................................. 331 Figure 168 Anaerobic digester at Växtkraft plant ........................................................ 332 Figure 169 Liquid digestate ........................................................................................ 333 Figure 170 Liquid digestate transport from site (Pettersson, 2006) .............................. 334 Figure 171 Liquid digestate transport to storage tanks (Pettersson, 2006) .................... 334 Figure 172 On-farm liquid digestate storage tank (Pettersson, 2006) ........................... 335 Figure 173 Spreading the liquid digestate (Pettersson, 2006) ...................................... 335 Figure 174 Solid digestate .......................................................................................... 336 Figure 175 Truck removing solid digestate container from plant (Pettersson, 2006) .... 337 Figure 176 Truck unloading solid digestate container on farmland (Pettersson, 2006) . 337 Figure 177 Overall biogas flow diagram (Växtkraft Promotional Information) ............ 338 Figure 178 Compressor units (Ahrens, 2006) .............................................................. 339 Figure 179 Biogas upgrading building ........................................................................ 340 Figure 180 Inside of biogas upgrading building .......................................................... 340 Figure 181 Flow diagram of biogas upgrading (Ahrens, 2006) .................................... 341 Figure 182 Compressors at Västerås Bus Depot .......................................................... 342 Figure 183 Biogas storage at Västerås Bus Depot ....................................................... 342 Figure 184 Biogas fuel pumps .................................................................................... 343 Figure 185 Key data from Växtkraft Project (Växtkraft Promotional Information) ...... 348 Figure 186 Aerial photograph of Buchen MBT Plant (T-Plus GmbH website, accessed
July 2006) ................................................................................................. 349 Figure 187 Process flow diagram of Buchen MBT Plant (Environmental Expert website
[a], accessed February 2006) ..................................................................... 350 Figure 188 Inside trommel sieve (1) at Buchen ........................................................... 351 Figure 189 Ferrous metal separator at Buchen ............................................................ 352 Figure 190 Percolators and de-gritters. ........................................................................ 353 Figure 191 Inside the percolators ................................................................................ 354 Figure 192 Aeration channels within percolators......................................................... 354 Figure 193 Rotating ‘arms’, inside percolator, in an operating percolator .................... 355 Figure 194 Conveyor belt from IVC to landfill site ..................................................... 357 Figure 195 Mass balance of ISKA process (Environmental Expert website [b], accessed
June 2006) ................................................................................................ 358 Figure 196 Photograph of Buchen MBT Plant, with landfill site in foreground ........... 359 Figure 197 Cassettes, rope and other wastes becoming tangled in moving parts of process
................................................................................................................. 361 Figure 198 Aerial photograph of Heilbronn Site in construction phase (Environmental
Expert website [b], accessed June 2006) ................................................... 364 Figure 199 Planned layout at Heilbronn (ISKA Promotional Information) .................. 364
Anaerobic Digestion of Biodegradable Municipal Wastes: A Review __________________________________________________________________________
_______________________________________________________________________
20
Figure 200 Process flow diagram of Heilbronn MBT Plant (Environmental Expert website [a], accessed February 2006) ........................................................ 365
Figure 201 Wastes reception area (outdoors) at Heilbronn .......................................... 366 Figure 202 Wastes reception area (indoors) at Heilbronn ............................................ 366 Figure 203 Mechanical separation stages at Heilbronn ................................................ 367 Figure 204 Inside trommel sieve at Heilbronn ............................................................. 367 Figure 205 Percolators at Heilbronn ............................................................................ 368 Figure 206 Anaerobic digester at Heilbronn ................................................................ 369 Figure 207 CLO/biostabilat loading bay at Heilbronn ................................................. 370 Figure 208 Mass balance of ISKA process (Environmental Expert website [b], accessed
June 2006) ................................................................................................ 371 Figure 209 ISKA Plant at Heilbronn (power station in background) ............................ 372 Figure 210 Process flow diagram (Omrin website, accessed November 2005, Courtesy of
SBI Friesland) ........................................................................................... 375 Figure 211 Baled paper and plastics awaiting collection ............................................. 376 Figure 212 Coarse inerts removed from organic waste stream ..................................... 377 Figure 213 Anaerobic digesters at SBI Friesland ......................................................... 378 Figure 214 Belt-presses for de-watering digestate ....................................................... 379 Figure 215 Wastewater treatment plant at SBI Friesland ............................................. 381 Figure 216 ITRADEC Plant (Mons) aerial photograph ............................................... 385 Figure 217 ITRADEC MBT plant process flow diagram............................................. 386 Figure 218 Waste reception hall .................................................................................. 387 Figure 219 Trommel sieves......................................................................................... 387 Figure 220 Waste stream from first trommel sieve to shredder .................................... 388 Figure 221 Inside trommel sieves ............................................................................... 388 Figure 222 RDF loading bay, with digesters in background ........................................ 389 Figure 223 Anaerobic digesters ................................................................................... 390 Figure 224 Biogas pressurisation unit ......................................................................... 391 Figure 225 Screw press ............................................................................................... 392 Figure 226 Composting hall ........................................................................................ 392 Figure 227 Windrows in composting Hall ................................................................... 393 Figure 228 Compost storage hall................................................................................. 394 Figure 229 Compost like output .................................................................................. 395 Figure 230 Biogas buffer/storage tank ........................................................................ 397 Figure 231 Gas de-sulpurisation units ......................................................................... 397 Figure 232 Aerial photograph of MBT plant (Pohlsche-Heide website, accessed
November 2005) ....................................................................................... 401 Figure 233 MBT Plant at Pohlsche-Heide ................................................................... 402 Figure 234 Process concept (IBA website, accessed July 2006) .................................. 403 Figure 235 Process flow diagram (IBA website, accessed July 2006) .......................... 404 Figure 236 Wastes reception area ............................................................................... 405 Figure 237 Conveyors between mechanical separation stages ..................................... 406 Figure 238 ‘Light fraction’ separation by wind sifting ................................................ 406 Figure 239 Dranco digester at Pohlsche-Heide ............................................................ 407 Figure 240 Waste entering tunnel composting system ................................................. 409 Figure 241 Exhaust gas treatment system overview (IBA website, accessed July 2006)
................................................................................................................. 410 Figure 242 Exhaust gas treatment ............................................................................... 411 Figure 243 Wastewater treatment plant ....................................................................... 412 Figure 244 Pulper/mixer at Saschenhagen ................................................................... 415
Anaerobic Digestion of Biodegradable Municipal Wastes: A Review __________________________________________________________________________
_______________________________________________________________________
21
Figure 245 Hydrolysis tanks ....................................................................................... 416 Figure 246 Anaerobic digester at Saschenhagen (one of four) ..................................... 417 Figure 247 Exhaust gas thermal oxidation plant and chimney ..................................... 419 Figure 248 Kahlenberg MBT aerial photograph .......................................................... 423 Figure 249 Process flow diagram (ZAK Promotional Information) ............................. 423 Figure 250 Waste reception hall .................................................................................. 424 Figure 251 Trommel sieves......................................................................................... 425 Figure 252 Percolators and screw presses ................................................................... 426 Figure 253 Fine inerts ................................................................................................. 426 Figure 254 Two (of the three) anaerobic digesters ....................................................... 427 Figure 255 Biodrying bays (5 of 9) ............................................................................. 428 Figure 256 Fine grade SRF from residual waste .......................................................... 429 Figure 257 RDF from residual waste stream ............................................................... 430 Figure 258 Biogas utilisation building ........................................................................ 431 Figure 259 Biofilter for exhaust gas treatment ............................................................ 432 Figure 260 Thermal oxidation unit for exhaust gas treatment ...................................... 433 Figure 261 Restored landfill site ................................................................................. 434 Figure 262 Process flow diagram of Holsworthy Biogas Plant .................................... 436 Figure 263 Summerleaze tanker on lanes outside Holsworthy Biogas Plant ................ 437 Figure 264 Wastes reception pit in enclosed wastes reception hall .............................. 438 Figure 265 Anaerobic digesters and heat exchangers .................................................. 439 Figure 266 Digestate storage tank (with gas de-sulphurisation unit in the foreground) 440 Figure 267 Holsworthy Biogas Plant from the road ..................................................... 442 Figure 268 Component of wastes stream at Linkoping Biogas Plant in May 2006 ....... 446 Figure 269 Linkoping Biogas Plant process flow diagram ........................................... 447 Figure 270 Linkoping Biogas Plant ............................................................................. 447 Figure 271 Digestate storage tank ............................................................................... 449 Figure 272 Inside digestate storage tank at Linkoping ................................................. 449 Figure 273 Biogas train, running between Linkoping and Vastervik ........................... 451 Figure 274 Linkoping Biogas Plant ............................................................................. 452 Figure 275 Lintrup Biogas Plant process flow diagram ............................................... 456 Figure 276 Wastes reception hall ................................................................................ 457 Figure 277 Inside wastes reception hall ....................................................................... 457 Figure 278 Wastes reception tank ............................................................................... 458 Figure 279 Anaerobic digester at Lintrup .................................................................... 459 Figure 280 Digestate storage tanks.............................................................................. 460 Figure 281 Biogas buffer/storage tank, emergency storage tank and de-sulphurisation
unit ........................................................................................................... 462 Figure 282 Lintrup Biogas Plant ................................................................................. 463 Figure 283 Pig farm in Lintrup ................................................................................... 464 Figure 284 Lemgo aerial photograph (Linde website, accessed August 2006) ............. 472 Figure 285 Linde-BRV process (Beck, 2004).............................................................. 473 Figure 286 Aerial photograph of ETVO facility (Valorsul, 2005)................................ 475 Figure 287 Linde-KCA AD process flow diagram (Beck, 2004) ................................ 476 Figure 288 Anaerobic digesters at the ETVO site (Linde Promotional Information)
................................................................................................................. 477 Figure 289 Overview of the Valorsul municipal wastes management system (Valorsul,
2005) ........................................................................................................ 480 Figure 290 Location of Valorsul facilities (Valorsul, 2005) ................................. 481 Figure 291 Public education poster by Valorsul (example 1) ....................................... 482
Anaerobic Digestion of Biodegradable Municipal Wastes: A Review __________________________________________________________________________
_______________________________________________________________________
22
Figure 292 Public education poster by Valorsul (example 2) ....................................... 483 Figure 293 Public education poster by Valorsul (example 3) ....................................... 483 Figure 294 Wels AD facility (Beck, 2004) .................................................................. 485 Figure 295 Linde-KCA AD process flow diagram (Beck, 2004) ................................. 485 Figure 296 Luebeck MBT Plant (Haase website, accessed July 2006) ......................... 487 Figure 297 Aerial photograph of Luebeck MBT Plant (Haase website, accessed July
2006) ........................................................................................................ 487 Figure 298 Process flow diagram of a similar Haase MBT Plant at Leon, Spain (Haase
website, accessed July 2006) ..................................................................... 488 Figure 299 Mechanical pre-treatment stages (Haase website, accessed July 2006) ...... 489 Figure 300 Diagram and photograph of a typical Haase anaerobic digester (Haase
website, accessed July 2006) ..................................................................... 490 Figure 301 Example of mass balance for Haase AD system (Haase website, accessed
July 2006) ................................................................................................. 490 Figure 302 Capital cost per tonne throughput over 20 year operating life .................... 495 Figure 303 Biogas production per tonne of wastes treated ........................................... 500 Figure 304 Total solids content of digester and average biogas production per tonne
throughput ................................................................................................ 502 Figure 305 Biogas production per tonne of total solids treated .................................... 503 Figure 306 Potential electricity production per tonne of waste treated (based on
calculations) .............................................................................................. 506 Figure 307 Total electricity theoretically produced (and exported) if all of the biogas was
used for electricity production ................................................................... 508 Figure 308 Potential theoretical electricity exported per tonne of wastes treated ......... 508 Figure 309 Total electricity actually exported ............................................................. 509 Figure 310 Potential income/savings from biogas ....................................................... 510 Figure 311 Theoretical potential income/saving from biogas per tonne of waste treated
................................................................................................................. 511 Figure 312 Theoretical potential saving from biogas if all exportable biogas was
upgraded and used as a petrol substitute .................................................... 512 Figure 313 Percentages of non-organic contaminants in incoming wastes stream ........ 514 Figure 314 MBT plant outputs .................................................................................... 522 Figure 315 Actual landfill diversion ............................................................................ 524 Figure 316 CLO produced and other landfilled wastes (both as a percentage of mass
input) ........................................................................................................ 525 Figure 317 Theoretical minimum landfill diversion potential of each MBT plant
(assuming all CLO is landfilled) ............................................................... 526 Figure 318 Total biogas production at MBT plants ..................................................... 528 Figure 319 Biogas production per tonne of waste anaerobically digested at MBT plants
................................................................................................................. 529 Figure 320 Energy balance (from biogas) per tonne of waste processed ...................... 533 Figure 321 Energy recovery potential (by mass of wastes input) ................................. 534 Figure 322 Fresh water requirements for MBT plants ................................................. 536 Figure 323 Tonnes of waste processed per square metre per year ................................ 541 Figure 324 Total residence times in the MBT plants visited ........................................ 543 Figure 325 Capital cost and capacity of MBT plants ................................................... 547 Figure 326 Capital cost per tonne treated over 20 year life span of the plant ............... 547 Figure 327 Operating cost comparison ........................................................................ 549 Figure 328 Mass balance of ISKA process (Environmental Expert website [b], accessed
June 2006) ................................................................................................ 606
Anaerobic Digestion of Biodegradable Municipal Wastes: A Review __________________________________________________________________________
_______________________________________________________________________
23
Figure 329 Buchen MBT plant mass balance outputs .................................................. 607 Figure 330 Heerenveen MBT plant mass balance outputs ........................................... 610 Figure 331 Mons MBT plant mass balance outputs ..................................................... 611 Figure 332 Saschenhagen MBT plant mass balance outputs ........................................ 613 Figure 333 Pohlsche Heide MBT plant mass balance outputs ...................................... 615 Figure 334 Vaasa MBT plant mass balance outputs .................................................... 618 Figure 335 ZAK Ringsheim MBT plant mass balance outputs .................................... 619
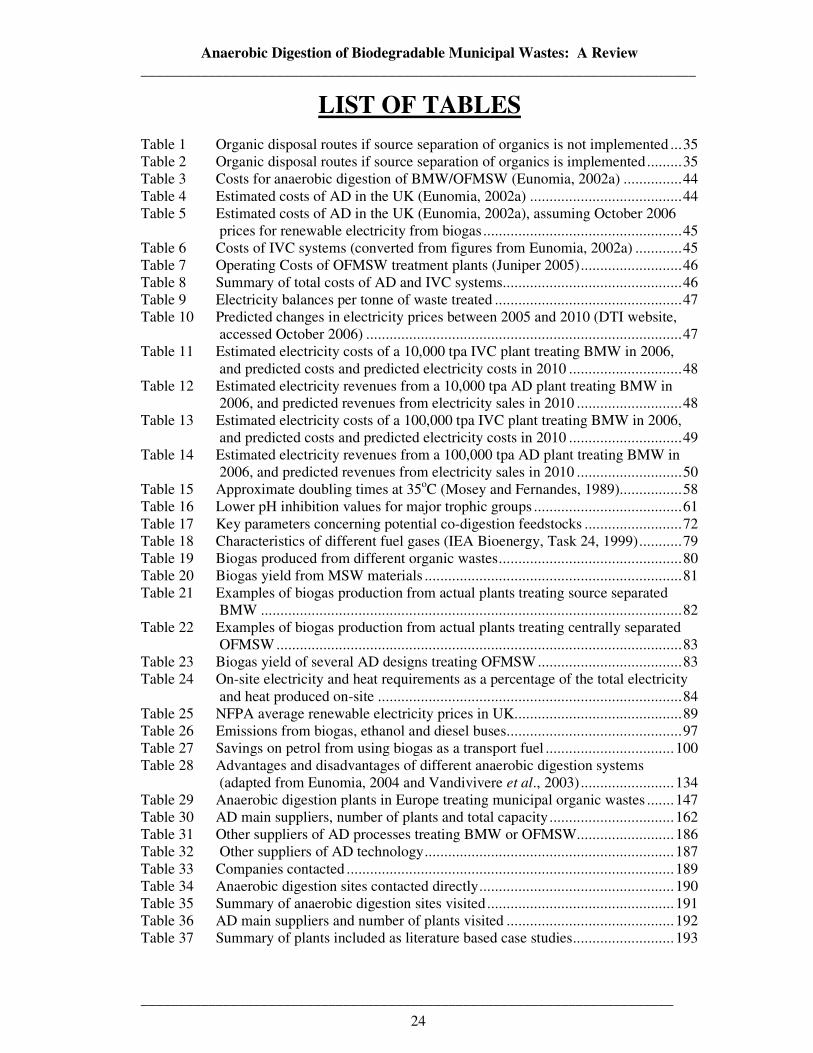
Anaerobic Digestion of Biodegradable Municipal Wastes: A Review __________________________________________________________________________
_______________________________________________________________________
24
LIST OF TABLES Table 1 Organic disposal routes if source separation of organics is not implemented ... 35 Table 2 Organic disposal routes if source separation of organics is implemented ......... 35 Table 3 Costs for anaerobic digestion of BMW/OFMSW (Eunomia, 2002a) ............... 44 Table 4 Estimated costs of AD in the UK (Eunomia, 2002a) ....................................... 44 Table 5 Estimated costs of AD in the UK (Eunomia, 2002a), assuming October 2006
prices for renewable electricity from biogas ................................................... 45 Table 6 Costs of IVC systems (converted from figures from Eunomia, 2002a) ............ 45 Table 7 Operating Costs of OFMSW treatment plants (Juniper 2005) .......................... 46 Table 8 Summary of total costs of AD and IVC systems .............................................. 46 Table 9 Electricity balances per tonne of waste treated ................................................ 47 Table 10 Predicted changes in electricity prices between 2005 and 2010 (DTI website,
accessed October 2006) ................................................................................. 47 Table 11 Estimated electricity costs of a 10,000 tpa IVC plant treating BMW in 2006,
and predicted costs and predicted electricity costs in 2010 ............................. 48 Table 12 Estimated electricity revenues from a 10,000 tpa AD plant treating BMW in
2006, and predicted revenues from electricity sales in 2010 ........................... 48 Table 13 Estimated electricity costs of a 100,000 tpa IVC plant treating BMW in 2006,
and predicted costs and predicted electricity costs in 2010 ............................. 49 Table 14 Estimated electricity revenues from a 100,000 tpa AD plant treating BMW in
2006, and predicted revenues from electricity sales in 2010 ........................... 50 Table 15 Approximate doubling times at 35oC (Mosey and Fernandes, 1989) ................ 58 Table 16 Lower pH inhibition values for major trophic groups ...................................... 61 Table 17 Key parameters concerning potential co-digestion feedstocks ......................... 72 Table 18 Characteristics of different fuel gases (IEA Bioenergy, Task 24, 1999) ........... 79 Table 19 Biogas produced from different organic wastes ............................................... 80 Table 20 Biogas yield from MSW materials .................................................................. 81 Table 21 Examples of biogas production from actual plants treating source separated
BMW ............................................................................................................ 82 Table 22 Examples of biogas production from actual plants treating centrally separated
OFMSW ........................................................................................................ 83 Table 23 Biogas yield of several AD designs treating OFMSW ..................................... 83 Table 24 On-site electricity and heat requirements as a percentage of the total electricity
and heat produced on-site .............................................................................. 84 Table 25 NFPA average renewable electricity prices in UK ........................................... 89 Table 26 Emissions from biogas, ethanol and diesel buses ............................................. 97 Table 27 Savings on petrol from using biogas as a transport fuel ................................. 100 Table 28 Advantages and disadvantages of different anaerobic digestion systems
(adapted from Eunomia, 2004 and Vandivivere et al., 2003) ........................ 134 Table 29 Anaerobic digestion plants in Europe treating municipal organic wastes ....... 147 Table 30 AD main suppliers, number of plants and total capacity ................................ 162 Table 31 Other suppliers of AD processes treating BMW or OFMSW......................... 186 Table 32 Other suppliers of AD technology ................................................................ 187 Table 33 Companies contacted .................................................................................... 189 Table 34 Anaerobic digestion sites contacted directly .................................................. 190 Table 35 Summary of anaerobic digestion sites visited ................................................ 191 Table 36 AD main suppliers and number of plants visited ........................................... 192 Table 37 Summary of plants included as literature based case studies .......................... 193
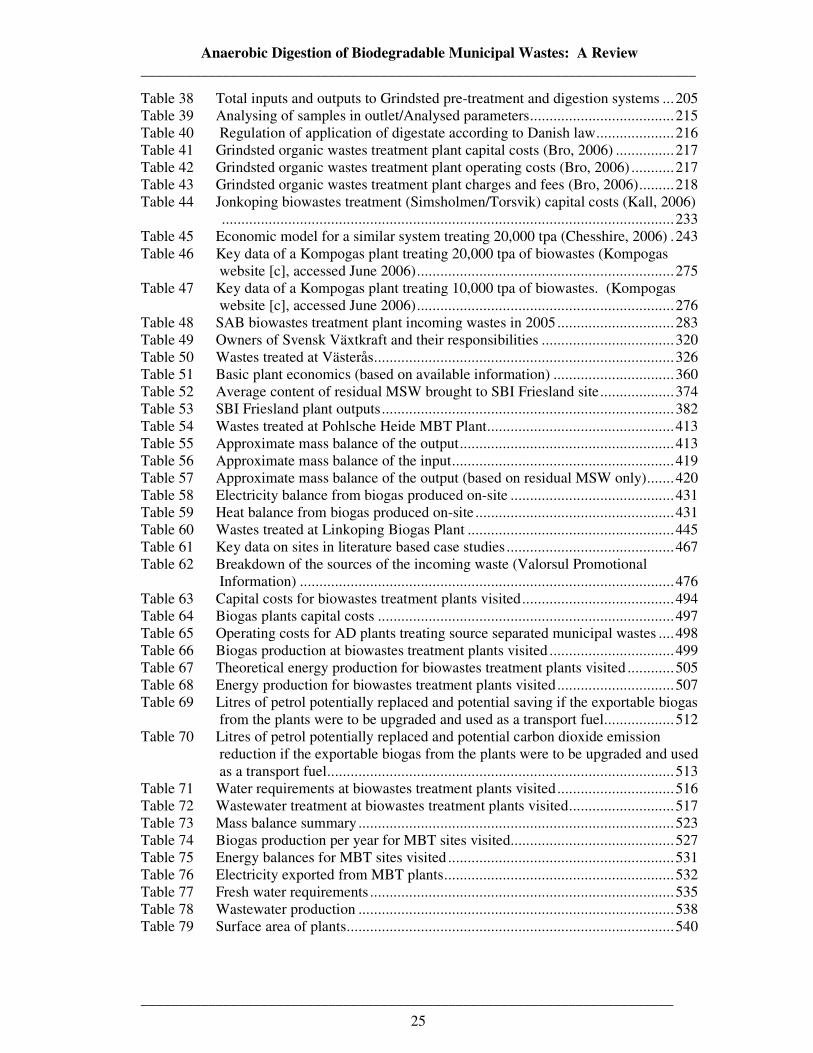
Anaerobic Digestion of Biodegradable Municipal Wastes: A Review __________________________________________________________________________
_______________________________________________________________________
25
Table 38 Total inputs and outputs to Grindsted pre-treatment and digestion systems ... 205 Table 39 Analysing of samples in outlet/Analysed parameters ..................................... 215 Table 40 Regulation of application of digestate according to Danish law .................... 216 Table 41 Grindsted organic wastes treatment plant capital costs (Bro, 2006) ............... 217 Table 42 Grindsted organic wastes treatment plant operating costs (Bro, 2006) ........... 217 Table 43 Grindsted organic wastes treatment plant charges and fees (Bro, 2006) ......... 218 Table 44 Jonkoping biowastes treatment (Simsholmen/Torsvik) capital costs (Kall, 2006)
.................................................................................................................... 233 Table 45 Economic model for a similar system treating 20,000 tpa (Chesshire, 2006) . 243 Table 46 Key data of a Kompogas plant treating 20,000 tpa of biowastes (Kompogas
website [c], accessed June 2006) .................................................................. 275 Table 47 Key data of a Kompogas plant treating 10,000 tpa of biowastes. (Kompogas
website [c], accessed June 2006) .................................................................. 276 Table 48 SAB biowastes treatment plant incoming wastes in 2005 .............................. 283 Table 49 Owners of Svensk Växtkraft and their responsibilities .................................. 320 Table 50 Wastes treated at Västerås ............................................................................. 326 Table 51 Basic plant economics (based on available information) ............................... 360 Table 52 Average content of residual MSW brought to SBI Friesland site ................... 374 Table 53 SBI Friesland plant outputs ........................................................................... 382 Table 54 Wastes treated at Pohlsche Heide MBT Plant ................................................ 413 Table 55 Approximate mass balance of the output ....................................................... 413 Table 56 Approximate mass balance of the input ......................................................... 419 Table 57 Approximate mass balance of the output (based on residual MSW only) ....... 420 Table 58 Electricity balance from biogas produced on-site .......................................... 431 Table 59 Heat balance from biogas produced on-site ................................................... 431 Table 60 Wastes treated at Linkoping Biogas Plant ..................................................... 445 Table 61 Key data on sites in literature based case studies ........................................... 467 Table 62 Breakdown of the sources of the incoming waste (Valorsul Promotional
Information) ................................................................................................ 476 Table 63 Capital costs for biowastes treatment plants visited ....................................... 494 Table 64 Biogas plants capital costs ............................................................................ 497 Table 65 Operating costs for AD plants treating source separated municipal wastes .... 498 Table 66 Biogas production at biowastes treatment plants visited ................................ 499 Table 67 Theoretical energy production for biowastes treatment plants visited ............ 505 Table 68 Energy production for biowastes treatment plants visited .............................. 507 Table 69 Litres of petrol potentially replaced and potential saving if the exportable biogas
from the plants were to be upgraded and used as a transport fuel .................. 512 Table 70 Litres of petrol potentially replaced and potential carbon dioxide emission
reduction if the exportable biogas from the plants were to be upgraded and used as a transport fuel ......................................................................................... 513
Table 71 Water requirements at biowastes treatment plants visited .............................. 516 Table 72 Wastewater treatment at biowastes treatment plants visited ........................... 517 Table 73 Mass balance summary ................................................................................. 523 Table 74 Biogas production per year for MBT sites visited .......................................... 527 Table 75 Energy balances for MBT sites visited .......................................................... 531 Table 76 Electricity exported from MBT plants ........................................................... 532 Table 77 Fresh water requirements .............................................................................. 535 Table 78 Wastewater production ................................................................................. 538 Table 79 Surface area of plants .................................................................................... 540
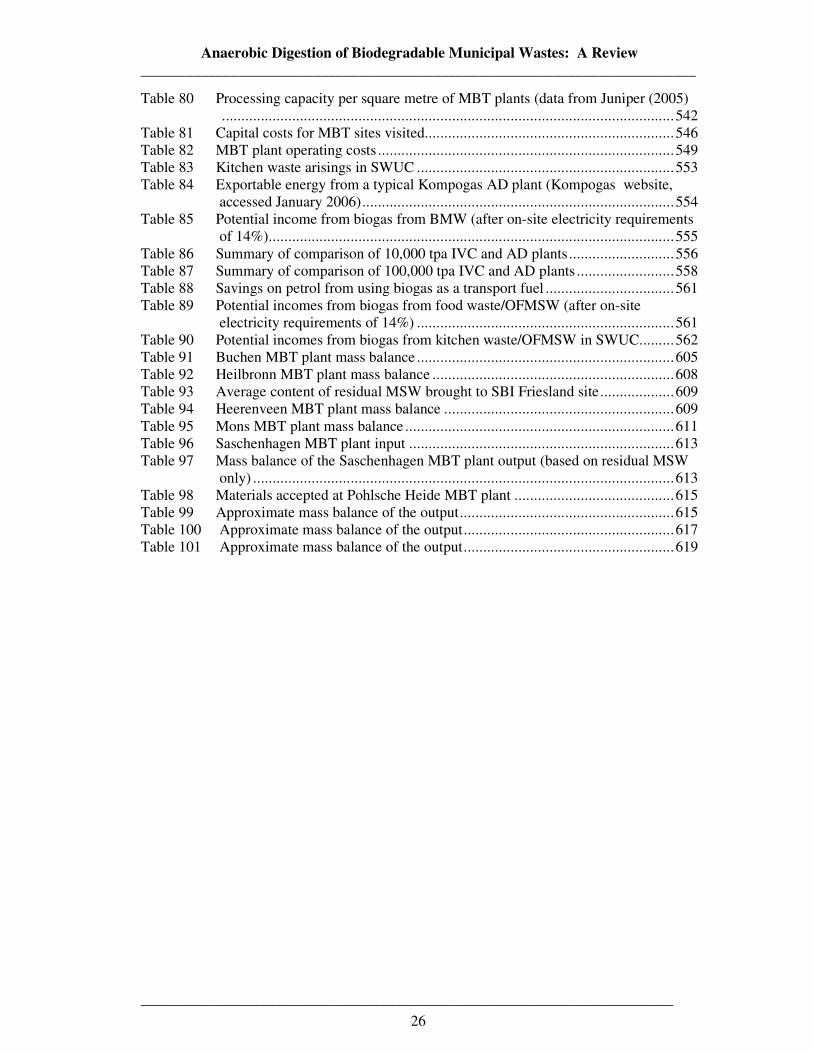
Anaerobic Digestion of Biodegradable Municipal Wastes: A Review __________________________________________________________________________
_______________________________________________________________________
26
Table 80 Processing capacity per square metre of MBT plants (data from Juniper (2005) .................................................................................................................... 542
Table 81 Capital costs for MBT sites visited................................................................ 546 Table 82 MBT plant operating costs ............................................................................ 549 Table 83 Kitchen waste arisings in SWUC .................................................................. 553 Table 84 Exportable energy from a typical Kompogas AD plant (Kompogas website,
accessed January 2006) ................................................................................ 554 Table 85 Potential income from biogas from BMW (after on-site electricity requirements
of 14%) ........................................................................................................ 555 Table 86 Summary of comparison of 10,000 tpa IVC and AD plants ........................... 556 Table 87 Summary of comparison of 100,000 tpa IVC and AD plants ......................... 558 Table 88 Savings on petrol from using biogas as a transport fuel ................................. 561 Table 89 Potential incomes from biogas from food waste/OFMSW (after on-site
electricity requirements of 14%) .................................................................. 561 Table 90 Potential incomes from biogas from kitchen waste/OFMSW in SWUC......... 562 Table 91 Buchen MBT plant mass balance .................................................................. 605 Table 92 Heilbronn MBT plant mass balance .............................................................. 608 Table 93 Average content of residual MSW brought to SBI Friesland site ................... 609 Table 94 Heerenveen MBT plant mass balance ........................................................... 609 Table 95 Mons MBT plant mass balance ..................................................................... 611 Table 96 Saschenhagen MBT plant input .................................................................... 613 Table 97 Mass balance of the Saschenhagen MBT plant output (based on residual MSW
only) ............................................................................................................ 613 Table 98 Materials accepted at Pohlsche Heide MBT plant ......................................... 615 Table 99 Approximate mass balance of the output ....................................................... 615 Table 100 Approximate mass balance of the output ...................................................... 617 Table 101 Approximate mass balance of the output ...................................................... 619
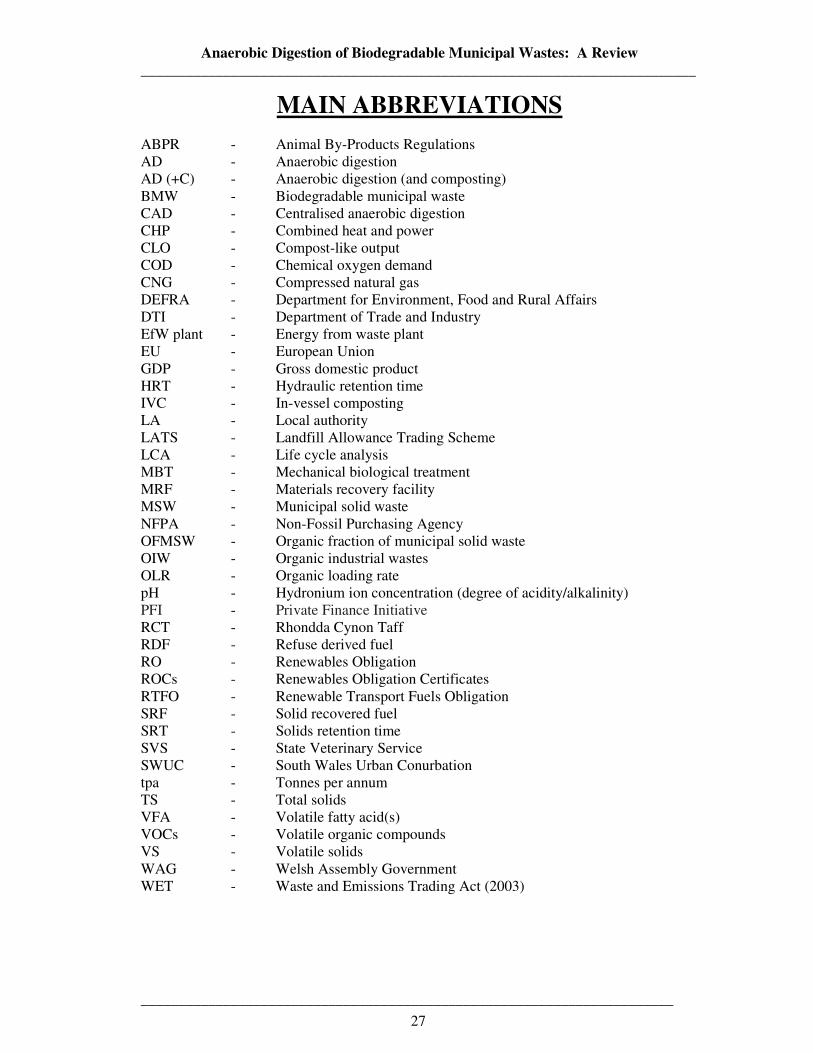
Anaerobic Digestion of Biodegradable Municipal Wastes: A Review __________________________________________________________________________
_______________________________________________________________________
27
MAIN ABBREVIATIONS ABPR - Animal By-Products Regulations AD - Anaerobic digestion AD (+C) - Anaerobic digestion (and composting) BMW - Biodegradable municipal waste CAD - Centralised anaerobic digestion CHP - Combined heat and power CLO - Compost-like output COD - Chemical oxygen demand CNG - Compressed natural gas DEFRA - Department for Environment, Food and Rural Affairs DTI - Department of Trade and Industry EfW plant - Energy from waste plant EU - European Union GDP - Gross domestic product HRT - Hydraulic retention time IVC - In-vessel composting LA - Local authority LATS - Landfill Allowance Trading Scheme LCA - Life cycle analysis MBT - Mechanical biological treatment MRF - Materials recovery facility MSW - Municipal solid waste NFPA - Non-Fossil Purchasing Agency OFMSW - Organic fraction of municipal solid waste OIW - Organic industrial wastes OLR - Organic loading rate pH - Hydronium ion concentration (degree of acidity/alkalinity) PFI - Private Finance Initiative RCT - Rhondda Cynon Taff RDF - Refuse derived fuel RO - Renewables Obligation ROCs - Renewables Obligation Certificates RTFO - Renewable Transport Fuels Obligation SRF - Solid recovered fuel SRT - Solids retention time SVS - State Veterinary Service SWUC - South Wales Urban Conurbation tpa - Tonnes per annum TS - Total solids VFA - Volatile fatty acid(s) VOCs - Volatile organic compounds VS - Volatile solids WAG - Welsh Assembly Government WET - Waste and Emissions Trading Act (2003)
Anaerobic Digestion of Biodegradable Municipal Wastes: A Review __________________________________________________________________________
_______________________________________________________________________
28
1.0 INTRODUCTION ‘Waste is Wales’ biggest environmental problem’ (WAG, 2002). The definition of municipal waste was clarified by Defra and the Welsh Assembly Government in September 2005, with effect that from April 2006 certain wastes are no longer considered to be municipal. Such wastes include those generated by local authority activities (housing, grounds maintenance etc), but that are not managed by local authorities in their capacities as Waste Collection or Waste Disposal Authorities. In 2002/2003 Wales landfilled over 1.5 million tonnes of MSW (National Assembly for Wales, 2004). This figure had fallen to around 1.4 million tonnes in 2005/06, due to an increase in recycling and composting by Welsh local authorities. The biodegradable fraction of MSW is known as biodegradable municipal waste (BMW) or organic fraction of MSW (OFMSW) and can consist of kitchen wastes, garden wastes, paper and card, and other putrescibles. The Landfill Allowances Scheme (Wales) Regulations 2004 deem the amount of biodegradable material in Welsh municipal waste to be 61% of the total. One of the guiding principles for European and UK waste management has been the concept of a hierarchy of waste management options, where the most desirable option is not to produce the waste in the first place (waste prevention, or reduction) and the least desirable option is to dispose of the waste with no recovery of either materials and/or energy. Between these two extremes there are a wide variety of waste treatment options that may be used as part of a waste management strategy to recover materials and energy. Anaerobic digestion (AD) is one such waste treatment option. The waste hierarchy ideal of ‘Reduce, Reuse, Recycle and Recover’ is key to reducing the amount of waste we produce as a society. Since the Second World War consumption and waste production have been rising, linked to gross domestic product (GDP), and economic reality in the UK has dictated that landfilling has been the predominant waste disposal option. Despite being the cheapest waste disposal option, it has long been recognised by European, National and Local Governments that landfilling municipal waste is not a sustainable option, both in environmental terms, and practically, in terms of space limitations. European legislation (Landfill Directive 1999/31/EC) has been enforced to limit the amount of biodegradable municipal waste (BMW) sent for disposal in landfill, and these limits have been transposed in Wales via the targets set in the Landfill Allowances Scheme (Wales) Regulations 2004. The diversion of this material from landfill is currently the most significant challenge facing the management of MSW in the UK. Because of the Landfill Directive requirements the wastes management industry in the UK is going through a transitional period, and treatment facilities must be rapidly planned and commissioned to treat BMW. In addition, attitudes are changing, and waste is increasingly being recognised as a ‘resource’ that contains many re-usable, recyclable or recoverable ‘products’. The Waste and Emissions Trading Act (2003) places the responsibility for diverting biodegradable municipal waste on Waste Disposal Authorities. Local authority landfill diversion targets were therefore devised by the UK Governments to ensure that the UK, as a whole, meets the obligation to reduce the amount of BMW sent to landfill that is specified in the EU Landfill Directive. In addition to the existing challenges of meeting landfill diversion and recycling targets, and despite efforts to reduce waste production, it is estimated that the amount of municipal waste produced will double between 2002 and 2020 (Strategy Unit, 2002). The predicted rise in wastes production and the fact that Landfill Allowances will not be tradable in Wales (as
Anaerobic Digestion of Biodegradable Municipal Wastes: A Review __________________________________________________________________________
_______________________________________________________________________
29
they will be in England) mean that the pressure on Welsh local authorities to plan and commission BMW treatment facilities is especially acute. It is expected that to meet the recycling and landfill diversion targets, local authorities will need to make provision for municipal wastes to be separated at source, in individual households and businesses. Aside from allowing the individual components of municipal waste to be collected separately and sent directly to the ideal recycling, treatment or disposal facility, an added bonus of source separation that has been observed in other European nations is that source separation requires the public to think about the wastes they produce, which leads to reductions in volume. If source separation is implemented, then the source separated BMW can be treated biologically. Biological treatment presents the possibility of recycling the nutrients and organic matter contained in the BMW back to land, provided the required quality standards are met. This will improve soil quality and reduce the amount of artificial fertilisers required. The main biological options for the treatment of biowastes (either source separated kitchen waste, or centrally separated OFMSW) are anaerobic digestion (AD) and in-vessel composting (IVC). Various Life Cycle Analysis (LCA) studies comparing IVC and AD for the treatment of biowastes have shown that AD is a superior environmental option (Edelmann et al. (2001); Edelmann and Schliess (2000); Sonesson et al. (2000); Ericsson et al. (2005); Bjorklund et al. (1999); Fricke et al. (2005)). This is primarily due to the fact that AD produces net energy, whereas in-vessel composting requires energy addition. With regards to the residual wastes stream, mechanical biological treatment (MBT) can boost recycling, help to meet landfill diversion targets and avoid incineration. Fricke et al. (2005) confirmed that with the rising relevancy of climate change and the utilisation of renewable energies, AD for the treatment of OFMSW has a high potential for further development. The comprehensive report on MBT by Juniper (2005) concluded that the most attractive MBT configurations are those that focus on anaerobic digestion (AD), rather than other options involving aerobic composting or biodrying. Again, the main advantage of the MBT configurations incorporating AD is the production of renewable energy produced in the form of biogas. If source separation of BMW is not implemented, conventional incineration or other thermal treatments are unlikely to be either popular politically (due to public opposition), or especially well-suited to the treatment of biowastes, mainly due to the high water content (often > 70 %) and lower calorific value. If BMW is incinerated the organic material and nutrients which would be beneficial to soil would be lost. Therefore compared to incineration, the recovery of nutrients makes biological treatment options superior in terms of sustainability. Biological treatment and incineration are not competing treatment processes but should be seen as technologies for two separate waste streams, i.e. the biodegradable and the non-biodegradable waste (Alexiou and Osada, 2000). Due to the production of renewable energy, AD will likely provide the best available biological treatment option for source separated BMW. In addition to the pressing problems of waste management, the UK and Wales (along with most of the rest of the world) are faced with the complicated issues of climate change, over-reliance on imported fossil fuels and concerns over security of supply. According to the Welsh Assembly Government (WAG):
Anaerobic Digestion of Biodegradable Municipal Wastes: A Review __________________________________________________________________________
_______________________________________________________________________
30
‘It is now widely accepted that climate change is occurring and that the burning of
fossil fuels, which generate greenhouse gas emissions, is a major contributor. Unless
such emissions, particularly carbon dioxide (and methane), are brought under control,
there will be severe and unpredictable global impacts which in turn will lead to a
significant climatic effect at a local level’ (WAG, 2005). WAG is committed to playing its part by delivering an energy programme which contributes to reducing carbon emissions (WAG, 2005). WAG has established specific renewable electricity production targets for Wales of 4 TWh per annum by 2010 and 7 TWh per annum by 2020. These targets should be seen in the context of the Welsh Assembly Government’s overall Energy Strategy and its commitment to energy efficiency. Planning policy at all levels should facilitate both the promotion of energy efficiency and the reduction of carbon emissions (WAG, 2005). With a well thought out, forward-thinking waste strategy, organic waste (including BMW or OFMSW) can and should become one of the most reliable sources of renewable energy (alongside energy recovery from the incineration of the combustible fractions of MSW). Organic wastes are available wherever humans are present, at a localised level. As the energy can be produced and used close to where the waste arises, security of supply issues associated with fossil fuels are avoided. In addition, organic wastes can cause a significant environmental impact if not dealt with properly. As well as reducing the volume of wastes requiring landfilling, energy can be recovered, fossil fuel use avoided, and carbon dioxide emissions reduced. Aside from being the best environmental option for biowastes treatment, renewable energy from the AD of OFMSW was found to show the best LCA results of all renewable energies (including wind power, photovoltaics and hydro) (ESU-Services, 2000). Anaerobic digestion is a unique technology, in that it represents an opportunity to divert biodegradable municipal waste from landfill, produce an agriculturally beneficial soil conditioner (depending on the quality of the waste treated) and produce renewable energy. All three of these benefits can significantly reduce greenhouse gas emissions. In addition to BMW treatment, significant possibilities exist to co-digest BMW with other organic wastes, which could tie in other benefits not usually considered relevant to municipal wastes treatment. Anaerobic digesters treating BMW/OFMSW can be used to co-digest other organic wastes, such as sewage sludge, agricultural wastes including manures and spoilt crops, slaughterhouse wastes, industrial organic wastes, and other organic material available (such as energy crops). Aside from the production of extra biogas (and therefore extra income) and extra soil conditioner (if the quality is high enough) slaughterhouse wastes and industrial organic wastes can attract ever increasing gate fees, further increasing plant economics. The treatment of agricultural wastes can aid nutrient control, reduce odours and improve pathogen kill in manure. In addition to the production of more biogas (and therefore increased revenue) the possibility of using the renewable heat in district heating schemes or neighbouring industries can further aid plant economics and reduce fossil fuel use. In addition to the co-digestion of BMW with other wastes, a fast developing area of interest is co-digestion with energy crops. Energy crops have been successfully grown and digested with BMW in full scale digesters in Europe (see Västerås case study, Section 5.1.8). Energy crops can be cultivated on marginal land, or in areas of excess food production, and can both diversify farmers income and create multi-level employment in rural areas. Energy crops can also be cultivated on marginal land which could bring derelict industrial land back into use whilst at the same time utilising AD digestates.
Anaerobic Digestion of Biodegradable Municipal Wastes: A Review __________________________________________________________________________
_______________________________________________________________________
31
To date in the UK the uptake of AD to treat BMW/OFMSW has been slow, despite the potential benefits. At present, there are only two anaerobic digestion systems operating on municipal wastes in the UK (one in Leicester, treating the organic fraction of centrally separated MSW, and one large-pilot scale digester treating source separated kitchen and garden wastes in Shropshire), both of which have been commissioned in the past few years. In contrast to the UK situation, the anaerobic digestion of BMW as a waste management technique has played an important role in the waste strategies of several European nations for some time. The first full scale plants treating OFMSW were installed in the late 1980s (in Amiens, France, in 1988 and in Vaasa, Finland, in 1989) and are still successfully operating. As operator knowledge and experience have developed, confidence in the process has grown and more and more anaerobic digestion systems have been commissioned. In mainland Europe there are now over 160 industrial scale anaerobic digesters treating BMW or OFMSW, and the AD of BMW/OFMSW is regarded as an accepted and industrially proven waste management option. This fact is reflected by the large number of plants installed since the year 2000 (at least 35 anaerobic digestion plants treating source separated BMW and at least 40 MBT plants where the OFMSW is anaerobically digested). Despite many years of successful operation on mainland Europe, the AD of BMW/OFMSW is still regarded as ‘unproven’ in some circles in the UK. The lack of dissemination of the potential benefits and the possibilities of AD for solid wastes treatment to politicians and other decision makers has also been identified as one of the major bottlenecks hindering uptake of the AD (Hartmann and Ahring, 2006). Aside from highlighting the reliable and proven anaerobic possibilities to decision makers, the primary aim of this project is to review the use of anaerobic digestion (AD) as a biodegradable municipal waste (BMW) management technique. This report contains technical information on the various anaerobic configurations available (both for the source separated biowastes, and for the organic fraction of centrally separated residual MSW), and underlines the large number, diversity and flexibility of different systems (or combinations of systems) commercially available, and successfully operational at present. The case studies presented contain in-depth information on issues such as process descriptions, the anaerobic digesters themselves, the other components of the process (such as gas upgrading and utilisation, pre-treatments and post treatments required) quantity content and quality of incoming wastes, suppliers/commissioners, ownership and locational issues, populations served, energy and economic issues and lessons learned. Due to the pressing needs of Local Governments, the fact that large investments need to be made with public funds, and the absolute requirement for reliability and provenness this report is focussed on anaerobic digestion systems that are in full-scale industrial use at present. The report also highlights potential cross-sector anaerobic co-digestion options, for example the co-digestion of BMW/OFMSW with other organic wastes that are not the responsibility of local authorities (sewage sludge, industrial organic wastes, agricultural wastes and energy crops) and the benefits that these systems have brought in other European nations. Financial issues are discussed, although the results were discussed in a non-specific fashion, so as not to compromise the confidentiality requirements of the providers of the information. Sustainability issues are discussed and good practices summarised. The lessons learnt and best practice guidelines from other countries also feature in the review, so that optimum AD treatment of BMW strategy(ies) can be formulated and implemented. Case studies analysed will help decision makers to assess the viability of using the AD process as part of an integrated solution for waste management in the UK. This transfer of knowledge and
Anaerobic Digestion of Biodegradable Municipal Wastes: A Review __________________________________________________________________________
_______________________________________________________________________
32
industrial experiences of the AD of BMW from continental Europe will enhance knowledge in the UK, enabling Wales and the UK to learn lessons from experiences across Europe, and gain from the advantages AD offers for the treatment of source separated BMW and centrally separated OFMSW.
Anaerobic Digestion of Biodegradable Municipal Wastes: A Review __________________________________________________________________________
_______________________________________________________________________
33
2.0 LITERATURE REVIEW
2.1 Drivers for change The main driver for change in the way BMW is treated in the UK is the European Landfill Directive (1999/31/EC), implemented in the UK by the Landfill (England and Wales) Regulations (2002). The Landfill (England and Wales) Regulations are available on the Office for Public Sector Information website, Accessed October 2006. The European Landfill Directive aims:
‘To prevent or reduce as far as possible negative effects on the environment, in
particular the pollution of surface water, groundwater, soil and air and on the global
environment, including greenhouse effect, as well as any resulting risk to human health,
from the landfilling of waste, during the whole life-cycle of the landfill’ (DEFRA website [b], Accessed September 2005).
The key requirements of the Landfill Directive with regards to BMW for the UK are summarised below:
• By 2010 to reduce biodegradable municipal waste landfilled to 75 % of that produced in 1995
• By 2013 to reduce biodegradable municipal waste landfilled to 50 % of that produced in 1995
• By 2020 to reduce biodegradable municipal waste landfilled to 35 % of that produced in 1995.
The diversion of this material from landfill is currently the most significant challenge facing the management of municipal solid waste in the UK. Central Government has passed these targets on to local authorities, which are responsible for the collection and treatment of municipal waste, and therefore for meeting the Landfill Regulations targets. The Government has reserved the right to pass on any European fine imposed on the UK for non compliance to the landfill directive targets onto the local authorities (or devolved administrations) responsible for the UK non-compliance to its targets. Therefore UK local authorities failing to meet their targets would be responsible for their share of fines up to £180 million per year (or £500,000 per day) until the Directive’s demands are met (Lets Recycle website, Accessed August 2006). In addition to these fines, prosecution can also take place. DEFRA will fine local authorities £150 for every tonne of biodegradable municipal waste they landfill beyond the limit set by the Government based on the Landfill Directive (Lets Recycle website, accessed August 2006). In Wales, WAG has committed to fining Local Authorities £200 for every tonne of biodegradable municipal waste exceeding their landfill allowances. In the UK, two main mechanisms are in place to aid the diversion of BMW from landfill. These are Landfill Tax (which artificially increases the cost of landfilling any waste) and Landfill Allowances Schemes. The Landfill Allowance Trading Scheme (LATS), which is a system of tradable permits, allowing local authorities that are performing well (in relation to BMW diversion targets) to ‘earn’ by accepting waste for landfill from poorly performing local authorities, which pay. In Wales the trading of landfill allowances is currently not allowed, and each local authority must treat, or otherwise dispose
Anaerobic Digestion of Biodegradable Municipal Wastes: A Review __________________________________________________________________________
_______________________________________________________________________
34
of its own waste, on its own. This adds extra pressure on Welsh local authorities to divert BMW from landfill as allowances are not tradable. Aside from the driving legislation promoting BMW treatment, potential AD projects would be subject to other European and national legislation. These include legislation concerning, treatment of animal by-products (described briefly in Section 2.3.1), digestate/compost quality requirements depending on the end use of the compost-like output and Pollution Prevention and Control (England and Wales) Regulations 2000, among others. Regular consultation of the Environment Agency and National Assembly for Wales websites is advised for updates on legislative documents. Some legislative issues relevant to AD of BMW/OFMSW, and uncertainties based on the current ‘gaps’ in legislation are further discussed in Juniper (2005). The Landfill (Scheme Year and Maximum Landfill Amount) Regulations 2004 prescribe the maximum quantities of BMW that Wales is allowed to landfill as: 2010 - 0.71 million tonnes 2013 - 0.32 million tonnes 2020 - 0.22 million tonnes Therefore assuming 1999/2000 figures and an unlikely 0% growth in waste arisings, an alternative disposal route must be found for 363,000 tpa of BMW by 2010, and 723,000 tpa of BMW by 2020. If waste arisings grow at 3 % per year, it is estimated that 762,000 tpa of BMW will need to be diverted from landfill by 2010, and 1,616,000 tpa by 2020 if Landfill Directive targets are to be met (Wise About Waste, 2002). More specifically, the National Waste Strategy for Wales (WAG, 2002) estimates that the composting/AD capacity requirements for the treatment of green and kitchen waste will fall close to the values below: 2005: 127,000 tonnes 2010: 170,000 tonnes 2020: 424,000 tonnes To put these figures into context, it has been estimated for 2006 that the BMW content of MSW landfilled in Wales was approximately 890,000 tonnes. Given the extent of these requirements and targets, it is no surprise that waste minimisation and composting (including AD) initiatives for BMW, as well as for biodegradable industrial and commercial wastes are being promoted as a high priority by the Environment Agency in Wales and business support organisations. If treated by AD, these organic wastes could also provide a significant locally produced percentage of Wales’ renewable energy, which could also aid Welsh progress towards meeting the Renewables Obligation (RO) (SI 2002/914), and therefore national and international carbon dioxide reduction targets including Kyoto Protocol commitments. Biogas from the anaerobic digestion of organic wastes (including BMW or OFMSW) can contribute to meeting the EU Biofuels Directive 2003/30/EC, which sets a target of 5.75 % of all transport fuels to come from renewable sources by 2010, and the proposed Renewable Transport Fuels Obligation (RTFO), which would propose similar targets.
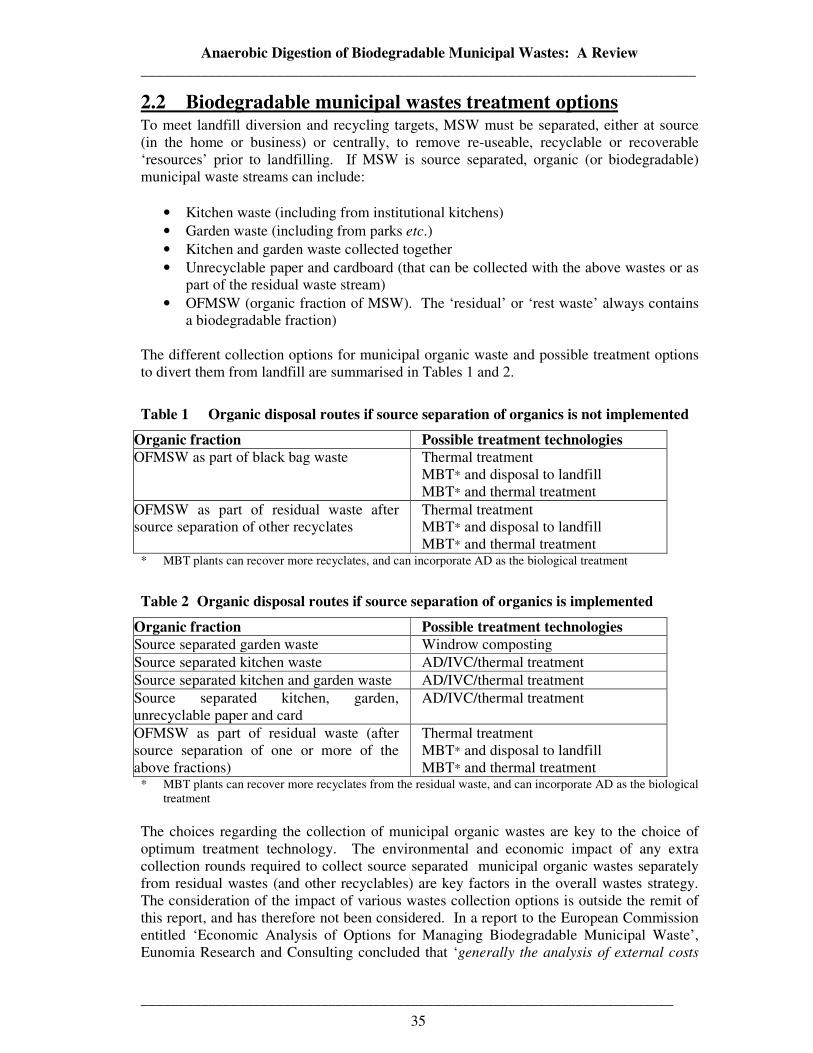
Anaerobic Digestion of Biodegradable Municipal Wastes: A Review __________________________________________________________________________
_______________________________________________________________________
35
2.2 Biodegradable municipal wastes treatment options To meet landfill diversion and recycling targets, MSW must be separated, either at source (in the home or business) or centrally, to remove re-useable, recyclable or recoverable ‘resources’ prior to landfilling. If MSW is source separated, organic (or biodegradable) municipal waste streams can include:
• Kitchen waste (including from institutional kitchens) • Garden waste (including from parks etc.) • Kitchen and garden waste collected together • Unrecyclable paper and cardboard (that can be collected with the above wastes or as
part of the residual waste stream) • OFMSW (organic fraction of MSW). The ‘residual’ or ‘rest waste’ always contains
a biodegradable fraction) The different collection options for municipal organic waste and possible treatment options to divert them from landfill are summarised in Tables 1 and 2.
Table 1 Organic disposal routes if source separation of organics is not implemented
Organic fraction Possible treatment technologies OFMSW as part of black bag waste Thermal treatment
MBT* and disposal to landfill MBT* and thermal treatment
OFMSW as part of residual waste after source separation of other recyclates
Thermal treatment MBT* and disposal to landfill MBT* and thermal treatment
* MBT plants can recover more recyclates, and can incorporate AD as the biological treatment
Table 2 Organic disposal routes if source separation of organics is implemented
Organic fraction Possible treatment technologies Source separated garden waste Windrow composting Source separated kitchen waste AD/IVC/thermal treatment Source separated kitchen and garden waste AD/IVC/thermal treatment Source separated kitchen, garden, unrecyclable paper and card
AD/IVC/thermal treatment
OFMSW as part of residual waste (after source separation of one or more of the above fractions)
Thermal treatment MBT* and disposal to landfill MBT* and thermal treatment
* MBT plants can recover more recyclates from the residual waste, and can incorporate AD as the biological treatment
The choices regarding the collection of municipal organic wastes are key to the choice of optimum treatment technology. The environmental and economic impact of any extra collection rounds required to collect source separated municipal organic wastes separately from residual wastes (and other recyclables) are key factors in the overall wastes strategy. The consideration of the impact of various wastes collection options is outside the remit of this report, and has therefore not been considered. In a report to the European Commission entitled ‘Economic Analysis of Options for Managing Biodegradable Municipal Waste’, Eunomia Research and Consulting concluded that ‘generally the analysis of external costs
Anaerobic Digestion of Biodegradable Municipal Wastes: A Review __________________________________________________________________________
_______________________________________________________________________
36
and benefits is favourable to the separate collection and treatment of biowastes through
composting or anaerobic digestion’. In addition, it has been observed in several European countries that the implementation of source separated wastes collection increases the possibility for implementing variable charging schemes, which (along with source separation itself) influence waste generation trends and act to highlight waste generation as an environmental issue amongst citizens. The most common systems for treating/disposing of municipal waste are landfill and mass burn incineration. Landfill and mass burn incineration are universally applicable but both systems are wasteful of resources – neither recovers energy particularly efficiently (Biffa, 2003). Other technologies (including AD, MBT with or without AD, gasification and pyrolysis) offer the possibility of enhanced materials recovery, enhanced energy recovery and reduced landfill. It is accepted as fact that the present level of landfill disposal for MSW, sewage sludge and other organic wastes is not a sustainable option (DEFRA, 2000). Aside from the requirements of the Landfill Directive and concerns over greenhouse gas emissions and climate change, in many areas of the UK the availability of landfill space is limited. Therefore, the cost of landfill is high and rising. As described above, European and UK policy is to minimise waste production, re-use and recycle as much waste as is practicable, and where neither of the above is possible, to recover energy from it. In any wastes strategy aimed at reducing the volume of wastes landfilled and recovering energy where possible, thermal treatment will have a role to play, even when recycling (and the use of biological treatments) is maximised. To meet the specific UK targets above, local authorities and waste management companies will need to invest in new wastes treatment plants. For the proportion of the wastes stream for which the best possible option is thermal energy recovery (such as unrecyclable paper and plastics), other emerging thermal waste treatment technologies such as gasification and pyrolysis could be preferable to incineration. Incineration, gasification and pyrolysis are described in Biffa (2003) and reviewed fully in Juniper (2001). The maximum recyclables recovery would be achieved by separating recyclables in the household (including BMW, that would be sent for biological treatment). Only minimal residual wastes would be sent to a MBT plant for further recyclables recovery. A MBT plant would also separate the high calorific value wastes (unrecyclable paper and plastics) that are most suitable for energy recovery by thermal treatment. The economics of various BMW treatment options (including both biological and thermal treatment options) have been analysed by Eunomia (2002a and 2002b), which noted that the costs of landfilling and incineration have shown a tendency to rise (owing to controls on pollutants) whereas the costs for enclosed composting and anaerobic digestion have shown a tendency to fall. For the source separated biowaste stream, biological treatments (AD or in-vessel composting) can produce a useable compost (if the system is designed and managed well) that enables the majority of the waste stream to be ‘recycled’. Under European and UK policy recycling is preferable to energy recovery (although AD processes would also recover energy as part of the recycling process). Compared to thermal treatments, the recovery of nutrients makes AD highly superior in terms of a sustainable wastes treatment concept for source separated biowastes. Moreover, AD has the potential to treat the ‘wet’ fraction of MSW that is less amenable to thermal treatments. In addition, the fly ash of the incineration treatment has to be deposited as hazardous waste. The content of chlorinated compounds in OFMSW is disadvantageous for incineration since it contributes to the formation of

Anaerobic Digestion of Biodegradable Municipal Wastes: A Review __________________________________________________________________________
_______________________________________________________________________
37
hydrogen chloride (HCl) and products of incomplete combustion (PICs) such as polychlorinated dibenzo-p-dioxins and polychlorinated dibenzofurans (PCDD/PCDFs) are formed (Kanters and Louw, 1994). Incineration plants would therefore benefit from not receiving OFMSW (Hartmann and Ahring, 2006). Consequently, biological treatment and incineration are not competing treatment processes for source separated organics but should be seen as technologies for two separate waste streams, i.e., the biodegradable and the non-biodegradable waste (Alexiou and Osada, 2000). Considering the residual wastes (wastes remaining after the source separation of recyclables), MBT plants can divert a significant proportion of the residual waste from landfill. MBT plants can recover recyclables from the residual waste, and can separate the high calorific fractions of the residual waste (e.g. packaging, unrecyclable paper and plastics) which can be treated in thermal treatment processes. MBT plants also separate the organic fraction, which can be treated biologically by AD (or IVC). In most MBT plants incorporating AD, the energy from the AD of the OFMSW can cover all the requirements of the MBT plant and produce excess (net) electricity and heat. Although a potential option for residual wastes, conventional incineration or other thermal treatments are unlikely to be either popular politically (due to public opposition), or especially well-suited to the treatment of biowastes or OFMSW, mainly due to the high water content (often > 70 %) and low calorific value. If kitchen/food waste is incinerated as part of the residual wastes stream (or indeed put through a MBT plant rather than source separated) the organic material and nutrients which would be beneficial to soil would be lost.
2.3 Biological options for the treatment of biowastes The biological options for the treatment of biowastes (either source separated BMW, or centrally separated OFMSW) are anaerobic digestion (AD) and in-vessel composting (IVC). Anaerobic digestion is the process of the biodegradation of complex organic matter (animal waste, plant matter, or synthetic organic matter) to its simpler chemical constituents, and ultimately methane and carbon dioxide, by a consortium of bacteria in the absence of oxygen. Anaerobic digestion plants maintain the biological process in an enclosed and controllable environment. Composting is the biodegradation of organic matter by bacteria, fungi and actinomycetes in the presence of oxygen, producing mainly carbon dioxide. ‘In-vessel’ composting technologies maintain the composting process in an enclosed and controllable environment. In-vessel composting and anaerobic digestion as BMW treatment technologies are compared in the following sections, in particular in terms of economics and environmental issues. Due to fact that both IVC and AD facilities would need to comply with the Animal By-products Regulations (ABPR), the ABPR are briefly summarised before the comparisons.
2.3.1 Animal By-products Regulations (ABPR) Animal By-Products Regulations are intended to prevent the spread of serious animal diseases and other pathogens that can be present in meat or meat products. Compliance with the ABPR ensures that sufficient pathogen removal has occurred so that the treated material can be spread on land. The European Animal By-Products Regulation (EC) No. 1774/2002 controls the collection, transport, storage, handling, processing and use of disposed animal by-products in EU member states. The legislation in full is available on the DEFRA website ([c] Accessed September 2006). In Wales the Animal By-Products (Wales) Regulations
Anaerobic Digestion of Biodegradable Municipal Wastes: A Review __________________________________________________________________________
_______________________________________________________________________
38
2003 (SI 2003/2756 W.267) are applicable, and are available in full at the Office for Public Sector Information website (Accessed September 2005). As part of meeting the Animal By-products Regulations, all composting and AD facilities treating food/kitchen waste must be approved for operation by a ‘competent authority’ in order to operate legally. In Wales, this competent authority is the National Assembly for Wales, while in England it is the State Veterinary Service (SVS). The ABPR divides animal by-products into 3 categories:
• Category 1 is high risk and must be incinerated. • Category 2 is material unfit for human consumption, e.g. fallen stock and animals
which have failed inspections. Most types of this material must be incinerated or rendered.
• Category 3 is material which is fit for but not destined for human consumption. Category 3 material may be incinerated, rendered or transformed in a composting or biogas plant.
Category 3 material includes:
• Abattoir by-products such as soft offal, blood and feathers. • Category 2 material which has been pressure-cooked. • Food factory waste. • Food waste from retail outlets, in particular supermarkets. • Catering waste, including kitchen waste from domestic households and commercial
kitchen waste.
For AD, the UK ABPR requires that waste potentially containing meat products be treated in an enclosed vessel for a minimum of 5 hours at a temperature over 57oC (maximum particle size 50 mm) or treated at 70oC for a minimum of 1 hour (maximum particle size 60 mm). For IVC systems the temperature/time requirements are 70oC for a minimum of 1 hour (maximum particle size 60 mm), or 60oC for a minimum of 2 days (maximum particle size 400 mm). Housed windrow systems must exceed 60oC for a minimum of 8 days during which the windrow must be turned at least 3 times at no less than 2 day intervals (maximum particle size 400 mm) In addition to meeting the temperature/time requirements, all biological treatment systems must include one of the additional barriers outlined below (DEFRA website [d], Accessed September 2006). a). Raw material must be meat-excluded catering waste. b). (For compost) a second composting stage, using any of the above standards. For this
second stage, windrowing does not need to be housed and can be done open (but the time/temperature and turning requirements remain the same as for housed windrows).
c). Storage for a minimum of 18 days (this need not be in an enclosed system). Biogas plants must include one of the additional barriers (a, b or c). Composting plants must either use barrier (b), or both barriers (a) and (c). Therefore, there must either be two composting stages, or for meat-excluded catering waste only, one composting stage followed by storage. Given that all wastes treatment technologies potentially required to divert OFMSW or BMW (containing kitchen waste) from landfill will be required to meet the ABPR to the satisfaction of the National Assembly in Wales,(or the State Veterinary Service in England),
Anaerobic Digestion of Biodegradable Municipal Wastes: A Review __________________________________________________________________________
_______________________________________________________________________
39
the ABPR is a very important piece of legislation when considering treatment options. Compared to IVC processes, AD systems are ideally suited to meet the ABPR temperature/time requirements with only marginally increased capital costs, given the excess heat that is produced on site. There is no reason why AD plants treating OFMSW or BMW should find compliance with the ABPR problematic. AD has the advantage in comparison to IVC in that if a higher temperature is required in the future, it can easily be adjusted. DEFRA guidance on the treatment in approved composting or biogas plants of animal by-products and catering waste is available on the DEFRA website ([e] Accessed September 2006).
2.3.2 Comparisons of AD and IVC systems Whether the organic waste is separated at source or centrally separated, it is assumed that the collection costs will be the same irrespective of the type of treatment process they are delivered to (either AD or IVC). Larger scale centralised systems may of course involve transporting waste over longer distances than smaller localised treatment systems. As the quality of the incoming biowaste is the most important factor in the production of a good quality ‘compost’, it is assumed that both AD and IVC technologies treating the same incoming wastes will produce similar standards of agriculturally beneficial composts (see Section 2.6.2). Therefore, as the systems can be assumed to be treating the same quality of organic wastes, it can be assumed that the impact the two technologies have on recycling/composting targets will be the same (100% minus inorganic contaminants for source separated wastes streams provided quality is maintained). It is assumed that the CLO from both processes will be suitable for land application in the UK (as long as the quality of the source separation is maintained). It will be assumed that 1 tonne of AD digestate will incur/generate the same disposal costs or revenues as 1 tonne of in-vessel compost output. It is also assumed that AD and IVC will produce a similar volume of ‘compost’. A mass balance from a Dutch study (van Zanten, Accessed 2005) revealed that AD produced 320 tonnes of ‘compost’ per 1000 tonnes biowaste treated, compared to 340 tonnes per 1000 tonnes of biowaste treated by the in-vessel composter. There are many different options within ‘anaerobic digestion’ or ‘aerobic composting’. A brief summary of anaerobic systems can be found in ‘A guide to Anaerobic Digestion’ (Composting Association, 2005). A brief summary of aerobic systems can be found in ‘A guide to In-Vessel Composting’ (Composting Association, 2005). As with anaerobic systems, there are a variety of aerobic composting systems available on the market. As well as in the UK, the market for aerobic systems is much more mature than that for anaerobic systems at the EU level. This is reflected in the relative take up of the technologies, with composting accounting for some 14 million tonnes of the 17 million tonnes or so of treatment capacity for separately collected biowaste (Eunomia, 2004). Much of this tonnage however, can be attributed to the windrow composting of garden waste. Nevertheless, the take up of AD relative to composting has increased significantly on continental Europe in recent years due to factors including: improved operational knowledge; greater experience with the process; process optimisation and subsequent cost reductions and the increasing importance (and cost) of energy.
2.3.2.2 AD and IVC: An environmental comparison
From the literature there is a clear consensus that from an environmental and ecological point of view anaerobic digestion is preferable to composting (Edelmann et al. (2001);
Anaerobic Digestion of Biodegradable Municipal Wastes: A Review __________________________________________________________________________
_______________________________________________________________________
40
Edelmann and Schleiss (2000); Sonesson et al. (2000); Ericsson et al. (2005); Bjorklund et
al. (1999); Fricke et al. (2005); van Zanten (Accessed 2005)). The main reason for this is that AD is energy positive due to the production of biogas, while aerobic composting requires additional energy for turning the windrows and/or for artificial aeration. In addition to the carbon saving provided by the difference in energy balance, AD has been shown to have lower carbon dioxide emissions than composting (van Zanten, Accessed 2005). AD also usually has a shorter retention time (even with aerobic post-treatment) and therefore requires less space than IVC to treat the same throughput of wastes. A number of Life Cycle Analysis (LCA) studies have come to the conclusion that the treatment of biowastes by AD is by far the most environmentally sound option, with fully enclosed composting showing high environmental impacts. Edelmann et al. (2001) used LCA to compare small scale (10,000 tpa) processes to treat organic household wastes (as well as co-digestion plants with agricultural wastes), aiming to get more detailed information to enhance future decision making. AD of OFMSW showed an excellent LCA performance, proving AD to be advantageous as compared to composting, incineration or combination of digestion and composting, mainly because of a better energy balance. From an ecological point of view, anaerobic digestion with an enclosed aerobic post-treatment showed by far the very best performance in all areas, followed by digestion combined with open composting. Windrow composting showed environmental impacts similar to incineration. The non-renewable energy required by IVC systems causes large environmental impacts in most of the impact categories, especially for treating technologies which show a high energy demand for plant operation. Mainly for this reason, fully enclosed composting plants were found to show the highest environmental impacts (Edelmann et al., 2001), even when compared to windrow composting and incineration. Edelmann et al. (2001) strongly recommend to treat as much material as possible anaerobically in the future, and suggested that ‘it seems to be reasonable to adapt the (Swiss) national laws on waste management in favour of anaerobic digestion. Edelmann and Schleiss (2000) used LCA to compare various in-vessel composting options with various AD and AD plus composting configurations. Incineration was also included in the study. As well as concluding that the ecological and the economic comparisons show that the biological treatments for biowastes are generally favourable to incineration the authors’ conclusions include the following points:
• ‘AD plants are better from an ecological point of view, because they do not need external
fossil and electrical energy. The production of renewable energy has positive consequences on nearly all impact categories, because of saving of or compensation for nuclear and fossil energy. This reduces the impacts of parameters such as radioactivity,
dust, SO2, CO, NOx, greenhouse gases, ozone depletion, acidification or carcinogenic substances’.
• ‘Regarding the heat resource produced by the two methods, it was concluded that it is nearly impossible to take advantage of waste heat produced while composting, while digestion plants could show a better eco-balance if they were constructed near an industry, which could use the waste heat from electricity production all year round.’
Edelmann and Schleiss (2000) concluded that for biowastes, AD is environmentally superior to composting, noting that:
‘Looking at the results of the eco-balance and the economic situation, it is difficult to
understand that today composting plants are constructed, where high value fossil and
Anaerobic Digestion of Biodegradable Municipal Wastes: A Review __________________________________________________________________________
_______________________________________________________________________
41
nuclear energy is invested to destroy the renewable solar energy, which is fixed in the
chemical compounds of biomass and thus in the biogenic waste’. Bjorklund et al. (1999) used LCA methodology to compare waste management options for a Swedish municipality. Similar to the other LCA results available, it was found that anaerobic digestion of biodegradable waste can reduce the net environmental impact, while large-scale composting either increases environmental impact or gives less reduction than anaerobic digestion. Bjorklund et al. (1999) recommended that large-scale composting of household biodegradable waste must only be considered a temporary solution to motivate households to source separate biodegradable waste before this fraction is also anaerobically digested. For the treatment of MSW, after mechanical separation, Fricke et al. (2005) reported that in comparison to aerobic processes, AD can be ecologically advantageous, particularly with regard to energy balances and exhaust emissions. Conversely, AD processes produce more wastewater than aerobic composting, with resultant wastewater treatment requirements. Another study, van Zanten (Accessed 2005), quantified this wastewater production at 305 kg per tonne biowaste treated, compared to 120 kg per tonne treated aerobically. It must be remembered that there are many other different aerobic and anaerobic configurations producing different volumes of wastewater. Fricke et al. (2005) confirmed that with the rising relevancy of climate change and the utilisation of renewable energies AD for the treatment of MSW has a high potential for further development. A study carried out over 12 months in the Netherlands (van Zanten, Accessed 2005) compared an AD process and an IVC process treating similar garden, food and vegetable (GFV) wastes at a similar scale. The AD process was reported to better mitigate carbon dioxide emissions. Taking into account the organic part in the compost production and the net energy consumption, the total CO2 reduction can be calculated as 173 kg CO2/tonne GFV waste treated for the anaerobic digestion plant and 158 kg/tonne for the composting plant. As anaerobic digestion also produces biogas, it could contribute further to reducing CO2 emissions. It was reported that both plants produce high-quality compost, free of weed seeds, meeting the general Dutch requirements for maturity. Several studies have attempted to quantify the difference in energy balances between AD and aerobic composting. Verma (2002) stated that aerobic composting required 50 – 75 kWh of electricity per tonne of MSW input, compared to AD producing 75 – 150 kWh of electricity from methane per tonne of MSW input. A difference of 125 – 225 kWh of electricity per tonne of waste. Van Zanten (Accessed 2005) compared the treatment of biowaste by AD and an IVC over a 12 month period and found that the anaerobic digestion plant produced 366 MJ (102 kWh) of net energy per tonne of (garden, food and vegetable) waste, whereas the composting plant consumed 261 MJ (73 kWh) per tonne of biowaste. This represents a difference of 627 MJ or 175 kWh per tonne of biowaste. It has been shown that a composting plant treating 15,000 tpa of OFMSW requires 0.75 million kWh/a of energy input, whereas the treatment of this waste anaerobically would produce approximately 2.4 million kWh/a (Mata-Alvarez et al., 2000). These figures represent an energy difference of 210 kWh/t of waste treated in favour of AD over IVC. Taking into account the primary energy for construction and running of the plants, i.e. including all losses from the moment of extracting crude oil or uranium, as well as the substitution of nuclear and fossil energy by renewable biogas, there is an energy difference as large as 700 kWh/tonne comparing anaerobic digestion with fully enclosed tunnel composting (Edelmann et al., 2001). Given the western world’s accepted over-reliance on fossil fuels
Anaerobic Digestion of Biodegradable Municipal Wastes: A Review __________________________________________________________________________
_______________________________________________________________________
42
and concern about security of energy supplies, this difference in energy balances assumes extra importance. From the above comparisons, it is clear that anaerobic digestion is environmentally favourable to IVC for biowastes treatment, particularly from the carbon emission saving and energy perspectives. There is considerable support in the scientific literature recommending AD as the best environmental option for biowastes treatment. In addition, renewable energy from the AD of OFMSW was found to show the best LCA results of all renewable energies (including wind power, photovoltaics and hydro) (ESU-Services, 2000).
2.3.2.3 AD and IVC: An economic comparison Comparing the economics of BMW treatment options is not straightforward. The various biological treatment options for BMW (AD and IVC) vary greatly in their design and complexity. Due to this and other factors (listed below) the capital and operating costs of BMW treatment processes vary widely. Although this report aims to supply consistent, comparable figures from case studies in Europe, any referenced data refers to different processes in different circumstances. In the literature, some capital cost information refers to whole turnkey projects, for example MBT plants, including costly mechanical separation equipment to deal with un-segregated (black bag or residual) MSW, others include the price of the land, the cost of connecting to existing infrastructure, construction costs or other costs. It is not always clear what is or is not included, and therefore the price of the ‘biological’ part of these systems is difficult to compare. Also, the information on costs provided by suppliers (if supplied at all) varies in detail. Even assuming that the organic waste stream is similar, different options have different fitness for purpose, quality guarantees, maintenance costs and operating lives. Various solutions from many suppliers could successfully be adapted to fit individual requirements. Almost all suppliers warn against making judgements based on capital cost alone. It must be remembered that suppliers of these processes are in competition with each other and as such are reluctant to share information, especially concerning costs. Reasons for variations in capital and operating costs include the following factors (many of which are applicable to IVC systems as well as to AD systems:
• Different wastes treated. • Different biological process used. • Plants built to meet different legislation. Different emissions controls. Tighter
legislation = higher cost. • Complexity of mechanical pre and post-treatment. • Treatment capacity of the plant. Larger plants benefit from economies of scale. • Retention time of process. • Different desired output uses and quality requirements, or disposal costs revenues.
Higher quality = potentially higher cost. • Energy costs (heating/aeration), and national/regional variations in these costs. • Required buffer and stand-by capacities or arrangements. • Costs of ancillary services. • ‘Bolt-ons’ used (gas scrubbers, gas storage, CHP unit, water supply, de-watering
and treatment, on-site EfW plant).
Anaerobic Digestion of Biodegradable Municipal Wastes: A Review __________________________________________________________________________
_______________________________________________________________________
43
• Location of plant. Costs vary not only country to country as well as region to region. Also significant is the exact location within the region, e.g. whether the facility is to be located in or near an urban residential area determines the importance placed on restricting odour emissions, or a site located in a rural area may need to be visually unobtrusive.
• Price variations over time. • Time of construction. Labour and land costs will probably have risen, but
technology and process efficiency may be much advanced since the year of construction.
• Fiscal and trading mechanisms are increasingly being used as tools to promote changes in environmental policy. These so called ‘market-distorters’ (Landfill tax, LATS fines, ROCs) already play a major role in determining the overall economics of a project (Juniper, 2005).
Many AD plants treat not only source separated food waste, but a variety of other organic wastes, agricultural or commercial, garden wastes or even energy crops, depending on local policies, conditions and requirements. Many IVC reference sites also treat garden waste and other biodegradable wastes. This ‘co-treatment’ with other wastes can bring great benefits to both plant economics in terms of gate fees (or increased biogas yield in the case of AD), and efficiency of operation (garden and paper/cardboard waste supplies much needed structure in composters, and agricultural wastes can enhance operational stability in anaerobic digesters when treated alongside kitchen waste). According to DEFRA estimations, the capital costs of an IVC plant range between £1 million and £5 million for plants with capacity between 10,000 tpa to 100,000 tpa. Operating costs for an in-vessel system are estimated at £20 - 30 per tonne (DEFRA website [a], accessed October 2006). The capital cost of a 10,000 tpa AD plant for catering waste is estimated to be £1.8m, excluding the cost of the land. The operating cost for labour, maintenance, management and digestate disposal, but excluding finance, depreciation, land costs and rates, is estimated to be £15 per tonne. The income from the sale of green electricity is expected to be a minimum of £12 per tonne, giving net operating costs of £3 per tonne (DEFRA website [a], accessed October 2006). Using these DEFRA figures, the economics of AD plants look favourable to IVC plants in terms of operating costs and payback periods. Partl and Steiner (2002) estimated that the total costs of large scale (85,000 tpa) IVC system is between €55 - 90/t (£37.00/t - £61.20/t), including the cost of finance. An anaerobic digestion system of a similar scale is estimated to cost €70 – 110/t (£47.60/t - £74.80/t), including finance. Perhaps the most in-depth publicly available studies to date on the costs of BMW/OFMSW treatment have been carried out by Eunomia Research and Consulting. Two reports in particular are recommended to the reader with a particular interest in the economic aspects of biodegradable municipal wastes treatment. These are ‘Costs for Municipal Waste Management in the EU’ (2002a), delivered to the Directorate General Environment of the European Commission and ‘Economic Analysis of Options for Managing Biodegradable Municipal Wastes’ (2002b), also delivered to the European Commission. Eunomia (2002a) and Eunomia (2002b) summarise the costs for AD, as in Table 3 and Table 4, but state that few detailed breakdowns of costs are available and that all UK data is based on estimates due to the lack of operating data. Eunomia (2002a) noted that ‘it appears that costs for AD are coming down, and discussions with
some process technologists suggests this relates to improved understanding and control of
the digestion process (allowing, amongst other things, control of partitioning between
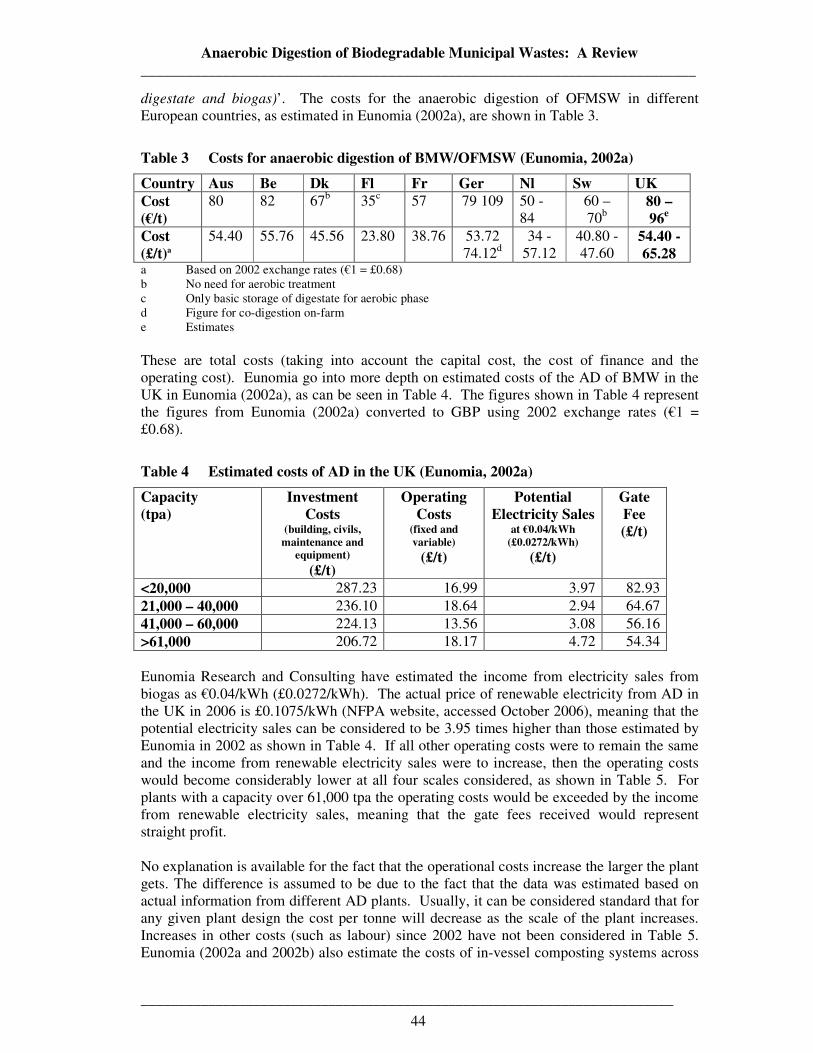
Anaerobic Digestion of Biodegradable Municipal Wastes: A Review __________________________________________________________________________
_______________________________________________________________________
44
digestate and biogas)’. The costs for the anaerobic digestion of OFMSW in different European countries, as estimated in Eunomia (2002a), are shown in Table 3.
Table 3 Costs for anaerobic digestion of BMW/OFMSW (Eunomia, 2002a)
Country Aus Be Dk Fl Fr Ger Nl Sw UK Cost (€/t)
80 82 67b 35c 57 79 109 50 - 84
60 – 70b
80 – 96e
Cost (£/t)a
54.40 55.76 45.56 23.80 38.76 53.72 74.12d
34 - 57.12
40.80 - 47.60
54.40 - 65.28
a Based on 2002 exchange rates (€1 = £0.68) b No need for aerobic treatment c Only basic storage of digestate for aerobic phase d Figure for co-digestion on-farm e Estimates These are total costs (taking into account the capital cost, the cost of finance and the operating cost). Eunomia go into more depth on estimated costs of the AD of BMW in the UK in Eunomia (2002a), as can be seen in Table 4. The figures shown in Table 4 represent the figures from Eunomia (2002a) converted to GBP using 2002 exchange rates (€1 = £0.68).
Table 4 Estimated costs of AD in the UK (Eunomia, 2002a)
Capacity (tpa)
Investment Costs
(building, civils, maintenance and
equipment) (£/t)
Operating Costs
(fixed and variable)
(£/t)
Potential Electricity Sales
at €0.04/kWh (£0.0272/kWh)
(£/t)
Gate Fee (£/t)
<20,000 287.23 16.99 3.97 82.93 21,000 – 40,000 236.10 18.64 2.94 64.67 41,000 – 60,000 224.13 13.56 3.08 56.16 >61,000 206.72 18.17 4.72 54.34 Eunomia Research and Consulting have estimated the income from electricity sales from biogas as €0.04/kWh (£0.0272/kWh). The actual price of renewable electricity from AD in the UK in 2006 is £0.1075/kWh (NFPA website, accessed October 2006), meaning that the potential electricity sales can be considered to be 3.95 times higher than those estimated by Eunomia in 2002 as shown in Table 4. If all other operating costs were to remain the same and the income from renewable electricity sales were to increase, then the operating costs would become considerably lower at all four scales considered, as shown in Table 5. For plants with a capacity over 61,000 tpa the operating costs would be exceeded by the income from renewable electricity sales, meaning that the gate fees received would represent straight profit. No explanation is available for the fact that the operational costs increase the larger the plant gets. The difference is assumed to be due to the fact that the data was estimated based on actual information from different AD plants. Usually, it can be considered standard that for any given plant design the cost per tonne will decrease as the scale of the plant increases. Increases in other costs (such as labour) since 2002 have not been considered in Table 5. Eunomia (2002a and 2002b) also estimate the costs of in-vessel composting systems across
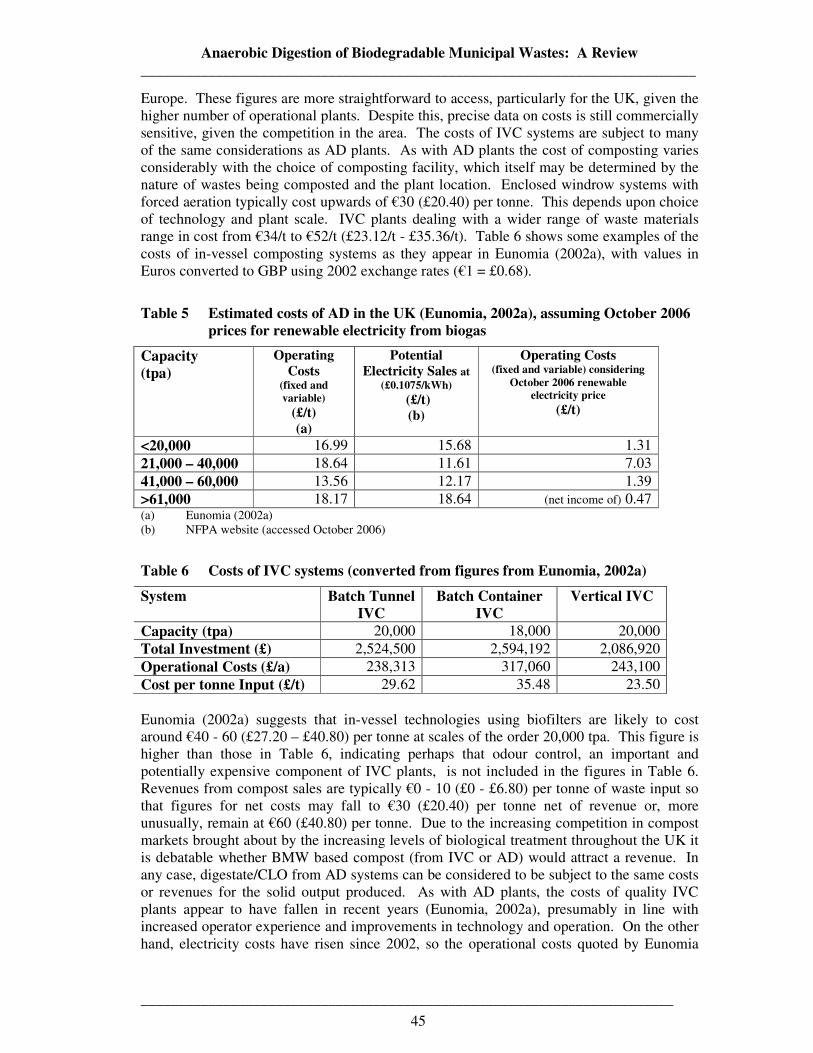
Anaerobic Digestion of Biodegradable Municipal Wastes: A Review __________________________________________________________________________
_______________________________________________________________________
45
Europe. These figures are more straightforward to access, particularly for the UK, given the higher number of operational plants. Despite this, precise data on costs is still commercially sensitive, given the competition in the area. The costs of IVC systems are subject to many of the same considerations as AD plants. As with AD plants the cost of composting varies considerably with the choice of composting facility, which itself may be determined by the nature of wastes being composted and the plant location. Enclosed windrow systems with forced aeration typically cost upwards of €30 (£20.40) per tonne. This depends upon choice of technology and plant scale. IVC plants dealing with a wider range of waste materials range in cost from €34/t to €52/t (£23.12/t - £35.36/t). Table 6 shows some examples of the costs of in-vessel composting systems as they appear in Eunomia (2002a), with values in Euros converted to GBP using 2002 exchange rates (€1 = £0.68).
Table 5 Estimated costs of AD in the UK (Eunomia, 2002a), assuming October 2006 prices for renewable electricity from biogas
Capacity (tpa)
Operating Costs
(fixed and variable)
(£/t) (a)
Potential Electricity Sales at
(£0.1075/kWh) (£/t) (b)
Operating Costs (fixed and variable) considering
October 2006 renewable electricity price
(£/t)
<20,000 16.99 15.68 1.31 21,000 – 40,000 18.64 11.61 7.03 41,000 – 60,000 13.56 12.17 1.39 >61,000 18.17 18.64 (net income of) 0.47 (a) Eunomia (2002a) (b) NFPA website (accessed October 2006)
Table 6 Costs of IVC systems (converted from figures from Eunomia, 2002a)
System Batch Tunnel IVC
Batch Container IVC
Vertical IVC
Capacity (tpa) 20,000 18,000 20,000 Total Investment (£) 2,524,500 2,594,192 2,086,920 Operational Costs (£/a) 238,313 317,060 243,100 Cost per tonne Input (£/t) 29.62 35.48 23.50 Eunomia (2002a) suggests that in-vessel technologies using biofilters are likely to cost around €40 - 60 (£27.20 – £40.80) per tonne at scales of the order 20,000 tpa. This figure is higher than those in Table 6, indicating perhaps that odour control, an important and potentially expensive component of IVC plants, is not included in the figures in Table 6. Revenues from compost sales are typically €0 - 10 (£0 - £6.80) per tonne of waste input so that figures for net costs may fall to €30 (£20.40) per tonne net of revenue or, more unusually, remain at €60 (£40.80) per tonne. Due to the increasing competition in compost markets brought about by the increasing levels of biological treatment throughout the UK it is debatable whether BMW based compost (from IVC or AD) would attract a revenue. In any case, digestate/CLO from AD systems can be considered to be subject to the same costs or revenues for the solid output produced. As with AD plants, the costs of quality IVC plants appear to have fallen in recent years (Eunomia, 2002a), presumably in line with increased operator experience and improvements in technology and operation. On the other hand, electricity costs have risen since 2002, so the operational costs quoted by Eunomia
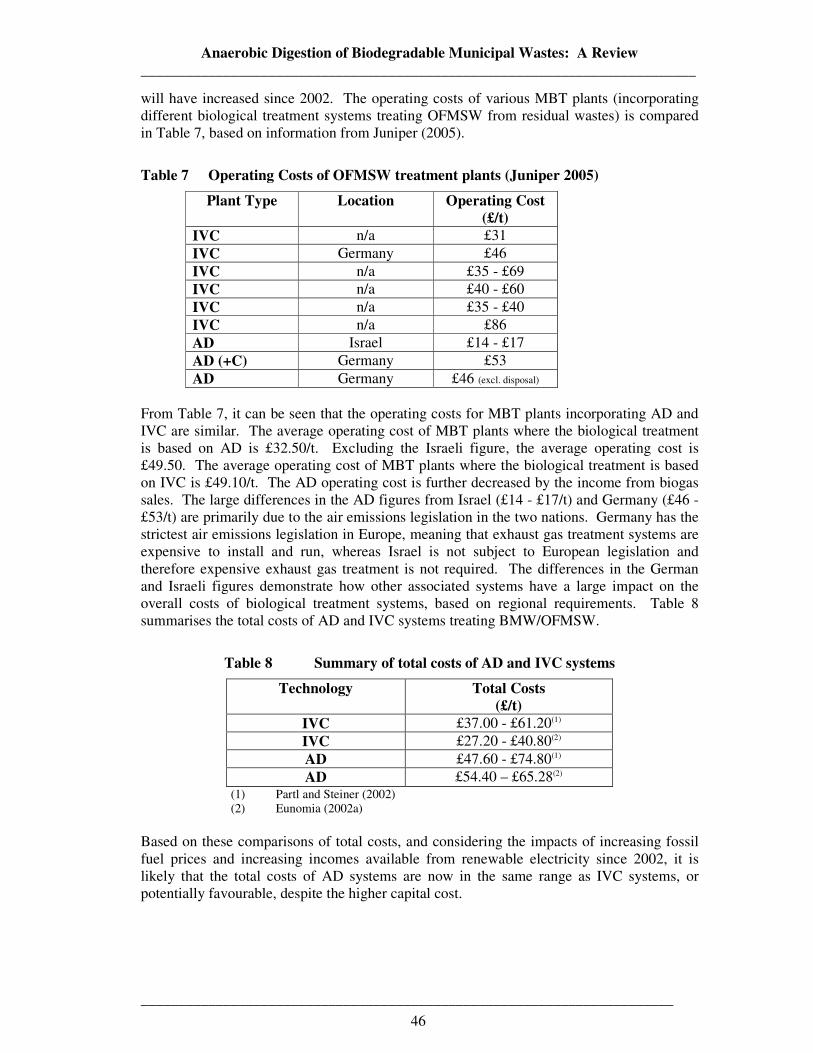
Anaerobic Digestion of Biodegradable Municipal Wastes: A Review __________________________________________________________________________
_______________________________________________________________________
46
will have increased since 2002. The operating costs of various MBT plants (incorporating different biological treatment systems treating OFMSW from residual wastes) is compared in Table 7, based on information from Juniper (2005).
Table 7 Operating Costs of OFMSW treatment plants (Juniper 2005)
Plant Type Location Operating Cost (£/t)
IVC n/a £31 IVC Germany £46 IVC n/a £35 - £69 IVC n/a £40 - £60 IVC n/a £35 - £40 IVC n/a £86 AD Israel £14 - £17 AD (+C) Germany £53 AD Germany £46 (excl. disposal)
From Table 7, it can be seen that the operating costs for MBT plants incorporating AD and IVC are similar. The average operating cost of MBT plants where the biological treatment is based on AD is £32.50/t. Excluding the Israeli figure, the average operating cost is £49.50. The average operating cost of MBT plants where the biological treatment is based on IVC is £49.10/t. The AD operating cost is further decreased by the income from biogas sales. The large differences in the AD figures from Israel (£14 - £17/t) and Germany (£46 - £53/t) are primarily due to the air emissions legislation in the two nations. Germany has the strictest air emissions legislation in Europe, meaning that exhaust gas treatment systems are expensive to install and run, whereas Israel is not subject to European legislation and therefore expensive exhaust gas treatment is not required. The differences in the German and Israeli figures demonstrate how other associated systems have a large impact on the overall costs of biological treatment systems, based on regional requirements. Table 8 summarises the total costs of AD and IVC systems treating BMW/OFMSW.
Table 8 Summary of total costs of AD and IVC systems
Technology Total Costs (£/t)
IVC £37.00 - £61.20(1) IVC £27.20 - £40.80(2) AD £47.60 - £74.80(1) AD £54.40 – £65.28(2)
(1) Partl and Steiner (2002) (2) Eunomia (2002a)
Based on these comparisons of total costs, and considering the impacts of increasing fossil fuel prices and increasing incomes available from renewable electricity since 2002, it is likely that the total costs of AD systems are now in the same range as IVC systems, or potentially favourable, despite the higher capital cost.
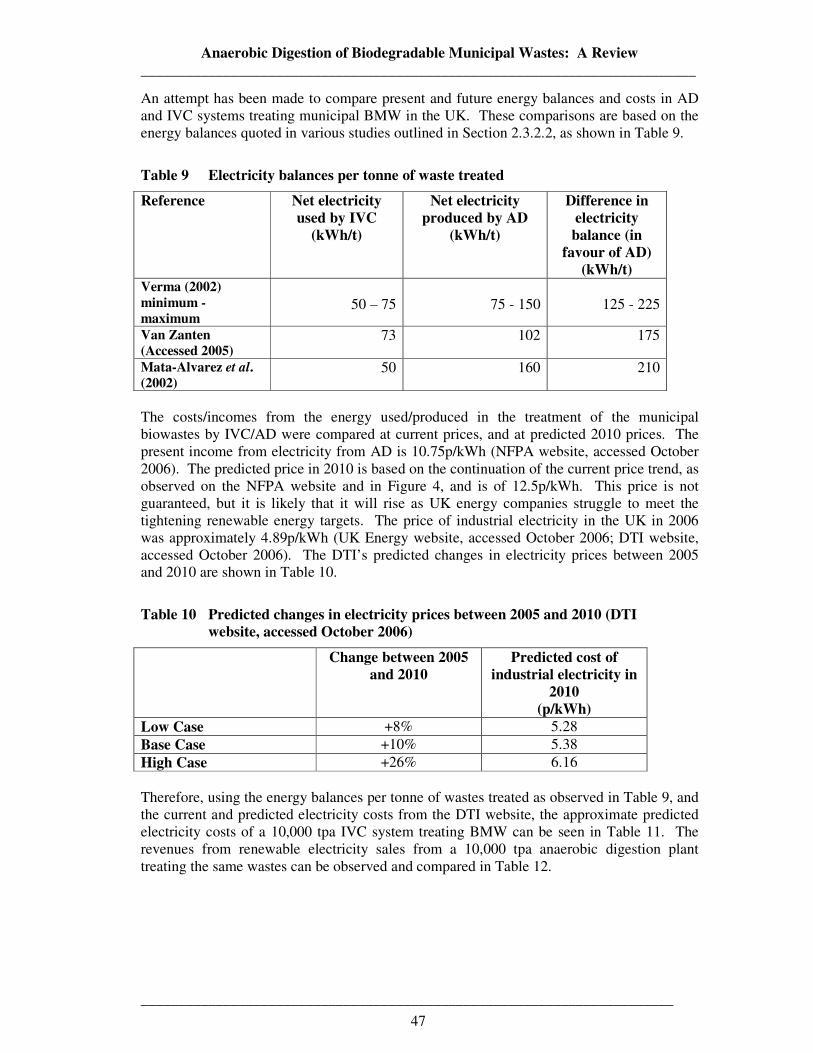
Anaerobic Digestion of Biodegradable Municipal Wastes: A Review __________________________________________________________________________
_______________________________________________________________________
47
An attempt has been made to compare present and future energy balances and costs in AD and IVC systems treating municipal BMW in the UK. These comparisons are based on the energy balances quoted in various studies outlined in Section 2.3.2.2, as shown in Table 9.
Table 9 Electricity balances per tonne of waste treated
Reference Net electricity used by IVC
(kWh/t)
Net electricity produced by AD
(kWh/t)
Difference in electricity balance (in
favour of AD) (kWh/t)
Verma (2002) minimum - maximum
50 – 75
75 - 150
125 - 225
Van Zanten (Accessed 2005)
73 102 175
Mata-Alvarez et al. (2002)
50 160 210
The costs/incomes from the energy used/produced in the treatment of the municipal biowastes by IVC/AD were compared at current prices, and at predicted 2010 prices. The present income from electricity from AD is 10.75p/kWh (NFPA website, accessed October 2006). The predicted price in 2010 is based on the continuation of the current price trend, as observed on the NFPA website and in Figure 4, and is of 12.5p/kWh. This price is not guaranteed, but it is likely that it will rise as UK energy companies struggle to meet the tightening renewable energy targets. The price of industrial electricity in the UK in 2006 was approximately 4.89p/kWh (UK Energy website, accessed October 2006; DTI website, accessed October 2006). The DTI’s predicted changes in electricity prices between 2005 and 2010 are shown in Table 10.
Table 10 Predicted changes in electricity prices between 2005 and 2010 (DTI website, accessed October 2006)
Change between 2005 and 2010
Predicted cost of industrial electricity in
2010 (p/kWh)
Low Case +8% 5.28 Base Case +10% 5.38 High Case +26% 6.16 Therefore, using the energy balances per tonne of wastes treated as observed in Table 9, and the current and predicted electricity costs from the DTI website, the approximate predicted electricity costs of a 10,000 tpa IVC system treating BMW can be seen in Table 11. The revenues from renewable electricity sales from a 10,000 tpa anaerobic digestion plant treating the same wastes can be observed and compared in Table 12.
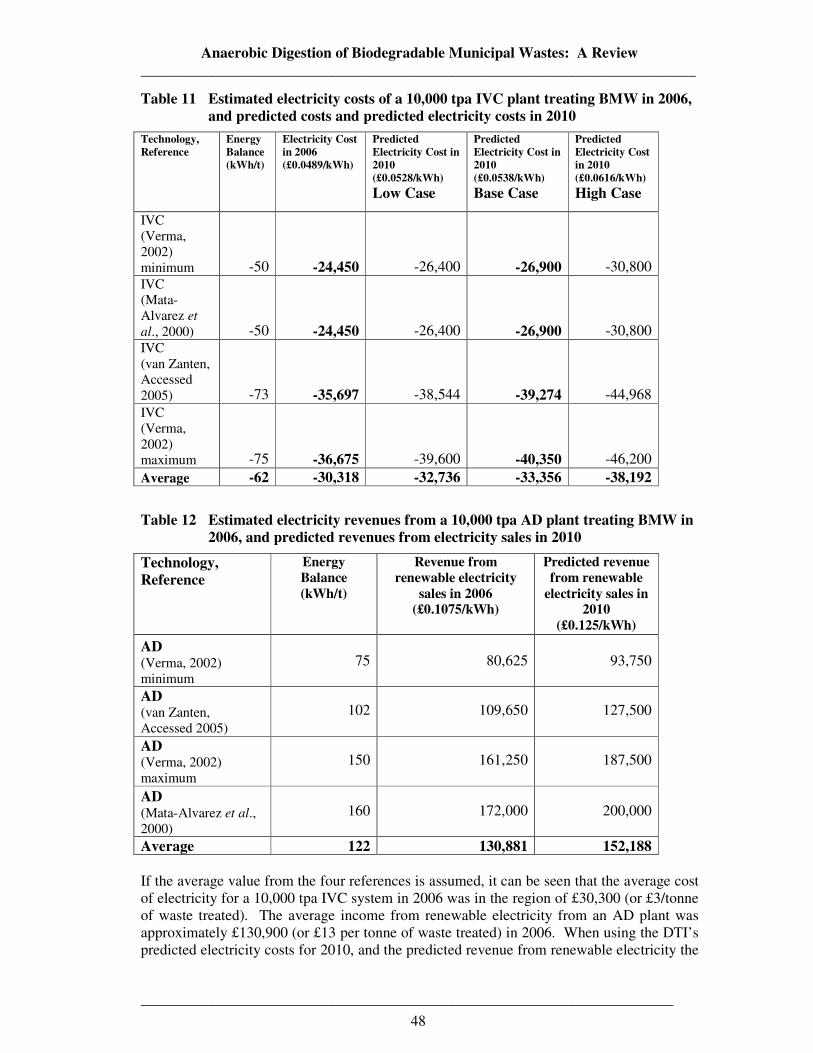
Anaerobic Digestion of Biodegradable Municipal Wastes: A Review __________________________________________________________________________
_______________________________________________________________________
48
Table 11 Estimated electricity costs of a 10,000 tpa IVC plant treating BMW in 2006, and predicted costs and predicted electricity costs in 2010
Technology, Reference
Energy Balance (kWh/t)
Electricity Cost in 2006 (£0.0489/kWh)
Predicted Electricity Cost in 2010 (£0.0528/kWh)
Low Case
Predicted Electricity Cost in 2010 (£0.0538/kWh)
Base Case
Predicted Electricity Cost in 2010 (£0.0616/kWh)
High Case
IVC (Verma, 2002) minimum -50 -24,450 -26,400 -26,900 -30,800 IVC (Mata-Alvarez et
al., 2000) -50 -24,450 -26,400 -26,900 -30,800 IVC (van Zanten, Accessed 2005) -73 -35,697 -38,544 -39,274 -44,968 IVC (Verma, 2002) maximum -75 -36,675 -39,600 -40,350 -46,200 Average -62 -30,318 -32,736 -33,356 -38,192
Table 12 Estimated electricity revenues from a 10,000 tpa AD plant treating BMW in 2006, and predicted revenues from electricity sales in 2010
Technology, Reference
Energy Balance (kWh/t)
Revenue from renewable electricity
sales in 2006 (£0.1075/kWh)
Predicted revenue from renewable
electricity sales in 2010
(£0.125/kWh)
AD (Verma, 2002) minimum
75
80,625
93,750
AD (van Zanten, Accessed 2005)
102
109,650
127,500
AD (Verma, 2002) maximum
150
161,250
187,500
AD (Mata-Alvarez et al., 2000)
160
172,000
200,000
Average 122 130,881 152,188 If the average value from the four references is assumed, it can be seen that the average cost of electricity for a 10,000 tpa IVC system in 2006 was in the region of £30,300 (or £3/tonne of waste treated). The average income from renewable electricity from an AD plant was approximately £130,900 (or £13 per tonne of waste treated) in 2006. When using the DTI’s predicted electricity costs for 2010, and the predicted revenue from renewable electricity the
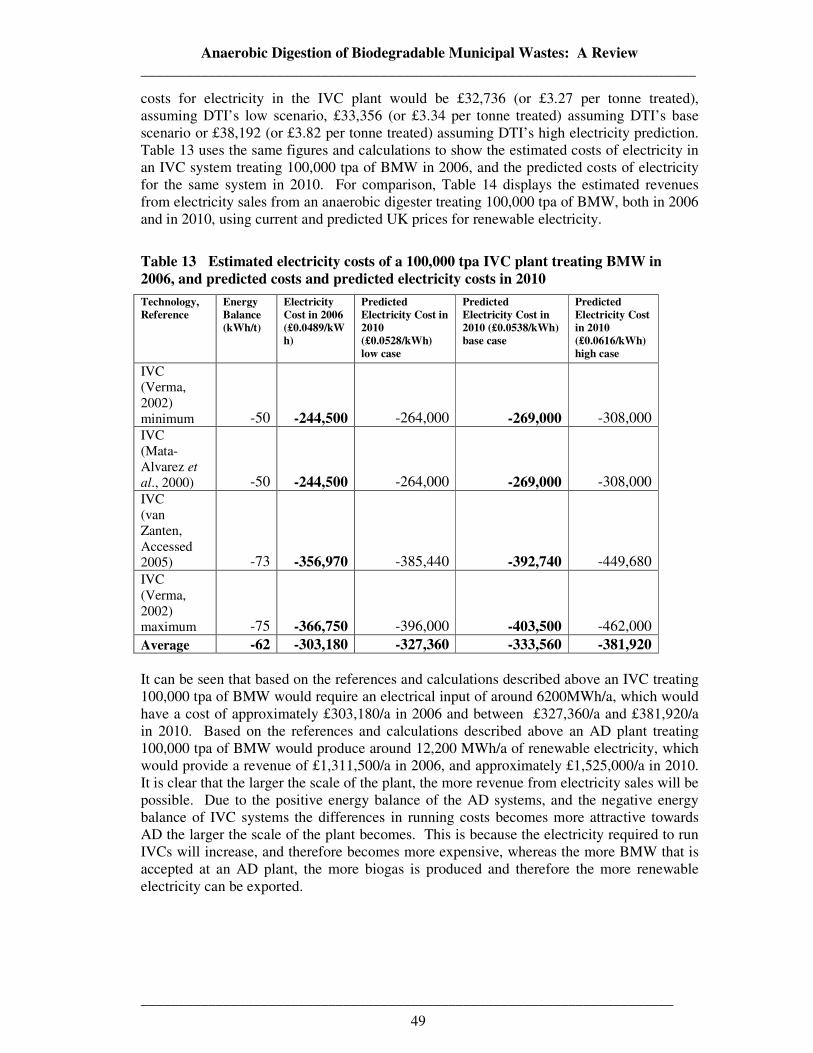
Anaerobic Digestion of Biodegradable Municipal Wastes: A Review __________________________________________________________________________
_______________________________________________________________________
49
costs for electricity in the IVC plant would be £32,736 (or £3.27 per tonne treated), assuming DTI’s low scenario, £33,356 (or £3.34 per tonne treated) assuming DTI’s base scenario or £38,192 (or £3.82 per tonne treated) assuming DTI’s high electricity prediction. Table 13 uses the same figures and calculations to show the estimated costs of electricity in an IVC system treating 100,000 tpa of BMW in 2006, and the predicted costs of electricity for the same system in 2010. For comparison, Table 14 displays the estimated revenues from electricity sales from an anaerobic digester treating 100,000 tpa of BMW, both in 2006 and in 2010, using current and predicted UK prices for renewable electricity.
Table 13 Estimated electricity costs of a 100,000 tpa IVC plant treating BMW in 2006, and predicted costs and predicted electricity costs in 2010
Technology, Reference
Energy Balance (kWh/t)
Electricity Cost in 2006 (£0.0489/kWh)
Predicted Electricity Cost in 2010 (£0.0528/kWh) low case
Predicted Electricity Cost in 2010 (£0.0538/kWh) base case
Predicted Electricity Cost in 2010 (£0.0616/kWh) high case
IVC (Verma, 2002) minimum -50 -244,500 -264,000 -269,000 -308,000 IVC (Mata-Alvarez et al., 2000) -50 -244,500 -264,000 -269,000 -308,000 IVC (van Zanten, Accessed 2005) -73 -356,970 -385,440 -392,740 -449,680 IVC (Verma, 2002) maximum -75 -366,750 -396,000 -403,500 -462,000 Average -62 -303,180 -327,360 -333,560 -381,920 It can be seen that based on the references and calculations described above an IVC treating 100,000 tpa of BMW would require an electrical input of around 6200MWh/a, which would have a cost of approximately £303,180/a in 2006 and between £327,360/a and £381,920/a in 2010. Based on the references and calculations described above an AD plant treating 100,000 tpa of BMW would produce around 12,200 MWh/a of renewable electricity, which would provide a revenue of £1,311,500/a in 2006, and approximately £1,525,000/a in 2010. It is clear that the larger the scale of the plant, the more revenue from electricity sales will be possible. Due to the positive energy balance of the AD systems, and the negative energy balance of IVC systems the differences in running costs becomes more attractive towards AD the larger the scale of the plant becomes. This is because the electricity required to run IVCs will increase, and therefore becomes more expensive, whereas the more BMW that is accepted at an AD plant, the more biogas is produced and therefore the more renewable electricity can be exported.
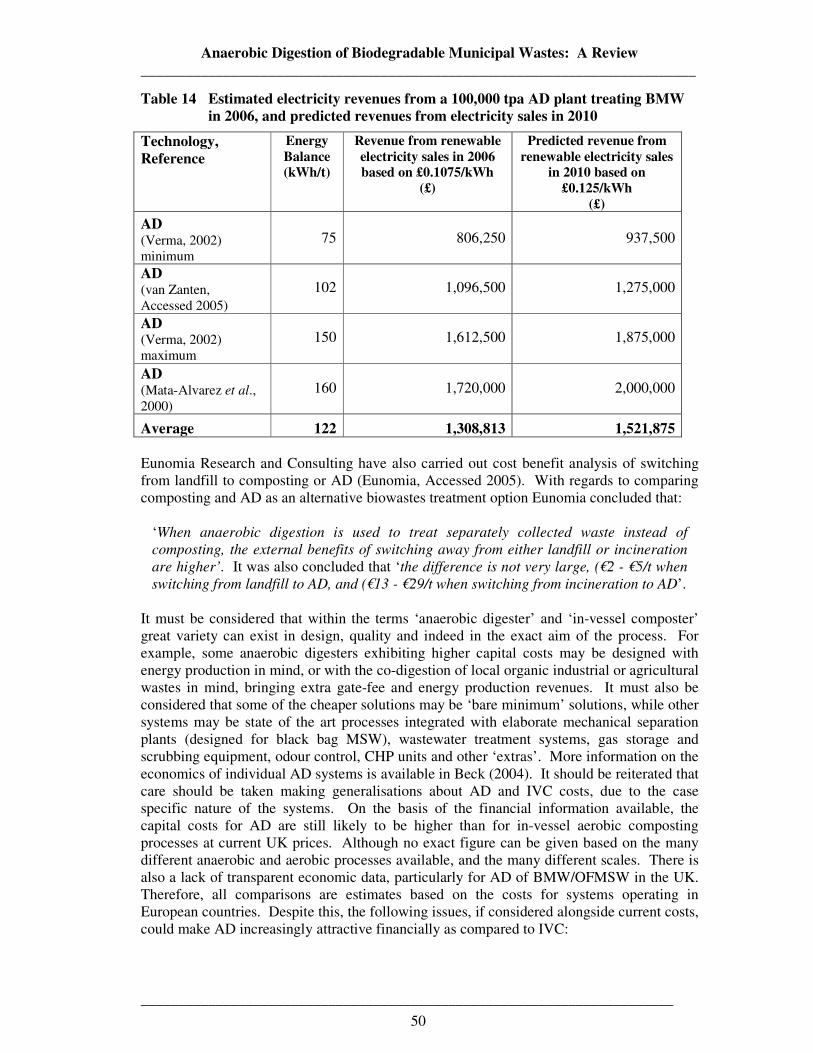
Anaerobic Digestion of Biodegradable Municipal Wastes: A Review __________________________________________________________________________
_______________________________________________________________________
50
Table 14 Estimated electricity revenues from a 100,000 tpa AD plant treating BMW in 2006, and predicted revenues from electricity sales in 2010
Technology, Reference
Energy Balance (kWh/t)
Revenue from renewable electricity sales in 2006 based on £0.1075/kWh
(£)
Predicted revenue from renewable electricity sales
in 2010 based on £0.125/kWh
(£)
AD (Verma, 2002) minimum
75
806,250
937,500
AD (van Zanten, Accessed 2005)
102
1,096,500
1,275,000
AD (Verma, 2002) maximum
150
1,612,500
1,875,000
AD (Mata-Alvarez et al., 2000)
160
1,720,000
2,000,000
Average 122 1,308,813 1,521,875 Eunomia Research and Consulting have also carried out cost benefit analysis of switching from landfill to composting or AD (Eunomia, Accessed 2005). With regards to comparing composting and AD as an alternative biowastes treatment option Eunomia concluded that:
‘When anaerobic digestion is used to treat separately collected waste instead of
composting, the external benefits of switching away from either landfill or incineration
are higher’. It was also concluded that ‘the difference is not very large, (€2 - €5/t when
switching from landfill to AD, and (€13 - €29/t when switching from incineration to AD’. It must be considered that within the terms ‘anaerobic digester’ and ‘in-vessel composter’ great variety can exist in design, quality and indeed in the exact aim of the process. For example, some anaerobic digesters exhibiting higher capital costs may be designed with energy production in mind, or with the co-digestion of local organic industrial or agricultural wastes in mind, bringing extra gate-fee and energy production revenues. It must also be considered that some of the cheaper solutions may be ‘bare minimum’ solutions, while other systems may be state of the art processes integrated with elaborate mechanical separation plants (designed for black bag MSW), wastewater treatment systems, gas storage and scrubbing equipment, odour control, CHP units and other ‘extras’. More information on the economics of individual AD systems is available in Beck (2004). It should be reiterated that care should be taken making generalisations about AD and IVC costs, due to the case specific nature of the systems. On the basis of the financial information available, the capital costs for AD are still likely to be higher than for in-vessel aerobic composting processes at current UK prices. Although no exact figure can be given based on the many different anaerobic and aerobic processes available, and the many different scales. There is also a lack of transparent economic data, particularly for AD of BMW/OFMSW in the UK. Therefore, all comparisons are estimates based on the costs for systems operating in European countries. Despite this, the following issues, if considered alongside current costs, could make AD increasingly attractive financially as compared to IVC:
Anaerobic Digestion of Biodegradable Municipal Wastes: A Review __________________________________________________________________________
_______________________________________________________________________
51
• Increasing fossil fuel prices will increase IVC operational outgoings. • Increasing income will be available from renewable electricity production. • The co-digestion of other organic wastes will increase revenue (gate-fees and
producing more biogas). • Grants may be available towards capital costs of AD systems in the future, based on
the positive effect of AD on renewable energy targets and carbon dioxide emissions reduction.
More detail on the economics of the treatment of BMW and OFMSW in Europe is available in Eunomia (2002a and 2002b). Due to the lack of UK operating data, areas of uncertainty remain. The only way to obtain more accurate cost estimates would be request a competitive tender to technology vendors and evaluate their submissions. The best possible configuration to deliver local authority (LA) aims and objectives at the most competitive price will require detailed case-by-case evaluation for each LA. In summary, AD systems are more expensive than IVC systems in terms of capital cost. The operating cost of AD systems is generally smaller than that of IVC systems once the income from biogas is taken into account. Therefore AD systems should prove to have shorter payback periods than IVC systems, especially if the use of current and future government introduced market distorters and grants to promote renewable energy and carbon emission savings are fully maximised. A more in depth analysis of more precise figures would be necessary to comment further.
2.3.2.4 Summary of Comparison of AD and IVC
There are many different options within ‘anaerobic digestion’ or ‘aerobic composting’. For source separated BMW the CLO from both processes will be suitable for land application in the UK (as long as the quality of the source separation is maintained), and therefore (assuming no contaminants in the source separated waste), a 100% landfill diversion will be possible using both technologies. AD and IVC will produce a similar volume of ‘compost’. Assuming good quality source separation, AD digestate will incur/generate the same disposal costs or revenues as a similar volume of IVC output. AD also usually has a shorter retention time (even when aerobic post-treatment is required) and therefore requires less space than in-vessel composting to treat the same throughput of wastes. The same points are true for CLO from centrally separated OFMSW, except that it will not be possible to spread CLO from centrally separated OFMSW on land (except for some landscaping or landfill cover applications). It is likely that CLO from centrally separated OFMSW will need to be landfilled or thermally treated. Similar volumes and therefore costs can be assumed for CLO from AD or IVC based MBT plants. From the literature there is a clear consensus that from an environmental and sustainability perspective anaerobic digestion is preferable to composting. The main reason for this is that AD is energy positive due to the production of biogas, while aerobic composting requires external fossil and electric energy addition for turning the windrows and/or for artificial aeration. Many LCA studies have concluded that the treatment of biowastes by AD is by far the most environmentally sound option for BMW, with fully enclosed composting showing high environmental impacts. Edelmann and Schleiss (2000) conclude that for biowastes, AD is environmentally superior to composting, noting that ‘Looking at the results of the
eco-balance and the economic situation, it is difficult to understand that today composting
plants are constructed, where high value fossil and nuclear energy is invested to destroy the
renewable solar energy, which is fixed in the chemical compounds of biomass and thus in
the biogenic waste’. Edelmann et al. (2001) concluded that LCA results strongly
Anaerobic Digestion of Biodegradable Municipal Wastes: A Review __________________________________________________________________________
_______________________________________________________________________
52
recommend to treat as much material as possible anaerobically in the future. This allows an ecologically safe waste management and saves money in a medium term, mainly by reducing incineration plant capacity and by reducing environmental costs as well as by generating a sustainable energy supply. Similarly, Bjorklund et al. (1999) recommended that large-scale composting of household biodegradable waste must only be considered a temporary solution to motivate households to source separate biodegradable waste before this fraction is also anaerobically digested. With regards to OFMSW, Fricke et al. (2005) confirm that with the rising relevancy of climate change and the utilisation of renewable energies AD for the treatment of OFMSW has a high potential for further development. This view is echoed by Juniper (2005) which concluded that the MBT configurations that appear most attractive in a UK context include those geared towards the production of biogas. Four reference studies have quantified the difference in energy balances between AD and aerobic composting of BMW. In all four, IVC was found to require an electricity input of between 50 and 75 kWh/tonne of waste treated, and AD was found to produce between 75 and 160 kWh/tonne of BMW treated. Therefore an electricity difference in favour of AD over IVC of 125 – 235 kWh/tonne of waste treated can be expected. Given current electricity costs and potential revenues from renewable electricity sales, for a 10,000 tpa biowastes treatment plant this difference equates to an energy cost difference of approximately £161,000/a (£16.10/t treated) in favour of AD in 2006. For a 100,000 tpa biowastes treatment plant, this difference equates to an energy cost difference of approximately £1.6 million/a (£16.10/t treated) in favour of AD in 2006. The effect of predicted rises in the cost of electricity and the price of renewable electricity were calculated, and it was estimated that in 2010 the energy cost difference would equate to £185,000 - £190,000/a for a 10,000 tpa plant (£18.50 - £19/t treated) and £1.85 - £1.9 million/a for a 100,000 tpa plant (£18.50 - £19/t treated). Aside from the financial savings, the use of AD rather than IVC will result in considerable carbon emission savings from fossil fuel substitution. Given the western world’s accepted over-reliance on fossil fuels and concern about security of energy supplies, this difference in energy balances assumes extra importance. Comparing the economics of BMW treatment options is not straight-forward. The various biological treatment options for BMW, AD and IVC) vary greatly in their design and complexity. For this and other reasons capital and operating costs of BMW treatment processes vary widely, although generally the costs of both aerobic and anaerobic systems are decreasing. AD systems are more expensive than IVC systems in terms of capital cost. The operating cost of AD systems is generally smaller than that of IVC systems once the income from biogas is taken into account. Therefore, AD systems should prove to have shorter payback periods than IVC systems, especially if the use of current and future government introduced market distorters and grants to promote renewable energy and carbon emission savings are fully maximised. As the scale of the plant increases, the operating costs of AD will become more and more favourable as compared to IVC (based on energy costs/revenues). The current upward trends in energy costs, impending renewable energy and carbon emission reduction targets and security of supply issues all point towards anaerobic digestion as the best available BMW (and OFMSW) treatment technology.
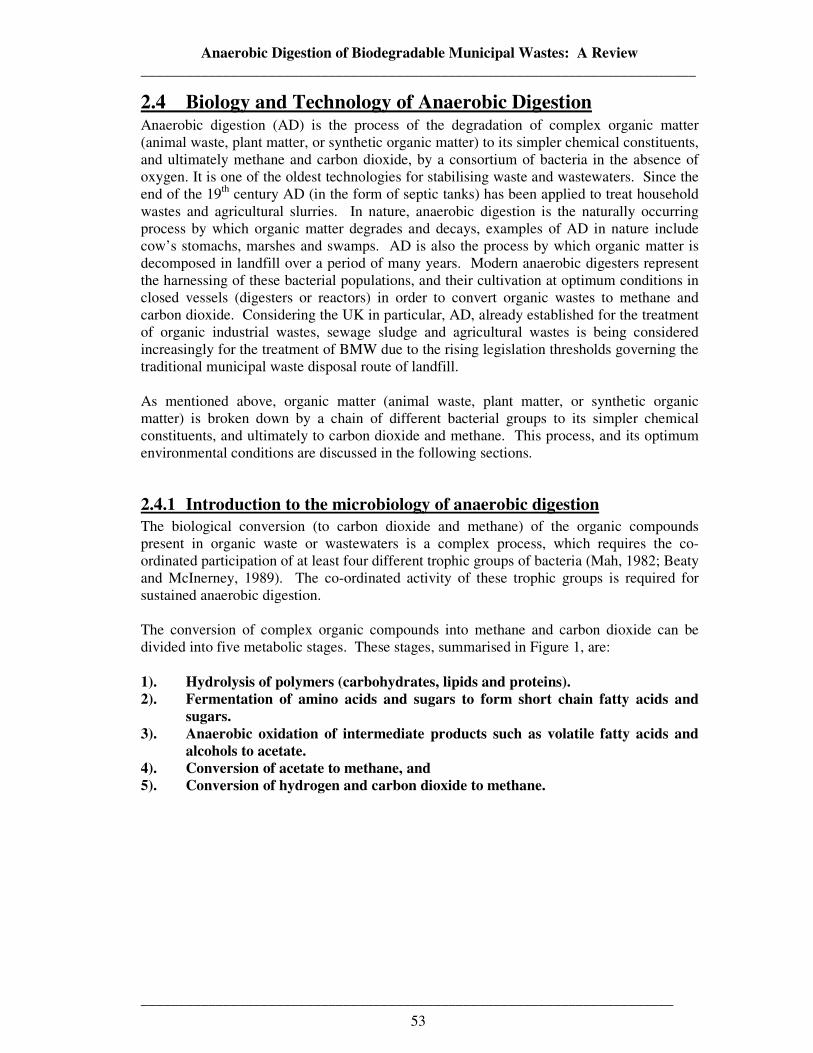
Anaerobic Digestion of Biodegradable Municipal Wastes: A Review __________________________________________________________________________
_______________________________________________________________________
53
2.4 Biology and Technology of Anaerobic Digestion Anaerobic digestion (AD) is the process of the degradation of complex organic matter (animal waste, plant matter, or synthetic organic matter) to its simpler chemical constituents, and ultimately methane and carbon dioxide, by a consortium of bacteria in the absence of oxygen. It is one of the oldest technologies for stabilising waste and wastewaters. Since the end of the 19th century AD (in the form of septic tanks) has been applied to treat household wastes and agricultural slurries. In nature, anaerobic digestion is the naturally occurring process by which organic matter degrades and decays, examples of AD in nature include cow’s stomachs, marshes and swamps. AD is also the process by which organic matter is decomposed in landfill over a period of many years. Modern anaerobic digesters represent the harnessing of these bacterial populations, and their cultivation at optimum conditions in closed vessels (digesters or reactors) in order to convert organic wastes to methane and carbon dioxide. Considering the UK in particular, AD, already established for the treatment of organic industrial wastes, sewage sludge and agricultural wastes is being considered increasingly for the treatment of BMW due to the rising legislation thresholds governing the traditional municipal waste disposal route of landfill. As mentioned above, organic matter (animal waste, plant matter, or synthetic organic matter) is broken down by a chain of different bacterial groups to its simpler chemical constituents, and ultimately to carbon dioxide and methane. This process, and its optimum environmental conditions are discussed in the following sections.
2.4.1 Introduction to the microbiology of anaerobic digestion
The biological conversion (to carbon dioxide and methane) of the organic compounds present in organic waste or wastewaters is a complex process, which requires the co-ordinated participation of at least four different trophic groups of bacteria (Mah, 1982; Beaty and McInerney, 1989). The co-ordinated activity of these trophic groups is required for sustained anaerobic digestion. The conversion of complex organic compounds into methane and carbon dioxide can be divided into five metabolic stages. These stages, summarised in Figure 1, are: 1). Hydrolysis of polymers (carbohydrates, lipids and proteins). 2). Fermentation of amino acids and sugars to form short chain fatty acids and
sugars. 3). Anaerobic oxidation of intermediate products such as volatile fatty acids and
alcohols to acetate. 4). Conversion of acetate to methane, and 5). Conversion of hydrogen and carbon dioxide to methane.
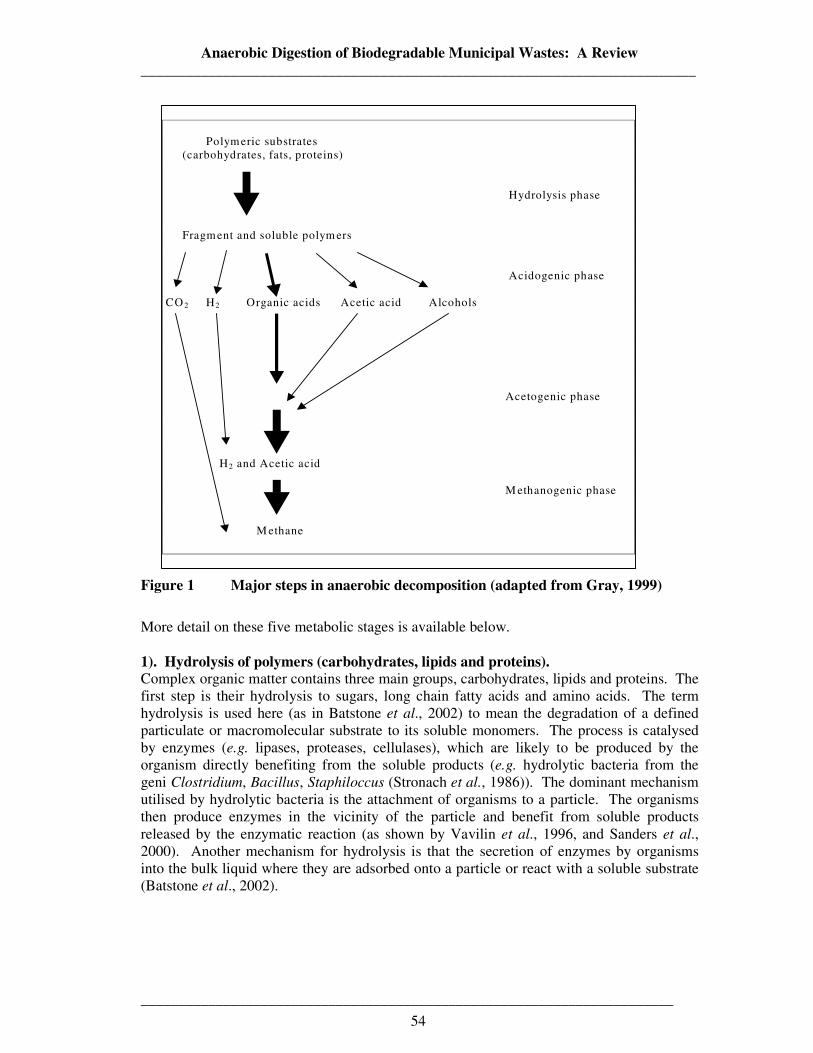
Anaerobic Digestion of Biodegradable Municipal Wastes: A Review __________________________________________________________________________
_______________________________________________________________________
54
Figure 1 Major steps in anaerobic decomposition (adapted from Gray, 1999)
More detail on these five metabolic stages is available below. 1). Hydrolysis of polymers (carbohydrates, lipids and proteins). Complex organic matter contains three main groups, carbohydrates, lipids and proteins. The first step is their hydrolysis to sugars, long chain fatty acids and amino acids. The term hydrolysis is used here (as in Batstone et al., 2002) to mean the degradation of a defined particulate or macromolecular substrate to its soluble monomers. The process is catalysed by enzymes (e.g. lipases, proteases, cellulases), which are likely to be produced by the organism directly benefiting from the soluble products (e.g. hydrolytic bacteria from the geni Clostridium, Bacillus, Staphiloccus (Stronach et al., 1986)). The dominant mechanism utilised by hydrolytic bacteria is the attachment of organisms to a particle. The organisms then produce enzymes in the vicinity of the particle and benefit from soluble products released by the enzymatic reaction (as shown by Vavilin et al., 1996, and Sanders et al., 2000). Another mechanism for hydrolysis is that the secretion of enzymes by organisms into the bulk liquid where they are adsorbed onto a particle or react with a soluble substrate (Batstone et al., 2002).
Polym eric substrates (carbohydrates, fats, proteins) Hydrolysis phase Fragm ent and soluble polym ers Acidogenic phase CO 2 H2 Organic acids Acetic acid Alcohols Acetogenic phase
H2 and Acetic acid M ethanogenic phase M ethane
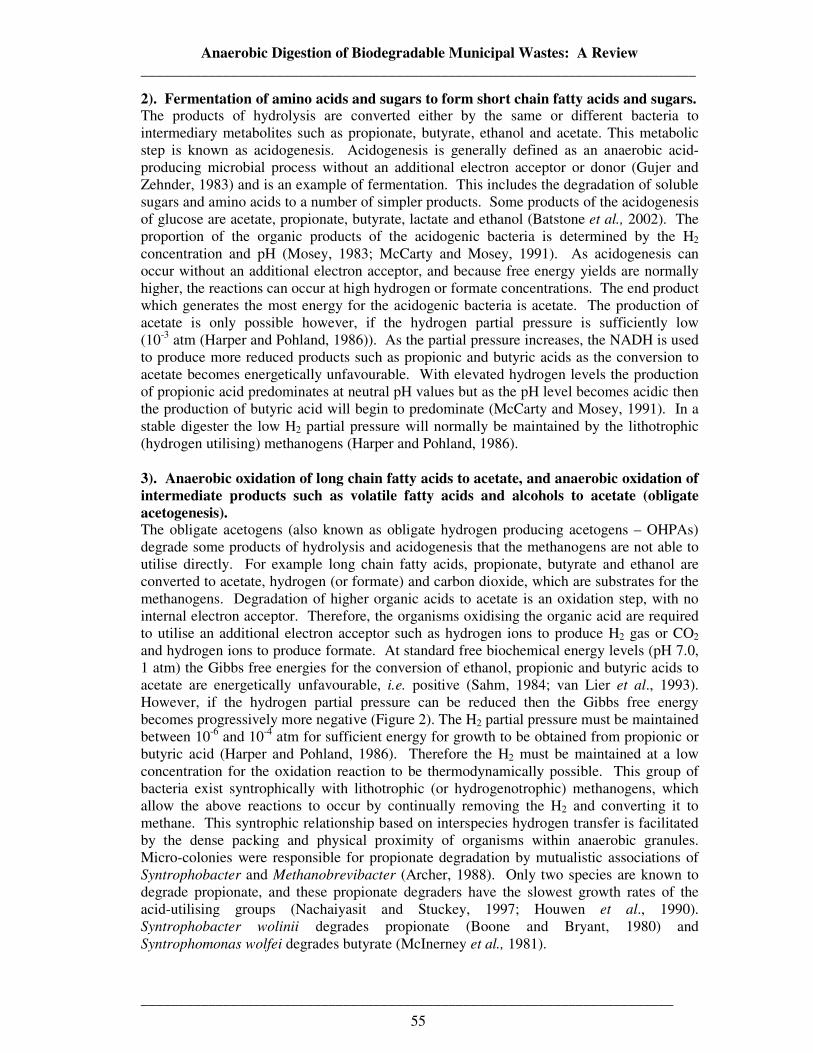
Anaerobic Digestion of Biodegradable Municipal Wastes: A Review __________________________________________________________________________
_______________________________________________________________________
55
2). Fermentation of amino acids and sugars to form short chain fatty acids and sugars. The products of hydrolysis are converted either by the same or different bacteria to intermediary metabolites such as propionate, butyrate, ethanol and acetate. This metabolic step is known as acidogenesis. Acidogenesis is generally defined as an anaerobic acid-producing microbial process without an additional electron acceptor or donor (Gujer and Zehnder, 1983) and is an example of fermentation. This includes the degradation of soluble sugars and amino acids to a number of simpler products. Some products of the acidogenesis of glucose are acetate, propionate, butyrate, lactate and ethanol (Batstone et al., 2002). The proportion of the organic products of the acidogenic bacteria is determined by the H2 concentration and pH (Mosey, 1983; McCarty and Mosey, 1991). As acidogenesis can occur without an additional electron acceptor, and because free energy yields are normally higher, the reactions can occur at high hydrogen or formate concentrations. The end product which generates the most energy for the acidogenic bacteria is acetate. The production of acetate is only possible however, if the hydrogen partial pressure is sufficiently low (10-3 atm (Harper and Pohland, 1986)). As the partial pressure increases, the NADH is used to produce more reduced products such as propionic and butyric acids as the conversion to acetate becomes energetically unfavourable. With elevated hydrogen levels the production of propionic acid predominates at neutral pH values but as the pH level becomes acidic then the production of butyric acid will begin to predominate (McCarty and Mosey, 1991). In a stable digester the low H2 partial pressure will normally be maintained by the lithotrophic (hydrogen utilising) methanogens (Harper and Pohland, 1986). 3). Anaerobic oxidation of long chain fatty acids to acetate, and anaerobic oxidation of intermediate products such as volatile fatty acids and alcohols to acetate (obligate acetogenesis). The obligate acetogens (also known as obligate hydrogen producing acetogens – OHPAs) degrade some products of hydrolysis and acidogenesis that the methanogens are not able to utilise directly. For example long chain fatty acids, propionate, butyrate and ethanol are converted to acetate, hydrogen (or formate) and carbon dioxide, which are substrates for the methanogens. Degradation of higher organic acids to acetate is an oxidation step, with no internal electron acceptor. Therefore, the organisms oxidising the organic acid are required to utilise an additional electron acceptor such as hydrogen ions to produce H2 gas or CO2 and hydrogen ions to produce formate. At standard free biochemical energy levels (pH 7.0, 1 atm) the Gibbs free energies for the conversion of ethanol, propionic and butyric acids to acetate are energetically unfavourable, i.e. positive (Sahm, 1984; van Lier et al., 1993). However, if the hydrogen partial pressure can be reduced then the Gibbs free energy becomes progressively more negative (Figure 2). The H2 partial pressure must be maintained between 10-6 and 10-4 atm for sufficient energy for growth to be obtained from propionic or butyric acid (Harper and Pohland, 1986). Therefore the H2 must be maintained at a low concentration for the oxidation reaction to be thermodynamically possible. This group of bacteria exist syntrophically with lithotrophic (or hydrogenotrophic) methanogens, which allow the above reactions to occur by continually removing the H2 and converting it to methane. This syntrophic relationship based on interspecies hydrogen transfer is facilitated by the dense packing and physical proximity of organisms within anaerobic granules. Micro-colonies were responsible for propionate degradation by mutualistic associations of Syntrophobacter and Methanobrevibacter (Archer, 1988). Only two species are known to degrade propionate, and these propionate degraders have the slowest growth rates of the acid-utilising groups (Nachaiyasit and Stuckey, 1997; Houwen et al., 1990). Syntrophobacter wolinii degrades propionate (Boone and Bryant, 1980) and
Syntrophomonas wolfei degrades butyrate (McInerney et al., 1981).
Anaerobic Digestion of Biodegradable Municipal Wastes: A Review __________________________________________________________________________
_______________________________________________________________________
56
The main pathway for anaerobic fatty acid degradation above propionate (C3) is β-oxidation. This is a cyclic process where one acetate group is removed per cycle (Batstone et al., 2002). The final carbon-containing product of fatty acids with an even number of carbon atoms is acetate only. When the fatty acid has an odd number of carbon atoms (e.g. valerate – C5), one mole of propionate is produced per mole of substrate.
Figure 2 Graphical representation of the hydrogen-dependant thermodynamic favourability of acetogenic oxidations and inorganic respirations associated with the anaerobic degradation of waste organics (from Harper and Pohland, 1986)
(1) Propionic oxidation to acetic acid, (2) butyric oxidation to acetic, (3) ethanol to acetic, (4) lactic to acetic, (5) acetogenic respiration of bicarbonate, (6) methanogenic respiration of bicarbonate, (7) respiration of sulphate to sulphide, (8) respiration of sulphite to sulphide, (9) methanogenic cleavage of acetic acid, (10) SRB-mediated cleavage of acetic acid. 4). Conversion of acetate to methane. A feature of methanogenic bacteria is their ability to reduce carbon dioxide to methane. The methanogens are dependant on the end products of the other microbial groups, such as the acetogens and the acid forming groups. In aceticlastic methanogenesis, acetate is cleaved to form CH4 and CO2.
CH3COOH ⇒ CH4 + CO2 Two genera utilise acetate to produce methane (Madigan et al., 2000). Methanosarcina dominates above 10-3 M acetate, while Methanosaeta (also known as Methanothrix) dominates below this acetate level (Zinder, 1993). Methanosaeta are more pH sensitive, and have lower yields (Schmidt and Ahring, 1996). The presence of the two different organisms in digesters is normally mutually exclusive, with Methanosaeta usually found in high-rate (biofilm) systems (Harmsen et al., 1996; and Sekiguchi et al., 1999) and Methanosarcina
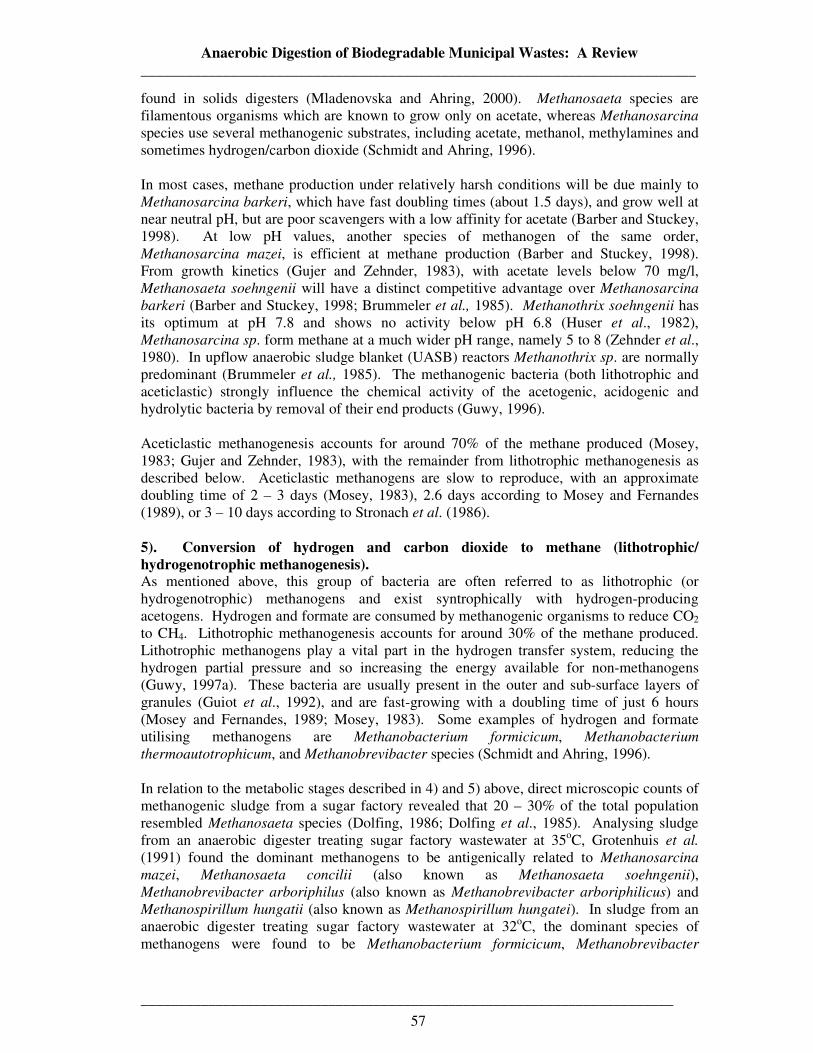
Anaerobic Digestion of Biodegradable Municipal Wastes: A Review __________________________________________________________________________
_______________________________________________________________________
57
found in solids digesters (Mladenovska and Ahring, 2000). Methanosaeta species are filamentous organisms which are known to grow only on acetate, whereas Methanosarcina species use several methanogenic substrates, including acetate, methanol, methylamines and sometimes hydrogen/carbon dioxide (Schmidt and Ahring, 1996). In most cases, methane production under relatively harsh conditions will be due mainly to Methanosarcina barkeri, which have fast doubling times (about 1.5 days), and grow well at near neutral pH, but are poor scavengers with a low affinity for acetate (Barber and Stuckey, 1998). At low pH values, another species of methanogen of the same order, Methanosarcina mazei, is efficient at methane production (Barber and Stuckey, 1998). From growth kinetics (Gujer and Zehnder, 1983), with acetate levels below 70 mg/l, Methanosaeta soehngenii will have a distinct competitive advantage over Methanosarcina
barkeri (Barber and Stuckey, 1998; Brummeler et al., 1985). Methanothrix soehngenii has its optimum at pH 7.8 and shows no activity below pH 6.8 (Huser et al., 1982), Methanosarcina sp. form methane at a much wider pH range, namely 5 to 8 (Zehnder et al., 1980). In upflow anaerobic sludge blanket (UASB) reactors Methanothrix sp. are normally predominant (Brummeler et al., 1985). The methanogenic bacteria (both lithotrophic and aceticlastic) strongly influence the chemical activity of the acetogenic, acidogenic and hydrolytic bacteria by removal of their end products (Guwy, 1996). Aceticlastic methanogenesis accounts for around 70% of the methane produced (Mosey, 1983; Gujer and Zehnder, 1983), with the remainder from lithotrophic methanogenesis as described below. Aceticlastic methanogens are slow to reproduce, with an approximate doubling time of 2 – 3 days (Mosey, 1983), 2.6 days according to Mosey and Fernandes (1989), or 3 – 10 days according to Stronach et al. (1986). 5). Conversion of hydrogen and carbon dioxide to methane (lithotrophic/ hydrogenotrophic methanogenesis). As mentioned above, this group of bacteria are often referred to as lithotrophic (or hydrogenotrophic) methanogens and exist syntrophically with hydrogen-producing acetogens. Hydrogen and formate are consumed by methanogenic organisms to reduce CO2 to CH4. Lithotrophic methanogenesis accounts for around 30% of the methane produced. Lithotrophic methanogens play a vital part in the hydrogen transfer system, reducing the hydrogen partial pressure and so increasing the energy available for non-methanogens (Guwy, 1997a). These bacteria are usually present in the outer and sub-surface layers of granules (Guiot et al., 1992), and are fast-growing with a doubling time of just 6 hours (Mosey and Fernandes, 1989; Mosey, 1983). Some examples of hydrogen and formate utilising methanogens are Methanobacterium formicicum, Methanobacterium
thermoautotrophicum, and Methanobrevibacter species (Schmidt and Ahring, 1996). In relation to the metabolic stages described in 4) and 5) above, direct microscopic counts of methanogenic sludge from a sugar factory revealed that 20 – 30% of the total population resembled Methanosaeta species (Dolfing, 1986; Dolfing et al., 1985). Analysing sludge from an anaerobic digester treating sugar factory wastewater at 35oC, Grotenhuis et al. (1991) found the dominant methanogens to be antigenically related to Methanosarcina
mazei, Methanosaeta concilii (also known as Methanosaeta soehngenii), Methanobrevibacter arboriphilus (also known as Methanobrevibacter arboriphilicus) and Methanospirillum hungatii (also known as Methanospirillum hungatei). In sludge from an anaerobic digester treating sugar factory wastewater at 32oC, the dominant species of methanogens were found to be Methanobacterium formicicum, Methanobrevibacter
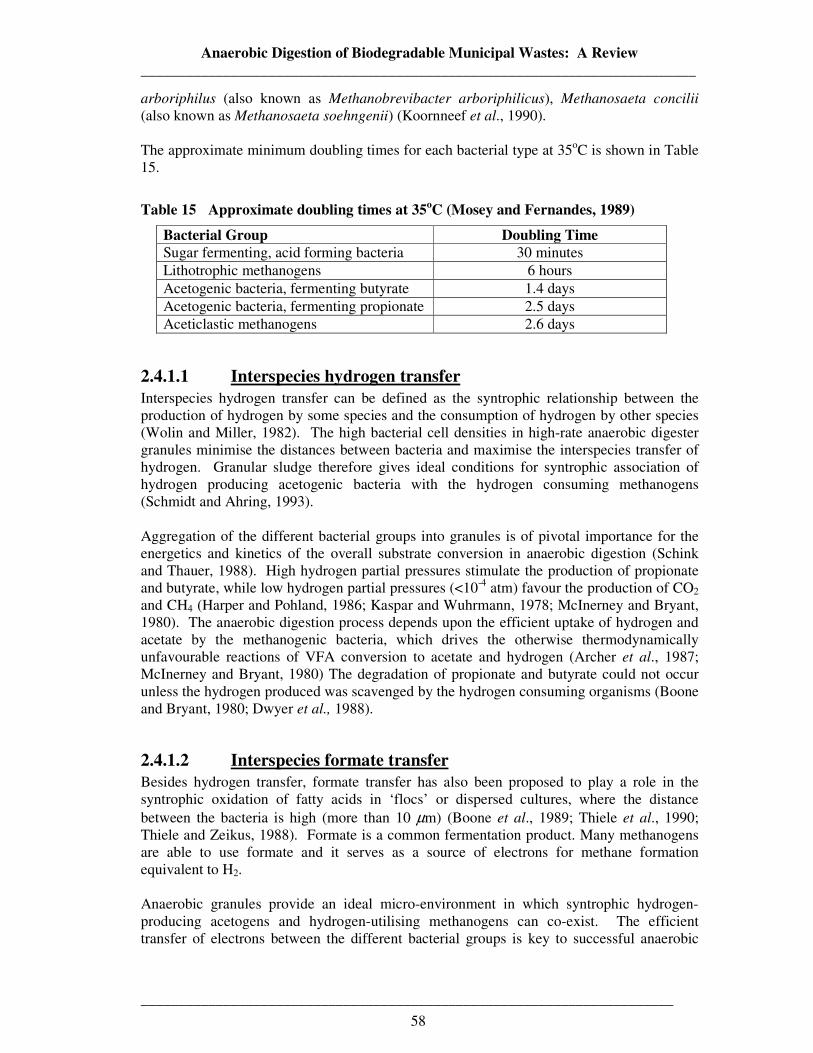
Anaerobic Digestion of Biodegradable Municipal Wastes: A Review __________________________________________________________________________
_______________________________________________________________________
58
arboriphilus (also known as Methanobrevibacter arboriphilicus), Methanosaeta concilii (also known as Methanosaeta soehngenii) (Koornneef et al., 1990). The approximate minimum doubling times for each bacterial type at 35oC is shown in Table 15.
Table 15 Approximate doubling times at 35oC (Mosey and Fernandes, 1989)
Bacterial Group Doubling Time Sugar fermenting, acid forming bacteria 30 minutes Lithotrophic methanogens 6 hours
Acetogenic bacteria, fermenting butyrate 1.4 days Acetogenic bacteria, fermenting propionate 2.5 days Aceticlastic methanogens 2.6 days
2.4.1.1 Interspecies hydrogen transfer
Interspecies hydrogen transfer can be defined as the syntrophic relationship between the production of hydrogen by some species and the consumption of hydrogen by other species (Wolin and Miller, 1982). The high bacterial cell densities in high-rate anaerobic digester granules minimise the distances between bacteria and maximise the interspecies transfer of hydrogen. Granular sludge therefore gives ideal conditions for syntrophic association of hydrogen producing acetogenic bacteria with the hydrogen consuming methanogens (Schmidt and Ahring, 1993). Aggregation of the different bacterial groups into granules is of pivotal importance for the energetics and kinetics of the overall substrate conversion in anaerobic digestion (Schink and Thauer, 1988). High hydrogen partial pressures stimulate the production of propionate and butyrate, while low hydrogen partial pressures (<10-4 atm) favour the production of CO2 and CH4 (Harper and Pohland, 1986; Kaspar and Wuhrmann, 1978; McInerney and Bryant, 1980). The anaerobic digestion process depends upon the efficient uptake of hydrogen and acetate by the methanogenic bacteria, which drives the otherwise thermodynamically unfavourable reactions of VFA conversion to acetate and hydrogen (Archer et al., 1987; McInerney and Bryant, 1980) The degradation of propionate and butyrate could not occur unless the hydrogen produced was scavenged by the hydrogen consuming organisms (Boone and Bryant, 1980; Dwyer et al., 1988).
2.4.1.2 Interspecies formate transfer
Besides hydrogen transfer, formate transfer has also been proposed to play a role in the syntrophic oxidation of fatty acids in ‘flocs’ or dispersed cultures, where the distance between the bacteria is high (more than 10 µm) (Boone et al., 1989; Thiele et al., 1990; Thiele and Zeikus, 1988). Formate is a common fermentation product. Many methanogens are able to use formate and it serves as a source of electrons for methane formation equivalent to H2. Anaerobic granules provide an ideal micro-environment in which syntrophic hydrogen-producing acetogens and hydrogen-utilising methanogens can co-exist. The efficient transfer of electrons between the different bacterial groups is key to successful anaerobic
Anaerobic Digestion of Biodegradable Municipal Wastes: A Review __________________________________________________________________________
_______________________________________________________________________
59
digestion. The electron carrier can be either hydrogen (from hydrogen ions) or formate (from carbon dioxide). The ease and efficiency of interspecies electron transfer is greatly enhanced in granular sludge, due to the physical proximity of the different bacterial groups. It is thought that in granular sludge hydrogen is the main electron carrier, whereas formate is the preferred route in suspended sludge, due to the increased distances between bacterial groups. In the literature there are conflicting views as to the importance of interspecies formate transfer as an alternative to interspecies hydrogen transfer (these are reviewed by Nachaiyasit and Stuckey, 1997). The same authors suggest that the debate is best summed up by Stams (1994), who stated “in syntrophic cultures both the hydrogen and the formate concentrations are extremely low, and it is difficult to deduce which of the two is most important. However, in methanogenic granular sludge, interspecies hydrogen transfer might be most important, while there is evidence to support the fact that formate might be more important than hydrogen transfer in suspended culture”.
2.4.1.3 Response of methanogens to stress
Although other bacterial groups can be more susceptible to specific toxicants, the acetoclastic methanogens are usually considered to be the most sensitive class of organism in the anaerobic digestion process (Speece, 1996; Mitra et al., 1998a). This is because their metabolism may be inhibited more easily than that of the other groups. Unlike the other fermentative organisms, the methanogens gain energy by anaerobic respiration. They are sensitive to oxygen, and other toxic compounds. They are also easily affected by changes in environmental conditions such as temperature and pH. For example hydrolytic and acetogenic bacteria are active in the pH range of 2 to 8, however, methanogens need a pH of approximately 6.4 - 8 to remain active (see Section 2.4.2.2). Methanogens are also very slow growing compared with acidogens and hydrolytic bacteria (Table 15). Thus organic overloading, a hydraulic overload, a toxic shock or a change in temperature can all to some degree inhibit the methanogenic population. Generally, the response of the anaerobic bacterial consortium to organic overload is as follows; an increase and accumulation of VFAs, a brief surge of hydrogen concentration, a decrease in pH, a decrease in biogas methane content, but an increase in biogas production and methane production, a decrease in COD removal efficiency, and often higher suspended solids content in the effluent. This is the case for completely mixed liquid systems. In dry AD systems any overload or toxic shock would be more likely to remain localised, meaning extreme conditions may occur in one area of the digester, whilst other areas remained unaffected. This would be due to less efficient transfer through a drier more solid medium than would occur in a liquid, unless the system was completely mixed.
2.4.2 Process Parameters
Environmental factors that exert an influence on the anaerobic digestion process include temperature, pH and mixing characteristics. A sudden or marked change in any of these characteristics will result in a significant change in operating characteristics.
Anaerobic Digestion of Biodegradable Municipal Wastes: A Review __________________________________________________________________________
_______________________________________________________________________
60
2.4.2.1 Temperature The significance of temperature to the rate of AD dictates that it must be considered as one of the main design parameters. Methanogenesis is reported to occur over temperature ranges of 4 – 100oC (Speece, 1996) and Lepisto and Rintala (1996) report economically viable anaerobic digestion at temperatures up to 80oC. The optimum range of mesophilic methanogenic growth is 33 – 37oC (Weiland and Rozzi, 1991), similar to the temperature range found in mammal intestines. In accordance with the optimal temperature range for the groups of micro-organisms involved in the digestion process, anaerobic digesters are normally operated at mesophilic temperature (30 – 40oC) or moderate thermophilic (50 – 60oC) temperatures (Ahring, 1994). The other temperature range sometimes employed in anaerobic digestion is known as psycrophilic and is generally between 5oC and 25oC (Gray, 1999). Stander et al. (1968) confirmed that a temperature rise of 10oC results in a doubling of biological activity and hence also a doubling in permissible loading rate over the mesophilic temperature range of 15 to 35oC and, conversely, a sharp decline in activity at 45oC. A sudden temperature drop in a high rate system will result in an immediate overload with a concomitant increase in VFA concentrations. It is recommended that mesophilic digesters be operated continuously at a temperature as close as possible to 35oC. However, in certain cases it may be economically desirable to work at lower temperatures with longer contact times (for example, with dilute wastewaters that cannot be heated economically). Although some of the highest loading rates have been recorded while operating in the thermophilic range, the excess energy required to maintain the digester at 20 – 30oC above ambient temperature is obviously a major drawback. With regards to systems from which it is intended to spread the digestate to land, thermophilic digestion presents the major advantage of superior seed and pathogen reduction (although usually pasteurisation will be necessary for ABPR compliance anyway). Whether operating in the mesophilic or thermophilic range, optimum temperature may vary according to the type of digester, the residence time and the composition and feeding rate of the waste. Although both temperature ranges can be successfully controlled, mesophilic digestion is generally considered to be more stable than thermophilic digestion for two reasons. Firstly, the mesophilic range contains a greater diversity of micro-organisms, and secondly, as reaction rates are faster in thermophilic digestion, they have a greater sensitivity to changes in environmental and operational conditions, meaning things can ‘go wrong’ faster should any problems arise. If not tightly controlled, this can leave less time to take preventative measures. An important characteristic of anaerobic bacteria is that their decay rate at temperatures below 15oC is very slow. Thus, it is possible to preserve the anaerobic population for long periods without losing much of its activity. This is especially useful in the case of digester downtime due to maintenance. Whatever the operational temperature chosen, it is desirable (although not strictly necessary) to maintain the temperature at as steady a level as possible to minimise disruption to the bacteria. Ambient temperature changes can have an effect on gas production despite digester heating. For this reason, digestion vessels should be insulated as well as possible against ambient temperature changes.
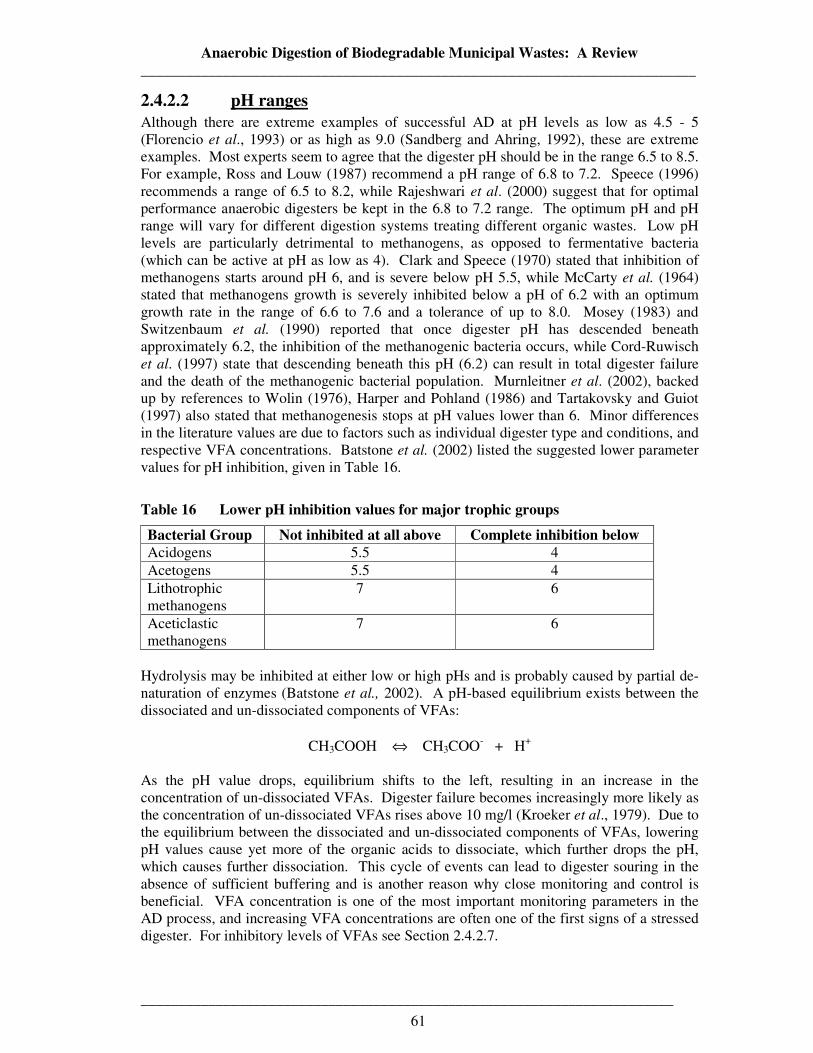
Anaerobic Digestion of Biodegradable Municipal Wastes: A Review __________________________________________________________________________
_______________________________________________________________________
61
2.4.2.2 pH ranges Although there are extreme examples of successful AD at pH levels as low as 4.5 - 5 (Florencio et al., 1993) or as high as 9.0 (Sandberg and Ahring, 1992), these are extreme examples. Most experts seem to agree that the digester pH should be in the range 6.5 to 8.5. For example, Ross and Louw (1987) recommend a pH range of 6.8 to 7.2. Speece (1996) recommends a range of 6.5 to 8.2, while Rajeshwari et al. (2000) suggest that for optimal performance anaerobic digesters be kept in the 6.8 to 7.2 range. The optimum pH and pH range will vary for different digestion systems treating different organic wastes. Low pH levels are particularly detrimental to methanogens, as opposed to fermentative bacteria (which can be active at pH as low as 4). Clark and Speece (1970) stated that inhibition of methanogens starts around pH 6, and is severe below pH 5.5, while McCarty et al. (1964) stated that methanogens growth is severely inhibited below a pH of 6.2 with an optimum growth rate in the range of 6.6 to 7.6 and a tolerance of up to 8.0. Mosey (1983) and Switzenbaum et al. (1990) reported that once digester pH has descended beneath approximately 6.2, the inhibition of the methanogenic bacteria occurs, while Cord-Ruwisch et al. (1997) state that descending beneath this pH (6.2) can result in total digester failure and the death of the methanogenic bacterial population. Murnleitner et al. (2002), backed up by references to Wolin (1976), Harper and Pohland (1986) and Tartakovsky and Guiot (1997) also stated that methanogenesis stops at pH values lower than 6. Minor differences in the literature values are due to factors such as individual digester type and conditions, and respective VFA concentrations. Batstone et al. (2002) listed the suggested lower parameter values for pH inhibition, given in Table 16.
Table 16 Lower pH inhibition values for major trophic groups
Bacterial Group Not inhibited at all above Complete inhibition below Acidogens 5.5 4 Acetogens 5.5 4 Lithotrophic methanogens
7 6
Aceticlastic methanogens
7 6
Hydrolysis may be inhibited at either low or high pHs and is probably caused by partial de-naturation of enzymes (Batstone et al., 2002). A pH-based equilibrium exists between the dissociated and un-dissociated components of VFAs:
CH3COOH ⇔ CH3COO- + H+ As the pH value drops, equilibrium shifts to the left, resulting in an increase in the concentration of un-dissociated VFAs. Digester failure becomes increasingly more likely as the concentration of un-dissociated VFAs rises above 10 mg/l (Kroeker et al., 1979). Due to the equilibrium between the dissociated and un-dissociated components of VFAs, lowering pH values cause yet more of the organic acids to dissociate, which further drops the pH, which causes further dissociation. This cycle of events can lead to digester souring in the absence of sufficient buffering and is another reason why close monitoring and control is beneficial. VFA concentration is one of the most important monitoring parameters in the AD process, and increasing VFA concentrations are often one of the first signs of a stressed digester. For inhibitory levels of VFAs see Section 2.4.2.7.

Anaerobic Digestion of Biodegradable Municipal Wastes: A Review __________________________________________________________________________
_______________________________________________________________________
62
2.4.2.3 Buffering capacity The digester’s alkalinity has a buffering effect against VFA accumulation and pH change and plays a vital role in the stabilisation of biotechnological processes providing the necessary environment for bacterial reproduction and breakdown of the organic waste. Bicarbonate alkalinity is traditionally measured as mgCaCO3/l (APHA Standard Methods, 1978). Some naturally occurring components of wastes or wastewaters have a capacity for buffering the liquid pH (for example bicarbonate, hydroxide ions, ammonia, phosphates and silicates), and manipulation of the feedstock mixture to include sufficient quantities of these natural buffers usually proves sufficient. Despite this, addition of buffering chemicals can sometimes be necessary to restore and maintain an acceptable pH range when VFA accumulation exceeds the natural buffering capacity of the digester contents. Based on personal communications with the operators of AD processes treating solid municipal organic wastes, the addition of chemicals to manipulate pH is rarely if ever required. Bicarbonate alkalinity (BA) (also known as mono-hydrogen carbonate concentration) is the main contributor to pH buffering capacity in most anaerobic reactors/digesters. The reaction of ammonium ions (which will always be present to some degree in AD of BMW/OFMSW) with bicarbonate ions to form ammonium bicarbonate provides buffering capacity in many AD systems (IWM AD Working Group, 2005). Lime is often used to manipulate digester pH, but its low solubility can be a problem, added to the fact that it can produce a negative pressure in the system when it reacts with carbon dioxide (Jeris and Kugelman, 1985). Sutton and Li (1983) review the advantages and disadvantages of chemicals commonly used for pH regulation and buffering in anaerobic digestion. In an industrial situation, disturbances leading to VFA accumulation (e.g. organic and/or hydraulic load changes, sudden temperature change) can occur frequently and without warning. It is therefore essential that the buffering capacity in the digester is maintained to prevent digester failure (Hawkes et al., 1993; Guwy et al., 1997b; Esteves, 2002; Esteves et
al., 2001). The IWM AD Working Group suggested that for BMW/OFMSW an alkalinity of greater than 500 mg/l would be indicative of a good buffering capacity (IWM AD Working Group, 2005). In general, full scale anaerobic digesters treating solid waste can modify their intake to ensure that sufficient natural buffering is present. One way of doing for the treatment of BMW/OFMSW would be to accept a proportion of slaughterhouse waste, which is very high in amino acids, which break down to ammonia and ammonium bicarbonate.
2.4.2.5 Nutrient requirements Efficient digestion processes require that the medium in which the micro-organisms grow and multiply contains sources of organic carbon, nitrogen and phosphorus for the biosynthesis of new cells. Nitrogen is the main nutrient required, although phosphorous and sulphur and other nutrients and trace elements are required in smaller quantities. Optimum methane production is expected at a C:N ratio between 20:1 and 30:1 (Composting Association, 2005). Higher C:N ratios indicate rapid nitrogen consumption by methanogens, and can result in a lower gas yield (Composting Association, 2005). Digester failure has been reported at ratios greater than 52:1 (IWM AD Working Group, 2005). Low
Anaerobic Digestion of Biodegradable Municipal Wastes: A Review __________________________________________________________________________
_______________________________________________________________________
63
C:N ratios can cause ammonia accumulation and high pH values, both of which can inhibit digestion. As well as nitrogen, stable microbial growth requires phosphorous. Phosphorous content should be maintained in the region of 5:1 (in terms of N:P). The phosphorous content of MSW is said to be low (IWM AD Working Group, 2005), so co-digestion of an organic phosphorous containing waste (such as sewage sludge) could eliminate the need for dosing. The theoretical minimum COD:N:P ratio required for a high loaded anaerobic digester is around 400:7:1 (Grasius et al., 1997). Trace elements are also necessary for cell synthesis. Various nutrients and trace metals used in anaerobic digesters include sulphur, magnesium, potassium, calcium, iron, aluminium, zinc, nickel, cobalt, molybdenum, manganese, copper, boron, selenium, riboflavin and vitamin B12 (Hawkes et al., 1991). While industrial waste streams are often too specific in their nature and may be deficient in these nutrients, municipal waste or sewage sludge will contain all of the necessary nutrients. Optimum C:N:P ratios (and the presence of trace elements) can be maintained by the co-digestion of different organic wastes. For example, by mixing wastes that are high in nitrogen and phosphorous (such as food wastes, sewage sludge or animal manures) with high carbon feedstocks to provide a balanced mix of wastes to the digester. Due to the wide range of potential contributors to BMW or OFMSW, either should provide a reasonably well balanced feedstock without the need for expensive nutrient addition, where co-digestion is not possible or desirable. Whilst academic studies on the requirements for AD of BMW/OFMSW are rare, there have been numerous studies regarding nutrients dosing for UASB/EGSB (expanded granular sludge bed) type reactors. These are reviewed by Singh et
al. (1999).
2.4.2.6 Toxicity and inhibitory substances
There are many substances, both inorganic and organic which may be toxic or inhibitory to the anaerobic waste treatment process. The term ‘toxic’ is relative and the concentration at which a substance becomes toxic or inhibitory may vary from a fraction of a mg/l to several thousand mg/l. Micro-organisms usually have the ability to adapt to some extent to inhibitory concentrations of most substances. The extent of adaption is relative, and in some cases the activity after acclimation may approach that obtained in the absence of the inhibitory material. In other cases the acclimation may be much less than this. It is a peculiarity of anaerobic digestion that process intermediates, if accumulated beyond certain levels, can be inhibitory to other bacterial groups. Process intermediates that can cause inhibition if accumulated beyond certain levels include VFAs, hydrogen and carbon dioxide. The inhibition caused by VFAs and their relationship with pH is discussed in Sections 2.4.2.2 and 2.4.2.7. Carbon dioxide is an end product of carbohydrate fermentations and the production of methane from acetate, yet it can act as an inhibitor to these reactions. This is only the case at artificially high carbon dioxide concentrations and need not be considered in normal digester operation. Carbon dioxide in the gas phase is directly related to carbon dioxide in the liquid phase, and contributes to reactor pH and buffering capacity.
Anaerobic Digestion of Biodegradable Municipal Wastes: A Review __________________________________________________________________________
_______________________________________________________________________
64
Many municipal and industrial wastes contain substances that are recalcitrant or potentially inhibitory. For example, heavy metals, chlorinated hydrocarbons and anionic detergents all have an inhibitory effect on the micro-organisms (Rittmann and McCarthy, 1980). In the food industry for example, biocides and caustic soda are commonly used to clean factory equipment and can result in poor efficiency or failure of the anaerobic treatment plant. Although they would be unlikely to be present in concentrations that would cause a visible adverse effect, pesticide residues may be present if garden or agricultural wastes are included as part of the organic waste stream, and this possibility should be considered. Municipal waste streams (especially non source separated streams) can contain many toxic substances which may not be present in sufficient concentrations to inhibit or even affect anaerobic bacteria, but would contaminate the digestate. This would render the digestate unusable as a fertiliser or soil amendment. In the case of wastes from municipal sources, there are a vast array of potential contaminants. This is especially true from centrally separated municipal wastes, although source-separated waste streams also often contain surprising contaminants, depending largely on the due care during seperation. The mechanical separation and pre-treatment techniques should remove a large proportion of these contaminants. In particular heavy metals from batteries can be a problem, not so much in terms of inhibiting the micro-organisms, but in terms of rendering the digestate useless as a compost. Contaminants (including batteries) are more likely to be present in centrally separated waste streams than in source separated waste streams, although their removal is always necessary. The removal of batteries is a key consideration in any mechanical separation set-up. In the past there has been an issue with ‘front-end’ shredders releasing contaminants that could have been avoided if shredding had occurred after separation. For example, heavy metals are released from shredded batteries, when a battery removal stage could have been implemented before shredding. As discussed in Sections 2.4.1 and 2.4.1.3 methanogens are usually the most sensitive bacterial group in the anaerobic consortium. Among the more common toxins for methanogens are molecular ammonia, the ammonium ion, soluble sulphides, and soluble salts of metals such as copper cadmium zinc and nickel. Several organic substances may also affect the micro-organisms (Diaz et al., 1993). Phenol can be inhibitory in acute situations, but following acclimation, large concentrations of phenol are easily metabolised in anaerobic conditions (Olezkiewicz and Poggi-Varaldo, 1997). Oil or grease may also be present, possibly due to their presence in the waste stream (again, particularly if MSW is collected together and separated centrally) or possibly from machinery washdown in the mechanical separation stages. It is very unlikely that concentrations toxic to the micro-organisms would be reached. It has been indicated that the toxicity to AD of pH, ammonium sulphide, copper, oxygen, cyanide, chloroform and various petro-chemicals is reversible (IWM AD Working Group, 2005). Sodium, potassium, calcium, magnesium salts and other alkali and alkaline-earth metal salts are stimulatory at low concentrations (see Section 2.4.2.5) and inhibitory at higher concentrations. The toxicity is a function of the cation fraction of the salt. Sodium begins to be inhibitory at concentrations approaching 3500 mg/l, potassium and calcium at 2500 mg/l and magnesium at 1000 mg/l. Ammonia toxicity must be given special consideration if slaughterhouse waste is to be co-digested. The ammonium ion, despite being the main nitrogen source for methanogenic bacteria, becomes toxic in high concentrations. Molecular ammonia becomes toxic when
Anaerobic Digestion of Biodegradable Municipal Wastes: A Review __________________________________________________________________________
_______________________________________________________________________
65
the concentrations exceed 1500 – 3000 mg/l of total ammonia-nitrogen at a pH higher than 7.4. The ammonium ion is toxic at concentrations greater than 3000 mg/l of total ammonium-nitrogen at all pH levels. The ammonium can exist in equilibrium with dissolved ammonia gas as follows:
NH4+ ↔ NH3 + H+
The pH level determines the degree of toxicity of ammonia-ammonium because of its effect on the equilibrium between the two forms. The equilibrium shifts towards the ammonium ion at low pH values and inhibition begins at 1500 mg/l. Despite the possibility of ammonia becoming toxic, it should not be forgotten that ammonium-nitrogen is one of the substances that is essential to microbial nutrition in AD (Diaz et al., 1993). Kayhanian and Tchobanoglous (1993) have suggested the inhibitory total ammonia concentration to be at the 1000 mg/l level, and recommended the running of reactors below 600 mg/l. Sewage sludge can contain heavy metals. Although heavy metal concentration in sewage sludge would not reach levels toxic or inhibitory to anaerobic bacteria, care must be taken as potential of contaminating the final ‘compost’ exists. If dosing sewage sludge for nutrients, TS content regulation, extra biogas production or just for a more balanced input, care must be taken to ensure that heavy metals in the digestate do not exceed levels that would prevent the digestate being used agriculturally. If the digestate is not intended for land application or energy recovery (but for landfill) then the heavy metal content of the digestate is not important, and unlimited sewage sludge addition will not present a problem from a heavy metals perspective. Although oxygen affects the activity of anaerobic bacteria, many methanogens can survive exposure to air for several hours (IWM, AD Working Group, 1995). In any case, as AD is carried out in anaerobic conditions, in an enclosed digester, oxygen does not present a significant problem. Exposure to air for a few hours (for example for maintenance) would not present a problem. More information on materials that are toxic/inhibitory to anaerobic micro-organisms is available in Speece (1996) and Grasius et al. (1997). On a physical level, inhibition can arise more easily if there is an inadequate transfer from liquid to gaseous phase, for example if diffusion of substrate from the cells into intracellular spaces is limited. This can occur in high solids systems, or where the high gas production isolates bacteria from the bulk reactor, or in inadequately mixed systems. In such cases, bacteria may be more likely to be affected by process intermediates, or by localised toxicity. With regards to full scale systems, problems due to toxicity can largely be anticipated and avoided at the planning stage. Given the irregular content of municipal waste streams toxicity problems do occur, although rarely. Monitoring and control measures, including regular analysis of waste input, digester contents and output, can provide safeguards against possible toxicity incidents. Due to the avoidance of bad publicity and its negative effect on marketability there are very few toxicity incidents at the full scale reported in the literature.
2.4.2.7 Volatile Fatty Acids (VFAs) and inhibition All organic acids contain the carboxyl group, they are weak acids, ionise poorly and all have sharp, penetrating odours (Olsson and Newell, 1999). VFAs are amongst the most important intermediates in the anaerobic digestion process, and have long been monitored as
Anaerobic Digestion of Biodegradable Municipal Wastes: A Review __________________________________________________________________________
_______________________________________________________________________
66
potential process performance indicators. In a well-balanced anaerobic digester VFAs should not accumulate. It has long been established that VFA levels increase in anaerobic digesters under stress (Graef and Andrews, 1974; Hill and Barth, 1977). The level of total volatile fatty acids (TVFA) in anaerobic digesters at steady state can vary greatly depending on the type of digester, the type of feed, the type and amount of buffer being used and importantly the organic loading rate (OLR). It is not feasible to define an absolute VFA level indicating the state of the process. Anaerobic systems have their own ‘normal’ levels of VFA, determined by the composition of the substrate digested and operating conditions (initial pH and alkalinity) (Lester and Birkett, 1999), as well as the operating OLR. In low or under-loaded digesters TVFA values can be low (<100 mg/l), whereas in high loaded digesters, or processes operated on the limits of their ability the steady state TVFA level can be high. Weiland and Rozzi (1991) suggest that the TVFA concentration during the start-up period should be kept below 500 – 1000 mg/l. The higher the TVFA level the more buffering is required. Buswell (1959) stated that the empirical overall upper limit of 2000 mgVFA/l was over-emphasised. The author preferred the use of sudden changes in a constant value of VFA content, as a control parameter, rather than setting levels for ‘safe’ digestion. Ahring et al. (1995) (amongst others) also suggested that the relative change in VFA concentrations were a more important indicator that all is not well in the reactor, rather than the absolute VFA concentrations. It follows that as far as control is concerned, any sudden changes in the steady state TVFA level are much more important than the level itself. This approach remains the preferred approach amongst industrial operators, who monitor VFA daily or weekly and take actions based on sudden changes in normal trends.
2.4.2.8 Hydraulic retention time (HRT) and solids retention time (SRT) The retention time (RT) is the mean time that any proportion of the waste will remain in a digestion system. Retention time can be worked out using digester volume (which is constant), and the rate of flow of feedstock into this volume (which is controlled and changeable, although usually constant over long periods of time). This relationship is summarised below:
RT(days)/day)(m F
)(m V3
3
=
Where: V = Volume F = Influent flow rate RT = Retention time The retention time must be sufficient to carry out the necessary degree of biodegradation. Retention time required (or allowed) by different anaerobic digesters treating different wastes varies greatly, and is a function of the goals of the process, the biodegradability of the feed, the loading rate, the degree of bioconversion/degradation required, and the environmental conditions. For example, a system with large volumes of waste throughput as the main process goal would employ a shorter residence time than a similar system with energy production as the main process goal. Hydraulic retention time (HRT) is defined as the mean time that any proportion of the feed liquid will remain in a digestion system. Solids retention time (SRT) can be defined as the mean time for which any portion of the feed solids, and/or the digester bacteria, remain in the digester. SRT is used in systems that
Anaerobic Digestion of Biodegradable Municipal Wastes: A Review __________________________________________________________________________
_______________________________________________________________________
67
employ a biomass retention system. In a fully mixed or continuous flow system solids and liquids pass through the digestion tanks at the same rate, and the SRT will be the same as the HRT. Two-stage processes can achieve longer SRTs, because they are designed to retain solids within the digesters, thus decoupling the HRT and SRT and enabling better degradation efficiencies and better gas yields to be achieved. With regards to MBT plants (or AD systems within MBT plants), the comparison of retention times may cause confusion. It is not always clear whether retention times quoted are for the anaerobic system only, the biological system (AD + post-composting), or for the whole wastes treatment process (mechanical separation, pre-treatment, AD, and post-AD composting).
2.4.2.9 Feed composition, strength and rate of addition Organic loading rate (OLR) is usually measured in terms of chemical oxygen demand (COD) fed to a unit volume of the digester per unit time (for example kgCOD/m3/day) or as volatile solids per unit volume of digester (for example kgVS/m3). Loading rate is a function of the volume of feedstock added, feed strength, digester volume and HRT. Clearly the composition, strength and rate of addition of the feed have a major impact on any anaerobic digester population. Steady feeding at a strength and rate that does not overload the bacterial population is essential, although (up to a point) the population may be ‘trained’ or ‘optimised’ by slow increases in OLR (organic loading rate) as long as the micro-organisms are given time to acclimatise and adapt to new conditions before the conditions are changed again. Stable operation (within suitable parameters) is key to bacterial population development, and although an anaerobic digester contains a living population that can adapt to most feedstocks and conditions, stable operation will enhance performance by evolving a bacterial population ideally suited to the conditions provided. The waste treatment system should always be chosen and designed based on the waste composition and volume that requires treating. Treatment systems should always be built with sufficient flexibility to cope with changes in composition, volume or strength of wastes. These changes may be expected or unexpected, and occur over a period of hours, days or even years. Prior to implementation of a full scale system, a thorough literature review, laboratory and pilot scale trials will be necessary to establish the suitability of the type of treatment system chosen to treat the desired waste. At the pilot or full scale, it is likely that the process can be optimised by fine-tuning the process. That said, once the system is designed and operating, the composition of the waste should be kept as constant as possible.
2.4.2.10 Solids content Solids content in a feedstock or digester is measured as percent total solids (%TS). TS can be defined as the material left after evaporation of water from the sample (Hobson and Wheatley, 1993). Within this, volatile solids (VS) are usually expressed as a percentage of TS and are measured as total solids minus the ash content, as obtained by complete combustion of the sample. Anaerobic digestion can occur at a wide range of TS levels between 1% and 50%. With regard to solid wastes the optimum range is around 10% to 40% TS, although many systems successfully dilute solid wastes to a total solids content less than 10% and successfully digest the wastes using ‘wet’ AD systems. Below 5% TS the waste is very dilute, and large digester volumes will be required to treat the same amount of organic waste. Above 50% TS waste is difficult (and expensive) to pump, and difficult to
Anaerobic Digestion of Biodegradable Municipal Wastes: A Review __________________________________________________________________________
_______________________________________________________________________
68
mix. Systems operating at TS values larger than 15% TS are known as ‘dry’ or ‘solid’ anaerobic systems, while those that treat waste (or slurry waste to) less than 15% TS are classified as ‘wet’ AD systems. These systems, and the advantages and disadvantages of each are discussed further in Section 2.7.2. The preferred solids content of the digester is one of the major factors to be considered in the choice of treatment system and the design of the system. This is discussed further in Sections 2.4.2.10 and 2.7.2. As different wastes have different solids contents, it may be possible to mix together different waste streams in order to obtain the desired total solids content prior to it being fed to the digester. TS percentage can be raised by the addition of waste with a higher solids content, or lowered by the addition of water (or a more liquid waste).
2.4.2.11 Mixing In any anaerobic system (other than landfill), mixing is necessary to ensure dispersion of the feed throughout the digester. Efficient mixing enhances the reliability of the process by ensuring a good and even contact between waste and bacteria, enabling more efficient substrate and nutrient transfer between the bacteria and the bulk contents, avoiding ‘dead zones’ where bacteria are inactive due to not being in contact with the waste and ensuring good heat transfer and a uniform temperature throughout the digester. Efficient mixing encourages even distribution of substrates and prevents the localised build-up of inhibitory substances (one of the factors enabling the treatment of otherwise toxic or inhibitory compounds). Aside from this obvious advantage, another advantage of efficient mixing is that it facilitates control, as changes in any control variables employed can be applied to the digestion vessel as a whole and not just one localised region. A good mixing system should also minimise the build up of scum and grit, which may accumulate at the top and bottom of the digester respectively, adding to the biologically inactive volume within the digester and decreasing treatment efficiency. If a digester is not sufficiently mixed (or sub-optimally mixed), then the treatment efficiency will decrease. Either less organic material will be degraded and less biogas produced, or the retention time will need to be increased to achieve the same amount of biodegradation. Digestion efficiency can be decreased due to sub-optimal mixing in the following ways:
• Decreased waste/biomass contact • Decreased transport/dispersion of substrates and nutrients • Potential for dead-zones (zones by-passed by incoming feed) within the digester • Potential for increased build up of heavy sediment layers on the bottom of the
digester, or scum layers on the top. Both of which decrease the biologically active volume of the digester.
• Non-uniform digester temperature, which could lead to less efficient operation or potential bacterial instability.
The type and intensity of mixing varies greatly between the various AD systems available. The preferred form of mixing will differ from ‘wet’ AD systems to ‘dry’ AD systems. The main options for mixing anaerobic digesters are explained below. In any anaerobic system, mixing is aided by the biogas production. Biogas formed throughout the digester constantly bubbles through the digester contents to the top of the digester. Despite causing some mixing, this biogas production is usually insufficient to mix sludges (Hobson and Wheatley, 1993), although industrial digesters operating at high rates and which produce more that 1.5 digester volumes of biogas per day can be completely
Anaerobic Digestion of Biodegradable Municipal Wastes: A Review __________________________________________________________________________
_______________________________________________________________________
69
mixed by gas evolution (Tilche and Viera, 1991). Despite gas production, another mixing technique is usually desirable. There are three main methods of mixing sludge digesters:
• Mechanical mixing • Re-circulation • Gas re-circulation
Mechanical mixing can take almost any form depending on the system design, but the most simple system involves large paddles rotating slowly from a vertical shaft in the centre of the digester. Mixer speeds are low, usually only a few rpm. It has been suggested that excessive mixing can disrupt microbial activity (Composting Association, 2005). Too much mixing will cause hydraulic shear (Nachaiyasit and Stuckey 1997b; Speece, 1996). Depending on the digester type, this can be detrimental, leading to particle attrition and abrasion and the subsequent washing out of smaller particles. Certainly, in UASB type systems, where bacteria form in to ‘flocs’ or granules, these bacterial structures can be damaged and the bacteria washed out if mixing is too vigorous (although these reactor types do not utilise mechanical mixing). Mixing characteristics of UASB type reactors are further discussed in Monson (2004). Blades near the bottom and the liquid surface can help to reduce the formation of sediment and scum layers (Hobson and Wheatley, 1993). Due to the somewhat unpredictable and non-constant nature of BMW and in particular OFMSW, there exists significant potential for internal mechanical mixing systems to become fouled or corroded, even after the pre-treatment of the waste. Long wastes such as string, rope, plastic strips or bags, hair and cassettes can become entangled around paddles in digesters treating OFMSW. The regular cleaning and maintenance of internal mechanical stirrers must be anticipated, and can be difficult and expensive. Re-circulation (or recycling) involves the use of pumps to extract a volume of treated digestate/waste from the back end of the digestion system, mix it with fresh feed and re-introduce it to the digester. As long as this pumping/recycling occurs at a sufficient rate, the contents of the digester will constantly be moving with the flow caused by the pumps. Recycling has several benefits as well as mixing, including the inoculation of the feedstock with bacteria and the improvement of heat exchange within the digester. Digester/reactor types using recycling intensify the hydraulic mixing. Advantages of this system include its durability. The fact that there are no moving parts within the digester mean that downtime and maintenance costs can be avoided. Disadvantages are that the system does not produce complete mixing, as the digester contents are turned over ‘en bloc’, and dead zones and ‘short circuiting’ can occur. ‘Short circuiting’ implies that some waste input may pass through the digester untreated, irrespective of the supposed retention time. Short circuiting could cause potential problems with regards to pathogen reduction potential and ABPR compliance. Often, systems use a combination of mechanical stirring and re-circulation. Direct comparisons of the various mixing options at the industrial scale are rare, but at the LinkoGas digester in Lintrup (Denmark) where two new digesters are mixed by re-circulation and an older digester by mechanical paddles it has been observed that the pumped re-circulation mixing technique shows better results than the mechanical paddles in terms of digester performance (Christiansen, Personal Communication, 2006). In this case the wastes treated were identical. Gas re-circulation involves the collection of biogas from the digester headspace, compressed and re-introduced at the bottom of the digester tank. There are several technical gas re-circulation variations possible, including gas release from jets evenly spaced over the base
Anaerobic Digestion of Biodegradable Municipal Wastes: A Review __________________________________________________________________________
_______________________________________________________________________
70
of a tall narrow digester (known as unconfined gas mixing), which gives the best mixing and scum reduction (Hobson and Wheatley, 1993). Many systems employ a mixing tank, prior to the AD stage. A mixing tank can ensure homogeneity of content and temperature, to help buffer the digesters micro-organisms against variations in content, strength and temperature in the incoming feed. Where several different waste types are digested together, the use of a mixing tank prior to the digester assumes extra importance.
2.4.2.12 Monitoring and control
In anaerobic digesters the monitoring and control of the incoming wastes, the in-digester conditions and the digestate quality is always necessary. Monitoring and control measures, including regular analysis of waste input, digester contents and output, can ensure conditions remain optimal for the bacterial population, optimising waste decomposition rates and biogas production and safeguarding against possible toxicity incidents. As well as closely monitoring and controlling the content and volume of the incoming wastes (which can go a long way towards ensuring efficient operation), it is necessary to monitor and control critical in-digester conditions such as temperature, pH levels, bicarbonate alkalinity, volatile fatty acid (VFA) concentrations, the concentrations of potentially toxic substances, total and volatile solids content and the COD of incoming waste and outgoing digestate/effluent. The monitoring of these parameters (as well as physical parameters such as liquid levels, gas pressure, gas production and content) can ensure that the process remains in the optimum ranges required to maximize biological activity and therefore waste decomposition rates and biogas production. As AD is an ever changing biological process, the monitoring of key process parameters is essential, and the more information that is available to an operator, the more accurate an overview of the process fundamentals he will have. The more knowledge that is available, the more informed the choices to be made can be. Also, the faster the information is available the better, as if necessary changes can be made or control actions can be taken faster. Control actions can include a variation in the influent flow rate, temporary diversion of incoming waste or addition of chemical compounds (e.g., alkali, bicarbonate, lime or citric acid for pH adjustment) (e.g. Esteves et al., 2000, 2001). Many process parameters are monitored on-line (such as liquid flow rates, temperature, pH, gas production and content) and logged on a central control computer (e.g. Esteves et al., 2000, 2001). On-line monitoring provides the operator accurate, up to the minute information on digester conditions. Other key process parameters (such as total and volatile solids analysis, COD, bicarbonate alkalinity and VFA analysis) must be monitored off-line, with samples regularly taken (usually daily or weekly) for analysis in a laboratory. As always, trends in the critical data provide a more useful guide to process wellbeing than ‘snapshot values’. In practice, the anaerobic digestion process is seldom in steady state. Appropriate methods are needed to ensure that the digester variables and environmental conditions remain within suitable limits. Failing this, the digester must be designed to operate within the worst case conditions, to ensure the survival of the bacterial populations. The demands for waste treatment plants to cope with variable incoming wastes and to meet higher environmental quality standards with greater consistency, whilst reducing treatment costs has made better control of the treatment process essential. This has triggered the development of various control techniques (both manual and automatic), for use on anaerobic digesters, the goal being to maintain efficient operation as safely and economically as possible. The on-line monitoring and control of anaerobic digesters is an active academic research area, as
Anaerobic Digestion of Biodegradable Municipal Wastes: A Review __________________________________________________________________________
_______________________________________________________________________
71
described in Monson (2004) and Esteves (2002), with many attempts being made to develop reliable automatic control systems for anaerobic digesters based on on-line data (Guwy et
al., 1997b; Premier et al., 1999; Esteves et al., 2001). Industrially most AD processes are monitored on-line where possible, but control is overseen by experienced operators acting on all available information (from on-line and off-line analysis).
2.5 Suitable Wastes for Anaerobic Digestion Although this report is primarily concerned with the AD of BMW, the AD process can often be more economically viable when other organic waste streams are co-digested. Organic wastes that could possibly be co-digested with BMW will be discussed below. Each specific waste type presents different operational challenges, in terms of process design, the type and extent of pre- and post-treatment required and digester operation and control issues. Due to the wide range of organic wastes that can be treated, and the many companies supplying anaerobic digestion solutions, there are a wide range of possible digestion and pre-treatment options. These are discussed in Section 2.7. Because of this myriad of potential configurations and treatment options the specific approach chosen should always be based on accurate information on the wastes that it is planned to treat, and the process goals. Quantity, content, organic strength, water content, impurity content, delivery patterns and frequency are all factors governing the choices in AD system design. The source of the waste treated and its degree of contamination determine the quality of the end product from the process. If this can be beneficially used as a soil improvement product then the economics of the process are likely to be much more favourable, otherwise there will be on-going disposal costs for the digestate at the end of the process. Waste streams that can be treated by anaerobic digestion can include:
• Source separated kitchen waste. • Source separated kitchen and garden waste. • OFMSW of residual or ‘black bag’ MSW (as part of a MBT plant). • Commercial organic waste (food waste from businesses, restaurant waste, or
catering wastes from institutional kitchens such as schools, hospitals, universities, office blocks, prisons etc.).
• Organic industrial waste (including food processing and brewery industries, glycerol from biodiesel production and many others).
• Abattoir/meat processing wastes. • Agricultural wastes (manures, slurries, or excess/unusable crop). • Sewage sludge. • Energy crops.
Table 17 simplifies some of the key parameters concerning potential co-digestion feedstocks for centralised anaerobic digesters. The simplified points made in Table 17 are further discussed in the paragraphs below.
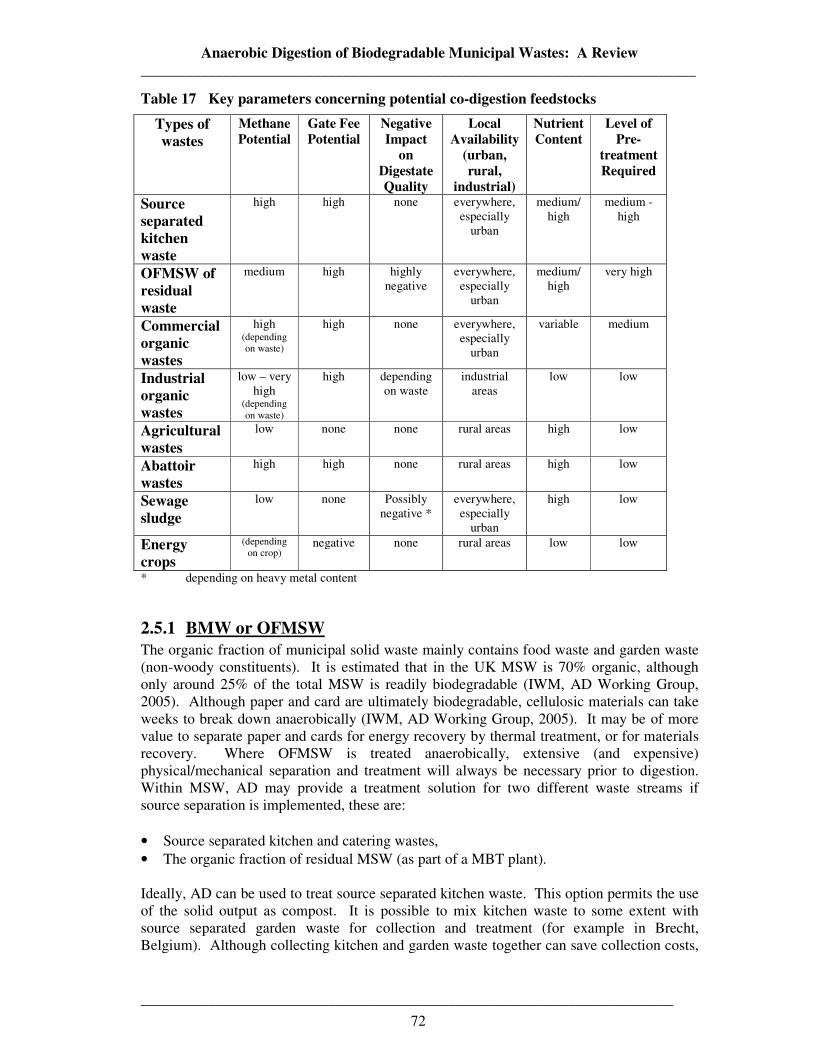
Anaerobic Digestion of Biodegradable Municipal Wastes: A Review __________________________________________________________________________
_______________________________________________________________________
72
Table 17 Key parameters concerning potential co-digestion feedstocks
Types of wastes
Methane Potential
Gate Fee Potential
Negative Impact
on Digestate Quality
Local Availability
(urban, rural,
industrial)
Nutrient Content
Level of Pre-
treatment Required
Source separated kitchen waste
high high none everywhere, especially
urban
medium/high
medium - high
OFMSW of residual waste
medium high highly negative
everywhere, especially
urban
medium/high
very high
Commercial organic wastes
high (depending on waste)
high none everywhere, especially
urban
variable
medium
Industrial organic wastes
low – very high
(depending on waste)
high depending on waste
industrial areas
low low
Agricultural wastes
low none none rural areas high low
Abattoir wastes
high high none rural areas high low
Sewage sludge
low none Possibly negative *
everywhere, especially
urban
high low
Energy crops
(depending on crop)
negative none rural areas low low
* depending on heavy metal content
2.5.1 BMW or OFMSW The organic fraction of municipal solid waste mainly contains food waste and garden waste (non-woody constituents). It is estimated that in the UK MSW is 70% organic, although only around 25% of the total MSW is readily biodegradable (IWM, AD Working Group, 2005). Although paper and card are ultimately biodegradable, cellulosic materials can take weeks to break down anaerobically (IWM, AD Working Group, 2005). It may be of more value to separate paper and cards for energy recovery by thermal treatment, or for materials recovery. Where OFMSW is treated anaerobically, extensive (and expensive) physical/mechanical separation and treatment will always be necessary prior to digestion. Within MSW, AD may provide a treatment solution for two different waste streams if source separation is implemented, these are: • Source separated kitchen and catering wastes, • The organic fraction of residual MSW (as part of a MBT plant). Ideally, AD can be used to treat source separated kitchen waste. This option permits the use of the solid output as compost. It is possible to mix kitchen waste to some extent with source separated garden waste for collection and treatment (for example in Brecht, Belgium). Although collecting kitchen and garden waste together can save collection costs,
Anaerobic Digestion of Biodegradable Municipal Wastes: A Review __________________________________________________________________________
_______________________________________________________________________
73
the logic behind this combined collection option is debatable, as garden wastes can be efficiently and cheaply windrow composted. Once garden wastes come into contact with kitchen waste, the entire garden waste stream must be treated in an ABPR compliant manner, which can increase costs. Also, not much energy is available from the anaerobic digestion of garden waste, and aerobic treatment gives a better breakdown of ligno-cellulosic material. Environmentally, the collection of garden wastes for centralised treatment is questionable, with non-collection or home-composting a more sustainable option. As the wastes have been separated at source, the amount of mechanical separation and pre-treatment required (and thus the complexity and expense of the system) will be greatly reduced, although some mechanical separation will always be necessary. If ‘black bag’ collection continues and separation remains centralised then AD can be used to treat the organic fraction of MSW as part of a MBT plant. In addition, where anaerobic digestion is used to treat centrally separated organic wastes (as in OFMSW of residual waste), then the digestate will not be suitable for use as a fertiliser and will need to be disposed of (either by thermal treatment or to landfill). This disposal will represent an extra expense. If the digestate is to be landfilled, then the quality of the digestate (as long as it is biostabilised) will not be important. In these cases, any organic waste should be added in the maximum possible quantities (provided toxicity and transport do not present problems) in order to maximise the biogas yield and therefore income from renewable energy.
2.5.2 Commercial organic waste Commercial organic wastes consist of food waste from businesses, restaurant waste, or catering wastes from schools, hospitals, universities, office blocks and other institutional kitchens. At present catering waste is collected as part of the MSW stream and landfilled. Commercial catering waste represents a large, easily targetable amount of food waste, which should be seen as a resource. Every local authority without exception has schools, hospitals, supermarkets, restaurants and other large catering facilities that produce food waste both in terms of un-used or out of date food/wastage and in terms of scraps disposed of in the bin. Were these organic resources to be collected at source, perhaps by a specially trained staff member, then large volumes of high energy biowaste could be easily collected from fewer points. Source separation and collection from large institutions such as these would be an easier and cheaper way to divert organics from landfill, than source separated collection from households. If source separation was carried out at source by trained staff in these institutions then there should be much less contamination than in a domestic-based municipal waste stream. This would mean that less mechanical separation would be required. With large scale suppliers discounted gate fees (or other incentives or punishments) could be offered in return for providing a contaminant free ‘product’. Due to the large volumes and putrescible nature of food wastes (particularly in summer) it could be necessary to collect wastes more often than once weekly. In Lisbon for example catering and restaurant wastes are collected every evening in the summer due to the hot climate. These wastes will be anaerobically digested at a centralised site for energy and compost production.
Anaerobic Digestion of Biodegradable Municipal Wastes: A Review __________________________________________________________________________
_______________________________________________________________________
74
2.5.3 Organic industrial waste A wide variety of organic wastes are produced in large volumes by many industries. Organic waste from industry can be in solid or liquid form. Many of the bigger industrial operations have their own waste treatment systems involving anaerobic digestion, which can minimise the costs of either on-site aerobic treatment or disposal to sewer. Industries commonly using AD for wastes treatment include the food industry, the drinks and brewing industry, the sugar industry, the paper industry, the dairy industry, slaughterhouses, fish processing industries, the organic chemical industry, and the pharmaceutical and fermentation industries. Many industries produce smaller amounts of waste which is ideal for anaerobic digestion, but for which a specialised digester would not be economic. Much of this waste is currently sent to landfill or sewer. Considerable potential exists for a centralised anaerobic digester to boost its economics by accepting these industrial organic wastes. Not only could gate fees be collected, but biogas yields could be improved and therefore more renewable energy produced and sold. Most of the waste products from the food industry have excellent methane potential. In other European countries these wastes are in demand by plant operators. As well as boosting biogas production, industrial organic wastes can usually attract a gate fee. Now, in Europe, some AD operators are starting to pay for the waste materials with the highest gas potential like fat and vegetable oil (IEA Bioenergy, Task 37, 2005). With current high feed-in tariffs operators can easily recover the cost of securing these wastes. Before any industrial wastes are accepted, their content should be thoroughly characterised and their digestability (and suitability in the particular system) tested at a laboratory scale facility.
2.5.4 Agricultural wastes (manures, slurries) The EU Nitrates Directive (1991/676/EEC) brought into sharp focus for livestock producers (and the associated industries continuing up the food chain) that society requires them to act responsibly towards the environment in the way they handle manure. AD is a technology which is employed (and could be employed further) to aid the industry in compliance with these requirements. AD is considered standard technology for treating the wastes from intensive livestock production, except for chicken litter, which is usually incinerated due to its high solids content (50% TS, Strathclyde University website, accessed June 2006). The reduction of organic pollution has traditionally been the main goal. There are many examples of successful digesters across Europe operating on source separated kitchen waste and livestock manure (see Table 29 in Section 3.0). In Germany in particular, there are many centralised anaerobic digesters co-digesting mainly source separated food waste with agricultural wastes. Some of these plants have been operating successfully for over 20 years. In the UK, as farmers can spread a certain amount of slurry straight to land, they have little incentive to pay for treatment, or for the transport of their slurry off-site. It is likely that costs for the transport and storage of animal slurry would need to be met by the AD operating company, rather than by the farmers, except in intensive livestock operations that do not already have wastewater treatment facilities on site. In the last few years, plants processing predominantly agricultural manures (which incur no gate fees) would have been financially marginal or unprofitable (Strathclyde University website, accessed June 2006). This situation is presently changing, with operating cost
Anaerobic Digestion of Biodegradable Municipal Wastes: A Review __________________________________________________________________________
_______________________________________________________________________
75
being minimised, more capital grants becoming available and the ever increasing fuel prices forcing incomes from renewable energy upwards. The addition of other higher energy waste streams (for which gate fees would be paid) could ‘tip the balance’ and make anaerobic systems profitable (see the Holsworthy Biogas Plant case study, Section 5.3.1). As well as reducing the organic pollution potential of manures, AD can reduce the odour associated with animal slurries by up to 80% (Irish EPA, 2005). Anaerobic digestion does not remove N and P from slurry, and can increase the proportion of nutrients available for the uptake by plants, as compared with untreated slurry. Digestate has 25% more accessible inorganic nitrogen (NH4-N) and a higher pH value than untreated liquid manure (Irish EPA, 2005). AD transforms organic bound nutrients to a mineralised form, which is more available to plants. Nutrients in the digestate can be more readily utilised as fertiliser or separated to produce a liquid and fibrous solid. The separated fibre could be further composted for full biostabilisation, or pelleted for ease of transport and application. Animal slurries are already rich in anaerobic bacteria, and can enhance the microbial populations in digesters. Slurries also contain a high nutrient content, which aids bacterial growth. Animal slurries have good buffering capacity because of their high ammonia content. They can also be useful additions, with regards to their high water content (3 – 5% TS in pig slurry, and 6 – 9% TS in cattle slurry), and can be mixed with drier wastes to raise the water content. On a negative note, animal manures are relatively low in energy content (due in part to a high ligno-cellulose content and their low TS content). Specific energy contents are shown in Table 19. Chicken manure is the exception to this due to its high TS content, but this TS content means that if it can not be mixed with a low solids waste (such as sewage sludge or cow manure) then significant volumes of water will need to be added before it can be digested. Pig, chicken and cow slurry can all contain antibiotics and disinfectants which may be inhibitory to AD bacteria at high concentrations (Monnet, 2003). Other potential problems with agricultural slurries include the presence of grit and sand, especially chicken manure when the chickens are kept in open feedlots (Monnet, 2003), or the presence of straw or wood shavings which can cause blockages or the formation of scum layers. In the case of most slurries however, aside from mixing with other wastes to obtain the optimal total solids percentage, very little pre-treatment is necessary. It can be worth involving local farmers at an early stage in the planning of any AD system, as realistically their land represents the best possible destination for the digestate. Outlay in terms of transporting slurry to and from the AD site may be considerably less than the benefits that the slurry (and the farmers co-operation) may bring. These issues are discussed further in the report on the Holsworthy Biogas Plant in Section 5.3.1). Other agricultural wastes potentially suitable for AD are excess or unusable crops. The unplanned and irregular nature of these wastes mean that they can be added to digestion systems when they arise, but should not be relied upon. Also, farmers often find cheaper disposal routes that do not require transport, such as use as an animal feed, or disposal back to the land.
Anaerobic Digestion of Biodegradable Municipal Wastes: A Review __________________________________________________________________________
_______________________________________________________________________
76
2.5.5 Abattoir wastes Due to its ABPR requirements, alongside its high methane potential and ammonia (buffering) content slaughterhouse waste is particularly well suited to large co-digestion plants. Abattoir waste material is classified in three categories. Category 1 products bear increased risk for human and animal health (BSE, foot and mouth disease etc.) and have to be incinerated (IEA Bioenergy, Task 37, 2005). Category 2 material includes perished animals or animals slaughtered, but not intended for human consumption, milk and colostrums, manure as well as digestive tract content. Category 3 materials contain meat-containing wastes from the foodstuff industry, slaughterhouse wastes of animals fit for human consumption and catering waste. The anaerobic digestion of Categories 2 and 3 wastes is strongly recommended (IEA Bioenergy, Task 37, 2005), although ABPR regulations including a pasteurisation stage must be met. The acceptance of abattoir wastes can be attractive from two perspectives, firstly, significant gate fees can be recovered per tonne of waste accepted, and secondly, abattoir wastes have a relatively high biogas yield, see Table 19, and income from renewable energy sales can be significantly increased. The upper gate fee that can be charged for abattoir wastes will be dependant on the market value for rendering processes. Abattoir wastes can also be high in ammonia which can act as a natural buffer. At higher concentrations however, ammonia can be toxic to micro-organisms, and care must be taken that ammonia is not present in levels inhibitory to methanogenic bacteria. Molecular ammonia becomes toxic when the concentrations exceed 1500 – 3000 mg/l of total ammonia-nitrogen at a pH higher than 7.4. The ammonium ion is toxic at concentrations greater than 3000 mg/l of total ammonium-nitrogen at all pH levels. Although there is usually some degree of local opposition to any new wastes-based development, the inclusion of abattoir wastes adds to perceived ‘unpleasantness’ and can further worsen the image of any plants. The acceptance of abattoir wastes increases the chance of odour problems, particularly at the unloading area, although this can be effectively managed. Despite not affecting the quality of the digestate, the inclusion of abattoir waste could negatively impact the image of the digestate, which could have knock-on effects for finding a market for the digestate. Despite pasteurisation and pathogen reduction, farmers could possibly be more reluctant to allow digestate to be spread on their land.
2.5.6 Sewage sludge
Anaerobic digestion has long been the treatment of choice for sewage sludge, mainly due to the low operational costs compared with alternatives. Typically in Europe between 30% and 70% of sewage sludge is treated by AD depending on national legislation and priorities. AD stabilises sewage sludge by degrading volatile organics, which reduces the solids content of the sludge, increases pathogen reduction and reduces the odour potential. Enough biogas is also produced to cover all on sewage sludge site requirements and produce a net excess, although this excess is small when compared to the AD of other organic wastes due to the low total solids content (approximately 2 - 5%). Despite the relatively poor energy return it offers in comparison to other organic materials, mixing sewage with other feed types can raise the overall C:N ratio, which can have a beneficial effect on the overall energy balance. Sewage sludge can contain heavy metals, and the end use of the digestate may be compromised if the level of heavy metals is too high. This is another reason why it may be beneficial to add only a controlled proportion of sewage sludge to the digester-bound waste
Anaerobic Digestion of Biodegradable Municipal Wastes: A Review __________________________________________________________________________
_______________________________________________________________________
77
stream. Sewage sludge is in plentiful supply, and if the digester is sited near an existing (or planned) wastewater treatment plant then transport costs will be minimised. The addition of sewage sludge to a digester treating OFMSW can bring similar benefits to the addition of animal slurries. Sewage sludge is rich in anaerobic bacteria and rich in nutrients that can aid bacterial growth. It has been reported that the addition of 5% sewage sludge to MSW has been proven to give good process performance and digester stability, but better AD performance has been achieved with a feedstock of 80% OFMSW to 20% sewage sludge (Monnet, 2003). OFMSW has been co-digested with sewage sludge in many full scale plants across Europe (particularly in Italy). For example, in Treviso 10 tonnes of centrally separated OFMSW per day are co-digested at the wastewater treatment plant, as described by Bolzonella et al., 2006).
2.5.7 Energy crops The cultivation of energy crops for renewable energy production by AD or thermal incineration (e.g. wood chip boilers) could represent a significant growth area in the near future. Surplus food production in OECD countries has lead to cultivable cropland areas being left fallow. In the European Union about 15% of arable land is currently under voluntary ‘set-aside’ and not used for food production (Bauen et al., 2004). Hence, significant potential exists for beneficially using these (and other) areas to grow energy crops. In 2001, 5.7 million ha of EU land were under compulsory or voluntary set-aside of which about 929,000 ha were dedicated to non-food crops (Bauen et al., 2004). It is estimated that 20% of arable land dedicated for energy production (20 t/TS/ha) would give around 10% of the worlds total energy required in 2050 (Holm Nielsen et al., 2006). Adding 7.5% from non collected straw, 4.5% from collected waste processing, and 15% from forest or pasture would result in almost 40% of the worlds energy needed in 2050 (Holm Nielsen et al., 2006). Most non-food crops are aimed at the production of biofuels, as a result of additional fiscal incentives linked to transport fuels. By-products from the production of biofuels (such as glycerol from the production of biodiesel) can provide further biogas when anaerobically digested. Aside from the renewable energy and land use potential, biomass-based energy systems (including energy crops for AD) could provide an alternative economic opportunity for agriculture-dependant rural populations. Energy crops that can be used in anaerobic digesters include (but are not limited to) corn, barley, rye or grass (IEA Bioenergy, Task 37, 2005). Along with agricultural wastes, energy crops could be a particularly important contribution to digesters in (or close to) rural areas. The digester would preferably be as close as possible to the farmland used, to minimise transport cost and impact. It is reported that the main constraints to increasing electricity production based on biomass resources in the OECD are commercial and policy barriers rather than technical barriers (Bauen et al., 2004). In Denmark, Austria and Germany where there are many AD systems, easily degradable wastes are becoming scarce and farmers are looking for alternative substrates (energy crops) such as corn, barley, rye or grass. In Germany the income from electricity produced from biogas made from corn is higher than using the same crop to feed fattening beef. Anaerobic digestion operators in Austria also receive higher feed-in tariffs when the biogas is produced with crops (IEA Bioenergy, Task 37, 2005). Aside from producing renewable energy, reducing dependence on fossil fuels

Anaerobic Digestion of Biodegradable Municipal Wastes: A Review __________________________________________________________________________
_______________________________________________________________________
78
and the associated carbon dioxide implications, benefits of growing energy crops would include:
• A viable, beneficial, sustainable outlet would be created for digestate not suitable for application to land used in food production. This could be very important given the potential large quantity of digestate/compost and the potential lack of markets.
• Jobs and income would be created in rural areas. • Utilisation of agricultural land not used for food production. • Diversification of income for farmers. • Energy production would become more ‘localised’, easing security of supply issues.
2.5.8 Glycerol from biodiesel production
Biodiesel is made from renewable biological sources such as vegetable oils and animal fats. It is biodegradable and non-toxic, has low emission profiles and so is environmentally beneficial. High quality glycerol is a by-product in the production of biodiesel. This glycerol is an ideal substrate for anaerobic digestion. Biodiesel production is expected to rise in the future, and therefore the availability of glycerol will be increased.
2.6 Anaerobic Digestion of Municipal Biowastes – End Products The primary end products from the anaerobic digestion of organic wastes are:
• Biogas • Digestate (and process water/liquor)
Irrespective of the type of organic waste treated, the biogas will remain a valuable commodity that can be used to produce renewable energy. With regards to digestate, its usefulness and marketability depends on the quality of the waste being digested. Generally speaking, a digestate from the digestion of residual OFMSW will not achieve the necessary quality standards to be spread on land, while the digestate from the digestion of organic industrial wastes, sewage sludge, source separated BMW or agricultural wastes should be able to be used beneficially on agriculture (although this is dependant on the specific wastes streams and national legislation). These two primary end products are discussed in more detail in the sections below.
2.6.1 Biogas
2.6.1.1 Introduction to biogas
The biogas produced by anaerobic digestion typically contains 55 – 65% methane (CH4), with 34 – 44% carbon dioxide (CO2), alongside small quantities of hydrogen sulphide (H2S), ammonia (NH4) and water vapour (H2O). Trace gases such as hydrogen, nitrogen, oxygen, saturated or halogenated carbohydrates, siloxanes and many others are also present in biogas. Biogas produced by the AD process is quite similar to landfill gas and ‘natural’ gas as it is extracted from the wellhead. However, as well as methane, natural gas also contains a variety of other hydrocarbons such as butane and propane. As a result, the calorific value
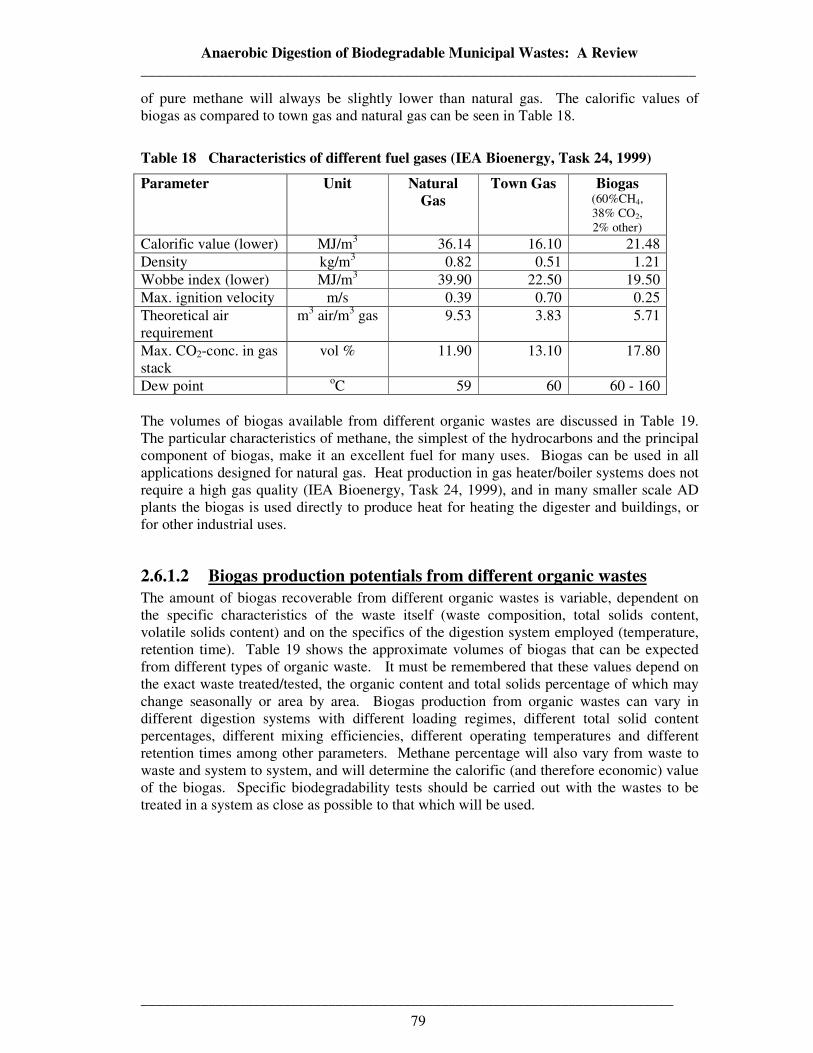
Anaerobic Digestion of Biodegradable Municipal Wastes: A Review __________________________________________________________________________
_______________________________________________________________________
79
of pure methane will always be slightly lower than natural gas. The calorific values of biogas as compared to town gas and natural gas can be seen in Table 18.
Table 18 Characteristics of different fuel gases (IEA Bioenergy, Task 24, 1999)
Parameter Unit Natural Gas
Town Gas Biogas (60%CH4, 38% CO2, 2% other)
Calorific value (lower) MJ/m3 36.14 16.10 21.48 Density kg/m3 0.82 0.51 1.21 Wobbe index (lower) MJ/m3 39.90 22.50 19.50 Max. ignition velocity m/s 0.39 0.70 0.25 Theoretical air requirement
m3 air/m3 gas 9.53 3.83 5.71
Max. CO2-conc. in gas stack
vol % 11.90 13.10 17.80
Dew point oC 59 60 60 - 160 The volumes of biogas available from different organic wastes are discussed in Table 19. The particular characteristics of methane, the simplest of the hydrocarbons and the principal component of biogas, make it an excellent fuel for many uses. Biogas can be used in all applications designed for natural gas. Heat production in gas heater/boiler systems does not require a high gas quality (IEA Bioenergy, Task 24, 1999), and in many smaller scale AD plants the biogas is used directly to produce heat for heating the digester and buildings, or for other industrial uses.
2.6.1.2 Biogas production potentials from different organic wastes
The amount of biogas recoverable from different organic wastes is variable, dependent on the specific characteristics of the waste itself (waste composition, total solids content, volatile solids content) and on the specifics of the digestion system employed (temperature, retention time). Table 19 shows the approximate volumes of biogas that can be expected from different types of organic waste. It must be remembered that these values depend on the exact waste treated/tested, the organic content and total solids percentage of which may change seasonally or area by area. Biogas production from organic wastes can vary in different digestion systems with different loading regimes, different total solid content percentages, different mixing efficiencies, different operating temperatures and different retention times among other parameters. Methane percentage will also vary from waste to waste and system to system, and will determine the calorific (and therefore economic) value of the biogas. Specific biodegradability tests should be carried out with the wastes to be treated in a system as close as possible to that which will be used.
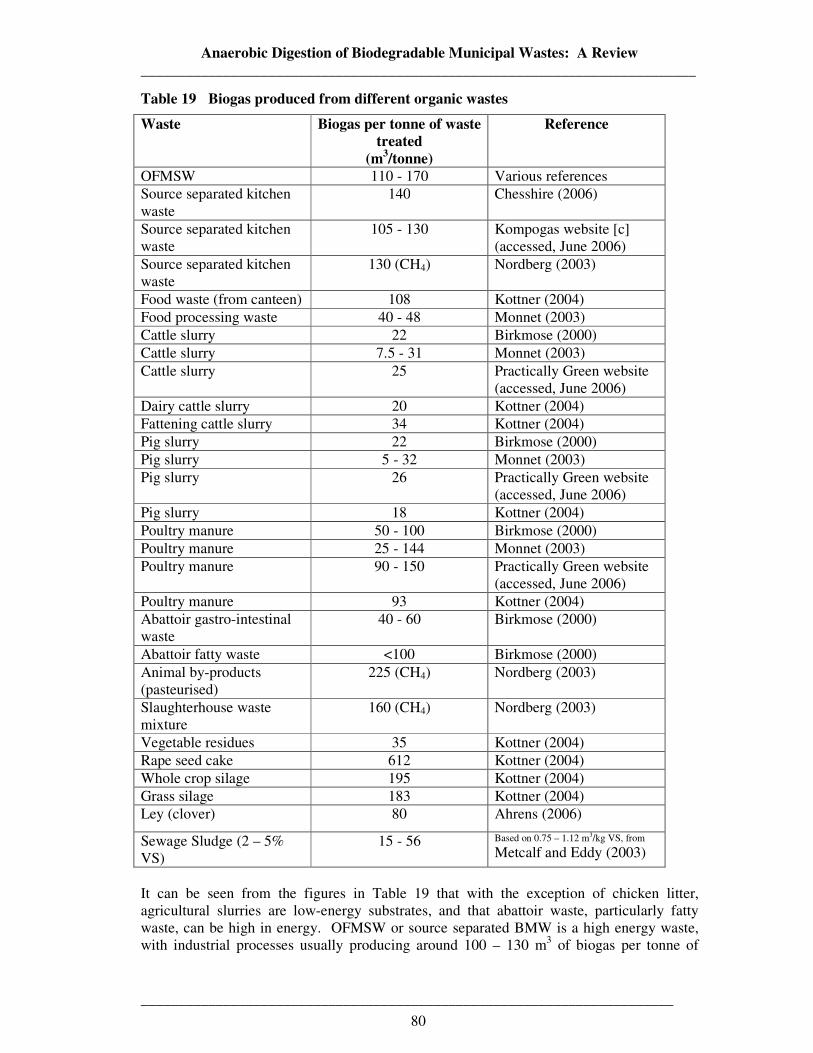
Anaerobic Digestion of Biodegradable Municipal Wastes: A Review __________________________________________________________________________
_______________________________________________________________________
80
Table 19 Biogas produced from different organic wastes
Waste Biogas per tonne of waste treated
(m3/tonne)
Reference
OFMSW 110 - 170 Various references Source separated kitchen waste
140 Chesshire (2006)
Source separated kitchen waste
105 - 130 Kompogas website [c] (accessed, June 2006)
Source separated kitchen waste
130 (CH4) Nordberg (2003)
Food waste (from canteen) 108 Kottner (2004) Food processing waste 40 - 48 Monnet (2003) Cattle slurry 22 Birkmose (2000) Cattle slurry 7.5 - 31 Monnet (2003) Cattle slurry 25 Practically Green website
(accessed, June 2006) Dairy cattle slurry 20 Kottner (2004) Fattening cattle slurry 34 Kottner (2004) Pig slurry 22 Birkmose (2000) Pig slurry 5 - 32 Monnet (2003) Pig slurry 26 Practically Green website
(accessed, June 2006) Pig slurry 18 Kottner (2004) Poultry manure 50 - 100 Birkmose (2000) Poultry manure 25 - 144 Monnet (2003) Poultry manure 90 - 150 Practically Green website
(accessed, June 2006) Poultry manure 93 Kottner (2004) Abattoir gastro-intestinal waste
40 - 60 Birkmose (2000)
Abattoir fatty waste <100 Birkmose (2000) Animal by-products (pasteurised)
225 (CH4) Nordberg (2003)
Slaughterhouse waste mixture
160 (CH4) Nordberg (2003)
Vegetable residues 35 Kottner (2004) Rape seed cake 612 Kottner (2004) Whole crop silage 195 Kottner (2004) Grass silage 183 Kottner (2004) Ley (clover) 80 Ahrens (2006)
Sewage Sludge (2 – 5% VS)
15 - 56 Based on 0.75 – 1.12 m3/kg VS, from
Metcalf and Eddy (2003)
It can be seen from the figures in Table 19 that with the exception of chicken litter, agricultural slurries are low-energy substrates, and that abattoir waste, particularly fatty waste, can be high in energy. OFMSW or source separated BMW is a high energy waste, with industrial processes usually producing around 100 – 130 m3 of biogas per tonne of

Anaerobic Digestion of Biodegradable Municipal Wastes: A Review __________________________________________________________________________
_______________________________________________________________________
81
waste. The value quoted in Monnet (2003) of 40 – 48 m3/tonne is for food processing waste, which can vary greatly in its content and therefore methane potential. With regards to energy crops silage and rape seed cake, in particular, have very high methane potentials, and their inclusion in any digester system would positively impact biogas production. Rape seed cake is very high in solids content (91% TS) and would therefore need to be mixed with wetter wastes (e.g. sewage sludge or cattle manure) before digestion. With regards to municipal organic wastes, the usual range of biogas production depends on the specific wastes collected, and the wastes strategy and collection methods employed. The content (and therefore biogas potential) of municipal organic wastes (both source separated and centrally separated) can vary significantly from region to region, and from season to season. This is another reason that many suppliers prefer to co-digest municipal wastes with other organic wastes. In terms of metres cubed of biogas per tonne, the biogas potential is in geral higher for source separated kitchen wastes than it is for kitchen and garden wastes, yard wastes, or centrally separated OFMSW. This average production figure decreases as more and more garden wastes are added (although the total biogas production increases with the extra waste). The biogas available from OFMSW is dependent on the quantity and content of the organic materials left in the residual wastes. The potential biogas yield from some of the organic materials in OFMSW is shown in Table 20.
Table 20 Biogas yield from MSW materials
Material Moisture (%)
Biogas Yield (m3/tonne of material feed)
Paper Newspaper 10 16 Cardboard/boxboard 10 125 Telephone directories 10 61 Office paper 10 178 Mixed paper 10 112 Kitchen Wastes Food 70 113 Yard Wastes Grass 60 34 Leaves 60 23 Brush 40 67 Other Organic 101 (Sources ICF, 2001 and Hackett and Williams, 2004, from RIS 2005).
Some specific biogas production references from systems treating municipal wastes are shown in Table 21 and Table 22.
As can be seen in Table 21 above the range of biogas produced in the sites treating source separated municipal biowastes is 70 – 170 m3/tonne, with a mean of 117 m3/tonne. This corresponds with the values reported in the literature.
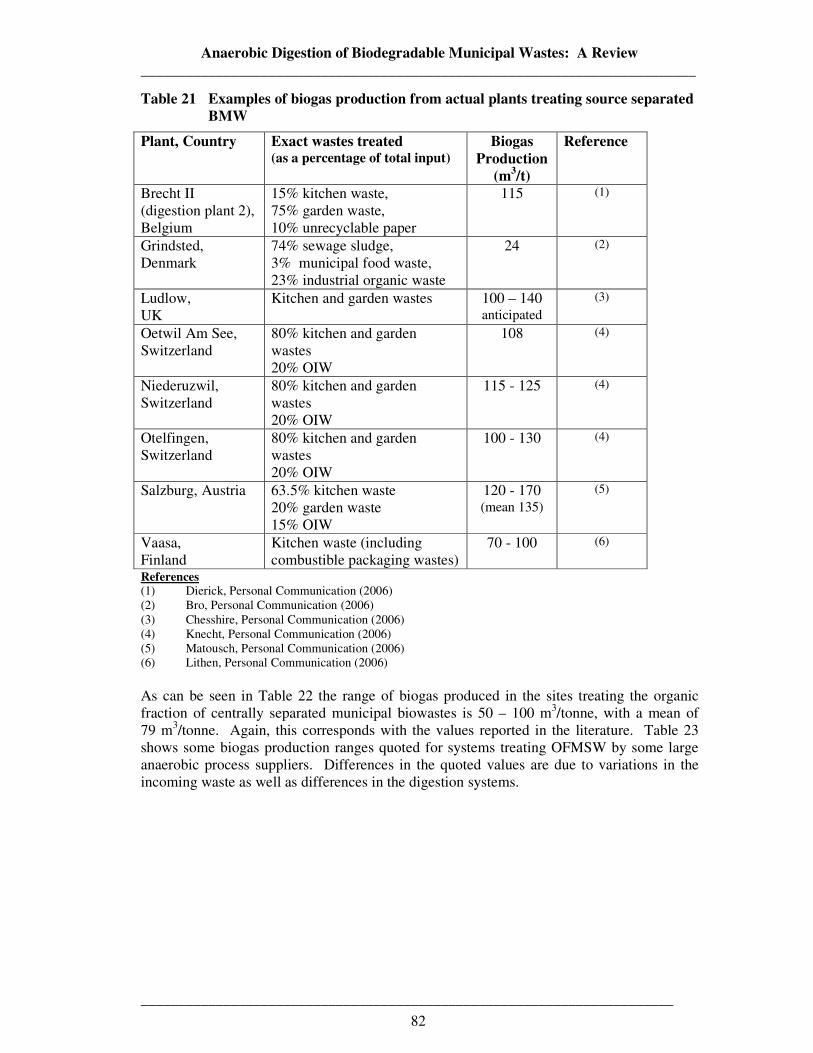
Anaerobic Digestion of Biodegradable Municipal Wastes: A Review __________________________________________________________________________
_______________________________________________________________________
82
Table 21 Examples of biogas production from actual plants treating source separated BMW
Plant, Country Exact wastes treated (as a percentage of total input)
Biogas Production
(m3/t)
Reference
Brecht II (digestion plant 2), Belgium
15% kitchen waste, 75% garden waste, 10% unrecyclable paper
115 (1)
Grindsted, Denmark
74% sewage sludge, 3% municipal food waste, 23% industrial organic waste
24 (2)
Ludlow, UK
Kitchen and garden wastes 100 – 140 anticipated
(3)
Oetwil Am See, Switzerland
80% kitchen and garden wastes 20% OIW
108 (4)
Niederuzwil, Switzerland
80% kitchen and garden wastes 20% OIW
115 - 125 (4)
Otelfingen, Switzerland
80% kitchen and garden wastes 20% OIW
100 - 130 (4)
Salzburg, Austria 63.5% kitchen waste 20% garden waste 15% OIW
120 - 170 (mean 135)
(5)
Vaasa, Finland
Kitchen waste (including combustible packaging wastes)
70 - 100 (6)
References (1) Dierick, Personal Communication (2006) (2) Bro, Personal Communication (2006) (3) Chesshire, Personal Communication (2006) (4) Knecht, Personal Communication (2006) (5) Matousch, Personal Communication (2006) (6) Lithen, Personal Communication (2006) As can be seen in Table 22 the range of biogas produced in the sites treating the organic fraction of centrally separated municipal biowastes is 50 – 100 m3/tonne, with a mean of 79 m3/tonne. Again, this corresponds with the values reported in the literature. Table 23 shows some biogas production ranges quoted for systems treating OFMSW by some large anaerobic process suppliers. Differences in the quoted values are due to variations in the incoming waste as well as differences in the digestion systems.
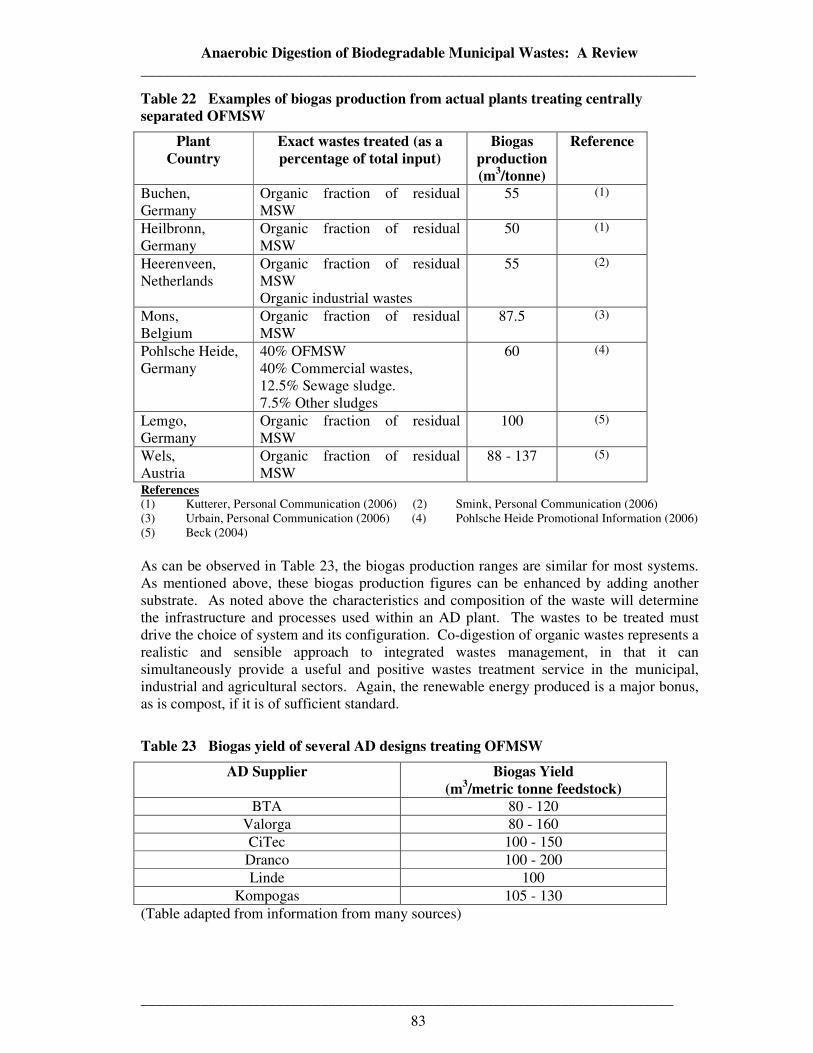
Anaerobic Digestion of Biodegradable Municipal Wastes: A Review __________________________________________________________________________
_______________________________________________________________________
83
Table 22 Examples of biogas production from actual plants treating centrally separated OFMSW
Plant Country
Exact wastes treated (as a percentage of total input)
Biogas production (m3/tonne)
Reference
Buchen, Germany
Organic fraction of residual MSW
55 (1)
Heilbronn, Germany
Organic fraction of residual MSW
50 (1)
Heerenveen, Netherlands
Organic fraction of residual MSW Organic industrial wastes
55 (2)
Mons, Belgium
Organic fraction of residual MSW
87.5 (3)
Pohlsche Heide, Germany
40% OFMSW 40% Commercial wastes, 12.5% Sewage sludge. 7.5% Other sludges
60 (4)
Lemgo, Germany
Organic fraction of residual MSW
100 (5)
Wels, Austria
Organic fraction of residual MSW
88 - 137 (5)
References (1) Kutterer, Personal Communication (2006) (2) Smink, Personal Communication (2006) (3) Urbain, Personal Communication (2006) (4) Pohlsche Heide Promotional Information (2006) (5) Beck (2004) As can be observed in Table 23, the biogas production ranges are similar for most systems. As mentioned above, these biogas production figures can be enhanced by adding another substrate. As noted above the characteristics and composition of the waste will determine the infrastructure and processes used within an AD plant. The wastes to be treated must drive the choice of system and its configuration. Co-digestion of organic wastes represents a realistic and sensible approach to integrated wastes management, in that it can simultaneously provide a useful and positive wastes treatment service in the municipal, industrial and agricultural sectors. Again, the renewable energy produced is a major bonus, as is compost, if it is of sufficient standard.
Table 23 Biogas yield of several AD designs treating OFMSW
AD Supplier Biogas Yield (m3/metric tonne feedstock)
BTA 80 - 120 Valorga 80 - 160 CiTec 100 - 150 Dranco 100 - 200 Linde 100
Kompogas 105 - 130 (Table adapted from information from many sources)
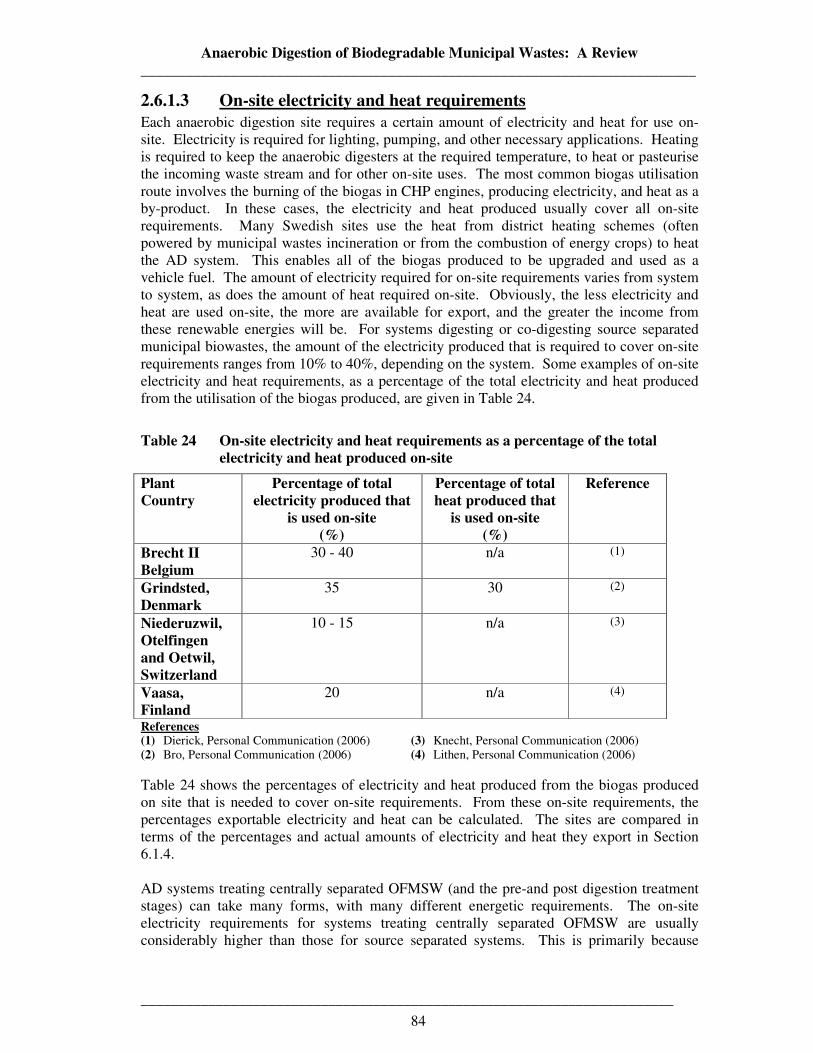
Anaerobic Digestion of Biodegradable Municipal Wastes: A Review __________________________________________________________________________
_______________________________________________________________________
84
2.6.1.3 On-site electricity and heat requirements Each anaerobic digestion site requires a certain amount of electricity and heat for use on-site. Electricity is required for lighting, pumping, and other necessary applications. Heating is required to keep the anaerobic digesters at the required temperature, to heat or pasteurise the incoming waste stream and for other on-site uses. The most common biogas utilisation route involves the burning of the biogas in CHP engines, producing electricity, and heat as a by-product. In these cases, the electricity and heat produced usually cover all on-site requirements. Many Swedish sites use the heat from district heating schemes (often powered by municipal wastes incineration or from the combustion of energy crops) to heat the AD system. This enables all of the biogas produced to be upgraded and used as a vehicle fuel. The amount of electricity required for on-site requirements varies from system to system, as does the amount of heat required on-site. Obviously, the less electricity and heat are used on-site, the more are available for export, and the greater the income from these renewable energies will be. For systems digesting or co-digesting source separated municipal biowastes, the amount of the electricity produced that is required to cover on-site requirements ranges from 10% to 40%, depending on the system. Some examples of on-site electricity and heat requirements, as a percentage of the total electricity and heat produced from the utilisation of the biogas produced, are given in Table 24.
Table 24 On-site electricity and heat requirements as a percentage of the total electricity and heat produced on-site
Plant Country
Percentage of total electricity produced that
is used on-site (%)
Percentage of total heat produced that
is used on-site (%)
Reference
Brecht II Belgium
30 - 40 n/a (1)
Grindsted, Denmark
35 30 (2)
Niederuzwil, Otelfingen and Oetwil, Switzerland
10 - 15 n/a (3)
Vaasa, Finland
20 n/a (4)
References (1) Dierick, Personal Communication (2006) (3) Knecht, Personal Communication (2006) (2) Bro, Personal Communication (2006) (4) Lithen, Personal Communication (2006) Table 24 shows the percentages of electricity and heat produced from the biogas produced on site that is needed to cover on-site requirements. From these on-site requirements, the percentages exportable electricity and heat can be calculated. The sites are compared in terms of the percentages and actual amounts of electricity and heat they export in Section 6.1.4. AD systems treating centrally separated OFMSW (and the pre-and post digestion treatment stages) can take many forms, with many different energetic requirements. The on-site electricity requirements for systems treating centrally separated OFMSW are usually considerably higher than those for source separated systems. This is primarily because
Anaerobic Digestion of Biodegradable Municipal Wastes: A Review __________________________________________________________________________
_______________________________________________________________________
85
centrally separated OFMSW requires more upfront mechanical separation and pre-treatment than source separated BMW, and this is usually more energy intensive. On larger wastes treatment and disposal sites, the electricity and heat produced are often used to cover the requirements of the whole site (often including a municipal wastewater treatment site). For example, at the Salzburger Abfallbeseitigung (SAB) wastes treatment and disposal site in Salzburg, the heat and electricity produced in treating source separated biowastes anaerobically is almost sufficient to cover the requirements of the entire MBT plant, treating residual MSW, the municipal wastewater treatment plant, the hazardous wastes disposal centre and all of the office buildings (Matousch, Personal Communication, 2006). The electricity and heat requirements of the biowastes treatment line (including the anaerobic digester) were easily exceeded by the biogas produced by the anaerobic digester. Given the great many approaches to wastes collection, pre-treatment, co-digestion options, digester configurations and post-treatment options, generalisations should not be made on the energetic requirements of AD systems treating municipal wastes, other than assuming that they are energy positive. Technologies and approaches vary and cases should be considered individually.
2.6.1.4 Biogas upgrading
For many applications, the quality of biogas has to be improved. In larger scale plants, the biogas is commonly burned in an internal combustion engine (ICE) to generate electricity. The main upgrading required before the biogas is utilised in most gas engines is that hydrogen sulphide must be removed, or at least reduced to below 1000 ppm to prevent corrosion of the gas engines (IEA Bioenergy, Task 24, 1999). A biogas de-sulphurisation unit is a feature of most anaerobic digestion plants. The most common commercial methods for hydrogen sulphide removal are listed below:
• Biological de-sulphurisation • Air/oxygen dosing to digester biogas • Biological filters • Iron chloride dosing to digester slurry • Iron oxide • Iron oxide wood chips • Iron oxide pellets • Impregnated activated carbon • Water scrubbing • Selexol scrubbing • Sodium hydroxide scrubbing
A summary of these various biogas de-sulphurisation options is available in IEA Bioenergy, Task 24 (1999). Water vapour must also be removed because of the potential of accumulation of condensate in the gas line, and to prevent the formation of a corrosive acidic solution when hydrogen sulphide or carbon dioxide are dissolved. Also, water vapour removal achieves lower dew points, meaning that condensation and freezing are not problematic when biogas is stored under elevated pressures in cold conditions. Further upgrades are required if the biogas is to be added to the natural gas grid or utilised as a transport fuel. The upgrades required if the biogas is to be used as a transport fuel are briefly described in the Västerås, Linkoping and Jonkoping case studies, and are described in more detail in NSCA (2006).

Anaerobic Digestion of Biodegradable Municipal Wastes: A Review __________________________________________________________________________
_______________________________________________________________________
86
2.6.1.5 Biogas utilisation The utilisation of biogas in internal combustion engines (gas engines) for electricity and heat production is a long established technology. The electrical efficiency which can be achieved using a gas engine depends strongly on the capacity. Diesel engines rebuilt to spark ignited gas engines or dual fuel engines with 8 – 10% diesel injection are mostly used in large-scale applications. Small-scale CHP systems (<45 kWe) reach an electrical efficiency of 29% (spark ignition) and 31% (dual fuel engine) (Reith et al., 2005). Practical experience with small-scale internal combustion engines with a rated capacity of less than 200 kW indicate an electrical conversion efficiency up to 25%. Larger internal combustion engines (up to 1.5 MW) have a much higher electrical conversion efficiency, of 30 - 35% (IEA Bioenergy, Task 24, 1999). This increases to 35 – 40% for the very large engines (2 MW) (Reith et al., 2005). When biogas is used to produce electricity, there is the added potential for heating water from the engine’s exhaust and cooling systems. Up to 50% of the biogas energy content is converted to heat, which can partly be recovered from the exhaust gas (high temperature heat) and the cooling water and oil cooling (lower temperature heat) (Jenbacher, 2002). Combining hot water recovery with electricity generation can provide an overall conversion efficiency of 65 - 85% (IEA Bioenergy, Task 24, 1999). Disadvantages of the gas engine, apart from the limited efficiency of the smaller engines, include the environmental impact, emissions and noise production. Two types of emissions are particularly relevant. NOx emissions are high (80 – 450 g/GJ) Gailfuss (2000). Although NOx reduction technologies are available, there is a cost and efficiency penalty involved with their application. Typically, 1 – 2% of the methane in a gas engine will not be converted and is emitted to the atmosphere (Reith et al., 2005). The emission of uncombusted methane is a problem because methane is a known greenhouse gas. A promising near-term application for electrical generation is the use of gas turbines. For larger-scale systems, combined cycle power stations consist of gas turbines, steam turbines, and waste heat recovery boilers all working together to produce electricity. Modern gas turbine plants are small, efficient, environmentally friendly and visually unobtrusive (Reith et al., 2005). Units as small as 200 kW are available, but only at scales of greater than 800 kW does their electrical conversion efficiency equal or surpass an internal combustion engine-based system (Reith et al., 2005). However, the use of a gas turbine allows a greater fraction of the waste heat to be recovered as more valuable steam. In this fashion, overall gas turbine efficiency can be greater than 70%. Gas engine CHP systems have a higher electrical efficiency than gas turbine CHP systems and lower specific investment costs, however maintenance costs for gas engines are higher than for turbines. The use of gas turbines in CHP systems may be more economical in applications with a large, constant high value heat requirement (>110ºC) or in large installations of several MWe’s capacity (Jenbacher, 2002). A restriction of gas turbines is the limited flexibility with varying gas flows because a reduced gas inflow leads to a decreased efficiency (Reith et al., 2005). In the future, fuel cells and the Stirling engine may be able to use biogas to cost-effectively generate electricity and recover process heat. Fuel cells (FC) are power generating systems that produce DC electricity by combining fuel and oxygen (from the air) in an electrochemical reaction. There is no intermediate process which first converts fuel into mechanical energy and heat. Therefore fuel cells have extremely low emissions (IEA Bioenergy, Task 24, 1999). The reaction is similar to a battery however, fuel cells do not store the energy with chemicals internally. In a first step the fuel is transformed into hydrogen either by a catalytic steam reforming conversion or by a (platinum) catalyst. The H2 is converted to direct electrical current. The by-products of the
Anaerobic Digestion of Biodegradable Municipal Wastes: A Review __________________________________________________________________________
_______________________________________________________________________
87
reaction are water and CO2. Conversion efficiency to electricity is expected to exceed 50%. FC’s demonstrate relatively constant efficiencies over a wide range of loads. There are five types of fuel cells, classified by the type of electrolyte:
• Alkaline (AFC) • Phosphoric Acid (PAFC) • Molten Carbonate (MCFC) • Solid Oxide (SOFC) • Proton Exchange Membrane (PEM)
For biogas applications, fuel cells are typically Molten Carbonate (MCFC) or Solid Oxide (SOFC). For example, a MCFC is running on biogas generated from the anaerobic digestion of waste at the Leonberg digester facility, Böblingen (Baden Württemberg), Germany. The system has a maximum electrical capacity of 245 kW electric (with around 47% conversion efficiency) and a thermal capacity of 170 kW that is used to dry fermented residue which is used as a fertiliser (MTU, 2007). Further information is available in IEA Bioenergy, Task 24 (1999). In most countries, including the UK, Government policy and market conditions have favoured the use of biogas to produce renewable electricity. In other countries, different Government priorities and different market conditions see the biogas being used in other ways. For example, in the Netherlands there have been examples of biogas being upgraded and added into the natural gas grid. In Denmark, the biogas is often piped to a nearby CHP plant that provides district heating for towns and cities, and in Sweden biogas is upgraded and exclusively used as a transport fuel.
2.6.1.6 Renewable electricity
The UK Government has set a target of generating 10% of all UK electricity from renewable sources by 2010 (UK Parliament website [a], accessed September 2006). As of 2004, 3.6% of the UK’s electricity supply was generated from renewable sources (DTI website, accessed September 2006). The fact that, it is cheaper to produce electricity from fossil fuels than from renewable energy sources is a significant economic disincentive for the growth of renewable energy electricity. With Directive 2001/77/EC requiring increased electricity generation from renewable energy sources, countries have introduced specific measures to improve the economics of renewable electricity. The UK predominantly uses a quota system to promote renewable energy, similar to the systems in Sweden, Italy and Ireland. Other countries such as Germany, Denmark and France have measures that directly support the renewable electricity price for all producers. Internationally, three types of policy initiatives have been used to support renewable energy development. Several countries use a competitive bidding system to allocate a quota of fixed term purchase contracts. Feed-in tariffs have been used elsewhere that oblige utilities to purchase renewable electricity at a fixed price. This approach has been very successful in developing renewable energy capacity in Germany, Denmark, Spain and Portugal. A third approach obliges utilities to demonstrate that a certain proportion of their electricity comes from renewable sources, which in essence places an additional value on renewable energy sources. The renewable electricity suppliers recoup this premium by means of a trading system in ‘green electricity’ certificates. This approach has been followed in the UK,
Anaerobic Digestion of Biodegradable Municipal Wastes: A Review __________________________________________________________________________
_______________________________________________________________________
88
Netherlands, Belgium, Italy, and more recently Denmark has switched from feed-in tariffs to green certificates (Ó Gallachóir et al., 2002; Meyer, 2004). As discussed above, financial incentives in the context of renewable energy production play an important role for enhancing the competitiveness of biogas plants, particularly versus composting (Irish EPA, 2005). A report on the status and promotion of renewable energy in the EU countries (Haas et al., 2001) provides an overview of promotion strategies in the EU. These strategies include 'voluntary approaches' such as 'green electricity tariffs' paid by consumers and 'green labels'. Furthermore, a number of regulatory, price driven strategies are in place in the EU either 'investment focused' (tax rebates and incentives) or 'generation based'. A widely used form of the latter is the 'feed-in tariff', which is the price per unit of electricity that a utility or supplier has to pay for renewable electricity to private generators ('producers'). In 2000, the highest feed-in tariffs for electricity from biogas and landfill gas were in force in Austria (up to €0.12/kWh), Germany (up to €0.1/kWh), Denmark (€0.08/kWh) and Greece (€0.06/kWh) (Haas et al., 2001). As discussed before, the biogas program in Denmark has been successful through a combination of legislative measures and financial incentives (tax exemption and investment subsidies). Similarly, the rapid expansion of biogas plants for (especially) manure digestion in Germany in recent years has been greatly stimulated by financial incentives that are guaranteed for long periods (20 years) (Reith et al., 2005). In the UK, the Government published a consultation paper in March 1999 seeking views on the kinds of support mechanism, which might be used to promote the development of renewable energy. At the end of the consultation process, the Government concluded that it would be appropriate to move away from the existing Non Fossil Fuel Obligation (NFFO) arrangements and adopt a supply obligation to be placed on all electricity suppliers (where every supplier is required to source a specific proportion of all their electricity from renewable generation). The NFFO therefore became obsolete, and the Renewables Obligation (RO) came into force on 1 April 2002. Renewable Obligation Certificates (ROCs) are issued under the terms of the Renewables Obligation Order, the Renewables Obligation Order (Scotland) and the Renewables Obligation Order (Northern Ireland). This is the Government's mechanism for increasing the proportion of electricity produced from renewable sources - licensed electricity suppliers are required to supply a certain percentage of their total sales from renewable sources (NFPA website, accessed September 2006). The Non-Fossil Purchasing Agency Limited (NFPA) was set up in 1990 by the twelve Regional Electricity Companies (RECs) in England and Wales as their agent for the purpose of enabling them to enter into collective arrangements to discharge their obligations under the Orders (NFPA website, accessed September 2006). At present, NFPA conducts green power auctions biannually. These auctions are for electrical output which will be produced by renewable electricity generators during a six month period (starting 1st April or 1st October) following the end of the auction. These auction prices are for electrical output together with, depending on the generation technology, Climate Change Levy Exemption Certificates (LECs) and Renewables Obligation Certificates (ROCs). The average prices obtained in the last NFPA power auction, completed on 10th August 2006 are presented in Table 25.
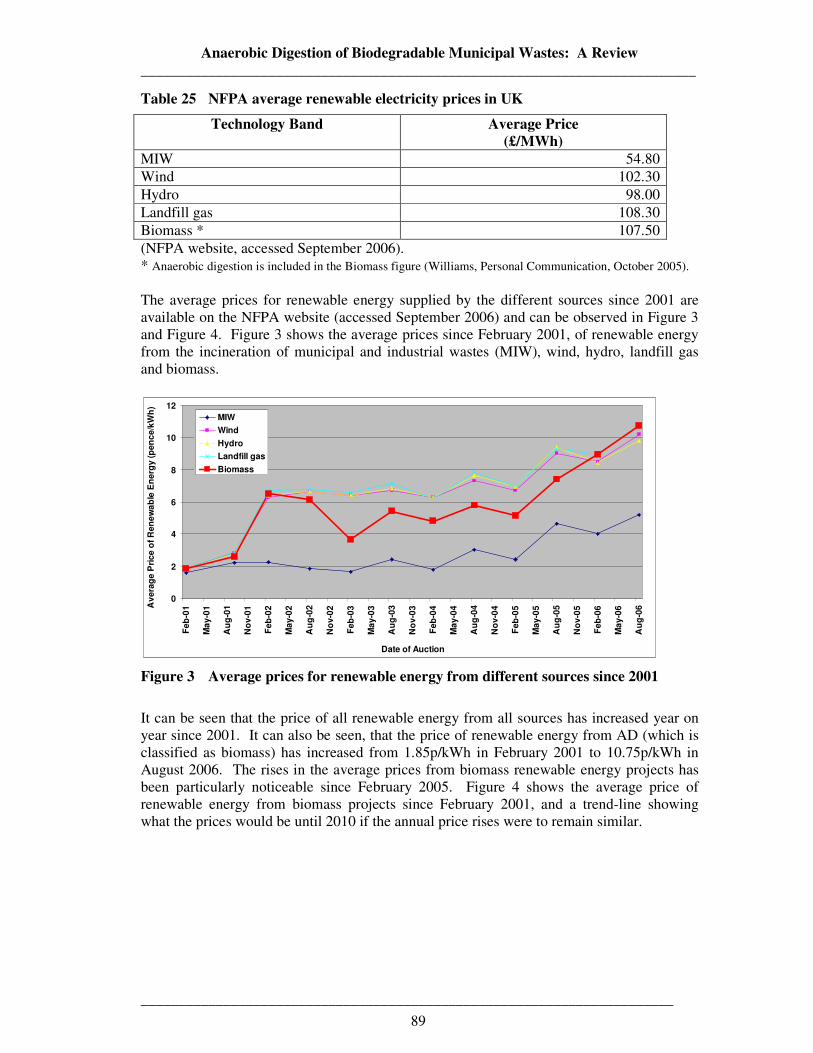
Anaerobic Digestion of Biodegradable Municipal Wastes: A Review __________________________________________________________________________
_______________________________________________________________________
89
Table 25 NFPA average renewable electricity prices in UK
Technology Band Average Price (£/MWh)
MIW 54.80 Wind 102.30 Hydro 98.00 Landfill gas 108.30 Biomass * 107.50 (NFPA website, accessed September 2006). * Anaerobic digestion is included in the Biomass figure (Williams, Personal Communication, October 2005). The average prices for renewable energy supplied by the different sources since 2001 are available on the NFPA website (accessed September 2006) and can be observed in Figure 3 and Figure 4. Figure 3 shows the average prices since February 2001, of renewable energy from the incineration of municipal and industrial wastes (MIW), wind, hydro, landfill gas and biomass.
0
2
4
6
8
10
12
Feb
-01
Ma
y-0
1
Au
g-0
1
No
v-0
1
Feb
-02
Ma
y-0
2
Au
g-0
2
No
v-0
2
Feb
-03
Ma
y-0
3
Au
g-0
3
No
v-0
3
Feb
-04
Ma
y-0
4
Au
g-0
4
No
v-0
4
Feb
-05
Ma
y-0
5
Au
g-0
5
No
v-0
5
Feb
-06
Ma
y-0
6
Au
g-0
6
Date of Auction
Av
era
ge
Pri
ce
of
Ren
ew
ab
le E
nerg
y (
pen
ce/k
Wh
)
MIW
Wind
Hydro
Landfill gas
Biomass
Figure 3 Average prices for renewable energy from different sources since 2001
It can be seen that the price of all renewable energy from all sources has increased year on year since 2001. It can also be seen, that the price of renewable energy from AD (which is classified as biomass) has increased from 1.85p/kWh in February 2001 to 10.75p/kWh in August 2006. The rises in the average prices from biomass renewable energy projects has been particularly noticeable since February 2005. Figure 4 shows the average price of renewable energy from biomass projects since February 2001, and a trend-line showing what the prices would be until 2010 if the annual price rises were to remain similar.
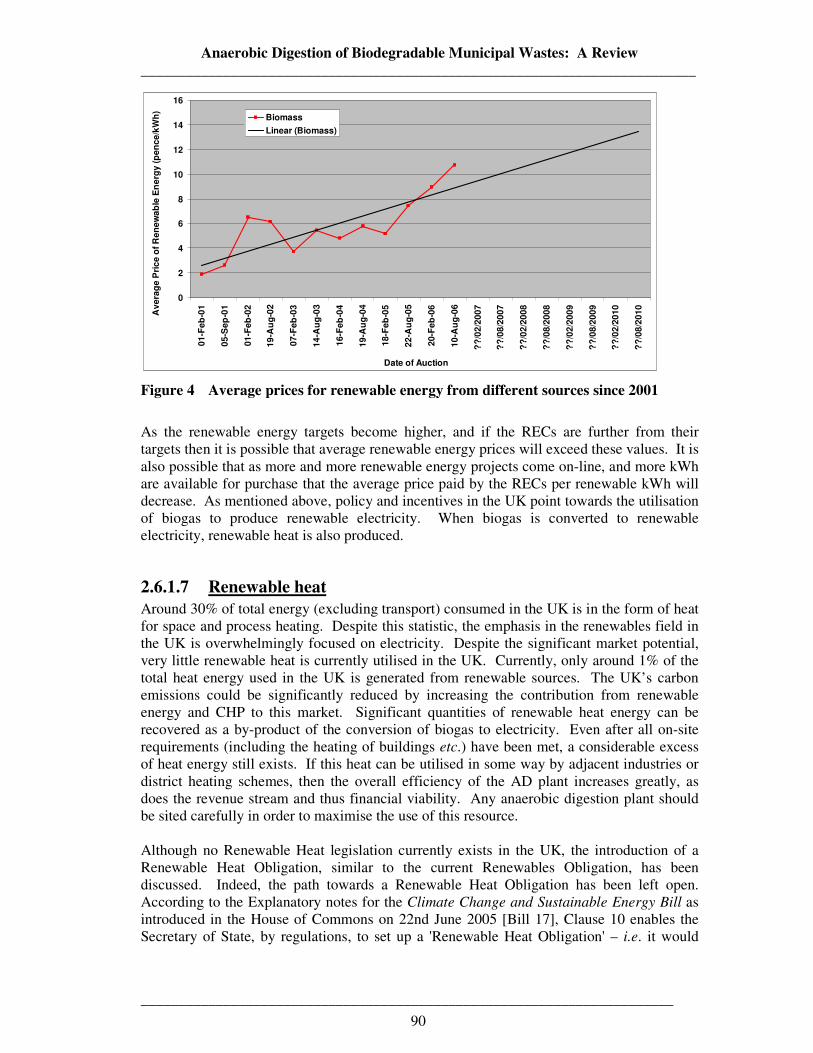
Anaerobic Digestion of Biodegradable Municipal Wastes: A Review __________________________________________________________________________
_______________________________________________________________________
90
0
2
4
6
8
10
12
14
16
01
-Fe
b-0
1
05
-Se
p-0
1
01
-Fe
b-0
2
19
-Au
g-0
2
07
-Fe
b-0
3
14
-Au
g-0
3
16
-Fe
b-0
4
19
-Au
g-0
4
18
-Fe
b-0
5
22
-Au
g-0
5
20
-Fe
b-0
6
10
-Au
g-0
6
??
/02
/20
07
??
/08
/20
07
??
/02
/20
08
??
/08
/20
08
??
/02
/20
09
??
/08
/20
09
??
/02
/20
10
??
/08
/20
10
Date of Auction
Av
era
ge
Pri
ce
of
Re
ne
wa
ble
En
erg
y (
pe
nc
e/k
Wh
)
Biomass
Linear (Biomass)
Figure 4 Average prices for renewable energy from different sources since 2001
As the renewable energy targets become higher, and if the RECs are further from their targets then it is possible that average renewable energy prices will exceed these values. It is also possible that as more and more renewable energy projects come on-line, and more kWh are available for purchase that the average price paid by the RECs per renewable kWh will decrease. As mentioned above, policy and incentives in the UK point towards the utilisation of biogas to produce renewable electricity. When biogas is converted to renewable electricity, renewable heat is also produced.
2.6.1.7 Renewable heat
Around 30% of total energy (excluding transport) consumed in the UK is in the form of heat for space and process heating. Despite this statistic, the emphasis in the renewables field in the UK is overwhelmingly focused on electricity. Despite the significant market potential, very little renewable heat is currently utilised in the UK. Currently, only around 1% of the total heat energy used in the UK is generated from renewable sources. The UK’s carbon emissions could be significantly reduced by increasing the contribution from renewable energy and CHP to this market. Significant quantities of renewable heat energy can be recovered as a by-product of the conversion of biogas to electricity. Even after all on-site requirements (including the heating of buildings etc.) have been met, a considerable excess of heat energy still exists. If this heat can be utilised in some way by adjacent industries or district heating schemes, then the overall efficiency of the AD plant increases greatly, as does the revenue stream and thus financial viability. Any anaerobic digestion plant should be sited carefully in order to maximise the use of this resource. Although no Renewable Heat legislation currently exists in the UK, the introduction of a Renewable Heat Obligation, similar to the current Renewables Obligation, has been discussed. Indeed, the path towards a Renewable Heat Obligation has been left open. According to the Explanatory notes for the Climate Change and Sustainable Energy Bill as introduced in the House of Commons on 22nd June 2005 [Bill 17], Clause 10 enables the Secretary of State, by regulations, to set up a 'Renewable Heat Obligation' – i.e. it would
Anaerobic Digestion of Biodegradable Municipal Wastes: A Review __________________________________________________________________________
_______________________________________________________________________
91
apply the current renewables obligation (which requires utilities to provide a specified percentage of the power they sell to consumers to come from renewable sources) to heat as well, and to save CO2 and stimulate demand for renewable heat such solar thermal, biomass and heat pumps. Clause 10(2) enables the regulations to set targets for energy suppliers, and to provide for penalties in cases of failure to meet those targets (UK Parliament website [b], accessed April 2006). CHP increases the efficiency of a power generation plant; in addition to generating electricity for the national grid, heat can be provided for district heating schemes. However, the feasibility of CHP schemes is dependent on the availability of an end-user for the heat generated. Clean and efficient CHP is already in use on close to 1,400 locations around the UK (CHPA website, accessed April 2006). Fifteen of these are energy from waste plants (13 in England and 2 in Scotland). These plants generate 210 MW electricity from the combustion of 3 million tpa of MSW. The size of these facilities ranges from 26,000 tpa (Lerwick) to 600,000 tpa (Edmonton, London) (Environmental Services website, accessed April 2006). Other examples of CHP schemes for district/community heating in the UK include Sheffield, where the heart of the system is an incinerator burning the city's refuse. Heat is piped to homes and commercial buildings throughout the city centre. Standby heat (to meet peak demand) is provided from boilers which can be fired by either gas or oil. Sheffield Heat and Power have calculated that the connection of homes and other consumers in the city centre saves over 81,000 MWh of fossil fuel - equivalent to 600,000 tpa of coal, thus saving the emission of over 30,000 tpa of CO2 (District Energy in Great Britain website, accessed April 2006). In Lerwick (Orkney Islands), the whole town is heated using a CHP scheme based on the incineration of MSW. Southampton, Coventry and Nottingham are other cities with district heating schemes, as well as the London boroughs of Westminster, City of London and Pimlico (CHPA website, accessed April 2006). It is estimated that if the level of CHP was increased to the Government's target of 10,000 MW, the UK could be one third of the way to meeting its international commitments to reduce carbon dioxide emissions (CHPA website, accessed April 2006). The end use of the renewable heat energy should be considered in any new AD projects, and provision made to supply the infrastructure at the construction stage. Such planning can ensure the heat energy is put to good use immediately (in a mutually beneficial agreement/arrangement) without the need for further engineering and costs. With regards to making use of the heat produced, the only extra cost would be for the distribution pipework. When considering heat utilisation, the distance of the user from the plant must be taken into account. Any end user of the heat energy must be as close as possible to the plant, as the cost of piping infrastructure can be prohibitively expensive. The cost of supplying heat to the residential sector from renewable energy is high compared with the costs of heat from conventional sources even when projected technology cost reductions to 2020 are included. For the commercial and industrial sectors heat from biomass, energy from waste (EfW) and anaerobic digestion (AD) are more competitive. Given the planning situation in the UK, industrial areas are generally away from residential areas. Any waste treatment facility (be it MBT of residual waste or MSW, or AD of source separated organic waste) would be likely to be transported to and treated at sites deliberately remote from residential buildings. It is mainly for this reason that neighbouring a single (or at least a small number of) industrial or commercial user(s) would probably be preferable to district heating schemes in the UK. Income from the heat energy produced is a major factor in the economics of Danish co-digestion plants. With or without Government introduced drivers, the utilisation of
Anaerobic Digestion of Biodegradable Municipal Wastes: A Review __________________________________________________________________________
_______________________________________________________________________
92
renewable heat will assume extra importance and become more economic in the future as energy prices rise.
2.6.1.8 Biogas as a transport fuel The income from the biogas produced by anaerobic digestion can be enhanced if it is used as a transport fuel rather than to produce electricity and heat (although some electricity and heat will always be required by the process itself). Today, the use of biogas/natural gas as a transport fuel is proven and developed, with further implementation more a question of marketing and industrialisation than a question of research and development (Biogas as a Vehicle Fuel, A European Overview, 2003). The UK Renewable Transport Fuels Obligation (RTFO) target is to have 5% of transport fuel from renewable sources by 2010, which will be in line with the EU Biofuels Directive (which requires the EU to have over 5.75% of all transport fuels from renewable sources by 2010). Replacing oil in transport, whilst maintaining the levels of mobility, flexibility and convenience to which we have become accustomed, and to which the developing world aspire will be a mammoth task. Any sustainable transport network must make the most of all renewable transport options, and try to develop an integrated system incorporating all of the options available. These options include biogas, bio-ethanol, biodiesel (either 100% or mixed at a lower percentage with traditional petrol/diesel) as well electric-based cars. There are examples of mass produced vehicles based on all of these fuels (usually in flexi-fuel systems so that petrol can be used as a backup) throughout the world. Examples of this are biogas vehicles in Sweden and other pilot projects around Europe, the millions of flexi-fuel vehicles running on bio-ethanol or petrol in Brazil, the 5% of UK vehicle fuel already made from biodiesel and the countless electric milk-floats, airport buses and forklift trucks. The advantages of biogas as a transport fuel (as compared with other renewable transport options are that its production can be localised, anywhere, urban or rural, it is not dependant on markets (particularly foreign markets as bio-ethanol is), it is not dependant on large mono-crop production (as bio-ethanol is), but can be produced from a wide range of energy crops. Biogas has a higher yield (in terms of km/hectare than any other bio-fuel (Biogas West, Fuelling the Future, 2006). Biogas can also and mostly importantly be produced from waste, therefore providing additional benefits. Although the concept of biogas as a large-scale transport fuel is relatively new, upgraded biogas can be used in natural gas cars. Therefore, many major car manufacturers (at least in mainland European countries) already produce biogas-friendly models. According to the European Association of Natural Gas Vehicles, there are some five million natural gas vehicles in use worldwide, of which 1.4 million are in Argentina and about one million each in Brazil and Pakistan. Italy’s fleet of 380,000 natural gas vehicles (NGVs) is by far the biggest in Europe, followed by Germany with 38,000 and France with 8000. In Spain there are more than 500 public sector natural gas vehicles operating in Madrid, including buses and refuse collection vehicles. To use biogas from anaerobic digesters as a transport fuel the biogas must first be upgraded, to approximately 97% methane, compressed and stored to around 200 – 250 bar for distribution (Jonsson, 2005). The same compression and storage technology as for natural gas can be utilised. Biogas upgrading consists of bubbling the biogas through a counter-current flow of water at high pressure, so that carbon dioxide and hydrogen sulphide
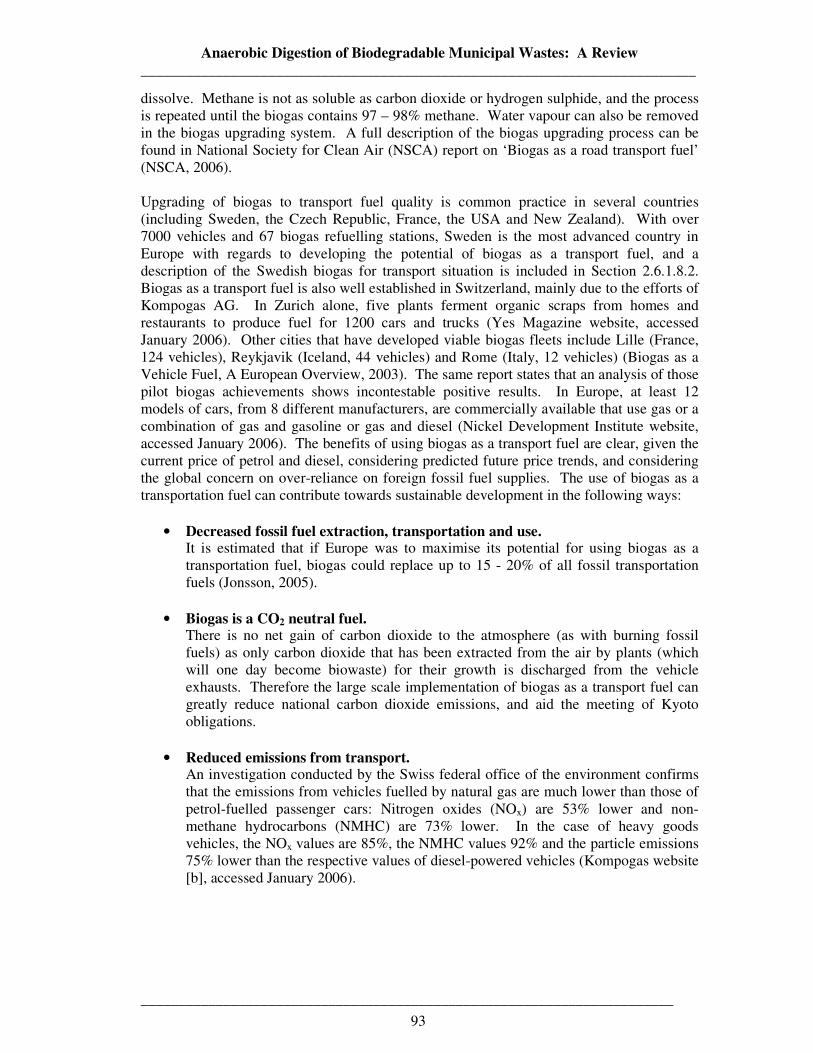
Anaerobic Digestion of Biodegradable Municipal Wastes: A Review __________________________________________________________________________
_______________________________________________________________________
93
dissolve. Methane is not as soluble as carbon dioxide or hydrogen sulphide, and the process is repeated until the biogas contains 97 – 98% methane. Water vapour can also be removed in the biogas upgrading system. A full description of the biogas upgrading process can be found in National Society for Clean Air (NSCA) report on ‘Biogas as a road transport fuel’ (NSCA, 2006). Upgrading of biogas to transport fuel quality is common practice in several countries (including Sweden, the Czech Republic, France, the USA and New Zealand). With over 7000 vehicles and 67 biogas refuelling stations, Sweden is the most advanced country in Europe with regards to developing the potential of biogas as a transport fuel, and a description of the Swedish biogas for transport situation is included in Section 2.6.1.8.2. Biogas as a transport fuel is also well established in Switzerland, mainly due to the efforts of Kompogas AG. In Zurich alone, five plants ferment organic scraps from homes and restaurants to produce fuel for 1200 cars and trucks (Yes Magazine website, accessed January 2006). Other cities that have developed viable biogas fleets include Lille (France, 124 vehicles), Reykjavik (Iceland, 44 vehicles) and Rome (Italy, 12 vehicles) (Biogas as a Vehicle Fuel, A European Overview, 2003). The same report states that an analysis of those pilot biogas achievements shows incontestable positive results. In Europe, at least 12 models of cars, from 8 different manufacturers, are commercially available that use gas or a combination of gas and gasoline or gas and diesel (Nickel Development Institute website, accessed January 2006). The benefits of using biogas as a transport fuel are clear, given the current price of petrol and diesel, considering predicted future price trends, and considering the global concern on over-reliance on foreign fossil fuel supplies. The use of biogas as a transportation fuel can contribute towards sustainable development in the following ways:
• Decreased fossil fuel extraction, transportation and use. It is estimated that if Europe was to maximise its potential for using biogas as a transportation fuel, biogas could replace up to 15 - 20% of all fossil transportation fuels (Jonsson, 2005).
• Biogas is a CO2 neutral fuel.
There is no net gain of carbon dioxide to the atmosphere (as with burning fossil fuels) as only carbon dioxide that has been extracted from the air by plants (which will one day become biowaste) for their growth is discharged from the vehicle exhausts. Therefore the large scale implementation of biogas as a transport fuel can greatly reduce national carbon dioxide emissions, and aid the meeting of Kyoto obligations.
• Reduced emissions from transport.
An investigation conducted by the Swiss federal office of the environment confirms that the emissions from vehicles fuelled by natural gas are much lower than those of petrol-fuelled passenger cars: Nitrogen oxides (NOx) are 53% lower and non-methane hydrocarbons (NMHC) are 73% lower. In the case of heavy goods vehicles, the NOx values are 85%, the NMHC values 92% and the particle emissions 75% lower than the respective values of diesel-powered vehicles (Kompogas website [b], accessed January 2006).
Anaerobic Digestion of Biodegradable Municipal Wastes: A Review __________________________________________________________________________
_______________________________________________________________________
94
Other benefits include:
• Reduced reliance on foreign fossil fuel supplies. • Less noise emissions (Biogas as a Vehicle Fuel, A European Overview, 2003).
Tests on natural gas tractor units have shown that gas vehicles are consistently quieter than diesel vehicles, with noise reductions averaging around 10 decibels, the equivalent of halving the noise level (Chive Fuels website, accessed October 2006).
• Less unpleasant odours. Both in terms of more biowaste receiving treatment, and in terms of reduced
emissions from transport in towns and cities (Biogas as a Vehicle Fuel, A European Overview, 2003).
• Less emissions from fertilizer production. Due to increased availability of natural compost from biowaste treatment.
• Less methane leakage. Due to more organic wastes being anaerobically digested rather than composted or landfilled.
• Increased safety. Accident statistics from countries with a high proportion of gas-powered cars such as Italy, Argentina, USA, Canada and New Zealand show that gas as a fuel is safer than petrol or diesel. The ignition temperature of gas (650oC) is appreciably higher than that of petrol (300oC). In addition, the danger of a gas bottle rupturing in an accident is virtually non-existent (Kompogas website [d], accessed January 2006).
• Image and social benefits for ‘being seen to be green’.
2.6.1.8.1 Biogas compared to other renewable fuels
If the transport sector is to be independent from oil, the utilisation of all renewable alternatives must be maximised. Options for renewable transport include:
• Biogas from all organic wastes (municipal, industrial, commercial and agricultural). • Gasification of biomass (including salix and other energy crops for bio-ethanol
production). • Bio-ethanol. • Rapeseed and other vegetable oils for biodiesel. • Electric vehicles (although electric vehicles are not necessarily charged from
renewable sources).
All renewable transport fuels have been studied and biogas has emerged as the best environmental option in terms of carbon dioxide emission reduction (Biogas West, 2006: NSCA 2006). On a LCA basis (measuring all greenhouse gas [GHG] emissions from every stage in the life cycle of a specific fuel – raw material, production, distribution and utilisation) biomethane is the best of the commercial renewable fuels available today (Biogas West, 2006). The ‘well to wheel’ emissions of various fuels fuelling heavy duty buses, passenger cars and heavy goods vehicles (HGV) can be observed in Figure 5, Figure 6 and Figure 7.

Anaerobic Digestion of Biodegradable Municipal Wastes: A Review __________________________________________________________________________
_______________________________________________________________________
95
Figure 5 Well to wheel greenhouse gas emissions for a bus (reproduced with permission from Biogas West, 2006)
From Figure 5, it can be seen that the well to wheel emissions for the fuel for a heavy duty bus are over 60 times smaller if the fuel is biogas from sewage sludge than if the fuel is diesel. Biogas from sewage sludge also produces considerably less emissions than ethanol from wheat, ethanol from wood or DME (di-methyl-ether). It can be considered, that biogas from other sources would have similarly low emissions. If the biogas was produced from another organic waste (such as BMW) that would be otherwise be untreated, then there would be further opportunity to minimise GHG emissions (by the treatment of the waste).
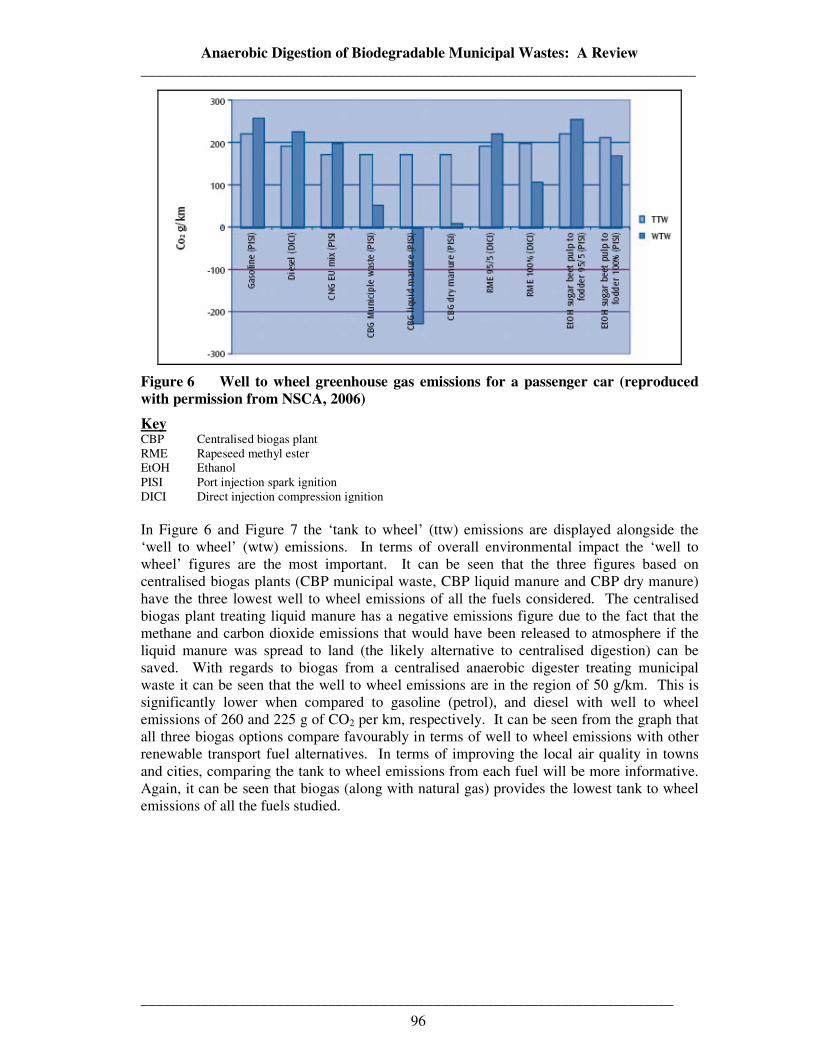
Anaerobic Digestion of Biodegradable Municipal Wastes: A Review __________________________________________________________________________
_______________________________________________________________________
96
Figure 6 Well to wheel greenhouse gas emissions for a passenger car (reproduced with permission from NSCA, 2006)
Key CBP Centralised biogas plant RME Rapeseed methyl ester EtOH Ethanol PISI Port injection spark ignition DICI Direct injection compression ignition In Figure 6 and Figure 7 the ‘tank to wheel’ (ttw) emissions are displayed alongside the ‘well to wheel’ (wtw) emissions. In terms of overall environmental impact the ‘well to wheel’ figures are the most important. It can be seen that the three figures based on centralised biogas plants (CBP municipal waste, CBP liquid manure and CBP dry manure) have the three lowest well to wheel emissions of all the fuels considered. The centralised biogas plant treating liquid manure has a negative emissions figure due to the fact that the methane and carbon dioxide emissions that would have been released to atmosphere if the liquid manure was spread to land (the likely alternative to centralised digestion) can be saved. With regards to biogas from a centralised anaerobic digester treating municipal waste it can be seen that the well to wheel emissions are in the region of 50 g/km. This is significantly lower when compared to gasoline (petrol), and diesel with well to wheel emissions of 260 and 225 g of CO2 per km, respectively. It can be seen from the graph that all three biogas options compare favourably in terms of well to wheel emissions with other renewable transport fuel alternatives. In terms of improving the local air quality in towns and cities, comparing the tank to wheel emissions from each fuel will be more informative. Again, it can be seen that biogas (along with natural gas) provides the lowest tank to wheel emissions of all the fuels studied.
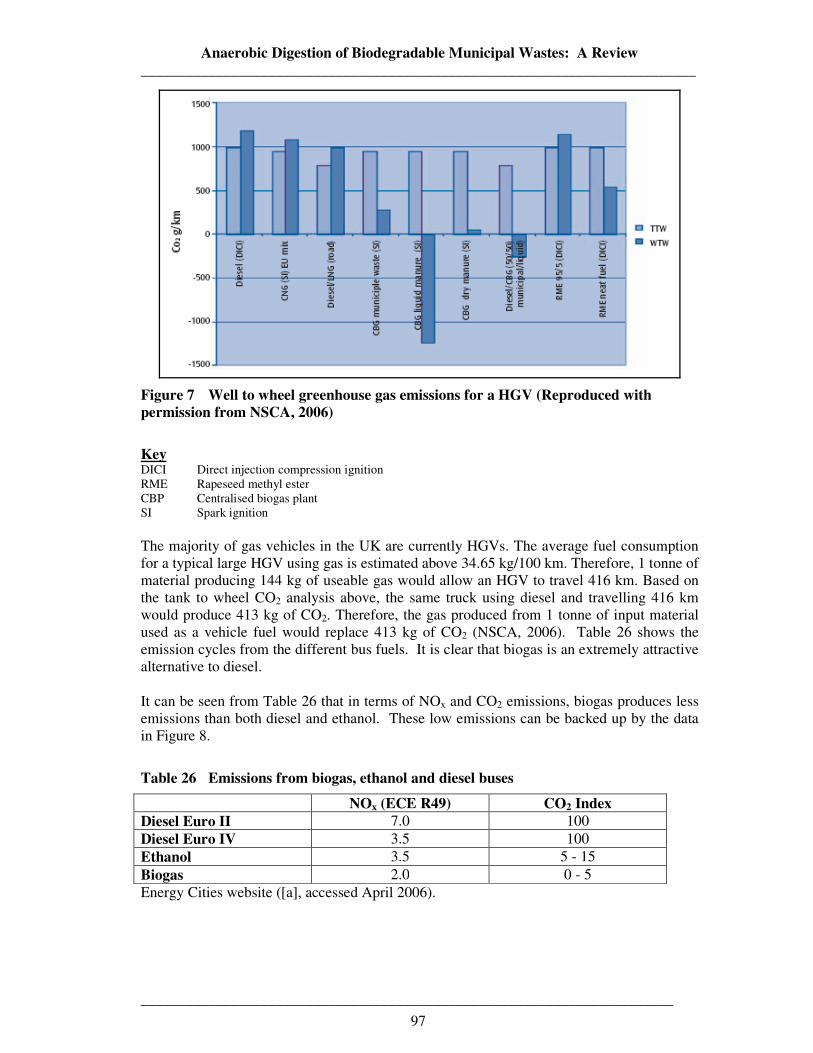
Anaerobic Digestion of Biodegradable Municipal Wastes: A Review __________________________________________________________________________
_______________________________________________________________________
97
Figure 7 Well to wheel greenhouse gas emissions for a HGV (Reproduced with permission from NSCA, 2006)
Key DICI Direct injection compression ignition RME Rapeseed methyl ester CBP Centralised biogas plant SI Spark ignition The majority of gas vehicles in the UK are currently HGVs. The average fuel consumption for a typical large HGV using gas is estimated above 34.65 kg/100 km. Therefore, 1 tonne of material producing 144 kg of useable gas would allow an HGV to travel 416 km. Based on the tank to wheel CO2 analysis above, the same truck using diesel and travelling 416 km would produce 413 kg of CO2. Therefore, the gas produced from 1 tonne of input material used as a vehicle fuel would replace 413 kg of CO2 (NSCA, 2006). Table 26 shows the emission cycles from the different bus fuels. It is clear that biogas is an extremely attractive alternative to diesel. It can be seen from Table 26 that in terms of NOx and CO2 emissions, biogas produces less emissions than both diesel and ethanol. These low emissions can be backed up by the data in Figure 8.
Table 26 Emissions from biogas, ethanol and diesel buses
NOx (ECE R49) CO2 Index Diesel Euro II 7.0 100 Diesel Euro IV 3.5 100 Ethanol 3.5 5 - 15 Biogas 2.0 0 - 5 Energy Cities website ([a], accessed April 2006).
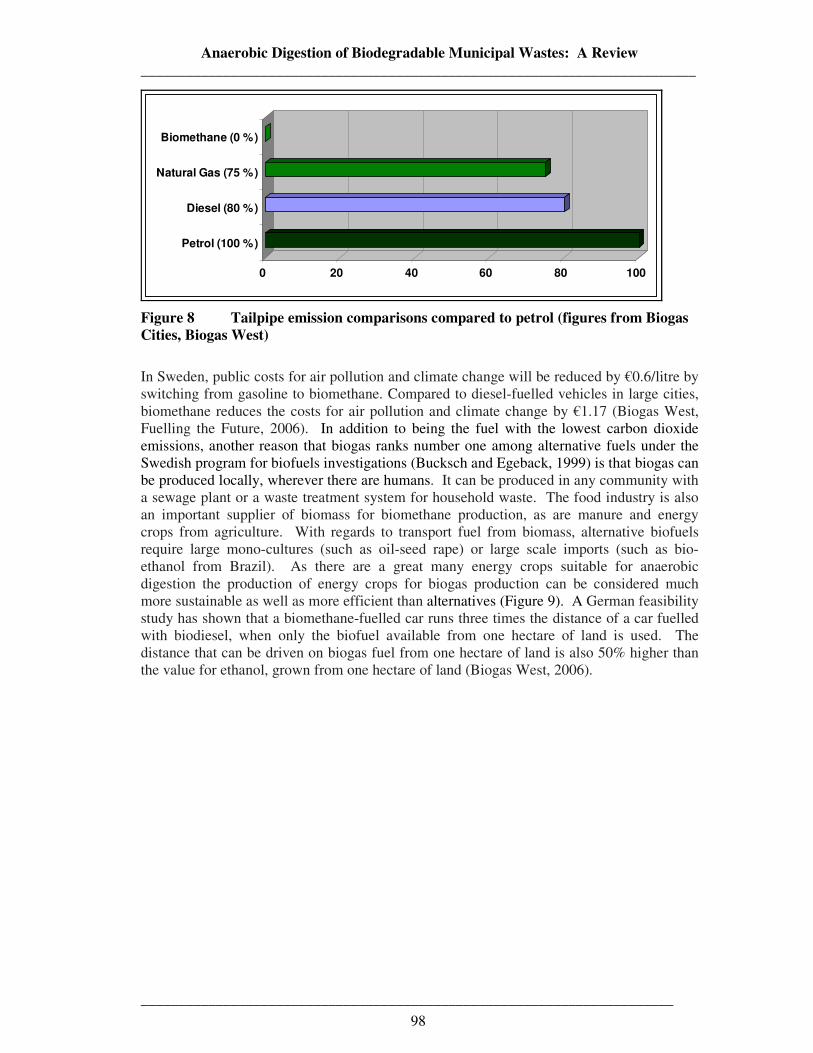
Anaerobic Digestion of Biodegradable Municipal Wastes: A Review __________________________________________________________________________
_______________________________________________________________________
98
0 20 40 60 80 100
Petrol (100 %)
Diesel (80 %)
Natural Gas (75 %)
Biomethane (0 %)
Figure 8 Tailpipe emission comparisons compared to petrol (figures from Biogas Cities, Biogas West)
In Sweden, public costs for air pollution and climate change will be reduced by €0.6/litre by switching from gasoline to biomethane. Compared to diesel-fuelled vehicles in large cities, biomethane reduces the costs for air pollution and climate change by €1.17 (Biogas West, Fuelling the Future, 2006). In addition to being the fuel with the lowest carbon dioxide emissions, another reason that biogas ranks number one among alternative fuels under the Swedish program for biofuels investigations (Bucksch and Egeback, 1999) is that biogas can be produced locally, wherever there are humans. It can be produced in any community with a sewage plant or a waste treatment system for household waste. The food industry is also an important supplier of biomass for biomethane production, as are manure and energy crops from agriculture. With regards to transport fuel from biomass, alternative biofuels require large mono-cultures (such as oil-seed rape) or large scale imports (such as bio-ethanol from Brazil). As there are a great many energy crops suitable for anaerobic digestion the production of energy crops for biogas production can be considered much more sustainable as well as more efficient than alternatives (Figure 9). A German feasibility study has shown that a biomethane-fuelled car runs three times the distance of a car fuelled with biodiesel, when only the biofuel available from one hectare of land is used. The distance that can be driven on biogas fuel from one hectare of land is also 50% higher than the value for ethanol, grown from one hectare of land (Biogas West, 2006).
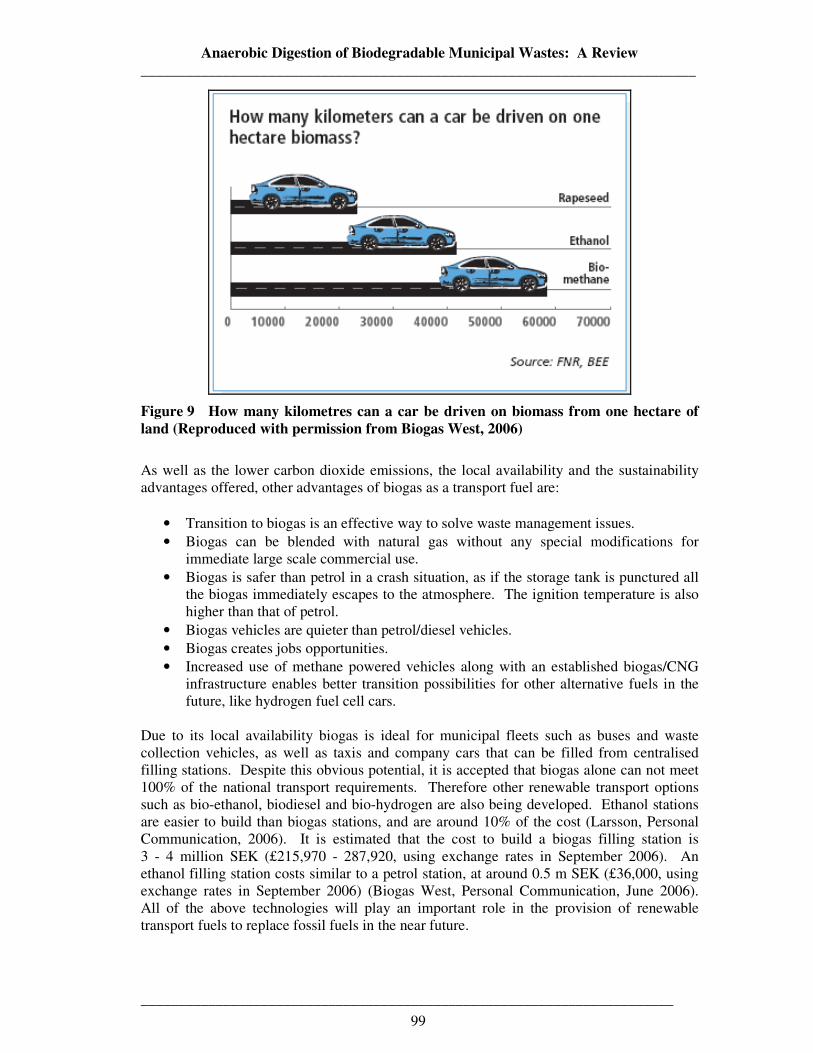
Anaerobic Digestion of Biodegradable Municipal Wastes: A Review __________________________________________________________________________
_______________________________________________________________________
99
Figure 9 How many kilometres can a car be driven on biomass from one hectare of land (Reproduced with permission from Biogas West, 2006)
As well as the lower carbon dioxide emissions, the local availability and the sustainability advantages offered, other advantages of biogas as a transport fuel are:
• Transition to biogas is an effective way to solve waste management issues. • Biogas can be blended with natural gas without any special modifications for
immediate large scale commercial use. • Biogas is safer than petrol in a crash situation, as if the storage tank is punctured all
the biogas immediately escapes to the atmosphere. The ignition temperature is also higher than that of petrol.
• Biogas vehicles are quieter than petrol/diesel vehicles. • Biogas creates jobs opportunities. • Increased use of methane powered vehicles along with an established biogas/CNG
infrastructure enables better transition possibilities for other alternative fuels in the future, like hydrogen fuel cell cars.
Due to its local availability biogas is ideal for municipal fleets such as buses and waste collection vehicles, as well as taxis and company cars that can be filled from centralised filling stations. Despite this obvious potential, it is accepted that biogas alone can not meet 100% of the national transport requirements. Therefore other renewable transport options such as bio-ethanol, biodiesel and bio-hydrogen are also being developed. Ethanol stations are easier to build than biogas stations, and are around 10% of the cost (Larsson, Personal Communication, 2006). It is estimated that the cost to build a biogas filling station is 3 - 4 million SEK (£215,970 - 287,920, using exchange rates in September 2006). An ethanol filling station costs similar to a petrol station, at around 0.5 m SEK (£36,000, using exchange rates in September 2006) (Biogas West, Personal Communication, June 2006). All of the above technologies will play an important role in the provision of renewable transport fuels to replace fossil fuels in the near future.
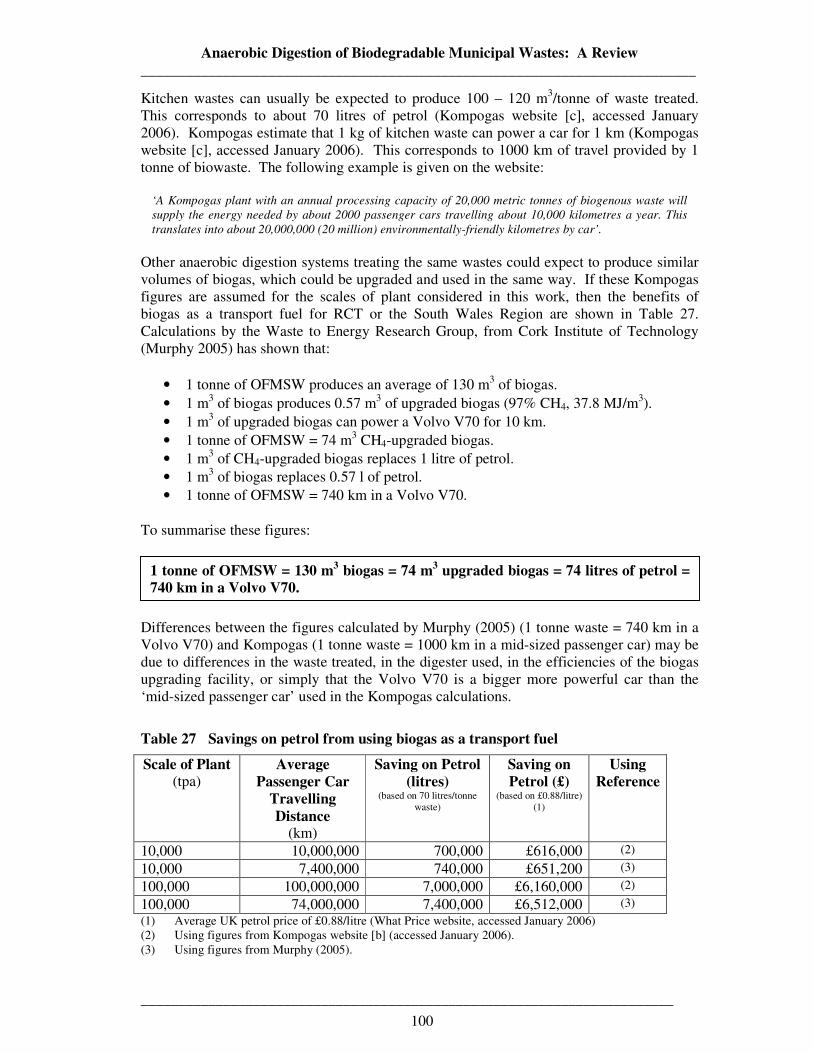
Anaerobic Digestion of Biodegradable Municipal Wastes: A Review __________________________________________________________________________
_______________________________________________________________________
100
Kitchen wastes can usually be expected to produce 100 – 120 m3/tonne of waste treated. This corresponds to about 70 litres of petrol (Kompogas website [c], accessed January 2006). Kompogas estimate that 1 kg of kitchen waste can power a car for 1 km (Kompogas website [c], accessed January 2006). This corresponds to 1000 km of travel provided by 1 tonne of biowaste. The following example is given on the website:
‘A Kompogas plant with an annual processing capacity of 20,000 metric tonnes of biogenous waste will
supply the energy needed by about 2000 passenger cars travelling about 10,000 kilometres a year. This
translates into about 20,000,000 (20 million) environmentally-friendly kilometres by car’.
Other anaerobic digestion systems treating the same wastes could expect to produce similar volumes of biogas, which could be upgraded and used in the same way. If these Kompogas figures are assumed for the scales of plant considered in this work, then the benefits of biogas as a transport fuel for RCT or the South Wales Region are shown in Table 27. Calculations by the Waste to Energy Research Group, from Cork Institute of Technology (Murphy 2005) has shown that:
• 1 tonne of OFMSW produces an average of 130 m3 of biogas. • 1 m3 of biogas produces 0.57 m3 of upgraded biogas (97% CH4, 37.8 MJ/m3). • 1 m3 of upgraded biogas can power a Volvo V70 for 10 km. • 1 tonne of OFMSW = 74 m3 CH4-upgraded biogas. • 1 m3 of CH4-upgraded biogas replaces 1 litre of petrol. • 1 m3 of biogas replaces 0.57 l of petrol. • 1 tonne of OFMSW = 740 km in a Volvo V70.
To summarise these figures:
Differences between the figures calculated by Murphy (2005) (1 tonne waste = 740 km in a Volvo V70) and Kompogas (1 tonne waste = 1000 km in a mid-sized passenger car) may be due to differences in the waste treated, in the digester used, in the efficiencies of the biogas upgrading facility, or simply that the Volvo V70 is a bigger more powerful car than the ‘mid-sized passenger car’ used in the Kompogas calculations.
Table 27 Savings on petrol from using biogas as a transport fuel
Scale of Plant (tpa)
Average Passenger Car
Travelling Distance
(km)
Saving on Petrol (litres)
(based on 70 litres/tonne waste)
Saving on Petrol (£)
(based on £0.88/litre) (1)
Using Reference
10,000 10,000,000 700,000 £616,000 (2)
10,000 7,400,000 740,000 £651,200 (3)
100,000 100,000,000 7,000,000 £6,160,000 (2)
100,000 74,000,000 7,400,000 £6,512,000 (3)
(1) Average UK petrol price of £0.88/litre (What Price website, accessed January 2006) (2) Using figures from Kompogas website [b] (accessed January 2006). (3) Using figures from Murphy (2005).
1 tonne of OFMSW = 130 m3 biogas = 74 m3 upgraded biogas = 74 litres of petrol = 740 km in a Volvo V70.
Anaerobic Digestion of Biodegradable Municipal Wastes: A Review __________________________________________________________________________
_______________________________________________________________________
101
These calculations do not take into account biogas used for electricity and heat on site, or finance/operating costs on the infrastructure required to set up biogas enrichment plants, biogas/natural gas filling stations, or any duty/incentives that may be imposed on this type of fuel. Nevertheless, the potential for fossil fuel avoidance and therefore carbon dioxide emission reduction is clear. In the UK, biogas/natural gas vehicles are not readily available. This is primarily due to lack of interest due to the lack of refuelling infrastructure and lack of incentives. On mainland Europe, the wide availability of natural gas fuelled vehicles and engines reflects the progress in the development of refuelling infrastructure, particularly in Germany and Italy. A wide range of passenger cars are available from European car manufacturers including Fiat, Opel, PSA, Ford, VW, Mercedes and Volvo. Vans are available from PSA, Fiat, Ford, Iveco, Daimler-Chrysler and Opel. Daimler-Chrysler, Volvo, Scania, Iveco, Cummins Westport, John Deere, Clean Air Power and MAN all offer CNG engines for use in trucks and buses (NSCA, 2006). In addition, the Czech Tedom group builds CNG buses with a Tedom engine, and the Czech Ekobus company build buses with engines from Cummins Westport. The only European manufacturer of heavy duty engines without a natural gas option is the Dutch DAF group (NSCA, 2006). The results of a National Association for Clean Air (NSCA) report on Biogas as a Road Transport Fuel; An Assessment of the Potential Role of Biogas as a Renewable Transport Fuel (NSCA, 2006) were presented in Greenwich in July 2006. The main conclusions were:
• In the UK the main feedstocks for biogas production through anaerobic digestion (AD) are agricultural manure wastes and food wastes. The UK generates some 30 million dry tonnes of this waste material a year, capable of producing some 6.3 million tonnes of oil equivalent of methane gas. Theoretically this could meet around 16% of national transport fuel demand.
• To be used as a transport fuel biogas has to be upgraded to at least 95% methane by
volume. It can then be used in vehicles originally modified to operate on natural gas. However, there is little availability of gas-fuelled vehicles in the UK and a very limited refuelling infrastructure.
• Biogas fuelled vehicles can reduce CO2 emissions by between 75% and 200%
compared with fossil fuels. The higher figure is for liquid manure as a feedstock and shows a negative carbon dioxide contribution which arises because liquid manure left untreated generates methane emissions, which are 21 times more powerful as a greenhouse gas than CO2. Hence there is a double benefit by reducing fossil emissions from burning diesel and reducing methane emissions from waste manure.
• Biogas will give lower exhaust emissions than fossil fuels, and so help to improve
local air quality, although technology changes in future years – for example, the introduction of particulate traps and selective catalytic reduction – may reduce this advantage.
• The availability of cost data for biogas production is poor, but data from Sweden and
the US suggest that biogas can be produced in the UK at a cost of between £0.50 – 0.60/kg, including duty (at the reduced rate of £0.09/kg) but excluding VAT. This range is comparable to the current price of CNG at around £0.55/kg.
Anaerobic Digestion of Biodegradable Municipal Wastes: A Review __________________________________________________________________________
_______________________________________________________________________
102
• The economics of using biogas or CNG sold at this price as a vehicle fuel are not
attractive at present in the UK. In terms of fuel costs, biogas is about 40% cheaper to run than diesel and 55% cheaper to run than petrol, but these fuel cost savings are off-set by higher capital costs in the UK, estimated at £25,000 for heavy duty vehicles and £5000 for light duty vehicles, and potentially higher maintenance costs. When these are taken into account only HGVs using gas are competitive with a diesel vehicle over an operating life of four years. This reflects the current market position where the only gas-fuelled vehicles having any success are HGVs operating on trunk routes. When the infrastructure is in place and the markets evolve, truck/car manufacturers can reduce these deficits considerably as has been observed in Sweden.
• Currently, all the biogas that is produced in the UK from both sewage treatment and
landfill is used to produce electricity and heat. The environmental and economic factors involved suggest that electricity production from biogas offers greater CO2 saving benefits and better economics and requires a lower subsidy (in the form of the Renewables Obligation) than biogas used for road transport. However, the balance is fine and further study is required to obtain a more robust answer to this question. It also suggests that only small changes in the economic variables on each side of the equation could switch the balance. For example the current rises in oil prices or the inclusion of biogas in the Renewable Transport Fuels Obligation (RTFO) could shift the balance.
• The CO2 benefits of biogas compared to other transport fuels seem strong. However,
if the UK is to pursue a policy of using biogas for transport it will be important to incentivise the market for biogas rather than the production plant itself. The main mechanisms that could be used are discussed in NSCA (2006) and include the RTFO, fuel duty rebates, vehicle grants and infrastructure grants.
• There is a significant resource available for the production of biogas in the UK
allowing us both to manage a waste issue and to provide a source of renewable fuel. In developing a biogas industry a number of disciplines are involved from waste management, through energy use and production to transport operation. Success factors in other countries have been a greater level of integration of actors in the value chain such as the municipal authority, waste management organisations and transport operators. It is this level of integration and an appropriate policy framework that will be needed in the UK.
To summarise the NSCA (2006) report analysis has shown that compared to other biofuels biogas has the potential to reduce carbon emissions. Its fuel life-cycle CO2 emissions are much lower than for the other bio-fuels. As such it would seem sensible – as is being done in some other countries – to promote biogas as one of the fuels that can meet the Biofuels Directive targets. However, in the UK the place of biogas in the RTFO is currently uncertain. Government policy must actively promote biogas as a renewable fuel in order to overcome ‘chicken and egg’ obstacles. For biogas to be exploited, Government and private companies need a greater level of co-operation. Car manufacturers and suppliers will not supply biogas vehicles in the UK until there is a demand. There will not be a demand until
Anaerobic Digestion of Biodegradable Municipal Wastes: A Review __________________________________________________________________________
_______________________________________________________________________
103
convenient re-fuelling options exist. Re-fuelling options will not exist until there is a fleet large enough to make the provision of re-fuelling options profitable.
2.6.1.8.2 Biogas as a transport fuel in Sweden
At present, Sweden leads the world in terms of the use of biogas as a transport fuel. This is mainly a result of the Swedish Government’s active promotion of anaerobic digestion and biogas transport initiatives through research, development and fiscal taxation policies. These policies are a direct result of the Swedish Government’s plans to be independent from oil by 2020. This ambitious forward thinking target prioritises renewable energy development in all three energy sectors:
• Electricity • Heating • Transport
With regards to electricity and heat, Sweden is already on the way to independence from oil. Biomass represents a major source of heat, with locally and nationally and internationally produced biomass combined with wood-based wastes and the combustible fraction of MSW, as well as other combustible wastes such as used tyres etc. being used in large and medium scale energy from waste plants. In these plants, electricity and heat are produced, with the heat utilised in district heating schemes in urban areas. In rural areas, wood pellets provide an alternative fuel to oil, and already provide a high proportion of the nations heating requirements. It is widely accepted in Sweden that replacing oil in the transport sector will present the biggest challenge. If the transport sector is to be independent from oil (in any country), the utilisation of all renewable alternatives must be maximised. At present, it is Swedish law that every petrol station must supply at least one alternative fuel. Eventually, the Swedish vision is to have ethanol or biodiesel/biogas dual-fuel vehicles as standard. Petrol/biogas, petrol/ethanol dual-fuel and other fossil fuel/renewable fuel hybrid vehicles will be stepping stones along the way. Sweden is currently the only nation in the world with a standard for upgraded biogas (SS 15 54 38: ‘Motor fuels – Biogas as a fuel for high speed Otto engines’). The standard deals with specific characteristics relevant to the use and storage of biogas produced by anaerobic digestion for use as a motor fuel (NSCA, 2006). Further details are available in NSCA (2006). The first biogas/natural gas filling station was in Malmo in 1997. Now there are at least 67 biogas filling stations across Sweden, with more being built and planned all the time. Existing facilities are mostly centred around the west coast where there is an existing natural gas grid, and in and around other big cities. Sweden currently produces approximately 1.4 TWh/a from biogas (Jonsson, 2005). This is primarily from sewage treatment plants, landfill sites and industrial wastewater treatment plants. Approximately 100 GWh/a (10 million m3) are currently upgraded in one of 22 biogas upgrading plants and used as vehicle fuel. This represents around 2% of the country’s total transport fuel demand, which was 75 TWh/a in 2005 (Jonsson, 2006). Based on experiences gained from projects with municipal fleets of buses and taxis, the Swedish program now aims for commercial expansion of vehicle fleets and infrastructure for (upgraded) biogas refuelling stations. Currently, there are some 14 local fleets (including those in the cities of Linköping, Uppsala, Kristianstad, Gothenburg and Stockholm) where the major part of the urban public transport is operated on biogas (NSCA, 2006). The Swedish Government are also promoting the use of biogas vehicles for taxis, company car fleets and even for private citizens. Private or

Anaerobic Digestion of Biodegradable Municipal Wastes: A Review __________________________________________________________________________
_______________________________________________________________________
104
company cars run on biogas (or other renewable fuels such as bio-ethanol or biodiesel) receive many benefits in Sweden, introduced by the Government to encourage citizens to make the switch, including:
• Cheaper fuel • Exemption from congestion charges in cities • Free parking in most cities • Special lanes for biogas taxis • Financial support for investment in biogas vehicles • Significant tax reductions (20%) • At the national level, company tax is reduced by 40% when gas vehicles are chosen
by staff (NSCA, 2006) These incentives have proved successful, as despite biogas models (at least the Volvo V70) being around 10% more expensive than the petrol only V70 model, renewable energy-based cars now account for 15% of all new car sales in Sweden. It was noted that it was ‘impossible’ to get a second hand biogas car (Larsson, Personal communication, 2006), such was the popularity of the models in circulation. It is estimated that a large proportion of the community would like to have a biogas car, but can not afford a new car. Therefore, five or ten years down the line, when new models are available (to those who can afford new cars), and the models already in circulation are on the used car market, the percentage ownership is expected to rocket as biogas cars become available to the average person. As the cars are 10% more expensive initially, but the fuel is 30 – 40% cheaper, biogas cars are ideal for those who need to travel large mileages (such as company cars). Particularly those who must travel large mileages around (or between) cities where the biogas filling station network is better developed (such as the Gothenburg region in western Sweden where there is a natural gas network). The top selling biogas/natural gas vehicle in Sweden is the Volvo V70 (Figure 10). The V70 is available off the production line in Sweden.
Figure 10 Bi-fuel Volvo V70

Anaerobic Digestion of Biodegradable Municipal Wastes: A Review __________________________________________________________________________
_______________________________________________________________________
105
The V70 always starts on petrol and switches to biogas automatically. It drives automatically on gas, and to switch to petrol you simply push a button beneath the radio. The car can switch smoothly back and forward between biogas and petrol while driving, with a changeover that is barely noticeable. Biogas cars are equipped with two tanks, a biogas tank and a normal petrol/diesel tank. In terms of space requirements, the petrol tank is usually halved in capacity to allow room for the biogas tank. Biogas storage is normally around 200 bar (in cars) and the storage space required to propel the car for the same number of kilometres is approximately 10% more. The V70 travels around 250 km on a full tank of gas, plus 300 – 350 km on a full petrol tank, giving it a range of 550 – 600 km, and enabling the user to use all the cheaper biogas first, and if refilling is not possible, to transfer to petrol. The Volvo V70 is reported to compare very well with its petrol or diesel counterparts in terms of acceleration and performance. The biogas storage tank is underneath the chassis, beside the petrol tank, and therefore no boot space is taken up. Aside from the incentives mentioned above, the main bonus of the bi-fuel car is that biogas is 30 – 40% cheaper than petrol per mile, which can translate into major fuel savings. Around 80% of Volvo cars sold in Sweden are biogas V70s. The bi-fuel V70 is approximately 10% more expensive to buy than a normal petrol or diesel Volvo. Every biogas car sold ties somebody in to biogas fuel for 15 years (lifetime of the vehicle) and adds to the movement. Business Region Goteborg/Biogas West/Biogas Cities Projects Biogas West is the name of a cluster of around 25 companies in the field of methane for vehicles in the Gothenburg region of western Sweden. The project is headed by ‘Business Region Goteborg’, and aims to bring together all the players in the biogas chain (including producers, distributors and vehicle manufacturers. Biogas Cities is another initiative by Business Region Goteborg, through Biogas West. Biogas Cities is a private and public sector co-operative project that was instigated to demonstrate how the community, Government and industry can work together to make the transition to renewable fuels a reality. Through the Biogas Cities project, cities and regions worldwide are invited to learn more about biogas, through a visit to biogas production and distribution facilities in the Gothenburg region, and by discussing political and commercial strategies. Biogas West would be very keen to co-operate in similar biogas for transport initiatives and are very keen to show politicians, policy makers or other interested parties around the Biogas West project (Larsson, Personal Communication, 2006). Please see www.brgbiogas.com for more information, or contact Hans Larsson [email protected]). Linkoping Project In 1999, over 49,000 private cars moved through Linkoping every day, and 8.5 million people used the public transport network (Energy Cities website [b], accessed June 2006). Traffic problems were concentrated in the city centre, where the converging point of the bus network combined with narrow slow moving streets. The high number of buses travelling through the area resulted in high emissions (especially particulates) and high noise levels. After several traffic reduction schemes in the eighties failed to improve air quality, the municipality decided to experiment with alternative fuels for its municipal fleets. Between 1989 and 1993, five biogas buses manufactured by Scania were trialled. The success of these vehicles led to a further 20 buses being replaced by biogas vehicles in 1998, and at present (2006) the entire bus fleet (at least 64 buses), the entire municipal refuse fleet, and at least 125 other vehicles including many taxis are fuelled by biogas. In Linkoping, each bus
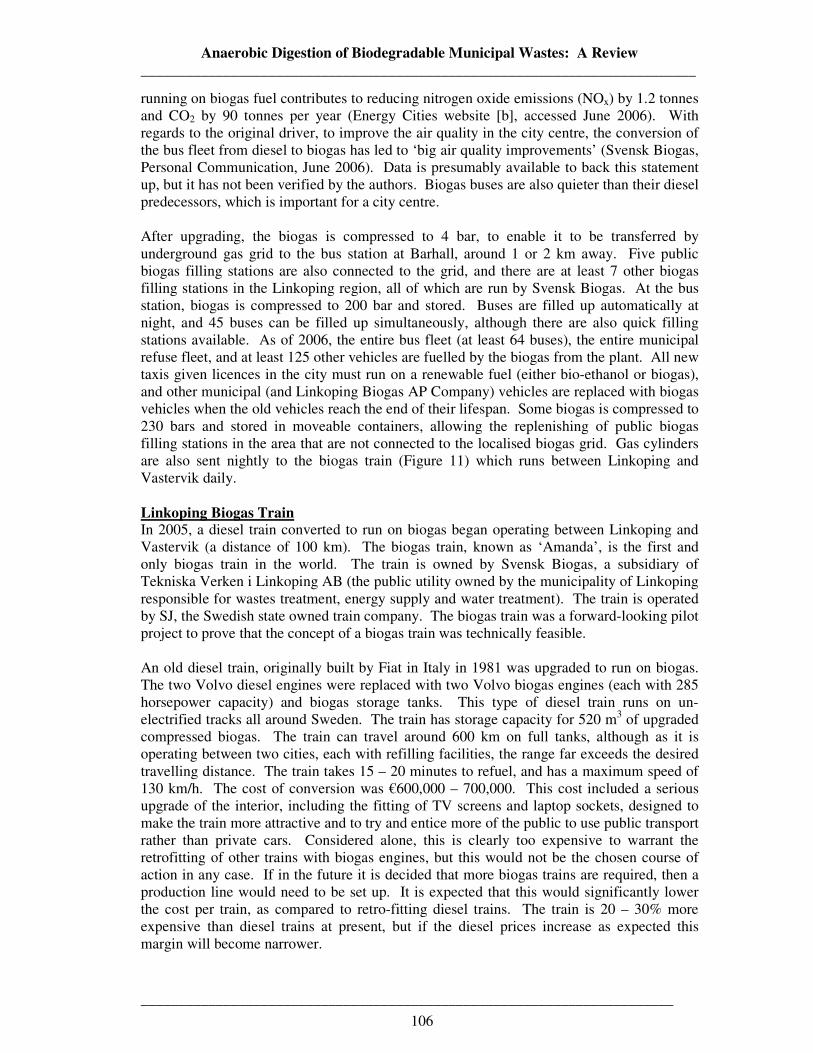
Anaerobic Digestion of Biodegradable Municipal Wastes: A Review __________________________________________________________________________
_______________________________________________________________________
106
running on biogas fuel contributes to reducing nitrogen oxide emissions (NOx) by 1.2 tonnes and CO2 by 90 tonnes per year (Energy Cities website [b], accessed June 2006). With regards to the original driver, to improve the air quality in the city centre, the conversion of the bus fleet from diesel to biogas has led to ‘big air quality improvements’ (Svensk Biogas, Personal Communication, June 2006). Data is presumably available to back this statement up, but it has not been verified by the authors. Biogas buses are also quieter than their diesel predecessors, which is important for a city centre. After upgrading, the biogas is compressed to 4 bar, to enable it to be transferred by underground gas grid to the bus station at Barhall, around 1 or 2 km away. Five public biogas filling stations are also connected to the grid, and there are at least 7 other biogas filling stations in the Linkoping region, all of which are run by Svensk Biogas. At the bus station, biogas is compressed to 200 bar and stored. Buses are filled up automatically at night, and 45 buses can be filled up simultaneously, although there are also quick filling stations available. As of 2006, the entire bus fleet (at least 64 buses), the entire municipal refuse fleet, and at least 125 other vehicles are fuelled by the biogas from the plant. All new taxis given licences in the city must run on a renewable fuel (either bio-ethanol or biogas), and other municipal (and Linkoping Biogas AP Company) vehicles are replaced with biogas vehicles when the old vehicles reach the end of their lifespan. Some biogas is compressed to 230 bars and stored in moveable containers, allowing the replenishing of public biogas filling stations in the area that are not connected to the localised biogas grid. Gas cylinders are also sent nightly to the biogas train (Figure 11) which runs between Linkoping and Vastervik daily. Linkoping Biogas Train In 2005, a diesel train converted to run on biogas began operating between Linkoping and Vastervik (a distance of 100 km). The biogas train, known as ‘Amanda’, is the first and only biogas train in the world. The train is owned by Svensk Biogas, a subsidiary of Tekniska Verken i Linkoping AB (the public utility owned by the municipality of Linkoping responsible for wastes treatment, energy supply and water treatment). The train is operated by SJ, the Swedish state owned train company. The biogas train was a forward-looking pilot project to prove that the concept of a biogas train was technically feasible. An old diesel train, originally built by Fiat in Italy in 1981 was upgraded to run on biogas. The two Volvo diesel engines were replaced with two Volvo biogas engines (each with 285 horsepower capacity) and biogas storage tanks. This type of diesel train runs on un-electrified tracks all around Sweden. The train has storage capacity for 520 m3 of upgraded compressed biogas. The train can travel around 600 km on full tanks, although as it is operating between two cities, each with refilling facilities, the range far exceeds the desired travelling distance. The train takes 15 – 20 minutes to refuel, and has a maximum speed of 130 km/h. The cost of conversion was €600,000 – 700,000. This cost included a serious upgrade of the interior, including the fitting of TV screens and laptop sockets, designed to make the train more attractive and to try and entice more of the public to use public transport rather than private cars. Considered alone, this is clearly too expensive to warrant the retrofitting of other trains with biogas engines, but this would not be the chosen course of action in any case. If in the future it is decided that more biogas trains are required, then a production line would need to be set up. It is expected that this would significantly lower the cost per train, as compared to retro-fitting diesel trains. The train is 20 – 30% more expensive than diesel trains at present, but if the diesel prices increase as expected this margin will become narrower.
Anaerobic Digestion of Biodegradable Municipal Wastes: A Review __________________________________________________________________________
_______________________________________________________________________
107
Figure 11 Biogas train (at Linkoping)
Although the biogas train produces a large reduction in emissions as compared with its diesel counterparts, if a certain budget was to be spent on biogas transport infrastructure, then biogas buses and waste collection fleets would undoubtedly be a preferable option. Advantages could be observed in many areas, including the improvement of inner city air quality, the reduction of inner city noise, and the relative ease and economy of buying biogas (or natural gas) buses as compared to biogas trains. The biogas train concept is a long way from being economic, but the Linkoping biogas train project proves to the world that it is possible. Västerås project As detailed in the Västerås case study the biogas plant treats source separated kitchen waste, grease trap removal sludge and specially grown energy crops to produce biogas, liquid fertiliser and a solid soil improver. Biogas from the biogas plant (equivalent of 1.5 million litres of petrol) is combined with biogas from the sewage treatment plant (equivalent of 0.8 million litres of petrol), upgraded, compressed and used as a vehicle fuel. Details of the biowastes treatment plant, the upgrading facility and the compression systems are available in the Västerås case study (Section 5.1.8). The gas from the two production sites is sufficient to supply all of the city buses (at least 40 buses), 10 refuse collection vehicles and some 500 cars and other light transport vehicles. Incoming gas arrives at 4 bar, and is immediately compressed to 330 bar (Figure 12).
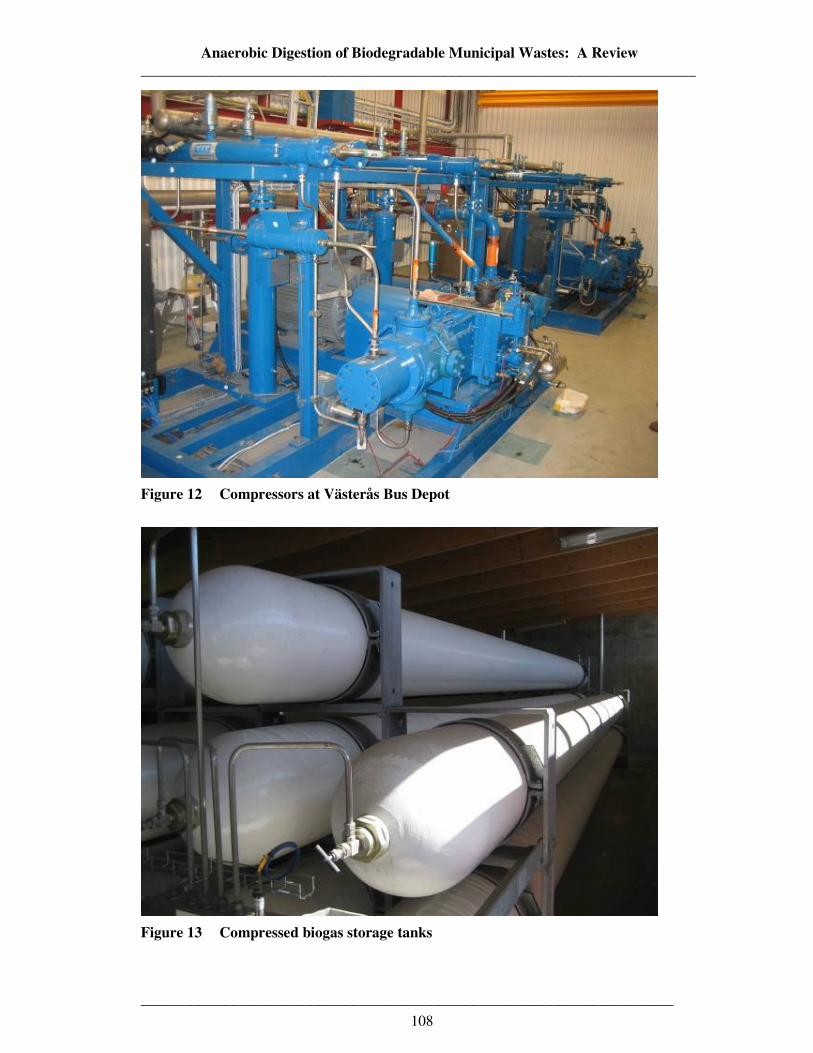
Anaerobic Digestion of Biodegradable Municipal Wastes: A Review __________________________________________________________________________
_______________________________________________________________________
108
Figure 12 Compressors at Västerås Bus Depot
Figure 13 Compressed biogas storage tanks
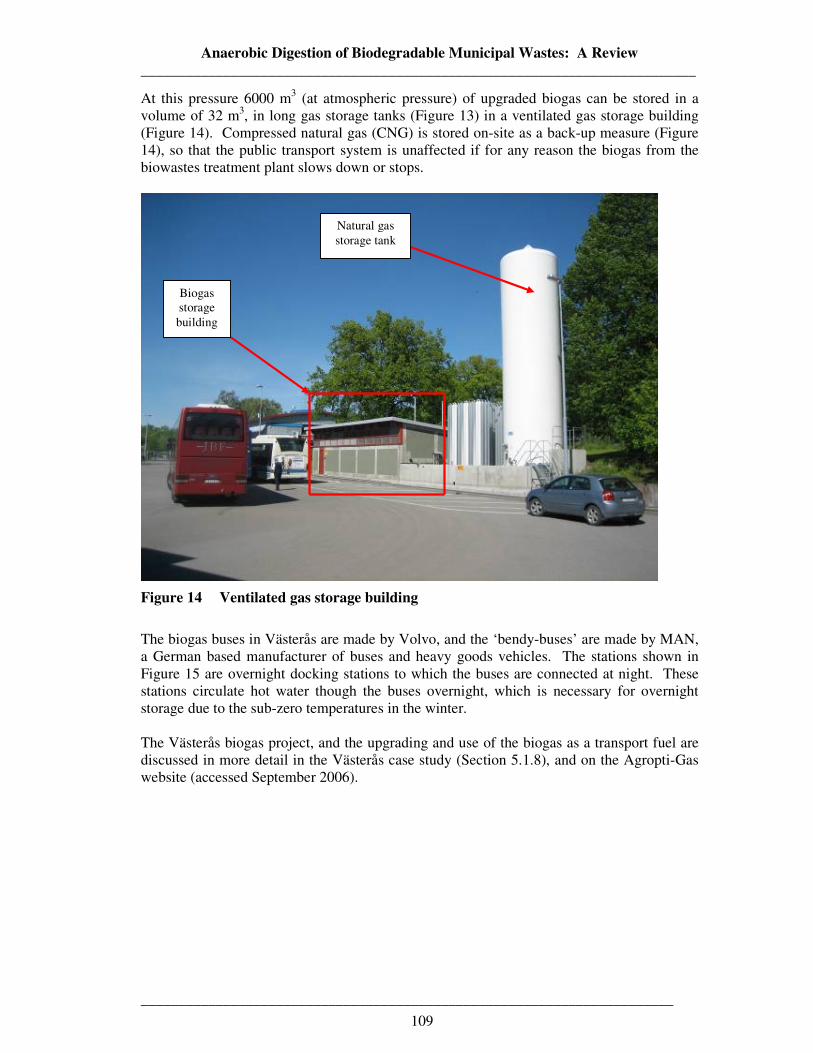
Anaerobic Digestion of Biodegradable Municipal Wastes: A Review __________________________________________________________________________
_______________________________________________________________________
109
At this pressure 6000 m3 (at atmospheric pressure) of upgraded biogas can be stored in a volume of 32 m3, in long gas storage tanks (Figure 13) in a ventilated gas storage building (Figure 14). Compressed natural gas (CNG) is stored on-site as a back-up measure (Figure 14), so that the public transport system is unaffected if for any reason the biogas from the biowastes treatment plant slows down or stops.
Figure 14 Ventilated gas storage building
The biogas buses in Västerås are made by Volvo, and the ‘bendy-buses’ are made by MAN, a German based manufacturer of buses and heavy goods vehicles. The stations shown in Figure 15 are overnight docking stations to which the buses are connected at night. These stations circulate hot water though the buses overnight, which is necessary for overnight storage due to the sub-zero temperatures in the winter. The Västerås biogas project, and the upgrading and use of the biogas as a transport fuel are discussed in more detail in the Västerås case study (Section 5.1.8), and on the Agropti-Gas website (accessed September 2006).
Biogas storage building
Natural gas storage tank
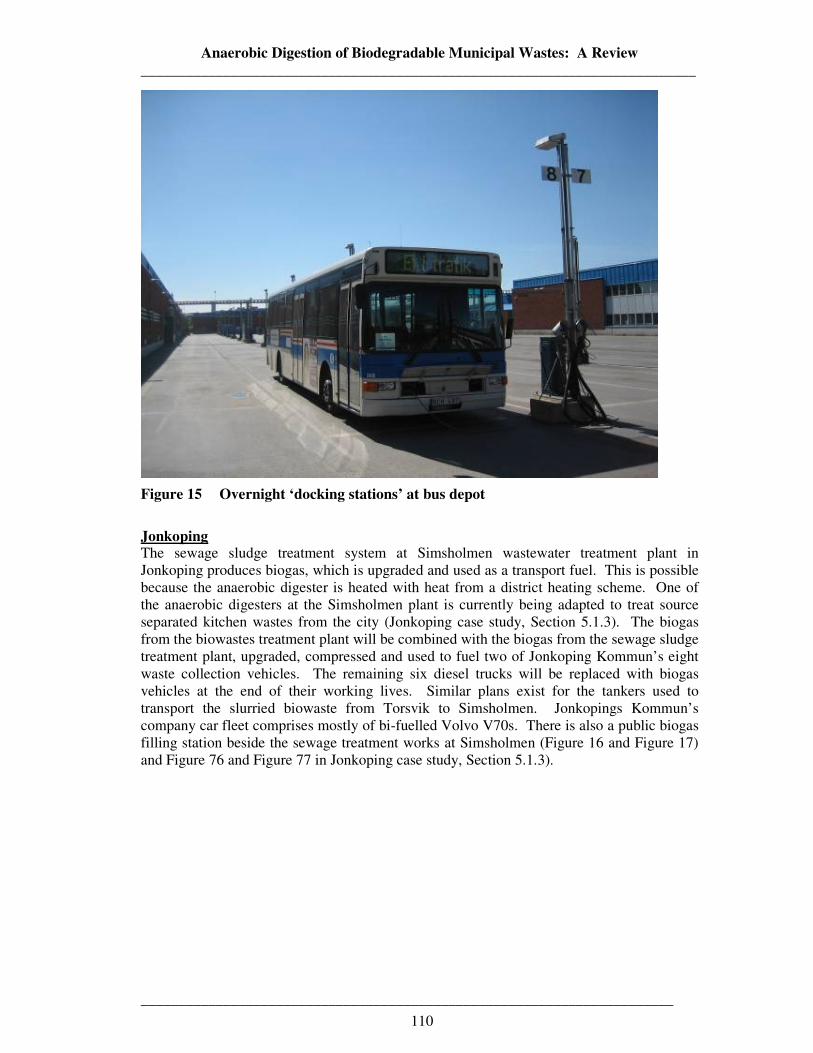
Anaerobic Digestion of Biodegradable Municipal Wastes: A Review __________________________________________________________________________
_______________________________________________________________________
110
Figure 15 Overnight ‘docking stations’ at bus depot
Jonkoping The sewage sludge treatment system at Simsholmen wastewater treatment plant in Jonkoping produces biogas, which is upgraded and used as a transport fuel. This is possible because the anaerobic digester is heated with heat from a district heating scheme. One of the anaerobic digesters at the Simsholmen plant is currently being adapted to treat source separated kitchen wastes from the city (Jonkoping case study, Section 5.1.3). The biogas from the biowastes treatment plant will be combined with the biogas from the sewage sludge treatment plant, upgraded, compressed and used to fuel two of Jonkoping Kommun’s eight waste collection vehicles. The remaining six diesel trucks will be replaced with biogas vehicles at the end of their working lives. Similar plans exist for the tankers used to transport the slurried biowaste from Torsvik to Simsholmen. Jonkopings Kommun’s company car fleet comprises mostly of bi-fuelled Volvo V70s. There is also a public biogas filling station beside the sewage treatment works at Simsholmen (Figure 16 and Figure 17) and Figure 76 and Figure 77 in Jonkoping case study, Section 5.1.3).
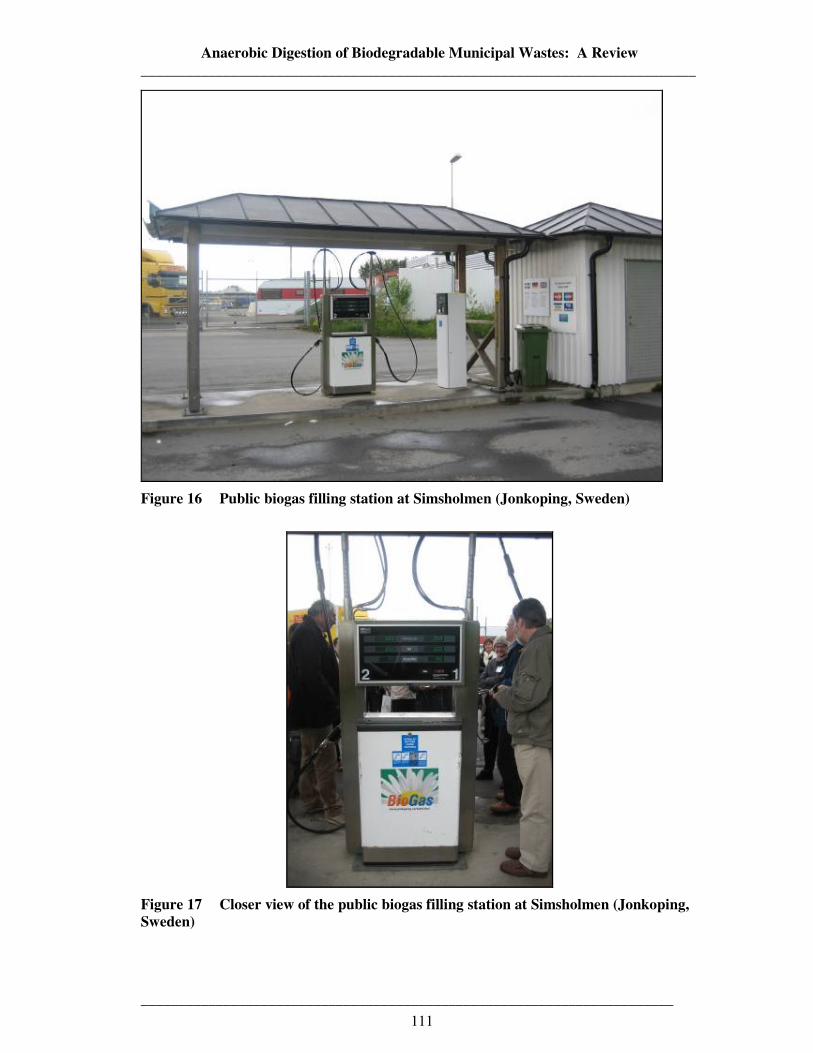
Anaerobic Digestion of Biodegradable Municipal Wastes: A Review __________________________________________________________________________
_______________________________________________________________________
111
Figure 16 Public biogas filling station at Simsholmen (Jonkoping, Sweden)
Figure 17 Closer view of the public biogas filling station at Simsholmen (Jonkoping, Sweden)
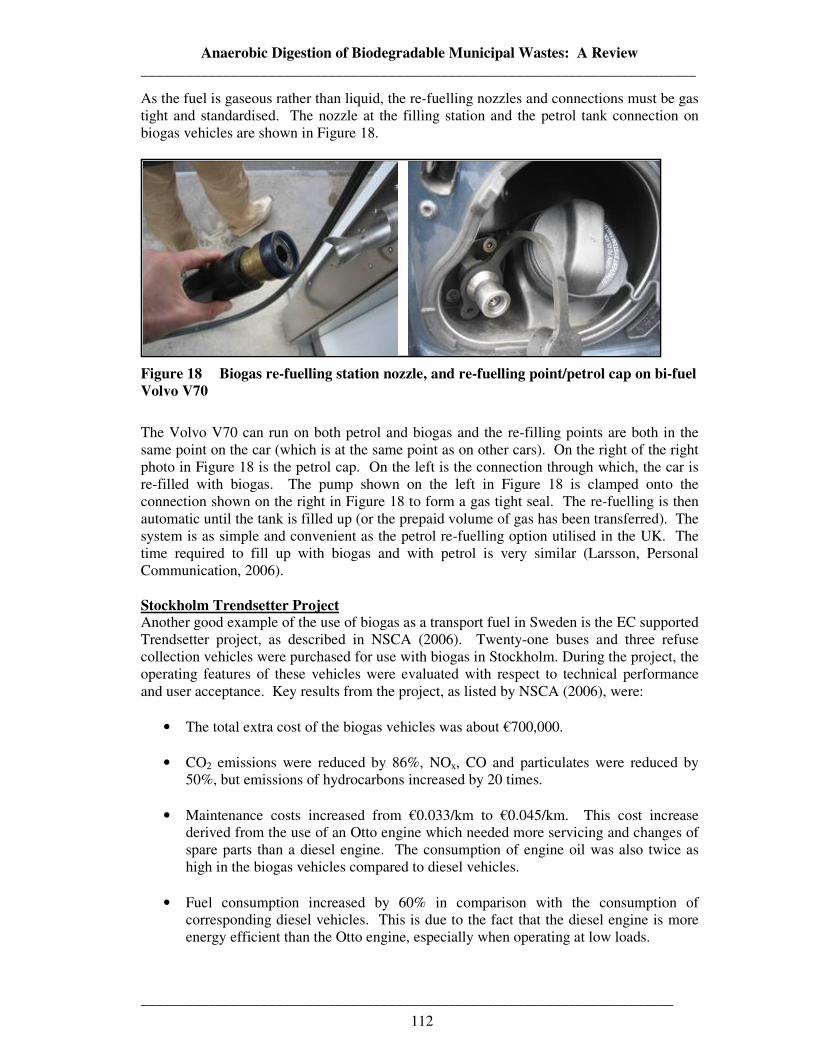
Anaerobic Digestion of Biodegradable Municipal Wastes: A Review __________________________________________________________________________
_______________________________________________________________________
112
As the fuel is gaseous rather than liquid, the re-fuelling nozzles and connections must be gas tight and standardised. The nozzle at the filling station and the petrol tank connection on biogas vehicles are shown in Figure 18.
Figure 18 Biogas re-fuelling station nozzle, and re-fuelling point/petrol cap on bi-fuel Volvo V70
The Volvo V70 can run on both petrol and biogas and the re-filling points are both in the same point on the car (which is at the same point as on other cars). On the right of the right photo in Figure 18 is the petrol cap. On the left is the connection through which, the car is re-filled with biogas. The pump shown on the left in Figure 18 is clamped onto the connection shown on the right in Figure 18 to form a gas tight seal. The re-fuelling is then automatic until the tank is filled up (or the prepaid volume of gas has been transferred). The system is as simple and convenient as the petrol re-fuelling option utilised in the UK. The time required to fill up with biogas and with petrol is very similar (Larsson, Personal Communication, 2006). Stockholm Trendsetter Project Another good example of the use of biogas as a transport fuel in Sweden is the EC supported Trendsetter project, as described in NSCA (2006). Twenty-one buses and three refuse collection vehicles were purchased for use with biogas in Stockholm. During the project, the operating features of these vehicles were evaluated with respect to technical performance and user acceptance. Key results from the project, as listed by NSCA (2006), were:
• The total extra cost of the biogas vehicles was about €700,000.
• CO2 emissions were reduced by 86%, NOx, CO and particulates were reduced by 50%, but emissions of hydrocarbons increased by 20 times.
• Maintenance costs increased from €0.033/km to €0.045/km. This cost increase
derived from the use of an Otto engine which needed more servicing and changes of spare parts than a diesel engine. The consumption of engine oil was also twice as high in the biogas vehicles compared to diesel vehicles.
• Fuel consumption increased by 60% in comparison with the consumption of
corresponding diesel vehicles. This is due to the fact that the diesel engine is more energy efficient than the Otto engine, especially when operating at low loads.
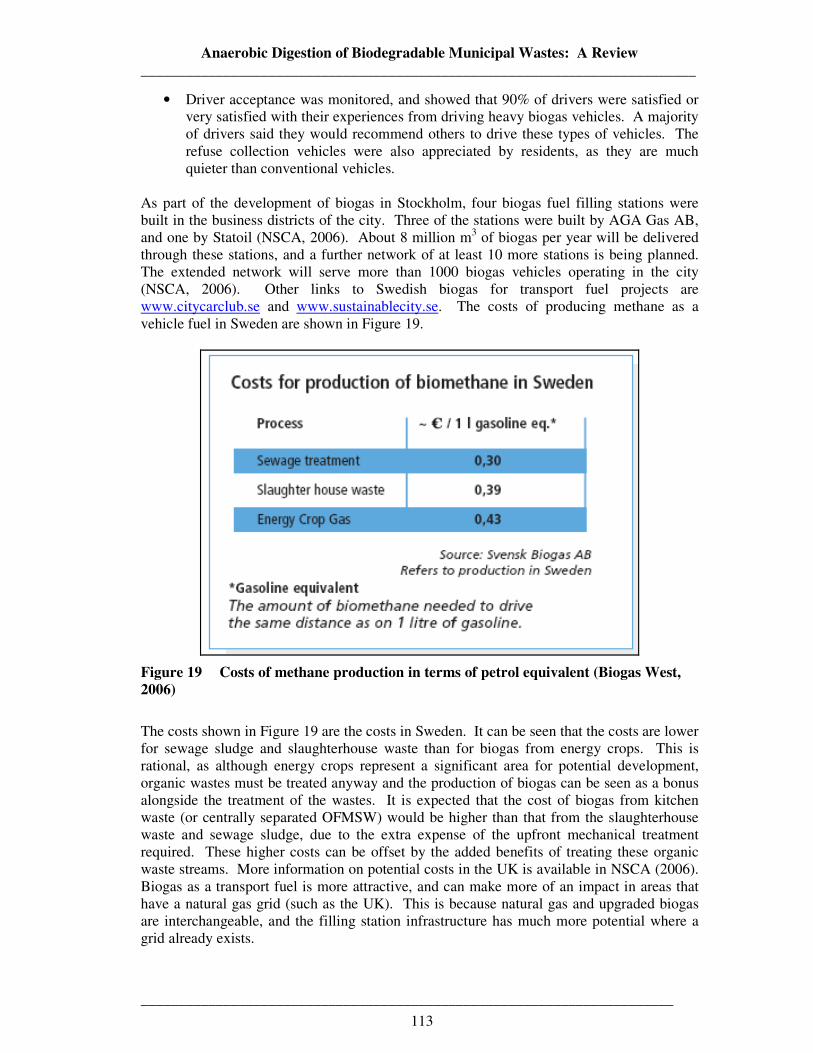
Anaerobic Digestion of Biodegradable Municipal Wastes: A Review __________________________________________________________________________
_______________________________________________________________________
113
• Driver acceptance was monitored, and showed that 90% of drivers were satisfied or very satisfied with their experiences from driving heavy biogas vehicles. A majority of drivers said they would recommend others to drive these types of vehicles. The refuse collection vehicles were also appreciated by residents, as they are much quieter than conventional vehicles.
As part of the development of biogas in Stockholm, four biogas fuel filling stations were built in the business districts of the city. Three of the stations were built by AGA Gas AB, and one by Statoil (NSCA, 2006). About 8 million m3 of biogas per year will be delivered through these stations, and a further network of at least 10 more stations is being planned. The extended network will serve more than 1000 biogas vehicles operating in the city (NSCA, 2006). Other links to Swedish biogas for transport fuel projects are www.citycarclub.se and www.sustainablecity.se. The costs of producing methane as a vehicle fuel in Sweden are shown in Figure 19.
Figure 19 Costs of methane production in terms of petrol equivalent (Biogas West, 2006)
The costs shown in Figure 19 are the costs in Sweden. It can be seen that the costs are lower for sewage sludge and slaughterhouse waste than for biogas from energy crops. This is rational, as although energy crops represent a significant area for potential development, organic wastes must be treated anyway and the production of biogas can be seen as a bonus alongside the treatment of the wastes. It is expected that the cost of biogas from kitchen waste (or centrally separated OFMSW) would be higher than that from the slaughterhouse waste and sewage sludge, due to the extra expense of the upfront mechanical treatment required. These higher costs can be offset by the added benefits of treating these organic waste streams. More information on potential costs in the UK is available in NSCA (2006). Biogas as a transport fuel is more attractive, and can make more of an impact in areas that have a natural gas grid (such as the UK). This is because natural gas and upgraded biogas are interchangeable, and the filling station infrastructure has much more potential where a grid already exists.
Anaerobic Digestion of Biodegradable Municipal Wastes: A Review __________________________________________________________________________
_______________________________________________________________________
114
The Swedish experience can be used to help point the way forward in the UK, although the specific circumstances of energy supply and demand in Sweden have been the major factors in influencing the take-up of this vehicle fuel option (NSCA, 2006). The importance of forward thinking decision makers at the top is vital. Linkoping has ‘top and bottom’ led environmental projects constantly ongoing (Agenda 21 for sustainable Linkoping website, accessed June 2006). The development of biogas as vehicle fuel in Sweden has been a result of a combination of a surplus of gas from existing biogas plants, primarily at their municipal sewage treatment plants, and a low electricity price that forces the biogas fuel into markets other than electricity production. More information on the Swedish situation is available from Biogas West, Business Region Goteborg and Agropti-Gas. An up to date analysis of the UK situation is available in NSCA (2006).
2.6.1.8.3 Costs of biogas upgrading plants
A biogas upgrading plant represents a considerable investment, as does the infrastructure required to use biogas as a transport fuel. As a rough guide to the potential capital costs of biogas upgrading infrastructure, the biogas upgrading plant at the Västerås biogas plant upgraded a volume of approximately 3 million m3 of biogas per year (from the biogas plant and the sewage sludge digestion plant), and had a capital cost of €1.7 million (£1.2 million) (Persson, Personal Communication, 2006). The contract was written so that everything was included, and the contract was not complete until the upgrading plant had been running successfully to pre-stipulated performance levels for a stated period of time. The facilities at the bus station (high pressure compressors, high pressure gas storage, back-up LNG store, buildings and pipework, and the re-fuelling facilities for buses and cars) cost €1.4 million (£1 million) (Persson, Personal Communication, 2006). More details are available in the Västerås case study, Section 5.1.8). It is expected that a larger biogas upgrading facility would lower the cost per cubic metre upgraded due to the economy of scale. At Linkoping the biogas upgrading plant was estimated to represent around 1/3 of the total capital cost of the plant (Unden, Personal Communication, 2006). The capital cost of the plant was €8.7 million (£5.8 million) in 1998, therefore the biogas upgrading plant must have cost in the region of €2.9 million (£1.9 million). This plant upgrades approximately 4.7 million m3 of biogas per year, but has the capacity to upgrade more. The biogas upgrading is estimated to cost in the region of €0.40/m3 (£0.27/m3) of upgraded biogas (at 97%) (Unden, Personal Communication, 2006). This represents total operational costs from biogas from the digester to upgraded biogas in the grid. More information on biogas upgrading facilities is available in NSCA (2006).
2.6.2 Digestate
The solid output from anaerobic digestion is known as digestate. In the literature it has also been referred to as residue slurry, anaerobic compost, soil conditioner or ‘compost like output’ (CLO). Digestate contains digested biomass, undigested or partially digested organic material, anaerobic bacteria and digestion intermediates such as organic acids. Digestate is therefore rich in organic material and rich in plant nutrients. Many photographs of digestate (both from source separated biowastes and from centrally separated residual MSW can be observed in the case studies (for example Figure 60, Figure 93, Figure 110, Figure 111, Figure 131, and Figure 229). Fundamental to the issue of digestate and what to do with it, is the source and quality of the incoming organic waste. The quality of the CLO is directly related to the quality of the waste treated, although the treatment processes
Anaerobic Digestion of Biodegradable Municipal Wastes: A Review __________________________________________________________________________
_______________________________________________________________________
115
employed also have an effect. Generally, source separated BMW (potentially mixed with other organic wastes) can produce a quality compost, provided it is relatively free from contaminants, whereas centrally separated OFMSW can not. In order to maximise sustainability, environmental gain, and hit recycling and composting targets producing an agriculturally beneficial fertiliser from the digestate should always be a key process goal where possible. In this way, the digestate is a truly beneficial, marketable ‘product’, rather than a ‘waste’ that requires disposal. Provided the digestate is of a sufficient quality, the main benefits it can bring are:
• Soil improvement. Due to its high organic content it can improve soil structure, water retention capacity, permeability, and protect soil against erosion.
• Fertiliser. Digestate contains N, P, K, Ca, Mg, S and micro-nutrients. • Stimulation of biological activity. Digestate application attracts more earthworms,
leading to increased soil aeration and increased humic material. • Inhibition of soil-borne diseases. Digestate application has a direct effect on soil-
borne diseases, and an indirect effect by stimulation of biological activity. • Inhibition of plant diseases. Digestate application inhibits plant diseases and
induction of resistance. (Schleiss et al., Accessed 2006). Despite enhancing soil quality in the long term, applications of immature composts can have a negative effect on crop yield, as soil nitrogen is utilised by micro organisms degrading the compost instead of being available to the crops. This is why digestate is usually dewatered and composted/matured before being spread to land (although digestate addition is still more beneficial than the direct land-spreading of manure). The need for post-AD composting can be avoided by applying immature compost (or digestate) well ahead of planting to allow for additional decomposition. As with all products, quality is essential for marketability. Digestate quality can be assessed on three criteria, chemical, biological and physical aspects. Chemical quality needs to be considered in terms of heavy metals and other inorganic contaminants, persistent organic compounds and the content of macro-elements such as nitrogen, phosphorous and potassium. Depending on their source, biowastes can contain pathogens, which can lead to the spreading of human, animal or plant diseases if not appropriately managed. Biowastes can also contain seeds, and where land application is intended, seeds need to be denatured in order that no unintentional cross-contamination of land occurs. The physical quality of composts includes mainly appearance and odour factors. While physical contamination of CLOs may not present a problem with regards to human plant or animal health, physical contamination of CLOs (in the form of plastics, metals, glass and ceramics) will definitely cause a negative perception. Even if compost is of a high quality and all standards are met, a negative public perception of wastes-based compost exists. The presence of visible contaminants reminds users of this. This negative perception impacts on many potential markets, propagating the image of a ‘waste’ rather than a ‘product’. The visible presence of plastics greatly reduces the value, and reduces the desirability of the CLO for application in uses such as landscaping, public parks, forestry and golf courses, as well as in the higher value horticultural markets. Most anaerobic digesters will have pre-treatment systems that remove large inerts and ‘heavy inerts’ such as metals, glass, ceramics, sand and stones. These materials can cause unnecessary wear and tear on pumps and piping. Undigested cellulosic materials can be considered more ‘natural’ and do not present such negative perception issues. The presence of small pieces of plastics in waste based composts remains a problem. There are many ‘compost treatment’ technologies, that can be implemented to
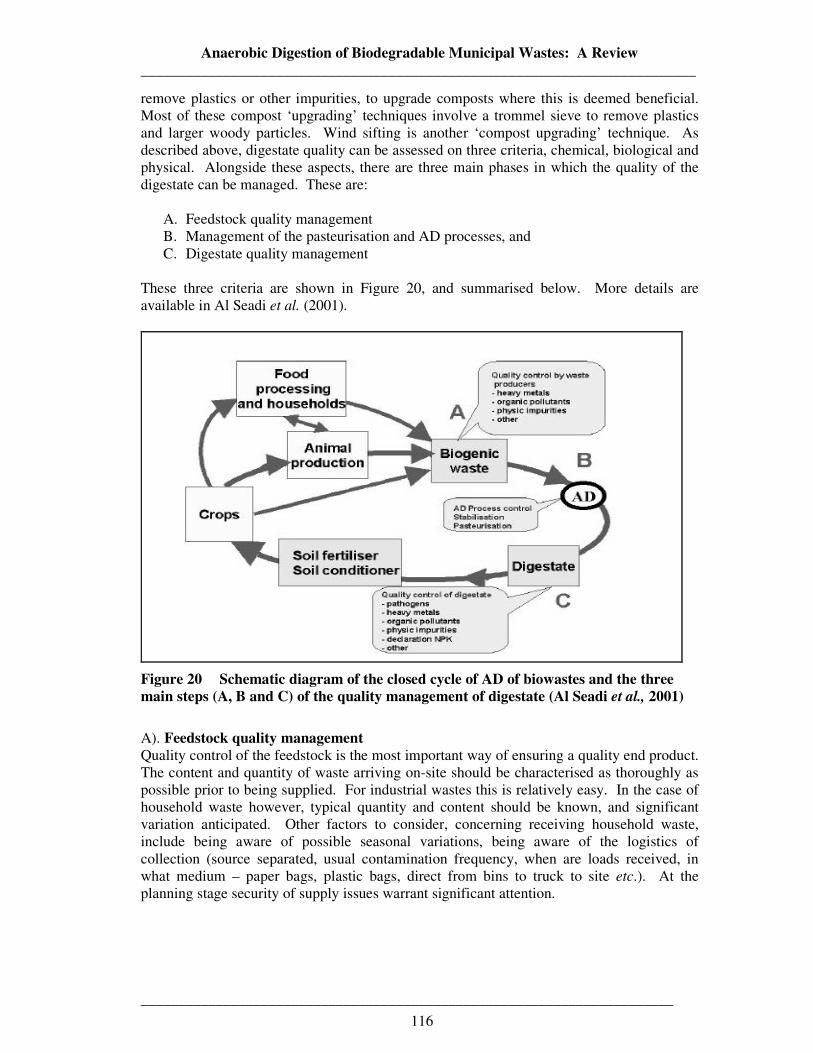
Anaerobic Digestion of Biodegradable Municipal Wastes: A Review __________________________________________________________________________
_______________________________________________________________________
116
remove plastics or other impurities, to upgrade composts where this is deemed beneficial. Most of these compost ‘upgrading’ techniques involve a trommel sieve to remove plastics and larger woody particles. Wind sifting is another ‘compost upgrading’ technique. As described above, digestate quality can be assessed on three criteria, chemical, biological and physical. Alongside these aspects, there are three main phases in which the quality of the digestate can be managed. These are:
A. Feedstock quality management B. Management of the pasteurisation and AD processes, and C. Digestate quality management
These three criteria are shown in Figure 20, and summarised below. More details are available in Al Seadi et al. (2001).
Figure 20 Schematic diagram of the closed cycle of AD of biowastes and the three main steps (A, B and C) of the quality management of digestate (Al Seadi et al., 2001)
A). Feedstock quality management Quality control of the feedstock is the most important way of ensuring a quality end product. The content and quantity of waste arriving on-site should be characterised as thoroughly as possible prior to being supplied. For industrial wastes this is relatively easy. In the case of household waste however, typical quantity and content should be known, and significant variation anticipated. Other factors to consider, concerning receiving household waste, include being aware of possible seasonal variations, being aware of the logistics of collection (source separated, usual contamination frequency, when are loads received, in what medium – paper bags, plastic bags, direct from bins to truck to site etc.). At the planning stage security of supply issues warrant significant attention.
Anaerobic Digestion of Biodegradable Municipal Wastes: A Review __________________________________________________________________________
_______________________________________________________________________
117
B). Management of the pasteurisation and AD processes Due to the potential for the transmission of pathogens (crop, animal or human diseases) or seeds pasteurisation is necessary in all systems where land application is anticipated. The management of the pasteurisation process and the AD plant itself are largely technical issues. Plants should be run by qualified, experienced personnel. C). Digestate quality management Digestate quality is, in no small way, already assured provided the first two phases (A and B) are efficiently planned and managed. Remaining responsibilities include the management of the post-AD treatment, which usually consists of some type of composting maturation process, and quality testing of the output to meet regulations. Farm scale digesters (or digesters treating mainly agricultural wastes) have traditionally disposed of their digestate on the farms from which the waste originated. Availability of nutrients is higher in digestate than in untreated organic waste. For example, AD digestate has 25% more accessible NH4-N (inorganic nitrogen) and a higher pH value than untreated liquid manure (Monnet, 2003). The application of CLO based on anaerobic digestate also improves the soil structure by the application of organic matter. Despite these benefits, farmers are justifiably wary of accepting waste based CLO from sources other than their own farm, with the possibility of introducing pathogens, seeds or contaminants to their land being of prime concern. These fears are exacerbated by the lack of applicable legislation and quality standards for CLOs from anaerobic digestion processes. Due to the relatively recent interest in AD as a method of diverting BMW from landfill, applicable standards for digestate have yet to be set. Throughout Europe, the recycling of AD digestates is generally poorly regulated. In 2001 the European Commission drafted a working document regarding the future regulation of digestates (EC/DG ENV.A, 2001). This document was intended as a basis for discussion concerning the future regulation of the biological treatment of wastes. The main objectives outlined were (Al Seadi et al., 2001):
• To promote the biological treatment of organic waste by harmonising the national measures concerning its management in order to prevent or reduce any negative impact on the environment.
• To protect soil and ensure that the use of treated and untreated organic wastes results in benefit to agriculture or ecological improvement.
• To ensure that human and animal plant health are not affected by the use of treated or untreated organic wastes.
• To ensure the functioning of the internal market and to avoid obstacles to trade and distortion and restrictions to competition.
As detailed above, there are presently no guidelines on AD digestate quality in the UK. The only compost guideline in the UK is the voluntary BSI PAS 100. It has often been said that there is a pressing need for the definition of compost (and digestate) in the UK to be linked unequivocally to quality standards which are designed to protect soil quality, i.e. standards based solely on quality and not on the origin of the CLO. There have also been repeated calls for a PAS 100 type ‘standard’ for digestate. The absence of such a standard is often quoted as a serious barrier to the further implementation of AD as a wastes treatment option. This was recognised in the Biomass Task Force Report (2005), which recommended that the Government considers, seriously and urgently, options for progressing towards a PAS 100 type standard for digestate. The Government’s response to the Biomass Task Force Report (April 2006) noted:
Anaerobic Digestion of Biodegradable Municipal Wastes: A Review __________________________________________________________________________
_______________________________________________________________________
118
‘The Environment Agency is currently working with partners to have the PAS 100 Standard upgraded so
that, where there is also certainty of use and no or negligible risk of pollution of the environment or
harm to human health, the outputs from processes such as anaerobic digestion may be considered as fully recovered for the purposes of the Waste Framework Directive and therefore no longer subject to
the Directive’s controls. This process is expected to take up to a year to complete and has been
undertaken with the agreement of the industry’.
Digestate from farm scale digesters and digesters treating non-municipal organic wastes (such as Holsworthy, Lintrup and Linkoping) can be transported directly to the farms for storage, so that the farmer can apply it to land at the optimum time (when it will provide the maximum benefit in terms of nutrient uptake and plant growth – spring or early summer). For some systems treating source separated biowastes this is also the case. Other options for digestate treatment include de-watering or post AD composting. The benefits of de-watering the digestate are that the digestate can be transported to the farms in two phases, a solid fraction that can be used as a soil improver, and a liquid fraction that can be used as a liquid fertiliser. One of the reasons that digestate is usually further treated in a composting facility is to stabilise the digestate, to ensure all organics have been decomposed. Composting the digestate also binds inorganic nutrients to humic material, reducing the potential for nitrogen to leach following land application. Levels of nutrients (such as phosphorous) are much lower in composted digestate than in sludge based materials (such as uncomposted digestate), making it possible to apply more organic material to the land without breaching consents or causing pollution. The quality of the CLO dictates whether it is classed as a ‘waste’ that you need to pay to dispose of, or a ‘product’ that people may pay for. Aside from the recycling of the organic material to the soil, the most important advantages of using CLO as a fertiliser are cost avoidance and environmental gain from minimising inorganic fertiliser production, transport and use. Also, biowastes are already a part of the natural nutrient cycle, whereas inorganic fertilisers are an addition to it. A consistently good quality CLO, with pre-planned beneficial uses can represent a substantial revenue stream, greatly improving plant economics and improving pay-back periods. Ideally (and if of a high enough standard) the CLO could be aimed at ‘high value’ markets such as sale in the horticultural industry, in garden centres and supermarkets as a ‘quality compost’. Failing this, other high value horticultural uses could be sought. Another preferred disposal route would be the re-distribution of the digestate to local farmers, for land spreading as a fertiliser substitute. To ensure this disposal route, the farmers would have to be ‘brought on board’ any project at an early stage of planning, and perhaps even ‘sweetened’ with free transport of the digestate, free on-farm storage tanks, or benefits in terms of manure management. It is unlikely that this disposal route would provide any additional income.
2.6.2.1 The utilisation of digestate as a solid fuel
Digestate not suitable for land application may be incinerated for energy recovery. The de-watered digestate from the Heerenveen MBT plant is reported to have a calorific value of around 4 MJ/tonne (Smink, Personal Communication, 2006). Thermal treatment will also reduce the volume of waste to be landfilled. In practice however, despite their calorific value, it has been referred that it can be difficult to find an industry or small scale incinerators that will accept digestates for energy recovery. This is partly due to the strict emissions legislation that needs to be met, and the expense of the extra gas cleaning equipment that may be required if these plants were to accept digestate (from the AD of
Anaerobic Digestion of Biodegradable Municipal Wastes: A Review __________________________________________________________________________
_______________________________________________________________________
119
residual OFMSW), which may be contaminated with heavy metals or other persistent toxic contaminants. Despite potential difficulties, CLO from anaerobic digesters treating municipal wastes can make an attractive fuel because they are cheap (or indeed negative cost), a dependable supply is available locally in reasonable quantities, they displace fossil fuels, and therefore reduce the reliance on imported energy. Disadvantages of using the CLO as a fuel include the variable nature of the fuel properties, technical issues such as increased exhaust air treatment costs and corrosion of piping. The heavy metal content would also raise issues, possibly contaminating the bottom ash, which could prevent its use in the construction industry. Also, any process utilising waste derived fuels is likely to encounter opposition. Thermal waste treatment processes can be subject to negative publicity. The key issue is that the CLO is simply less attractive to users than other fuels for a mix of technical, economic, legal and regulatory reasons, highlighted below (from Juniper, 2005).
• Reluctance on the part of the power industry and many industrial facilities to use waste derived fuels.
• Concerns about possible problems of corrosion or erosion in co-combustion boiler tubes and other technical issues.
• Potential changed regulatory status of co-combustion facility when burning wastes. • Impact on community relations to user (negative ‘burning waste’ issue). • Limited capacity for waste derived fuels in the cement industry. • Concerns about the long term security of outlets, and hence bankability of projects. • Insufficient fiscal incentives for waste co-combustion relative to biomass feeds and
novel technologies.
As the Landfill Directive targets are coming through and landfill costs rise, and as energy prices rise, the use of RDF and SRF from municipal waste will become more economic and desirable, although the incinerators will still charge a gate fee to accept the waste. As such, the economics for the thermal treatment of de-watered digestates/CLO is expected to improve over the next 20 years, especially when compared with landfilling, the only alternative. The use of CLO from MBT plants is further discussed in Juniper (2005).
2.6.2.2 Digestate, possible contamination Possible contamination of the digestate can arise from:
• MSW – almost any contamination imaginable – but especially plastics.
• Heavy metals in digestate usually come from anthropogenic sources. Domestic wastewater effluent contains metals from metabolic wastes, corrosion of water pipes, and consumer products. Industrial effluents and waste sludges may substantially contribute to metal loading.
• Agricultural wastes can contain persistent organic contaminants as pesticide
residues, antibiotics and other animal medicaments. Industrial organic waste, sewage sludge and household waste can contain aromatic, aliphatic and halogenated hydrocarbons, organo-chlorine pesticides, PCBs, PAHs etc. (Al Seadi et al., 2001).
Anaerobic Digestion of Biodegradable Municipal Wastes: A Review __________________________________________________________________________
_______________________________________________________________________
120
• Pig slurry can contain high levels of copper and zinc, which are both added to the food to accelerate growth. The quantity of these heavy metals in digestate from anaerobic digesters accepting pig slurry will need to be monitored.
In many cases, the blending of various waste streams can dilute levels of contamination to the required low levels. The close monitoring and control of the incoming wastes and the digestate quality is always necessary.
2.6.2.3 Digestate, potential future markets and trends
A survey for the Composting Association suggests that of all composted material (AD digestate, and compost from windrows and IVC systems), 57% was sold, 29% was used on-site, and 14% was distributed free of charge. These overall distribution proportions are different for each product type (i.e. quality of CLO). Around 66% of mulch was sold, 24% was used on-site and 10% was distributed without charge. Around 66% of soil conditioner was sold, 17% was used on site, and 17% was distributed without charge. Around 76% of daily landfill cover was used on site, 21% was distributed without charge, and 90% of growing media was sold (Eunomia, 2002a). For composted material that was sold, the most popular types of customer were commercial landscapers and commercial gardeners, followed by garden centres and hobby gardeners. In addition to these main customers, composted material was also sold to organic growers, local authorities, golf courses and building companies (Eunomia, 2002a). Schleiss et al. (Accessed 2006) estimated that to provide the same quantity of nutrients as 1 m3 of compost, the fertiliser cost would be around €6 in best practice farming and €9 in organic farming. To provide the same amount of organic matter with peat would cost €13. Traditionally, the main benefit of compost/digestate application was considered to be the nutrient content. Schleiss et al. (Accessed 2006) questioned over 50 farmers who had recently applied compost to their land about its benefits and found that they awarded a higher value to the supply of organic matter than to the supply of nutrients. The primary benefit of extra organic matter in soil is that it can sustain larger populations of earthworms and other organisms. Secondly, a more stable humic fraction improves the cation exchange capacity of the soil and buffers against possible physico-chemical imbalances Schleiss et al. (Accessed 2006). Diaz et al. (1993) stated that marketing studies of composts produced from municipal wastes have shown that the development of a market is to a large extent a matter of overcoming inertia and bias and instilling an awareness in potential users (provided the compost is of good quality). Diaz et al. (1993) also suggested that this can be done through a programme of education and promotion. Since 1993, several studies have been undertaken in the UK and abroad to try and ascertain and develop potential markets for digestate/compost from municipal waste sources. These include Dawson and Probert (2005), SITA website (accessed October 2006), Barth (Accessed 2006), WRAP website (Accessed October 2006), Composting Council of Canada website (Accessed October 2006), US EPA website (accessed October 2006). The general message of most of these reports is that:
• Income from the sale of good quality compost from source separated BMW is possible, but should not be relied upon when considering plant economics. Any income from the sale of compost from municipal waste sources should be seen as a bonus.
Anaerobic Digestion of Biodegradable Municipal Wastes: A Review __________________________________________________________________________
_______________________________________________________________________
121
Many sources suspect the future market for compost based on waste to be weak in the UK. This is mainly due to three factors:
• Increased volume of compost on the market in the future (as more local councils move towards their recycling and composting targets).
• Increased competition from increased amounts of ‘cleaner image’ compost (for example, from windrow composting of garden wastes).
• Pressure from food ‘buyers’ not wanting their products to be associated with crops/livestock fed on soils fertilised with ‘waste-based’ compost (irrespective of quality).
Schleiss et al. (Accessed 2006) suggest that for the long-term viability of a compost market the ‘image’ of the product is of prime importance. This is a vision shared (and backed up practically in a recognisable way) by Kompogas. The producer must shed his role of waste manager and focus on a more commercial attitude, where the quality of his product, and more importantly ‘customer satisfaction with his product’ becomes of primary importance. More details of all aspects of the management of the quality of anaerobic digestates is available in Al Seadi et al. (2001). More details about the benefits of compost/digestate is available in Schleiss et al. (Accessed 2006). In terms of the quantities of CLO produced per tonne of organic waste treated, values depend on the total solids and volatile solids content of the incoming waste entering the digester, but typical figures for CLO production for systems with incoming total solids contents of 10 – 30% (normal for anaerobic digesters accepting solid wastes) appear to be between 30% and 40% of the incoming wastes by mass. Therefore the usual CLO output would be in the region of 300 and 400 kg of digestate solids per tonne of wastes input. A further reduction in mass of around 5 – 10% (50 – 100 kg per tonne of waste treated) is possible in the aerobic composting maturation phase. This usually results in approximately 290 – 350 kg of CLO per tonne of organic waste input. Typical figures from processes studied in this report range from 28% of the total incoming waste by mass at Västerås (6500 tpa digestate from 23,000 tpa incoming wastes) to 40% of the total incoming waste by mass at Salzburg (8000 tpa digestate from 20,000 tpa incoming wastes). Other figures include Kompogas systems at 28 – 36% of the total incoming waste by mass, or approximately 33% of the total incoming waste by mass at the Brecht biowastes treatment plant.
2.6.3 AD liquor The liquor from farm scale digesters and centralised digesters treating ‘good quality’ organic wastes can be spread directly to farmland via traditional irrigation equipment. In many cases the digestate is transported to the farms without further treatment. In some cases the digestate is de-watered, and a proportion of the liquor re-used on-site (usually to dilute and re-seed the incoming feed materials). Where the digestate is de-watered, two valuable products can be transported to the farms. The solid fraction as a soil improver, and the liquid fraction as a liquid fertiliser. In these cases the liquid fraction is tankered (or in some cases piped) back to the farms from which the manure/energy crop originated. These plants are often based in rural locations, close to the farms whose waste they treat (and on whose land the solid and liquid fractions will be spread). Farmers often have on-farm liquor storage facilities, which enables them to spread the liquor at the most beneficial time of year (spring or early summer). Demonstrations for the use of the liquor as a hydroponic media
Anaerobic Digestion of Biodegradable Municipal Wastes: A Review __________________________________________________________________________
_______________________________________________________________________
122
for horticulture have been carried out, and advances in Denmark indicate that liquor can be further refined to produce a nutrient concentrate, similar to commercially marketed fertiliser (Composting Association, 2005). Despite its high nutrient content and possible use as a fertiliser, AD liquor from MBT systems treating residual wastes (that is not recycled for use elsewhere on the plant) is usually treated in a wastewater treatment plant before being released to sewer. In all cases, the quality of the incoming waste stream is the key factor determining whether or not the digestate liquor is a ‘wastewater’ that needs to be treated, or a ‘quality product’ that can be beneficially used. If BMW is to be used in a system that plans to produce a ‘quality product’, then efficient source separation is fundamental, as are stringent quality tests to maintain farmer and consumer confidence in the ‘product’.
2.6.4 Other end products from the anaerobic digestion of municipal biowastes
Aside from biogas, digestate and liquor/wastewater, other end products arising from anaerobic digestion systems treating municipal organic wastes are:
• Non-organic recyclates (from the mechanical separation stages rather than from the AD stages, therefore dependant on degree of contamination).
• Exhaust gases.
2.6.4.1 Recyclates from mechanical separation stages
With digesters treating source separated municipal waste, or commercial or industrial organic waste, there will be a percentage of impurities in the incoming waste that need to be removed, and landfilled, but it is unlikely that these will be present in quantities large enough to impact greatly on plant economics. When considering the anaerobic digestion of centrally separated OFMSW as part of a MBT plant, the markets (or disposal costs) for each separated waste/recyclate stream will be a major factors to be considered. For example, there are markets for these recyclates (such as ferrous metals, or specific types of plastic) that can impact positively on MBT plant economics, while other items such as RDF may impact negatively, with the plant paying for removal and disposal. Landfill diversion targets and savings based on diverting these materials from landfill must also be considered. The impact of these other materials (such as ferrous metals, RDF, sand etc.) on plant economics is beyond the scope of this report, but is an important associated issue and is considered in detail in Juniper (2005).
2.6.4.2 Exhaust gases
In all centralised AD plants the exhaust gases will need treatment before being released to the atmosphere. Exhaust gas treatment not only ensures compliance with emissions legislation, but also serves to control odours on site, and to minimise their escape. In existing plants, exhaust gases are collected from the enclosed wastes reception area, the mechanical separation/pre-treatment areas, the biogas utilisation stages, the digestate de-watering and post-treatment stages of processes. The actual anaerobic digestion system is always totally enclosed, and therefore be odour free, except during maintenance work. Exhaust gases and their treatment is further discussed in Section 2.8.8.
Anaerobic Digestion of Biodegradable Municipal Wastes: A Review __________________________________________________________________________
_______________________________________________________________________
123
2.7 Types of Anaerobic Digester for Solid Wastes At present, there is no consensus of the optimal digester design for the anaerobic digestion of either BMW or OFMSW. The appropriateness of a specific type of digester depends on the waste streams. Another reason, is that there are many successful variations of anaerobic digester design, supplied by many companies, that have stood the test of time and remain sound organic waste treatment options. Another limitation in directly comparing anaerobic digesters treating either BMW or OFMSW from centrally separated wastes is that the digesters themselves can not be considered ‘stand alone technologies’. All anaerobic digesters treating OFMSW or to a lesser extent BMW are parts of a larger ‘treatment system’. This treatment system incorporates pre-treatment, digestion and post-digestion treatment, as well as driving factors such as the exact waste stream being treated. As such, problems with pre-treatment stages can lead to downtime and expensive maintenance in anaerobic digesters. In any case, AD-based systems treating OFMSW or BMW should be considerably more robust and flexible than systems treating other (more consistent and predictable) waste streams. The suppliers remaining in the market have gained considerable experience, and have developed the necessary pre-treatment technologies to ensure their digestion systems operate problem free. Many anaerobic digestion systems that have been designed for other waste streams have encountered problems when dealing with municipal wastes, as their mechanical pre-treatment stages have not been sufficiently robust or successful to deal with incoming non-organic contaminants. Many digestion systems have also suffered, as the waste stream they receive has turned out different from the waste stream they were designed to treat. Where digestion systems have encountered problems, these have often been due to insufficient pre-treatment of the wastes to remove inorganic contaminants before digestion. Therefore, for OFMSW it is necessary to consider the mechanical pre-treatment stages as part of the AD process (as AD can not proceed without the pre-treatment). This complicates direct comparison. The discussion and evaluation of digester designs will vary greatly depending on whether one takes a biological, technical, economical, or environmental viewpoint (Vandivivere et
al., 2003). When considering the best possible anaerobic digestion system to implement, it is absolutely fundamental to consider not only your aims and objectives, but also your aims and objectives as part of ‘the bigger picture’. This may seem an obvious point, but an anaerobic digestion plant can have a significant role to play not only in municipal waste treatment, but in the treatment of other organic and industrial wastes, in terms of renewable energy production and also socially, in terms of the provision of employment and income in rural areas. Other factors of key importance include the exact content and composition of the incoming waste, and therefore the degree of pre-treatment required before anaerobic treatment, and the degree of post treatment required to meet objectives and targets. Pre-treatment techniques employed on municipal solid waste streams (both BMW and OFMSW) are key to digester success. Examples of these pre-treatment systems are available in the case studies (and in Section 2.8.1). Post AD treatment is described in Section 2.8.2. Local variations are also very important, for example different countries will need to approach problems from different angles, for example, Denmark, having manure disposal and pollution problems caused by its high intensity animal farming, and having no access to fossil fuels was at the forefront of the co-digestion of BMW with animal manures (although many Danish plants have since stopped accepting BMW). The Spanish, with large areas of dry unusable soil need to not only treat their waste but to produce as much usable compost as possible. In France, the emphasis is firmly on waste disposal, with energy production
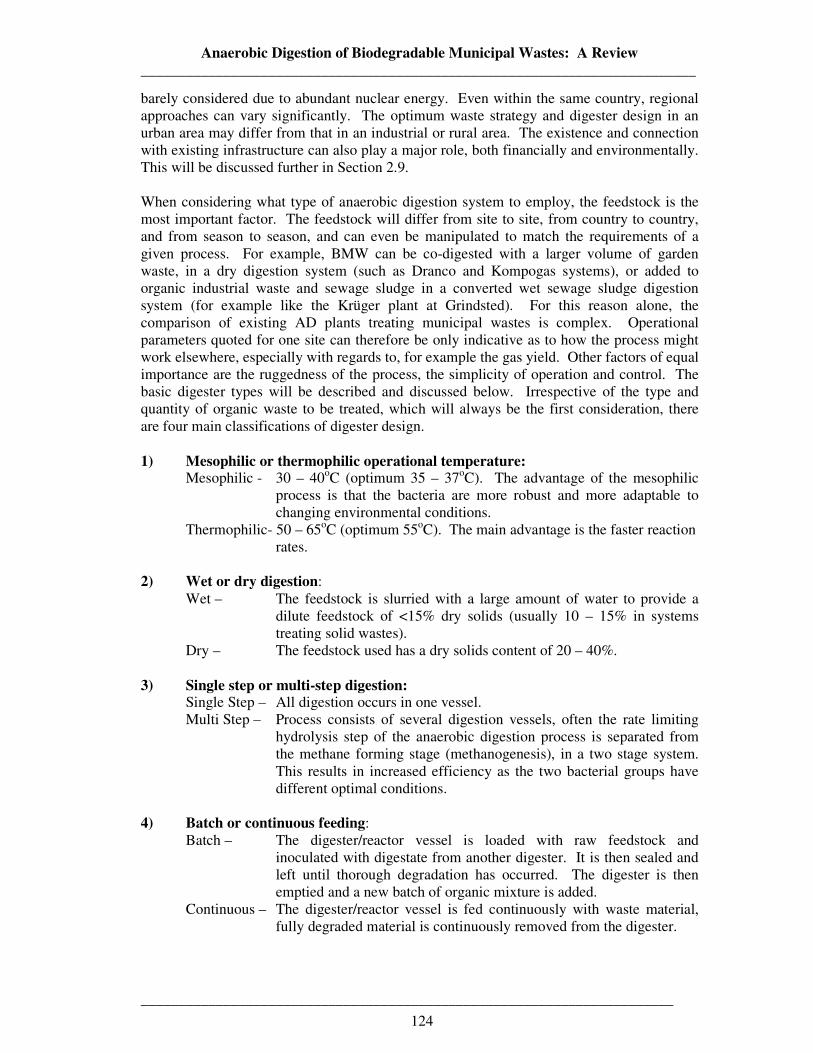
Anaerobic Digestion of Biodegradable Municipal Wastes: A Review __________________________________________________________________________
_______________________________________________________________________
124
barely considered due to abundant nuclear energy. Even within the same country, regional approaches can vary significantly. The optimum waste strategy and digester design in an urban area may differ from that in an industrial or rural area. The existence and connection with existing infrastructure can also play a major role, both financially and environmentally. This will be discussed further in Section 2.9. When considering what type of anaerobic digestion system to employ, the feedstock is the most important factor. The feedstock will differ from site to site, from country to country, and from season to season, and can even be manipulated to match the requirements of a given process. For example, BMW can be co-digested with a larger volume of garden waste, in a dry digestion system (such as Dranco and Kompogas systems), or added to organic industrial waste and sewage sludge in a converted wet sewage sludge digestion system (for example like the Krüger plant at Grindsted). For this reason alone, the comparison of existing AD plants treating municipal wastes is complex. Operational parameters quoted for one site can therefore be only indicative as to how the process might work elsewhere, especially with regards to, for example the gas yield. Other factors of equal importance are the ruggedness of the process, the simplicity of operation and control. The basic digester types will be described and discussed below. Irrespective of the type and quantity of organic waste to be treated, which will always be the first consideration, there are four main classifications of digester design. 1) Mesophilic or thermophilic operational temperature:
Mesophilic - 30 – 40oC (optimum 35 – 37oC). The advantage of the mesophilic process is that the bacteria are more robust and more adaptable to changing environmental conditions.
Thermophilic- 50 – 65oC (optimum 55oC). The main advantage is the faster reaction rates.
2) Wet or dry digestion:
Wet – The feedstock is slurried with a large amount of water to provide a dilute feedstock of <15% dry solids (usually 10 – 15% in systems treating solid wastes).
Dry – The feedstock used has a dry solids content of 20 – 40%. 3) Single step or multi-step digestion:
Single Step – All digestion occurs in one vessel. Multi Step – Process consists of several digestion vessels, often the rate limiting
hydrolysis step of the anaerobic digestion process is separated from the methane forming stage (methanogenesis), in a two stage system. This results in increased efficiency as the two bacterial groups have different optimal conditions.
4) Batch or continuous feeding:
Batch – The digester/reactor vessel is loaded with raw feedstock and inoculated with digestate from another digester. It is then sealed and left until thorough degradation has occurred. The digester is then emptied and a new batch of organic mixture is added.
Continuous – The digester/reactor vessel is fed continuously with waste material, fully degraded material is continuously removed from the digester.
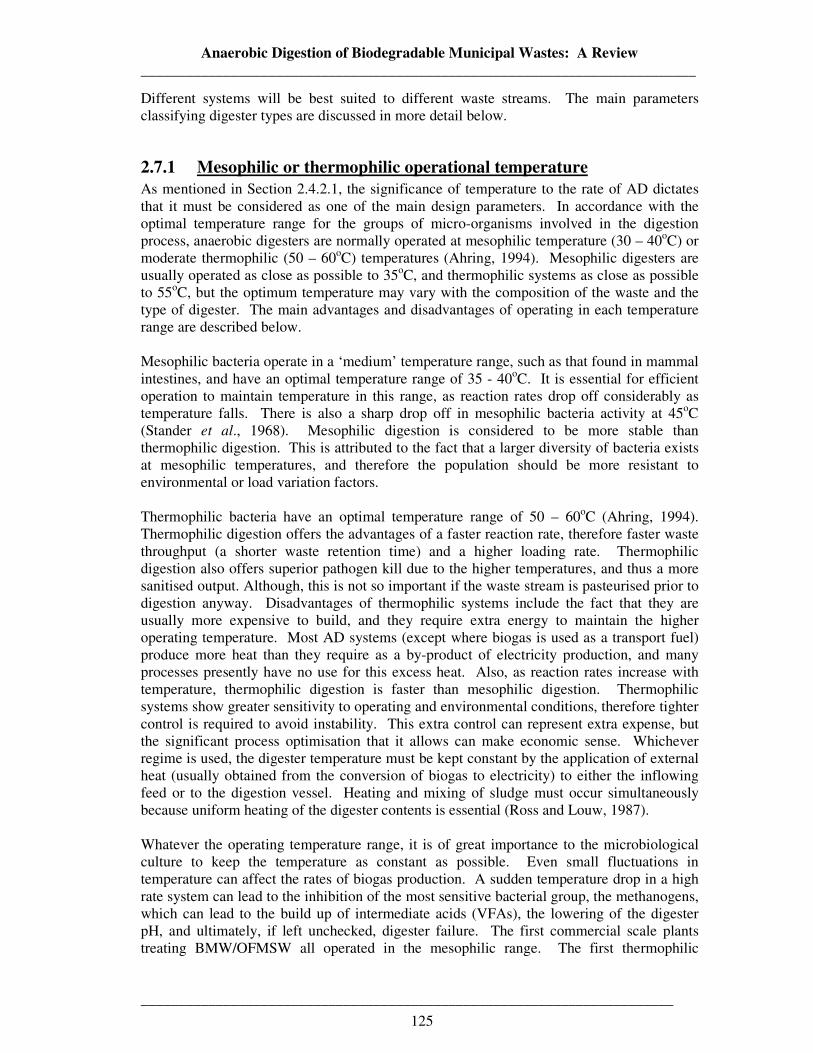
Anaerobic Digestion of Biodegradable Municipal Wastes: A Review __________________________________________________________________________
_______________________________________________________________________
125
Different systems will be best suited to different waste streams. The main parameters classifying digester types are discussed in more detail below.
2.7.1 Mesophilic or thermophilic operational temperature As mentioned in Section 2.4.2.1, the significance of temperature to the rate of AD dictates that it must be considered as one of the main design parameters. In accordance with the optimal temperature range for the groups of micro-organisms involved in the digestion process, anaerobic digesters are normally operated at mesophilic temperature (30 – 40oC) or moderate thermophilic (50 – 60oC) temperatures (Ahring, 1994). Mesophilic digesters are usually operated as close as possible to 35oC, and thermophilic systems as close as possible to 55oC, but the optimum temperature may vary with the composition of the waste and the type of digester. The main advantages and disadvantages of operating in each temperature range are described below. Mesophilic bacteria operate in a ‘medium’ temperature range, such as that found in mammal intestines, and have an optimal temperature range of 35 - 40oC. It is essential for efficient operation to maintain temperature in this range, as reaction rates drop off considerably as temperature falls. There is also a sharp drop off in mesophilic bacteria activity at 45oC (Stander et al., 1968). Mesophilic digestion is considered to be more stable than thermophilic digestion. This is attributed to the fact that a larger diversity of bacteria exists at mesophilic temperatures, and therefore the population should be more resistant to environmental or load variation factors. Thermophilic bacteria have an optimal temperature range of 50 – 60oC (Ahring, 1994). Thermophilic digestion offers the advantages of a faster reaction rate, therefore faster waste throughput (a shorter waste retention time) and a higher loading rate. Thermophilic digestion also offers superior pathogen kill due to the higher temperatures, and thus a more sanitised output. Although, this is not so important if the waste stream is pasteurised prior to digestion anyway. Disadvantages of thermophilic systems include the fact that they are usually more expensive to build, and they require extra energy to maintain the higher operating temperature. Most AD systems (except where biogas is used as a transport fuel) produce more heat than they require as a by-product of electricity production, and many processes presently have no use for this excess heat. Also, as reaction rates increase with temperature, thermophilic digestion is faster than mesophilic digestion. Thermophilic systems show greater sensitivity to operating and environmental conditions, therefore tighter control is required to avoid instability. This extra control can represent extra expense, but the significant process optimisation that it allows can make economic sense. Whichever regime is used, the digester temperature must be kept constant by the application of external heat (usually obtained from the conversion of biogas to electricity) to either the inflowing feed or to the digestion vessel. Heating and mixing of sludge must occur simultaneously because uniform heating of the digester contents is essential (Ross and Louw, 1987). Whatever the operating temperature range, it is of great importance to the microbiological culture to keep the temperature as constant as possible. Even small fluctuations in temperature can affect the rates of biogas production. A sudden temperature drop in a high rate system can lead to the inhibition of the most sensitive bacterial group, the methanogens, which can lead to the build up of intermediate acids (VFAs), the lowering of the digester pH, and ultimately, if left unchecked, digester failure. The first commercial scale plants treating BMW/OFMSW all operated in the mesophilic range. The first thermophilic
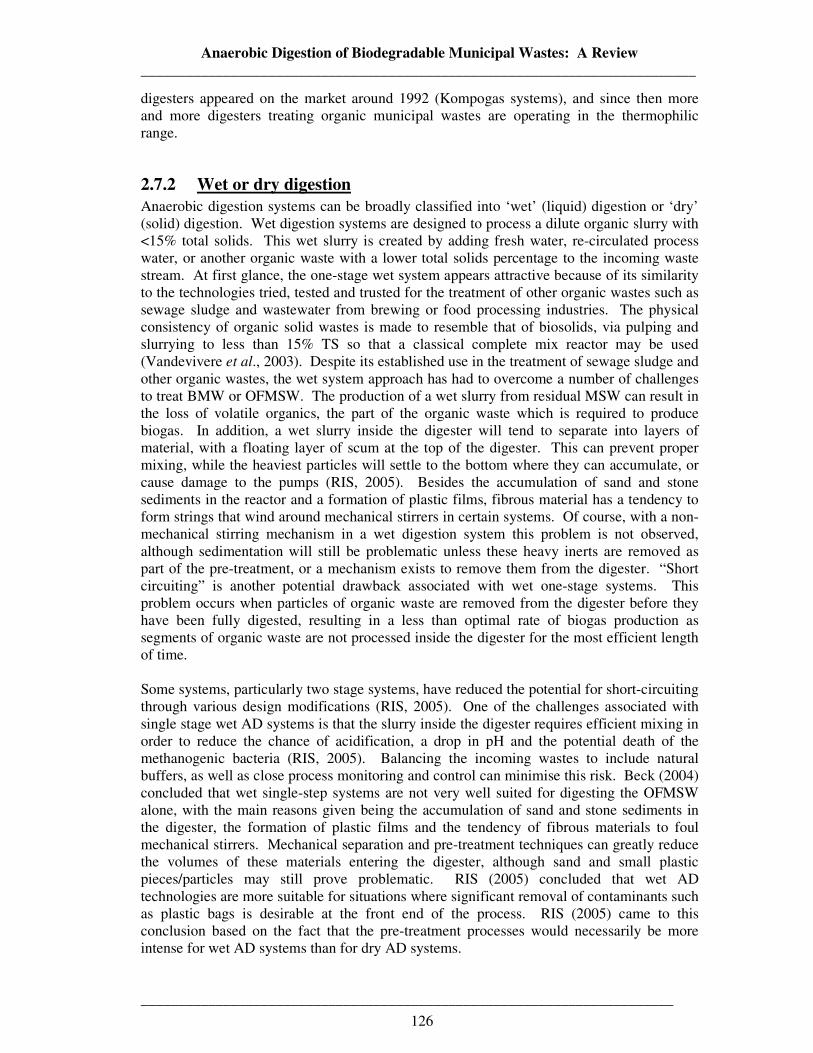
Anaerobic Digestion of Biodegradable Municipal Wastes: A Review __________________________________________________________________________
_______________________________________________________________________
126
digesters appeared on the market around 1992 (Kompogas systems), and since then more and more digesters treating organic municipal wastes are operating in the thermophilic range.
2.7.2 Wet or dry digestion
Anaerobic digestion systems can be broadly classified into ‘wet’ (liquid) digestion or ‘dry’ (solid) digestion. Wet digestion systems are designed to process a dilute organic slurry with <15% total solids. This wet slurry is created by adding fresh water, re-circulated process water, or another organic waste with a lower total solids percentage to the incoming waste stream. At first glance, the one-stage wet system appears attractive because of its similarity to the technologies tried, tested and trusted for the treatment of other organic wastes such as sewage sludge and wastewater from brewing or food processing industries. The physical consistency of organic solid wastes is made to resemble that of biosolids, via pulping and slurrying to less than 15% TS so that a classical complete mix reactor may be used (Vandevivere et al., 2003). Despite its established use in the treatment of sewage sludge and other organic wastes, the wet system approach has had to overcome a number of challenges to treat BMW or OFMSW. The production of a wet slurry from residual MSW can result in the loss of volatile organics, the part of the organic waste which is required to produce biogas. In addition, a wet slurry inside the digester will tend to separate into layers of material, with a floating layer of scum at the top of the digester. This can prevent proper mixing, while the heaviest particles will settle to the bottom where they can accumulate, or cause damage to the pumps (RIS, 2005). Besides the accumulation of sand and stone sediments in the reactor and a formation of plastic films, fibrous material has a tendency to form strings that wind around mechanical stirrers in certain systems. Of course, with a non-mechanical stirring mechanism in a wet digestion system this problem is not observed, although sedimentation will still be problematic unless these heavy inerts are removed as part of the pre-treatment, or a mechanism exists to remove them from the digester. “Short circuiting” is another potential drawback associated with wet one-stage systems. This problem occurs when particles of organic waste are removed from the digester before they have been fully digested, resulting in a less than optimal rate of biogas production as segments of organic waste are not processed inside the digester for the most efficient length of time. Some systems, particularly two stage systems, have reduced the potential for short-circuiting through various design modifications (RIS, 2005). One of the challenges associated with single stage wet AD systems is that the slurry inside the digester requires efficient mixing in order to reduce the chance of acidification, a drop in pH and the potential death of the methanogenic bacteria (RIS, 2005). Balancing the incoming wastes to include natural buffers, as well as close process monitoring and control can minimise this risk. Beck (2004) concluded that wet single-step systems are not very well suited for digesting the OFMSW alone, with the main reasons given being the accumulation of sand and stone sediments in the digester, the formation of plastic films and the tendency of fibrous materials to foul mechanical stirrers. Mechanical separation and pre-treatment techniques can greatly reduce the volumes of these materials entering the digester, although sand and small plastic pieces/particles may still prove problematic. RIS (2005) concluded that wet AD technologies are more suitable for situations where significant removal of contaminants such as plastic bags is desirable at the front end of the process. RIS (2005) came to this conclusion based on the fact that the pre-treatment processes would necessarily be more intense for wet AD systems than for dry AD systems.
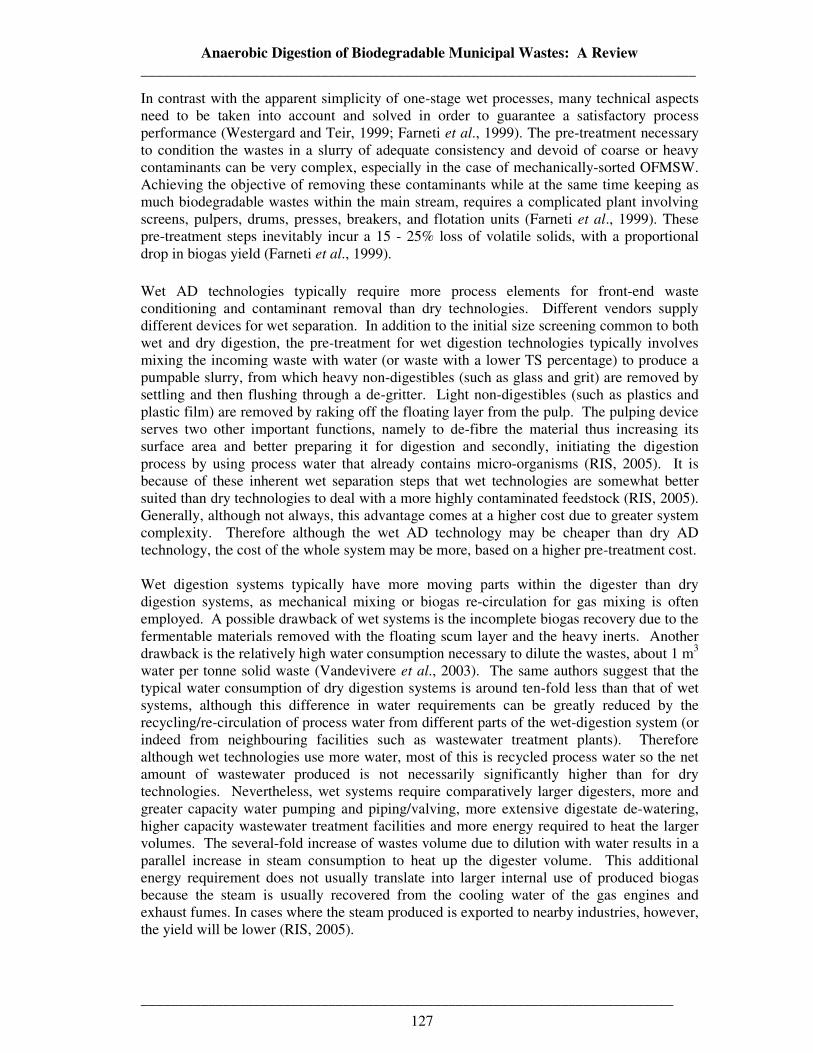
Anaerobic Digestion of Biodegradable Municipal Wastes: A Review __________________________________________________________________________
_______________________________________________________________________
127
In contrast with the apparent simplicity of one-stage wet processes, many technical aspects need to be taken into account and solved in order to guarantee a satisfactory process performance (Westergard and Teir, 1999; Farneti et al., 1999). The pre-treatment necessary to condition the wastes in a slurry of adequate consistency and devoid of coarse or heavy contaminants can be very complex, especially in the case of mechanically-sorted OFMSW. Achieving the objective of removing these contaminants while at the same time keeping as much biodegradable wastes within the main stream, requires a complicated plant involving screens, pulpers, drums, presses, breakers, and flotation units (Farneti et al., 1999). These pre-treatment steps inevitably incur a 15 - 25% loss of volatile solids, with a proportional drop in biogas yield (Farneti et al., 1999).
Wet AD technologies typically require more process elements for front-end waste conditioning and contaminant removal than dry technologies. Different vendors supply different devices for wet separation. In addition to the initial size screening common to both wet and dry digestion, the pre-treatment for wet digestion technologies typically involves mixing the incoming waste with water (or waste with a lower TS percentage) to produce a pumpable slurry, from which heavy non-digestibles (such as glass and grit) are removed by settling and then flushing through a de-gritter. Light non-digestibles (such as plastics and plastic film) are removed by raking off the floating layer from the pulp. The pulping device serves two other important functions, namely to de-fibre the material thus increasing its surface area and better preparing it for digestion and secondly, initiating the digestion process by using process water that already contains micro-organisms (RIS, 2005). It is because of these inherent wet separation steps that wet technologies are somewhat better suited than dry technologies to deal with a more highly contaminated feedstock (RIS, 2005). Generally, although not always, this advantage comes at a higher cost due to greater system complexity. Therefore although the wet AD technology may be cheaper than dry AD technology, the cost of the whole system may be more, based on a higher pre-treatment cost. Wet digestion systems typically have more moving parts within the digester than dry digestion systems, as mechanical mixing or biogas re-circulation for gas mixing is often employed. A possible drawback of wet systems is the incomplete biogas recovery due to the fermentable materials removed with the floating scum layer and the heavy inerts. Another drawback is the relatively high water consumption necessary to dilute the wastes, about 1 m3 water per tonne solid waste (Vandevivere et al., 2003). The same authors suggest that the typical water consumption of dry digestion systems is around ten-fold less than that of wet systems, although this difference in water requirements can be greatly reduced by the recycling/re-circulation of process water from different parts of the wet-digestion system (or indeed from neighbouring facilities such as wastewater treatment plants). Therefore although wet technologies use more water, most of this is recycled process water so the net amount of wastewater produced is not necessarily significantly higher than for dry technologies. Nevertheless, wet systems require comparatively larger digesters, more and greater capacity water pumping and piping/valving, more extensive digestate de-watering, higher capacity wastewater treatment facilities and more energy required to heat the larger volumes. The several-fold increase of wastes volume due to dilution with water results in a parallel increase in steam consumption to heat up the digester volume. This additional energy requirement does not usually translate into larger internal use of produced biogas because the steam is usually recovered from the cooling water of the gas engines and exhaust fumes. In cases where the steam produced is exported to nearby industries, however, the yield will be lower (RIS, 2005).
Anaerobic Digestion of Biodegradable Municipal Wastes: A Review __________________________________________________________________________
_______________________________________________________________________
128
As mentioned above, since the heavy and light components of the waste stream can block and damage pipes and pumps, it is necessary to remove them as much as possible in the pre-treatment stages, possibly in specifically-designed hydro-cyclones or in a pulper, designed with a settling zone. It is also advisable to foresee means to periodically extract light and heavy fractions from the digester. Even in processes with pre-treatment technologies installed, heavy and light fractions can accumulate and eventually cause severe problems. Sedimentation is a common and well documented problem, as is the build up of floating layers. The slurrying of the solid wastes brings the economical advantage that cheaper equipment may be used, e.g. pumps and piping, relative to solid materials. This advantage is however balanced by the higher investment costs resulting from larger digesters with internal mixing, larger de-watering equipment, and necessary pre-treatment steps. Overall, investment costs are comparable to those for one stage 'dry' systems (Vandevivere et al., 2003). Dry AD systems digest a waste stream of 15 – 40% total solids. Examples of suppliers of commercially available high solids content dry digestion systems include OWS Dranco, Kompogas and Valorga. The physical characteristics of the wastes at such high solids content impose technical approaches in terms of handling, mixing and pre-treatment, which are fundamentally different from those of wet systems. Transport and handling of the wastes is carried out with conveyor belts, screws, and powerful pumps especially designed for highly viscous streams (such as cement). This equipment is more expensive than the centrifugal pumps used in wet systems and also much more robust and flexible, meaning that wastes with high solids contents (20 and 50%) can be handled, and impurities such as stones, glass or wood do not cause problems (Vandevivere et al., 2003). The only pre-treatment which is necessary before feeding the wastes into the digester is the removal of the coarse impurities larger than approximately 40mm. This is accomplished either via trommel screens, as is typically the case with mechanically-sorted OFMSW, or via shredders and trommel screens in the case of source separated biowaste (Fruteau de Laclos et al., 1997; De Baere and Boelens, 1999; Levasseur, 1999). The heavy inert materials such as stones and glass which pass the screens or shredder need not be removed from the waste stream as is the case in wet systems. This makes the pre-treatment of dry systems somewhat simpler than that of their wet counterparts and very attractive for the treatment of OFMSW which can contain up to 25% by weight of heavy inerts (Vandevivere et al., 2003). Due to their high viscosity, the fermenting wastes move via plug flow inside the digesters, contrary to wet systems where completely mixed digesters are usually used. Therefore heat and nutrient transfer and homogeneity in dry AD systems is less efficient than in wet AD systems. Plug flow operations need specialised mixing arrangements, as mixing the incoming wastes with the fermenting biomass is crucial to guarantee adequate inoculation and to prevent localised overloading and acidification. In the Dranco process, the mixing occurs via re-circulation of the wastes extracted at the bottom end, mixing with fresh wastes (one part fresh wastes for six parts digested wastes), and pumping to the top of the digester. This simple design has been shown effective for the treatment of wastes ranging from 20 to 50% TS. The Kompogas process (and some Linde processes) work similarly, except that the plug flow takes place horizontally in cylindrical reactors. The horizontal plug flow is aided by slowly-rotating impellers inside the reactors, which also serve for homogenization, de-gassing, and re-suspending heavier particles. This system requires careful adjustment of the solid content around 23% TS inside the reactor. At lower values, heavy particles such as sand and glass tend to sink and accumulate inside the reactor while higher TS values cause excessive resistance to the flow (Vandevivere et al., 2003). The Valorga system differs in that the horizontal plug flow is circular in a cylindrical reactor, where mixing occurs periodically via
Anaerobic Digestion of Biodegradable Municipal Wastes: A Review __________________________________________________________________________
_______________________________________________________________________
129
biogas injection at high pressure at the bottom of the reactor through a network of injectors (Fruteau de Laclos et al., 1997). This pneumatic mixing mode seems to work well since the digested wastes leaving the reactor need not be re-circulated to dilute the incoming wastes. One technical drawback of this mixing design is that gas injection ports can potentially become clogged and maintenance can be cumbersome (Vandevivere et al., 2003). As in the Kompogas process, process water is re-circulated in order to achieve a solid content of 30% TS inside the digester. Dry systems use considerably less water as part of the process than wet systems. This in turn leads to lower energy requirements for in-plant needs, because less energy is needed for heating process water, and for de-watering AD digestate. Comparing wet and dry AD processes energetically, RIS (2005) concluded that dry AD processes seem favourable, with more energy available for export. Dry AD technologies appear to use 20 – 30% of the energy produced on-site for internal requirements, leaving 70 – 80% of the energy produced for export (RIS, 2005). In contrast, wet AD technologies appear to use more energy (up to 50% reported) for internal operations, with about 50% is available for export, although they state that reported values were inconsistent from one wet technology to another. As mentioned above, a major advantage of the single stage dry system is that it can more readily handle contaminants (i.e. stones, glass, plastic, metals) in the process compared to wet systems. The sturdiness of the 'dry' systems toward inhibition was documented by Oleszkiewicz and Poggi-Varaldo (1997). Six and De Baere (1992) reported that no ammonium inhibition occurred in the thermophilic Dranco process for wastes having C:N ratios larger than 20. A possible explanation is that micro-organisms within a dry fermenting medium are better shielded against toxicants since the absence of full mixing within the digester limits the temporary shock loads to restricted zones in the digester, leaving other zones little exposed to transient high levels of inhibitors. Although the same threshold value was noted by Weiland (1992) for mesophilic 'wet' systems. More research comparing the susceptibility of each type of digestion system to inhibition would be welcome, although both wet and dry AD systems have consistently been shown to operate well on both BMW and OFMSW. Laboratory scale studies on dry AD of paper, kitchen waste and sewage sludge demonstrated that the optimum digester performance was at 30 – 35% TS (Olezkiewicz and Poggi-Varaldo, 1997). In batch experiments it has been found that methane gas productivity increased with decreasing total solids content (from 45% to 25% TS). This is rational, as despite there being less TS, and therefore less organic solids to digest, digestion efficiency would have been improved by the increased bacteria/waste contact in the liquid medium. In dry digestion, although there is more organic matter on which to potentially feed, the anaerobic bacteria have a more limited access to it. The adding of liquid, and the mixing of this liquid, should improve waste/biomass contact. A maximum total solids level of 36% has been recommended for stable mesophilic anaerobic digestion of the organic fraction of MSW in a system with mechanical mixing and optimum environmental conditions (IWM AD Working Group, 2005). Another possible advantage of dry systems is that the plug flow in some digester designs can (under thermophilic conditions) guarantee the complete hygienisation of the wastes and a pathogen-free compost as an end-product (Baeten and Verstraete, 1993). In the UK, both wet and dry AD systems would need to meet the UK ABPR temperature and time requirements. Although these are identical whether digestion is wet or dry, the plug flow
Anaerobic Digestion of Biodegradable Municipal Wastes: A Review __________________________________________________________________________
_______________________________________________________________________
130
nature of some dry AD processes (at thermophilic temperatures) could guarantee a temperature of over 57oC for a minimum of 5 hours. In summary, both wet and dry AD processes can successfully treat BMW or OFMSW. Low solids processes have shorter retention times, but may need larger tank volumes to cope with the same organic waste, due to the extra volume requirements required to accommodate the water added to the process. From a financial viewpoint, the wet and dry designs are comparable, as dry designs require smaller reactor volumes but more expensive equipment. From a technical viewpoint, however, the 'dry' systems appear more robust as frequent technical failures are reported with 'wet' systems due to sand, stones, plastics and wood (Vandevivere et al., 2003). These technical failures can be avoided to a large extent by the addition of a more complex mechanical pre-treatment stage, and the engineering of mechanisms to remove floating and sedimentary layers into wet anaerobic digesters. The economical differences between the wet and dry systems are small, both in terms of investment and operational costs (Vandevivere et al., 2003). The higher costs for the sturdy waste handling devices such as pumps, screws and valves required for dry systems are compensated by a cheaper pre-treatment and reactor, the latter being several times smaller than for wet systems. The smaller heat requirement of dry systems does not usually translate to financial gain since the excess heat from gas motors is rarely sold to nearby industries. RIS (2005) estimated that more energy was exportable from dry AD technologies than from wet digestion systems.
2.7.3 Single step/multi-step digestion Although environmental conditions exist in which all the anaerobic trophic groups can function (these are the conditions maintained in single stage digesters), different anaerobic trophic groups perform better in different environmental conditions. This is the key concept behind two (or multi) stage digesters, where digestion is separated into stages. Therefore the optimum environmental conditions for each bacterial group can be provided, without having an adverse effect on the other groups. Optimising these reactions in different stages or digesters can lead to a faster overall reaction rate and a larger biogas yield (Ghosh et al., 2000). Single stage systems can come in many designs, including continuously stirred tank reactor (CSTR) and plug-flow digesters, each with different modes of operation and differences in design and operation. Generally, single stage systems are simpler than two-stage systems, and cheaper to construct and operate. While it is true that two-stage systems can offer more protection to the methanogenic population, this is not to say that single stage systems are unreliable. The methanogenic bacterial population can be protected in single stage systems by a precisely controlled feeding rate, by thorough mixing of incoming wastes to avoid peak concentrations of potentially harmful contaminants, by co-digestion with other organic wastes to provide natural buffering or by the addition of a buffer. In multi stage systems two digestion stages are normally used. In the first, hydrolysis and acidification (and some degree of acetogenesis) take place, and in the second stage the main biological process is methanogenesis, with some degree of acetogenesis also occurring. In the first stage, hydrolysis of cellulose is normally the rate-limiting step (Noike et al., 1985). As discussed in Section 2.4.1 and 2.4.1.3, the methanogenic bacteria are recognised as the most easily disturbed bacterial group, with a smaller range of tolerated environmental conditions, and different optimum conditions. Methanogenic bacteria also have the longest
Anaerobic Digestion of Biodegradable Municipal Wastes: A Review __________________________________________________________________________
_______________________________________________________________________
131
doubling time of all the bacterial groups involved in AD. This slow microbial growth rate is reported to be the rate limiting step in the second stage (Liu and Ghosh, 1997; Palmowski and Muller, 1999). It is with the cultivation and welfare of these methanogenic bacteria in mind that multi stage systems are considered. As well as providing optimal environmental conditions in the second stage, some kind of biomass retention scheme is often designed, in order to keep as many active, well adapted methanogens in the digester as possible, rather than passing them out with the effluent (Weiland, 1992). It has been suggested that the main advantage of two-stage systems is that they can provide a greater biological stability, particularly in the treatment of wastes that may cause unstable performance in one-stage systems (for example, wastes with a fluctuating content or load, or sometimes containing inhibitory substances). This makes sense, as the sensitive methanogenic population is given an extra layer of protection (in the form of the first digestion stage) from potential causes of instability in the influent. The greater biogas yields and reaction rates that two-stage systems supposedly provide has not always been apparent in industrial systems (Weiland, 1992). This could be due in some way to design problems which have since been engineered out by suppliers. Another possible explanation is operator inexperience. It is likely that reactor efficiency and design has improved in the subsequent years with the hard-won benefits of experience. Also, as operators gain more experience, they can ‘fine-tune’ their systems to optimise performance. Most full scale multi-stage processes have a second stage that involves the retention of biomass, although it is possible to employ two-stage system designs that resemble two completely mixed reactors in series, or two plug-flow reactors in series. The arguments of Vandevivere et al. (2003) suggest that there is little advantage in two-stage systems that do not retain biomass in the second stage, as one stage systems can perform equally well in terms of biological stability, biogas yield and maximum possible OLR. With regards to single stage systems being just as good as two-stage systems without biomass retention in the second stage in terms of biological stability, reasons given include that for the majority of wastes, the hydrolysis of cellulose is the rate-limiting step, rather than the methanogenesis (Noike et al., 1985), and therefore a shock load would not lead to a potentially inhibitory VFA build-up in a single stage system. Increasing the density of slowly growing methanogenic bacteria in the second stage can increase the rates of methanogenesis (more methanogens = more methanogenic activity) and the resistance to shock loads or inhibitory substances. Methanogens can be retained to form higher cell densities in two ways. The first is to raise the solids retention time in the digester by separating hydraulic retention time from solids retention time. One way to do this is to employ upflow systems, where the waste flows upwards, through a layer or ‘bed’ of bacteria, and exits at the top of the reactor. The liquid waste exits at the top, while the heavier sludge layer (containing high concentrations of bacteria) is retained (by gravity) towards the bottom of the reactor. Another way is to filter the effluent from the second stage and re-introduce the solids to the reactor (Madokoro et al., 1999). The second way to retain biomass is to design a reactor with ‘support material’, which allows attached bacterial growth and thus retained biomass. This extra biomass retention provides more efficient biological operation per unit volume of reactor, and greater resistance to potentially inhibitory substances. The disadvantages of multi-stage systems are that they are often more complex, and usually more expensive than single stage AD systems. It should be remembered that with BMW/OFMSW, some of the early stages of AD (hydrolysis, acidogenesis) may have already been carried out naturally in the bins/containers, in the collection vehicles and in the storage/mixing tanks. This is especially
Anaerobic Digestion of Biodegradable Municipal Wastes: A Review __________________________________________________________________________
_______________________________________________________________________
132
the case in the Summer, when ambient temperatures are higher, and in cases where the waste is not collected immediately (e.g. fortnightly collection). Cecchi et al. (1992) verified that the proportion of OFMSW converted to acetate prior to digestion in the Summer months had a marked effect on the digester, in terms of the process kinetics of substrate utilisation. Therefore, in some cases, particularly with easily digestible wastes, a first stage may not be necessary, or, may be substituted with a storage or mixing tank. Certainly, a two-stage system may be more applicable for the harder to digest contents of bio-waste. A two-stage system based on aerobic percolation followed by anaerobic digestion to treat centrally separated OFMSW has recently been developed. In the percolation stage the OFMSW hot water and steam are added to the waste, which is then aerated in a closed, continuously stirred vessel. Hydrolytic bacteria form soluble compounds from the solid organic material, which are washed out by recycled water. In a second step, the dissolved organic compounds are anaerobically digested in a high rate industrial wastewater digester. The solid fraction of the OFMSW is in-vessel composted (or biodried) and landfilled. Examples of this type of system can be observed in the Buchen, Heilbronn and ZAK Ringsheim case studies in Sections 5.2.1, 5.2.2 and 5.2.7 respectively. In summary, single stage systems, are simpler and cheaper to build and to run. Two (or multi) stage systems can potentially improve throughput times and biogas yields by providing optimum conditions for the different trophic groups in separate reactors. They can also provide extra protection for the methanogenic population, but are also more complex, and cost more to construct and to operate. Up to 1999, around 90% of anaerobic reactors treating BMW/OFMSW were single stage systems (De Baere, 1999).
2.7.4 Batch or continuous feeding
In batch systems, digesters are filled once with fresh wastes with a high total solids content, with or without addition of seed material, with or without mixing, and left for a given period to degrade anaerobically. Although batch systems may appear as nothing more than a landfill-in-a-box, they in fact achieve 50 to 100 fold higher biogas production rates than those observed in landfills because of two basic features. The first is that the leachate is continuously re-circulated, which allows the dispersion of inoculant, nutrients, and acids, and in fact is the equivalent of partial mixing. The second is that batch systems are run at higher temperatures than that normally observed in landfills. Biogas yield has been observed to be approximately 40% smaller than that obtained in continuously-fed one-stage systems treating the same type of waste (Saint-Joly et al., 1999; De Baere, 1999). This low yield is the result of leachate channelling, i.e. the lack of uniform spreading of the leachate which invariably tends to flow along preferential paths. Batch fed systems are the lowest end of technology of all AD systems and also the cheapest. Their major drawbacks are that they have a longer retention time than continuously fed systems, a large footprint and a lower biogas yield, as inefficient mixing usually results in channelling and clogging (Vandevivere et al., 2003). Because batch systems are technically simple, the investment costs are significantly (~40%) less than those of continuously-fed systems (ten Brummeler, 1992). The land area required by batch processes is considerably larger than that for continuously-fed 'dry' systems, since the height of batch reactors is about five-fold less and their OLR two-fold less, resulting in a ten-fold larger required footprint per tonne treated wastes. Operational costs of batch fed digestion systems seem comparable to those of continuously fed systems (ten Brummeler, 1992). Presently, the uptake of batch systems has not taken off, although the Lelystadt plant in the Netherlands operates a Biocel batch
Anaerobic Digestion of Biodegradable Municipal Wastes: A Review __________________________________________________________________________
_______________________________________________________________________
133
digestion process (further described in ten Brummeler, 2000). Pasteurisation/hygienisation requirements as well as safety requirements will make these systems more difficult to introduce, although their lower investment costs may make them attractive options in developing nations (Vandevivere et al., 2003). Continuously fed systems make up the vast majority of systems treating BMW or OFMSW, although many use a semi-continuous feeding regime, where a certain volume of waste is added to the digester at a given time interval. For example, the Valorga digester at Mons (Belgium) is fed in the mornings, and other digestion systems are batch-fed hourly. In these systems, the distinction between continuous feeding and batch feeding can become ambiguous. Others digesters are continuously fed for five or six days per week, and then ‘rested’ for a portion of the weekend. Feeding regimes are different for each digestion system and each individual waste stream. Optimal feeding regimes for anaerobic digesters are still a highly debated subject, with experienced AD plant managers often disagreeing on the optimal feeding patterns (Christiansen, Personal Communication, 2006). The size of commercial scale digesters and the margins at which they operate mean that testing and optimisation of the process is difficult, once they have been fully commissioned. Therefore, there is little data published on the subject, other than academic laboratory-based studies which are very case specific, with results differing from digester to digester and from waste stream to waste stream, and therefore difficult to compare and generalise. The process suppliers themselves, having tested and optimised their systems over the years of development and operation, are in the best position to recommend the optimal feeding regime for their particular processes. Aside from the four classifications discussed above, the type of mixing is also of great importance in digester design. As described in Section 2.4.2.11, efficient mixing is essential to ensure dispersion of the feed through the digestion vessel. Good mixing also enhances the reliability of the process by ensuring a good and even contact between waste and bacteria. It also ensures a good heat and nutrient transfer and a uniform temperature throughout the digester. Isolated pockets, dead zones and scum layers in the reactor can also be prevented by effective mixing, depending on the digester type. Some digestion systems are described in more detail below. An assessment of the advantages and disadvantages of the different system types is shown in Table 28. Many companies now offer several versions of one technology, often treating either centrally separated OFMSW or other organic wastes. Many companies also supply many different AD systems, and adapt the specific engineering to meet the specific requirements of the waste stream. At present and most likely, this will remain the case in the future, as it is not possible to single out specific processes as all-round ‘best performers’ and optimally suited under all circumstances. Many variables have to be taken into consideration and a final evaluation for a specific site will need to be made. There is and will continue to be room for technical diversity in this domain of waste treatment (Eunomia, 2004). For this reason, any feasibility study which seeks to recommend specific technologies is likely to be confronted with significant difficulties in the absence of an exact specification of the situation being addressed, including everything from the collection system used, the materials available for co-digestion, the desired end-product and the locally available infrastructure, which can all have an effect on the most practical treatment method (Eunomia, 2004).
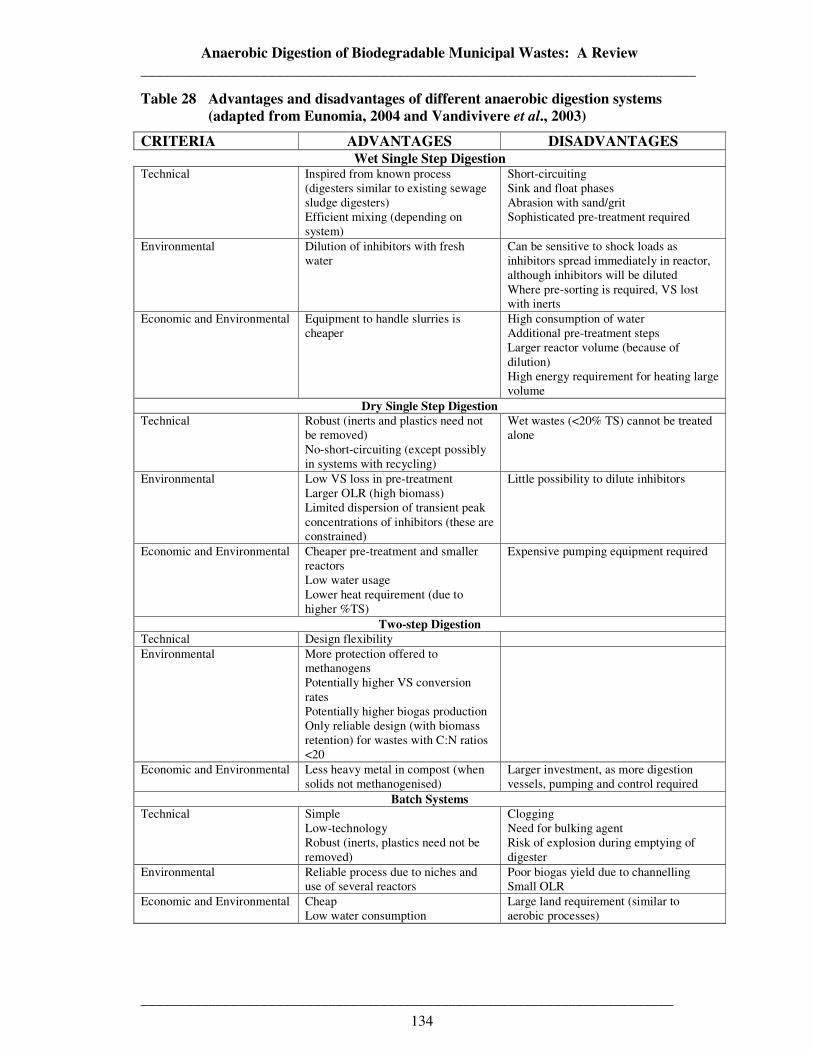
Anaerobic Digestion of Biodegradable Municipal Wastes: A Review __________________________________________________________________________
_______________________________________________________________________
134
Table 28 Advantages and disadvantages of different anaerobic digestion systems (adapted from Eunomia, 2004 and Vandivivere et al., 2003)
CRITERIA ADVANTAGES DISADVANTAGES Wet Single Step Digestion
Technical Inspired from known process (digesters similar to existing sewage sludge digesters) Efficient mixing (depending on system)
Short-circuiting Sink and float phases Abrasion with sand/grit Sophisticated pre-treatment required
Environmental Dilution of inhibitors with fresh water
Can be sensitive to shock loads as inhibitors spread immediately in reactor, although inhibitors will be diluted Where pre-sorting is required, VS lost with inerts
Economic and Environmental Equipment to handle slurries is cheaper
High consumption of water Additional pre-treatment steps Larger reactor volume (because of dilution) High energy requirement for heating large volume
Dry Single Step Digestion Technical Robust (inerts and plastics need not
be removed) No-short-circuiting (except possibly in systems with recycling)
Wet wastes (<20% TS) cannot be treated alone
Environmental Low VS loss in pre-treatment Larger OLR (high biomass) Limited dispersion of transient peak concentrations of inhibitors (these are constrained)
Little possibility to dilute inhibitors
Economic and Environmental Cheaper pre-treatment and smaller reactors Low water usage Lower heat requirement (due to higher %TS)
Expensive pumping equipment required
Two-step Digestion Technical Design flexibility Environmental More protection offered to
methanogens Potentially higher VS conversion rates Potentially higher biogas production Only reliable design (with biomass retention) for wastes with C:N ratios <20
Economic and Environmental Less heavy metal in compost (when solids not methanogenised)
Larger investment, as more digestion vessels, pumping and control required
Batch Systems Technical Simple
Low-technology Robust (inerts, plastics need not be removed)
Clogging Need for bulking agent Risk of explosion during emptying of digester
Environmental Reliable process due to niches and use of several reactors
Poor biogas yield due to channelling Small OLR
Economic and Environmental Cheap Low water consumption
Large land requirement (similar to aerobic processes)
Anaerobic Digestion of Biodegradable Municipal Wastes: A Review __________________________________________________________________________
_______________________________________________________________________
135
Initial scepticism towards the use of AD to treat BMW and OFMSW, mainly caused by the high capital costs, lack of reliable reference sites, and some teething problems at certain sites has been replaced by a general acceptance of the technology as best practice. This acceptance is backed up by the fact that various digester types are functioning at industrial scale in a reliable manner. Recent interest has further heightened because of landfill diversion requirements, climate change concerns and increasing fossil fuel prices. This is illustrated by the growth in installed capacity over recent years (Figure 21). Given the energetic advantages of AD over its main competitor (in-vessel composting) this growth in installed capacity looks set to continue in the coming years, particularly as fossil fuel prices continue to rise. It is likely that in the future digester designs will be improved and matched to more specific substrates, which should provide far more reliable plants (Vandivevere et
al., 2003).
2.8 Other Essential Parts of Anaerobic Digestion Systems Treating Biodegradable Municipal Wastes
The aim of the project was to review the anaerobic digestion of biodegradable municipal wastes, and the various anaerobic digester options and designs to treat municipal organic wastes. This has been discussed in Section 2.7. However, to fully consider the anaerobic digestion of BMW or OFMSW, one must realise that the anaerobic digester is one component in a waste treatment plant, which is a ‘system’ comprising of an assembly of different technologies. To function as intended, the ‘system’ may have many individual components, including:
• Pre-treatment
• Mechanical pre-treatment • Pasteurisation/hygienisation • Mixing/buffer/storage tanks
• Anaerobic digestion
• Post AD treatment
• Digestate de-watering • Wastewater treatment • Composting • Pasteurisation/hygienisation (if not performed earlier in the process) • Possible thermal treatments
• Biogas de-sulphurisation
• Biogas utilisation
• Exhaust gas treatment/odour control Each of these components (usually supplied by different companies) must be successfully integrated to form one smoothly operating system. A basic overview of these components is included below. It must be noted that there are a large number of possible systems, with a large number of possible component technologies. Pre-treatment, post-treatment, de-watering, water treatment, biogas upgrading, biogas utilisation, odour control and exhaust gas treatment options are all waste management issues in their own right and to discuss all
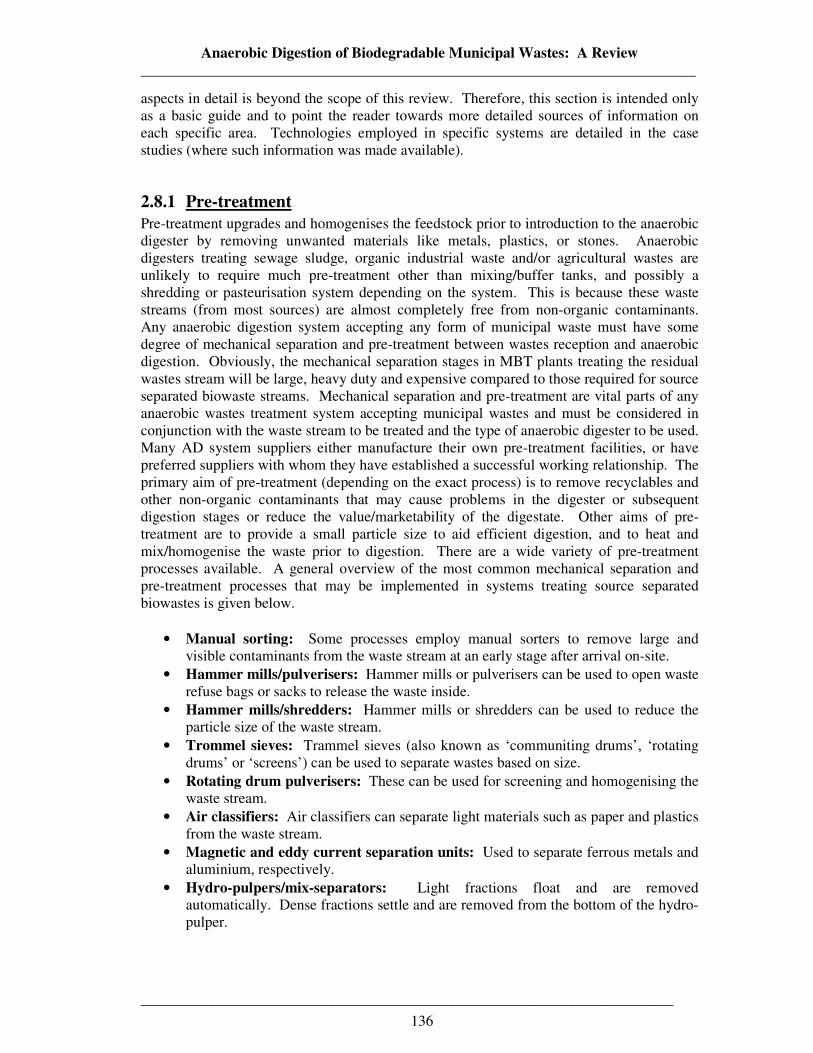
Anaerobic Digestion of Biodegradable Municipal Wastes: A Review __________________________________________________________________________
_______________________________________________________________________
136
aspects in detail is beyond the scope of this review. Therefore, this section is intended only as a basic guide and to point the reader towards more detailed sources of information on each specific area. Technologies employed in specific systems are detailed in the case studies (where such information was made available).
2.8.1 Pre-treatment
Pre-treatment upgrades and homogenises the feedstock prior to introduction to the anaerobic digester by removing unwanted materials like metals, plastics, or stones. Anaerobic digesters treating sewage sludge, organic industrial waste and/or agricultural wastes are unlikely to require much pre-treatment other than mixing/buffer tanks, and possibly a shredding or pasteurisation system depending on the system. This is because these waste streams (from most sources) are almost completely free from non-organic contaminants. Any anaerobic digestion system accepting any form of municipal waste must have some degree of mechanical separation and pre-treatment between wastes reception and anaerobic digestion. Obviously, the mechanical separation stages in MBT plants treating the residual wastes stream will be large, heavy duty and expensive compared to those required for source separated biowaste streams. Mechanical separation and pre-treatment are vital parts of any anaerobic wastes treatment system accepting municipal wastes and must be considered in conjunction with the waste stream to be treated and the type of anaerobic digester to be used. Many AD system suppliers either manufacture their own pre-treatment facilities, or have preferred suppliers with whom they have established a successful working relationship. The primary aim of pre-treatment (depending on the exact process) is to remove recyclables and other non-organic contaminants that may cause problems in the digester or subsequent digestion stages or reduce the value/marketability of the digestate. Other aims of pre-treatment are to provide a small particle size to aid efficient digestion, and to heat and mix/homogenise the waste prior to digestion. There are a wide variety of pre-treatment processes available. A general overview of the most common mechanical separation and pre-treatment processes that may be implemented in systems treating source separated biowastes is given below.
• Manual sorting: Some processes employ manual sorters to remove large and visible contaminants from the waste stream at an early stage after arrival on-site.
• Hammer mills/pulverisers: Hammer mills or pulverisers can be used to open waste refuse bags or sacks to release the waste inside.
• Hammer mills/shredders: Hammer mills or shredders can be used to reduce the particle size of the waste stream.
• Trommel sieves: Trammel sieves (also known as ‘communiting drums’, ‘rotating drums’ or ‘screens’) can be used to separate wastes based on size.
• Rotating drum pulverisers: These can be used for screening and homogenising the waste stream.
• Air classifiers: Air classifiers can separate light materials such as paper and plastics from the waste stream.
• Magnetic and eddy current separation units: Used to separate ferrous metals and aluminium, respectively.
• Hydro-pulpers/mix-separators: Light fractions float and are removed automatically. Dense fractions settle and are removed from the bottom of the hydro-pulper.
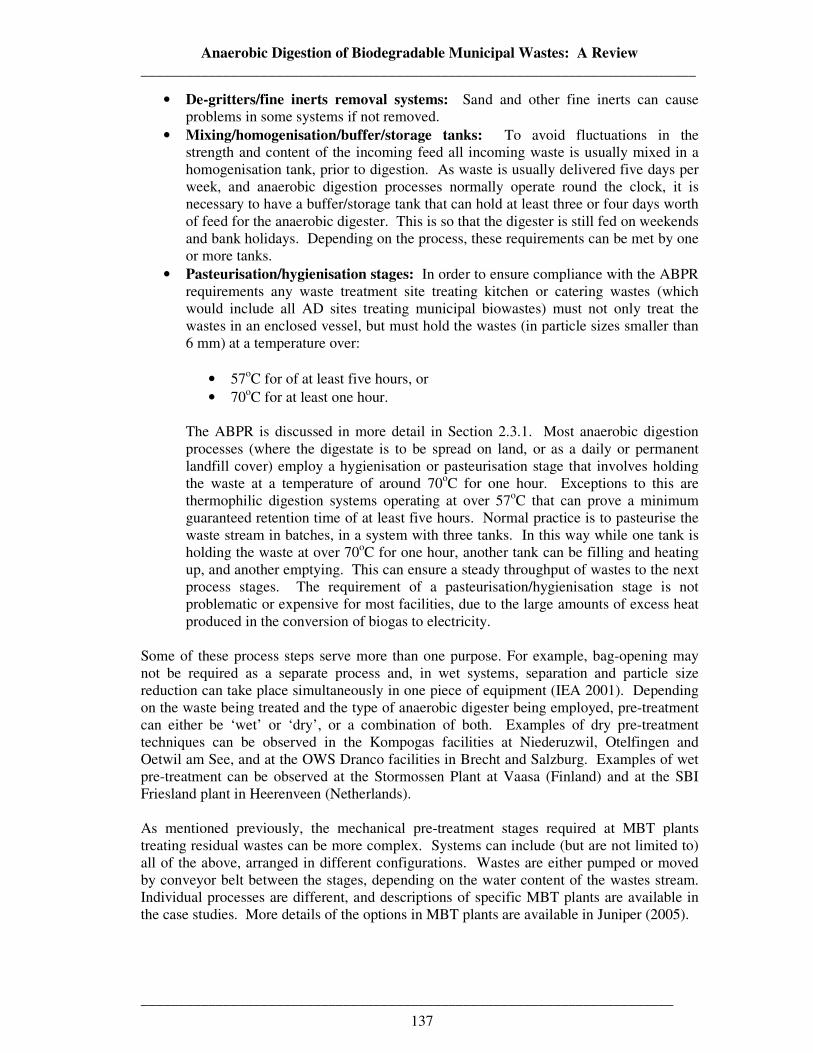
Anaerobic Digestion of Biodegradable Municipal Wastes: A Review __________________________________________________________________________
_______________________________________________________________________
137
• De-gritters/fine inerts removal systems: Sand and other fine inerts can cause problems in some systems if not removed.
• Mixing/homogenisation/buffer/storage tanks: To avoid fluctuations in the strength and content of the incoming feed all incoming waste is usually mixed in a homogenisation tank, prior to digestion. As waste is usually delivered five days per week, and anaerobic digestion processes normally operate round the clock, it is necessary to have a buffer/storage tank that can hold at least three or four days worth of feed for the anaerobic digester. This is so that the digester is still fed on weekends and bank holidays. Depending on the process, these requirements can be met by one or more tanks.
• Pasteurisation/hygienisation stages: In order to ensure compliance with the ABPR requirements any waste treatment site treating kitchen or catering wastes (which would include all AD sites treating municipal biowastes) must not only treat the wastes in an enclosed vessel, but must hold the wastes (in particle sizes smaller than 6 mm) at a temperature over:
• 57oC for of at least five hours, or • 70oC for at least one hour.
The ABPR is discussed in more detail in Section 2.3.1. Most anaerobic digestion processes (where the digestate is to be spread on land, or as a daily or permanent landfill cover) employ a hygienisation or pasteurisation stage that involves holding the waste at a temperature of around 70oC for one hour. Exceptions to this are thermophilic digestion systems operating at over 57oC that can prove a minimum guaranteed retention time of at least five hours. Normal practice is to pasteurise the waste stream in batches, in a system with three tanks. In this way while one tank is holding the waste at over 70oC for one hour, another tank can be filling and heating up, and another emptying. This can ensure a steady throughput of wastes to the next process stages. The requirement of a pasteurisation/hygienisation stage is not problematic or expensive for most facilities, due to the large amounts of excess heat produced in the conversion of biogas to electricity.
Some of these process steps serve more than one purpose. For example, bag-opening may not be required as a separate process and, in wet systems, separation and particle size reduction can take place simultaneously in one piece of equipment (IEA 2001). Depending on the waste being treated and the type of anaerobic digester being employed, pre-treatment can either be ‘wet’ or ‘dry’, or a combination of both. Examples of dry pre-treatment techniques can be observed in the Kompogas facilities at Niederuzwil, Otelfingen and Oetwil am See, and at the OWS Dranco facilities in Brecht and Salzburg. Examples of wet pre-treatment can be observed at the Stormossen Plant at Vaasa (Finland) and at the SBI Friesland plant in Heerenveen (Netherlands). As mentioned previously, the mechanical pre-treatment stages required at MBT plants treating residual wastes can be more complex. Systems can include (but are not limited to) all of the above, arranged in different configurations. Wastes are either pumped or moved by conveyor belt between the stages, depending on the water content of the wastes stream. Individual processes are different, and descriptions of specific MBT plants are available in the case studies. More details of the options in MBT plants are available in Juniper (2005).
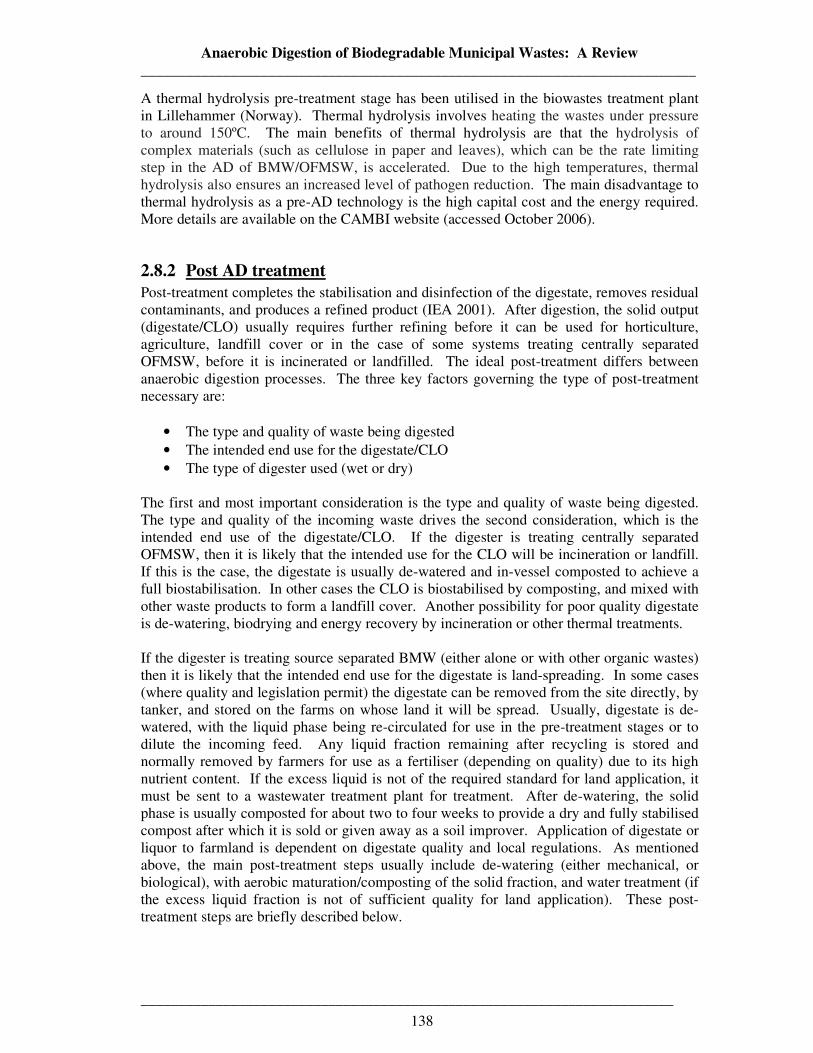
Anaerobic Digestion of Biodegradable Municipal Wastes: A Review __________________________________________________________________________
_______________________________________________________________________
138
A thermal hydrolysis pre-treatment stage has been utilised in the biowastes treatment plant in Lillehammer (Norway). Thermal hydrolysis involves heating the wastes under pressure to around 150ºC. The main benefits of thermal hydrolysis are that the hydrolysis of complex materials (such as cellulose in paper and leaves), which can be the rate limiting step in the AD of BMW/OFMSW, is accelerated. Due to the high temperatures, thermal hydrolysis also ensures an increased level of pathogen reduction. The main disadvantage to thermal hydrolysis as a pre-AD technology is the high capital cost and the energy required. More details are available on the CAMBI website (accessed October 2006).
2.8.2 Post AD treatment
Post-treatment completes the stabilisation and disinfection of the digestate, removes residual contaminants, and produces a refined product (IEA 2001). After digestion, the solid output (digestate/CLO) usually requires further refining before it can be used for horticulture, agriculture, landfill cover or in the case of some systems treating centrally separated OFMSW, before it is incinerated or landfilled. The ideal post-treatment differs between anaerobic digestion processes. The three key factors governing the type of post-treatment necessary are:
• The type and quality of waste being digested • The intended end use for the digestate/CLO • The type of digester used (wet or dry)
The first and most important consideration is the type and quality of waste being digested. The type and quality of the incoming waste drives the second consideration, which is the intended end use of the digestate/CLO. If the digester is treating centrally separated OFMSW, then it is likely that the intended use for the CLO will be incineration or landfill. If this is the case, the digestate is usually de-watered and in-vessel composted to achieve a full biostabilisation. In other cases the CLO is biostabilised by composting, and mixed with other waste products to form a landfill cover. Another possibility for poor quality digestate is de-watering, biodrying and energy recovery by incineration or other thermal treatments. If the digester is treating source separated BMW (either alone or with other organic wastes) then it is likely that the intended end use for the digestate is land-spreading. In some cases (where quality and legislation permit) the digestate can be removed from the site directly, by tanker, and stored on the farms on whose land it will be spread. Usually, digestate is de-watered, with the liquid phase being re-circulated for use in the pre-treatment stages or to dilute the incoming feed. Any liquid fraction remaining after recycling is stored and normally removed by farmers for use as a fertiliser (depending on quality) due to its high nutrient content. If the excess liquid is not of the required standard for land application, it must be sent to a wastewater treatment plant for treatment. After de-watering, the solid phase is usually composted for about two to four weeks to provide a dry and fully stabilised compost after which it is sold or given away as a soil improver. Application of digestate or liquor to farmland is dependent on digestate quality and local regulations. As mentioned above, the main post-treatment steps usually include de-watering (either mechanical, or biological), with aerobic maturation/composting of the solid fraction, and water treatment (if the excess liquid fraction is not of sufficient quality for land application). These post-treatment steps are briefly described below.
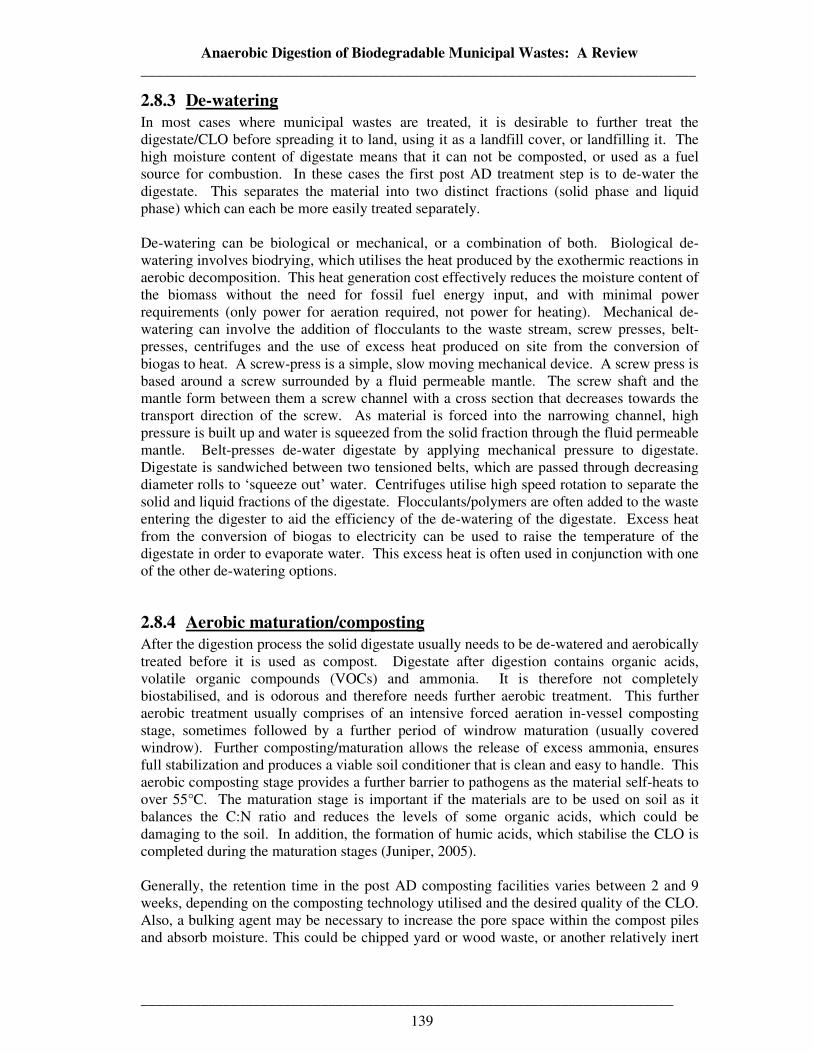
Anaerobic Digestion of Biodegradable Municipal Wastes: A Review __________________________________________________________________________
_______________________________________________________________________
139
2.8.3 De-watering In most cases where municipal wastes are treated, it is desirable to further treat the digestate/CLO before spreading it to land, using it as a landfill cover, or landfilling it. The high moisture content of digestate means that it can not be composted, or used as a fuel source for combustion. In these cases the first post AD treatment step is to de-water the digestate. This separates the material into two distinct fractions (solid phase and liquid phase) which can each be more easily treated separately. De-watering can be biological or mechanical, or a combination of both. Biological de-watering involves biodrying, which utilises the heat produced by the exothermic reactions in aerobic decomposition. This heat generation cost effectively reduces the moisture content of the biomass without the need for fossil fuel energy input, and with minimal power requirements (only power for aeration required, not power for heating). Mechanical de-watering can involve the addition of flocculants to the waste stream, screw presses, belt-presses, centrifuges and the use of excess heat produced on site from the conversion of biogas to heat. A screw-press is a simple, slow moving mechanical device. A screw press is based around a screw surrounded by a fluid permeable mantle. The screw shaft and the mantle form between them a screw channel with a cross section that decreases towards the transport direction of the screw. As material is forced into the narrowing channel, high pressure is built up and water is squeezed from the solid fraction through the fluid permeable mantle. Belt-presses de-water digestate by applying mechanical pressure to digestate. Digestate is sandwiched between two tensioned belts, which are passed through decreasing diameter rolls to ‘squeeze out’ water. Centrifuges utilise high speed rotation to separate the solid and liquid fractions of the digestate. Flocculants/polymers are often added to the waste entering the digester to aid the efficiency of the de-watering of the digestate. Excess heat from the conversion of biogas to electricity can be used to raise the temperature of the digestate in order to evaporate water. This excess heat is often used in conjunction with one of the other de-watering options.
2.8.4 Aerobic maturation/composting After the digestion process the solid digestate usually needs to be de-watered and aerobically treated before it is used as compost. Digestate after digestion contains organic acids, volatile organic compounds (VOCs) and ammonia. It is therefore not completely biostabilised, and is odorous and therefore needs further aerobic treatment. This further aerobic treatment usually comprises of an intensive forced aeration in-vessel composting stage, sometimes followed by a further period of windrow maturation (usually covered windrow). Further composting/maturation allows the release of excess ammonia, ensures full stabilization and produces a viable soil conditioner that is clean and easy to handle. This aerobic composting stage provides a further barrier to pathogens as the material self-heats to over 55°C. The maturation stage is important if the materials are to be used on soil as it balances the C:N ratio and reduces the levels of some organic acids, which could be damaging to the soil. In addition, the formation of humic acids, which stabilise the CLO is completed during the maturation stages (Juniper, 2005). Generally, the retention time in the post AD composting facilities varies between 2 and 9 weeks, depending on the composting technology utilised and the desired quality of the CLO. Also, a bulking agent may be necessary to increase the pore space within the compost piles and absorb moisture. This could be chipped yard or wood waste, or another relatively inert
Anaerobic Digestion of Biodegradable Municipal Wastes: A Review __________________________________________________________________________
_______________________________________________________________________
140
organic material. It would be added to make up approximately 20% by mass of the composting material. In processes that are designed to biostabilise the waste for landfilling, the operating conditions are closely controlled to optimise pH, temperature, moisture and the supply of oxygen to the waste in the first 3 or 4 weeks. This initial period is often referred to as ‘intensive composting’. After this period a further 3 - 4 weeks of compost stabilisation (or maturation) is conducted that has comparatively little or no process controls. In many cases compost is passed through further physical separation stages after maturation. The post refining stage is important in removing visual contamination from the CLO, producing a CLO that will be more attractive to end users. There is currently no UK standard to determine when an output has had its biodegradability sufficiently reduced to be deemed as ‘bio-stabilised’. Standards exist in some other EU countries including Germany, Austria and Italy. In these countries, bio stability is determined by the respiration activity of the output from the process. More details are available in Juniper (2005).
2.8.5 Wastewater treatment
Process liquor can have high suspended solids, a high COD and high concentrations of nitrogen and phosphorous. Heavy metals and other contaminants may also be present depending on the incoming wastes. Process liquor that can not be used on agricultural land or recycled on-site is a wastewater, and must be treated. Most sites build their own wastewater treatment plant as part of the project. A packaged wastewater treatment process consisting of a clarifier and aeration tank, or alternatively a packaged rotating biological contactor (RBC) could be installed (RIS, 2005) to treat wastewater to within the local sewer discharge consents. Other smaller sites that produce less wastewater discharge straight to sewer if the effluent meets local sewer discharge requirements. Some sites also make use of existing wastewater treatment plants, perhaps treating landfill leach ate or wastewater from another wastes treatment facility nearby. The ideal wastewater treatment option will be dependent on the quantity and content of the wastewater that the plant produces, which will be dependent on the content of the wastes that the digestion plant is treating and the type of digestion system used. The ideal wastewater treatment option will also depend on the availability and costs of existing local and municipal wastewater treatment facilities, and local legislation.
2.8.6 Biogas de-sulphurisation
Because hydrogen sulphide is highly corrosive to gas engines, it is always removed prior to biogas utilisation. Biogas de-sulphurisation is discussed in Section 2.6.1.4.
2.8.7 Biogas utilisation Biogas is usually converted to electricity and heat in gas engines. It can also be upgraded and used as a vehicle fuel. The various options for biogas utilisation are discussed in Section 2.6.1.5. Further information is available in Reith et al. (2005) and IEA Bioenergy, Task 24 (1999). Further information on the upgrading required to use the biogas as a vehicle fuel is available in the Västerås, Jonkoping and Linkoping case studies, in NSCA (2006) and in Jonsson (2005).
Anaerobic Digestion of Biodegradable Municipal Wastes: A Review __________________________________________________________________________
_______________________________________________________________________
141
2.8.8 Exhaust gas treatment/odour control In AD or MBT plants, exhaust gases from the wastes reception area, the mechanical pre-treatment areas, the post AD composting areas and other odorous areas are treated prior to being released to atmosphere. In many plants these areas are enclosed, and kept at a negative pressure to eliminate odour escape. In these enclosed areas, fresh air is usually re-circulated to improve the working conditions of those inside. Exhaust gases are treated to minimise odour, bio-aerosol and VOC emissions and to comply with legislation. The extent of the exhaust gas treatment required is dependent on the type of plant, local and national legislation and the proximity of the plant to residential areas. The two main types of exhaust gas treatments used in AD sites and MBT plants are:
• Biofilter • Regenerative thermal oxidation (RTO)
Biofilters are a low cost option for managing exhaust gases. Biofilters consist of a mass of humidified porous organic material (usually woody biomass) that is populated with microbes capable of degrading odorous contaminants present in the off-gases. Adsorption, physico-chemical and microbiological processes take place between the process off-gases and the filter medium resulting in the breakdown of contaminants in the off-gases (Juniper 2005). Biofilters are cheap to maintain, but may not be sufficient to meet legislation, and can take up a large area in comparison to other options. Regenerative thermal oxidation (RTO) uses fossil fuel energy (or energy from the biogas produced in the AD stage) to combust off-gasses in specially designed burners, which recuperate the heat from the exhaust gases (Juniper, 2005). RTO effectively destroys odorous contaminants, bio-aerosols and volatile organics. RTO systems are expensive to install and maintain, and are energy intensive. Many plants in Germany, where exhaust gas emission legislation is particularly strict, employ more than one exhaust gas treatment system, so that exhaust gases from individual parts of plants can be treated in the cheapest possible way. In Germany biofilters alone are unable to meet the legislative requirements and other exhaust gas treatment systems (such as RTO) are necessary. Given present UK legislation it is unlikely that anaerobic digestion sites or MBT plants will need regenerative thermal oxidation plants to meet current legislation (Juniper, 2005), nevertheless it will depend on the plant’s location. For AD or MBT plants built close to residential locations, these may be required. Another range of options for exhaust gas treatment and odour control are chemical scrubbing systems (e.g. acid washing and ozone treatment). Some sites also periodically release aromatic oils in the wastes reception area to suppress odours (for example the ITRADEC MBT plant in Mons). Many sites have experienced odour problems in the past, but have since overcome these problems by changing or improving their exhaust gas treatment systems. In many cases simple measures such as improving housekeeping, and employing stricter management on issues such as keeping wastes reception area and composting area doors closed has led to a major reduction in odour emissions.
Anaerobic Digestion of Biodegradable Municipal Wastes: A Review __________________________________________________________________________
_______________________________________________________________________
142
2.9 Plant Siting Considerations The siting of an AD plant (whether it be co-digesting BMW with other organic wastes or digesting centrally separated MSW as part of a MBT plant) is critical for its viability. For all AD facilities irrespective of the wastes being treated the following points must be considered:
• The proximity principle dictates that the waste should be treated as close as possible to the point at which it arises to minimise transport impact and emissions.
• An Environmental Impact Assessment will need to be completed before planning
permission is granted. Planning permission is clearly more likely to be granted in industrial areas than in rural or residential areas.
• Impacts on neighbours. Centralised AD plants may be best sited in areas designated
for industrial development in the development plan of the local planning authority. All plants need to consider noise, odour and traffic impacts on local residents.
• Any new waste treatment facilities (of whatever nature) should be integrated as
much as possible with existing infrastructure. • A new facility should have good road access, avoiding where possible residential or
rural areas.
• Where possible, new plants should be sited in locations where opportunities for co-utilisation of certain assets exist. These assets can include biogas upgrading and use facilities, water treatment facilities, existing wastes handling licences or existing infrastructure connections.
• Centralised AD plants should ideally be situated near other industries (or in an area
where other industries are planned in the near future). Co-operation and forward planning could provide the plant with a use (and therefore income) for the excess heat produced. Benefits to the partner industry would be heat at a cheaper rate than would otherwise be available. If the plant is built on a developing (rather than existing) industrial estate then the engineering required for neighbouring industries to utilise the excess heat could be established at the development stage, rather than retro-fitted (which can prove prohibitively expensive at present fossil fuel prices).
• The chosen site should not be too remote, so as to avoid secondary infrastructure
costs.
• The right location can save thousands of pounds on electricity grid connection costs (RPA website, accessed July 2006), and the value of the electricity is enhanced by minimising transmission losses; the closer it can be connected to its end users when sold off-site the better.
• Significant environmental and economic advantages may accrue when large EfW
facilities are located adjacent to rail heads and ports (The Planning Service, 2002). For example, in Salzburg a rail link for RDF transport from the MBT plant to the incinerator for RDF transport was purpose built.
Anaerobic Digestion of Biodegradable Municipal Wastes: A Review __________________________________________________________________________
_______________________________________________________________________
143
• The initial area for construction should ideally leave room for growth and further
developments. For MBT plants with an AD stage the following additional points must be considered:
• Ideally sited near but not in a major population centre, to guarantee sufficient volumes of municipal waste.
• Ideally, a new process would be sited on an existing wastes treatment park that
already has a landfill site, a wastewater treatment plant and facilities to utilise the biogas or landfill gas produced.
• MBT plants treating residual MSW should be sited if possible on the site of an
existing landfill site. This will enable easy disposal of the biostabilised output, and enable the combination of biogas and landfill gas to be co-utilised in CHP facilities. Another option would be siting the plant on the same complex as an MSW incinerator (or other thermal wastes treatment complex). This will mean that the excess heat can be combined and utilised together, and other mutually beneficial advantages realised. Also, the sitting of two wastes treatment processes on the same site should theoretically minimise planning problems.
• Another alternative that could prove advantageous would be to build the plant on the
same site as (or close to) a wastewater treatment plant. Again, this would enable the co-use of by-products, facilities and infrastructure, and potentially minimise costs.
For the co-digestion of BMW with other organic wastes or energy crops the following points are true:
• Ideally sited near but not in a major population centre, to guarantee sufficient volumes of source separated BMW, restaurant and institutional kitchen waste.
• If source separated BMW is to be co-digested, the plant should ideally be sited near
an agricultural area, to make use of agricultural wastes, manures and slaughterhouse wastes. The plant should also be close enough for farmers to receive back digestate/CLO for land-spreading without major transport costs.
• Ideally sited near food and beverage industries producing OIW.
• If sewage sludge was to be co-digested, then the plant could be sited on the site of
(or close to) a sewage treatment works. Potential benefits would include the adaptation of sewage sludge digesters to treat other organic wastes, co-utilisation of biogas and other infrastructural facilities.
• Ideally sited near a forestry project/land reclamation project (e.g. open cast mine
regeneration), so that excess compost could be beneficially applied in a sector unrelated to food production. This would assume extra importance if the CLO could not be utilised on agricultural land.
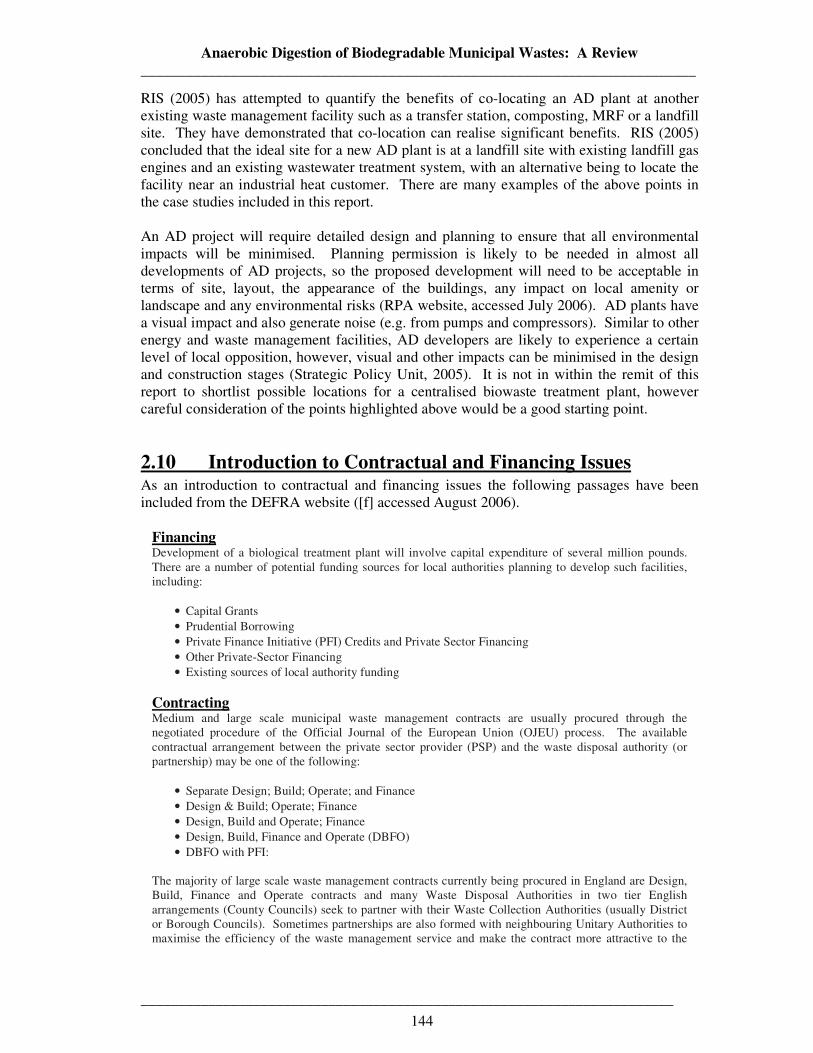
Anaerobic Digestion of Biodegradable Municipal Wastes: A Review __________________________________________________________________________
_______________________________________________________________________
144
RIS (2005) has attempted to quantify the benefits of co-locating an AD plant at another existing waste management facility such as a transfer station, composting, MRF or a landfill site. They have demonstrated that co-location can realise significant benefits. RIS (2005) concluded that the ideal site for a new AD plant is at a landfill site with existing landfill gas engines and an existing wastewater treatment system, with an alternative being to locate the facility near an industrial heat customer. There are many examples of the above points in the case studies included in this report. An AD project will require detailed design and planning to ensure that all environmental impacts will be minimised. Planning permission is likely to be needed in almost all developments of AD projects, so the proposed development will need to be acceptable in terms of site, layout, the appearance of the buildings, any impact on local amenity or landscape and any environmental risks (RPA website, accessed July 2006). AD plants have a visual impact and also generate noise (e.g. from pumps and compressors). Similar to other energy and waste management facilities, AD developers are likely to experience a certain level of local opposition, however, visual and other impacts can be minimised in the design and construction stages (Strategic Policy Unit, 2005). It is not in within the remit of this report to shortlist possible locations for a centralised biowaste treatment plant, however careful consideration of the points highlighted above would be a good starting point.
2.10 Introduction to Contractual and Financing Issues As an introduction to contractual and financing issues the following passages have been included from the DEFRA website ([f] accessed August 2006).
Financing Development of a biological treatment plant will involve capital expenditure of several million pounds. There are a number of potential funding sources for local authorities planning to develop such facilities, including:
• Capital Grants • Prudential Borrowing • Private Finance Initiative (PFI) Credits and Private Sector Financing • Other Private-Sector Financing • Existing sources of local authority funding
Contracting Medium and large scale municipal waste management contracts are usually procured through the negotiated procedure of the Official Journal of the European Union (OJEU) process. The available contractual arrangement between the private sector provider (PSP) and the waste disposal authority (or partnership) may be one of the following:
• Separate Design; Build; Operate; and Finance • Design & Build; Operate; Finance • Design, Build and Operate; Finance • Design, Build, Finance and Operate (DBFO) • DBFO with PFI:
The majority of large scale waste management contracts currently being procured in England are Design, Build, Finance and Operate contracts and many Waste Disposal Authorities in two tier English arrangements (County Councils) seek to partner with their Waste Collection Authorities (usually District or Borough Councils). Sometimes partnerships are also formed with neighbouring Unitary Authorities to maximise the efficiency of the waste management service and make the contract more attractive to the
Anaerobic Digestion of Biodegradable Municipal Wastes: A Review __________________________________________________________________________
_______________________________________________________________________
145
Private Sector Provider. Before initiating any procurement or funding process for a new waste management treatment facility, the following issues should be considered:
• Performance requirements • Waste inputs • Project duration • Project cost • Available budgets • Availability of sites • Planning status • Interface with existing contracts • Timescales • Governance and decision making arrangements • Market appetite and risk allocation.
Further guidance on these issues can be obtained from DEFRA Procurement Toolkit website ([f] accessed September 2006), Institution of Civil Engineers 'New Engineering Contract' website (accessed September 2006) and Eunomia (2002c).
Anaerobic Digestion of Biodegradable Municipal Wastes: A Review __________________________________________________________________________
_______________________________________________________________________
146
3.0 ANAEROBIC DIGESTION TRENDS European countries are world leaders in the anaerobic digestion of municipal wastes. By the early 1980s the anaerobic digestion of agricultural and industrial organic wastes was commonplace, including many systems treating food-based wastes. Many companies had spotted the potential to anaerobically digest municipal organic wastes in the same (or similar) ways and began developing trial and pilot scale digesters and pre-treatment systems. Among the first full-scale plants built were the plant at Amiens (France), which was built by Valorga in 1988, and the Stormossen plant in Vaasa (Finland), which was built by CiTec in 1989. Both plants were designed to treat the organic fraction of centrally separated MSW. In the early 1990s, OWS Dranco and Kompogas installed pilot scale plants based on the dry digestion of source separated kitchen and garden wastes, with a view to producing compost as another marketable resource. Early experiences have led to many developments, with good systems thriving and mediocre systems evolving into good systems. Unfortunately, in the early days some poorly designed and poorly tested anaerobic systems (which were ideal for the treatment of other organic wastes but poorly prepared for the challenges of municipal wastes) were rushed onto the market without adequate research, development, testing or operator experience. Some of these AD systems experienced problems, which affected the reputation of the whole sector rather than only the companies involved, and slowed down the uptake of AD technology in the municipal wastes sector. To a certain extent, this reputation is still apparent in the UK, despite the hundreds of successful AD systems across Europe. As experience and confidence in the anaerobic digestion of organic municipal wastes has grown, more and more plants have been built, with the majority having been built in the last decade. The plants treating source separated BMW or centrally separated OFMSW (either alone or with other organic wastes) have been identified and key data summarised (Table 29). In Table 29 biowaste refers to source separated BMW and can be any combination of kitchen and garden waste, catering waste or even paper if it is collected with municipal biowaste. In Table 29 OIW stands for organic industrial waste and can be any organic waste arising from any industry. For most of the MBT plants treating MSW, the capacity of the whole plant is quoted where available, alongside the capacity of the anaerobic digestion stages of the plant. In some cases it was necessary to estimate the capacity of the anaerobic treatment stage where it was not supplied.
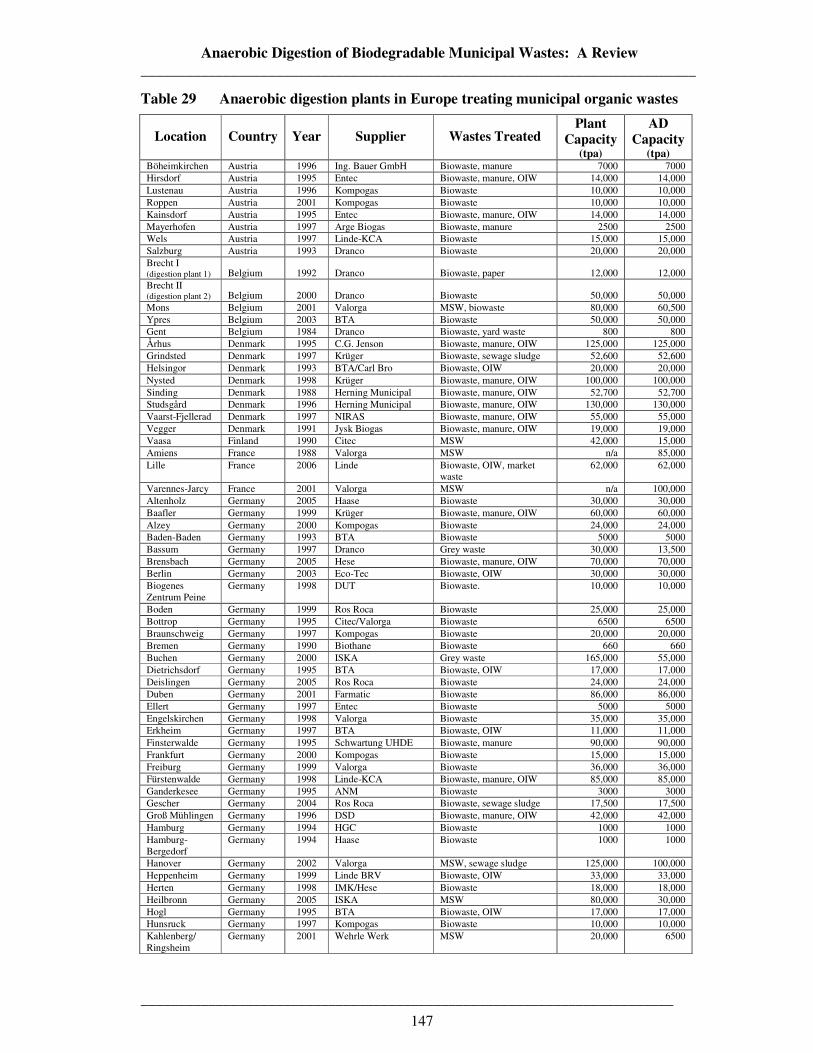
Anaerobic Digestion of Biodegradable Municipal Wastes: A Review __________________________________________________________________________
_______________________________________________________________________
147
Table 29 Anaerobic digestion plants in Europe treating municipal organic wastes
Location
Country
Year
Supplier
Wastes Treated
Plant Capacity
(tpa)
AD Capacity
(tpa) Böheimkirchen Austria 1996 Ing. Bauer GmbH Biowaste, manure 7000 7000 Hirsdorf Austria 1995 Entec Biowaste, manure, OIW 14,000 14,000 Lustenau Austria 1996 Kompogas Biowaste 10,000 10,000 Roppen Austria 2001 Kompogas Biowaste 10,000 10,000 Kainsdorf Austria 1995 Entec Biowaste, manure, OIW 14,000 14,000 Mayerhofen Austria 1997 Arge Biogas Biowaste, manure 2500 2500 Wels Austria 1997 Linde-KCA Biowaste 15,000 15,000 Salzburg Austria 1993 Dranco Biowaste 20,000 20,000 Brecht I (digestion plant 1) Belgium 1992 Dranco Biowaste, paper 12,000 12,000 Brecht II (digestion plant 2) Belgium 2000 Dranco Biowaste 50,000 50,000 Mons Belgium 2001 Valorga MSW, biowaste 80,000 60,500 Ypres Belgium 2003 BTA Biowaste 50,000 50,000 Gent Belgium 1984 Dranco Biowaste, yard waste 800 800 Århus Denmark 1995 C.G. Jenson Biowaste, manure, OIW 125,000 125,000 Grindsted Denmark 1997 Krüger Biowaste, sewage sludge 52,600 52,600 Helsingor Denmark 1993 BTA/Carl Bro Biowaste, OIW 20,000 20,000 Nysted Denmark 1998 Krüger Biowaste, manure, OIW 100,000 100,000 Sinding Denmark 1988 Herning Municipal Biowaste, manure, OIW 52,700 52,700 Studsgård Denmark 1996 Herning Municipal Biowaste, manure, OIW 130,000 130,000 Vaarst-Fjellerad Denmark 1997 NIRAS Biowaste, manure, OIW 55,000 55,000 Vegger Denmark 1991 Jysk Biogas Biowaste, manure, OIW 19,000 19,000 Vaasa Finland 1990 Citec MSW 42,000 15,000 Amiens France 1988 Valorga MSW n/a 85,000 Lille
France
2006
Linde
Biowaste, OIW, market waste
62,000
62,000
Varennes-Jarcy France 2001 Valorga MSW n/a 100,000 Altenholz Germany 2005 Haase Biowaste 30,000 30,000 Baafler Germany 1999 Krüger Biowaste, manure, OIW 60,000 60,000 Alzey Germany 2000 Kompogas Biowaste 24,000 24,000 Baden-Baden Germany 1993 BTA Biowaste 5000 5000 Bassum Germany 1997 Dranco Grey waste 30,000 13,500 Brensbach Germany 2005 Hese Biowaste, manure, OIW 70,000 70,000 Berlin Germany 2003 Eco-Tec Biowaste, OIW 30,000 30,000 Biogenes Zentrum Peine
Germany
1998
DUT
Biowaste.
10,000
10,000
Boden Germany 1999 Ros Roca Biowaste 25,000 25,000 Bottrop Germany 1995 Citec/Valorga Biowaste 6500 6500 Braunschweig Germany 1997 Kompogas Biowaste 20,000 20,000 Bremen Germany 1990 Biothane Biowaste 660 660 Buchen Germany 2000 ISKA Grey waste 165,000 55,000 Dietrichsdorf Germany 1995 BTA Biowaste, OIW 17,000 17,000 Deislingen Germany 2005 Ros Roca Biowaste 24,000 24,000 Duben Germany 2001 Farmatic Biowaste 86,000 86,000 Ellert Germany 1997 Entec Biowaste 5000 5000 Engelskirchen Germany 1998 Valorga Biowaste 35,000 35,000 Erkheim Germany 1997 BTA Biowaste, OIW 11,000 11,000 Finsterwalde Germany 1995 Schwartung UHDE Biowaste, manure 90,000 90,000 Frankfurt Germany 2000 Kompogas Biowaste 15,000 15,000 Freiburg Germany 1999 Valorga Biowaste 36,000 36,000 Fürstenwalde Germany 1998 Linde-KCA Biowaste, manure, OIW 85,000 85,000 Ganderkesee Germany 1995 ANM Biowaste 3000 3000 Gescher Germany 2004 Ros Roca Biowaste, sewage sludge 17,500 17,500 Groß Mühlingen Germany 1996 DSD Biowaste, manure, OIW 42,000 42,000 Hamburg Germany 1994 HGC Biowaste 1000 1000 Hamburg-Bergedorf
Germany
1994
Haase
Biowaste
1000
1000
Hanover Germany 2002 Valorga MSW, sewage sludge 125,000 100,000 Heppenheim Germany 1999 Linde BRV Biowaste, OIW 33,000 33,000 Herten Germany 1998 IMK/Hese Biowaste 18,000 18,000 Heilbronn Germany 2005 ISKA MSW 80,000 30,000 Hogl Germany 1995 BTA Biowaste, OIW 17,000 17,000 Hunsruck Germany 1997 Kompogas Biowaste 10,000 10,000 Kahlenberg/ Ringsheim
Germany
2001
Wehrle Werk
MSW
20,000
6500
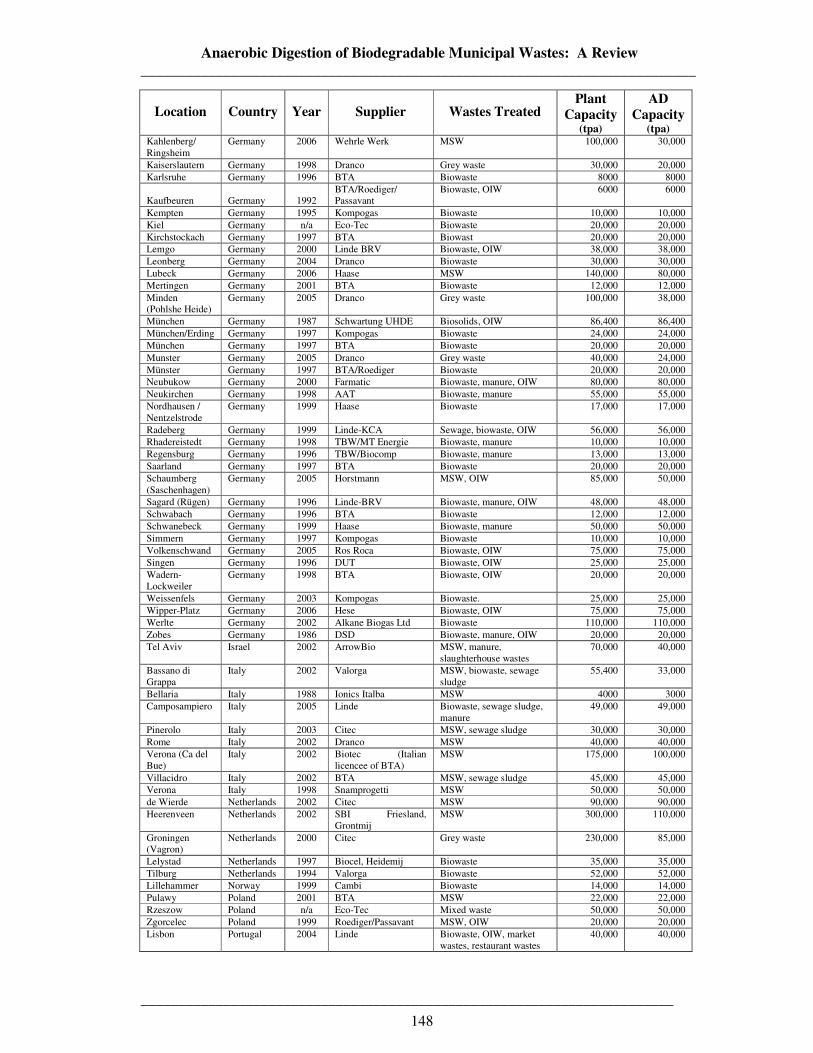
Anaerobic Digestion of Biodegradable Municipal Wastes: A Review __________________________________________________________________________
_______________________________________________________________________
148
Location
Country
Year
Supplier
Wastes Treated
Plant Capacity
(tpa)
AD Capacity
(tpa) Kahlenberg/ Ringsheim
Germany
2006
Wehrle Werk
MSW
100,000
30,000
Kaiserslautern Germany 1998 Dranco Grey waste 30,000 20,000 Karlsruhe Germany 1996 BTA Biowaste 8000 8000
Kaufbeuren Germany 1992 BTA/Roediger/ Passavant
Biowaste, OIW
6000
6000
Kempten Germany 1995 Kompogas Biowaste 10,000 10,000 Kiel Germany n/a Eco-Tec Biowaste 20,000 20,000 Kirchstockach Germany 1997 BTA Biowast 20,000 20,000 Lemgo Germany 2000 Linde BRV Biowaste, OIW 38,000 38,000 Leonberg Germany 2004 Dranco Biowaste 30,000 30,000 Lubeck Germany 2006 Haase MSW 140,000 80,000 Mertingen Germany 2001 BTA Biowaste 12,000 12,000 Minden (Pohlshe Heide)
Germany
2005
Dranco
Grey waste
100,000
38,000
München Germany 1987 Schwartung UHDE Biosolids, OIW 86,400 86,400 München/Erding Germany 1997 Kompogas Biowaste 24,000 24,000 München Germany 1997 BTA Biowaste 20,000 20,000 Munster Germany 2005 Dranco Grey waste 40,000 24,000 Münster Germany 1997 BTA/Roediger Biowaste 20,000 20,000 Neubukow Germany 2000 Farmatic Biowaste, manure, OIW 80,000 80,000 Neukirchen Germany 1998 AAT Biowaste, manure 55,000 55,000 Nordhausen / Nentzelstrode
Germany
1999
Haase
Biowaste
17,000
17,000
Radeberg Germany 1999 Linde-KCA Sewage, biowaste, OIW 56,000 56,000 Rhadereistedt Germany 1998 TBW/MT Energie Biowaste, manure 10,000 10,000 Regensburg Germany 1996 TBW/Biocomp Biowaste, manure 13,000 13,000 Saarland Germany 1997 BTA Biowaste 20,000 20,000 Schaumberg (Saschenhagen)
Germany
2005
Horstmann
MSW, OIW
85,000
50,000
Sagard (Rügen) Germany 1996 Linde-BRV Biowaste, manure, OIW 48,000 48,000 Schwabach Germany 1996 BTA Biowaste 12,000 12,000 Schwanebeck Germany 1999 Haase Biowaste, manure 50,000 50,000 Simmern Germany 1997 Kompogas Biowaste 10,000 10,000 Volkenschwand Germany 2005 Ros Roca Biowaste, OIW 75,000 75,000 Singen Germany 1996 DUT Biowaste, OIW 25,000 25,000 Wadern-Lockweiler
Germany
1998
BTA
Biowaste, OIW
20,000
20,000
Weissenfels Germany 2003 Kompogas Biowaste. 25,000 25,000 Wipper-Platz Germany 2006 Hese Biowaste, OIW 75,000 75,000 Werlte Germany 2002 Alkane Biogas Ltd Biowaste 110,000 110,000 Zobes Germany 1986 DSD Biowaste, manure, OIW 20,000 20,000 Tel Aviv
Israel
2002
ArrowBio
MSW, manure, slaughterhouse wastes
70,000
40,000
Bassano di Grappa
Italy
2002
Valorga
MSW, biowaste, sewage sludge
55,400
33,000
Bellaria Italy 1988 Ionics Italba MSW 4000 3000 Camposampiero
Italy
2005
Linde
Biowaste, sewage sludge, manure
49,000
49,000
Pinerolo Italy 2003 Citec MSW, sewage sludge 30,000 30,000 Rome Italy 2002 Dranco MSW 40,000 40,000 Verona (Ca del Bue)
Italy
2002
Biotec (Italian licencee of BTA)
MSW
175,000
100,000
Villacidro Italy 2002 BTA MSW, sewage sludge 45,000 45,000 Verona Italy 1998 Snamprogetti MSW 50,000 50,000 de Wierde Netherlands 2002 Citec MSW 90,000 90,000 Heerenveen
Netherlands
2002
SBI Friesland, Grontmij
MSW
300,000
110,000
Groningen (Vagron)
Netherlands
2000
Citec
Grey waste
230,000
85,000
Lelystad Netherlands 1997 Biocel, Heidemij Biowaste 35,000 35,000 Tilburg Netherlands 1994 Valorga Biowaste 52,000 52,000 Lillehammer Norway 1999 Cambi Biowaste 14,000 14,000 Pulawy Poland 2001 BTA MSW 22,000 22,000 Rzeszow Poland n/a Eco-Tec Mixed waste 50,000 50,000 Zgorcelec Poland 1999 Roediger/Passavant MSW, OIW 20,000 20,000 Lisbon
Portugal
2004
Linde
Biowaste, OIW, market wastes, restaurant wastes
40,000
40,000
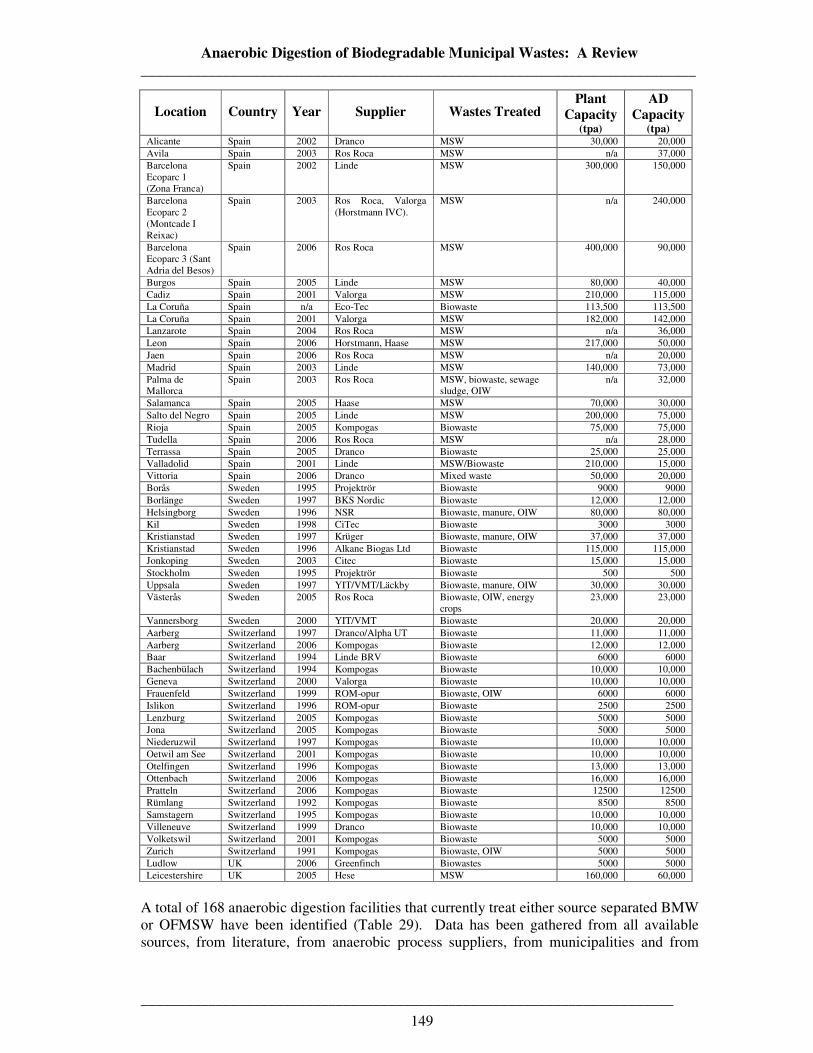
Anaerobic Digestion of Biodegradable Municipal Wastes: A Review __________________________________________________________________________
_______________________________________________________________________
149
Location
Country
Year
Supplier
Wastes Treated
Plant Capacity
(tpa)
AD Capacity
(tpa) Alicante Spain 2002 Dranco MSW 30,000 20,000 Avila Spain 2003 Ros Roca MSW n/a 37,000 Barcelona Ecoparc 1 (Zona Franca)
Spain
2002
Linde
MSW
300,000
150,000
Barcelona Ecoparc 2 (Montcade I Reixac)
Spain
2003
Ros Roca, Valorga (Horstmann IVC).
MSW
n/a
240,000
Barcelona Ecoparc 3 (Sant Adria del Besos)
Spain
2006
Ros Roca
MSW
400,000
90,000
Burgos Spain 2005 Linde MSW 80,000 40,000 Cadiz Spain 2001 Valorga MSW 210,000 115,000 La Coruña Spain n/a Eco-Tec Biowaste 113,500 113,500 La Coruña Spain 2001 Valorga MSW 182,000 142,000 Lanzarote Spain 2004 Ros Roca MSW n/a 36,000 Leon Spain 2006 Horstmann, Haase MSW 217,000 50,000 Jaen Spain 2006 Ros Roca MSW n/a 20,000 Madrid Spain 2003 Linde MSW 140,000 73,000 Palma de Mallorca
Spain
2003
Ros Roca
MSW, biowaste, sewage sludge, OIW
n/a
32,000
Salamanca Spain 2005 Haase MSW 70,000 30,000 Salto del Negro Spain 2005 Linde MSW 200,000 75,000 Rioja Spain 2005 Kompogas Biowaste 75,000 75,000 Tudella Spain 2006 Ros Roca MSW n/a 28,000 Terrassa Spain 2005 Dranco Biowaste 25,000 25,000 Valladolid Spain 2001 Linde MSW/Biowaste 210,000 15,000 Vittoria Spain 2006 Dranco Mixed waste 50,000 20,000 Borås Sweden 1995 Projektrör Biowaste 9000 9000 Borlänge Sweden 1997 BKS Nordic Biowaste 12,000 12,000 Helsingborg Sweden 1996 NSR Biowaste, manure, OIW 80,000 80,000 Kil Sweden 1998 CiTec Biowaste 3000 3000 Kristianstad Sweden 1997 Krüger Biowaste, manure, OIW 37,000 37,000 Kristianstad Sweden 1996 Alkane Biogas Ltd Biowaste 115,000 115,000 Jonkoping Sweden 2003 Citec Biowaste 15,000 15,000 Stockholm Sweden 1995 Projektrör Biowaste 500 500 Uppsala Sweden 1997 YIT/VMT/Läckby Biowaste, manure, OIW 30,000 30,000 Västerås
Sweden
2005
Ros Roca
Biowaste, OIW, energy crops
23,000
23,000
Vannersborg Sweden 2000 YIT/VMT Biowaste 20,000 20,000 Aarberg Switzerland 1997 Dranco/Alpha UT Biowaste 11,000 11,000 Aarberg Switzerland 2006 Kompogas Biowaste 12,000 12,000 Baar Switzerland 1994 Linde BRV Biowaste 6000 6000 Bachenbülach Switzerland 1994 Kompogas Biowaste 10,000 10,000 Geneva Switzerland 2000 Valorga Biowaste 10,000 10,000 Frauenfeld Switzerland 1999 ROM-opur Biowaste, OIW 6000 6000 Islikon Switzerland 1996 ROM-opur Biowaste 2500 2500 Lenzburg Switzerland 2005 Kompogas Biowaste 5000 5000 Jona Switzerland 2005 Kompogas Biowaste 5000 5000 Niederuzwil Switzerland 1997 Kompogas Biowaste 10,000 10,000 Oetwil am See Switzerland 2001 Kompogas Biowaste 10,000 10,000 Otelfingen Switzerland 1996 Kompogas Biowaste 13,000 13,000 Ottenbach Switzerland 2006 Kompogas Biowaste 16,000 16,000 Pratteln Switzerland 2006 Kompogas Biowaste 12500 12500 Rümlang Switzerland 1992 Kompogas Biowaste 8500 8500 Samstagern Switzerland 1995 Kompogas Biowaste 10,000 10,000 Villeneuve Switzerland 1999 Dranco Biowaste 10,000 10,000 Volketswil Switzerland 2001 Kompogas Biowaste 5000 5000 Zurich Switzerland 1991 Kompogas Biowaste, OIW 5000 5000 Ludlow UK 2006 Greenfinch Biowastes 5000 5000 Leicestershire UK 2005 Hese MSW 160,000 60,000
A total of 168 anaerobic digestion facilities that currently treat either source separated BMW or OFMSW have been identified (Table 29). Data has been gathered from all available sources, from literature, from anaerobic process suppliers, from municipalities and from
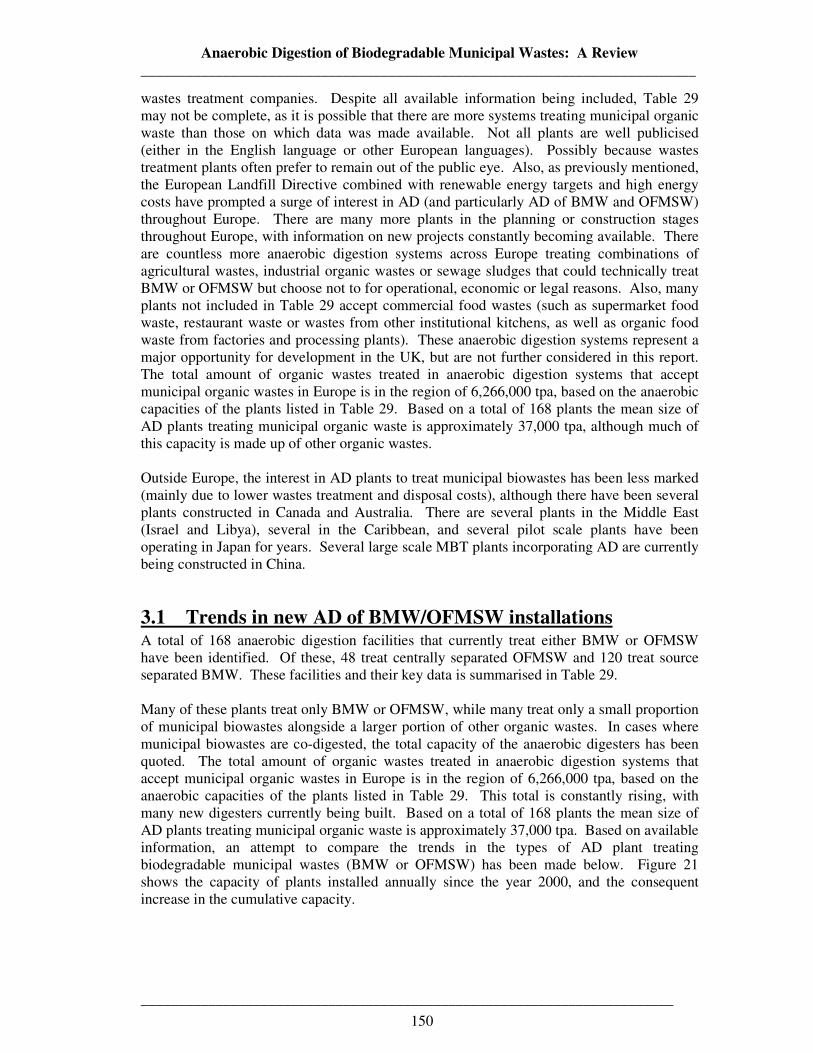
Anaerobic Digestion of Biodegradable Municipal Wastes: A Review __________________________________________________________________________
_______________________________________________________________________
150
wastes treatment companies. Despite all available information being included, Table 29 may not be complete, as it is possible that there are more systems treating municipal organic waste than those on which data was made available. Not all plants are well publicised (either in the English language or other European languages). Possibly because wastes treatment plants often prefer to remain out of the public eye. Also, as previously mentioned, the European Landfill Directive combined with renewable energy targets and high energy costs have prompted a surge of interest in AD (and particularly AD of BMW and OFMSW) throughout Europe. There are many more plants in the planning or construction stages throughout Europe, with information on new projects constantly becoming available. There are countless more anaerobic digestion systems across Europe treating combinations of agricultural wastes, industrial organic wastes or sewage sludges that could technically treat BMW or OFMSW but choose not to for operational, economic or legal reasons. Also, many plants not included in Table 29 accept commercial food wastes (such as supermarket food waste, restaurant waste or wastes from other institutional kitchens, as well as organic food waste from factories and processing plants). These anaerobic digestion systems represent a major opportunity for development in the UK, but are not further considered in this report. The total amount of organic wastes treated in anaerobic digestion systems that accept municipal organic wastes in Europe is in the region of 6,266,000 tpa, based on the anaerobic capacities of the plants listed in Table 29. Based on a total of 168 plants the mean size of AD plants treating municipal organic waste is approximately 37,000 tpa, although much of this capacity is made up of other organic wastes. Outside Europe, the interest in AD plants to treat municipal biowastes has been less marked (mainly due to lower wastes treatment and disposal costs), although there have been several plants constructed in Canada and Australia. There are several plants in the Middle East (Israel and Libya), several in the Caribbean, and several pilot scale plants have been operating in Japan for years. Several large scale MBT plants incorporating AD are currently being constructed in China.
3.1 Trends in new AD of BMW/OFMSW installations A total of 168 anaerobic digestion facilities that currently treat either BMW or OFMSW have been identified. Of these, 48 treat centrally separated OFMSW and 120 treat source separated BMW. These facilities and their key data is summarised in Table 29. Many of these plants treat only BMW or OFMSW, while many treat only a small proportion of municipal biowastes alongside a larger portion of other organic wastes. In cases where municipal biowastes are co-digested, the total capacity of the anaerobic digesters has been quoted. The total amount of organic wastes treated in anaerobic digestion systems that accept municipal organic wastes in Europe is in the region of 6,266,000 tpa, based on the anaerobic capacities of the plants listed in Table 29. This total is constantly rising, with many new digesters currently being built. Based on a total of 168 plants the mean size of AD plants treating municipal organic waste is approximately 37,000 tpa. Based on available information, an attempt to compare the trends in the types of AD plant treating biodegradable municipal wastes (BMW or OFMSW) has been made below. Figure 21 shows the capacity of plants installed annually since the year 2000, and the consequent increase in the cumulative capacity.
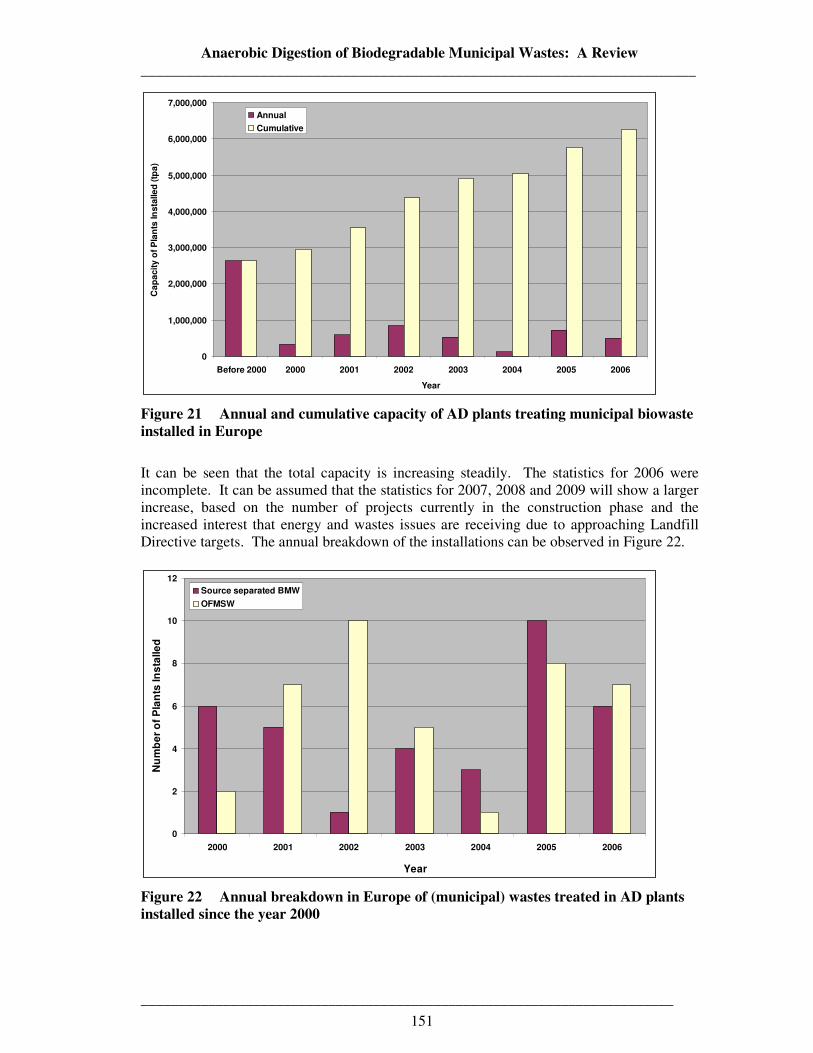
Anaerobic Digestion of Biodegradable Municipal Wastes: A Review __________________________________________________________________________
_______________________________________________________________________
151
0
1,000,000
2,000,000
3,000,000
4,000,000
5,000,000
6,000,000
7,000,000
Before 2000 2000 2001 2002 2003 2004 2005 2006
Year
Ca
pa
cit
y o
f P
lan
ts In
sta
lle
d (
tpa
)
Annual
Cumulative
Figure 21 Annual and cumulative capacity of AD plants treating municipal biowaste installed in Europe
It can be seen that the total capacity is increasing steadily. The statistics for 2006 were incomplete. It can be assumed that the statistics for 2007, 2008 and 2009 will show a larger increase, based on the number of projects currently in the construction phase and the increased interest that energy and wastes issues are receiving due to approaching Landfill Directive targets. The annual breakdown of the installations can be observed in Figure 22.
0
2
4
6
8
10
12
2000 2001 2002 2003 2004 2005 2006
Year
Nu
mb
er
of
Pla
nts
In
sta
lle
d
Source separated BMW
OFMSW
Figure 22 Annual breakdown in Europe of (municipal) wastes treated in AD plants installed since the year 2000
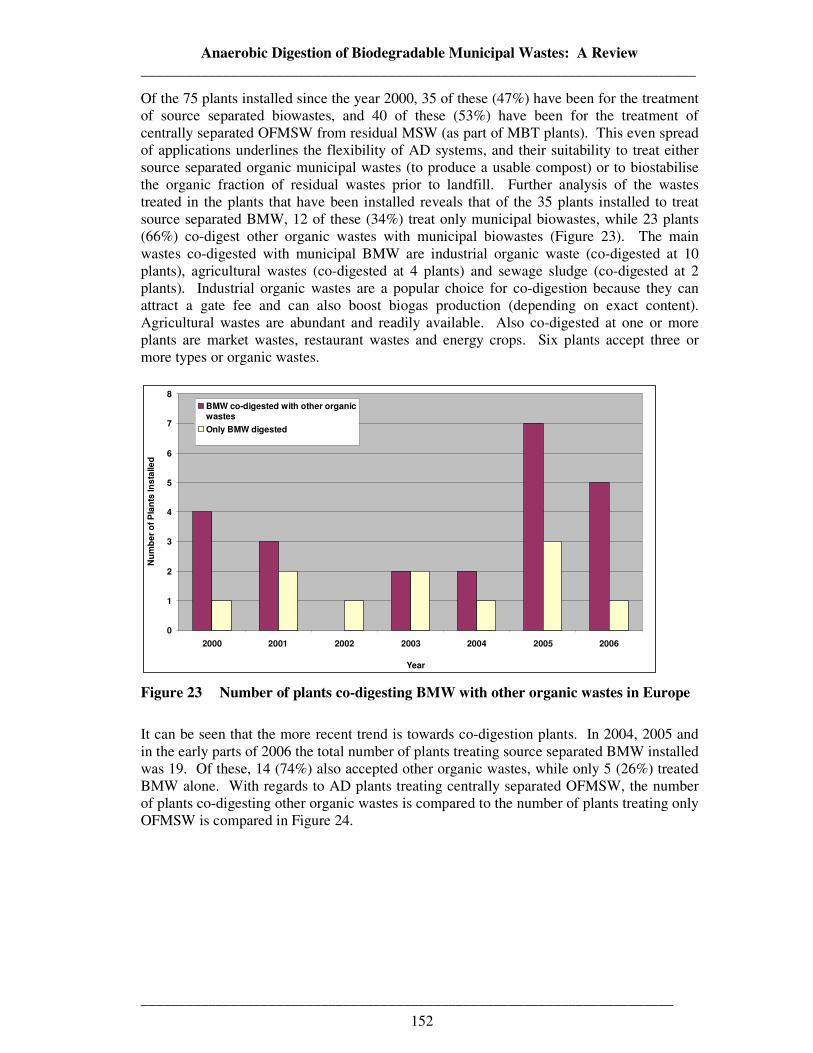
Anaerobic Digestion of Biodegradable Municipal Wastes: A Review __________________________________________________________________________
_______________________________________________________________________
152
Of the 75 plants installed since the year 2000, 35 of these (47%) have been for the treatment of source separated biowastes, and 40 of these (53%) have been for the treatment of centrally separated OFMSW from residual MSW (as part of MBT plants). This even spread of applications underlines the flexibility of AD systems, and their suitability to treat either source separated organic municipal wastes (to produce a usable compost) or to biostabilise the organic fraction of residual wastes prior to landfill. Further analysis of the wastes treated in the plants that have been installed reveals that of the 35 plants installed to treat source separated BMW, 12 of these (34%) treat only municipal biowastes, while 23 plants (66%) co-digest other organic wastes with municipal biowastes (Figure 23). The main wastes co-digested with municipal BMW are industrial organic waste (co-digested at 10 plants), agricultural wastes (co-digested at 4 plants) and sewage sludge (co-digested at 2 plants). Industrial organic wastes are a popular choice for co-digestion because they can attract a gate fee and can also boost biogas production (depending on exact content). Agricultural wastes are abundant and readily available. Also co-digested at one or more plants are market wastes, restaurant wastes and energy crops. Six plants accept three or more types or organic wastes.
0
1
2
3
4
5
6
7
8
2000 2001 2002 2003 2004 2005 2006
Year
Nu
mb
er
of
Pla
nts
In
sta
lle
d
BMW co-digested with other organicwastes
Only BMW digested
Figure 23 Number of plants co-digesting BMW with other organic wastes in Europe
It can be seen that the more recent trend is towards co-digestion plants. In 2004, 2005 and in the early parts of 2006 the total number of plants treating source separated BMW installed was 19. Of these, 14 (74%) also accepted other organic wastes, while only 5 (26%) treated BMW alone. With regards to AD plants treating centrally separated OFMSW, the number of plants co-digesting other organic wastes is compared to the number of plants treating only OFMSW is compared in Figure 24.
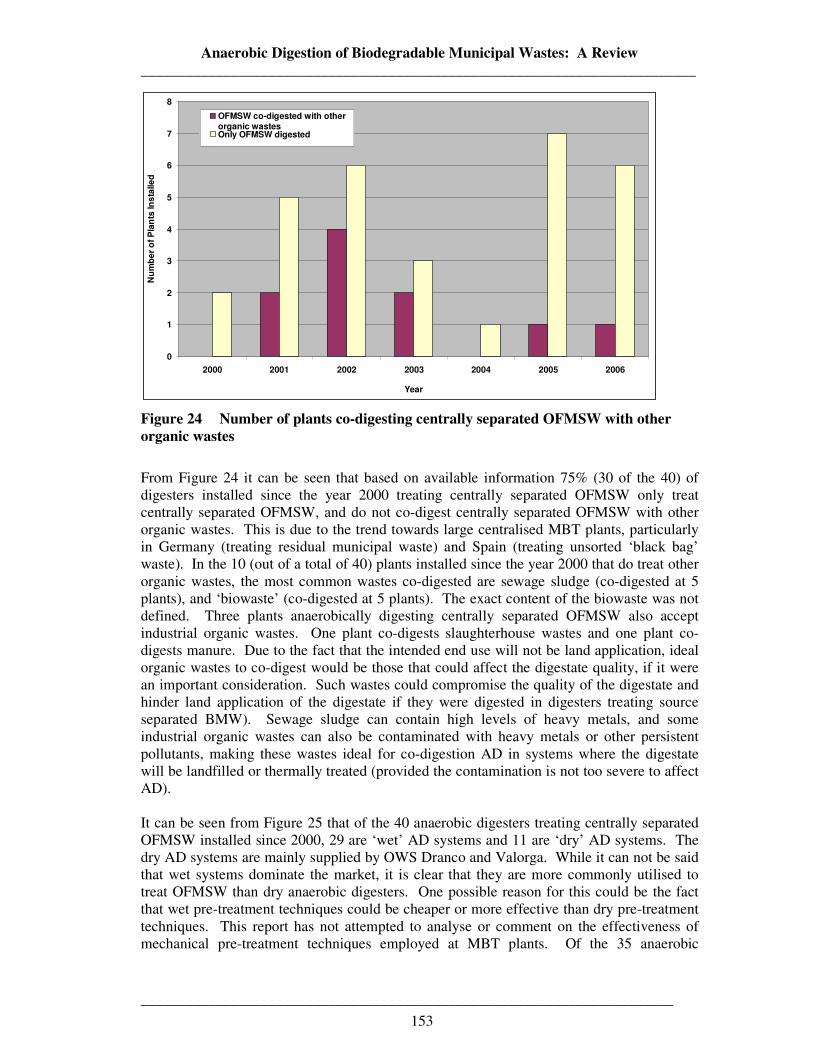
Anaerobic Digestion of Biodegradable Municipal Wastes: A Review __________________________________________________________________________
_______________________________________________________________________
153
0
1
2
3
4
5
6
7
8
2000 2001 2002 2003 2004 2005 2006
Year
Nu
mb
er
of
Pla
nts
In
sta
lle
d
OFMSW co-digested with otherorganic wastesOnly OFMSW digested
Figure 24 Number of plants co-digesting centrally separated OFMSW with other organic wastes
From Figure 24 it can be seen that based on available information 75% (30 of the 40) of digesters installed since the year 2000 treating centrally separated OFMSW only treat centrally separated OFMSW, and do not co-digest centrally separated OFMSW with other organic wastes. This is due to the trend towards large centralised MBT plants, particularly in Germany (treating residual municipal waste) and Spain (treating unsorted ‘black bag’ waste). In the 10 (out of a total of 40) plants installed since the year 2000 that do treat other organic wastes, the most common wastes co-digested are sewage sludge (co-digested at 5 plants), and ‘biowaste’ (co-digested at 5 plants). The exact content of the biowaste was not defined. Three plants anaerobically digesting centrally separated OFMSW also accept industrial organic wastes. One plant co-digests slaughterhouse wastes and one plant co-digests manure. Due to the fact that the intended end use will not be land application, ideal organic wastes to co-digest would be those that could affect the digestate quality, if it were an important consideration. Such wastes could compromise the quality of the digestate and hinder land application of the digestate if they were digested in digesters treating source separated BMW). Sewage sludge can contain high levels of heavy metals, and some industrial organic wastes can also be contaminated with heavy metals or other persistent pollutants, making these wastes ideal for co-digestion AD in systems where the digestate will be landfilled or thermally treated (provided the contamination is not too severe to affect AD). It can be seen from Figure 25 that of the 40 anaerobic digesters treating centrally separated OFMSW installed since 2000, 29 are ‘wet’ AD systems and 11 are ‘dry’ AD systems. The dry AD systems are mainly supplied by OWS Dranco and Valorga. While it can not be said that wet systems dominate the market, it is clear that they are more commonly utilised to treat OFMSW than dry anaerobic digesters. One possible reason for this could be the fact that wet pre-treatment techniques could be cheaper or more effective than dry pre-treatment techniques. This report has not attempted to analyse or comment on the effectiveness of mechanical pre-treatment techniques employed at MBT plants. Of the 35 anaerobic
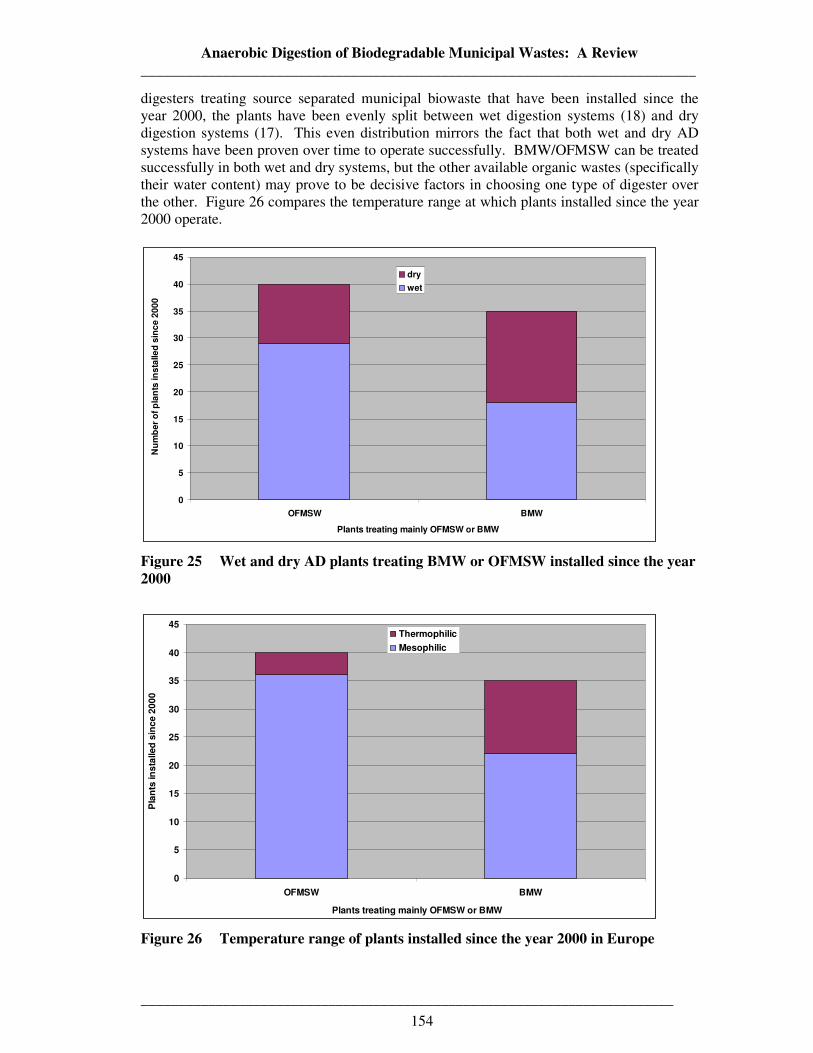
Anaerobic Digestion of Biodegradable Municipal Wastes: A Review __________________________________________________________________________
_______________________________________________________________________
154
digesters treating source separated municipal biowaste that have been installed since the year 2000, the plants have been evenly split between wet digestion systems (18) and dry digestion systems (17). This even distribution mirrors the fact that both wet and dry AD systems have been proven over time to operate successfully. BMW/OFMSW can be treated successfully in both wet and dry systems, but the other available organic wastes (specifically their water content) may prove to be decisive factors in choosing one type of digester over the other. Figure 26 compares the temperature range at which plants installed since the year 2000 operate.
0
5
10
15
20
25
30
35
40
45
OFMSW BMW
Plants treating mainly OFMSW or BMW
Nu
mb
er
of
pla
nts
in
sta
lle
d s
inc
e 2
00
0
dry
wet
Figure 25 Wet and dry AD plants treating BMW or OFMSW installed since the year 2000
0
5
10
15
20
25
30
35
40
45
OFMSW BMW
Plants treating mainly OFMSW or BMW
Pla
nts
in
sta
lled
sin
ce
20
00
Thermophilic
Mesophilic
Figure 26 Temperature range of plants installed since the year 2000 in Europe
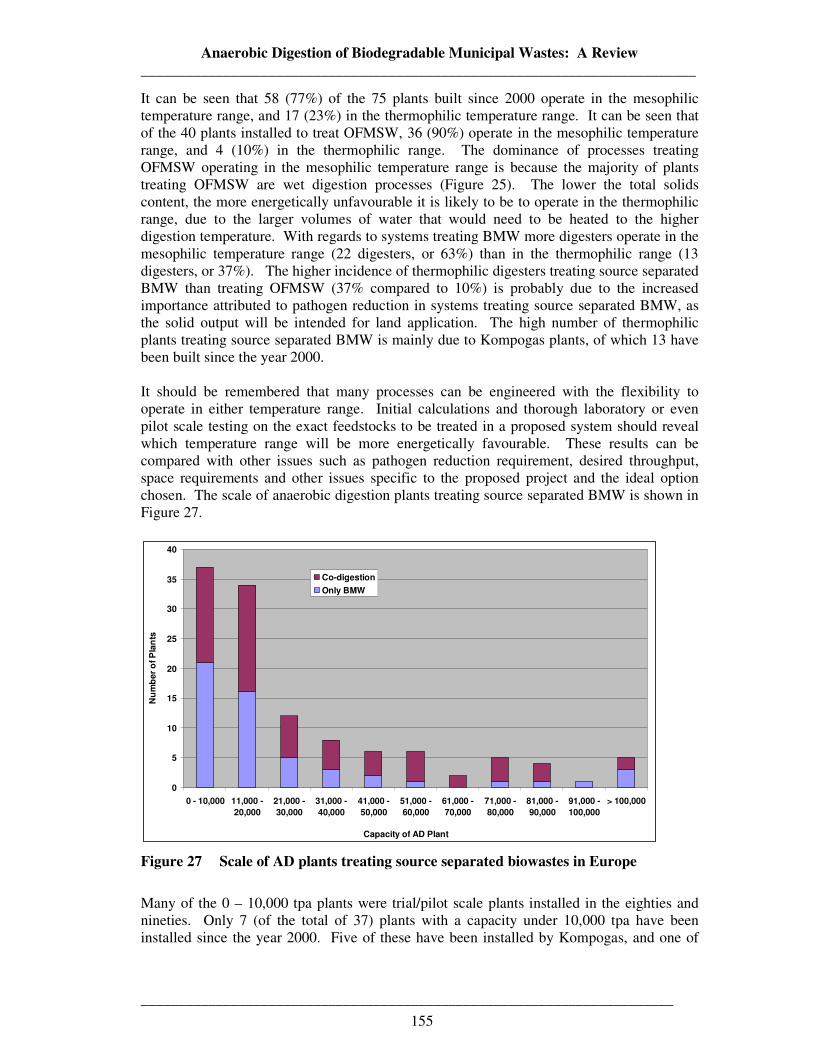
Anaerobic Digestion of Biodegradable Municipal Wastes: A Review __________________________________________________________________________
_______________________________________________________________________
155
It can be seen that 58 (77%) of the 75 plants built since 2000 operate in the mesophilic temperature range, and 17 (23%) in the thermophilic temperature range. It can be seen that of the 40 plants installed to treat OFMSW, 36 (90%) operate in the mesophilic temperature range, and 4 (10%) in the thermophilic range. The dominance of processes treating OFMSW operating in the mesophilic temperature range is because the majority of plants treating OFMSW are wet digestion processes (Figure 25). The lower the total solids content, the more energetically unfavourable it is likely to be to operate in the thermophilic range, due to the larger volumes of water that would need to be heated to the higher digestion temperature. With regards to systems treating BMW more digesters operate in the mesophilic temperature range (22 digesters, or 63%) than in the thermophilic range (13 digesters, or 37%). The higher incidence of thermophilic digesters treating source separated BMW than treating OFMSW (37% compared to 10%) is probably due to the increased importance attributed to pathogen reduction in systems treating source separated BMW, as the solid output will be intended for land application. The high number of thermophilic plants treating source separated BMW is mainly due to Kompogas plants, of which 13 have been built since the year 2000. It should be remembered that many processes can be engineered with the flexibility to operate in either temperature range. Initial calculations and thorough laboratory or even pilot scale testing on the exact feedstocks to be treated in a proposed system should reveal which temperature range will be more energetically favourable. These results can be compared with other issues such as pathogen reduction requirement, desired throughput, space requirements and other issues specific to the proposed project and the ideal option chosen. The scale of anaerobic digestion plants treating source separated BMW is shown in Figure 27.
0
5
10
15
20
25
30
35
40
0 - 10,000 11,000 -
20,000
21,000 -
30,000
31,000 -
40,000
41,000 -
50,000
51,000 -
60,000
61,000 -
70,000
71,000 -
80,000
81,000 -
90,000
91,000 -
100,000
> 100,000
Capacity of AD Plant
Nu
mb
er
of P
lan
ts
Co-digestion
Only BMW
Figure 27 Scale of AD plants treating source separated biowastes in Europe
Many of the 0 – 10,000 tpa plants were trial/pilot scale plants installed in the eighties and nineties. Only 7 (of the total of 37) plants with a capacity under 10,000 tpa have been installed since the year 2000. Five of these have been installed by Kompogas, and one of
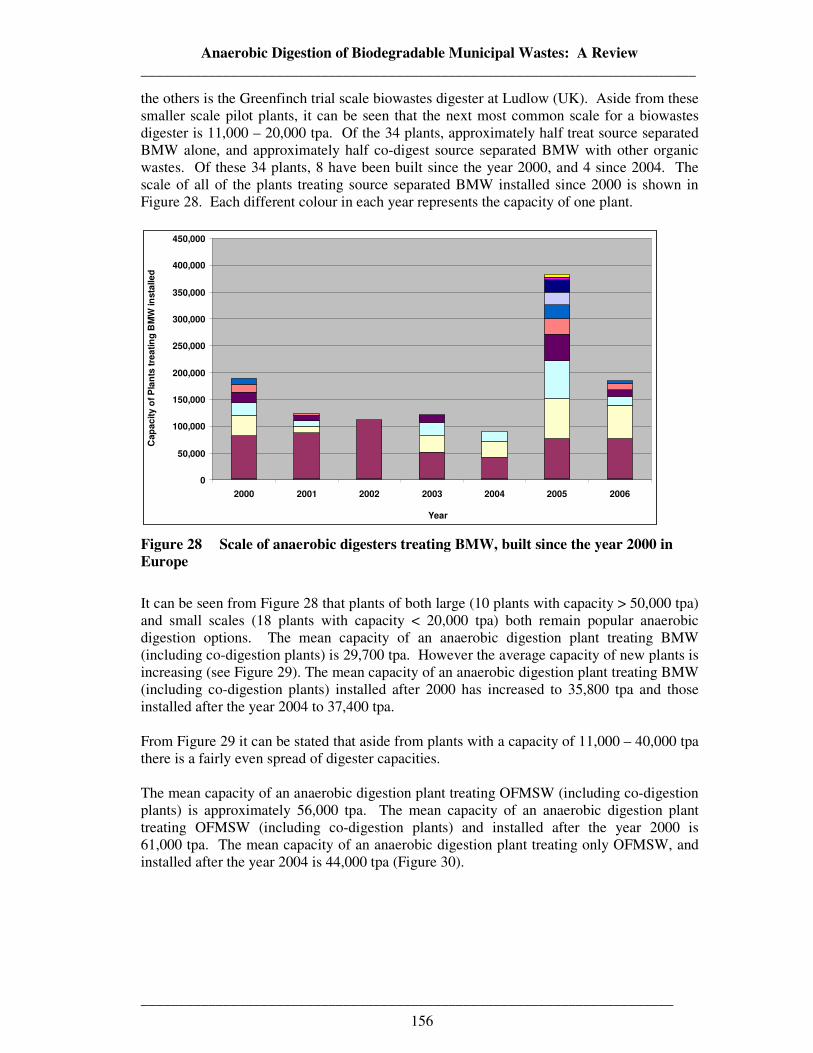
Anaerobic Digestion of Biodegradable Municipal Wastes: A Review __________________________________________________________________________
_______________________________________________________________________
156
the others is the Greenfinch trial scale biowastes digester at Ludlow (UK). Aside from these smaller scale pilot plants, it can be seen that the next most common scale for a biowastes digester is 11,000 – 20,000 tpa. Of the 34 plants, approximately half treat source separated BMW alone, and approximately half co-digest source separated BMW with other organic wastes. Of these 34 plants, 8 have been built since the year 2000, and 4 since 2004. The scale of all of the plants treating source separated BMW installed since 2000 is shown in Figure 28. Each different colour in each year represents the capacity of one plant.
0
50,000
100,000
150,000
200,000
250,000
300,000
350,000
400,000
450,000
2000 2001 2002 2003 2004 2005 2006
Year
Cap
ac
ity
of
Pla
nts
tre
ati
ng
BM
W in
sta
lle
d
Figure 28 Scale of anaerobic digesters treating BMW, built since the year 2000 in Europe
It can be seen from Figure 28 that plants of both large (10 plants with capacity > 50,000 tpa) and small scales (18 plants with capacity < 20,000 tpa) both remain popular anaerobic digestion options. The mean capacity of an anaerobic digestion plant treating BMW (including co-digestion plants) is 29,700 tpa. However the average capacity of new plants is increasing (see Figure 29). The mean capacity of an anaerobic digestion plant treating BMW (including co-digestion plants) installed after 2000 has increased to 35,800 tpa and those installed after the year 2004 to 37,400 tpa. From Figure 29 it can be stated that aside from plants with a capacity of 11,000 – 40,000 tpa there is a fairly even spread of digester capacities. The mean capacity of an anaerobic digestion plant treating OFMSW (including co-digestion plants) is approximately 56,000 tpa. The mean capacity of an anaerobic digestion plant treating OFMSW (including co-digestion plants) and installed after the year 2000 is 61,000 tpa. The mean capacity of an anaerobic digestion plant treating only OFMSW, and installed after the year 2004 is 44,000 tpa (Figure 30).
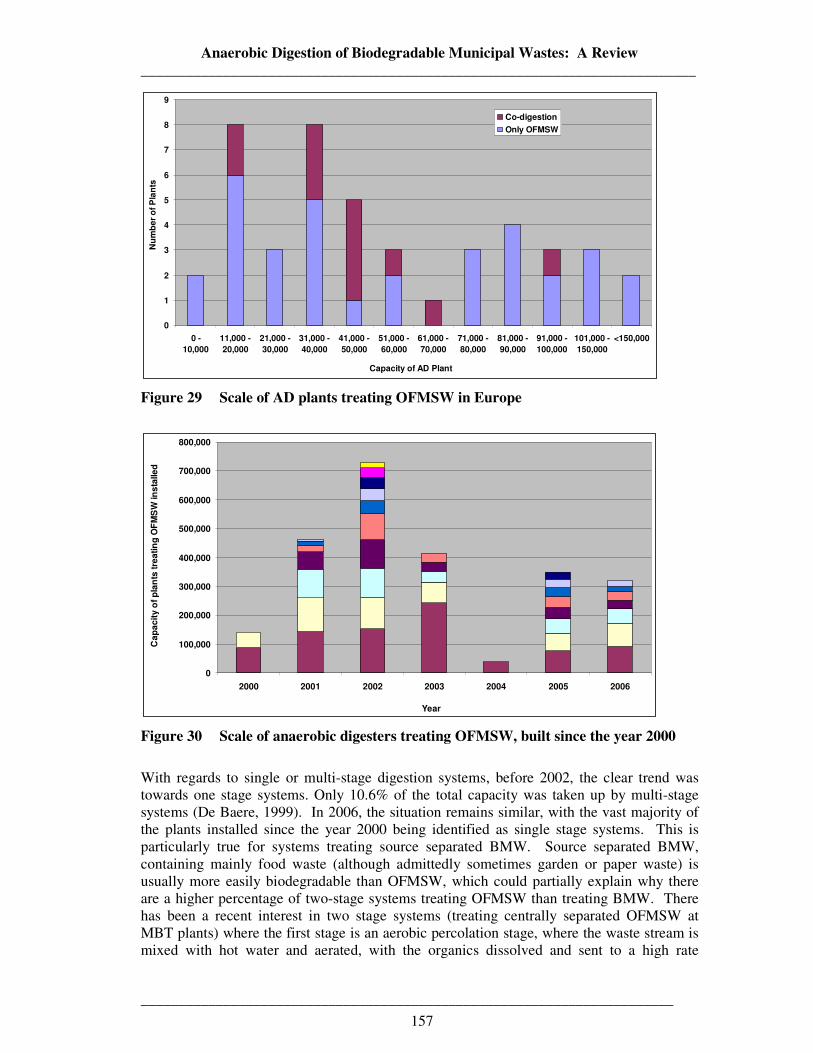
Anaerobic Digestion of Biodegradable Municipal Wastes: A Review __________________________________________________________________________
_______________________________________________________________________
157
0
1
2
3
4
5
6
7
8
9
0 -
10,000
11,000 -
20,000
21,000 -
30,000
31,000 -
40,000
41,000 -
50,000
51,000 -
60,000
61,000 -
70,000
71,000 -
80,000
81,000 -
90,000
91,000 -
100,000
101,000 -
150,000
<150,000
Capacity of AD Plant
Nu
mb
er
of
Pla
nts
Co-digestion
Only OFMSW
Figure 29 Scale of AD plants treating OFMSW in Europe
0
100,000
200,000
300,000
400,000
500,000
600,000
700,000
800,000
2000 2001 2002 2003 2004 2005 2006
Year
Ca
pa
cit
y o
f p
lan
ts t
rea
tin
g O
FM
SW
in
sta
lle
d
Figure 30 Scale of anaerobic digesters treating OFMSW, built since the year 2000
With regards to single or multi-stage digestion systems, before 2002, the clear trend was towards one stage systems. Only 10.6% of the total capacity was taken up by multi-stage systems (De Baere, 1999). In 2006, the situation remains similar, with the vast majority of the plants installed since the year 2000 being identified as single stage systems. This is particularly true for systems treating source separated BMW. Source separated BMW, containing mainly food waste (although admittedly sometimes garden or paper waste) is usually more easily biodegradable than OFMSW, which could partially explain why there are a higher percentage of two-stage systems treating OFMSW than treating BMW. There has been a recent interest in two stage systems (treating centrally separated OFMSW at MBT plants) where the first stage is an aerobic percolation stage, where the waste stream is mixed with hot water and aerated, with the organics dissolved and sent to a high rate
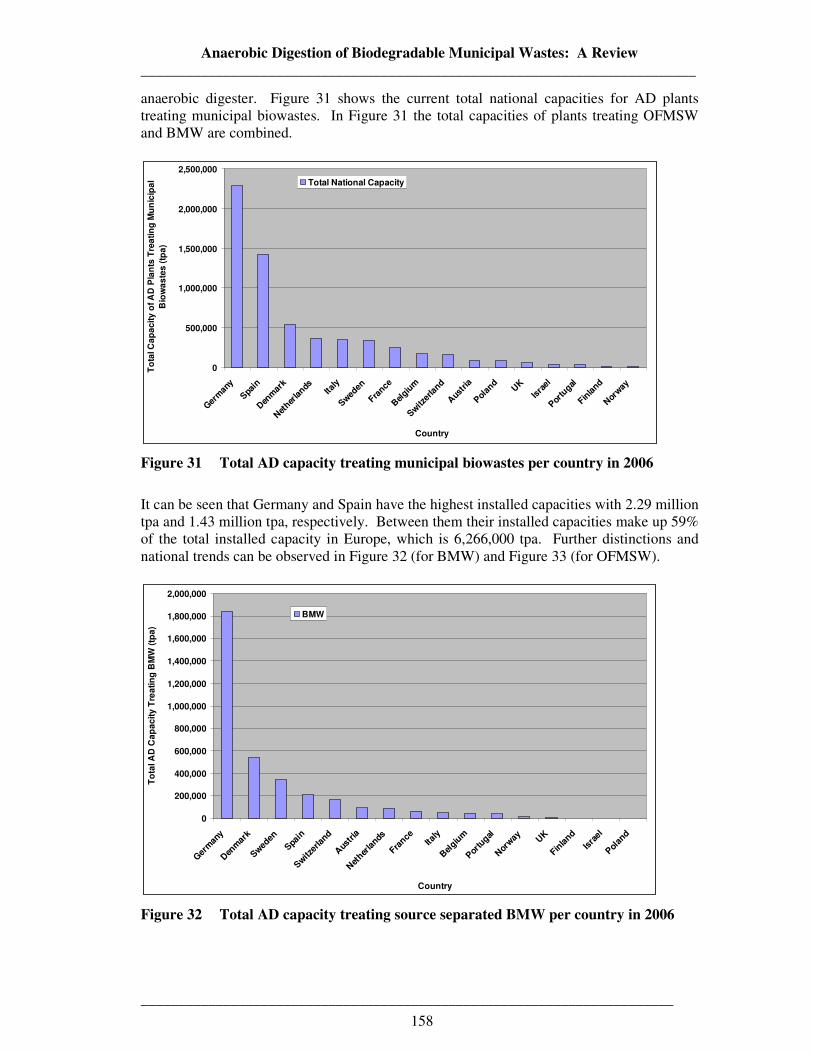
Anaerobic Digestion of Biodegradable Municipal Wastes: A Review __________________________________________________________________________
_______________________________________________________________________
158
anaerobic digester. Figure 31 shows the current total national capacities for AD plants treating municipal biowastes. In Figure 31 the total capacities of plants treating OFMSW and BMW are combined.
0
500,000
1,000,000
1,500,000
2,000,000
2,500,000
Ger
man
y
Spa
in
Den
mar
k
Net
herla
ndsIta
ly
Swed
en
France
Bel
gium
Switz
erla
nd
Aus
tria
Pol
and
UK
Isra
el
Portu
gal
Finla
nd
Nor
way
Country
To
tal C
ap
acit
y o
f A
D P
lan
ts T
rea
tin
g M
un
icip
al
Bio
wa
ste
s (
tpa
)
Total National Capacity
Figure 31 Total AD capacity treating municipal biowastes per country in 2006
It can be seen that Germany and Spain have the highest installed capacities with 2.29 million tpa and 1.43 million tpa, respectively. Between them their installed capacities make up 59% of the total installed capacity in Europe, which is 6,266,000 tpa. Further distinctions and national trends can be observed in Figure 32 (for BMW) and Figure 33 (for OFMSW).
0
200,000
400,000
600,000
800,000
1,000,000
1,200,000
1,400,000
1,600,000
1,800,000
2,000,000
Ger
man
y
Den
mar
k
Swed
en
Spain
Switz
erla
nd
Aus
tria
Net
herla
nds
France
Italy
Bel
gium
Por
tugal
Nor
way U
K
Finla
nd
Isra
el
Pol
and
Country
To
tal A
D C
ap
ac
ity
Tre
ati
ng
BM
W (
tpa
)
BMW
Figure 32 Total AD capacity treating source separated BMW per country in 2006
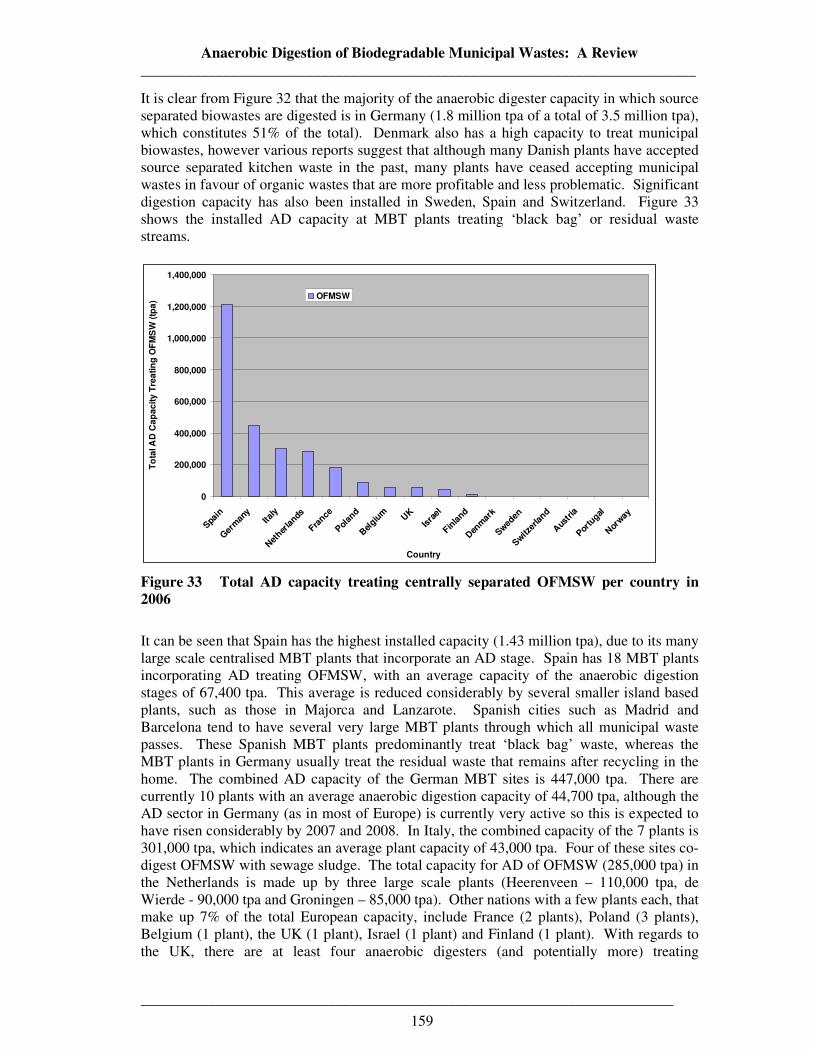
Anaerobic Digestion of Biodegradable Municipal Wastes: A Review __________________________________________________________________________
_______________________________________________________________________
159
It is clear from Figure 32 that the majority of the anaerobic digester capacity in which source separated biowastes are digested is in Germany (1.8 million tpa of a total of 3.5 million tpa), which constitutes 51% of the total). Denmark also has a high capacity to treat municipal biowastes, however various reports suggest that although many Danish plants have accepted source separated kitchen waste in the past, many plants have ceased accepting municipal wastes in favour of organic wastes that are more profitable and less problematic. Significant digestion capacity has also been installed in Sweden, Spain and Switzerland. Figure 33 shows the installed AD capacity at MBT plants treating ‘black bag’ or residual waste streams.
0
200,000
400,000
600,000
800,000
1,000,000
1,200,000
1,400,000
Spa
in
Ger
man
yIta
ly
Net
herla
nds
France
Pol
and
Bel
gium U
K
Isra
el
Finla
nd
Den
mar
k
Swed
en
Switz
erla
nd
Aus
tria
Por
tugal
Nor
way
Country
To
tal A
D C
ap
ac
ity
Tre
ati
ng
OF
MS
W (
tpa
)
OFMSW
Figure 33 Total AD capacity treating centrally separated OFMSW per country in 2006
It can be seen that Spain has the highest installed capacity (1.43 million tpa), due to its many large scale centralised MBT plants that incorporate an AD stage. Spain has 18 MBT plants incorporating AD treating OFMSW, with an average capacity of the anaerobic digestion stages of 67,400 tpa. This average is reduced considerably by several smaller island based plants, such as those in Majorca and Lanzarote. Spanish cities such as Madrid and Barcelona tend to have several very large MBT plants through which all municipal waste passes. These Spanish MBT plants predominantly treat ‘black bag’ waste, whereas the MBT plants in Germany usually treat the residual waste that remains after recycling in the home. The combined AD capacity of the German MBT sites is 447,000 tpa. There are currently 10 plants with an average anaerobic digestion capacity of 44,700 tpa, although the AD sector in Germany (as in most of Europe) is currently very active so this is expected to have risen considerably by 2007 and 2008. In Italy, the combined capacity of the 7 plants is 301,000 tpa, which indicates an average plant capacity of 43,000 tpa. Four of these sites co-digest OFMSW with sewage sludge. The total capacity for AD of OFMSW (285,000 tpa) in the Netherlands is made up by three large scale plants (Heerenveen – 110,000 tpa, de Wierde - 90,000 tpa and Groningen – 85,000 tpa). Other nations with a few plants each, that make up 7% of the total European capacity, include France (2 plants), Poland (3 plants), Belgium (1 plant), the UK (1 plant), Israel (1 plant) and Finland (1 plant). With regards to the UK, there are at least four anaerobic digesters (and potentially more) treating
Anaerobic Digestion of Biodegradable Municipal Wastes: A Review __________________________________________________________________________
_______________________________________________________________________
160
BMW/OFMSW being planned or built. It can be seen that several countries that feature prominently in terms of installed anaerobic digestion capacity to treat biowastes do not have any digesters treating OFMSW (Sweden, Switzerland, Austria). The total amount of organic wastes treated in anaerobic digestion systems that accept municipal organic wastes in Europe is in the region of 6,266,000 tpa, based on the anaerobic capacities of the plants listed in Table 29. This has increased significantly from the estimated value of 1.65 million tpa in 2002 (De Baere, 2001) and 2.8 million tpa of installed capacity in 2004 (California Integrated Wastes Management Board, 2004). Based on a total of 168 plants the mean size of AD plants treating municipal organic waste is approximately 37,000 tpa.
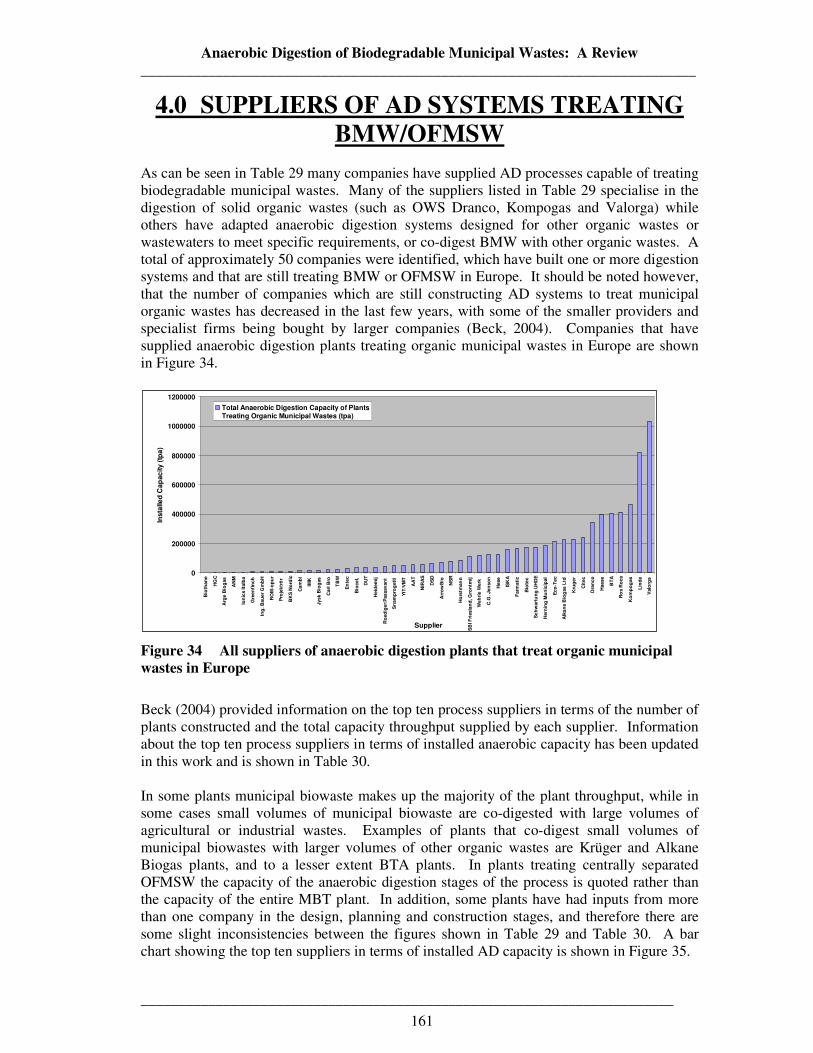
Anaerobic Digestion of Biodegradable Municipal Wastes: A Review __________________________________________________________________________
_______________________________________________________________________
161
4.0 SUPPLIERS OF AD SYSTEMS TREATING BMW/OFMSW
As can be seen in Table 29 many companies have supplied AD processes capable of treating biodegradable municipal wastes. Many of the suppliers listed in Table 29 specialise in the digestion of solid organic wastes (such as OWS Dranco, Kompogas and Valorga) while others have adapted anaerobic digestion systems designed for other organic wastes or wastewaters to meet specific requirements, or co-digest BMW with other organic wastes. A total of approximately 50 companies were identified, which have built one or more digestion systems and that are still treating BMW or OFMSW in Europe. It should be noted however, that the number of companies which are still constructing AD systems to treat municipal organic wastes has decreased in the last few years, with some of the smaller providers and specialist firms being bought by larger companies (Beck, 2004). Companies that have supplied anaerobic digestion plants treating organic municipal wastes in Europe are shown in Figure 34.
0
200000
400000
600000
800000
1000000
1200000
Bio
tha
ne
HG
C
Arg
e B
iog
as
AN
M
Ion
ics Ita
lba
Gre
en
fin
ch
Ing
. B
au
er
Gm
bH
RO
M-o
pu
r
Pro
jek
trö
r
BK
S N
ord
ic
Ca
mb
i
IMK
Jy
sk
Bio
gas
Carl
Bro
TB
W
En
tec
Bio
ce
l,
DU
T
Heid
em
ij
Ro
ed
ige
r/P
as
sav
an
t
Sn
am
pro
gett
i
YIT
/VM
T
AA
T
NIR
AS
DS
D
Arr
ow
Bio
NS
R
Ho
rstm
an
n
SB
I F
riesla
nd
, G
ron
tmij
Weh
rle
Werk
C.G
. Je
nso
n
Hese
ISK
A
Farm
ati
c
Bio
tec
Sc
hw
art
un
g U
HD
E
Hern
ing
Mu
nic
ipal
Eco
-Te
c
Alk
an
e B
iog
as L
td
Kru
ge
r
Cit
ec
Dra
nco
Haa
se
BT
A
Ro
s R
oca
Ko
mp
og
as
Lin
de
Valo
rga
Supplier
Insta
lled
Cap
ac
ity
(tp
a)
Total Anaerobic Digestion Capacity of PlantsTreating Organic Municipal Wastes (tpa)
Figure 34 All suppliers of anaerobic digestion plants that treat organic municipal wastes in Europe
Beck (2004) provided information on the top ten process suppliers in terms of the number of plants constructed and the total capacity throughput supplied by each supplier. Information about the top ten process suppliers in terms of installed anaerobic capacity has been updated in this work and is shown in Table 30. In some plants municipal biowaste makes up the majority of the plant throughput, while in some cases small volumes of municipal biowaste are co-digested with large volumes of agricultural or industrial wastes. Examples of plants that co-digest small volumes of municipal biowastes with larger volumes of other organic wastes are Krüger and Alkane Biogas plants, and to a lesser extent BTA plants. In plants treating centrally separated OFMSW the capacity of the anaerobic digestion stages of the process is quoted rather than the capacity of the entire MBT plant. In addition, some plants have had inputs from more than one company in the design, planning and construction stages, and therefore there are some slight inconsistencies between the figures shown in Table 29 and Table 30. A bar chart showing the top ten suppliers in terms of installed AD capacity is shown in Figure 35.
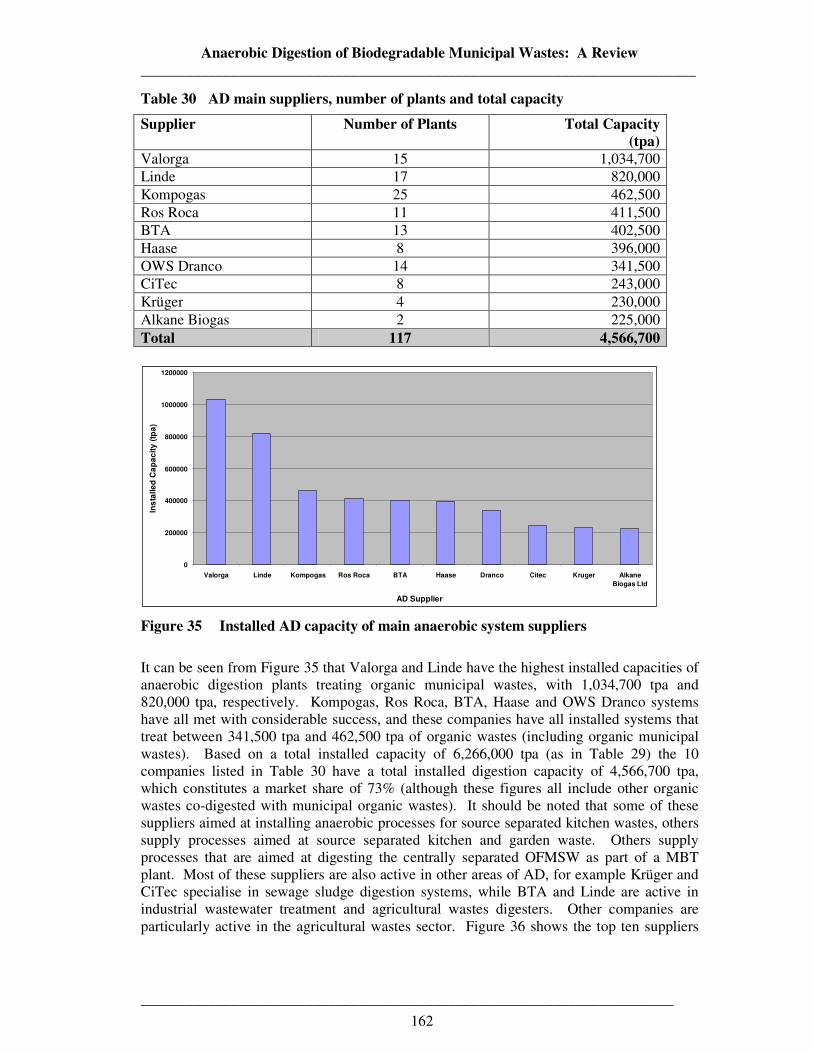
Anaerobic Digestion of Biodegradable Municipal Wastes: A Review __________________________________________________________________________
_______________________________________________________________________
162
Table 30 AD main suppliers, number of plants and total capacity
Supplier Number of Plants Total Capacity (tpa)
Valorga 15 1,034,700 Linde 17 820,000 Kompogas 25 462,500 Ros Roca 11 411,500 BTA 13 402,500 Haase 8 396,000 OWS Dranco 14 341,500 CiTec 8 243,000 Krüger 4 230,000 Alkane Biogas 2 225,000 Total 117 4,566,700
0
200000
400000
600000
800000
1000000
1200000
Valorga Linde Kompogas Ros Roca BTA Haase Dranco Citec Kruger Alkane
Biogas Ltd
AD Supplier
Ins
talle
d C
ap
ac
ity
(tp
a)
Figure 35 Installed AD capacity of main anaerobic system suppliers
It can be seen from Figure 35 that Valorga and Linde have the highest installed capacities of anaerobic digestion plants treating organic municipal wastes, with 1,034,700 tpa and 820,000 tpa, respectively. Kompogas, Ros Roca, BTA, Haase and OWS Dranco systems have all met with considerable success, and these companies have all installed systems that treat between 341,500 tpa and 462,500 tpa of organic wastes (including organic municipal wastes). Based on a total installed capacity of 6,266,000 tpa (as in Table 29) the 10 companies listed in Table 30 have a total installed digestion capacity of 4,566,700 tpa, which constitutes a market share of 73% (although these figures all include other organic wastes co-digested with municipal organic wastes). It should be noted that some of these suppliers aimed at installing anaerobic processes for source separated kitchen wastes, others supply processes aimed at source separated kitchen and garden waste. Others supply processes that are aimed at digesting the centrally separated OFMSW as part of a MBT plant. Most of these suppliers are also active in other areas of AD, for example Krüger and CiTec specialise in sewage sludge digestion systems, while BTA and Linde are active in industrial wastewater treatment and agricultural wastes digesters. Other companies are particularly active in the agricultural wastes sector. Figure 36 shows the top ten suppliers
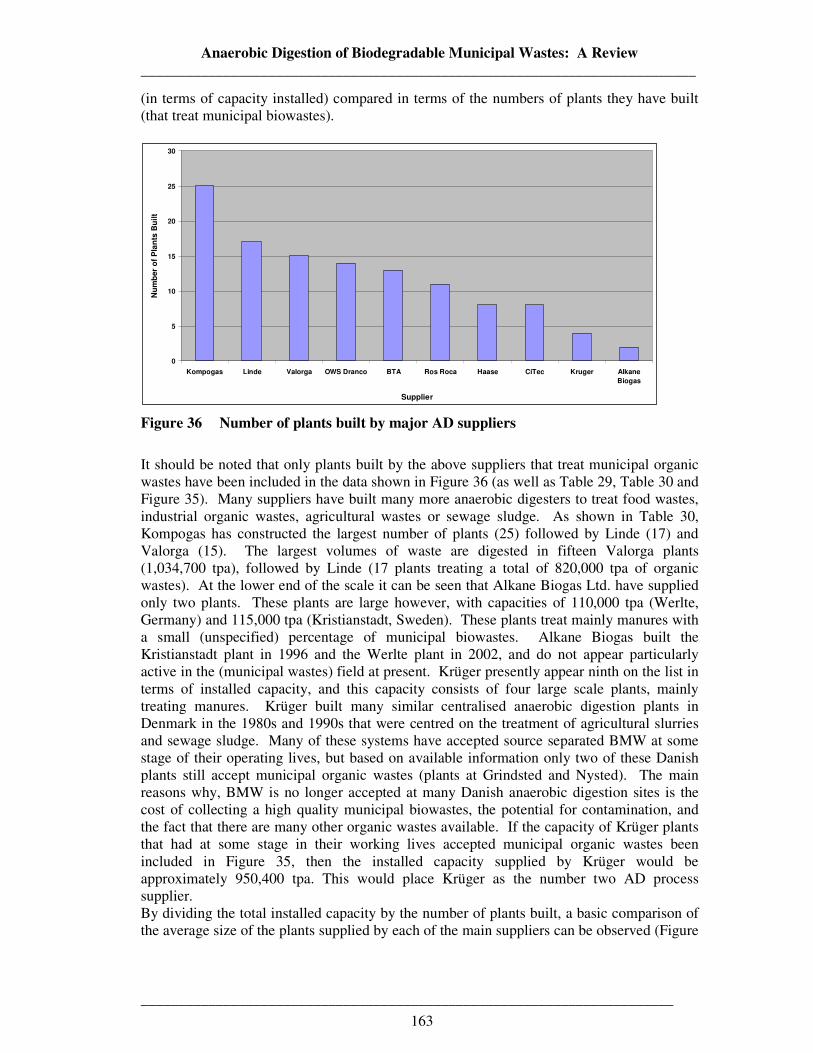
Anaerobic Digestion of Biodegradable Municipal Wastes: A Review __________________________________________________________________________
_______________________________________________________________________
163
(in terms of capacity installed) compared in terms of the numbers of plants they have built (that treat municipal biowastes).
0
5
10
15
20
25
30
Kompogas Linde Valorga OWS Dranco BTA Ros Roca Haase CiTec Kruger Alkane
Biogas
Supplier
Nu
mb
er
of
Pla
nts
Bu
ilt
Figure 36 Number of plants built by major AD suppliers
It should be noted that only plants built by the above suppliers that treat municipal organic wastes have been included in the data shown in Figure 36 (as well as Table 29, Table 30 and Figure 35). Many suppliers have built many more anaerobic digesters to treat food wastes, industrial organic wastes, agricultural wastes or sewage sludge. As shown in Table 30, Kompogas has constructed the largest number of plants (25) followed by Linde (17) and Valorga (15). The largest volumes of waste are digested in fifteen Valorga plants (1,034,700 tpa), followed by Linde (17 plants treating a total of 820,000 tpa of organic wastes). At the lower end of the scale it can be seen that Alkane Biogas Ltd. have supplied only two plants. These plants are large however, with capacities of 110,000 tpa (Werlte, Germany) and 115,000 tpa (Kristianstadt, Sweden). These plants treat mainly manures with a small (unspecified) percentage of municipal biowastes. Alkane Biogas built the Kristianstadt plant in 1996 and the Werlte plant in 2002, and do not appear particularly active in the (municipal wastes) field at present. Krüger presently appear ninth on the list in terms of installed capacity, and this capacity consists of four large scale plants, mainly treating manures. Krüger built many similar centralised anaerobic digestion plants in Denmark in the 1980s and 1990s that were centred on the treatment of agricultural slurries and sewage sludge. Many of these systems have accepted source separated BMW at some stage of their operating lives, but based on available information only two of these Danish plants still accept municipal organic wastes (plants at Grindsted and Nysted). The main reasons why, BMW is no longer accepted at many Danish anaerobic digestion sites is the cost of collecting a high quality municipal biowastes, the potential for contamination, and the fact that there are many other organic wastes available. If the capacity of Krüger plants that had at some stage in their working lives accepted municipal organic wastes been included in Figure 35, then the installed capacity supplied by Krüger would be approximately 950,400 tpa. This would place Krüger as the number two AD process supplier. By dividing the total installed capacity by the number of plants built, a basic comparison of the average size of the plants supplied by each of the main suppliers can be observed (Figure
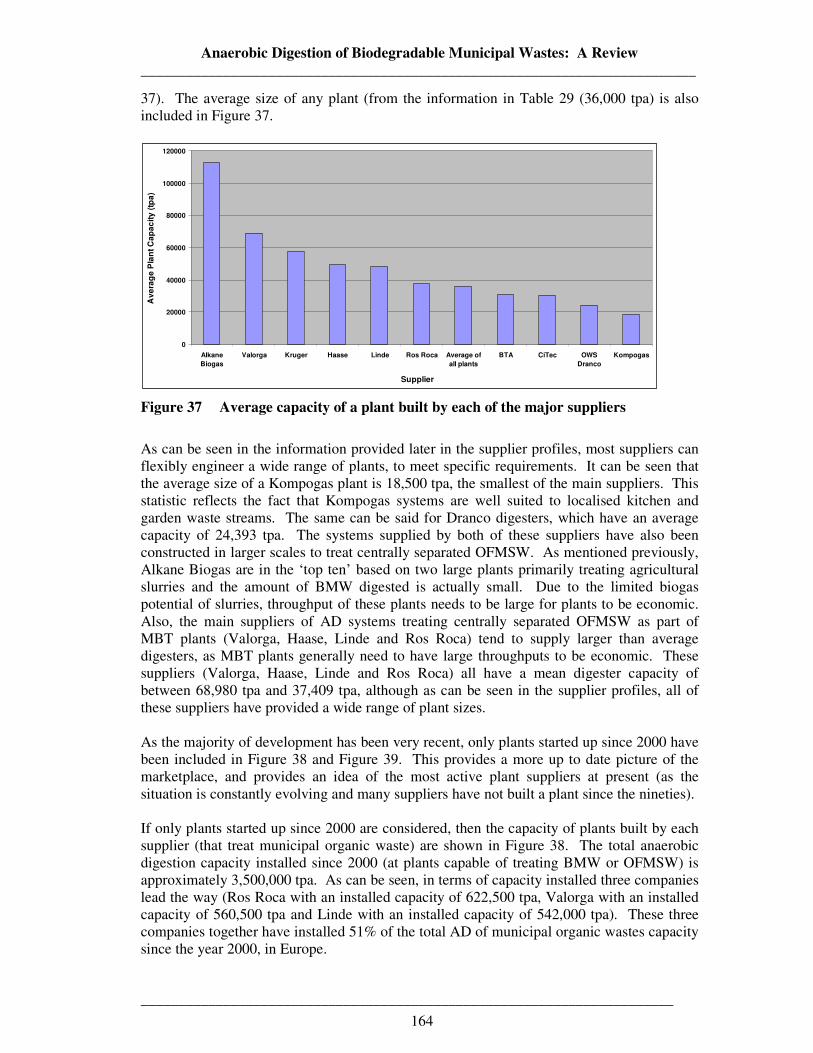
Anaerobic Digestion of Biodegradable Municipal Wastes: A Review __________________________________________________________________________
_______________________________________________________________________
164
37). The average size of any plant (from the information in Table 29 (36,000 tpa) is also included in Figure 37.
0
20000
40000
60000
80000
100000
120000
Alkane
Biogas
Valorga Kruger Haase Linde Ros Roca Average of
all plants
BTA CiTec OWS
Dranco
Kompogas
Supplier
Av
era
ge
Pla
nt
Ca
pa
cit
y (
tpa
)
Figure 37 Average capacity of a plant built by each of the major suppliers
As can be seen in the information provided later in the supplier profiles, most suppliers can flexibly engineer a wide range of plants, to meet specific requirements. It can be seen that the average size of a Kompogas plant is 18,500 tpa, the smallest of the main suppliers. This statistic reflects the fact that Kompogas systems are well suited to localised kitchen and garden waste streams. The same can be said for Dranco digesters, which have an average capacity of 24,393 tpa. The systems supplied by both of these suppliers have also been constructed in larger scales to treat centrally separated OFMSW. As mentioned previously, Alkane Biogas are in the ‘top ten’ based on two large plants primarily treating agricultural slurries and the amount of BMW digested is actually small. Due to the limited biogas potential of slurries, throughput of these plants needs to be large for plants to be economic. Also, the main suppliers of AD systems treating centrally separated OFMSW as part of MBT plants (Valorga, Haase, Linde and Ros Roca) tend to supply larger than average digesters, as MBT plants generally need to have large throughputs to be economic. These suppliers (Valorga, Haase, Linde and Ros Roca) all have a mean digester capacity of between 68,980 tpa and 37,409 tpa, although as can be seen in the supplier profiles, all of these suppliers have provided a wide range of plant sizes. As the majority of development has been very recent, only plants started up since 2000 have been included in Figure 38 and Figure 39. This provides a more up to date picture of the marketplace, and provides an idea of the most active plant suppliers at present (as the situation is constantly evolving and many suppliers have not built a plant since the nineties). If only plants started up since 2000 are considered, then the capacity of plants built by each supplier (that treat municipal organic waste) are shown in Figure 38. The total anaerobic digestion capacity installed since 2000 (at plants capable of treating BMW or OFMSW) is approximately 3,500,000 tpa. As can be seen, in terms of capacity installed three companies lead the way (Ros Roca with an installed capacity of 622,500 tpa, Valorga with an installed capacity of 560,500 tpa and Linde with an installed capacity of 542,000 tpa). These three companies together have installed 51% of the total AD of municipal organic wastes capacity since the year 2000, in Europe.
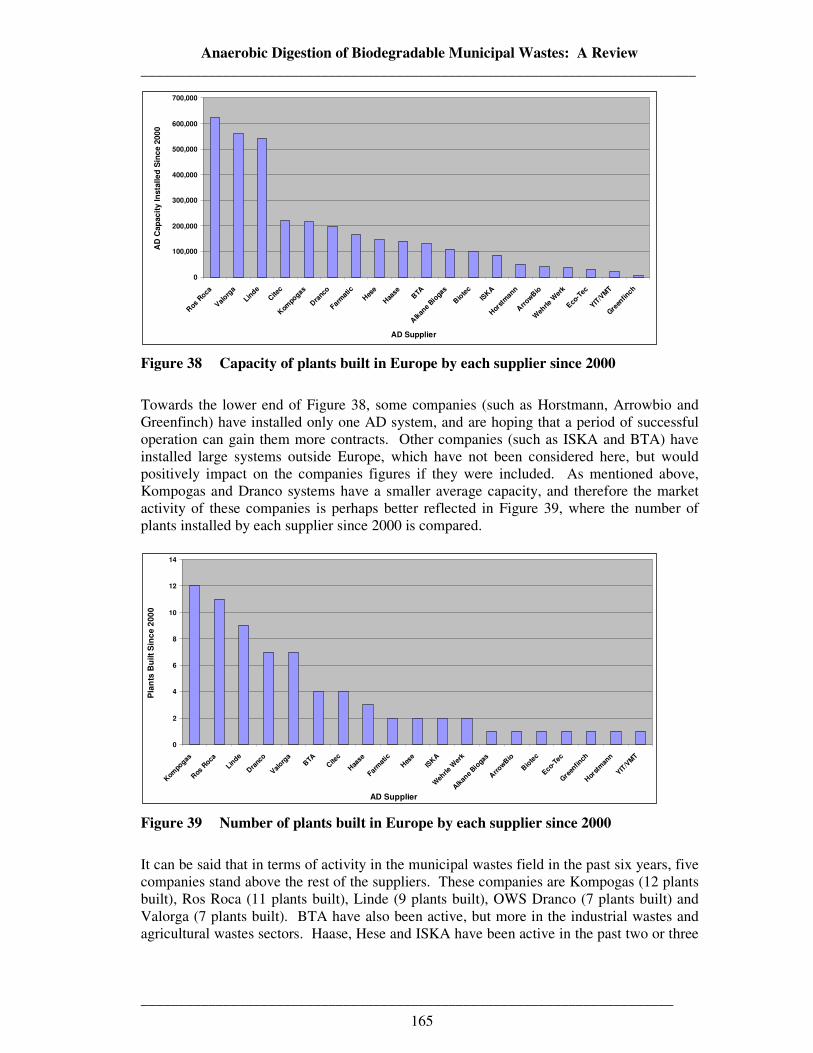
Anaerobic Digestion of Biodegradable Municipal Wastes: A Review __________________________________________________________________________
_______________________________________________________________________
165
0
100,000
200,000
300,000
400,000
500,000
600,000
700,000
Ros
Roca
Valorg
a
Linde
Cite
c
Kom
pogas
Dra
nco
Farm
atic
Hes
e
Haa
seBTA
Alk
ane
Bioga
s
Bio
tec
ISKA
Hor
stm
ann
Arrow
Bio
Weh
rle W
erk
Eco-T
ec
YIT/V
MT
Gre
enfin
ch
AD Supplier
AD
Cap
ac
ity I
nsta
lle
d S
inc
e 2
00
0
Figure 38 Capacity of plants built in Europe by each supplier since 2000
Towards the lower end of Figure 38, some companies (such as Horstmann, Arrowbio and Greenfinch) have installed only one AD system, and are hoping that a period of successful operation can gain them more contracts. Other companies (such as ISKA and BTA) have installed large systems outside Europe, which have not been considered here, but would positively impact on the companies figures if they were included. As mentioned above, Kompogas and Dranco systems have a smaller average capacity, and therefore the market activity of these companies is perhaps better reflected in Figure 39, where the number of plants installed by each supplier since 2000 is compared.
0
2
4
6
8
10
12
14
Kom
pogas
Ros
Roca
Linde
Dra
nco
Val
orga
BTA
Cite
c
Haa
se
Farm
atic
Hes
e
ISKA
Weh
rle W
erk
Alk
ane
Bio
gas
Arrow
Bio
Bio
tec
Eco
-Tec
Gre
enfin
ch
Hor
stm
ann
YIT
/VM
T
AD Supplier
Pla
nts
Bu
ilt
Sin
ce
20
00
Figure 39 Number of plants built in Europe by each supplier since 2000
It can be said that in terms of activity in the municipal wastes field in the past six years, five companies stand above the rest of the suppliers. These companies are Kompogas (12 plants built), Ros Roca (11 plants built), Linde (9 plants built), OWS Dranco (7 plants built) and Valorga (7 plants built). BTA have also been active, but more in the industrial wastes and agricultural wastes sectors. Haase, Hese and ISKA have been active in the past two or three
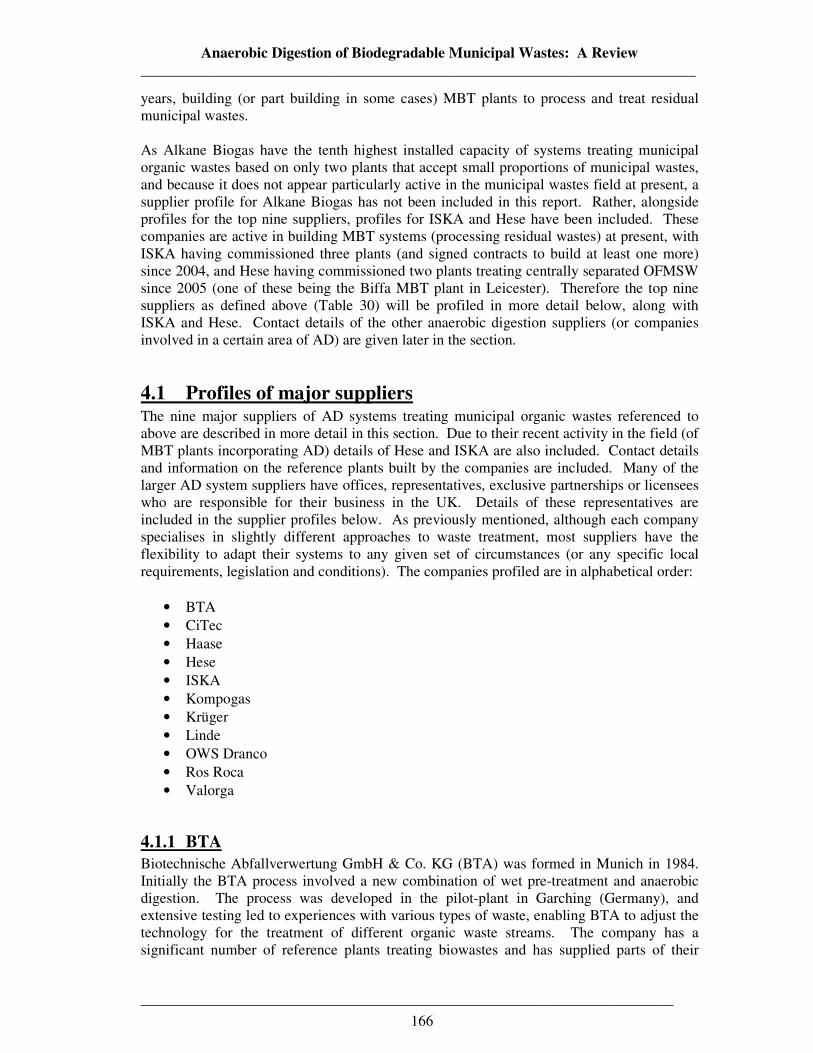
Anaerobic Digestion of Biodegradable Municipal Wastes: A Review __________________________________________________________________________
_______________________________________________________________________
166
years, building (or part building in some cases) MBT plants to process and treat residual municipal wastes. As Alkane Biogas have the tenth highest installed capacity of systems treating municipal organic wastes based on only two plants that accept small proportions of municipal wastes, and because it does not appear particularly active in the municipal wastes field at present, a supplier profile for Alkane Biogas has not been included in this report. Rather, alongside profiles for the top nine suppliers, profiles for ISKA and Hese have been included. These companies are active in building MBT systems (processing residual wastes) at present, with ISKA having commissioned three plants (and signed contracts to build at least one more) since 2004, and Hese having commissioned two plants treating centrally separated OFMSW since 2005 (one of these being the Biffa MBT plant in Leicester). Therefore the top nine suppliers as defined above (Table 30) will be profiled in more detail below, along with ISKA and Hese. Contact details of the other anaerobic digestion suppliers (or companies involved in a certain area of AD) are given later in the section.
4.1 Profiles of major suppliers The nine major suppliers of AD systems treating municipal organic wastes referenced to above are described in more detail in this section. Due to their recent activity in the field (of MBT plants incorporating AD) details of Hese and ISKA are also included. Contact details and information on the reference plants built by the companies are included. Many of the larger AD system suppliers have offices, representatives, exclusive partnerships or licensees who are responsible for their business in the UK. Details of these representatives are included in the supplier profiles below. As previously mentioned, although each company specialises in slightly different approaches to waste treatment, most suppliers have the flexibility to adapt their systems to any given set of circumstances (or any specific local requirements, legislation and conditions). The companies profiled are in alphabetical order:
• BTA • CiTec • Haase • Hese • ISKA • Kompogas • Krüger • Linde • OWS Dranco • Ros Roca • Valorga
4.1.1 BTA
Biotechnische Abfallverwertung GmbH & Co. KG (BTA) was formed in Munich in 1984. Initially the BTA process involved a new combination of wet pre-treatment and anaerobic digestion. The process was developed in the pilot-plant in Garching (Germany), and extensive testing led to experiences with various types of waste, enabling BTA to adjust the technology for the treatment of different organic waste streams. The company has a significant number of reference plants treating biowastes and has supplied parts of their
Anaerobic Digestion of Biodegradable Municipal Wastes: A Review __________________________________________________________________________
_______________________________________________________________________
167
technology for large scale MBT plants. One reference plant where the whole integrated MBT process is being operated in accordance with the BTA design is in Villacidro, Italy. BTA is a globally accepted supplier of wet AD technologies, with many reference plants worldwide. With regards to sizing of plants, BTA can provide flexible solutions, having provided plants with a wide range of capacities (8000 – 150,000 tpa). BTA technologies can treat biowaste alone (e.g. Kirchstockach, Ypres and Karlsruhe), or co-digest biowaste with organic industrial wastes (Mulheim, Newmarket, Wadern-Lockweiler, Dietrichsdorf), sewage sludge (Villacidro) or agricultural wastes (Mertingen). In addition to the reference list above, BTA has also provided many other AD systems treating other organic wastes. BTA has also been involved in the engineering and pre-treatment sections of many other MBT or biowastes treatment plants. For a full list and description of BTA involvement please see Canada Composting website (www.canadacomposting.com/newmarketplant.htm, accessed July 2006). BTA: Key Details Company Name: BTA
Biotechnische Abfallverwertung (BTA) GmbH & Co KG Nationality: German Number of Reference Plants: 13 Date of First Reference Plant: (that is still in operation):
1995 (Dietrichsdorf, Germany).
Case Studies in this Report: Ypres, Belgium. BTA: Contact Details Internet Address: www.bta-technologie.de Contact: Telephone Fax E-mail
Harry Wiljan +49 89 520 460-6 +49 89 523 2329 [email protected] [email protected]
Address of Headquarters:
Biotechnische Abfallverwertung (BTA) GmbH & Co KG Rottmannstrasse 18 D-80333 Munchen, Germany
UK Licensee/Office: PURAC Ltd. Birmingham Road Kidderminster, Worcestershire DY10 2SH, UK
UK Licensee/Office Internet Address: www.purac.net/index2.html UK Licensee/Office Contact: Telephone E-mail
Jerry Quickenden +44 (0)1562 828685 [email protected]
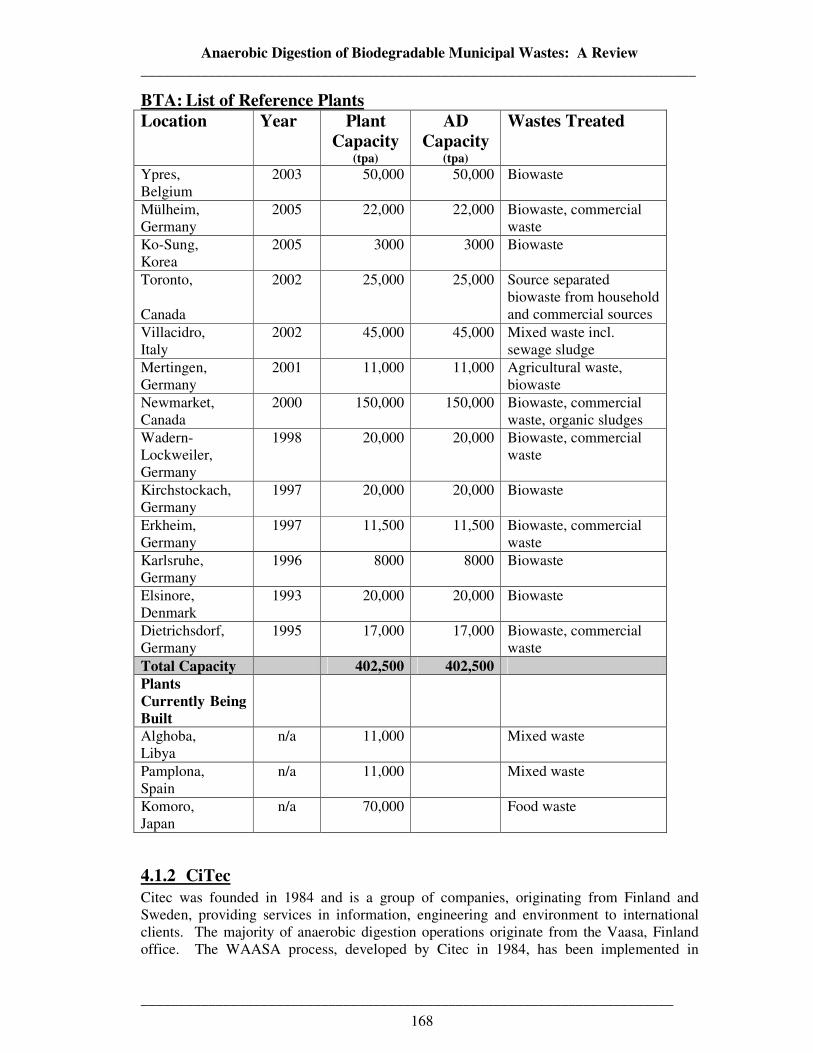
Anaerobic Digestion of Biodegradable Municipal Wastes: A Review __________________________________________________________________________
_______________________________________________________________________
168
BTA: List of Reference Plants Location Year Plant
Capacity (tpa)
AD Capacity
(tpa)
Wastes Treated
Ypres, Belgium
2003 50,000 50,000 Biowaste
Mülheim, Germany
2005 22,000 22,000 Biowaste, commercial waste
Ko-Sung, Korea
2005 3000 3000 Biowaste
Toronto,
Canada
2002 25,000 25,000 Source separated biowaste from household and commercial sources
Villacidro, Italy
2002 45,000 45,000 Mixed waste incl. sewage sludge
Mertingen, Germany
2001 11,000 11,000 Agricultural waste, biowaste
Newmarket, Canada
2000 150,000 150,000 Biowaste, commercial waste, organic sludges
Wadern-Lockweiler, Germany
1998 20,000 20,000 Biowaste, commercial waste
Kirchstockach, Germany
1997 20,000 20,000 Biowaste
Erkheim, Germany
1997 11,500
11,500
Biowaste, commercial waste
Karlsruhe, Germany
1996 8000 8000 Biowaste
Elsinore, Denmark
1993 20,000 20,000 Biowaste
Dietrichsdorf, Germany
1995 17,000 17,000 Biowaste, commercial waste
Total Capacity 402,500 402,500 Plants Currently Being Built
Alghoba, Libya
n/a 11,000
Mixed waste
Pamplona, Spain
n/a 11,000 Mixed waste
Komoro, Japan
n/a 70,000 Food waste
4.1.2 CiTec
Citec was founded in 1984 and is a group of companies, originating from Finland and Sweden, providing services in information, engineering and environment to international clients. The majority of anaerobic digestion operations originate from the Vaasa, Finland office. The WAASA process, developed by Citec in 1984, has been implemented in
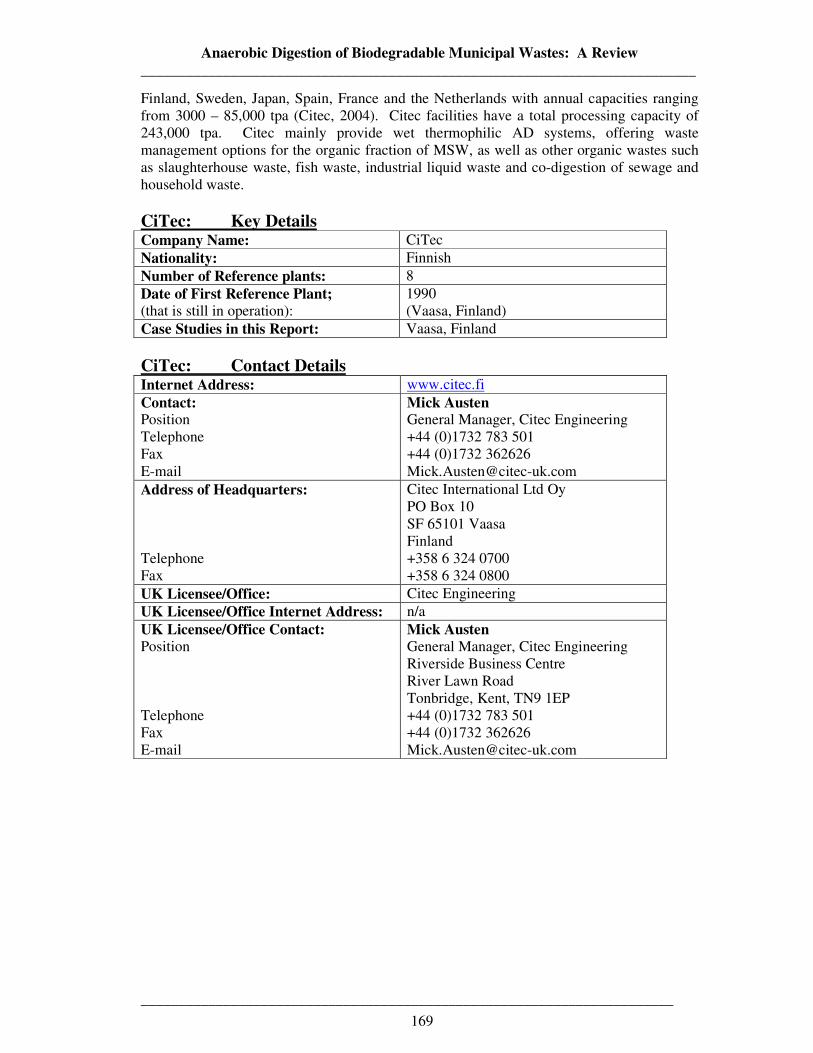
Anaerobic Digestion of Biodegradable Municipal Wastes: A Review __________________________________________________________________________
_______________________________________________________________________
169
Finland, Sweden, Japan, Spain, France and the Netherlands with annual capacities ranging from 3000 – 85,000 tpa (Citec, 2004). Citec facilities have a total processing capacity of 243,000 tpa. Citec mainly provide wet thermophilic AD systems, offering waste management options for the organic fraction of MSW, as well as other organic wastes such as slaughterhouse waste, fish waste, industrial liquid waste and co-digestion of sewage and household waste. CiTec: Key Details Company Name: CiTec Nationality: Finnish Number of Reference plants: 8 Date of First Reference Plant; (that is still in operation):
1990 (Vaasa, Finland)
Case Studies in this Report: Vaasa, Finland CiTec: Contact Details Internet Address: www.citec.fi Contact: Position Telephone Fax E-mail
Mick Austen General Manager, Citec Engineering +44 (0)1732 783 501 +44 (0)1732 362626 [email protected]
Address of Headquarters: Telephone Fax
Citec International Ltd Oy PO Box 10 SF 65101 Vaasa Finland +358 6 324 0700 +358 6 324 0800
UK Licensee/Office: Citec Engineering UK Licensee/Office Internet Address: n/a UK Licensee/Office Contact: Position Telephone Fax E-mail
Mick Austen General Manager, Citec Engineering Riverside Business Centre River Lawn Road Tonbridge, Kent, TN9 1EP +44 (0)1732 783 501 +44 (0)1732 362626 [email protected]
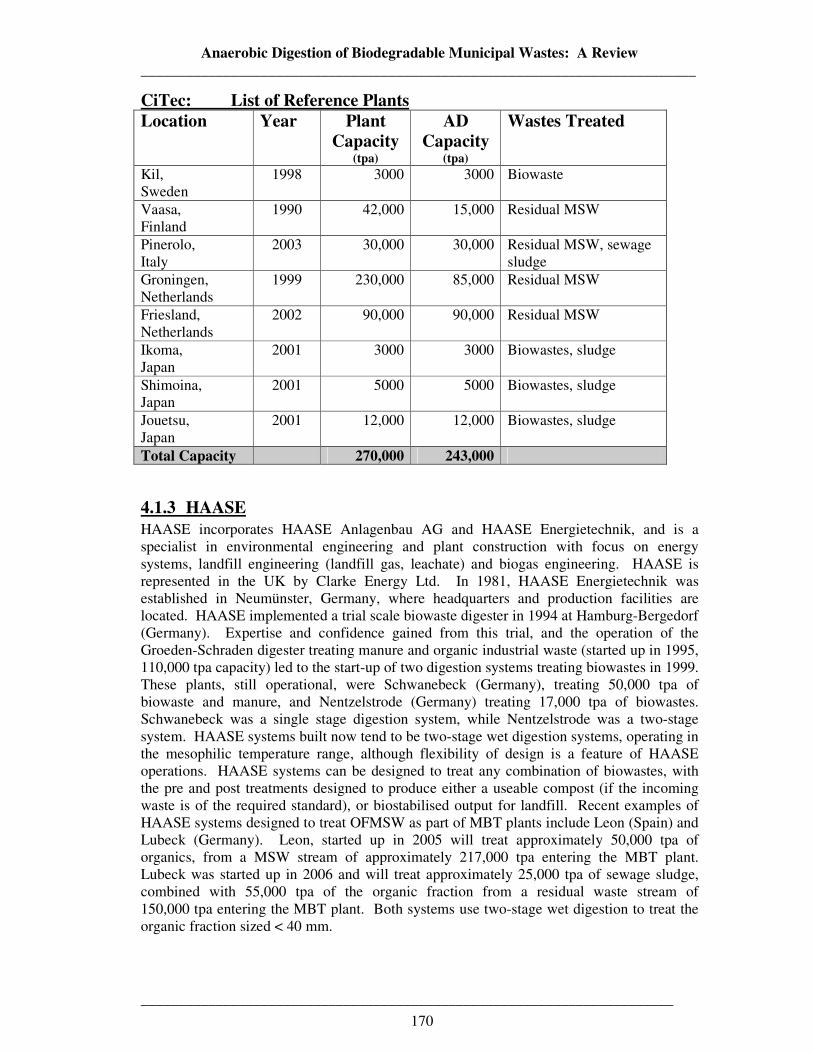
Anaerobic Digestion of Biodegradable Municipal Wastes: A Review __________________________________________________________________________
_______________________________________________________________________
170
CiTec: List of Reference Plants Location Year Plant
Capacity (tpa)
AD Capacity
(tpa)
Wastes Treated
Kil, Sweden
1998 3000 3000 Biowaste
Vaasa, Finland
1990 42,000 15,000 Residual MSW
Pinerolo, Italy
2003 30,000 30,000 Residual MSW, sewage sludge
Groningen, Netherlands
1999 230,000 85,000 Residual MSW
Friesland, Netherlands
2002 90,000 90,000 Residual MSW
Ikoma, Japan
2001 3000 3000 Biowastes, sludge
Shimoina, Japan
2001 5000 5000 Biowastes, sludge
Jouetsu, Japan
2001 12,000 12,000 Biowastes, sludge
Total Capacity 270,000 243,000
4.1.3 HAASE HAASE incorporates HAASE Anlagenbau AG and HAASE Energietechnik, and is a specialist in environmental engineering and plant construction with focus on energy systems, landfill engineering (landfill gas, leachate) and biogas engineering. HAASE is represented in the UK by Clarke Energy Ltd. In 1981, HAASE Energietechnik was established in Neumünster, Germany, where headquarters and production facilities are located. HAASE implemented a trial scale biowaste digester in 1994 at Hamburg-Bergedorf (Germany). Expertise and confidence gained from this trial, and the operation of the Groeden-Schraden digester treating manure and organic industrial waste (started up in 1995, 110,000 tpa capacity) led to the start-up of two digestion systems treating biowastes in 1999. These plants, still operational, were Schwanebeck (Germany), treating 50,000 tpa of biowaste and manure, and Nentzelstrode (Germany) treating 17,000 tpa of biowastes. Schwanebeck was a single stage digestion system, while Nentzelstrode was a two-stage system. HAASE systems built now tend to be two-stage wet digestion systems, operating in the mesophilic temperature range, although flexibility of design is a feature of HAASE operations. HAASE systems can be designed to treat any combination of biowastes, with the pre and post treatments designed to produce either a useable compost (if the incoming waste is of the required standard), or biostabilised output for landfill. Recent examples of HAASE systems designed to treat OFMSW as part of MBT plants include Leon (Spain) and Lubeck (Germany). Leon, started up in 2005 will treat approximately 50,000 tpa of organics, from a MSW stream of approximately 217,000 tpa entering the MBT plant. Lubeck was started up in 2006 and will treat approximately 25,000 tpa of sewage sludge, combined with 55,000 tpa of the organic fraction from a residual waste stream of 150,000 tpa entering the MBT plant. Both systems use two-stage wet digestion to treat the organic fraction sized < 40 mm.
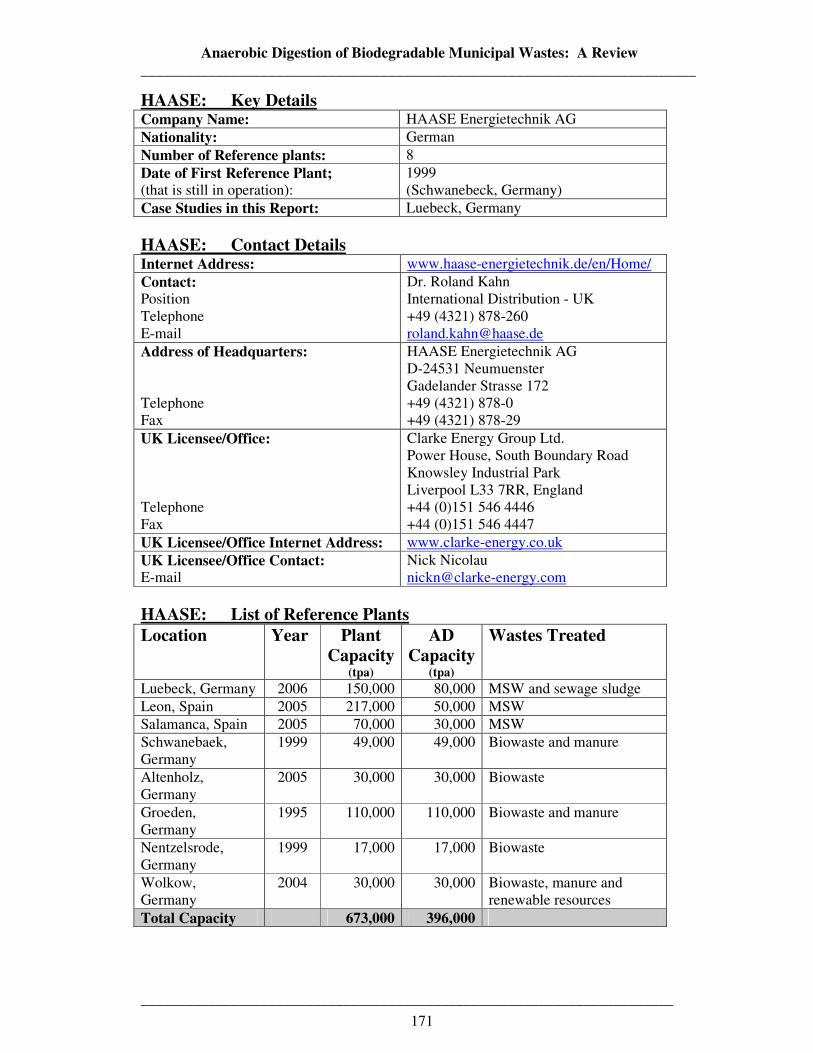
Anaerobic Digestion of Biodegradable Municipal Wastes: A Review __________________________________________________________________________
_______________________________________________________________________
171
HAASE: Key Details Company Name: HAASE Energietechnik AG Nationality: German Number of Reference plants: 8 Date of First Reference Plant; (that is still in operation):
1999 (Schwanebeck, Germany)
Case Studies in this Report: Luebeck, Germany HAASE: Contact Details Internet Address: www.haase-energietechnik.de/en/Home/ Contact: Position Telephone E-mail
Dr. Roland Kahn International Distribution - UK +49 (4321) 878-260 [email protected]
Address of Headquarters: Telephone Fax
HAASE Energietechnik AG D-24531 Neumuenster Gadelander Strasse 172 +49 (4321) 878-0 +49 (4321) 878-29
UK Licensee/Office: Telephone Fax
Clarke Energy Group Ltd. Power House, South Boundary Road Knowsley Industrial Park Liverpool L33 7RR, England +44 (0)151 546 4446 +44 (0)151 546 4447
UK Licensee/Office Internet Address: www.clarke-energy.co.uk UK Licensee/Office Contact: E-mail
Nick Nicolau [email protected]
HAASE: List of Reference Plants Location Year Plant
Capacity (tpa)
AD Capacity
(tpa)
Wastes Treated
Luebeck, Germany 2006 150,000 80,000 MSW and sewage sludge Leon, Spain 2005 217,000 50,000 MSW Salamanca, Spain 2005 70,000 30,000 MSW Schwanebaek, Germany
1999 49,000 49,000 Biowaste and manure
Altenholz, Germany
2005 30,000 30,000 Biowaste
Groeden, Germany
1995 110,000 110,000 Biowaste and manure
Nentzelsrode, Germany
1999 17,000 17,000 Biowaste
Wolkow, Germany
2004 30,000 30,000 Biowaste, manure and renewable resources
Total Capacity 673,000 396,000
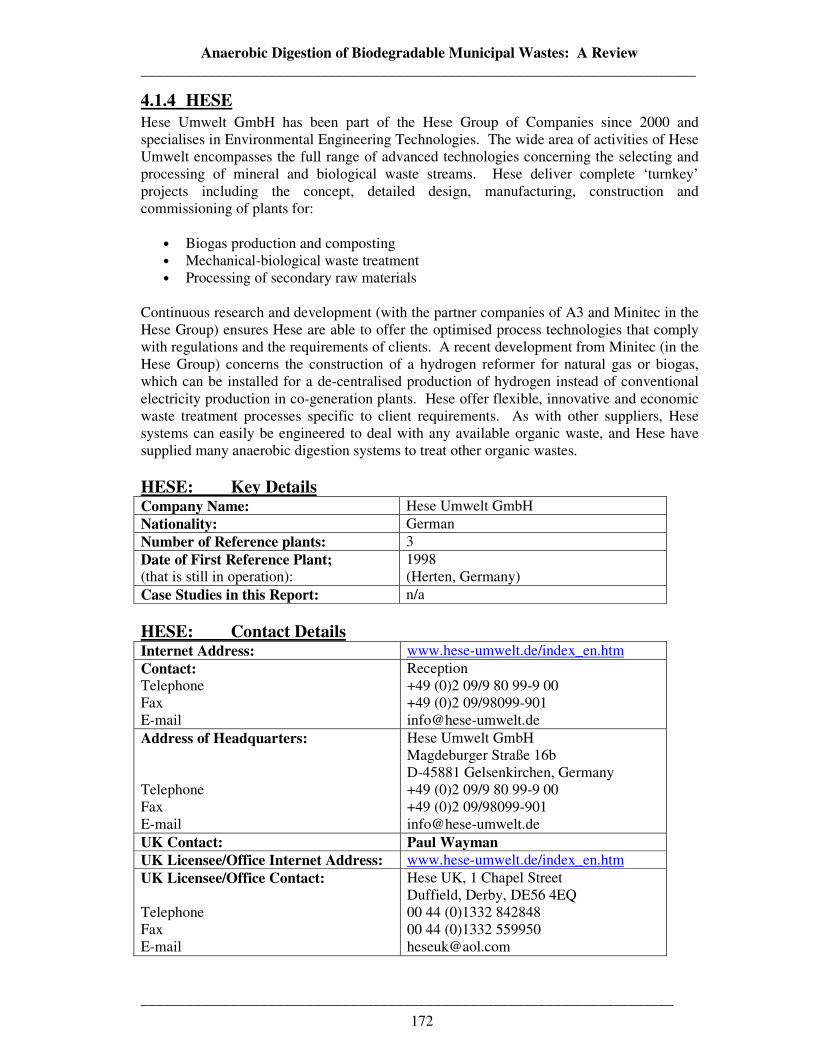
Anaerobic Digestion of Biodegradable Municipal Wastes: A Review __________________________________________________________________________
_______________________________________________________________________
172
4.1.4 HESE Hese Umwelt GmbH has been part of the Hese Group of Companies since 2000 and specialises in Environmental Engineering Technologies. The wide area of activities of Hese Umwelt encompasses the full range of advanced technologies concerning the selecting and processing of mineral and biological waste streams. Hese deliver complete ‘turnkey’ projects including the concept, detailed design, manufacturing, construction and commissioning of plants for:
• Biogas production and composting • Mechanical-biological waste treatment • Processing of secondary raw materials
Continuous research and development (with the partner companies of A3 and Minitec in the Hese Group) ensures Hese are able to offer the optimised process technologies that comply with regulations and the requirements of clients. A recent development from Minitec (in the Hese Group) concerns the construction of a hydrogen reformer for natural gas or biogas, which can be installed for a de-centralised production of hydrogen instead of conventional electricity production in co-generation plants. Hese offer flexible, innovative and economic waste treatment processes specific to client requirements. As with other suppliers, Hese systems can easily be engineered to deal with any available organic waste, and Hese have supplied many anaerobic digestion systems to treat other organic wastes. HESE: Key Details Company Name: Hese Umwelt GmbH Nationality: German Number of Reference plants: 3 Date of First Reference Plant; (that is still in operation):
1998 (Herten, Germany)
Case Studies in this Report: n/a HESE: Contact Details Internet Address: www.hese-umwelt.de/index_en.htm Contact: Telephone Fax E-mail
Reception +49 (0)2 09/9 80 99-9 00 +49 (0)2 09/98099-901 [email protected]
Address of Headquarters: Telephone Fax E-mail
Hese Umwelt GmbH Magdeburger Straße 16b D-45881 Gelsenkirchen, Germany +49 (0)2 09/9 80 99-9 00 +49 (0)2 09/98099-901 [email protected]
UK Contact: Paul Wayman UK Licensee/Office Internet Address: www.hese-umwelt.de/index_en.htm UK Licensee/Office Contact: Telephone Fax E-mail
Hese UK, 1 Chapel Street Duffield, Derby, DE56 4EQ 00 44 (0)1332 842848 00 44 (0)1332 559950 [email protected]
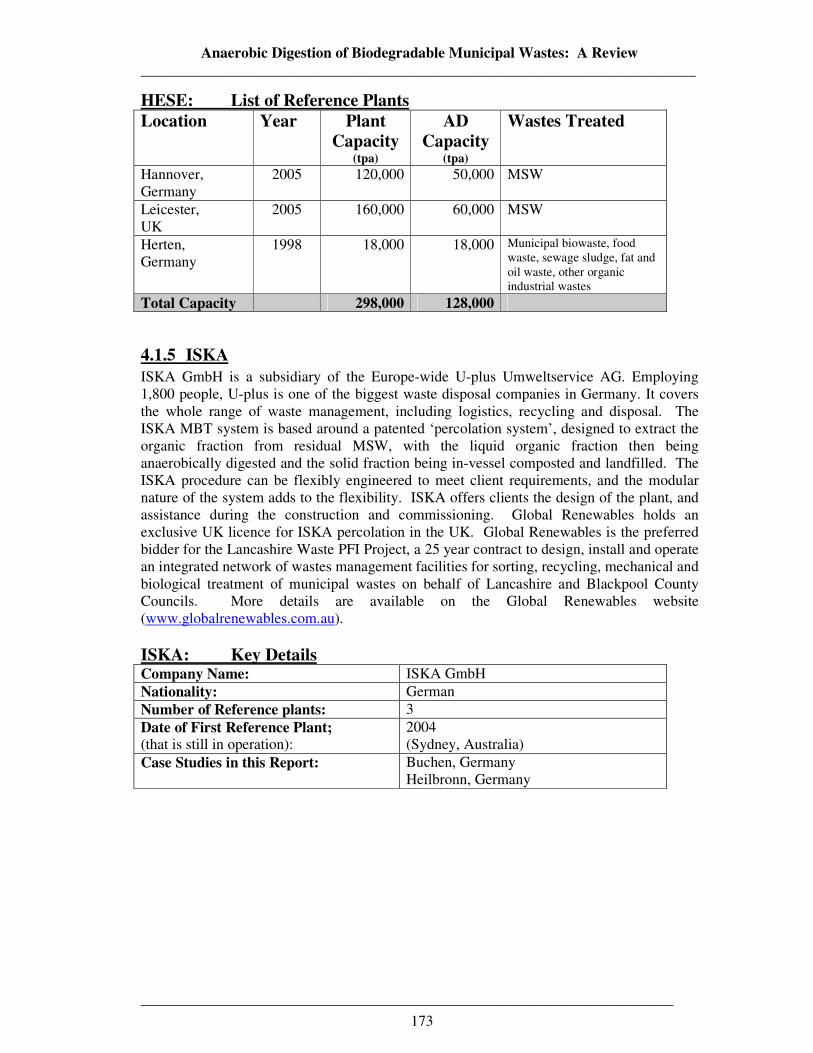
Anaerobic Digestion of Biodegradable Municipal Wastes: A Review __________________________________________________________________________
_______________________________________________________________________
173
HESE: List of Reference Plants Location Year Plant
Capacity (tpa)
AD Capacity
(tpa)
Wastes Treated
Hannover, Germany
2005 120,000 50,000 MSW
Leicester, UK
2005 160,000 60,000 MSW
Herten, Germany
1998 18,000 18,000 Municipal biowaste, food waste, sewage sludge, fat and oil waste, other organic industrial wastes
Total Capacity 298,000 128,000
4.1.5 ISKA ISKA GmbH is a subsidiary of the Europe-wide U-plus Umweltservice AG. Employing 1,800 people, U-plus is one of the biggest waste disposal companies in Germany. It covers the whole range of waste management, including logistics, recycling and disposal. The ISKA MBT system is based around a patented ‘percolation system’, designed to extract the organic fraction from residual MSW, with the liquid organic fraction then being anaerobically digested and the solid fraction being in-vessel composted and landfilled. The ISKA procedure can be flexibly engineered to meet client requirements, and the modular nature of the system adds to the flexibility. ISKA offers clients the design of the plant, and assistance during the construction and commissioning. Global Renewables holds an exclusive UK licence for ISKA percolation in the UK. Global Renewables is the preferred bidder for the Lancashire Waste PFI Project, a 25 year contract to design, install and operate an integrated network of wastes management facilities for sorting, recycling, mechanical and biological treatment of municipal wastes on behalf of Lancashire and Blackpool County Councils. More details are available on the Global Renewables website (www.globalrenewables.com.au). ISKA: Key Details Company Name: ISKA GmbH Nationality: German Number of Reference plants: 3 Date of First Reference Plant; (that is still in operation):
2004 (Sydney, Australia)
Case Studies in this Report:
Buchen, Germany Heilbronn, Germany
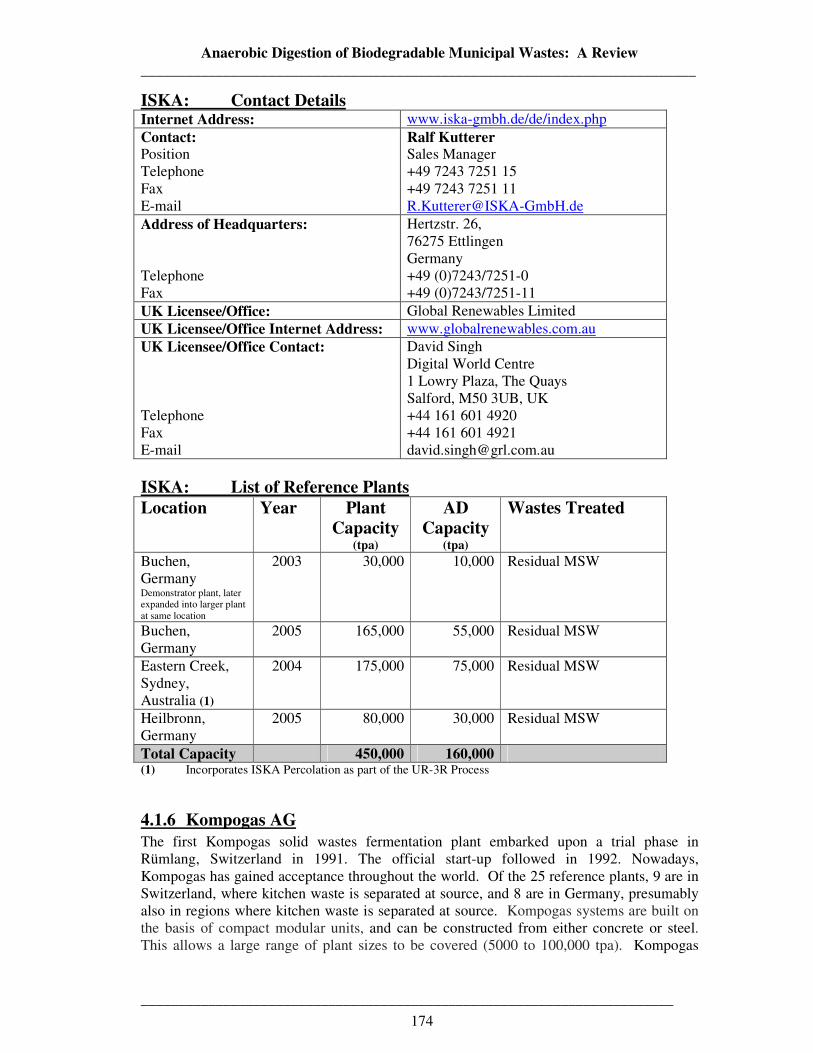
Anaerobic Digestion of Biodegradable Municipal Wastes: A Review __________________________________________________________________________
_______________________________________________________________________
174
ISKA: Contact Details Internet Address: www.iska-gmbh.de/de/index.php Contact: Position Telephone Fax E-mail
Ralf Kutterer Sales Manager +49 7243 7251 15 +49 7243 7251 11 [email protected]
Address of Headquarters: Telephone Fax
Hertzstr. 26, 76275 Ettlingen Germany +49 (0)7243/7251-0 +49 (0)7243/7251-11
UK Licensee/Office: Global Renewables Limited UK Licensee/Office Internet Address: www.globalrenewables.com.au UK Licensee/Office Contact: Telephone Fax E-mail
David Singh Digital World Centre 1 Lowry Plaza, The Quays Salford, M50 3UB, UK +44 161 601 4920 +44 161 601 4921 [email protected]
ISKA: List of Reference Plants Location Year Plant
Capacity (tpa)
AD Capacity
(tpa)
Wastes Treated
Buchen, Germany Demonstrator plant, later expanded into larger plant at same location
2003 30,000 10,000 Residual MSW
Buchen, Germany
2005 165,000 55,000 Residual MSW
Eastern Creek, Sydney, Australia (1)
2004 175,000 75,000 Residual MSW
Heilbronn, Germany
2005 80,000 30,000 Residual MSW
Total Capacity 450,000 160,000 (1) Incorporates ISKA Percolation as part of the UR-3R Process
4.1.6 Kompogas AG The first Kompogas solid wastes fermentation plant embarked upon a trial phase in Rümlang, Switzerland in 1991. The official start-up followed in 1992. Nowadays, Kompogas has gained acceptance throughout the world. Of the 25 reference plants, 9 are in Switzerland, where kitchen waste is separated at source, and 8 are in Germany, presumably also in regions where kitchen waste is separated at source. Kompogas systems are built on the basis of compact modular units, and can be constructed from either concrete or steel. This allows a large range of plant sizes to be covered (5000 to 100,000 tpa). Kompogas
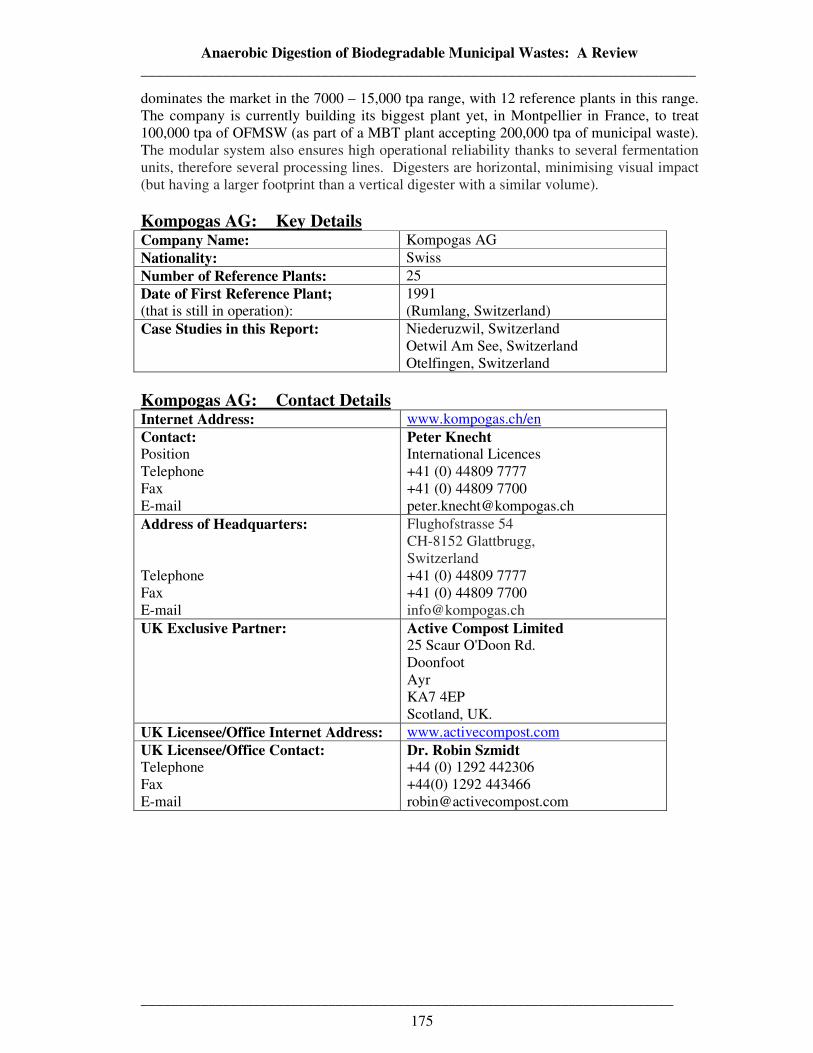
Anaerobic Digestion of Biodegradable Municipal Wastes: A Review __________________________________________________________________________
_______________________________________________________________________
175
dominates the market in the 7000 – 15,000 tpa range, with 12 reference plants in this range. The company is currently building its biggest plant yet, in Montpellier in France, to treat 100,000 tpa of OFMSW (as part of a MBT plant accepting 200,000 tpa of municipal waste). The modular system also ensures high operational reliability thanks to several fermentation units, therefore several processing lines. Digesters are horizontal, minimising visual impact (but having a larger footprint than a vertical digester with a similar volume). Kompogas AG: Key Details Company Name: Kompogas AG Nationality: Swiss Number of Reference Plants: 25 Date of First Reference Plant; (that is still in operation):
1991 (Rumlang, Switzerland)
Case Studies in this Report:
Niederuzwil, Switzerland Oetwil Am See, Switzerland Otelfingen, Switzerland
Kompogas AG: Contact Details Internet Address: www.kompogas.ch/en Contact: Position Telephone Fax E-mail
Peter Knecht International Licences +41 (0) 44809 7777 +41 (0) 44809 7700 [email protected]
Address of Headquarters: Telephone Fax E-mail
Flughofstrasse 54 CH-8152 Glattbrugg, Switzerland +41 (0) 44809 7777 +41 (0) 44809 7700 [email protected]
UK Exclusive Partner: Active Compost Limited 25 Scaur O'Doon Rd. Doonfoot Ayr KA7 4EP Scotland, UK.
UK Licensee/Office Internet Address: www.activecompost.com UK Licensee/Office Contact: Telephone Fax E-mail
Dr. Robin Szmidt +44 (0) 1292 442306 +44(0) 1292 443466 [email protected]
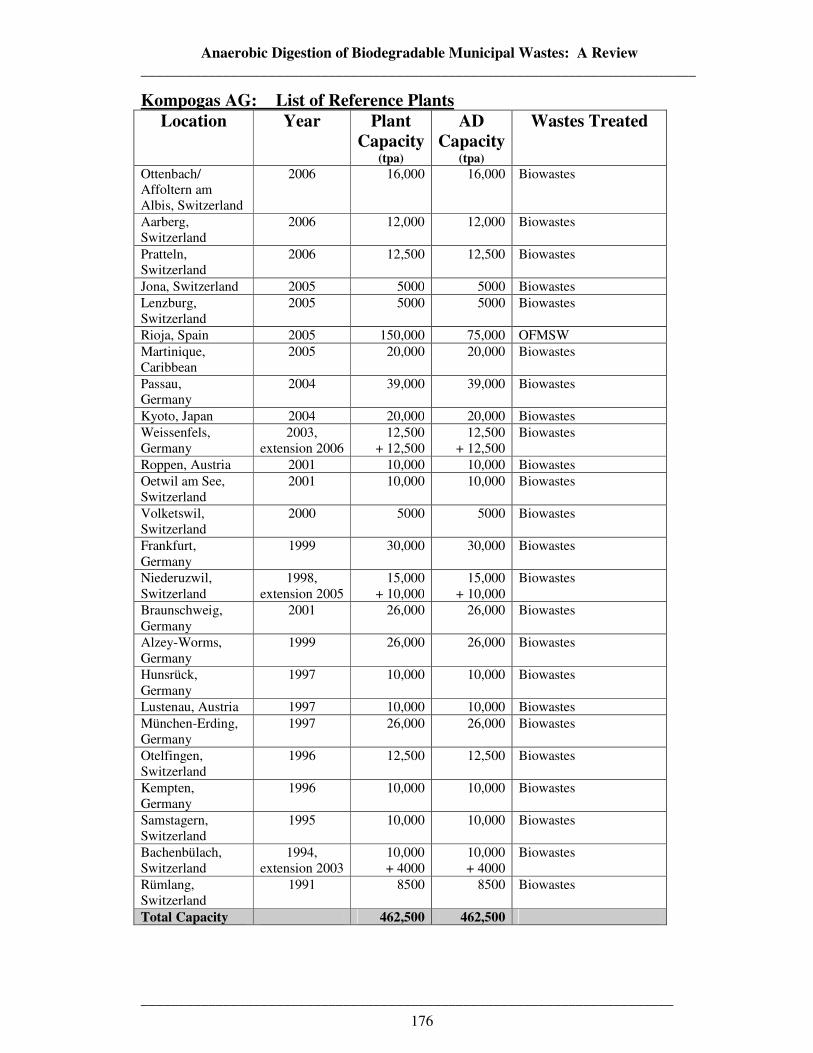
Anaerobic Digestion of Biodegradable Municipal Wastes: A Review __________________________________________________________________________
_______________________________________________________________________
176
Kompogas AG: List of Reference Plants Location Year Plant
Capacity (tpa)
AD Capacity
(tpa)
Wastes Treated
Ottenbach/ Affoltern am Albis, Switzerland
2006 16,000 16,000 Biowastes
Aarberg, Switzerland
2006 12,000
12,000
Biowastes
Pratteln, Switzerland
2006 12,500
12,500
Biowastes
Jona, Switzerland 2005 5000 5000 Biowastes Lenzburg, Switzerland
2005 5000 5000 Biowastes
Rioja, Spain 2005 150,000 75,000 OFMSW Martinique, Caribbean
2005 20,000 20,000 Biowastes
Passau, Germany
2004 39,000 39,000 Biowastes
Kyoto, Japan 2004 20,000 20,000 Biowastes Weissenfels, Germany
2003, extension 2006
12,500 + 12,500
12,500 + 12,500
Biowastes
Roppen, Austria 2001 10,000 10,000 Biowastes Oetwil am See, Switzerland
2001
10,000 10,000 Biowastes
Volketswil, Switzerland
2000
5000 5000 Biowastes
Frankfurt, Germany
1999
30,000 30,000 Biowastes
Niederuzwil, Switzerland
1998, extension 2005
15,000 + 10,000
15,000 + 10,000
Biowastes
Braunschweig, Germany
2001
26,000 26,000 Biowastes
Alzey-Worms, Germany
1999
26,000 26,000 Biowastes
Hunsrück, Germany
1997 10,000 10,000 Biowastes
Lustenau, Austria 1997 10,000 10,000 Biowastes München-Erding, Germany
1997
26,000 26,000 Biowastes
Otelfingen, Switzerland
1996
12,500 12,500 Biowastes
Kempten, Germany
1996
10,000 10,000 Biowastes
Samstagern, Switzerland
1995 10,000 10,000 Biowastes
Bachenbülach, Switzerland
1994, extension 2003
10,000 + 4000
10,000 + 4000
Biowastes
Rümlang, Switzerland
1991 8500 8500 Biowastes
Total Capacity 462,500 462,500
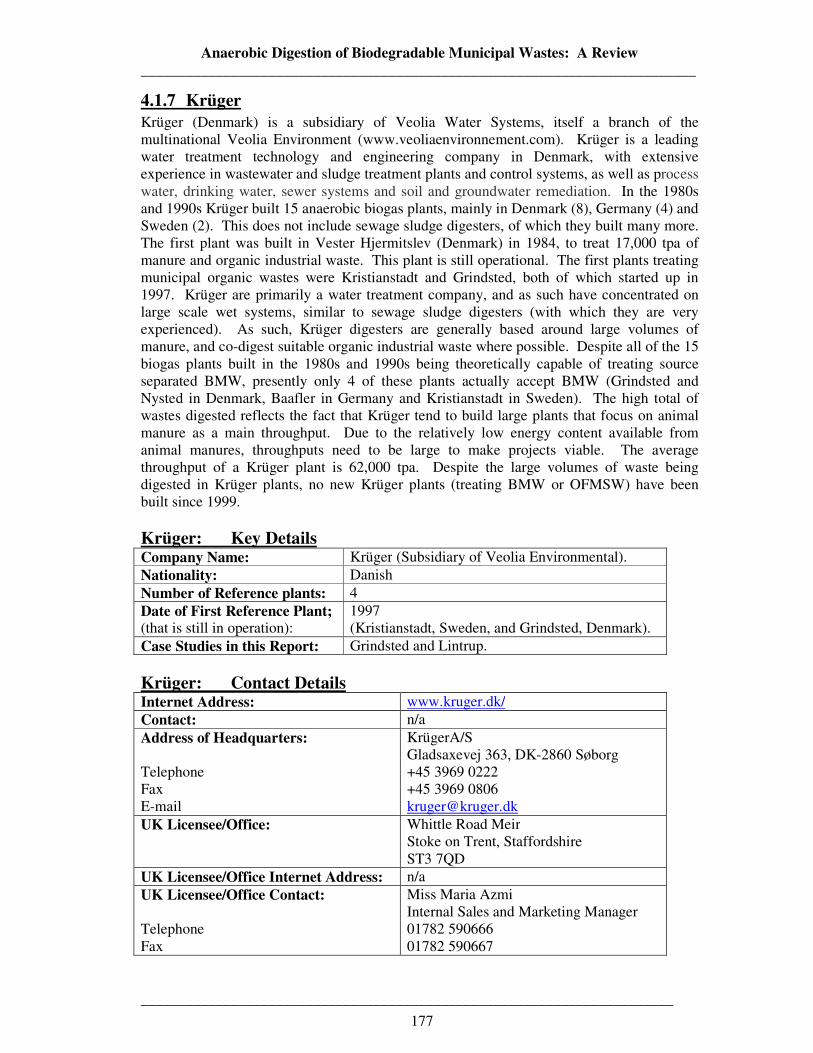
Anaerobic Digestion of Biodegradable Municipal Wastes: A Review __________________________________________________________________________
_______________________________________________________________________
177
4.1.7 Krüger Krüger (Denmark) is a subsidiary of Veolia Water Systems, itself a branch of the multinational Veolia Environment (www.veoliaenvironnement.com). Krüger is a leading water treatment technology and engineering company in Denmark, with extensive experience in wastewater and sludge treatment plants and control systems, as well as process water, drinking water, sewer systems and soil and groundwater remediation. In the 1980s and 1990s Krüger built 15 anaerobic biogas plants, mainly in Denmark (8), Germany (4) and Sweden (2). This does not include sewage sludge digesters, of which they built many more. The first plant was built in Vester Hjermitslev (Denmark) in 1984, to treat 17,000 tpa of manure and organic industrial waste. This plant is still operational. The first plants treating municipal organic wastes were Kristianstadt and Grindsted, both of which started up in 1997. Krüger are primarily a water treatment company, and as such have concentrated on large scale wet systems, similar to sewage sludge digesters (with which they are very experienced). As such, Krüger digesters are generally based around large volumes of manure, and co-digest suitable organic industrial waste where possible. Despite all of the 15 biogas plants built in the 1980s and 1990s being theoretically capable of treating source separated BMW, presently only 4 of these plants actually accept BMW (Grindsted and Nysted in Denmark, Baafler in Germany and Kristianstadt in Sweden). The high total of wastes digested reflects the fact that Krüger tend to build large plants that focus on animal manure as a main throughput. Due to the relatively low energy content available from animal manures, throughputs need to be large to make projects viable. The average throughput of a Krüger plant is 62,000 tpa. Despite the large volumes of waste being digested in Krüger plants, no new Krüger plants (treating BMW or OFMSW) have been built since 1999. Krüger: Key Details Company Name: Krüger (Subsidiary of Veolia Environmental). Nationality: Danish Number of Reference plants: 4 Date of First Reference Plant; (that is still in operation):
1997 (Kristianstadt, Sweden, and Grindsted, Denmark).
Case Studies in this Report: Grindsted and Lintrup. Krüger: Contact Details Internet Address: www.kruger.dk/ Contact: n/a Address of Headquarters: Telephone Fax E-mail
KrügerA/S Gladsaxevej 363, DK-2860 Søborg +45 3969 0222 +45 3969 0806 [email protected]
UK Licensee/Office: Whittle Road Meir Stoke on Trent, Staffordshire ST3 7QD
UK Licensee/Office Internet Address: n/a UK Licensee/Office Contact: Telephone Fax
Miss Maria Azmi Internal Sales and Marketing Manager 01782 590666 01782 590667
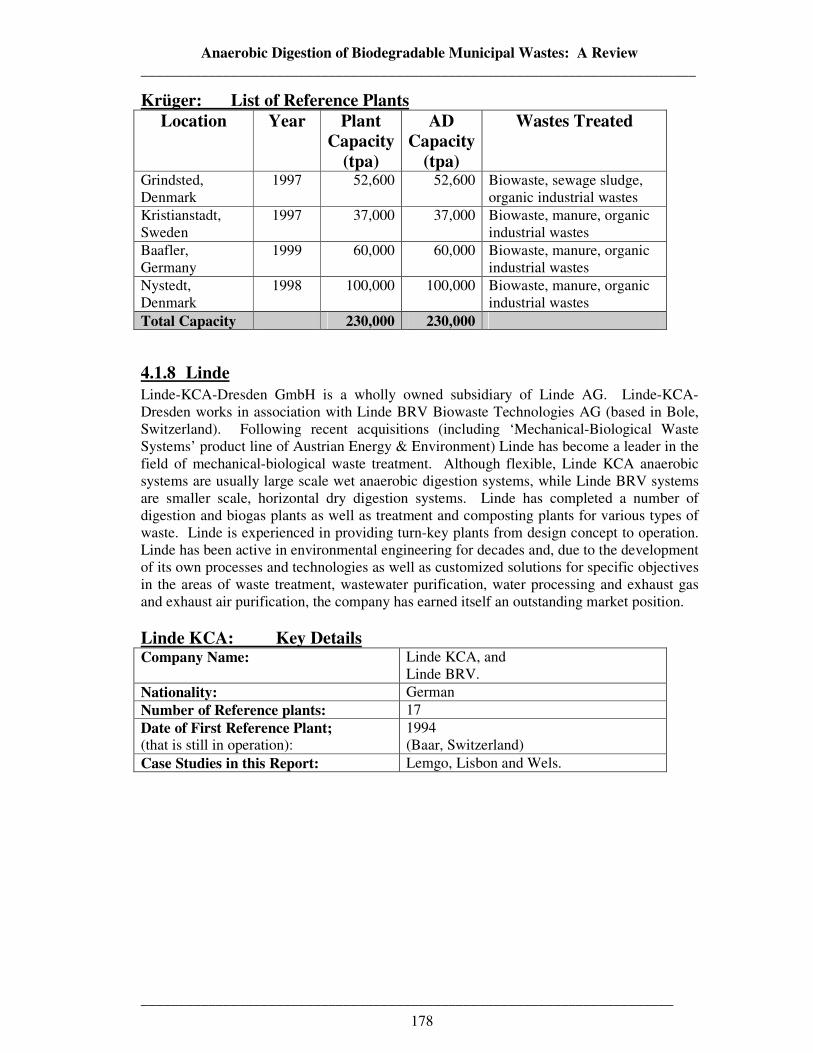
Anaerobic Digestion of Biodegradable Municipal Wastes: A Review __________________________________________________________________________
_______________________________________________________________________
178
Krüger: List of Reference Plants Location Year Plant
Capacity (tpa)
AD Capacity
(tpa)
Wastes Treated
Grindsted, Denmark
1997 52,600 52,600 Biowaste, sewage sludge, organic industrial wastes
Kristianstadt, Sweden
1997 37,000 37,000 Biowaste, manure, organic industrial wastes
Baafler, Germany
1999 60,000 60,000 Biowaste, manure, organic industrial wastes
Nystedt, Denmark
1998 100,000 100,000 Biowaste, manure, organic industrial wastes
Total Capacity 230,000 230,000
4.1.8 Linde Linde-KCA-Dresden GmbH is a wholly owned subsidiary of Linde AG. Linde-KCA-Dresden works in association with Linde BRV Biowaste Technologies AG (based in Bole, Switzerland). Following recent acquisitions (including ‘Mechanical-Biological Waste Systems’ product line of Austrian Energy & Environment) Linde has become a leader in the field of mechanical-biological waste treatment. Although flexible, Linde KCA anaerobic systems are usually large scale wet anaerobic digestion systems, while Linde BRV systems are smaller scale, horizontal dry digestion systems. Linde has completed a number of digestion and biogas plants as well as treatment and composting plants for various types of waste. Linde is experienced in providing turn-key plants from design concept to operation. Linde has been active in environmental engineering for decades and, due to the development of its own processes and technologies as well as customized solutions for specific objectives in the areas of waste treatment, wastewater purification, water processing and exhaust gas and exhaust air purification, the company has earned itself an outstanding market position. Linde KCA: Key Details Company Name: Linde KCA, and
Linde BRV. Nationality: German Number of Reference plants: 17 Date of First Reference Plant; (that is still in operation):
1994 (Baar, Switzerland)
Case Studies in this Report: Lemgo, Lisbon and Wels.
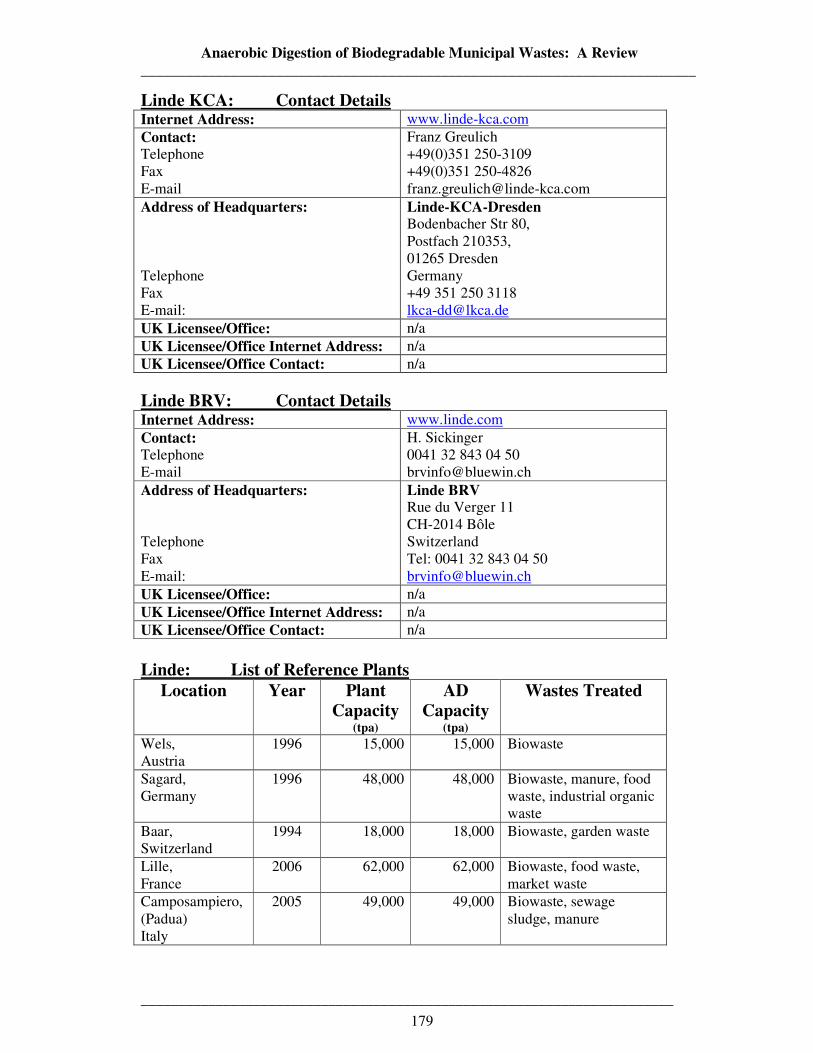
Anaerobic Digestion of Biodegradable Municipal Wastes: A Review __________________________________________________________________________
_______________________________________________________________________
179
Linde KCA: Contact Details Internet Address: www.linde-kca.com Contact: Telephone Fax E-mail
Franz Greulich +49(0)351 250-3109 +49(0)351 250-4826 [email protected]
Address of Headquarters: Telephone Fax E-mail:
Linde-KCA-Dresden Bodenbacher Str 80, Postfach 210353, 01265 Dresden Germany +49 351 250 3118 [email protected]
UK Licensee/Office: n/a UK Licensee/Office Internet Address: n/a UK Licensee/Office Contact: n/a Linde BRV: Contact Details Internet Address: www.linde.com Contact: Telephone E-mail
H. Sickinger 0041 32 843 04 50 [email protected]
Address of Headquarters: Telephone Fax E-mail:
Linde BRV Rue du Verger 11 CH-2014 Bôle Switzerland Tel: 0041 32 843 04 50 [email protected]
UK Licensee/Office: n/a UK Licensee/Office Internet Address: n/a UK Licensee/Office Contact: n/a Linde: List of Reference Plants
Location Year Plant Capacity
(tpa)
AD Capacity
(tpa)
Wastes Treated
Wels, Austria
1996
15,000
15,000
Biowaste
Sagard, Germany
1996
48,000 48,000 Biowaste, manure, food waste, industrial organic waste
Baar, Switzerland
1994 18,000
18,000
Biowaste, garden waste
Lille, France
2006 62,000 62,000 Biowaste, food waste, market waste
Camposampiero, (Padua) Italy
2005 49,000 49,000 Biowaste, sewage sludge, manure
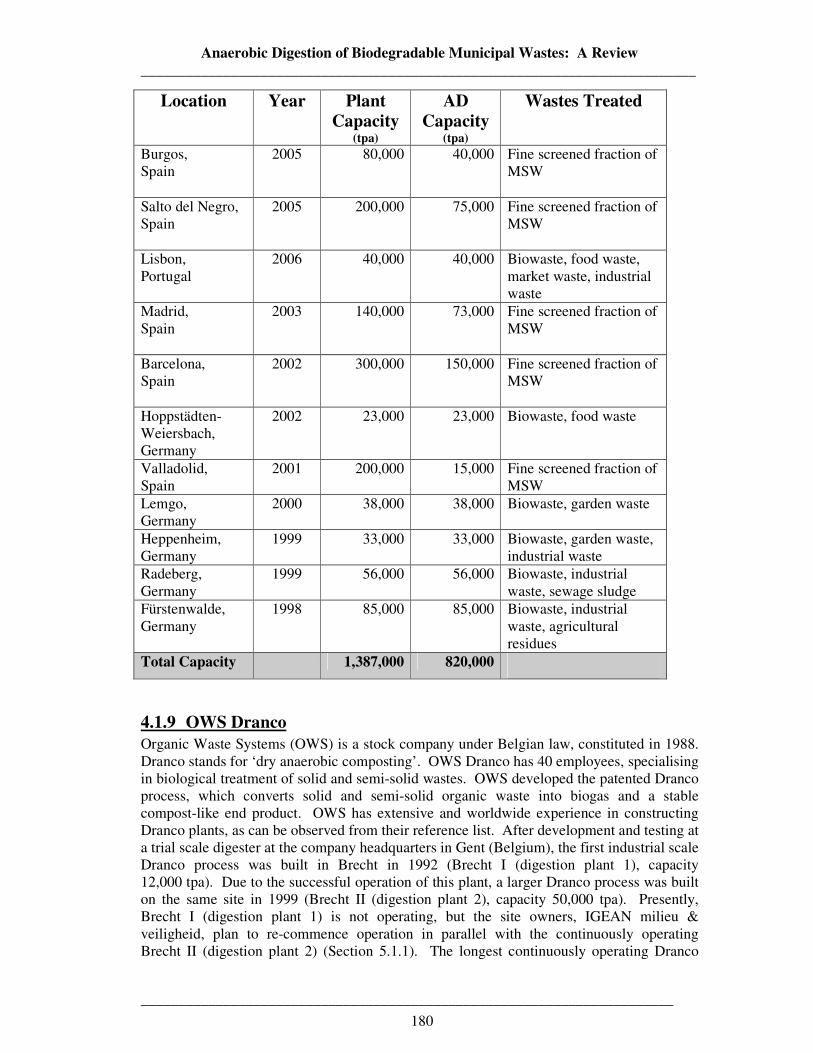
Anaerobic Digestion of Biodegradable Municipal Wastes: A Review __________________________________________________________________________
_______________________________________________________________________
180
Location Year Plant Capacity
(tpa)
AD Capacity
(tpa)
Wastes Treated
Burgos, Spain
2005 80,000 40,000 Fine screened fraction of MSW
Salto del Negro, Spain
2005 200,000 75,000 Fine screened fraction of MSW
Lisbon, Portugal
2006 40,000 40,000 Biowaste, food waste, market waste, industrial waste
Madrid, Spain
2003 140,000 73,000 Fine screened fraction of MSW
Barcelona, Spain
2002 300,000 150,000 Fine screened fraction of MSW
Hoppstädten- Weiersbach, Germany
2002
23,000 23,000 Biowaste, food waste
Valladolid, Spain
2001
200,000 15,000 Fine screened fraction of MSW
Lemgo, Germany
2000 38,000 38,000 Biowaste, garden waste
Heppenheim, Germany
1999 33,000 33,000 Biowaste, garden waste, industrial waste
Radeberg, Germany
1999 56,000 56,000 Biowaste, industrial waste, sewage sludge
Fürstenwalde, Germany
1998
85,000 85,000 Biowaste, industrial waste, agricultural residues
Total Capacity 1,387,000 820,000
4.1.9 OWS Dranco Organic Waste Systems (OWS) is a stock company under Belgian law, constituted in 1988. Dranco stands for ‘dry anaerobic composting’. OWS Dranco has 40 employees, specialising in biological treatment of solid and semi-solid wastes. OWS developed the patented Dranco process, which converts solid and semi-solid organic waste into biogas and a stable compost-like end product. OWS has extensive and worldwide experience in constructing Dranco plants, as can be observed from their reference list. After development and testing at a trial scale digester at the company headquarters in Gent (Belgium), the first industrial scale Dranco process was built in Brecht in 1992 (Brecht I (digestion plant 1), capacity 12,000 tpa). Due to the successful operation of this plant, a larger Dranco process was built on the same site in 1999 (Brecht II (digestion plant 2), capacity 50,000 tpa). Presently, Brecht I (digestion plant 1) is not operating, but the site owners, IGEAN milieu & veiligheid, plan to re-commence operation in parallel with the continuously operating Brecht II (digestion plant 2) (Section 5.1.1). The longest continuously operating Dranco
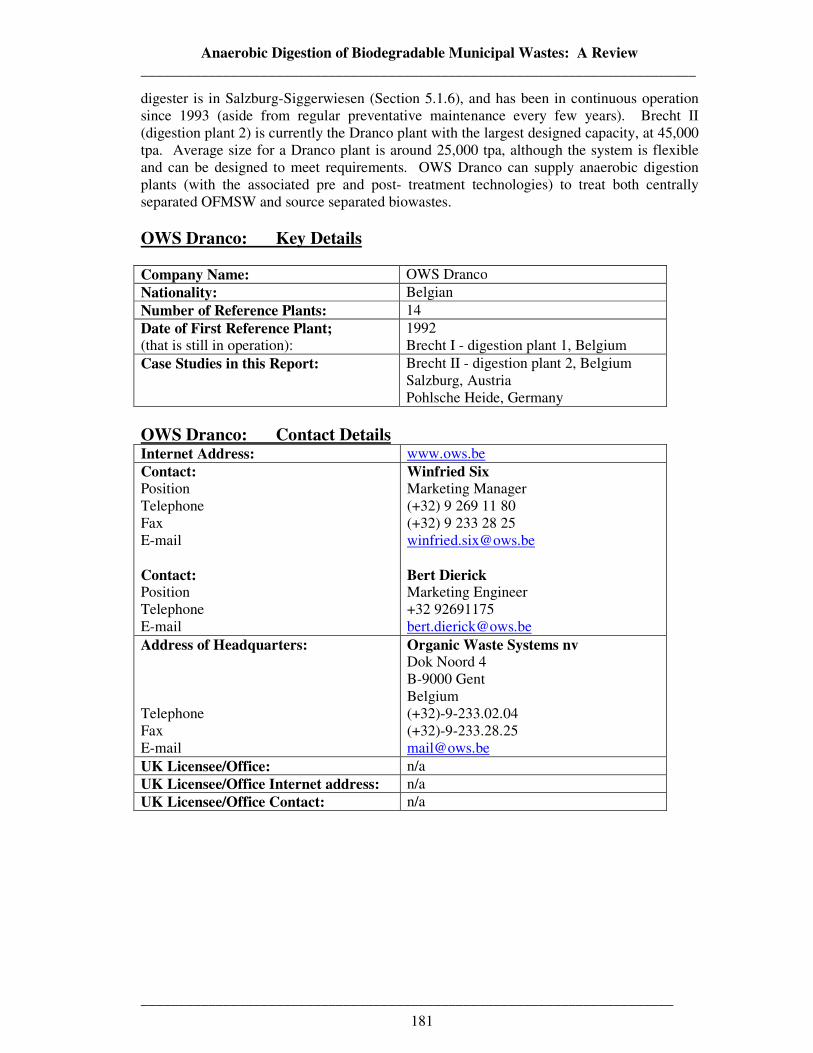
Anaerobic Digestion of Biodegradable Municipal Wastes: A Review __________________________________________________________________________
_______________________________________________________________________
181
digester is in Salzburg-Siggerwiesen (Section 5.1.6), and has been in continuous operation since 1993 (aside from regular preventative maintenance every few years). Brecht II (digestion plant 2) is currently the Dranco plant with the largest designed capacity, at 45,000 tpa. Average size for a Dranco plant is around 25,000 tpa, although the system is flexible and can be designed to meet requirements. OWS Dranco can supply anaerobic digestion plants (with the associated pre and post- treatment technologies) to treat both centrally separated OFMSW and source separated biowastes. OWS Dranco: Key Details Company Name: OWS Dranco Nationality: Belgian Number of Reference Plants: 14 Date of First Reference Plant; (that is still in operation):
1992 Brecht I - digestion plant 1, Belgium
Case Studies in this Report:
Brecht II - digestion plant 2, Belgium Salzburg, Austria Pohlsche Heide, Germany
OWS Dranco: Contact Details Internet Address: www.ows.be Contact: Position Telephone Fax E-mail Contact: Position Telephone E-mail
Winfried Six Marketing Manager (+32) 9 269 11 80 (+32) 9 233 28 25 [email protected] Bert Dierick Marketing Engineer +32 92691175 [email protected]
Address of Headquarters: Telephone Fax E-mail
Organic Waste Systems nv Dok Noord 4 B-9000 Gent Belgium (+32)-9-233.02.04 (+32)-9-233.28.25 [email protected]
UK Licensee/Office: n/a UK Licensee/Office Internet address: n/a UK Licensee/Office Contact: n/a
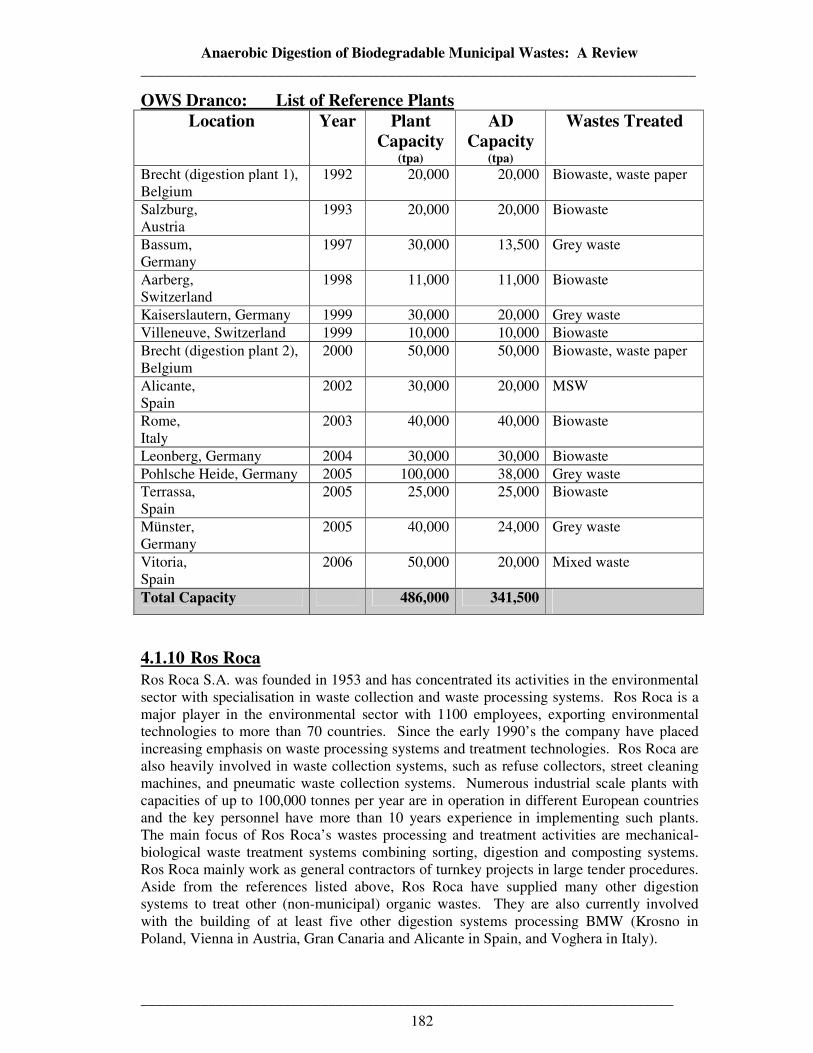
Anaerobic Digestion of Biodegradable Municipal Wastes: A Review __________________________________________________________________________
_______________________________________________________________________
182
OWS Dranco: List of Reference Plants Location Year Plant
Capacity (tpa)
AD Capacity
(tpa)
Wastes Treated
Brecht (digestion plant 1), Belgium
1992 20,000 20,000 Biowaste, waste paper
Salzburg, Austria
1993 20,000 20,000 Biowaste
Bassum, Germany
1997 30,000 13,500 Grey waste
Aarberg, Switzerland
1998 11,000 11,000 Biowaste
Kaiserslautern, Germany 1999 30,000 20,000 Grey waste Villeneuve, Switzerland 1999 10,000 10,000 Biowaste Brecht (digestion plant 2), Belgium
2000 50,000 50,000 Biowaste, waste paper
Alicante, Spain
2002 30,000 20,000 MSW
Rome, Italy
2003 40,000 40,000 Biowaste
Leonberg, Germany 2004 30,000 30,000 Biowaste Pohlsche Heide, Germany 2005 100,000 38,000 Grey waste Terrassa, Spain
2005 25,000 25,000 Biowaste
Münster, Germany
2005 40,000 24,000 Grey waste
Vitoria, Spain
2006 50,000 20,000 Mixed waste
Total Capacity 486,000 341,500
4.1.10 Ros Roca
Ros Roca S.A. was founded in 1953 and has concentrated its activities in the environmental sector with specialisation in waste collection and waste processing systems. Ros Roca is a major player in the environmental sector with 1100 employees, exporting environmental technologies to more than 70 countries. Since the early 1990’s the company have placed increasing emphasis on waste processing systems and treatment technologies. Ros Roca are also heavily involved in waste collection systems, such as refuse collectors, street cleaning machines, and pneumatic waste collection systems. Numerous industrial scale plants with capacities of up to 100,000 tonnes per year are in operation in different European countries and the key personnel have more than 10 years experience in implementing such plants. The main focus of Ros Roca’s wastes processing and treatment activities are mechanical-biological waste treatment systems combining sorting, digestion and composting systems. Ros Roca mainly work as general contractors of turnkey projects in large tender procedures. Aside from the references listed above, Ros Roca have supplied many other digestion systems to treat other (non-municipal) organic wastes. They are also currently involved with the building of at least five other digestion systems processing BMW (Krosno in Poland, Vienna in Austria, Gran Canaria and Alicante in Spain, and Voghera in Italy).
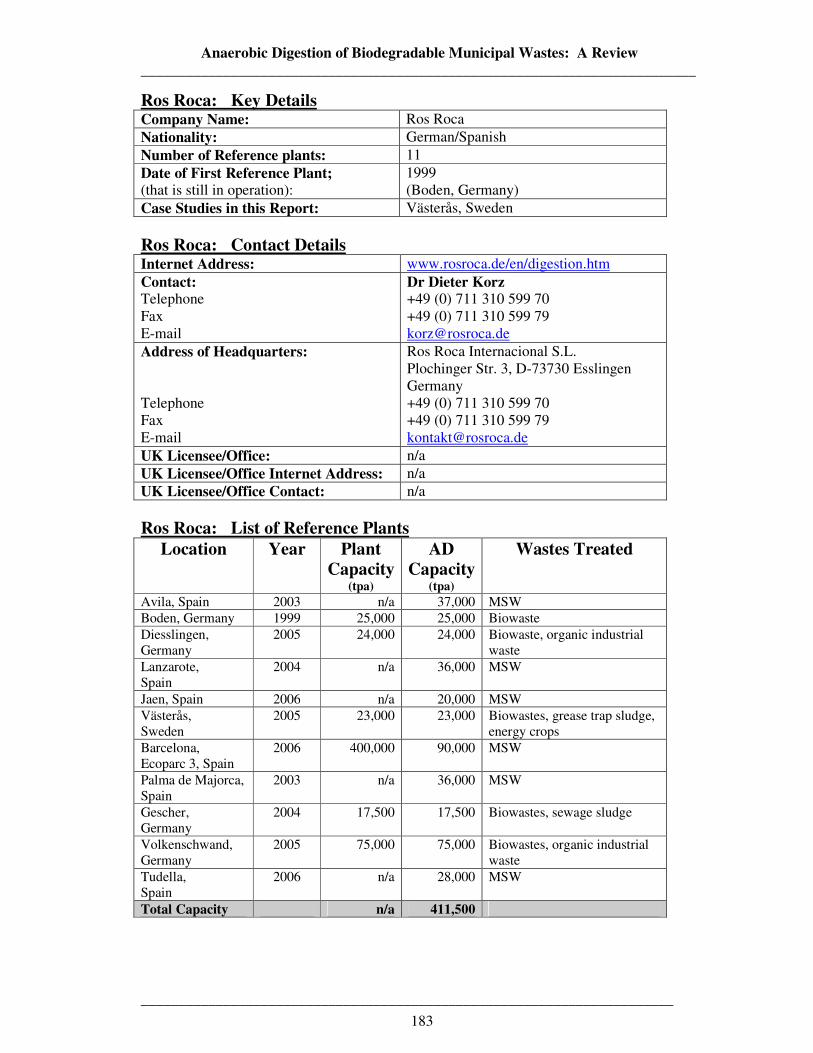
Anaerobic Digestion of Biodegradable Municipal Wastes: A Review __________________________________________________________________________
_______________________________________________________________________
183
Ros Roca: Key Details Company Name: Ros Roca Nationality: German/Spanish Number of Reference plants: 11 Date of First Reference Plant; (that is still in operation):
1999 (Boden, Germany)
Case Studies in this Report: Västerås, Sweden Ros Roca: Contact Details Internet Address: www.rosroca.de/en/digestion.htm Contact: Telephone Fax E-mail
Dr Dieter Korz +49 (0) 711 310 599 70 +49 (0) 711 310 599 79 [email protected]
Address of Headquarters: Telephone Fax E-mail
Ros Roca Internacional S.L. Plochinger Str. 3, D-73730 Esslingen Germany +49 (0) 711 310 599 70 +49 (0) 711 310 599 79 [email protected]
UK Licensee/Office: n/a UK Licensee/Office Internet Address: n/a UK Licensee/Office Contact: n/a Ros Roca: List of Reference Plants
Location Year Plant Capacity
(tpa)
AD Capacity
(tpa)
Wastes Treated
Avila, Spain 2003 n/a 37,000 MSW Boden, Germany 1999 25,000 25,000 Biowaste Diesslingen, Germany
2005 24,000 24,000 Biowaste, organic industrial waste
Lanzarote, Spain
2004 n/a 36,000 MSW
Jaen, Spain 2006 n/a 20,000 MSW Västerås, Sweden
2005 23,000 23,000 Biowastes, grease trap sludge, energy crops
Barcelona, Ecoparc 3, Spain
2006 400,000 90,000 MSW
Palma de Majorca, Spain
2003 n/a 36,000 MSW
Gescher, Germany
2004 17,500 17,500 Biowastes, sewage sludge
Volkenschwand, Germany
2005 75,000 75,000 Biowastes, organic industrial waste
Tudella, Spain
2006 n/a 28,000 MSW
Total Capacity n/a 411,500
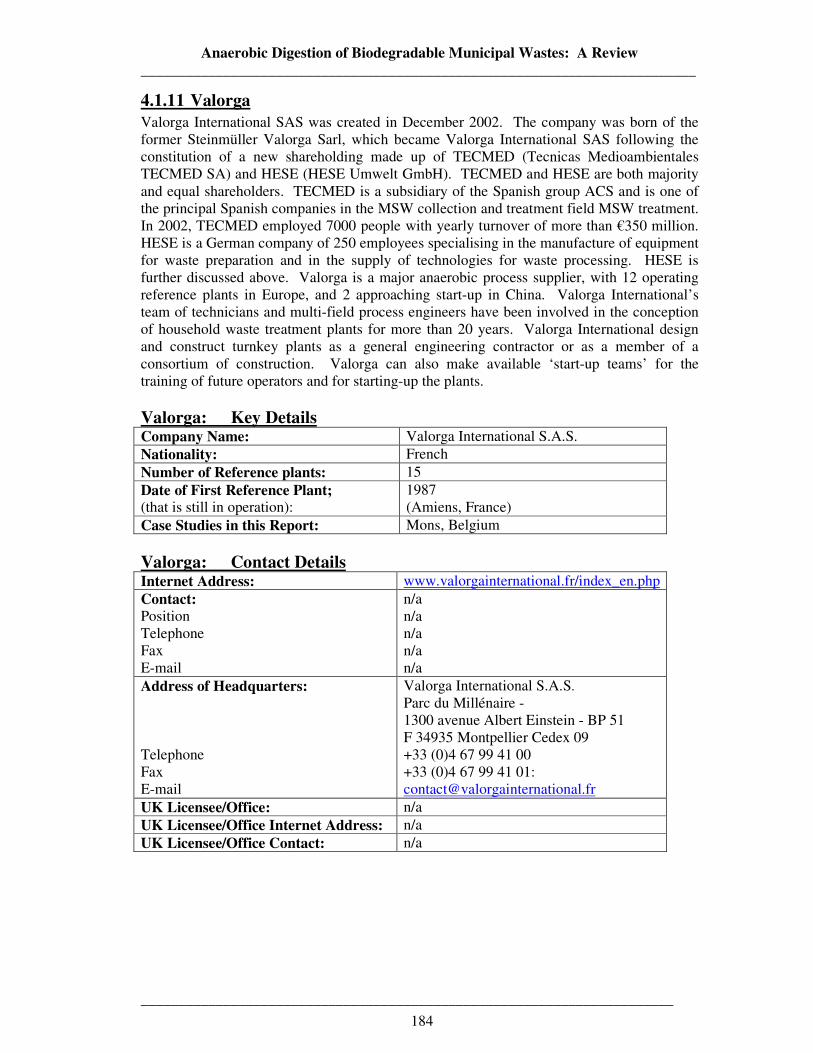
Anaerobic Digestion of Biodegradable Municipal Wastes: A Review __________________________________________________________________________
_______________________________________________________________________
184
4.1.11 Valorga Valorga International SAS was created in December 2002. The company was born of the former Steinmüller Valorga Sarl, which became Valorga International SAS following the constitution of a new shareholding made up of TECMED (Tecnicas Medioambientales TECMED SA) and HESE (HESE Umwelt GmbH). TECMED and HESE are both majority and equal shareholders. TECMED is a subsidiary of the Spanish group ACS and is one of the principal Spanish companies in the MSW collection and treatment field MSW treatment. In 2002, TECMED employed 7000 people with yearly turnover of more than €350 million. HESE is a German company of 250 employees specialising in the manufacture of equipment for waste preparation and in the supply of technologies for waste processing. HESE is further discussed above. Valorga is a major anaerobic process supplier, with 12 operating reference plants in Europe, and 2 approaching start-up in China. Valorga International’s team of technicians and multi-field process engineers have been involved in the conception of household waste treatment plants for more than 20 years. Valorga International design and construct turnkey plants as a general engineering contractor or as a member of a consortium of construction. Valorga can also make available ‘start-up teams’ for the training of future operators and for starting-up the plants. Valorga: Key Details Company Name: Valorga International S.A.S. Nationality: French Number of Reference plants: 15 Date of First Reference Plant; (that is still in operation):
1987 (Amiens, France)
Case Studies in this Report: Mons, Belgium Valorga: Contact Details Internet Address: www.valorgainternational.fr/index_en.php Contact: Position Telephone Fax E-mail
n/a n/a n/a n/a n/a
Address of Headquarters: Telephone Fax E-mail
Valorga International S.A.S. Parc du Millénaire - 1300 avenue Albert Einstein - BP 51 F 34935 Montpellier Cedex 09 +33 (0)4 67 99 41 00 +33 (0)4 67 99 41 01: [email protected]
UK Licensee/Office: n/a UK Licensee/Office Internet Address: n/a UK Licensee/Office Contact: n/a
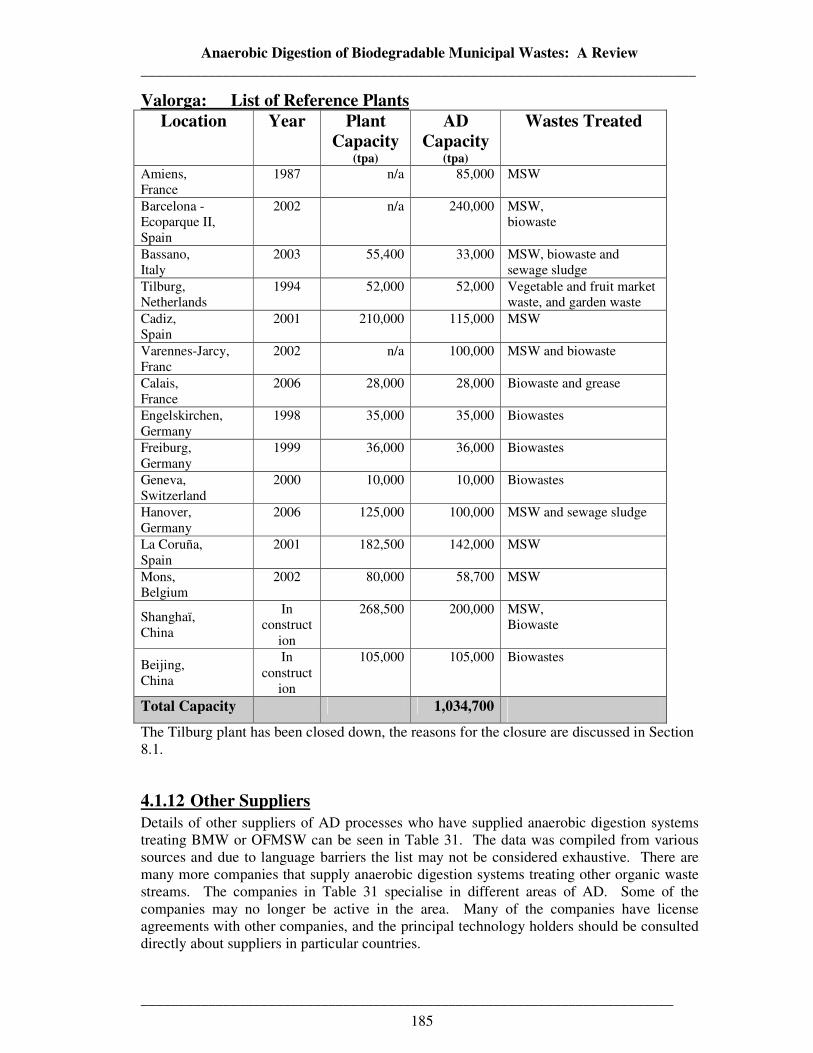
Anaerobic Digestion of Biodegradable Municipal Wastes: A Review __________________________________________________________________________
_______________________________________________________________________
185
Valorga: List of Reference Plants Location Year Plant
Capacity (tpa)
AD Capacity
(tpa)
Wastes Treated
Amiens, France
1987 n/a 85,000 MSW
Barcelona - Ecoparque II, Spain
2002 n/a 240,000 MSW, biowaste
Bassano, Italy
2003 55,400 33,000 MSW, biowaste and sewage sludge
Tilburg, Netherlands
1994 52,000 52,000 Vegetable and fruit market waste, and garden waste
Cadiz, Spain
2001 210,000 115,000 MSW
Varennes-Jarcy, Franc
2002 n/a 100,000 MSW and biowaste
Calais, France
2006 28,000 28,000 Biowaste and grease
Engelskirchen, Germany
1998 35,000 35,000 Biowastes
Freiburg, Germany
1999 36,000 36,000 Biowastes
Geneva, Switzerland
2000 10,000 10,000 Biowastes
Hanover, Germany
2006 125,000 100,000
MSW and sewage sludge
La Coruña, Spain
2001 182,500 142,000 MSW
Mons, Belgium
2002 80,000 58,700 MSW
Shanghaï, China
In construct
ion
268,500 200,000 MSW, Biowaste
Beijing, China
In construct
ion
105,000 105,000 Biowastes
Total Capacity 1,034,700 The Tilburg plant has been closed down, the reasons for the closure are discussed in Section 8.1.
4.1.12 Other Suppliers
Details of other suppliers of AD processes who have supplied anaerobic digestion systems treating BMW or OFMSW can be seen in Table 31. The data was compiled from various sources and due to language barriers the list may not be considered exhaustive. There are many more companies that supply anaerobic digestion systems treating other organic waste streams. The companies in Table 31 specialise in different areas of AD. Some of the companies may no longer be active in the area. Many of the companies have license agreements with other companies, and the principal technology holders should be consulted directly about suppliers in particular countries.
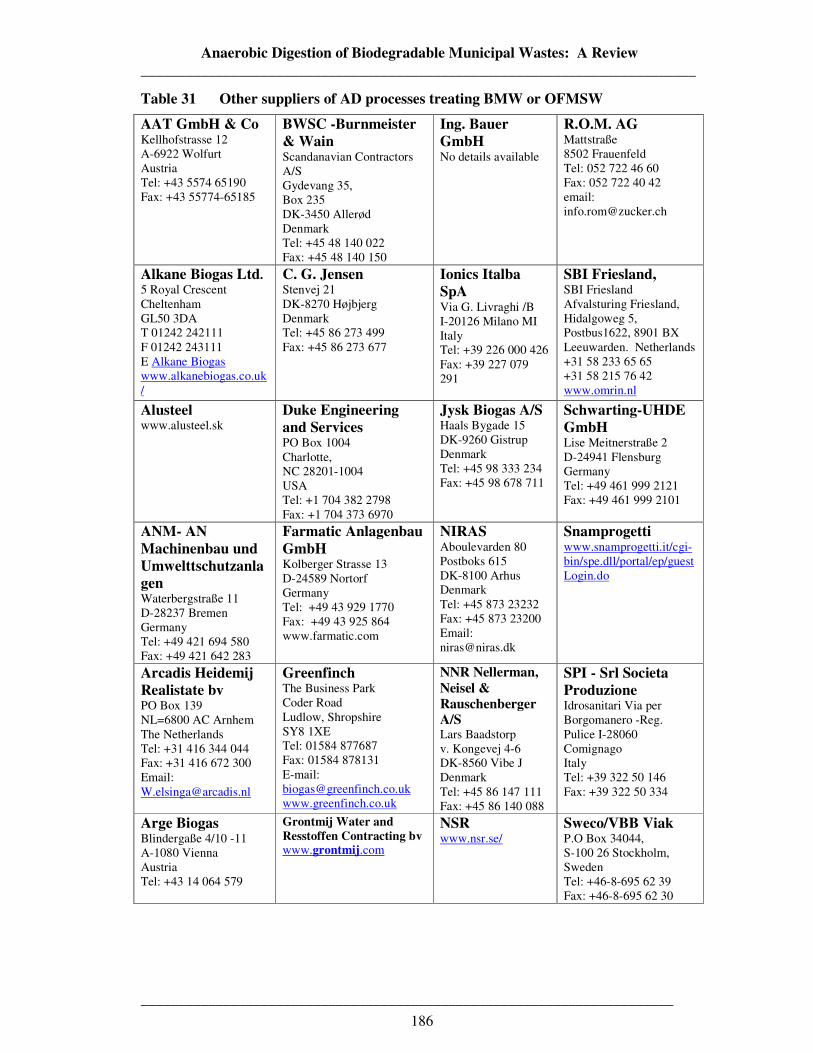
Anaerobic Digestion of Biodegradable Municipal Wastes: A Review __________________________________________________________________________
_______________________________________________________________________
186
Table 31 Other suppliers of AD processes treating BMW or OFMSW
AAT GmbH & Co Kellhofstrasse 12 A-6922 Wolfurt Austria Tel: +43 5574 65190 Fax: +43 55774-65185
BWSC -Burnmeister & Wain Scandanavian Contractors A/S Gydevang 35, Box 235 DK-3450 Allerød Denmark Tel: +45 48 140 022 Fax: +45 48 140 150
Ing. Bauer GmbH No details available
R.O.M. AG Mattstraße 8502 Frauenfeld Tel: 052 722 46 60 Fax: 052 722 40 42 email: [email protected]
Alkane Biogas Ltd. 5 Royal Crescent Cheltenham GL50 3DA T 01242 242111 F 01242 243111 E Alkane Biogas www.alkanebiogas.co.uk/
C. G. Jensen Stenvej 21 DK-8270 Højbjerg Denmark Tel: +45 86 273 499 Fax: +45 86 273 677
Ionics Italba SpA Via G. Livraghi /B I-20126 Milano MI Italy Tel: +39 226 000 426 Fax: +39 227 079 291
SBI Friesland, SBI Friesland Afvalsturing Friesland, Hidalgoweg 5, Postbus1622, 8901 BX Leeuwarden. Netherlands +31 58 233 65 65 +31 58 215 76 42 www.omrin.nl
Alusteel www.alusteel.sk
Duke Engineering and Services PO Box 1004 Charlotte, NC 28201-1004 USA Tel: +1 704 382 2798 Fax: +1 704 373 6970
Jysk Biogas A/S Haals Bygade 15 DK-9260 Gistrup Denmark Tel: +45 98 333 234 Fax: +45 98 678 711
Schwarting-UHDE GmbH Lise Meitnerstraße 2 D-24941 Flensburg Germany Tel: +49 461 999 2121 Fax: +49 461 999 2101
ANM- AN Machinenbau und Umwelttschutzanlagen Waterbergstraße 11 D-28237 Bremen Germany Tel: +49 421 694 580 Fax: +49 421 642 283
Farmatic Anlagenbau GmbH Kolberger Strasse 13 D-24589 Nortorf Germany Tel: +49 43 929 1770 Fax: +49 43 925 864 www.farmatic.com
NIRAS Aboulevarden 80 Postboks 615 DK-8100 Arhus Denmark Tel: +45 873 23232 Fax: +45 873 23200 Email: [email protected]
Snamprogetti www.snamprogetti.it/cgi-bin/spe.dll/portal/ep/guestLogin.do
Arcadis Heidemij Realistate bv PO Box 139 NL=6800 AC Arnhem The Netherlands Tel: +31 416 344 044 Fax: +31 416 672 300 Email: [email protected]
Greenfinch The Business Park Coder Road Ludlow, Shropshire SY8 1XE Tel: 01584 877687 Fax: 01584 878131 E-mail: [email protected] www.greenfinch.co.uk
NNR Nellerman, Neisel & Rauschenberger A/S Lars Baadstorp v. Kongevej 4-6 DK-8560 Vibe J Denmark Tel: +45 86 147 111 Fax: +45 86 140 088
SPI - Srl Societa Produzione Idrosanitari Via per Borgomanero -Reg. Pulice I-28060 Comignago Italy Tel: +39 322 50 146 Fax: +39 322 50 334
Arge Biogas Blindergaße 4/10 -11 A-1080 Vienna Austria Tel: +43 14 064 579
Grontmij Water and Resstoffen Contracting bv www.grontmij.com
NSR www.nsr.se/
Sweco/VBB Viak P.O Box 34044, S-100 26 Stockholm, Sweden Tel: +46-8-695 62 39 Fax: +46-8-695 62 30
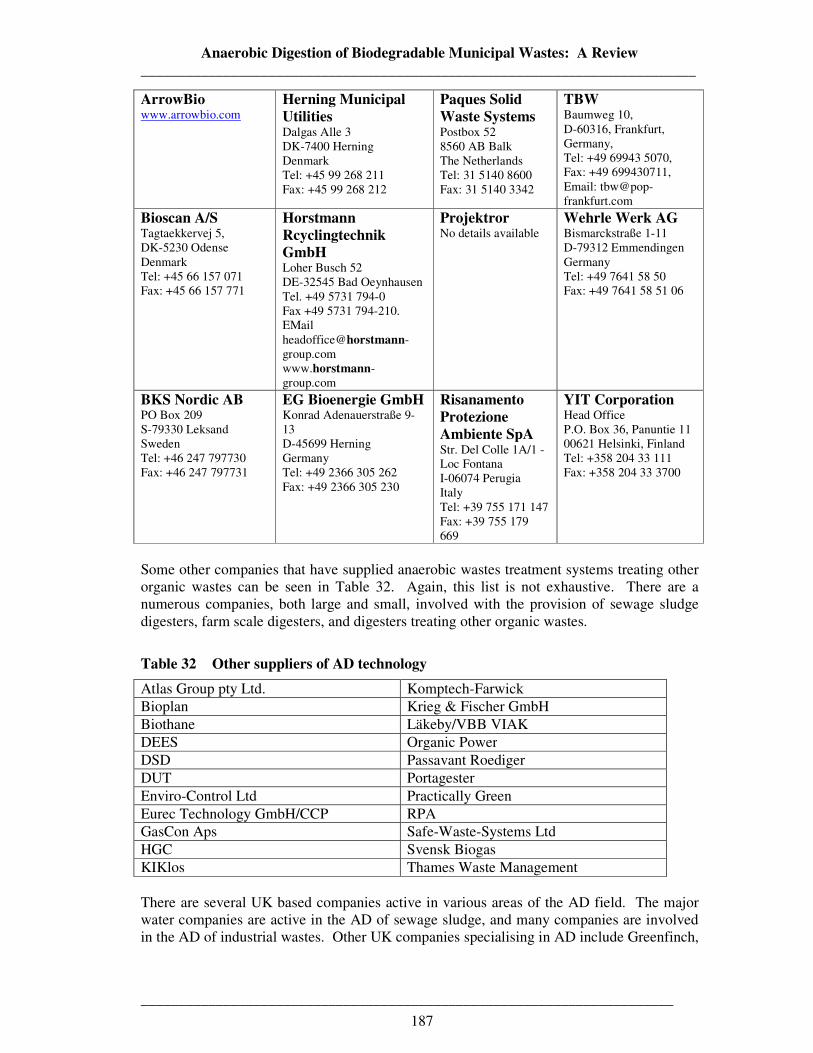
Anaerobic Digestion of Biodegradable Municipal Wastes: A Review __________________________________________________________________________
_______________________________________________________________________
187
ArrowBio www.arrowbio.com
Herning Municipal Utilities Dalgas Alle 3 DK-7400 Herning Denmark Tel: +45 99 268 211 Fax: +45 99 268 212
Paques Solid Waste Systems Postbox 52 8560 AB Balk The Netherlands Tel: 31 5140 8600 Fax: 31 5140 3342
TBW Baumweg 10, D-60316, Frankfurt, Germany, Tel: +49 69943 5070, Fax: +49 699430711, Email: [email protected]
Bioscan A/S Tagtaekkervej 5, DK-5230 Odense Denmark Tel: +45 66 157 071 Fax: +45 66 157 771
Horstmann Rcyclingtechnik GmbH Loher Busch 52 DE-32545 Bad Oeynhausen Tel. +49 5731 794-0 Fax +49 5731 794-210. EMail [email protected] www.horstmann-group.com
Projektror No details available
Wehrle Werk AG Bismarckstraße 1-11 D-79312 Emmendingen Germany Tel: +49 7641 58 50 Fax: +49 7641 58 51 06
BKS Nordic AB PO Box 209 S-79330 Leksand Sweden Tel: +46 247 797730 Fax: +46 247 797731
EG Bioenergie GmbH Konrad Adenauerstraße 9-13 D-45699 Herning Germany Tel: +49 2366 305 262 Fax: +49 2366 305 230
Risanamento Protezione Ambiente SpA Str. Del Colle 1A/1 - Loc Fontana I-06074 Perugia Italy Tel: +39 755 171 147 Fax: +39 755 179 669
YIT Corporation Head Office P.O. Box 36, Panuntie 11 00621 Helsinki, Finland Tel: +358 204 33 111 Fax: +358 204 33 3700
Some other companies that have supplied anaerobic wastes treatment systems treating other organic wastes can be seen in Table 32. Again, this list is not exhaustive. There are a numerous companies, both large and small, involved with the provision of sewage sludge digesters, farm scale digesters, and digesters treating other organic wastes.
Table 32 Other suppliers of AD technology
Atlas Group pty Ltd. Komptech-Farwick Bioplan Krieg & Fischer GmbH Biothane Läkeby/VBB VIAK DEES Organic Power DSD Passavant Roediger DUT Portagester Enviro-Control Ltd Practically Green Eurec Technology GmbH/CCP RPA GasCon Aps Safe-Waste-Systems Ltd HGC Svensk Biogas KIKlos Thames Waste Management There are several UK based companies active in various areas of the AD field. The major water companies are active in the AD of sewage sludge, and many companies are involved in the AD of industrial wastes. Other UK companies specialising in AD include Greenfinch,
Anaerobic Digestion of Biodegradable Municipal Wastes: A Review __________________________________________________________________________
_______________________________________________________________________
188
Portagester, Organic Power and Practically Green. As yet none of these companies except Greenfinch have built a full scale digestion system treating BMW in Europe. The Greenfinch digester in reality is more of a large-pilot scale digester than a full scale digester, and treats 5000 tpa of kitchen waste. This anaerobic digestion system is described in Section 5.1.4 (Ludlow case study).
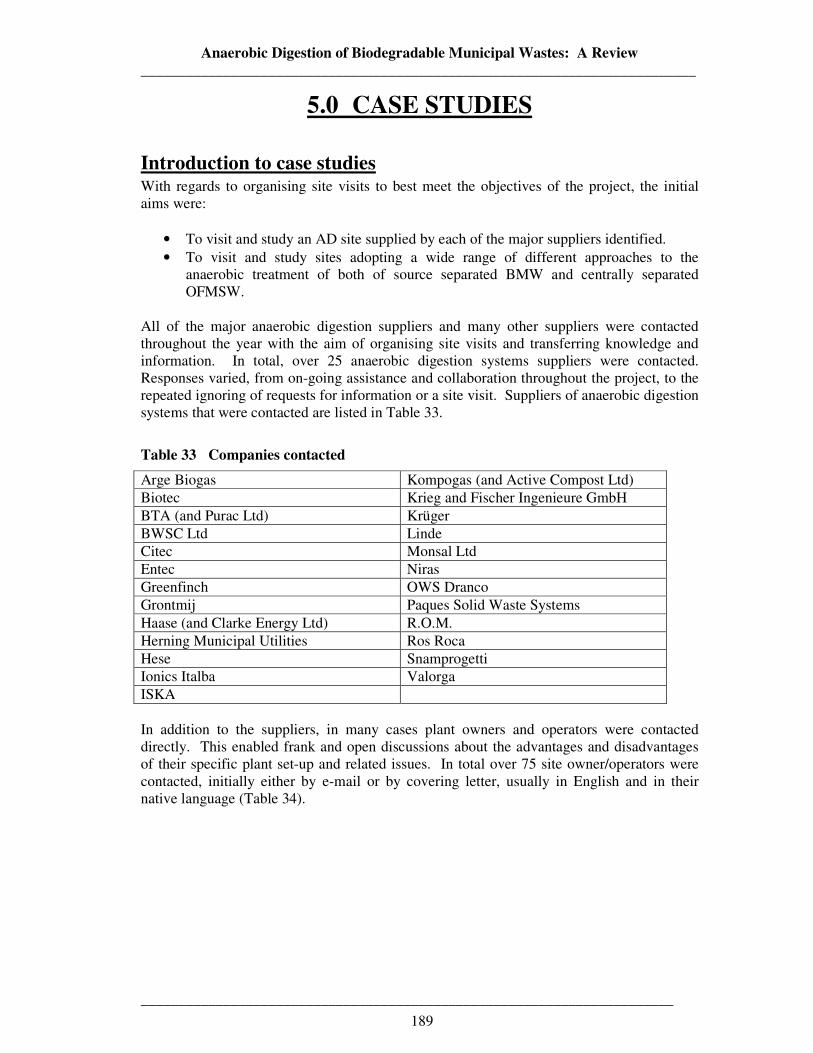
Anaerobic Digestion of Biodegradable Municipal Wastes: A Review __________________________________________________________________________
_______________________________________________________________________
189
5.0 CASE STUDIES
Introduction to case studies With regards to organising site visits to best meet the objectives of the project, the initial aims were:
• To visit and study an AD site supplied by each of the major suppliers identified. • To visit and study sites adopting a wide range of different approaches to the
anaerobic treatment of both of source separated BMW and centrally separated OFMSW.
All of the major anaerobic digestion suppliers and many other suppliers were contacted throughout the year with the aim of organising site visits and transferring knowledge and information. In total, over 25 anaerobic digestion systems suppliers were contacted. Responses varied, from on-going assistance and collaboration throughout the project, to the repeated ignoring of requests for information or a site visit. Suppliers of anaerobic digestion systems that were contacted are listed in Table 33.
Table 33 Companies contacted
Arge Biogas Kompogas (and Active Compost Ltd) Biotec Krieg and Fischer Ingenieure GmbH BTA (and Purac Ltd) Krüger BWSC Ltd Linde Citec Monsal Ltd Entec Niras Greenfinch OWS Dranco Grontmij Paques Solid Waste Systems Haase (and Clarke Energy Ltd) R.O.M. Herning Municipal Utilities Ros Roca Hese Snamprogetti Ionics Italba Valorga ISKA In addition to the suppliers, in many cases plant owners and operators were contacted directly. This enabled frank and open discussions about the advantages and disadvantages of their specific plant set-up and related issues. In total over 75 site owner/operators were contacted, initially either by e-mail or by covering letter, usually in English and in their native language (Table 34).
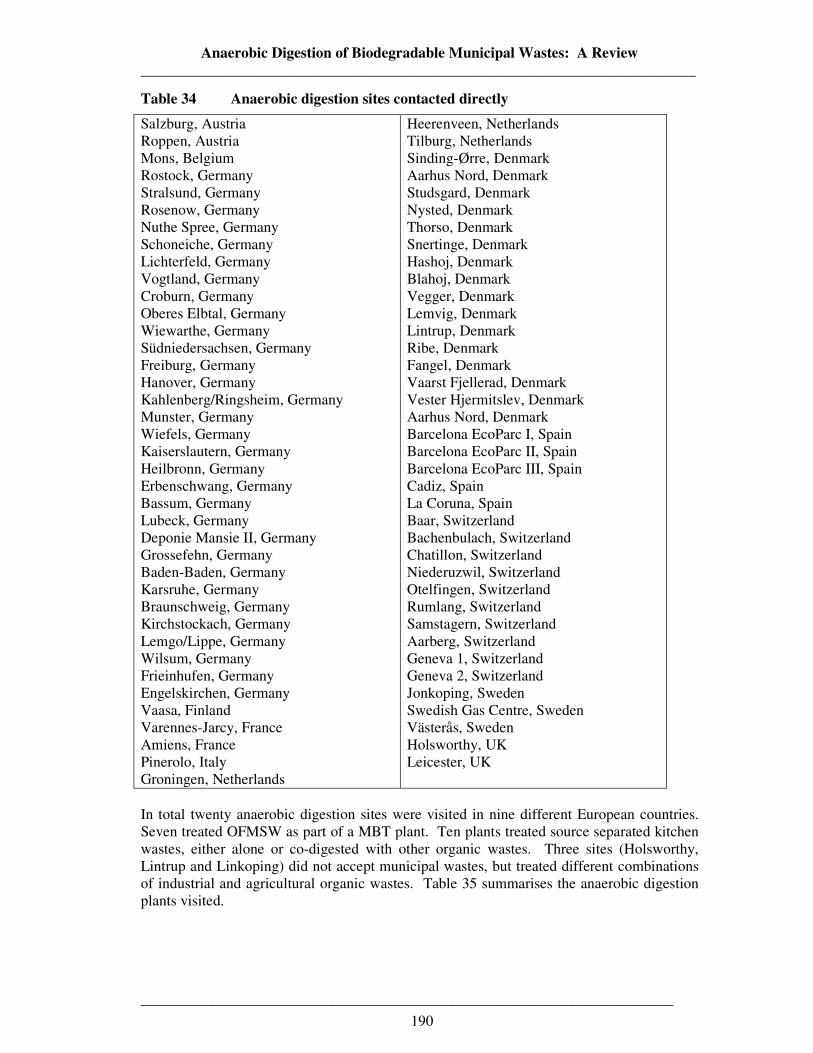
Anaerobic Digestion of Biodegradable Municipal Wastes: A Review __________________________________________________________________________
_______________________________________________________________________
190
Table 34 Anaerobic digestion sites contacted directly
Salzburg, Austria Roppen, Austria Mons, Belgium Rostock, Germany Stralsund, Germany Rosenow, Germany Nuthe Spree, Germany Schoneiche, Germany Lichterfeld, Germany Vogtland, Germany Croburn, Germany Oberes Elbtal, Germany Wiewarthe, Germany Südniedersachsen, Germany Freiburg, Germany Hanover, Germany Kahlenberg/Ringsheim, Germany Munster, Germany Wiefels, Germany Kaiserslautern, Germany Heilbronn, Germany Erbenschwang, Germany Bassum, Germany Lubeck, Germany Deponie Mansie II, Germany Grossefehn, Germany Baden-Baden, Germany Karsruhe, Germany Braunschweig, Germany Kirchstockach, Germany Lemgo/Lippe, Germany Wilsum, Germany Frieinhufen, Germany Engelskirchen, Germany Vaasa, Finland Varennes-Jarcy, France Amiens, France Pinerolo, Italy Groningen, Netherlands
Heerenveen, Netherlands Tilburg, Netherlands Sinding-Ørre, Denmark Aarhus Nord, Denmark Studsgard, Denmark Nysted, Denmark Thorso, Denmark Snertinge, Denmark Hashoj, Denmark Blahoj, Denmark Vegger, Denmark Lemvig, Denmark Lintrup, Denmark Ribe, Denmark Fangel, Denmark Vaarst Fjellerad, Denmark Vester Hjermitslev, Denmark Aarhus Nord, Denmark Barcelona EcoParc I, Spain Barcelona EcoParc II, Spain Barcelona EcoParc III, Spain Cadiz, Spain La Coruna, Spain Baar, Switzerland Bachenbulach, Switzerland Chatillon, Switzerland Niederuzwil, Switzerland Otelfingen, Switzerland Rumlang, Switzerland Samstagern, Switzerland Aarberg, Switzerland Geneva 1, Switzerland Geneva 2, Switzerland Jonkoping, Sweden Swedish Gas Centre, Sweden Västerås, Sweden Holsworthy, UK Leicester, UK
In total twenty anaerobic digestion sites were visited in nine different European countries. Seven treated OFMSW as part of a MBT plant. Ten plants treated source separated kitchen wastes, either alone or co-digested with other organic wastes. Three sites (Holsworthy, Lintrup and Linkoping) did not accept municipal wastes, but treated different combinations of industrial and agricultural organic wastes. Table 35 summarises the anaerobic digestion plants visited.
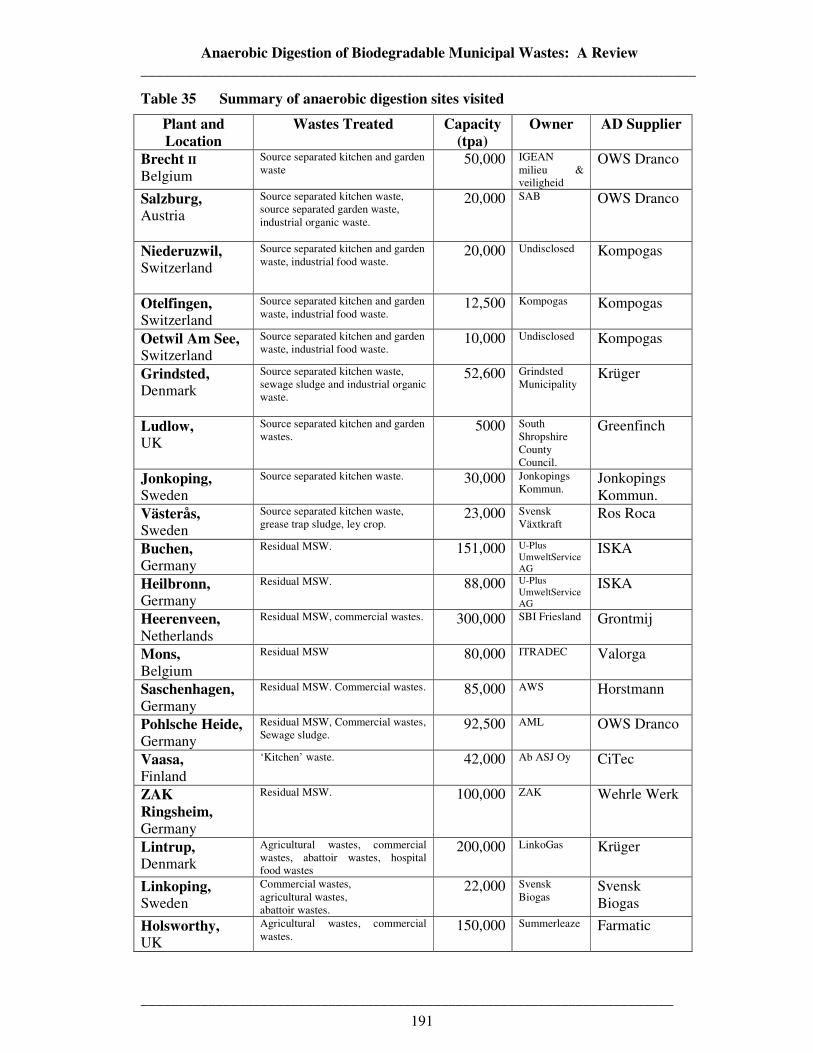
Anaerobic Digestion of Biodegradable Municipal Wastes: A Review __________________________________________________________________________
_______________________________________________________________________
191
Table 35 Summary of anaerobic digestion sites visited
Plant and Location
Wastes Treated Capacity (tpa)
Owner AD Supplier
Brecht II Belgium
Source separated kitchen and garden waste
50,000 IGEAN milieu & veiligheid
OWS Dranco
Salzburg, Austria
Source separated kitchen waste, source separated garden waste, industrial organic waste.
20,000 SAB OWS Dranco
Niederuzwil, Switzerland
Source separated kitchen and garden waste, industrial food waste.
20,000 Undisclosed Kompogas
Otelfingen, Switzerland
Source separated kitchen and garden waste, industrial food waste.
12,500 Kompogas Kompogas
Oetwil Am See, Switzerland
Source separated kitchen and garden waste, industrial food waste.
10,000 Undisclosed Kompogas
Grindsted, Denmark
Source separated kitchen waste, sewage sludge and industrial organic waste.
52,600 Grindsted Municipality
Krüger
Ludlow, UK
Source separated kitchen and garden wastes.
5000 South Shropshire County Council.
Greenfinch
Jonkoping, Sweden
Source separated kitchen waste. 30,000 Jonkopings Kommun.
Jonkopings Kommun.
Västerås, Sweden
Source separated kitchen waste, grease trap sludge, ley crop.
23,000 Svensk Växtkraft
Ros Roca
Buchen, Germany
Residual MSW. 151,000 U-Plus UmweltService AG
ISKA
Heilbronn, Germany
Residual MSW. 88,000 U-Plus UmweltService AG
ISKA
Heerenveen, Netherlands
Residual MSW, commercial wastes. 300,000 SBI Friesland Grontmij
Mons, Belgium
Residual MSW 80,000 ITRADEC Valorga
Saschenhagen, Germany
Residual MSW. Commercial wastes. 85,000 AWS Horstmann
Pohlsche Heide, Germany
Residual MSW, Commercial wastes, Sewage sludge.
92,500 AML OWS Dranco
Vaasa, Finland
‘Kitchen’ waste. 42,000 Ab ASJ Oy CiTec
ZAK Ringsheim, Germany
Residual MSW. 100,000 ZAK Wehrle Werk
Lintrup, Denmark
Agricultural wastes, commercial wastes, abattoir wastes, hospital food wastes
200,000 LinkoGas Krüger
Linkoping, Sweden
Commercial wastes, agricultural wastes, abattoir wastes.
22,000 Svensk Biogas
Svensk Biogas
Holsworthy, UK
Agricultural wastes, commercial wastes.
150,000 Summerleaze Farmatic
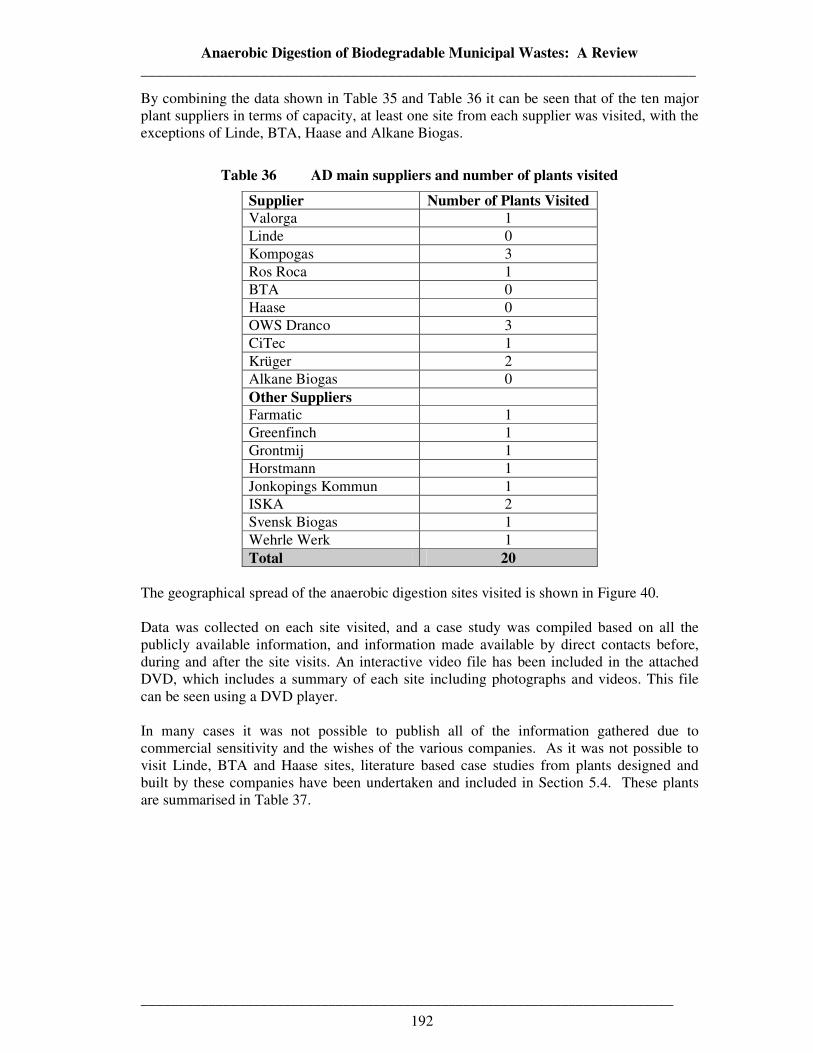
Anaerobic Digestion of Biodegradable Municipal Wastes: A Review __________________________________________________________________________
_______________________________________________________________________
192
By combining the data shown in Table 35 and Table 36 it can be seen that of the ten major plant suppliers in terms of capacity, at least one site from each supplier was visited, with the exceptions of Linde, BTA, Haase and Alkane Biogas.
Table 36 AD main suppliers and number of plants visited
Supplier Number of Plants Visited Valorga 1 Linde 0 Kompogas 3 Ros Roca 1 BTA 0 Haase 0 OWS Dranco 3 CiTec 1 Krüger 2 Alkane Biogas 0 Other Suppliers Farmatic 1 Greenfinch 1 Grontmij 1 Horstmann 1 Jonkopings Kommun 1 ISKA 2 Svensk Biogas 1 Wehrle Werk 1 Total 20
The geographical spread of the anaerobic digestion sites visited is shown in Figure 40. Data was collected on each site visited, and a case study was compiled based on all the publicly available information, and information made available by direct contacts before, during and after the site visits. An interactive video file has been included in the attached DVD, which includes a summary of each site including photographs and videos. This file can be seen using a DVD player. In many cases it was not possible to publish all of the information gathered due to commercial sensitivity and the wishes of the various companies. As it was not possible to visit Linde, BTA and Haase sites, literature based case studies from plants designed and built by these companies have been undertaken and included in Section 5.4. These plants are summarised in Table 37.
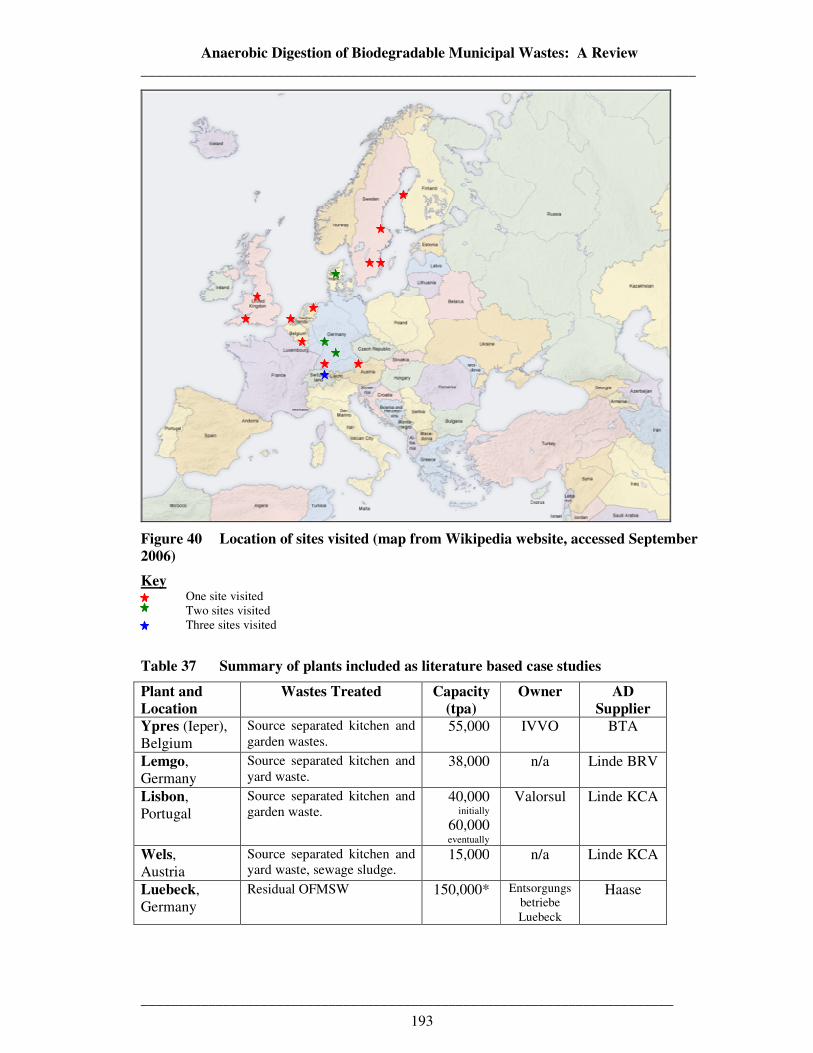
Anaerobic Digestion of Biodegradable Municipal Wastes: A Review __________________________________________________________________________
_______________________________________________________________________
193
Figure 40 Location of sites visited (map from Wikipedia website, accessed September 2006)
Key One site visited Two sites visited Three sites visited
Table 37 Summary of plants included as literature based case studies
Plant and Location
Wastes Treated Capacity (tpa)
Owner AD Supplier
Ypres (Ieper), Belgium
Source separated kitchen and garden wastes.
55,000 IVVO BTA
Lemgo, Germany
Source separated kitchen and yard waste.
38,000 n/a Linde BRV
Lisbon, Portugal
Source separated kitchen and garden waste.
40,000 initially
60,000 eventually
Valorsul Linde KCA
Wels, Austria
Source separated kitchen and yard waste, sewage sludge.
15,000 n/a Linde KCA
Luebeck, Germany
Residual OFMSW 150,000*
Entsorgungsbetriebe Luebeck
Haase
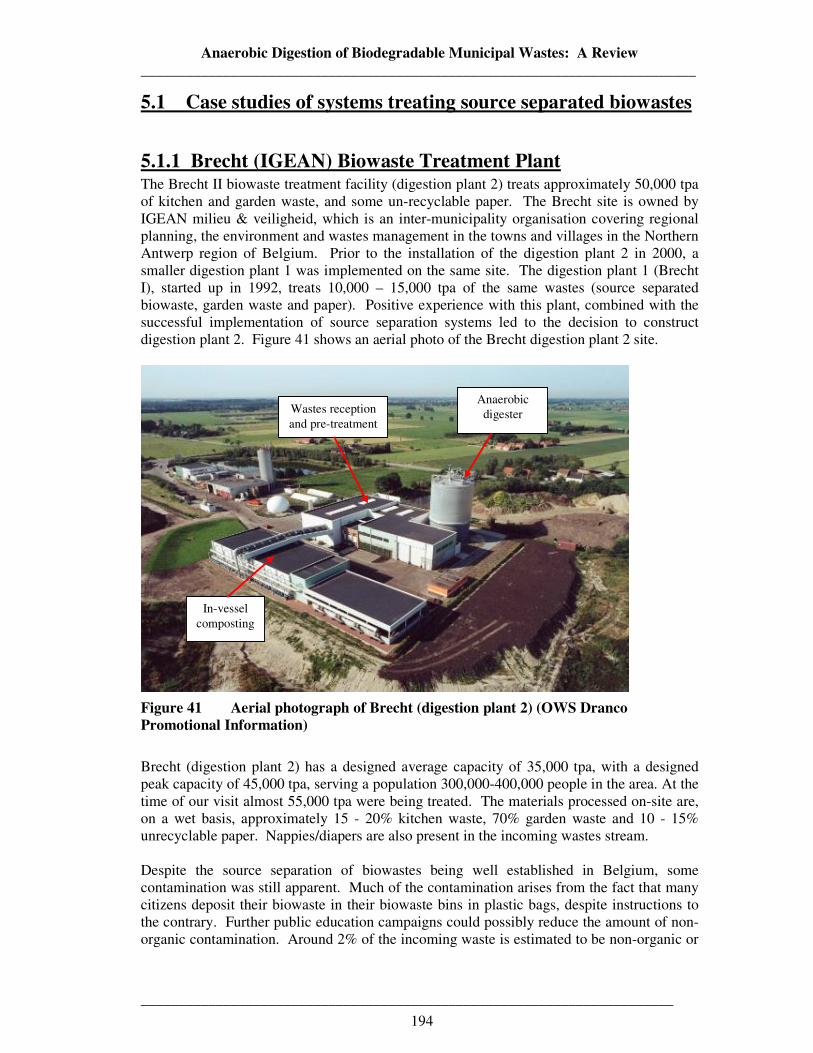
Anaerobic Digestion of Biodegradable Municipal Wastes: A Review __________________________________________________________________________
_______________________________________________________________________
194
5.1 Case studies of systems treating source separated biowastes
5.1.1 Brecht (IGEAN) Biowaste Treatment Plant The Brecht II biowaste treatment facility (digestion plant 2) treats approximately 50,000 tpa of kitchen and garden waste, and some un-recyclable paper. The Brecht site is owned by IGEAN milieu & veiligheid, which is an inter-municipality organisation covering regional planning, the environment and wastes management in the towns and villages in the Northern Antwerp region of Belgium. Prior to the installation of the digestion plant 2 in 2000, a smaller digestion plant 1 was implemented on the same site. The digestion plant 1 (Brecht I), started up in 1992, treats 10,000 – 15,000 tpa of the same wastes (source separated biowaste, garden waste and paper). Positive experience with this plant, combined with the successful implementation of source separation systems led to the decision to construct digestion plant 2. Figure 41 shows an aerial photo of the Brecht digestion plant 2 site.
Figure 41 Aerial photograph of Brecht (digestion plant 2) (OWS Dranco Promotional Information)
Brecht (digestion plant 2) has a designed average capacity of 35,000 tpa, with a designed peak capacity of 45,000 tpa, serving a population 300,000-400,000 people in the area. At the time of our visit almost 55,000 tpa were being treated. The materials processed on-site are, on a wet basis, approximately 15 - 20% kitchen waste, 70% garden waste and 10 - 15% unrecyclable paper. Nappies/diapers are also present in the incoming wastes stream. Despite the source separation of biowastes being well established in Belgium, some contamination was still apparent. Much of the contamination arises from the fact that many citizens deposit their biowaste in their biowaste bins in plastic bags, despite instructions to the contrary. Further public education campaigns could possibly reduce the amount of non-organic contamination. Around 2% of the incoming waste is estimated to be non-organic or
Anaerobic digester
In-vessel composting
Wastes reception and pre-treatment
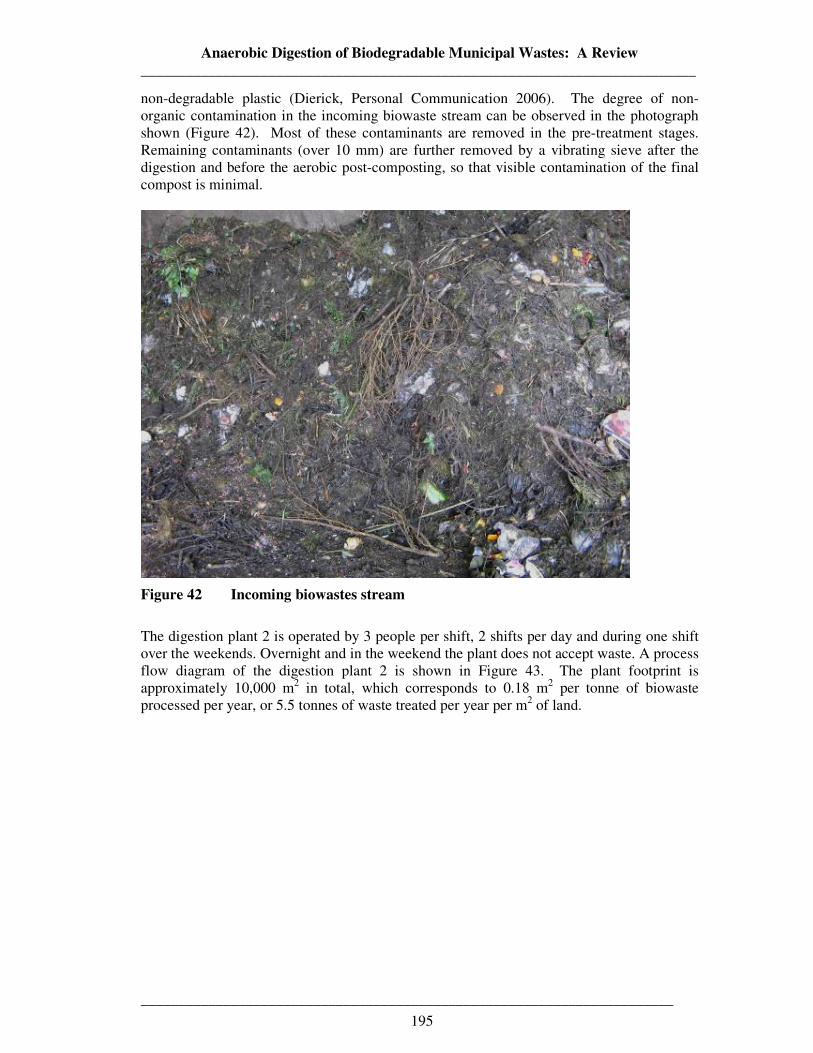
Anaerobic Digestion of Biodegradable Municipal Wastes: A Review __________________________________________________________________________
_______________________________________________________________________
195
non-degradable plastic (Dierick, Personal Communication 2006). The degree of non-organic contamination in the incoming biowaste stream can be observed in the photograph shown (Figure 42). Most of these contaminants are removed in the pre-treatment stages. Remaining contaminants (over 10 mm) are further removed by a vibrating sieve after the digestion and before the aerobic post-composting, so that visible contamination of the final compost is minimal.
Figure 42 Incoming biowastes stream
The digestion plant 2 is operated by 3 people per shift, 2 shifts per day and during one shift over the weekends. Overnight and in the weekend the plant does not accept waste. A process flow diagram of the digestion plant 2 is shown in Figure 43. The plant footprint is approximately 10,000 m2 in total, which corresponds to 0.18 m2 per tonne of biowaste processed per year, or 5.5 tonnes of waste treated per year per m2 of land.
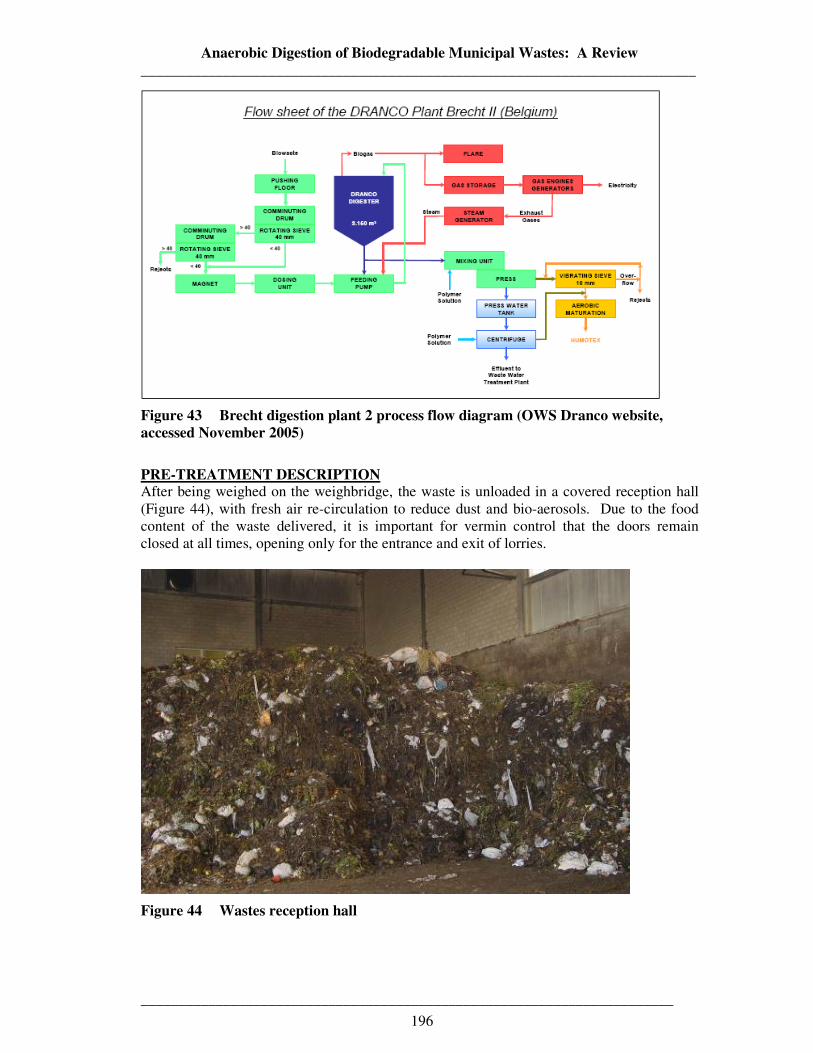
Anaerobic Digestion of Biodegradable Municipal Wastes: A Review __________________________________________________________________________
_______________________________________________________________________
196
Figure 43 Brecht digestion plant 2 process flow diagram (OWS Dranco website, accessed November 2005)
PRE-TREATMENT DESCRIPTION After being weighed on the weighbridge, the waste is unloaded in a covered reception hall (Figure 44), with fresh air re-circulation to reduce dust and bio-aerosols. Due to the food content of the waste delivered, it is important for vermin control that the doors remain closed at all times, opening only for the entrance and exit of lorries.
Figure 44 Wastes reception hall
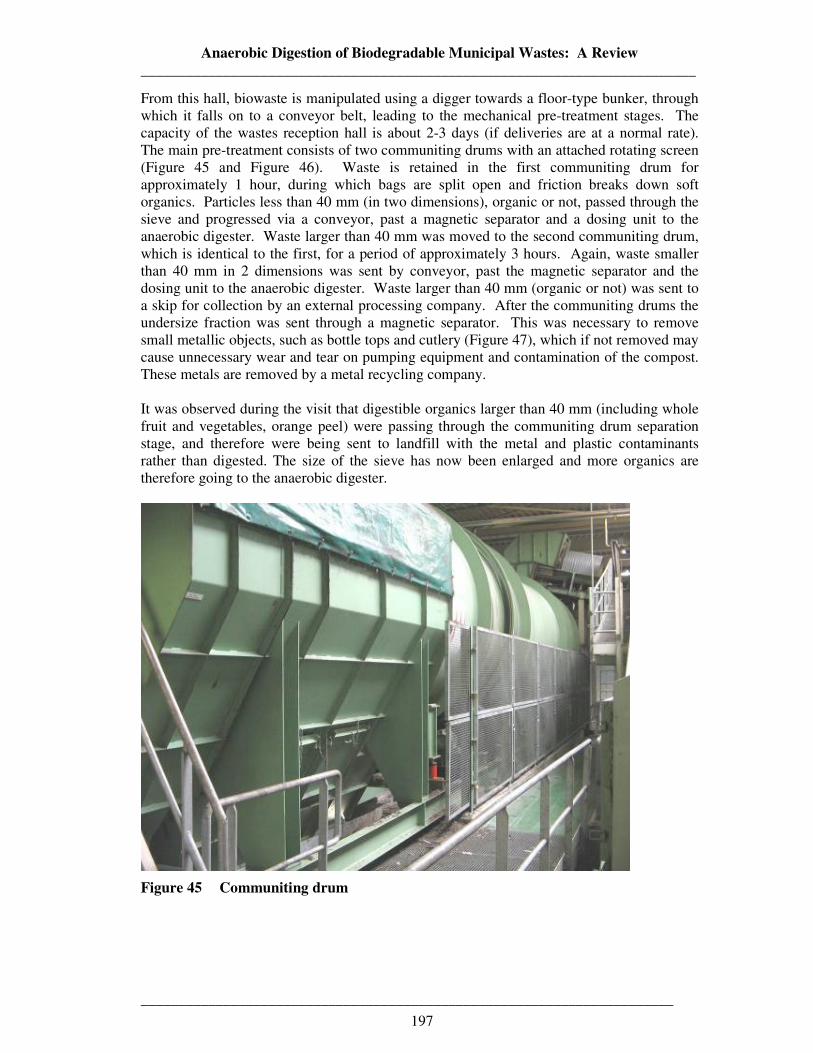
Anaerobic Digestion of Biodegradable Municipal Wastes: A Review __________________________________________________________________________
_______________________________________________________________________
197
From this hall, biowaste is manipulated using a digger towards a floor-type bunker, through which it falls on to a conveyor belt, leading to the mechanical pre-treatment stages. The capacity of the wastes reception hall is about 2-3 days (if deliveries are at a normal rate). The main pre-treatment consists of two communiting drums with an attached rotating screen (Figure 45 and Figure 46). Waste is retained in the first communiting drum for approximately 1 hour, during which bags are split open and friction breaks down soft organics. Particles less than 40 mm (in two dimensions), organic or not, passed through the sieve and progressed via a conveyor, past a magnetic separator and a dosing unit to the anaerobic digester. Waste larger than 40 mm was moved to the second communiting drum, which is identical to the first, for a period of approximately 3 hours. Again, waste smaller than 40 mm in 2 dimensions was sent by conveyor, past the magnetic separator and the dosing unit to the anaerobic digester. Waste larger than 40 mm (organic or not) was sent to a skip for collection by an external processing company. After the communiting drums the undersize fraction was sent through a magnetic separator. This was necessary to remove small metallic objects, such as bottle tops and cutlery (Figure 47), which if not removed may cause unnecessary wear and tear on pumping equipment and contamination of the compost. These metals are removed by a metal recycling company. It was observed during the visit that digestible organics larger than 40 mm (including whole fruit and vegetables, orange peel) were passing through the communiting drum separation stage, and therefore were being sent to landfill with the metal and plastic contaminants rather than digested. The size of the sieve has now been enlarged and more organics are therefore going to the anaerobic digester.
Figure 45 Communiting drum
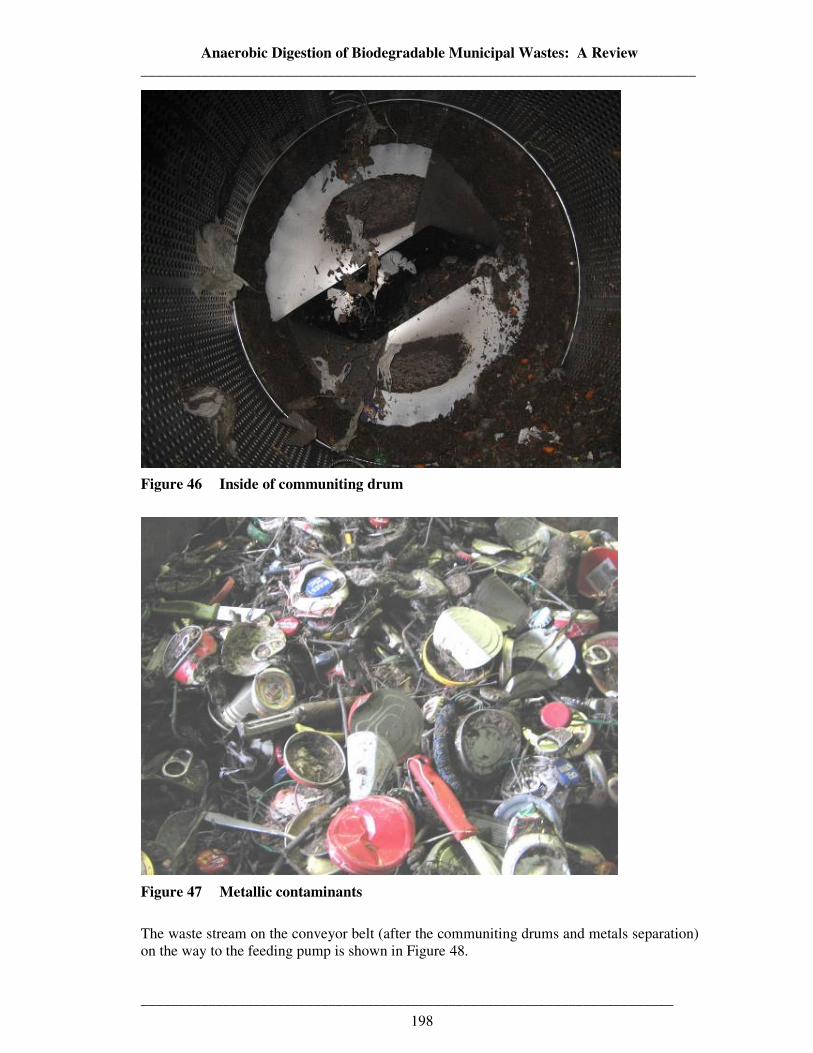
Anaerobic Digestion of Biodegradable Municipal Wastes: A Review __________________________________________________________________________
_______________________________________________________________________
198
Figure 46 Inside of communiting drum
Figure 47 Metallic contaminants
The waste stream on the conveyor belt (after the communiting drums and metals separation) on the way to the feeding pump is shown in Figure 48.
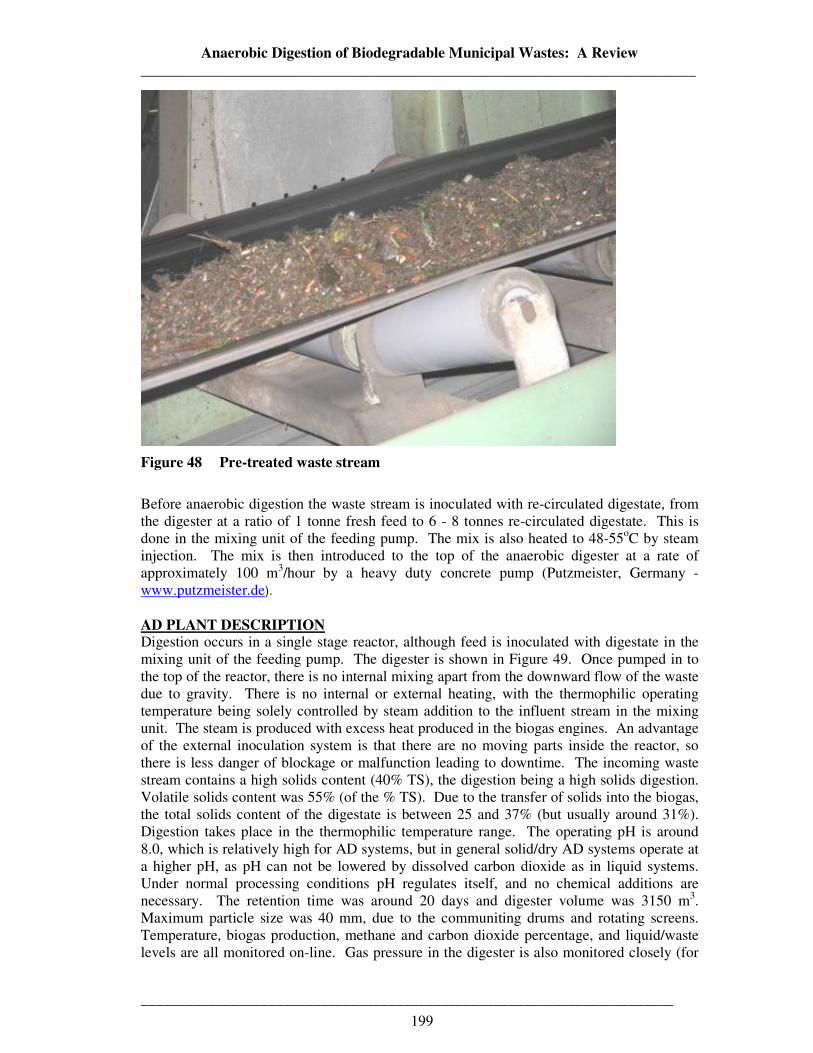
Anaerobic Digestion of Biodegradable Municipal Wastes: A Review __________________________________________________________________________
_______________________________________________________________________
199
Figure 48 Pre-treated waste stream
Before anaerobic digestion the waste stream is inoculated with re-circulated digestate, from the digester at a ratio of 1 tonne fresh feed to 6 - 8 tonnes re-circulated digestate. This is done in the mixing unit of the feeding pump. The mix is also heated to 48-55oC by steam injection. The mix is then introduced to the top of the anaerobic digester at a rate of approximately 100 m3/hour by a heavy duty concrete pump (Putzmeister, Germany - www.putzmeister.de).
AD PLANT DESCRIPTION Digestion occurs in a single stage reactor, although feed is inoculated with digestate in the mixing unit of the feeding pump. The digester is shown in Figure 49. Once pumped in to the top of the reactor, there is no internal mixing apart from the downward flow of the waste due to gravity. There is no internal or external heating, with the thermophilic operating temperature being solely controlled by steam addition to the influent stream in the mixing unit. The steam is produced with excess heat produced in the biogas engines. An advantage of the external inoculation system is that there are no moving parts inside the reactor, so there is less danger of blockage or malfunction leading to downtime. The incoming waste stream contains a high solids content (40% TS), the digestion being a high solids digestion. Volatile solids content was 55% (of the % TS). Due to the transfer of solids into the biogas, the total solids content of the digestate is between 25 and 37% (but usually around 31%). Digestion takes place in the thermophilic temperature range. The operating pH is around 8.0, which is relatively high for AD systems, but in general solid/dry AD systems operate at a higher pH, as pH can not be lowered by dissolved carbon dioxide as in liquid systems. Under normal processing conditions pH regulates itself, and no chemical additions are necessary. The retention time was around 20 days and digester volume was 3150 m3. Maximum particle size was 40 mm, due to the communiting drums and rotating screens. Temperature, biogas production, methane and carbon dioxide percentage, and liquid/waste levels are all monitored on-line. Gas pressure in the digester is also monitored closely (for
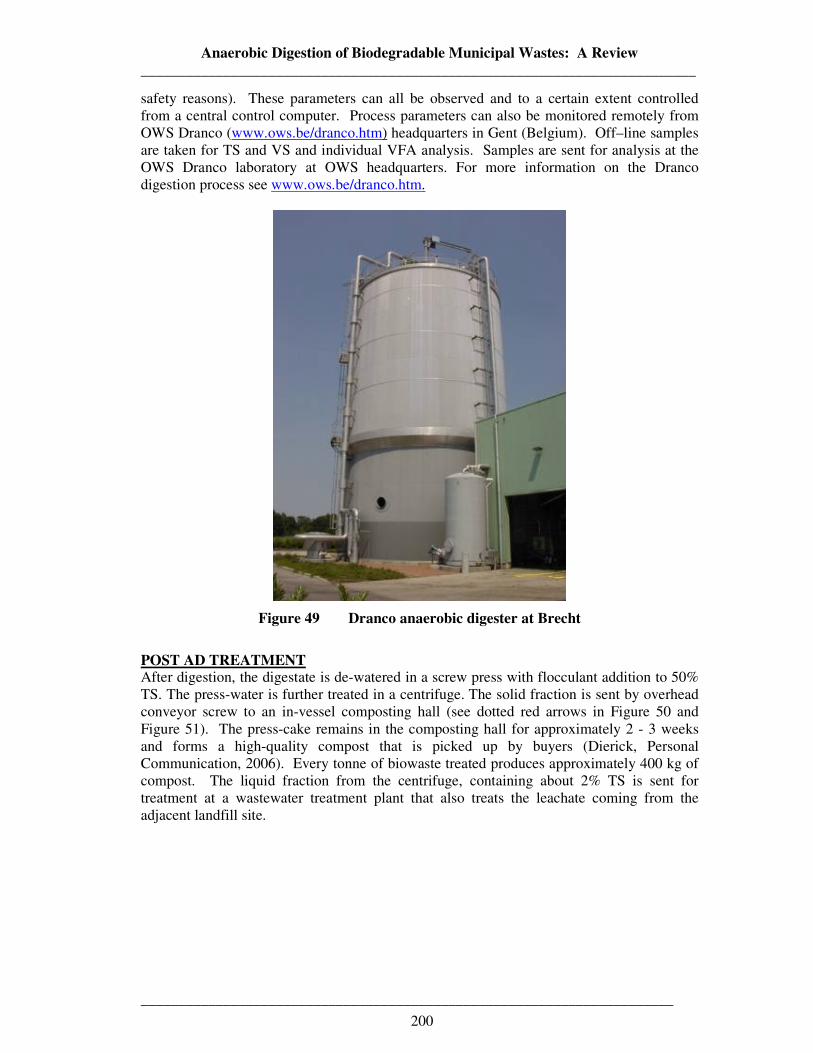
Anaerobic Digestion of Biodegradable Municipal Wastes: A Review __________________________________________________________________________
_______________________________________________________________________
200
safety reasons). These parameters can all be observed and to a certain extent controlled from a central control computer. Process parameters can also be monitored remotely from OWS Dranco (www.ows.be/dranco.htm) headquarters in Gent (Belgium). Off–line samples are taken for TS and VS and individual VFA analysis. Samples are sent for analysis at the OWS Dranco laboratory at OWS headquarters. For more information on the Dranco digestion process see www.ows.be/dranco.htm.
Figure 49 Dranco anaerobic digester at Brecht
POST AD TREATMENT After digestion, the digestate is de-watered in a screw press with flocculant addition to 50% TS. The press-water is further treated in a centrifuge. The solid fraction is sent by overhead conveyor screw to an in-vessel composting hall (see dotted red arrows in Figure 50 and Figure 51). The press-cake remains in the composting hall for approximately 2 - 3 weeks and forms a high-quality compost that is picked up by buyers (Dierick, Personal Communication, 2006). Every tonne of biowaste treated produces approximately 400 kg of compost. The liquid fraction from the centrifuge, containing about 2% TS is sent for treatment at a wastewater treatment plant that also treats the leachate coming from the adjacent landfill site.
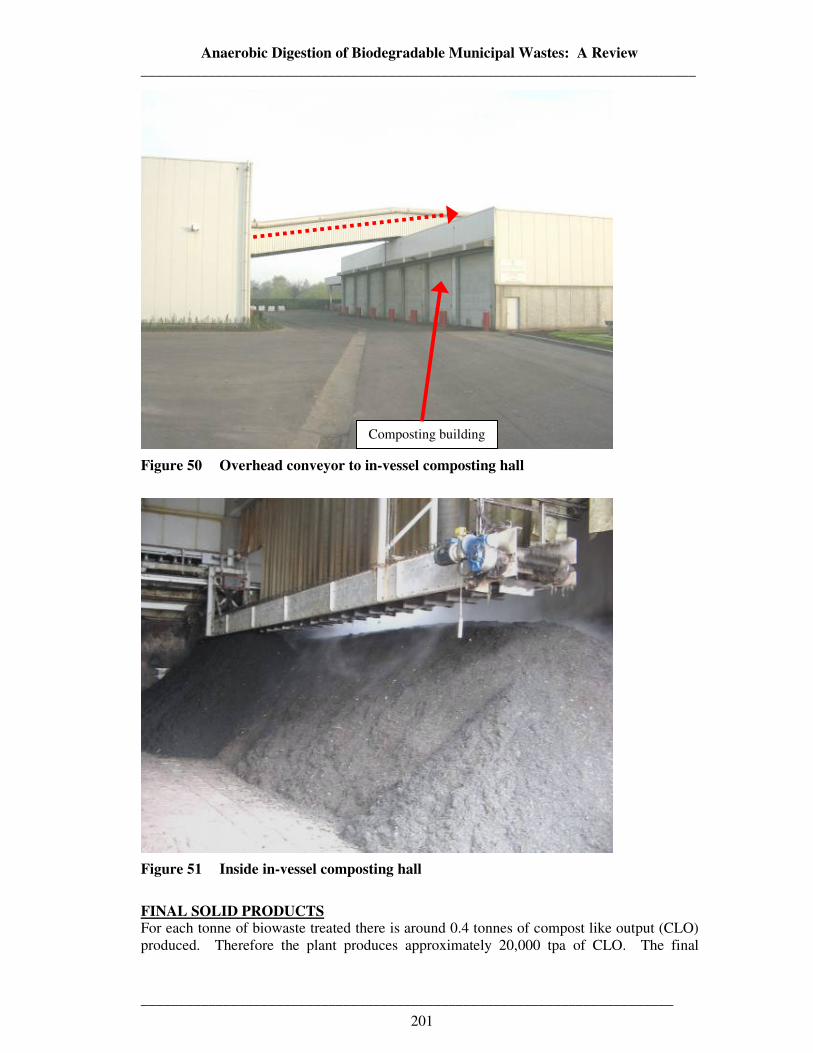
Anaerobic Digestion of Biodegradable Municipal Wastes: A Review __________________________________________________________________________
_______________________________________________________________________
201
Figure 50 Overhead conveyor to in-vessel composting hall
Figure 51 Inside in-vessel composting hall
FINAL SOLID PRODUCTS For each tonne of biowaste treated there is around 0.4 tonnes of compost like output (CLO) produced. Therefore the plant produces approximately 20,000 tpa of CLO. The final
Composting building
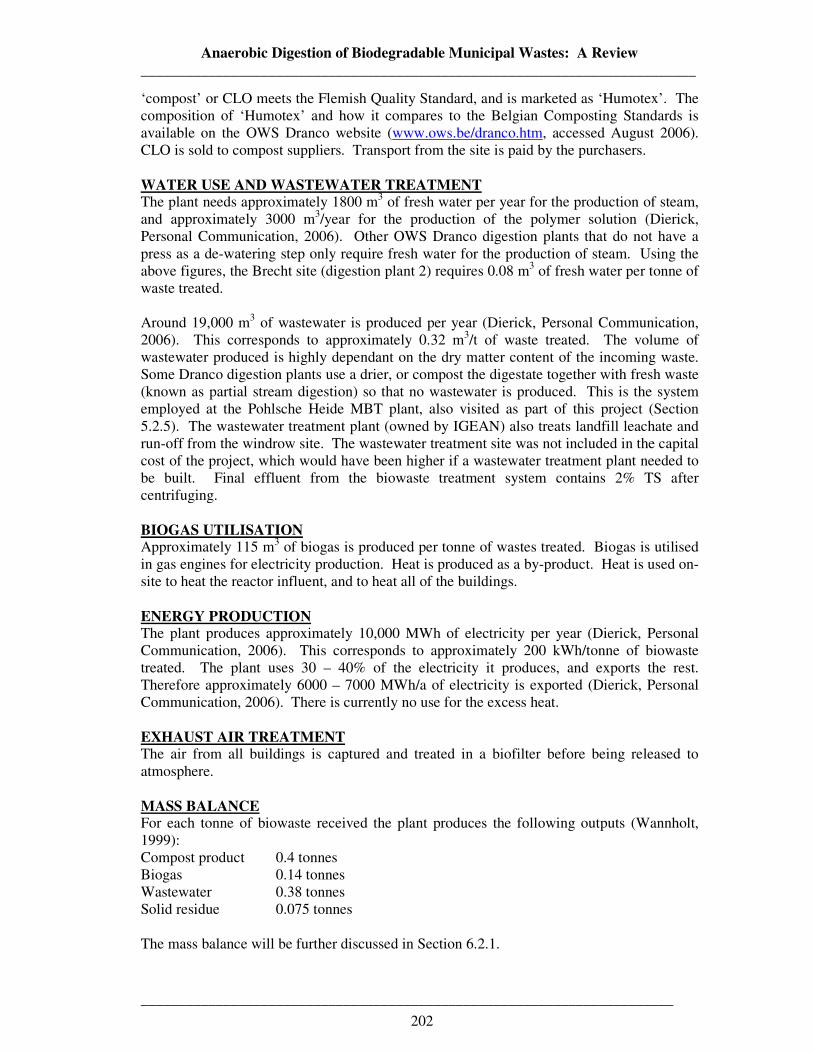
Anaerobic Digestion of Biodegradable Municipal Wastes: A Review __________________________________________________________________________
_______________________________________________________________________
202
‘compost’ or CLO meets the Flemish Quality Standard, and is marketed as ‘Humotex’. The composition of ‘Humotex’ and how it compares to the Belgian Composting Standards is available on the OWS Dranco website (www.ows.be/dranco.htm, accessed August 2006). CLO is sold to compost suppliers. Transport from the site is paid by the purchasers. WATER USE AND WASTEWATER TREATMENT The plant needs approximately 1800 m3 of fresh water per year for the production of steam, and approximately 3000 m3/year for the production of the polymer solution (Dierick, Personal Communication, 2006). Other OWS Dranco digestion plants that do not have a press as a de-watering step only require fresh water for the production of steam. Using the above figures, the Brecht site (digestion plant 2) requires 0.08 m3 of fresh water per tonne of waste treated. Around 19,000 m3 of wastewater is produced per year (Dierick, Personal Communication, 2006). This corresponds to approximately 0.32 m3/t of waste treated. The volume of wastewater produced is highly dependant on the dry matter content of the incoming waste. Some Dranco digestion plants use a drier, or compost the digestate together with fresh waste (known as partial stream digestion) so that no wastewater is produced. This is the system employed at the Pohlsche Heide MBT plant, also visited as part of this project (Section 5.2.5). The wastewater treatment plant (owned by IGEAN) also treats landfill leachate and run-off from the windrow site. The wastewater treatment site was not included in the capital cost of the project, which would have been higher if a wastewater treatment plant needed to be built. Final effluent from the biowaste treatment system contains 2% TS after centrifuging. BIOGAS UTILISATION Approximately 115 m3 of biogas is produced per tonne of wastes treated. Biogas is utilised in gas engines for electricity production. Heat is produced as a by-product. Heat is used on-site to heat the reactor influent, and to heat all of the buildings. ENERGY PRODUCTION The plant produces approximately 10,000 MWh of electricity per year (Dierick, Personal Communication, 2006). This corresponds to approximately 200 kWh/tonne of biowaste treated. The plant uses 30 – 40% of the electricity it produces, and exports the rest. Therefore approximately 6000 – 7000 MWh/a of electricity is exported (Dierick, Personal Communication, 2006). There is currently no use for the excess heat. EXHAUST AIR TREATMENT The air from all buildings is captured and treated in a biofilter before being released to atmosphere. MASS BALANCE For each tonne of biowaste received the plant produces the following outputs (Wannholt, 1999): Compost product 0.4 tonnes Biogas 0.14 tonnes Wastewater 0.38 tonnes Solid residue 0.075 tonnes The mass balance will be further discussed in Section 6.2.1.
Anaerobic Digestion of Biodegradable Municipal Wastes: A Review __________________________________________________________________________
_______________________________________________________________________
203
COSTS AND ECONOMICS In total, the plant was reported to have cost in the region of £10 million in 2000. The anaerobic digester itself was estimated at one quarter of this, although the digester can not ‘stand alone’ and the rest of the plant consists of necessary system components. Operating costs are reported to be between £40 (Wannholt, 1999) and £59 (Eunomia, 2004) per tonne of biowaste treated. IGEAN are also responsible for wastes collection and received a gate fee of €82/tonne of waste collected and treated (Energie-Cities website, accessed February 2006). This figure may well have changed since the reference was quoted. Approximately 6000 – 7000 MWh/a of electricity is available for export to the grid. At current UK average prices (£107.50/MWh, Non Fossil Purchasing Agency website, accessed September 2006) this would be worth £645,000 - £752,500. VISUAL AND LOCAL IMPACT The plant is situated in countryside/farmland a few kilometres outside the town of Brecht. The tallest point of the plant is the anaerobic reactor at 25 m, and is visible from a long distance due to the flat and undeveloped nature of the land. No odour was detected outside the plant. The anaerobic digestion process itself, as with other AD processes emitted no odours as the system is completely closed. The waste reception area, as would be expected, smelt unpleasant, despite the fresh air re-circulation. As with many wastes reception halls, it is unlikely that bio-aerosols were completely absent inside the wastes reception area, but the doors were kept closed at all times (except for deliveries), and the air was treated before being released. Due to the moist nature of the waste, there was no visible dust in the air (as is often the case at MBT plants treating residual wastes). Very good housekeeping is required to keep vermin away, especially around the waste reception area. CHALLENGES, DISCUSSION AND CONCLUSIONS The total processing time from entering to leaving the site is approximately 35 days (including usually 0 - 2 days in the reception hall, 0.5 days of pre-treatment, 20 days in the digester, 14 days in the composting/maturation stages). In a UK context, the benefits of mixing garden waste, which can be cheaply windrow composted, with Category 3 kitchen waste, which must be treated in compliance with UK ABPR legislation, are debatable. This would have the effect of ‘contaminating’ the whole (easily and cheaply treatable) garden waste stream with animal by-products, meaning that the entire garden waste stream would need to be treated to UK ABPR standards as well as the kitchen waste stream. If the same biowaste percentages are assumed as in Brecht (digestion plant 2), (70% of 55,000 tpa), this would mean contaminating 38,500 tpa of garden waste which is of little energetic value when digested. The benefits are the renewable energy produced, the diversion of kitchen waste from landfill and the emissions reductions provided by both of these. As the compost can be used on land, the nutrients are also returned to the soil. The biowaste treatment system employed here is tried, tested and proven to be successful. The process has run successfully since 2000, and the Brecht digestion plant 1 ran successfully since 1992.

Anaerobic Digestion of Biodegradable Municipal Wastes: A Review __________________________________________________________________________
_______________________________________________________________________
204
5.1.2 Grindsted Organic Wastes Treatment Plant INTRODUCTION The Grindsted Organic Wastes Treatment Plant (at the site of the wastewater treatment plant, at Grindsted, Denmark) was started up in 1997. The plant is owned and operated by Grindsted Municipality, and is responsible for wastes and wastewater treatment. The Grindsted AD plant is integrated into the sewage treatment plant, as can be seen in Figure 52. As well as approximately 39,000 tpa of sewage sludge the plant accepts approximately 12,200 tpa of industrial organic wastes, 250 tpa of food waste from supermarkets and 1200 tpa of kitchen wastes from approximately 6700 households in the Grindsted Municipality. The plant, built by Krüger, was originally started up as a sewage sludge digester but has been modified to treat other organic waste streams.
Figure 52 Aerial photograph of Grindsted Wastes and Wastewater Treatment Plant
The building on the right beside the car park is the office building, which also contains a laboratory. The anaerobic digester and gas treatment and storage tanks are on the left. The small building immediately to the right of the digester contains the pulper, the mixing/buffer tank, the heat exchangers, the hygienisation tank and the gas engine. The underground reception tank for industrial wastes can not be seen in this photograph, but is located behind this building. The small green cluster to the left of the digester contains the BMW reception point, with the screens, and the shredder. The large building in the middle of Figure 52 is the digestate composting and storage hall. Between this large building and the offices is the de-watering building. The top half of the photo shows the conventional aerobic wastewater treatment plant.
Organic wastes treatment plant
Wastewater treatment plant
Offices
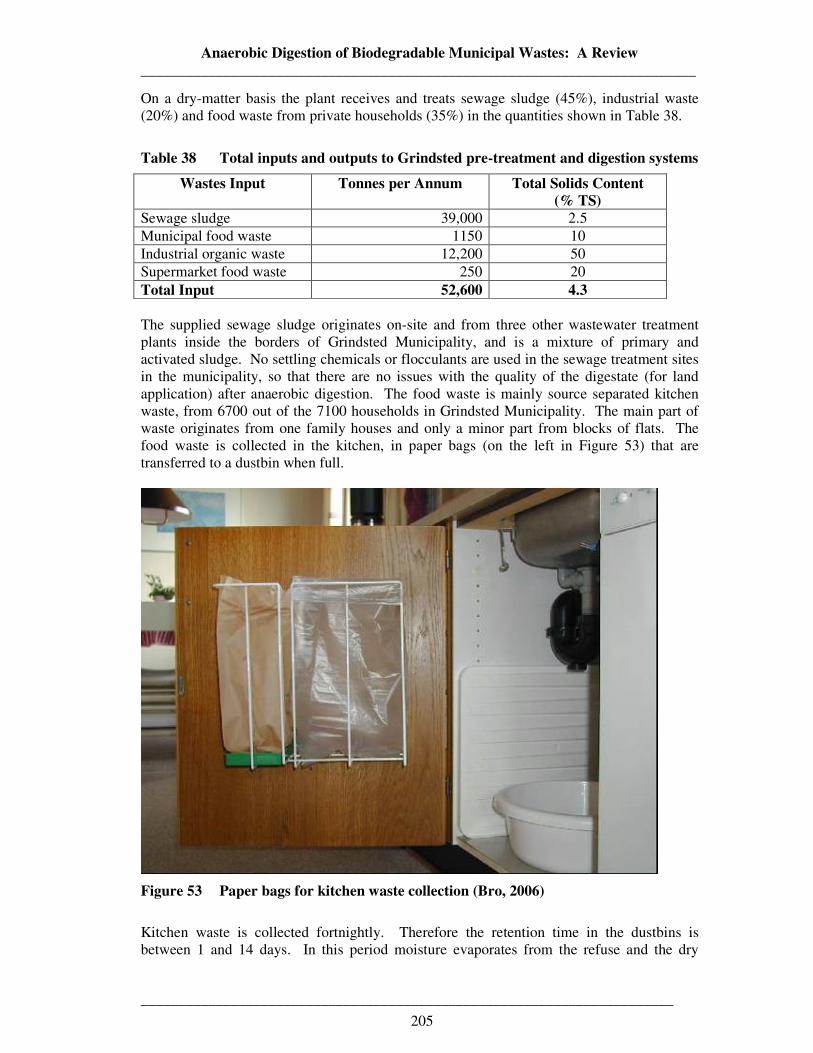
Anaerobic Digestion of Biodegradable Municipal Wastes: A Review __________________________________________________________________________
_______________________________________________________________________
205
On a dry-matter basis the plant receives and treats sewage sludge (45%), industrial waste (20%) and food waste from private households (35%) in the quantities shown in Table 38.
Table 38 Total inputs and outputs to Grindsted pre-treatment and digestion systems
Wastes Input Tonnes per Annum Total Solids Content (% TS)
Sewage sludge 39,000 2.5 Municipal food waste 1150 10 Industrial organic waste 12,200 50 Supermarket food waste 250 20 Total Input 52,600 4.3 The supplied sewage sludge originates on-site and from three other wastewater treatment plants inside the borders of Grindsted Municipality, and is a mixture of primary and activated sludge. No settling chemicals or flocculants are used in the sewage treatment sites in the municipality, so that there are no issues with the quality of the digestate (for land application) after anaerobic digestion. The food waste is mainly source separated kitchen waste, from 6700 out of the 7100 households in Grindsted Municipality. The main part of waste originates from one family houses and only a minor part from blocks of flats. The food waste is collected in the kitchen, in paper bags (on the left in Figure 53) that are transferred to a dustbin when full.
Figure 53 Paper bags for kitchen waste collection (Bro, 2006)
Kitchen waste is collected fortnightly. Therefore the retention time in the dustbins is between 1 and 14 days. In this period moisture evaporates from the refuse and the dry

Anaerobic Digestion of Biodegradable Municipal Wastes: A Review __________________________________________________________________________
_______________________________________________________________________
206
matter content increases to around 40%. As can be seen in Figure 54 the paper bags do not get soggy or waterlogged, despite containing wet kitchen waste, and arrive at the site intact.
Figure 54 Paper bags in the wastes reception pit (Bro, 2006)
No nappies, plastic packing and aluminium wrapping are allowed. The sorting work is controlled by the waste collectors. A warning and a penalty system, managed by the administration keeps mis-sorting to a minimum so the waste treatment plant can run with a minimum of maintenance and operation stoppages. Source separation of organic wastes has occurred in the area since the mid nineties, and there is a high degree of co-operation amongst the citizens. Less than 1% contaminants are observed in the wastes stream. Industrial waste feedstocks originate from the food industry in the neighbourhood and are waste from production of food additives and from manufacturing of vegetable products such as chopped salads and potato-based products. Most of the waste consists of peel, cover leaves and spoilt production. Grindsted Wastewater Treatment Plant has nine employees in total. These nine employees are responsible for 35 pump-stations and 3 wastewater treatment plants in addition to the Grindsted Wastewater Treatment plant. Four of these staff work on-site and one other constantly monitors the process from a central control computer. Other staff include a mechanical engineer, a laboratory assistant responsible for taking and analysing samples, and a tanker driver, who delivers sewage sludge from the other sewage treatment works and transports digestate to the farmers who will use it. Bjarne Bro, who guided the site visit, manages the wastewater treatment and wastes collection in the Grindsted municipality from the local government base in the town hall.
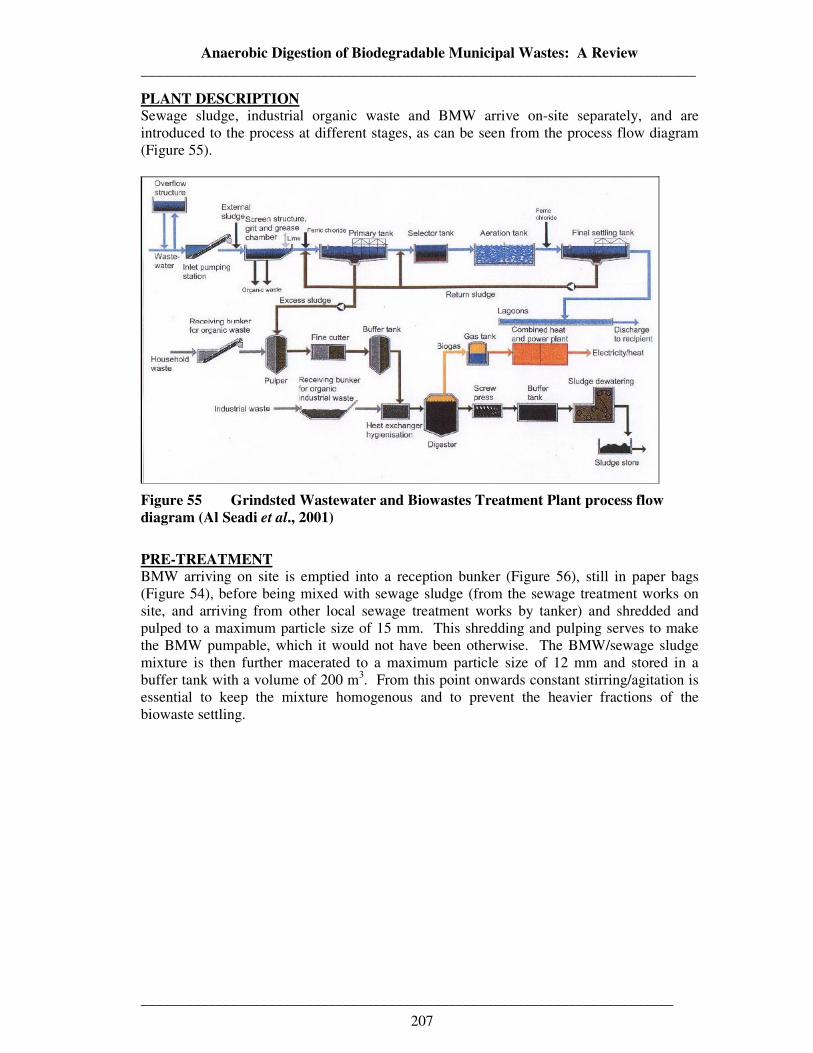
Anaerobic Digestion of Biodegradable Municipal Wastes: A Review __________________________________________________________________________
_______________________________________________________________________
207
PLANT DESCRIPTION Sewage sludge, industrial organic waste and BMW arrive on-site separately, and are introduced to the process at different stages, as can be seen from the process flow diagram (Figure 55).
Figure 55 Grindsted Wastewater and Biowastes Treatment Plant process flow diagram (Al Seadi et al., 2001)
PRE-TREATMENT BMW arriving on site is emptied into a reception bunker (Figure 56), still in paper bags (Figure 54), before being mixed with sewage sludge (from the sewage treatment works on site, and arriving from other local sewage treatment works by tanker) and shredded and pulped to a maximum particle size of 15 mm. This shredding and pulping serves to make the BMW pumpable, which it would not have been otherwise. The BMW/sewage sludge mixture is then further macerated to a maximum particle size of 12 mm and stored in a buffer tank with a volume of 200 m3. From this point onwards constant stirring/agitation is essential to keep the mixture homogenous and to prevent the heavier fractions of the biowaste settling.
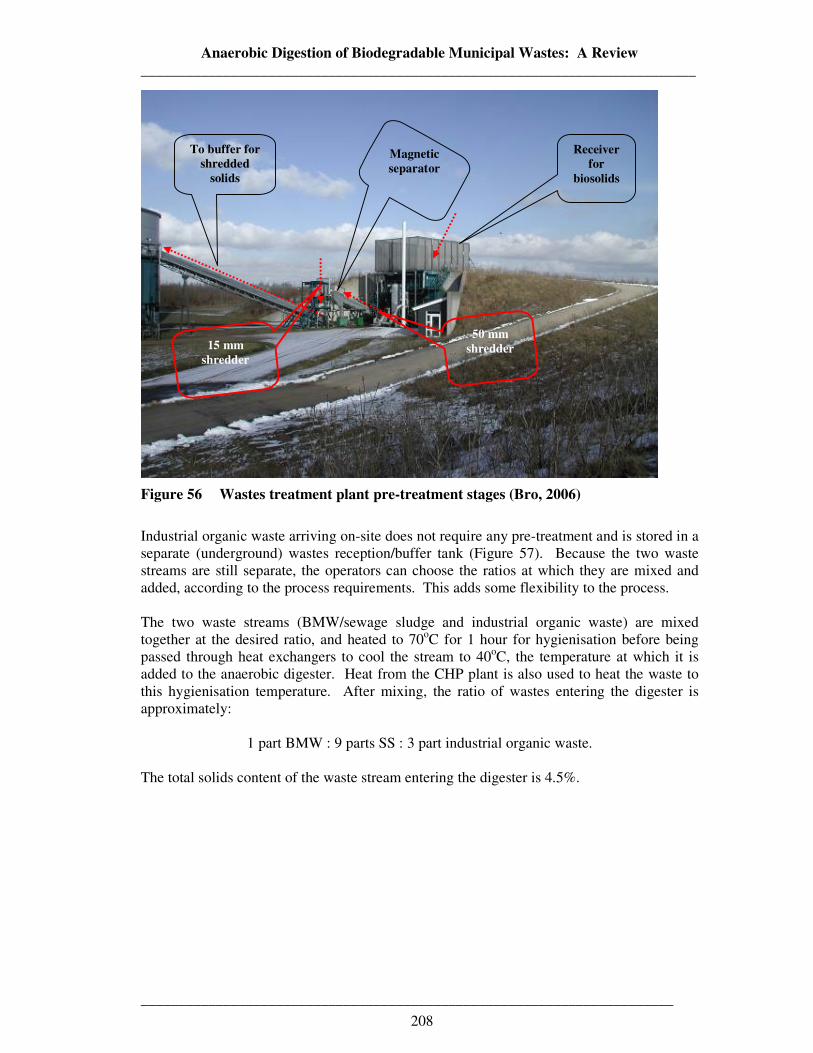
Anaerobic Digestion of Biodegradable Municipal Wastes: A Review __________________________________________________________________________
_______________________________________________________________________
208
Figure 56 Wastes treatment plant pre-treatment stages (Bro, 2006)
Industrial organic waste arriving on-site does not require any pre-treatment and is stored in a separate (underground) wastes reception/buffer tank (Figure 57). Because the two waste streams are still separate, the operators can choose the ratios at which they are mixed and added, according to the process requirements. This adds some flexibility to the process. The two waste streams (BMW/sewage sludge and industrial organic waste) are mixed together at the desired ratio, and heated to 70oC for 1 hour for hygienisation before being passed through heat exchangers to cool the stream to 40oC, the temperature at which it is added to the anaerobic digester. Heat from the CHP plant is also used to heat the waste to this hygienisation temperature. After mixing, the ratio of wastes entering the digester is approximately:
1 part BMW : 9 parts SS : 3 part industrial organic waste. The total solids content of the waste stream entering the digester is 4.5%.
Receiver for
biosolids
50 mm shredder 15 mm
shredder
Magnetic separator
To buffer for shredded
solids
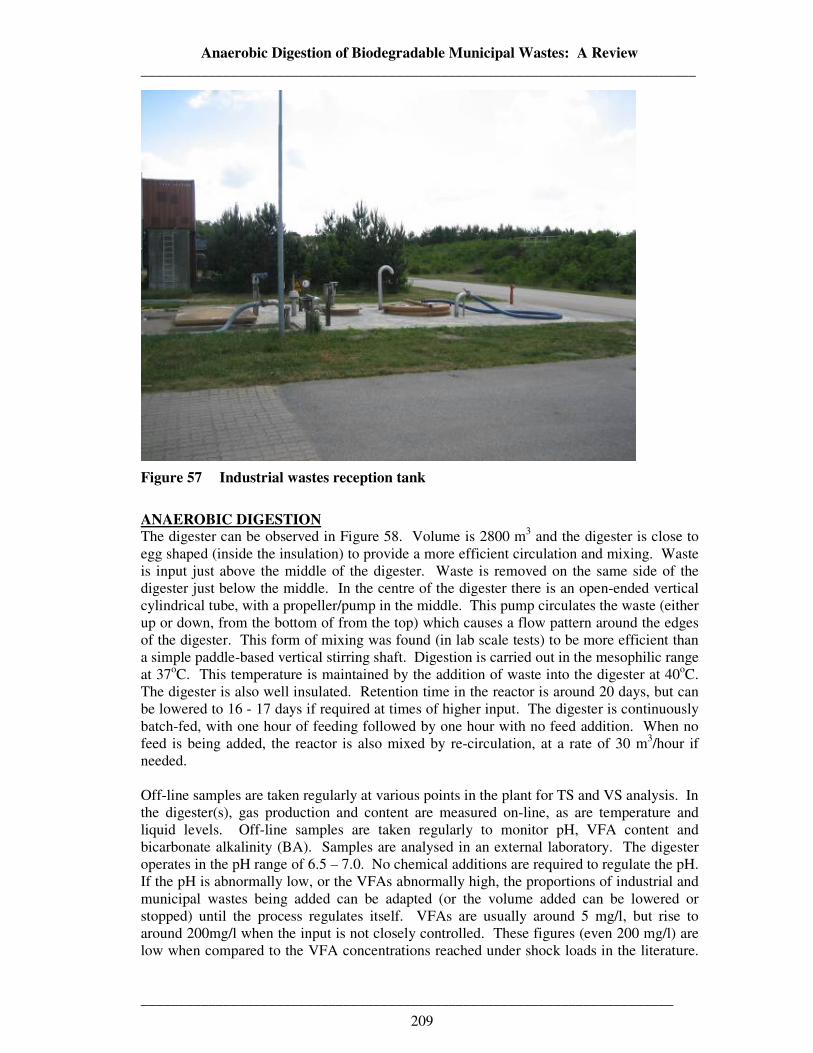
Anaerobic Digestion of Biodegradable Municipal Wastes: A Review __________________________________________________________________________
_______________________________________________________________________
209
Figure 57 Industrial wastes reception tank
ANAEROBIC DIGESTION The digester can be observed in Figure 58. Volume is 2800 m3 and the digester is close to egg shaped (inside the insulation) to provide a more efficient circulation and mixing. Waste is input just above the middle of the digester. Waste is removed on the same side of the digester just below the middle. In the centre of the digester there is an open-ended vertical cylindrical tube, with a propeller/pump in the middle. This pump circulates the waste (either up or down, from the bottom of from the top) which causes a flow pattern around the edges of the digester. This form of mixing was found (in lab scale tests) to be more efficient than a simple paddle-based vertical stirring shaft. Digestion is carried out in the mesophilic range at 37oC. This temperature is maintained by the addition of waste into the digester at 40oC. The digester is also well insulated. Retention time in the reactor is around 20 days, but can be lowered to 16 - 17 days if required at times of higher input. The digester is continuously batch-fed, with one hour of feeding followed by one hour with no feed addition. When no feed is being added, the reactor is also mixed by re-circulation, at a rate of 30 m3/hour if needed. Off-line samples are taken regularly at various points in the plant for TS and VS analysis. In the digester(s), gas production and content are measured on-line, as are temperature and liquid levels. Off-line samples are taken regularly to monitor pH, VFA content and bicarbonate alkalinity (BA). Samples are analysed in an external laboratory. The digester operates in the pH range of 6.5 – 7.0. No chemical additions are required to regulate the pH. If the pH is abnormally low, or the VFAs abnormally high, the proportions of industrial and municipal wastes being added can be adapted (or the volume added can be lowered or stopped) until the process regulates itself. VFAs are usually around 5 mg/l, but rise to around 200mg/l when the input is not closely controlled. These figures (even 200 mg/l) are low when compared to the VFA concentrations reached under shock loads in the literature.
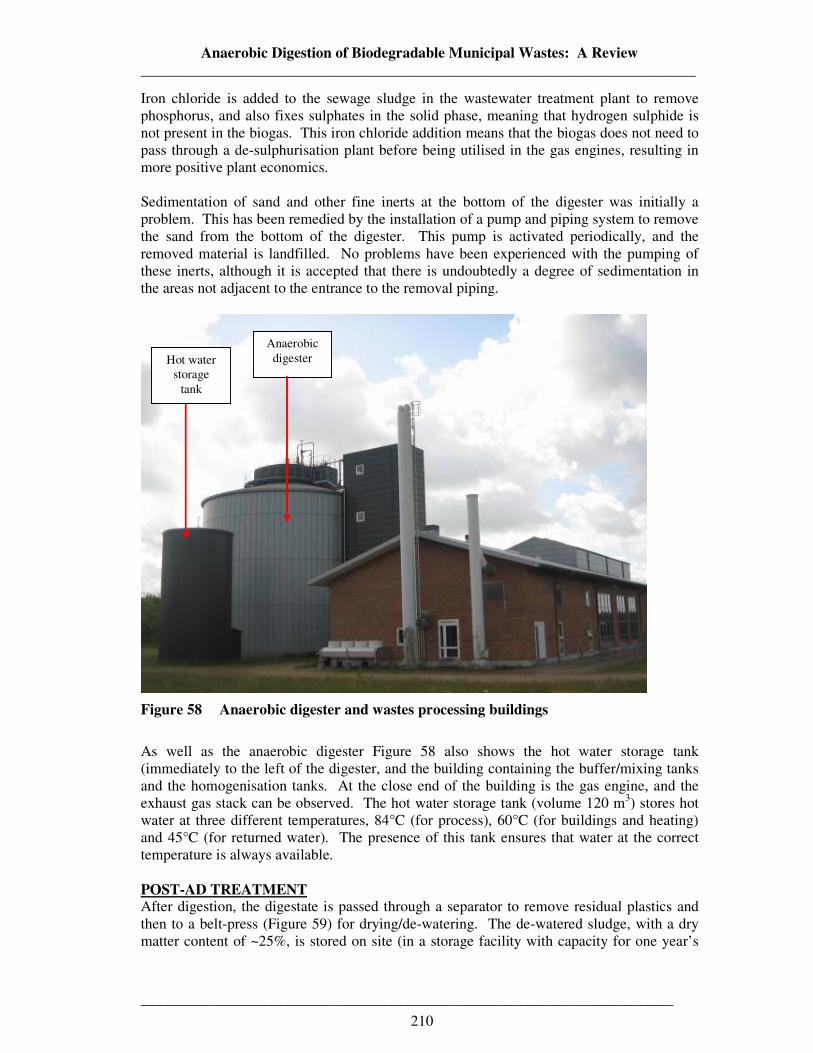
Anaerobic Digestion of Biodegradable Municipal Wastes: A Review __________________________________________________________________________
_______________________________________________________________________
210
Iron chloride is added to the sewage sludge in the wastewater treatment plant to remove phosphorus, and also fixes sulphates in the solid phase, meaning that hydrogen sulphide is not present in the biogas. This iron chloride addition means that the biogas does not need to pass through a de-sulphurisation plant before being utilised in the gas engines, resulting in more positive plant economics. Sedimentation of sand and other fine inerts at the bottom of the digester was initially a problem. This has been remedied by the installation of a pump and piping system to remove the sand from the bottom of the digester. This pump is activated periodically, and the removed material is landfilled. No problems have been experienced with the pumping of these inerts, although it is accepted that there is undoubtedly a degree of sedimentation in the areas not adjacent to the entrance to the removal piping.
Figure 58 Anaerobic digester and wastes processing buildings
As well as the anaerobic digester Figure 58 also shows the hot water storage tank (immediately to the left of the digester, and the building containing the buffer/mixing tanks and the homogenisation tanks. At the close end of the building is the gas engine, and the exhaust gas stack can be observed. The hot water storage tank (volume 120 m3) stores hot water at three different temperatures, 84°C (for process), 60°C (for buildings and heating) and 45°C (for returned water). The presence of this tank ensures that water at the correct temperature is always available. POST-AD TREATMENT After digestion, the digestate is passed through a separator to remove residual plastics and then to a belt-press (Figure 59) for drying/de-watering. The de-watered sludge, with a dry matter content of ~25%, is stored on site (in a storage facility with capacity for one year’s
Anaerobic digester Hot water
storage tank

Anaerobic Digestion of Biodegradable Municipal Wastes: A Review __________________________________________________________________________
_______________________________________________________________________
211
production), before being transported back to local farms and spread on land. The liquid section of the waste stream is re-circulated to the wastewater treatment plant.
Figure 59 Belt-press
DIGESTATE A good quality digestate is produced that meets all Danish legislation. Figure 60 shows a piece of the de-watered digestate as emerges from the belt-press. It can be seen that any plastic remaining in the digestate is too small to be noticeable. This digestate is composted in the well ventilated building shown in Figure 61 and Figure 62, and stored until it is removed from the site. Digestate is delivered to farmers, who use it as a soil improver on agricultural fields, plantations and forests. The farmers are paid approximately €9/t to land-spread the digestate.
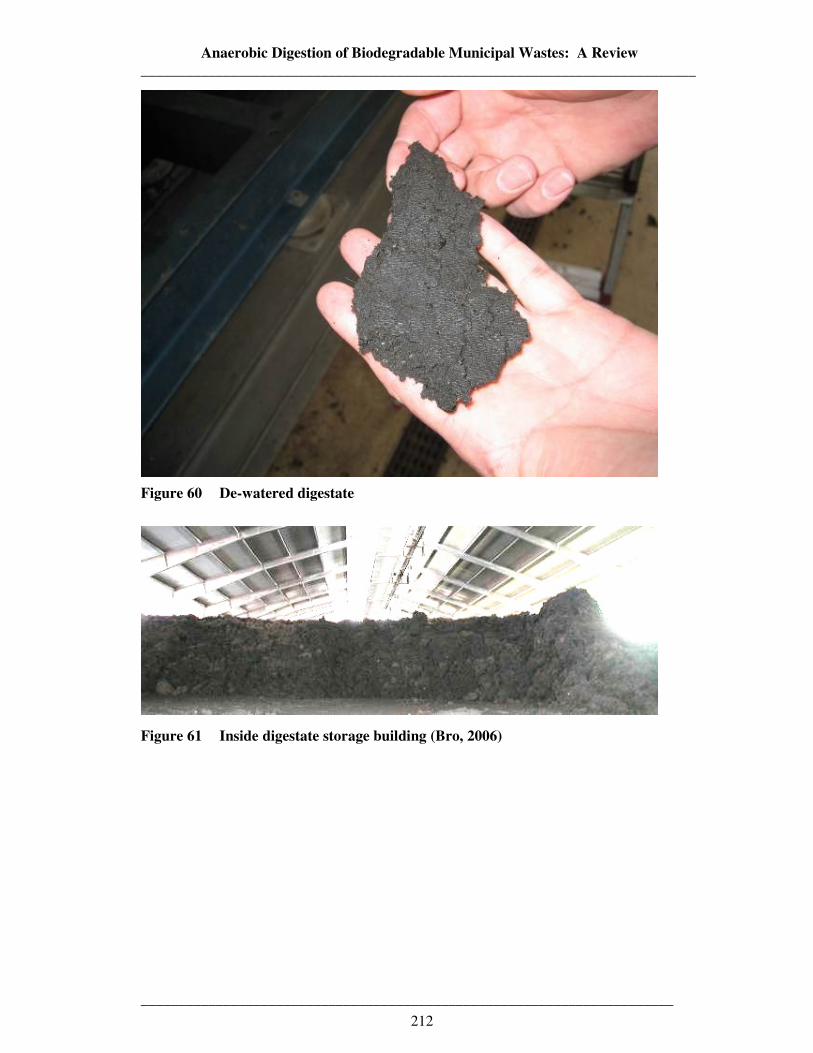
Anaerobic Digestion of Biodegradable Municipal Wastes: A Review __________________________________________________________________________
_______________________________________________________________________
212
Figure 60 De-watered digestate
Figure 61 Inside digestate storage building (Bro, 2006)

Anaerobic Digestion of Biodegradable Municipal Wastes: A Review __________________________________________________________________________
_______________________________________________________________________
213
Figure 62 Digestate composting and storage hall
The following passage written by Bjarne Bro (Process Manager at Grindsted Wastewater Treatment Plant, and guide for the site visit), sums up how the quality of the digestate is managed at Grindsted Wastewater Treatment Plant. The passage is extracted from Al Seadi et al. (2001).
According to the Danish legislation, the sludge producer (Grindsted municipality) has to document all the inlet and outlet sludge streams to the local authorities, to the sludge users, to the county and to the government. This documentation is based on a control program based on the analysis of the content of nutrients, heavy metals and xenobiotic substances as well in the inlet and the outlet streams of each single charge as principle. The digested sludge has a dry matter content of 23%, no odour, is pasteurised and its level of heavy metals and organic pollutants is within the limits permitted and is allowed to be used without any hygienic restrictions. The quality of the digested biomass is ensured via a quality management system (QMS) introduced by the producer. It includes a line of management and control steps in all the sludge and waste streams, starting with the control of household sorting and separate collection to the chemical analysis of the final product. The Danish legislation requires that no inlet concentration of heavy metal and persistent xenobiotic organic should be higher than the permissible limits for the outlets. Both feedstocks and end products are controlled, as the contaminants can only be eliminated by tracing contamination to individual waste sources. Source sorting This only concerns organic household waste. Each household has to sort and collect separate its own daily waste in two bins. One for food waste and one for the rest. The sorting must be done according
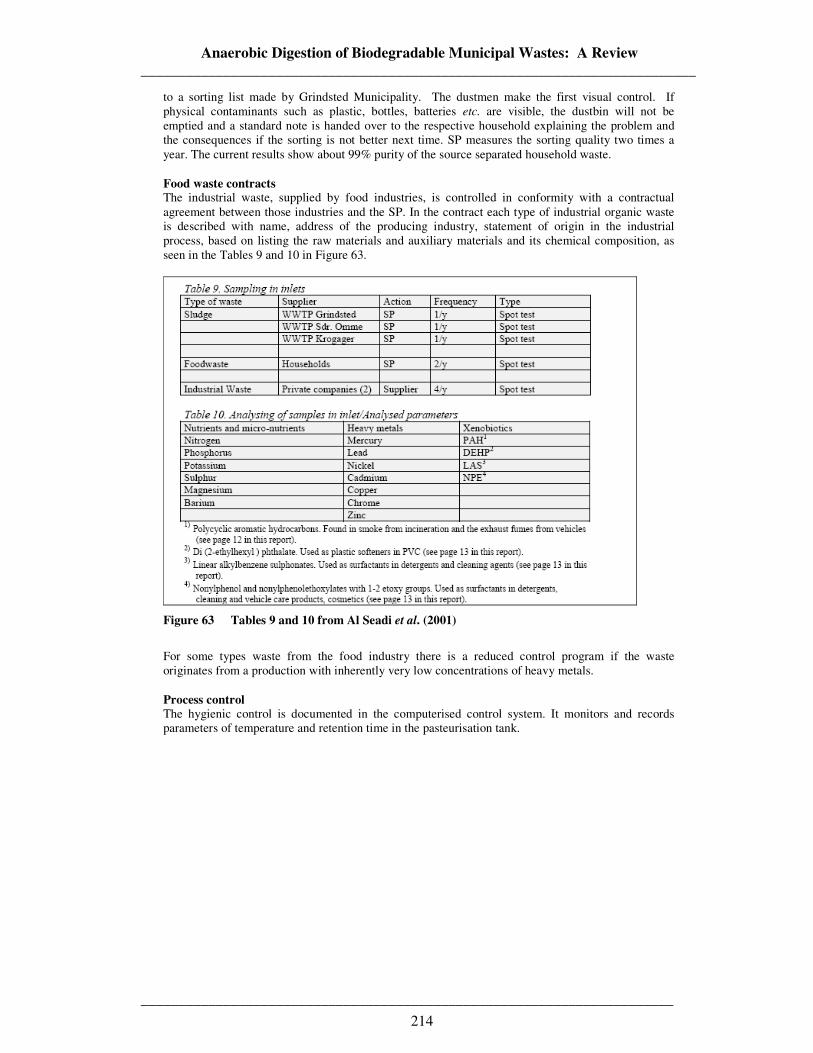
Anaerobic Digestion of Biodegradable Municipal Wastes: A Review __________________________________________________________________________
_______________________________________________________________________
214
to a sorting list made by Grindsted Municipality. The dustmen make the first visual control. If physical contaminants such as plastic, bottles, batteries etc. are visible, the dustbin will not be emptied and a standard note is handed over to the respective household explaining the problem and the consequences if the sorting is not better next time. SP measures the sorting quality two times a year. The current results show about 99% purity of the source separated household waste. Food waste contracts The industrial waste, supplied by food industries, is controlled in conformity with a contractual agreement between those industries and the SP. In the contract each type of industrial organic waste is described with name, address of the producing industry, statement of origin in the industrial process, based on listing the raw materials and auxiliary materials and its chemical composition, as seen in the Tables 9 and 10 in Figure 63.
Figure 63 Tables 9 and 10 from Al Seadi et al. (2001)
For some types waste from the food industry there is a reduced control program if the waste originates from a production with inherently very low concentrations of heavy metals. Process control The hygienic control is documented in the computerised control system. It monitors and records parameters of temperature and retention time in the pasteurisation tank.
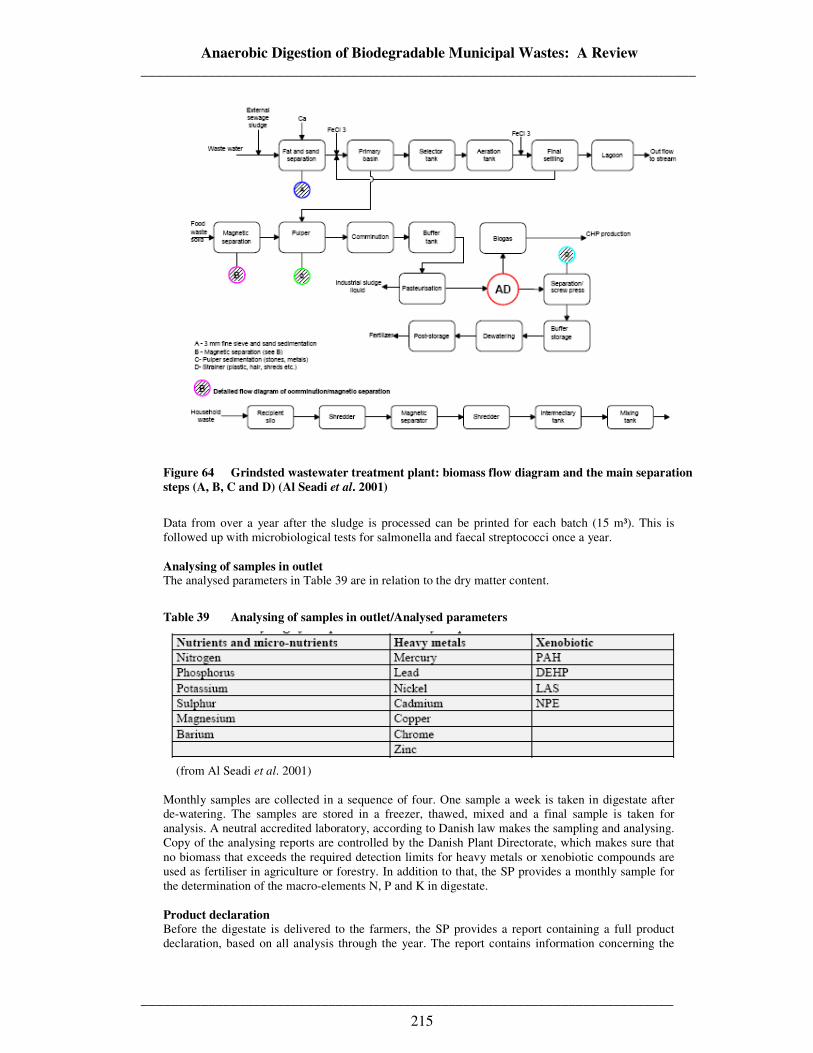
Anaerobic Digestion of Biodegradable Municipal Wastes: A Review __________________________________________________________________________
_______________________________________________________________________
215
Figure 64 Grindsted wastewater treatment plant: biomass flow diagram and the main separation steps (A, B, C and D) (Al Seadi et al. 2001)
Data from over a year after the sludge is processed can be printed for each batch (15 m³). This is followed up with microbiological tests for salmonella and faecal streptococci once a year. Analysing of samples in outlet The analysed parameters in Table 39 are in relation to the dry matter content.
Table 39 Analysing of samples in outlet/Analysed parameters
(from Al Seadi et al. 2001)
Monthly samples are collected in a sequence of four. One sample a week is taken in digestate after de-watering. The samples are stored in a freezer, thawed, mixed and a final sample is taken for analysis. A neutral accredited laboratory, according to Danish law makes the sampling and analysing. Copy of the analysing reports are controlled by the Danish Plant Directorate, which makes sure that no biomass that exceeds the required detection limits for heavy metals or xenobiotic compounds are used as fertiliser in agriculture or forestry. In addition to that, the SP provides a monthly sample for the determination of the macro-elements N, P and K in digestate. Product declaration Before the digestate is delivered to the farmers, the SP provides a report containing a full product declaration, based on all analysis through the year. The report contains information concerning the
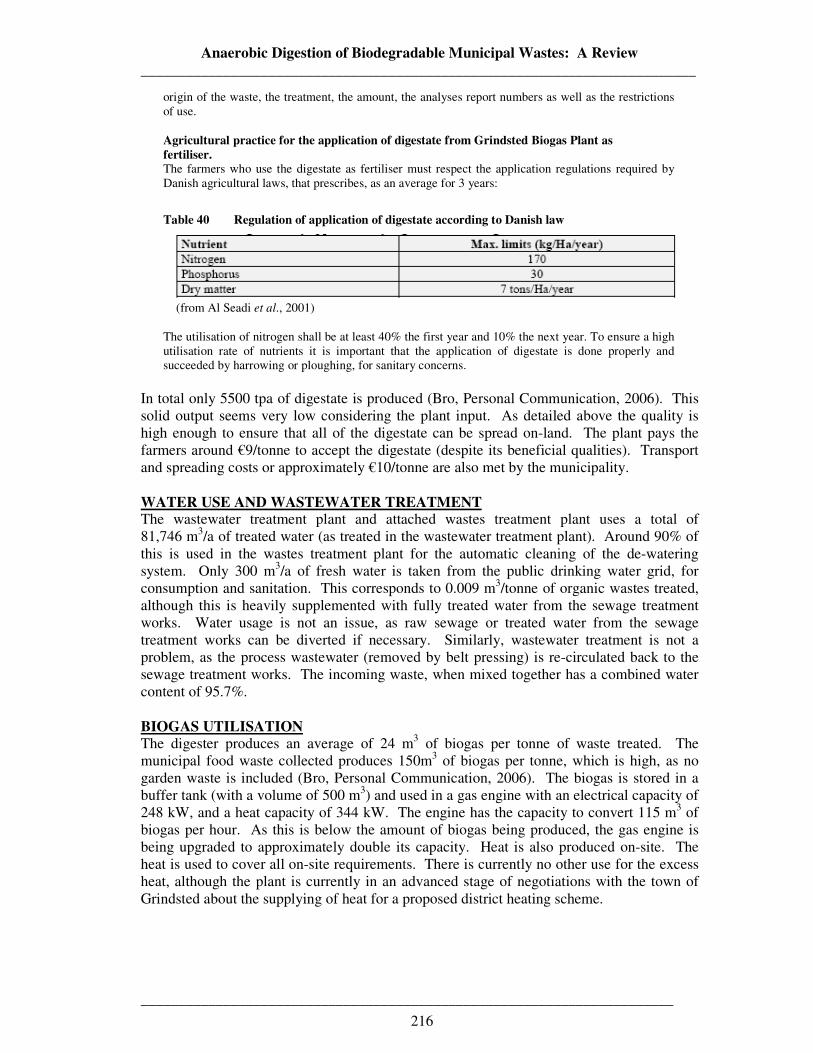
Anaerobic Digestion of Biodegradable Municipal Wastes: A Review __________________________________________________________________________
_______________________________________________________________________
216
origin of the waste, the treatment, the amount, the analyses report numbers as well as the restrictions of use. Agricultural practice for the application of digestate from Grindsted Biogas Plant as fertiliser. The farmers who use the digestate as fertiliser must respect the application regulations required by Danish agricultural laws, that prescribes, as an average for 3 years:
Table 40 Regulation of application of digestate according to Danish law
(from Al Seadi et al., 2001)
The utilisation of nitrogen shall be at least 40% the first year and 10% the next year. To ensure a high utilisation rate of nutrients it is important that the application of digestate is done properly and succeeded by harrowing or ploughing, for sanitary concerns.
In total only 5500 tpa of digestate is produced (Bro, Personal Communication, 2006). This solid output seems very low considering the plant input. As detailed above the quality is high enough to ensure that all of the digestate can be spread on-land. The plant pays the farmers around €9/tonne to accept the digestate (despite its beneficial qualities). Transport and spreading costs or approximately €10/tonne are also met by the municipality. WATER USE AND WASTEWATER TREATMENT The wastewater treatment plant and attached wastes treatment plant uses a total of 81,746 m3/a of treated water (as treated in the wastewater treatment plant). Around 90% of this is used in the wastes treatment plant for the automatic cleaning of the de-watering system. Only 300 m3/a of fresh water is taken from the public drinking water grid, for consumption and sanitation. This corresponds to 0.009 m3/tonne of organic wastes treated, although this is heavily supplemented with fully treated water from the sewage treatment works. Water usage is not an issue, as raw sewage or treated water from the sewage treatment works can be diverted if necessary. Similarly, wastewater treatment is not a problem, as the process wastewater (removed by belt pressing) is re-circulated back to the sewage treatment works. The incoming waste, when mixed together has a combined water content of 95.7%. BIOGAS UTILISATION The digester produces an average of 24 m3 of biogas per tonne of waste treated. The municipal food waste collected produces 150m3 of biogas per tonne, which is high, as no garden waste is included (Bro, Personal Communication, 2006). The biogas is stored in a buffer tank (with a volume of 500 m3) and used in a gas engine with an electrical capacity of 248 kW, and a heat capacity of 344 kW. The engine has the capacity to convert 115 m3 of biogas per hour. As this is below the amount of biogas being produced, the gas engine is being upgraded to approximately double its capacity. Heat is also produced on-site. The heat is used to cover all on-site requirements. There is currently no other use for the excess heat, although the plant is currently in an advanced stage of negotiations with the town of Grindsted about the supplying of heat for a proposed district heating scheme.
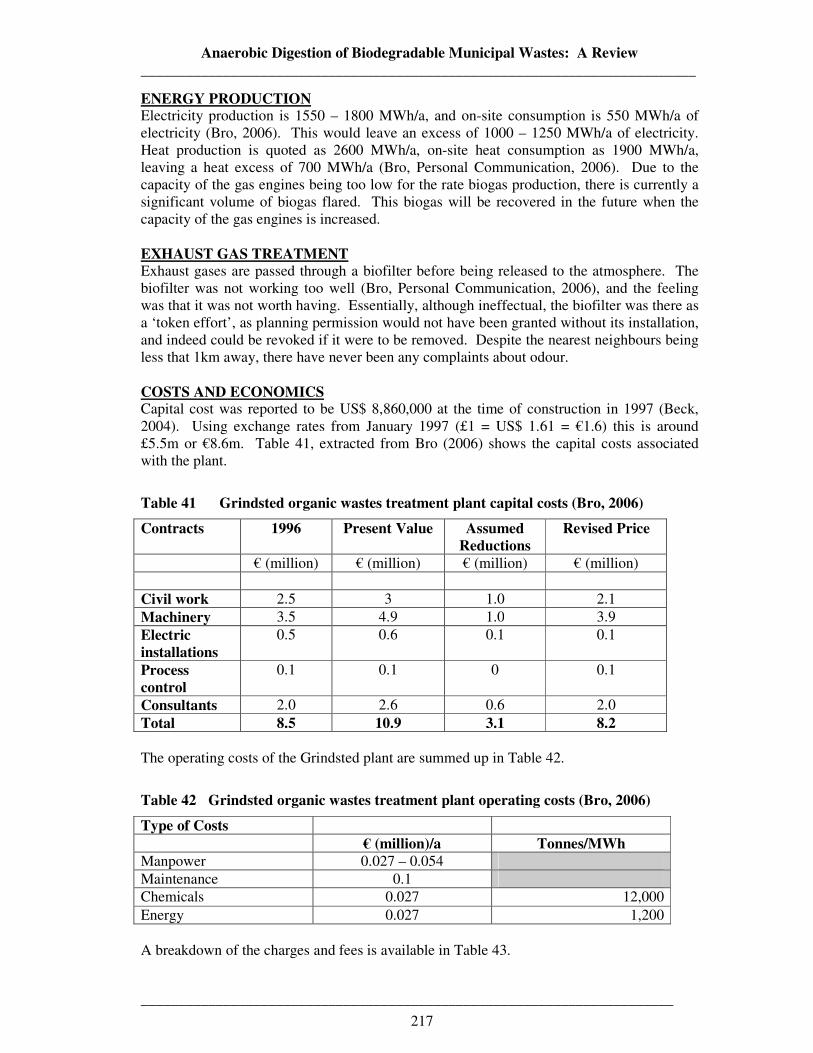
Anaerobic Digestion of Biodegradable Municipal Wastes: A Review __________________________________________________________________________
_______________________________________________________________________
217
ENERGY PRODUCTION Electricity production is 1550 – 1800 MWh/a, and on-site consumption is 550 MWh/a of electricity (Bro, 2006). This would leave an excess of 1000 – 1250 MWh/a of electricity. Heat production is quoted as 2600 MWh/a, on-site heat consumption as 1900 MWh/a, leaving a heat excess of 700 MWh/a (Bro, Personal Communication, 2006). Due to the capacity of the gas engines being too low for the rate biogas production, there is currently a significant volume of biogas flared. This biogas will be recovered in the future when the capacity of the gas engines is increased. EXHAUST GAS TREATMENT Exhaust gases are passed through a biofilter before being released to the atmosphere. The biofilter was not working too well (Bro, Personal Communication, 2006), and the feeling was that it was not worth having. Essentially, although ineffectual, the biofilter was there as a ‘token effort’, as planning permission would not have been granted without its installation, and indeed could be revoked if it were to be removed. Despite the nearest neighbours being less that 1km away, there have never been any complaints about odour. COSTS AND ECONOMICS Capital cost was reported to be US$ 8,860,000 at the time of construction in 1997 (Beck, 2004). Using exchange rates from January 1997 (£1 = US$ 1.61 = €1.6) this is around £5.5m or €8.6m. Table 41, extracted from Bro (2006) shows the capital costs associated with the plant.
Table 41 Grindsted organic wastes treatment plant capital costs (Bro, 2006)
Contracts 1996 Present Value Assumed Reductions
Revised Price
€ (million) € (million) € (million) € (million) Civil work 2.5 3 1.0 2.1 Machinery 3.5 4.9 1.0 3.9 Electric installations
0.5 0.6 0.1 0.1
Process control
0.1 0.1 0 0.1
Consultants 2.0 2.6 0.6 2.0 Total 8.5 10.9 3.1 8.2 The operating costs of the Grindsted plant are summed up in Table 42.
Table 42 Grindsted organic wastes treatment plant operating costs (Bro, 2006)
Type of Costs
€ (million)/a Tonnes/MWh Manpower 0.027 – 0.054 Maintenance 0.1 Chemicals 0.027 12,000 Energy 0.027 1,200 A breakdown of the charges and fees is available in Table 43.
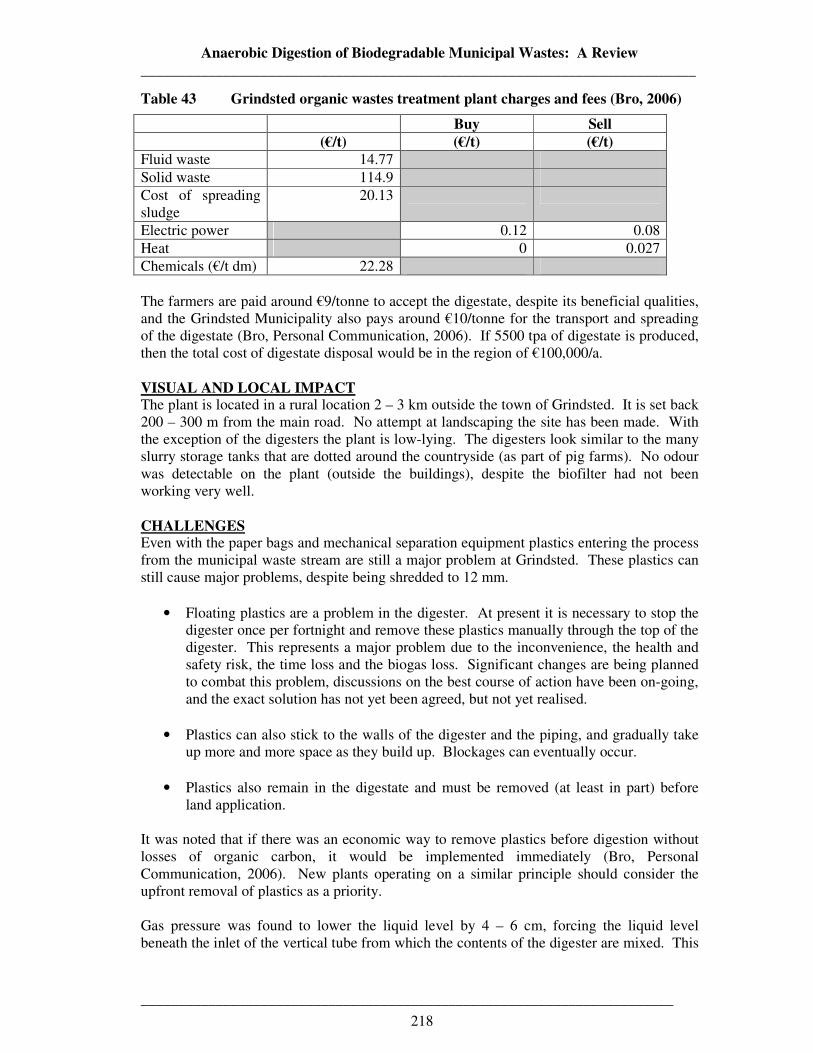
Anaerobic Digestion of Biodegradable Municipal Wastes: A Review __________________________________________________________________________
_______________________________________________________________________
218
Table 43 Grindsted organic wastes treatment plant charges and fees (Bro, 2006)
Buy Sell (€/t) (€/t) (€/t) Fluid waste 14.77 Solid waste 114.9 Cost of spreading sludge
20.13
Electric power 0.12 0.08 Heat 0 0.027 Chemicals (€/t dm) 22.28 The farmers are paid around €9/tonne to accept the digestate, despite its beneficial qualities, and the Grindsted Municipality also pays around €10/tonne for the transport and spreading of the digestate (Bro, Personal Communication, 2006). If 5500 tpa of digestate is produced, then the total cost of digestate disposal would be in the region of €100,000/a. VISUAL AND LOCAL IMPACT The plant is located in a rural location 2 – 3 km outside the town of Grindsted. It is set back 200 – 300 m from the main road. No attempt at landscaping the site has been made. With the exception of the digesters the plant is low-lying. The digesters look similar to the many slurry storage tanks that are dotted around the countryside (as part of pig farms). No odour was detectable on the plant (outside the buildings), despite the biofilter had not been working very well. CHALLENGES Even with the paper bags and mechanical separation equipment plastics entering the process from the municipal waste stream are still a major problem at Grindsted. These plastics can still cause major problems, despite being shredded to 12 mm.
• Floating plastics are a problem in the digester. At present it is necessary to stop the digester once per fortnight and remove these plastics manually through the top of the digester. This represents a major problem due to the inconvenience, the health and safety risk, the time loss and the biogas loss. Significant changes are being planned to combat this problem, discussions on the best course of action have been on-going, and the exact solution has not yet been agreed, but not yet realised.
• Plastics can also stick to the walls of the digester and the piping, and gradually take
up more and more space as they build up. Blockages can eventually occur.
• Plastics also remain in the digestate and must be removed (at least in part) before land application.
It was noted that if there was an economic way to remove plastics before digestion without losses of organic carbon, it would be implemented immediately (Bro, Personal Communication, 2006). New plants operating on a similar principle should consider the upfront removal of plastics as a priority. Gas pressure was found to lower the liquid level by 4 – 6 cm, forcing the liquid level beneath the inlet of the vertical tube from which the contents of the digester are mixed. This

Anaerobic Digestion of Biodegradable Municipal Wastes: A Review __________________________________________________________________________
_______________________________________________________________________
219
had the result of stopping the digester mixing, and lowering conversion efficiency and gas yield. Problems were experienced with the pumps originally bought to pump waste between the hygienisation stage and the heat exchangers. The waste stream at 70oC was too aggressive for the original pumps which contained rubber seals. These rubber seals were worn out and needed replaced every 14 days or so. These pumps were replaced with more heavy duty self-priming centrifugal pumps (supplied by Gorman Rupp Co., USA), which have operated for 5 years without problems. The engineering of the pipework had to be adapted to eliminate gas pockets and sedimentation, both of which led to blockages or non-pumping. The pipework now includes a high pressure ‘blockbuster’ facility, to flush out any blockages. The original heat exchanger was recently replaced with a newer heat exchanger, based on ‘co-axial’ design. The new heat exchanger was found to be much more efficient, as well as considerably smaller and cheaper. A slight adaptation to the plant layout is being planned. A second industrial wastes reception tank will be installed, next to the first. The idea behind having two industrial wastes reception tanks is that higher energy wastes will be stored in one, and lower energy wastes in the other. This will give the plant operators a greater control of the feed mixture going into the reactor. This could be used to manipulate the organic (and nutrient) loading rates, to increase, decrease or regulate the rate of biogas production. This would definitely be a worthwhile feature to include in the design from the start, were a similar process is to be built. DISCUSSION AND CONCLUSIONS Aside from the problems described above, that were dealt with as they arose, the plant has been successfully digesting organic wastes for over 9 years. A few points noted during the site visit are:
• There is always more and more incoming waste. It is always wise to build at a capacity significantly larger than you require, so as to accommodate this extra waste. Grindsted plant is currently in the process of upgrading its gas engines to increase the capacity.
• Even in a society with well developed source separation procedures, and a
population experienced in the source separation of wastes, contaminants still enter the kitchen waste stream. Contaminants that have caused problems at Grindsted in the past include axe-heads and hammer-heads which damage the pulper or jam the shredder, and plastic contaminants. A ferro-separator has been added between the two shredder stages to remove ferrous metals. The plastic contaminants present a major ongoing problem. The lack of upfront mechanical separation at the Grindsted plant means that these contaminants are shredded and pass through to the digester system, where they accumulate. The reactor design was not originally meant to cope with these plastics, and the reactor needs to be stopped and opened up approximately fortnightly to remove them. This stoppage represents a major loss in time and biogas, and an effective solution must be found, and is a current priority for the Grindsted engineering and management teams.
Anaerobic Digestion of Biodegradable Municipal Wastes: A Review __________________________________________________________________________
_______________________________________________________________________
220
The management and engineering team at Grindsted have solved many problems, and have many ideas about how the plant could be further improved and optimised. They have learned many lessons first hand and are keen to become involved in the design and construction of other similar ‘second generation’ plants, based on the same concept (Bro, 2006). The adaptation or upgrading of sewage sludge digesters to treat BMW and other organic wastes is a possibility that should be considered in the UK. Processes such as that at Grindsted should be studied in detail to learn from positive and negative experiences. Even after 9 years of operation the Grindsted digester and process is still evolving, and lessons are still being learned.
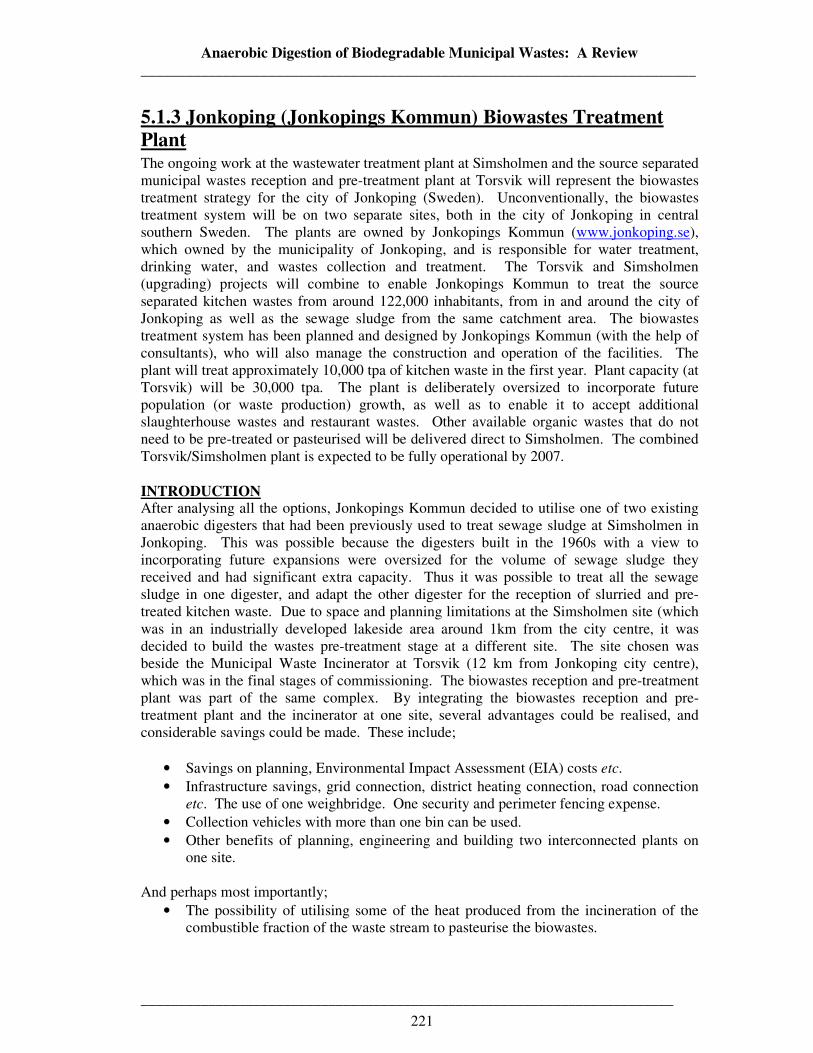
Anaerobic Digestion of Biodegradable Municipal Wastes: A Review __________________________________________________________________________
_______________________________________________________________________
221
5.1.3 Jonkoping (Jonkopings Kommun) Biowastes Treatment Plant The ongoing work at the wastewater treatment plant at Simsholmen and the source separated municipal wastes reception and pre-treatment plant at Torsvik will represent the biowastes treatment strategy for the city of Jonkoping (Sweden). Unconventionally, the biowastes treatment system will be on two separate sites, both in the city of Jonkoping in central southern Sweden. The plants are owned by Jonkopings Kommun (www.jonkoping.se), which owned by the municipality of Jonkoping, and is responsible for water treatment, drinking water, and wastes collection and treatment. The Torsvik and Simsholmen (upgrading) projects will combine to enable Jonkopings Kommun to treat the source separated kitchen wastes from around 122,000 inhabitants, from in and around the city of Jonkoping as well as the sewage sludge from the same catchment area. The biowastes treatment system has been planned and designed by Jonkopings Kommun (with the help of consultants), who will also manage the construction and operation of the facilities. The plant will treat approximately 10,000 tpa of kitchen waste in the first year. Plant capacity (at Torsvik) will be 30,000 tpa. The plant is deliberately oversized to incorporate future population (or waste production) growth, as well as to enable it to accept additional slaughterhouse wastes and restaurant wastes. Other available organic wastes that do not need to be pre-treated or pasteurised will be delivered direct to Simsholmen. The combined Torsvik/Simsholmen plant is expected to be fully operational by 2007. INTRODUCTION After analysing all the options, Jonkopings Kommun decided to utilise one of two existing anaerobic digesters that had been previously used to treat sewage sludge at Simsholmen in Jonkoping. This was possible because the digesters built in the 1960s with a view to incorporating future expansions were oversized for the volume of sewage sludge they received and had significant extra capacity. Thus it was possible to treat all the sewage sludge in one digester, and adapt the other digester for the reception of slurried and pre-treated kitchen waste. Due to space and planning limitations at the Simsholmen site (which was in an industrially developed lakeside area around 1km from the city centre, it was decided to build the wastes pre-treatment stage at a different site. The site chosen was beside the Municipal Waste Incinerator at Torsvik (12 km from Jonkoping city centre), which was in the final stages of commissioning. The biowastes reception and pre-treatment plant was part of the same complex. By integrating the biowastes reception and pre-treatment plant and the incinerator at one site, several advantages could be realised, and considerable savings could be made. These include;
• Savings on planning, Environmental Impact Assessment (EIA) costs etc. • Infrastructure savings, grid connection, district heating connection, road connection
etc. The use of one weighbridge. One security and perimeter fencing expense. • Collection vehicles with more than one bin can be used. • Other benefits of planning, engineering and building two interconnected plants on
one site. And perhaps most importantly;
• The possibility of utilising some of the heat produced from the incineration of the combustible fraction of the waste stream to pasteurise the biowastes.
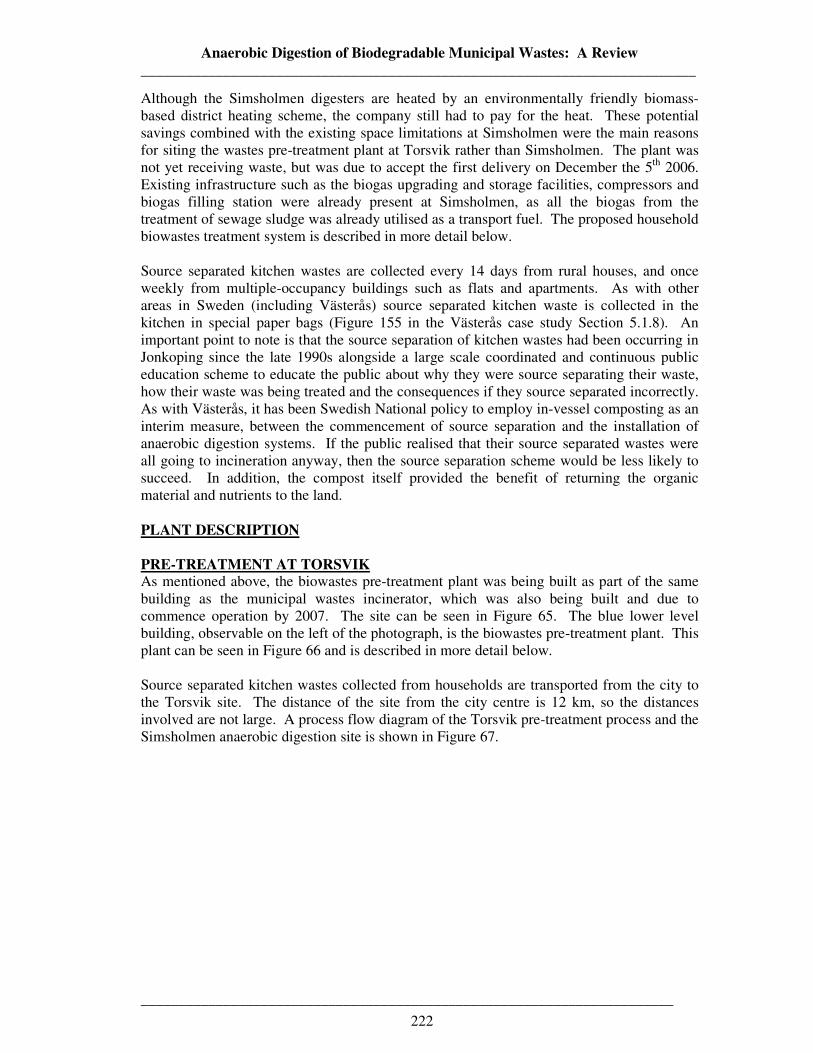
Anaerobic Digestion of Biodegradable Municipal Wastes: A Review __________________________________________________________________________
_______________________________________________________________________
222
Although the Simsholmen digesters are heated by an environmentally friendly biomass-based district heating scheme, the company still had to pay for the heat. These potential savings combined with the existing space limitations at Simsholmen were the main reasons for siting the wastes pre-treatment plant at Torsvik rather than Simsholmen. The plant was not yet receiving waste, but was due to accept the first delivery on December the 5th 2006. Existing infrastructure such as the biogas upgrading and storage facilities, compressors and biogas filling station were already present at Simsholmen, as all the biogas from the treatment of sewage sludge was already utilised as a transport fuel. The proposed household biowastes treatment system is described in more detail below. Source separated kitchen wastes are collected every 14 days from rural houses, and once weekly from multiple-occupancy buildings such as flats and apartments. As with other areas in Sweden (including Västerås) source separated kitchen waste is collected in the kitchen in special paper bags (Figure 155 in the Västerås case study Section 5.1.8). An important point to note is that the source separation of kitchen wastes had been occurring in Jonkoping since the late 1990s alongside a large scale coordinated and continuous public education scheme to educate the public about why they were source separating their waste, how their waste was being treated and the consequences if they source separated incorrectly. As with Västerås, it has been Swedish National policy to employ in-vessel composting as an interim measure, between the commencement of source separation and the installation of anaerobic digestion systems. If the public realised that their source separated wastes were all going to incineration anyway, then the source separation scheme would be less likely to succeed. In addition, the compost itself provided the benefit of returning the organic material and nutrients to the land. PLANT DESCRIPTION PRE-TREATMENT AT TORSVIK As mentioned above, the biowastes pre-treatment plant was being built as part of the same building as the municipal wastes incinerator, which was also being built and due to commence operation by 2007. The site can be seen in Figure 65. The blue lower level building, observable on the left of the photograph, is the biowastes pre-treatment plant. This plant can be seen in Figure 66 and is described in more detail below. Source separated kitchen wastes collected from households are transported from the city to the Torsvik site. The distance of the site from the city centre is 12 km, so the distances involved are not large. A process flow diagram of the Torsvik pre-treatment process and the Simsholmen anaerobic digestion site is shown in Figure 67.
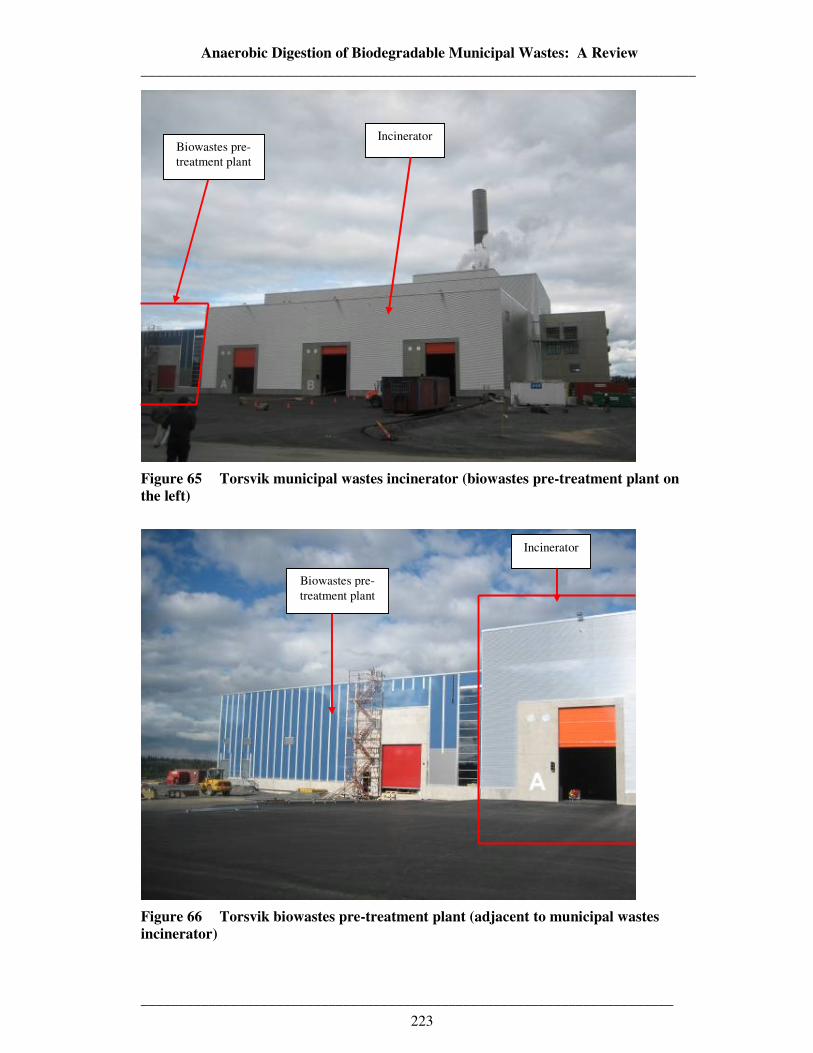
Anaerobic Digestion of Biodegradable Municipal Wastes: A Review __________________________________________________________________________
_______________________________________________________________________
223
Figure 65 Torsvik municipal wastes incinerator (biowastes pre-treatment plant on the left)
Figure 66 Torsvik biowastes pre-treatment plant (adjacent to municipal wastes incinerator)
Incinerator Biowastes pre-treatment plant
Biowastes pre-treatment plant
Incinerator
Anaerobic Digestion of Biodegradable Municipal Wastes: A Review __________________________________________________________________________
_______________________________________________________________________
224
Figure 67 Torsvik organic household wastes pre-treatment plant process flow diagram
Key Swedish English Biogasanlaggning Organiskt Avfall Biowaste Treatment System Vattern Water ARV Simsholmen Simsholmen Sewage Treatment Works Fordonsagas Transport fuel Mottagings Tank Wastes Reception Tank Rotkammare Anaerobic Digestion Avvattning Post AD treatment Rotrest Digestate Hygieniserad Slurry Hygienised Slurry Forbehandlingsanlaggning Torsvik Torsvik Pre-treatment Plant Sonderdelning Pre-treatment Blandnings-och Sedimenteringsficka Homogenisation and sedimentation tank Tipficka Wastes reception tank Org Avfall Biowaste Buffertank med hygienisering Buffertank with hygienisation Spadvattentank Process water storage tank Varme Heat Rejekt Rejects Forbranningsanlaggning Incineration
Upon delivery the biowastes are dumped straight into a reception pit (volume 50 m3), where they will be mixed with hot water/steam. Preliminary testing has shown that the pH of the arriving household wastes will be 4.0 – 4.5, so the reception tank shown in Figure 68 is manufactured from steel (specification SS 23 43) rather than concrete. This low pH is elevated by mixing with slaughterhouse wastes and dilution by steam. Material is moved from the reception tank to the milling stage by screw-pumps in the floor of the tank.
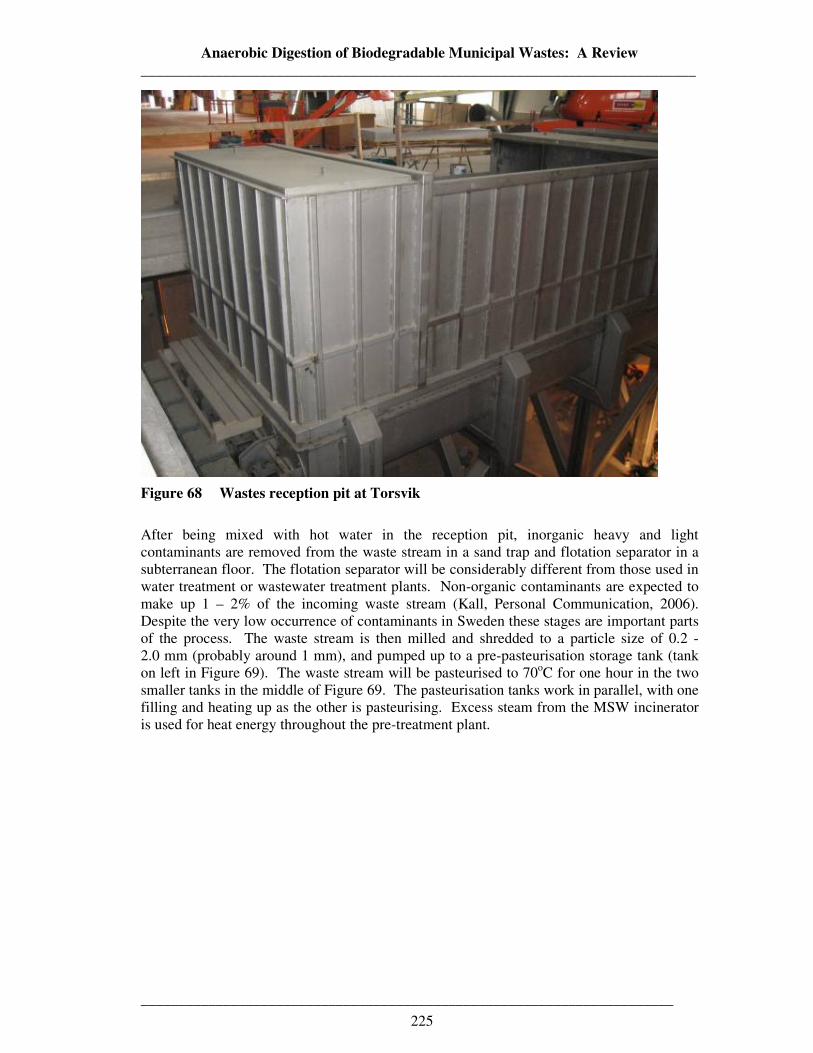
Anaerobic Digestion of Biodegradable Municipal Wastes: A Review __________________________________________________________________________
_______________________________________________________________________
225
Figure 68 Wastes reception pit at Torsvik
After being mixed with hot water in the reception pit, inorganic heavy and light contaminants are removed from the waste stream in a sand trap and flotation separator in a subterranean floor. The flotation separator will be considerably different from those used in water treatment or wastewater treatment plants. Non-organic contaminants are expected to make up 1 – 2% of the incoming waste stream (Kall, Personal Communication, 2006). Despite the very low occurrence of contaminants in Sweden these stages are important parts of the process. The waste stream is then milled and shredded to a particle size of 0.2 - 2.0 mm (probably around 1 mm), and pumped up to a pre-pasteurisation storage tank (tank on left in Figure 69). The waste stream will be pasteurised to 70oC for one hour in the two smaller tanks in the middle of Figure 69. The pasteurisation tanks work in parallel, with one filling and heating up as the other is pasteurising. Excess steam from the MSW incinerator is used for heat energy throughout the pre-treatment plant.
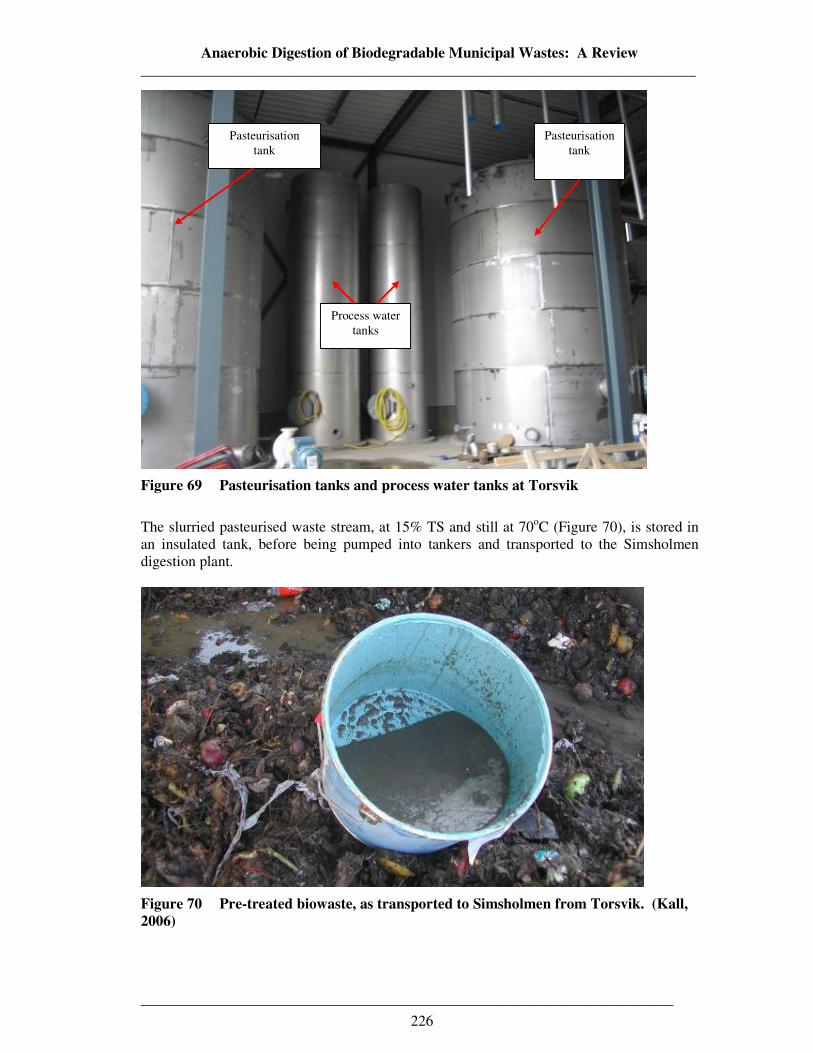
Anaerobic Digestion of Biodegradable Municipal Wastes: A Review __________________________________________________________________________
_______________________________________________________________________
226
Figure 69 Pasteurisation tanks and process water tanks at Torsvik
The slurried pasteurised waste stream, at 15% TS and still at 70oC (Figure 70), is stored in an insulated tank, before being pumped into tankers and transported to the Simsholmen digestion plant.
Figure 70 Pre-treated biowaste, as transported to Simsholmen from Torsvik. (Kall, 2006)
Pasteurisation tank
Pasteurisation tank
Process water tanks

Anaerobic Digestion of Biodegradable Municipal Wastes: A Review __________________________________________________________________________
_______________________________________________________________________
227
SIMSHOLMEN On arriving at Simsholmen, the waste (still hot, cooling from 70oC from the pasteurisation stage) will be emptied from the tankers into a reception tank with a planned volume of 170m3. As the waste is still hot from pasteurisation, this energy can be used to contribute to the heat requirements of the digester. In the reception tank the slurried waste arriving from Torsvik will be mixed with other industrial organic wastes that do not need to be pre-treated or pasteurised (such as dairy industry wastes). ANAEROBIC DIGESTION STAGE The anaerobic digesters (Figure 71) were originally built in the 1965 for sewage sludge treatment. Each digester has a volume of 3000 m3. Between the digesters is a building containing all pumping equipment and instrumentation, a control room and a small laboratory which is used to analyse off line samples from the wastewater treatment process.
Figure 71 Anaerobic digesters at Simsholmen
To incorporate the new biowaste stream whilst retaining current function as a sewage sludge treatment plant, one digester will be retained for the treatment of sewage sludge, and the other adapted to treat the incoming biowastes from Torsvik. Modifications will include the addition of a reception buffer tank at the front of the plant, to receive incoming pre-treated waste arriving from Torsvik and the fitting of a mechanical stirrer inside the reactor. Mixing will also be aided by biogas fluxing from the bottom of the reactor. This extra mixing will be necessary as the waste stream will enter the reactor at 15% TS, much higher than the total solids content in the sewage sludge digester (which is 3.5 – 4%). Reactor temperature will be maintained at 37oC by the heat of the incoming pasteurised biowaste, and by the local district heating scheme (itself powered by biomass from forestry). Biogas production is expected to be around 70 – 100 m3/tonne of incoming biowaste, which corresponds to
Existing sewage sludge anaerobic digesters at Simsholmen
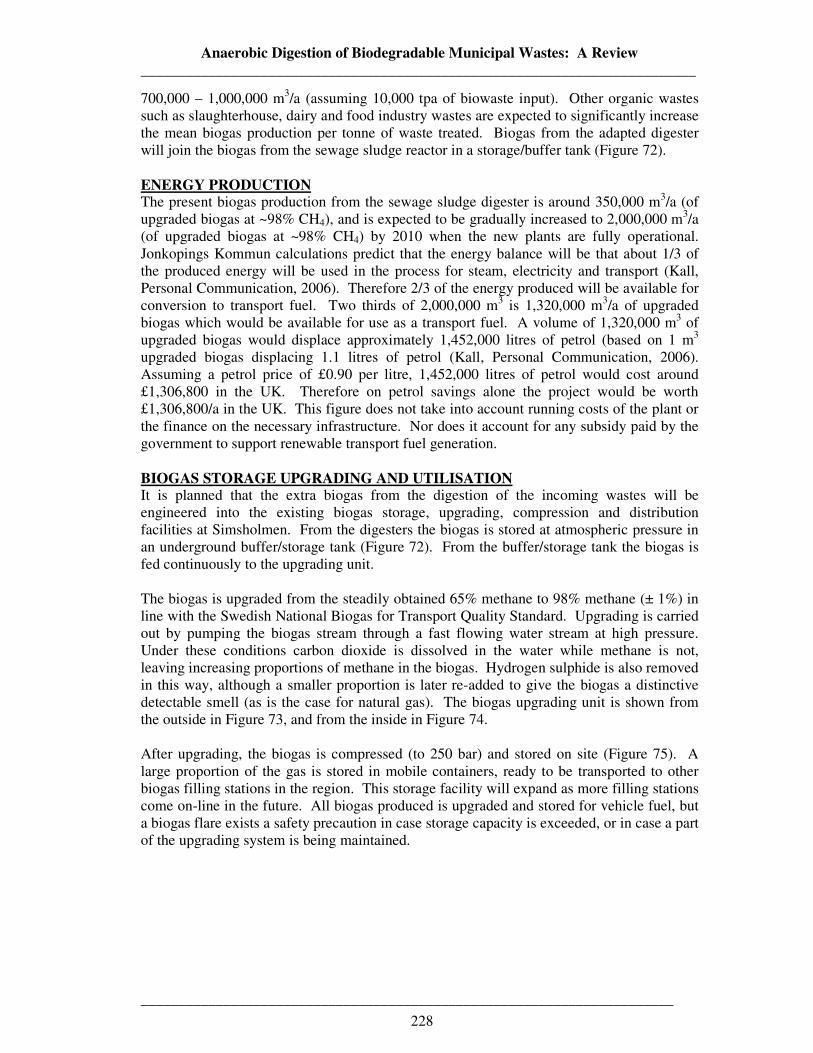
Anaerobic Digestion of Biodegradable Municipal Wastes: A Review __________________________________________________________________________
_______________________________________________________________________
228
700,000 – 1,000,000 m3/a (assuming 10,000 tpa of biowaste input). Other organic wastes such as slaughterhouse, dairy and food industry wastes are expected to significantly increase the mean biogas production per tonne of waste treated. Biogas from the adapted digester will join the biogas from the sewage sludge reactor in a storage/buffer tank (Figure 72). ENERGY PRODUCTION The present biogas production from the sewage sludge digester is around 350,000 m3/a (of upgraded biogas at ~98% CH4), and is expected to be gradually increased to 2,000,000 m3/a (of upgraded biogas at ~98% CH4) by 2010 when the new plants are fully operational. Jonkopings Kommun calculations predict that the energy balance will be that about 1/3 of the produced energy will be used in the process for steam, electricity and transport (Kall, Personal Communication, 2006). Therefore 2/3 of the energy produced will be available for conversion to transport fuel. Two thirds of 2,000,000 m3 is 1,320,000 m3/a of upgraded biogas which would be available for use as a transport fuel. A volume of 1,320,000 m3 of upgraded biogas would displace approximately 1,452,000 litres of petrol (based on 1 m3 upgraded biogas displacing 1.1 litres of petrol (Kall, Personal Communication, 2006). Assuming a petrol price of £0.90 per litre, 1,452,000 litres of petrol would cost around £1,306,800 in the UK. Therefore on petrol savings alone the project would be worth £1,306,800/a in the UK. This figure does not take into account running costs of the plant or the finance on the necessary infrastructure. Nor does it account for any subsidy paid by the government to support renewable transport fuel generation. BIOGAS STORAGE UPGRADING AND UTILISATION It is planned that the extra biogas from the digestion of the incoming wastes will be engineered into the existing biogas storage, upgrading, compression and distribution facilities at Simsholmen. From the digesters the biogas is stored at atmospheric pressure in an underground buffer/storage tank (Figure 72). From the buffer/storage tank the biogas is fed continuously to the upgrading unit. The biogas is upgraded from the steadily obtained 65% methane to 98% methane (± 1%) in line with the Swedish National Biogas for Transport Quality Standard. Upgrading is carried out by pumping the biogas stream through a fast flowing water stream at high pressure. Under these conditions carbon dioxide is dissolved in the water while methane is not, leaving increasing proportions of methane in the biogas. Hydrogen sulphide is also removed in this way, although a smaller proportion is later re-added to give the biogas a distinctive detectable smell (as is the case for natural gas). The biogas upgrading unit is shown from the outside in Figure 73, and from the inside in Figure 74. After upgrading, the biogas is compressed (to 250 bar) and stored on site (Figure 75). A large proportion of the gas is stored in mobile containers, ready to be transported to other biogas filling stations in the region. This storage facility will expand as more filling stations come on-line in the future. All biogas produced is upgraded and stored for vehicle fuel, but a biogas flare exists a safety precaution in case storage capacity is exceeded, or in case a part of the upgrading system is being maintained.
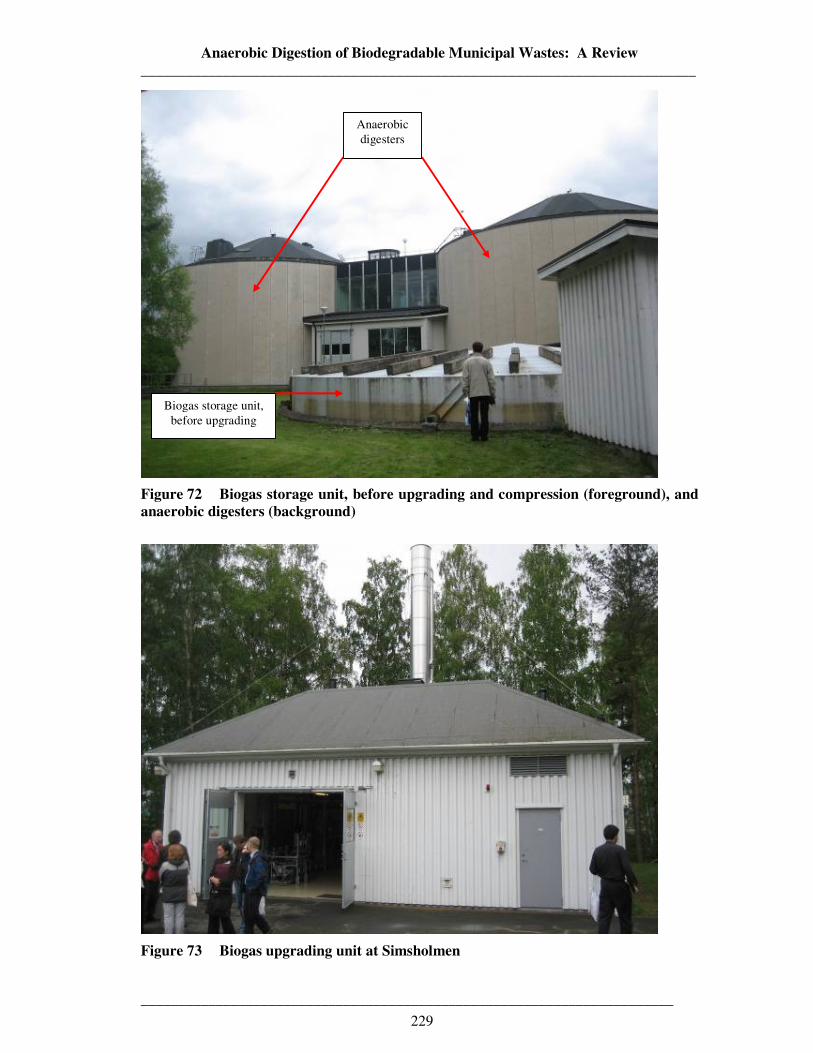
Anaerobic Digestion of Biodegradable Municipal Wastes: A Review __________________________________________________________________________
_______________________________________________________________________
229
Figure 72 Biogas storage unit, before upgrading and compression (foreground), and anaerobic digesters (background)
Figure 73 Biogas upgrading unit at Simsholmen
Anaerobic digesters
Biogas storage unit, before upgrading
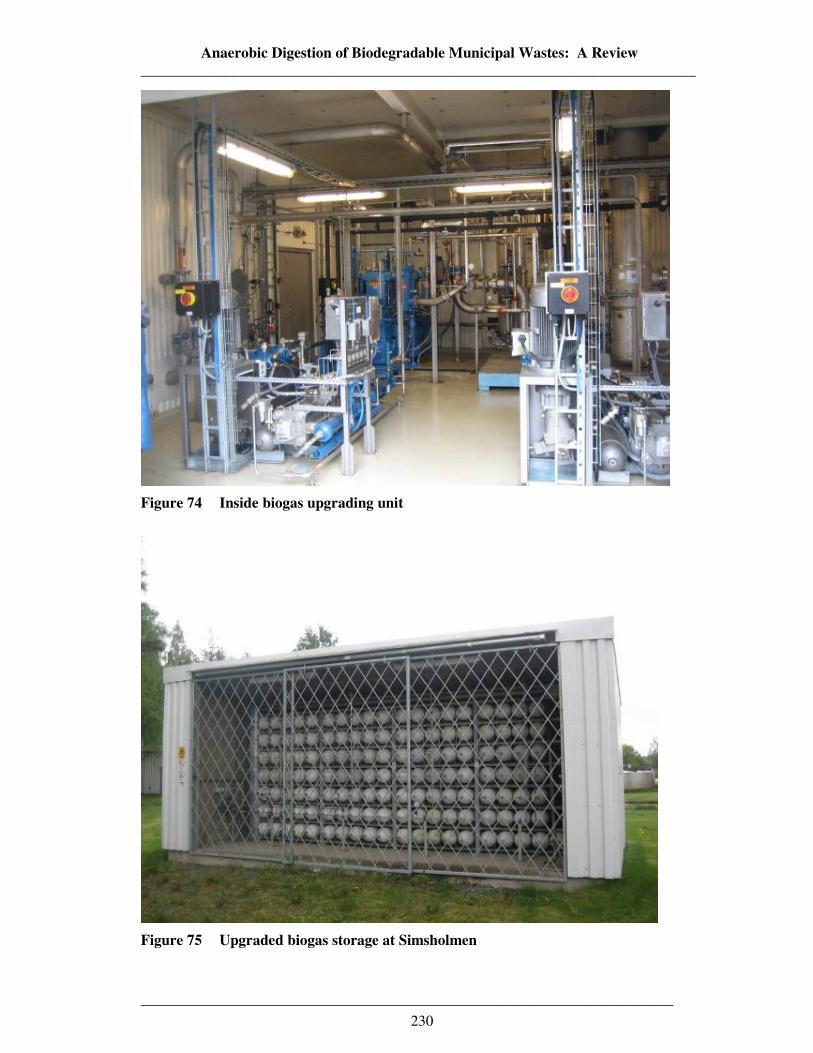
Anaerobic Digestion of Biodegradable Municipal Wastes: A Review __________________________________________________________________________
_______________________________________________________________________
230
Figure 74 Inside biogas upgrading unit
Figure 75 Upgraded biogas storage at Simsholmen

Anaerobic Digestion of Biodegradable Municipal Wastes: A Review __________________________________________________________________________
_______________________________________________________________________
231
BIOGAS UTILISATION The compressed biogas is currently used to fuel two of Jonkoping Kommun’s eight waste collection vehicles. The remaining six diesel trucks will be replaced with biogas vehicles at the end of their working lives. Similar plans exist for the tankers used to transport the slurried biowaste from Torsvik to Simsholmen. At present 50% of Jonkopings Kommun’s company car fleet is run on biogas. There is also a public biogas filling station beside the sewage treatment works at Simsholmen (Figure 76 and Figure 77).
Figure 76 Public biogas filling station at Simsholmen (1)
Biogas is sold for 7.2 SEK/m3 (£0.53/m3 on 27/07/06). This is 30 - 40% cheaper than the petrol equivalent in terms of mileage. The Swedish efforts to integrate renewable energy into their transport system as part of their goal to be independent from oil by 2020 is described in more detail in Section 2.6.1.8.2.
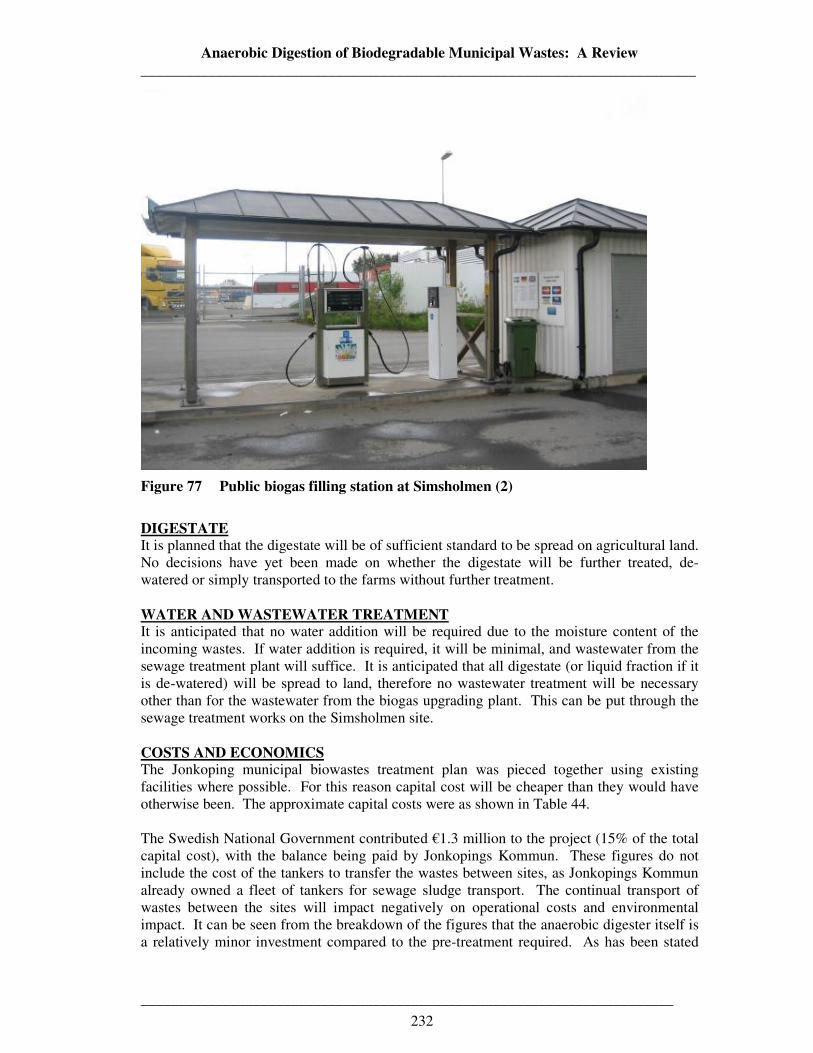
Anaerobic Digestion of Biodegradable Municipal Wastes: A Review __________________________________________________________________________
_______________________________________________________________________
232
Figure 77 Public biogas filling station at Simsholmen (2)
DIGESTATE It is planned that the digestate will be of sufficient standard to be spread on agricultural land. No decisions have yet been made on whether the digestate will be further treated, de-watered or simply transported to the farms without further treatment. WATER AND WASTEWATER TREATMENT It is anticipated that no water addition will be required due to the moisture content of the incoming wastes. If water addition is required, it will be minimal, and wastewater from the sewage treatment plant will suffice. It is anticipated that all digestate (or liquid fraction if it is de-watered) will be spread to land, therefore no wastewater treatment will be necessary other than for the wastewater from the biogas upgrading plant. This can be put through the sewage treatment works on the Simsholmen site. COSTS AND ECONOMICS The Jonkoping municipal biowastes treatment plan was pieced together using existing facilities where possible. For this reason capital cost will be cheaper than they would have otherwise been. The approximate capital costs were as shown in Table 44. The Swedish National Government contributed €1.3 million to the project (15% of the total capital cost), with the balance being paid by Jonkopings Kommun. These figures do not include the cost of the tankers to transfer the wastes between sites, as Jonkopings Kommun already owned a fleet of tankers for sewage sludge transport. The continual transport of wastes between the sites will impact negatively on operational costs and environmental impact. It can be seen from the breakdown of the figures that the anaerobic digester itself is a relatively minor investment compared to the pre-treatment required. As has been stated
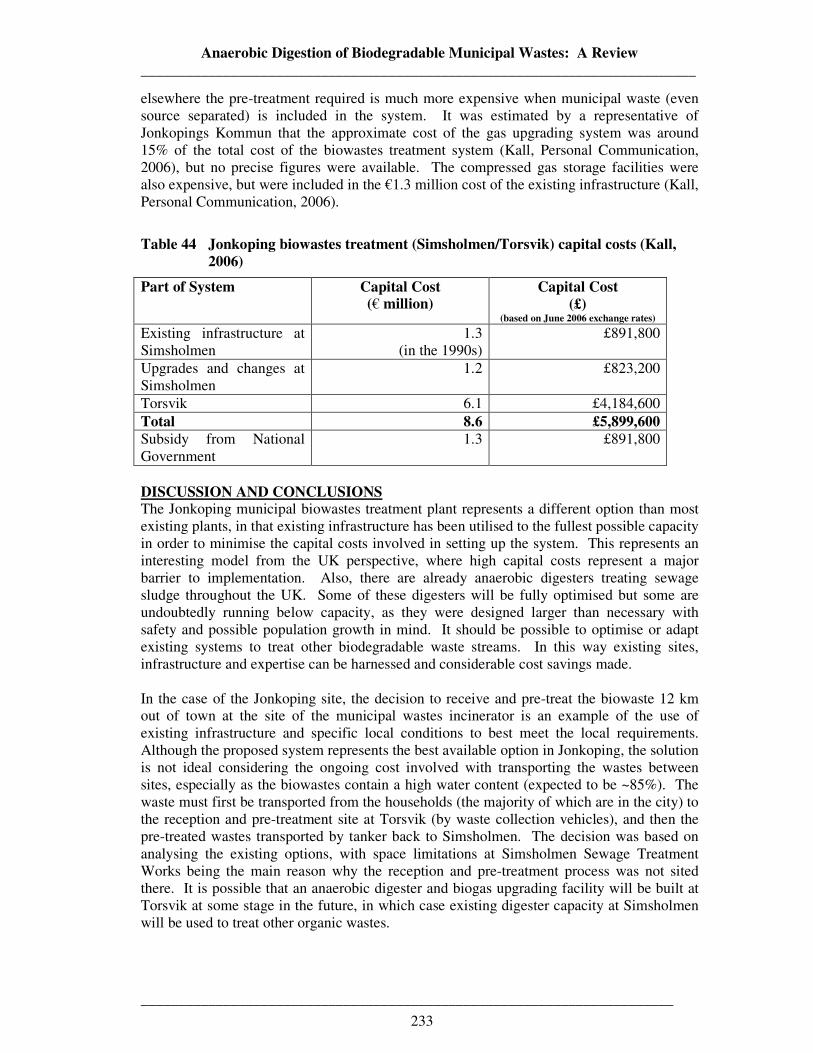
Anaerobic Digestion of Biodegradable Municipal Wastes: A Review __________________________________________________________________________
_______________________________________________________________________
233
elsewhere the pre-treatment required is much more expensive when municipal waste (even source separated) is included in the system. It was estimated by a representative of Jonkopings Kommun that the approximate cost of the gas upgrading system was around 15% of the total cost of the biowastes treatment system (Kall, Personal Communication, 2006), but no precise figures were available. The compressed gas storage facilities were also expensive, but were included in the €1.3 million cost of the existing infrastructure (Kall, Personal Communication, 2006).
Table 44 Jonkoping biowastes treatment (Simsholmen/Torsvik) capital costs (Kall, 2006)
Part of System Capital Cost (€ million)
Capital Cost (£)
(based on June 2006 exchange rates)
Existing infrastructure at Simsholmen
1.3 (in the 1990s)
£891,800
Upgrades and changes at Simsholmen
1.2 £823,200
Torsvik 6.1 £4,184,600 Total 8.6 £5,899,600 Subsidy from National Government
1.3 £891,800
DISCUSSION AND CONCLUSIONS The Jonkoping municipal biowastes treatment plant represents a different option than most existing plants, in that existing infrastructure has been utilised to the fullest possible capacity in order to minimise the capital costs involved in setting up the system. This represents an interesting model from the UK perspective, where high capital costs represent a major barrier to implementation. Also, there are already anaerobic digesters treating sewage sludge throughout the UK. Some of these digesters will be fully optimised but some are undoubtedly running below capacity, as they were designed larger than necessary with safety and possible population growth in mind. It should be possible to optimise or adapt existing systems to treat other biodegradable waste streams. In this way existing sites, infrastructure and expertise can be harnessed and considerable cost savings made. In the case of the Jonkoping site, the decision to receive and pre-treat the biowaste 12 km out of town at the site of the municipal wastes incinerator is an example of the use of existing infrastructure and specific local conditions to best meet the local requirements. Although the proposed system represents the best available option in Jonkoping, the solution is not ideal considering the ongoing cost involved with transporting the wastes between sites, especially as the biowastes contain a high water content (expected to be ~85%). The waste must first be transported from the households (the majority of which are in the city) to the reception and pre-treatment site at Torsvik (by waste collection vehicles), and then the pre-treated wastes transported by tanker back to Simsholmen. The decision was based on analysing the existing options, with space limitations at Simsholmen Sewage Treatment Works being the main reason why the reception and pre-treatment process was not sited there. It is possible that an anaerobic digester and biogas upgrading facility will be built at Torsvik at some stage in the future, in which case existing digester capacity at Simsholmen will be used to treat other organic wastes.
Anaerobic Digestion of Biodegradable Municipal Wastes: A Review __________________________________________________________________________
_______________________________________________________________________
234
Jonkopings Kommun are planning, designing and managing the upgrading of their digesters themselves, and no further details were available. The pre-treatment site at Torsvik was also designed and constructed in-house by Jonkopings Kommun (or at least managed, with specific tasks sub-contracted). As the plant was due to accept its first delivery of waste in December 2006, and therefore was not yet operational, no further comments can be made on the mass or energy balances of the system, or its operational reliability. Jonkopings Kommun had made every effort in terms facilitating the smooth start up of the process, nevertheless, it is expected that (as with all new plants) teething problems will be thrown up in the first month or two of operation.
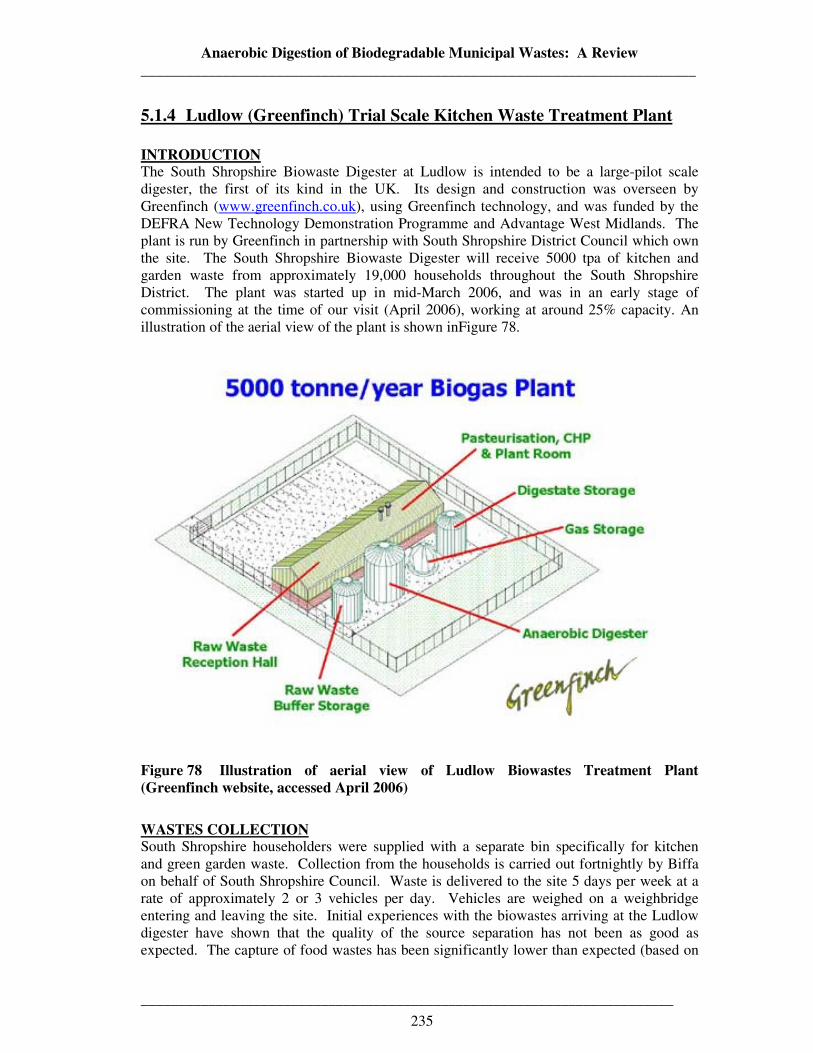
Anaerobic Digestion of Biodegradable Municipal Wastes: A Review __________________________________________________________________________
_______________________________________________________________________
235
5.1.4 Ludlow (Greenfinch) Trial Scale Kitchen Waste Treatment Plant INTRODUCTION The South Shropshire Biowaste Digester at Ludlow is intended to be a large-pilot scale digester, the first of its kind in the UK. Its design and construction was overseen by Greenfinch (www.greenfinch.co.uk), using Greenfinch technology, and was funded by the DEFRA New Technology Demonstration Programme and Advantage West Midlands. The plant is run by Greenfinch in partnership with South Shropshire District Council which own the site. The South Shropshire Biowaste Digester will receive 5000 tpa of kitchen and garden waste from approximately 19,000 households throughout the South Shropshire District. The plant was started up in mid-March 2006, and was in an early stage of commissioning at the time of our visit (April 2006), working at around 25% capacity. An illustration of the aerial view of the plant is shown inFigure 78.
Figure 78 Illustration of aerial view of Ludlow Biowastes Treatment Plant (Greenfinch website, accessed April 2006)
WASTES COLLECTION South Shropshire householders were supplied with a separate bin specifically for kitchen and green garden waste. Collection from the households is carried out fortnightly by Biffa on behalf of South Shropshire Council. Waste is delivered to the site 5 days per week at a rate of approximately 2 or 3 vehicles per day. Vehicles are weighed on a weighbridge entering and leaving the site. Initial experiences with the biowastes arriving at the Ludlow digester have shown that the quality of the source separation has not been as good as expected. The capture of food wastes has been significantly lower than expected (based on
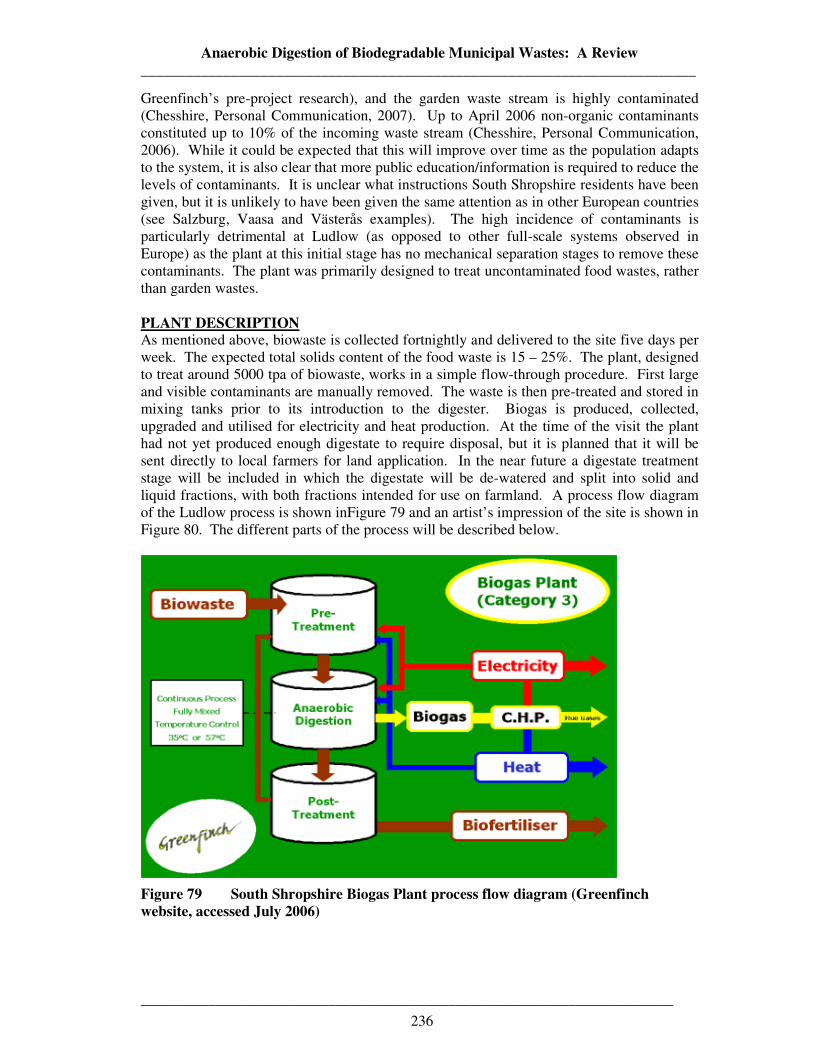
Anaerobic Digestion of Biodegradable Municipal Wastes: A Review __________________________________________________________________________
_______________________________________________________________________
236
Greenfinch’s pre-project research), and the garden waste stream is highly contaminated (Chesshire, Personal Communication, 2007). Up to April 2006 non-organic contaminants constituted up to 10% of the incoming waste stream (Chesshire, Personal Communication, 2006). While it could be expected that this will improve over time as the population adapts to the system, it is also clear that more public education/information is required to reduce the levels of contaminants. It is unclear what instructions South Shropshire residents have been given, but it is unlikely to have been given the same attention as in other European countries (see Salzburg, Vaasa and Västerås examples). The high incidence of contaminants is particularly detrimental at Ludlow (as opposed to other full-scale systems observed in Europe) as the plant at this initial stage has no mechanical separation stages to remove these contaminants. The plant was primarily designed to treat uncontaminated food wastes, rather than garden wastes. PLANT DESCRIPTION As mentioned above, biowaste is collected fortnightly and delivered to the site five days per week. The expected total solids content of the food waste is 15 – 25%. The plant, designed to treat around 5000 tpa of biowaste, works in a simple flow-through procedure. First large and visible contaminants are manually removed. The waste is then pre-treated and stored in mixing tanks prior to its introduction to the digester. Biogas is produced, collected, upgraded and utilised for electricity and heat production. At the time of the visit the plant had not yet produced enough digestate to require disposal, but it is planned that it will be sent directly to local farmers for land application. In the near future a digestate treatment stage will be included in which the digestate will be de-watered and split into solid and liquid fractions, with both fractions intended for use on farmland. A process flow diagram of the Ludlow process is shown inFigure 79 and an artist’s impression of the site is shown in Figure 80. The different parts of the process will be described below.
Figure 79 South Shropshire Biogas Plant process flow diagram (Greenfinch website, accessed July 2006)
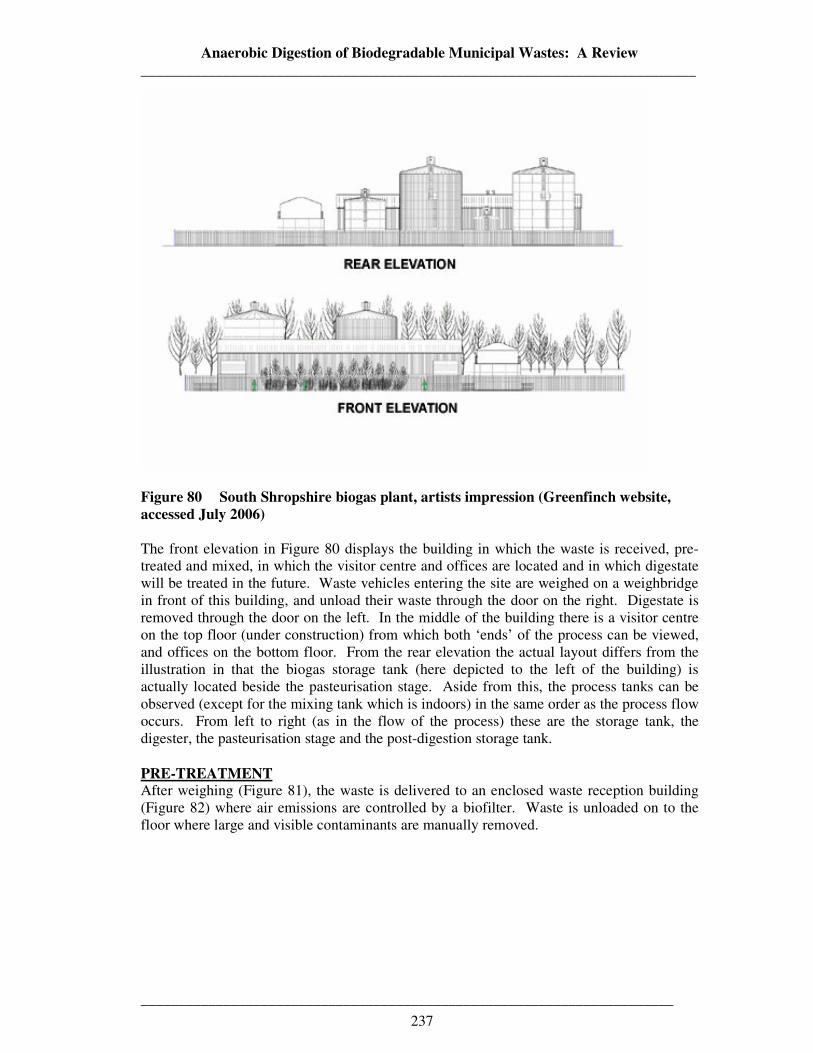
Anaerobic Digestion of Biodegradable Municipal Wastes: A Review __________________________________________________________________________
_______________________________________________________________________
237
Figure 80 South Shropshire biogas plant, artists impression (Greenfinch website, accessed July 2006)
The front elevation in Figure 80 displays the building in which the waste is received, pre-treated and mixed, in which the visitor centre and offices are located and in which digestate will be treated in the future. Waste vehicles entering the site are weighed on a weighbridge in front of this building, and unload their waste through the door on the right. Digestate is removed through the door on the left. In the middle of the building there is a visitor centre on the top floor (under construction) from which both ‘ends’ of the process can be viewed, and offices on the bottom floor. From the rear elevation the actual layout differs from the illustration in that the biogas storage tank (here depicted to the left of the building) is actually located beside the pasteurisation stage. Aside from this, the process tanks can be observed (except for the mixing tank which is indoors) in the same order as the process flow occurs. From left to right (as in the flow of the process) these are the storage tank, the digester, the pasteurisation stage and the post-digestion storage tank.
PRE-TREATMENT After weighing (Figure 81), the waste is delivered to an enclosed waste reception building (Figure 82) where air emissions are controlled by a biofilter. Waste is unloaded on to the floor where large and visible contaminants are manually removed.
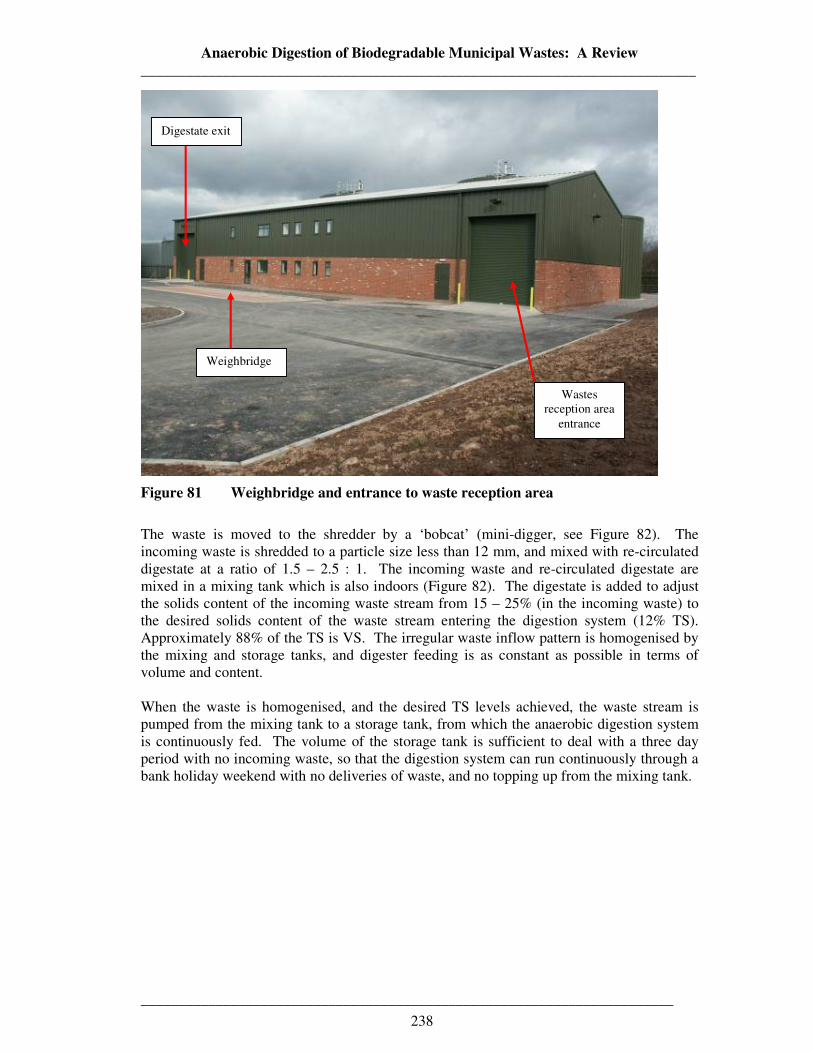
Anaerobic Digestion of Biodegradable Municipal Wastes: A Review __________________________________________________________________________
_______________________________________________________________________
238
Figure 81 Weighbridge and entrance to waste reception area
The waste is moved to the shredder by a ‘bobcat’ (mini-digger, see Figure 82). The incoming waste is shredded to a particle size less than 12 mm, and mixed with re-circulated digestate at a ratio of 1.5 – 2.5 : 1. The incoming waste and re-circulated digestate are mixed in a mixing tank which is also indoors (Figure 82). The digestate is added to adjust the solids content of the incoming waste stream from 15 – 25% (in the incoming waste) to the desired solids content of the waste stream entering the digestion system (12% TS). Approximately 88% of the TS is VS. The irregular waste inflow pattern is homogenised by the mixing and storage tanks, and digester feeding is as constant as possible in terms of volume and content. When the waste is homogenised, and the desired TS levels achieved, the waste stream is pumped from the mixing tank to a storage tank, from which the anaerobic digestion system is continuously fed. The volume of the storage tank is sufficient to deal with a three day period with no incoming waste, so that the digestion system can run continuously through a bank holiday weekend with no deliveries of waste, and no topping up from the mixing tank.
Digestate exit
Weighbridge
Wastes reception area
entrance

Anaerobic Digestion of Biodegradable Municipal Wastes: A Review __________________________________________________________________________
_______________________________________________________________________
239
Figure 82 Wastes reception area (mixing tank and ‘Bobcat’)
Figure 83 Mixing tank (shredder and waste reception area entrance)
Mixing tank
Bobcat
Mixing tank
Shredder
Entrance
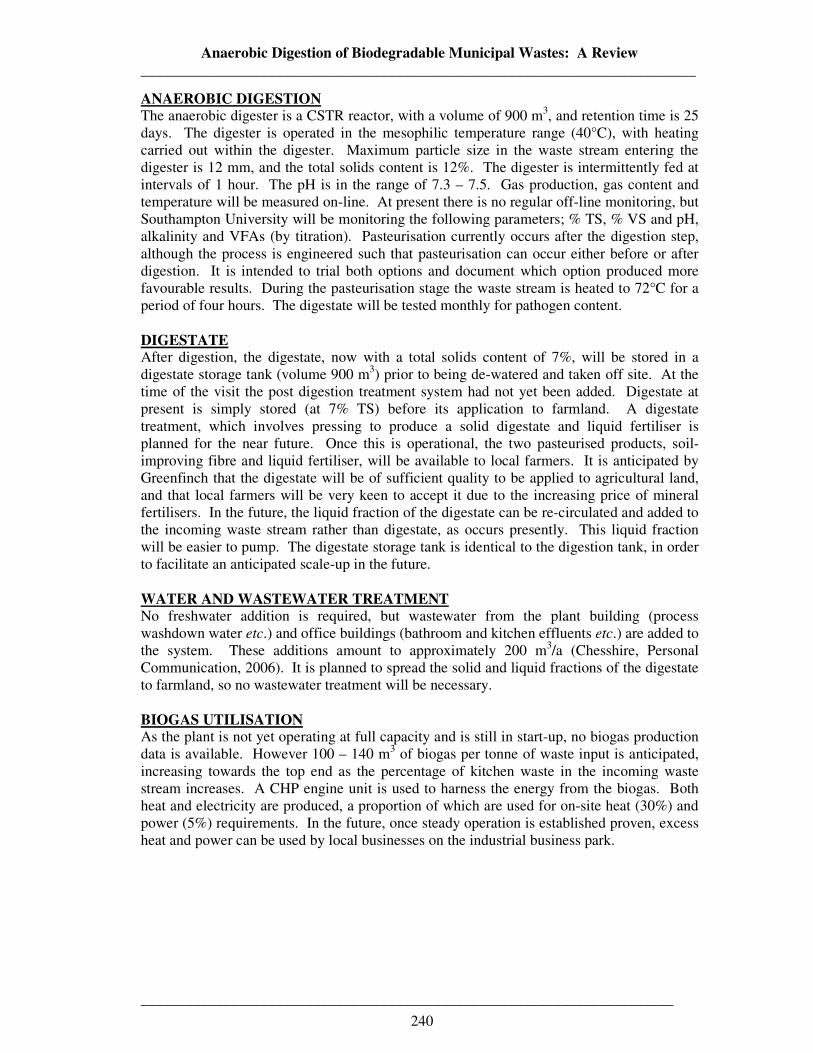
Anaerobic Digestion of Biodegradable Municipal Wastes: A Review __________________________________________________________________________
_______________________________________________________________________
240
ANAEROBIC DIGESTION The anaerobic digester is a CSTR reactor, with a volume of 900 m3, and retention time is 25 days. The digester is operated in the mesophilic temperature range (40°C), with heating carried out within the digester. Maximum particle size in the waste stream entering the digester is 12 mm, and the total solids content is 12%. The digester is intermittently fed at intervals of 1 hour. The pH is in the range of 7.3 – 7.5. Gas production, gas content and temperature will be measured on-line. At present there is no regular off-line monitoring, but Southampton University will be monitoring the following parameters; % TS, % VS and pH, alkalinity and VFAs (by titration). Pasteurisation currently occurs after the digestion step, although the process is engineered such that pasteurisation can occur either before or after digestion. It is intended to trial both options and document which option produced more favourable results. During the pasteurisation stage the waste stream is heated to 72°C for a period of four hours. The digestate will be tested monthly for pathogen content. DIGESTATE After digestion, the digestate, now with a total solids content of 7%, will be stored in a digestate storage tank (volume 900 m3) prior to being de-watered and taken off site. At the time of the visit the post digestion treatment system had not yet been added. Digestate at present is simply stored (at 7% TS) before its application to farmland. A digestate treatment, which involves pressing to produce a solid digestate and liquid fertiliser is planned for the near future. Once this is operational, the two pasteurised products, soil-improving fibre and liquid fertiliser, will be available to local farmers. It is anticipated by Greenfinch that the digestate will be of sufficient quality to be applied to agricultural land, and that local farmers will be very keen to accept it due to the increasing price of mineral fertilisers. In the future, the liquid fraction of the digestate can be re-circulated and added to the incoming waste stream rather than digestate, as occurs presently. This liquid fraction will be easier to pump. The digestate storage tank is identical to the digestion tank, in order to facilitate an anticipated scale-up in the future. WATER AND WASTEWATER TREATMENT No freshwater addition is required, but wastewater from the plant building (process washdown water etc.) and office buildings (bathroom and kitchen effluents etc.) are added to the system. These additions amount to approximately 200 m3/a (Chesshire, Personal Communication, 2006). It is planned to spread the solid and liquid fractions of the digestate to farmland, so no wastewater treatment will be necessary. BIOGAS UTILISATION As the plant is not yet operating at full capacity and is still in start-up, no biogas production data is available. However 100 – 140 m3 of biogas per tonne of waste input is anticipated, increasing towards the top end as the percentage of kitchen waste in the incoming waste stream increases. A CHP engine unit is used to harness the energy from the biogas. Both heat and electricity are produced, a proportion of which are used for on-site heat (30%) and power (5%) requirements. In the future, once steady operation is established proven, excess heat and power can be used by local businesses on the industrial business park.
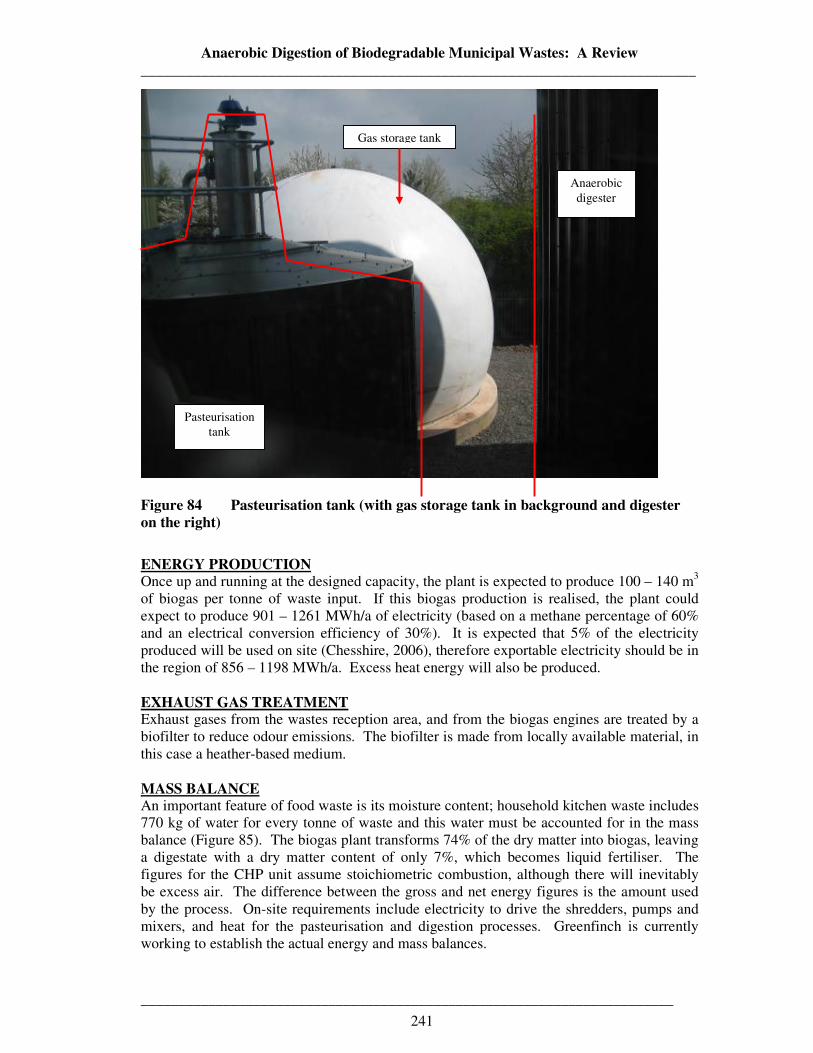
Anaerobic Digestion of Biodegradable Municipal Wastes: A Review __________________________________________________________________________
_______________________________________________________________________
241
Figure 84 Pasteurisation tank (with gas storage tank in background and digester on the right)
ENERGY PRODUCTION Once up and running at the designed capacity, the plant is expected to produce 100 – 140 m3 of biogas per tonne of waste input. If this biogas production is realised, the plant could expect to produce 901 – 1261 MWh/a of electricity (based on a methane percentage of 60% and an electrical conversion efficiency of 30%). It is expected that 5% of the electricity produced will be used on site (Chesshire, 2006), therefore exportable electricity should be in the region of 856 – 1198 MWh/a. Excess heat energy will also be produced. EXHAUST GAS TREATMENT Exhaust gases from the wastes reception area, and from the biogas engines are treated by a biofilter to reduce odour emissions. The biofilter is made from locally available material, in this case a heather-based medium. MASS BALANCE An important feature of food waste is its moisture content; household kitchen waste includes 770 kg of water for every tonne of waste and this water must be accounted for in the mass balance (Figure 85). The biogas plant transforms 74% of the dry matter into biogas, leaving a digestate with a dry matter content of only 7%, which becomes liquid fertiliser. The figures for the CHP unit assume stoichiometric combustion, although there will inevitably be excess air. The difference between the gross and net energy figures is the amount used by the process. On-site requirements include electricity to drive the shredders, pumps and mixers, and heat for the pasteurisation and digestion processes. Greenfinch is currently working to establish the actual energy and mass balances.
Pasteurisation tank
Anaerobic digester
Gas storage tank
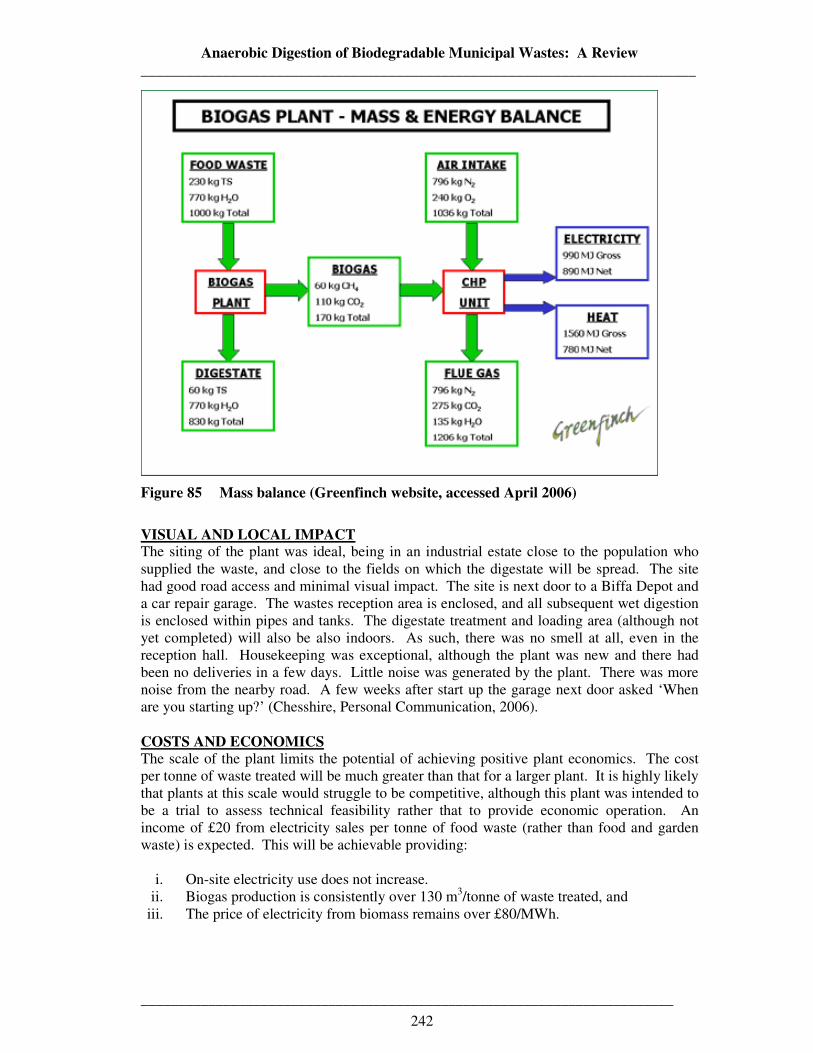
Anaerobic Digestion of Biodegradable Municipal Wastes: A Review __________________________________________________________________________
_______________________________________________________________________
242
Figure 85 Mass balance (Greenfinch website, accessed April 2006)
VISUAL AND LOCAL IMPACT The siting of the plant was ideal, being in an industrial estate close to the population who supplied the waste, and close to the fields on which the digestate will be spread. The site had good road access and minimal visual impact. The site is next door to a Biffa Depot and a car repair garage. The wastes reception area is enclosed, and all subsequent wet digestion is enclosed within pipes and tanks. The digestate treatment and loading area (although not yet completed) will also be also indoors. As such, there was no smell at all, even in the reception hall. Housekeeping was exceptional, although the plant was new and there had been no deliveries in a few days. Little noise was generated by the plant. There was more noise from the nearby road. A few weeks after start up the garage next door asked ‘When are you starting up?’ (Chesshire, Personal Communication, 2006). COSTS AND ECONOMICS The scale of the plant limits the potential of achieving positive plant economics. The cost per tonne of waste treated will be much greater than that for a larger plant. It is highly likely that plants at this scale would struggle to be competitive, although this plant was intended to be a trial to assess technical feasibility rather that to provide economic operation. An income of £20 from electricity sales per tonne of food waste (rather than food and garden waste) is expected. This will be achievable providing:
i. On-site electricity use does not increase. ii. Biogas production is consistently over 130 m3/tonne of waste treated, and
iii. The price of electricity from biomass remains over £80/MWh.
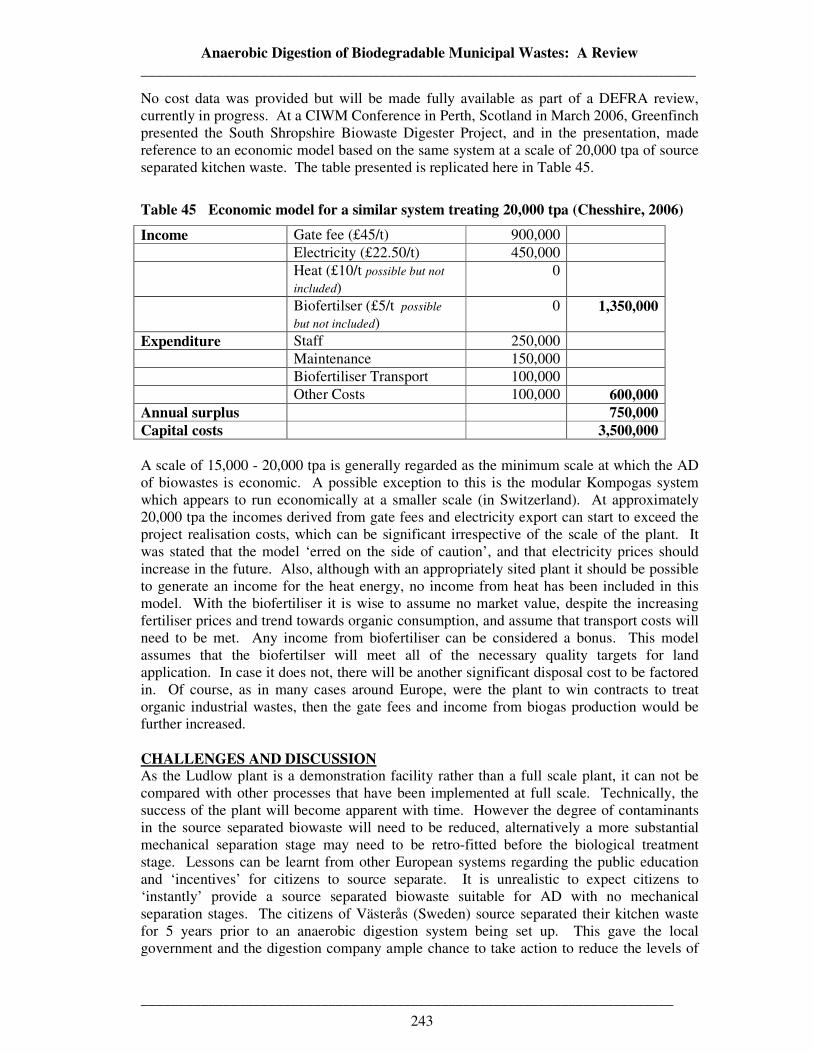
Anaerobic Digestion of Biodegradable Municipal Wastes: A Review __________________________________________________________________________
_______________________________________________________________________
243
No cost data was provided but will be made fully available as part of a DEFRA review, currently in progress. At a CIWM Conference in Perth, Scotland in March 2006, Greenfinch presented the South Shropshire Biowaste Digester Project, and in the presentation, made reference to an economic model based on the same system at a scale of 20,000 tpa of source separated kitchen waste. The table presented is replicated here in Table 45.
Table 45 Economic model for a similar system treating 20,000 tpa (Chesshire, 2006)
Income Gate fee (£45/t) 900,000 Electricity (£22.50/t) 450,000 Heat (£10/t possible but not
included) 0
Biofertilser (£5/t possible
but not included) 0 1,350,000
Expenditure Staff 250,000 Maintenance 150,000 Biofertiliser Transport 100,000 Other Costs 100,000 600,000 Annual surplus 750,000 Capital costs 3,500,000 A scale of 15,000 - 20,000 tpa is generally regarded as the minimum scale at which the AD of biowastes is economic. A possible exception to this is the modular Kompogas system which appears to run economically at a smaller scale (in Switzerland). At approximately 20,000 tpa the incomes derived from gate fees and electricity export can start to exceed the project realisation costs, which can be significant irrespective of the scale of the plant. It was stated that the model ‘erred on the side of caution’, and that electricity prices should increase in the future. Also, although with an appropriately sited plant it should be possible to generate an income for the heat energy, no income from heat has been included in this model. With the biofertiliser it is wise to assume no market value, despite the increasing fertiliser prices and trend towards organic consumption, and assume that transport costs will need to be met. Any income from biofertiliser can be considered a bonus. This model assumes that the biofertilser will meet all of the necessary quality targets for land application. In case it does not, there will be another significant disposal cost to be factored in. Of course, as in many cases around Europe, were the plant to win contracts to treat organic industrial wastes, then the gate fees and income from biogas production would be further increased. CHALLENGES AND DISCUSSION As the Ludlow plant is a demonstration facility rather than a full scale plant, it can not be compared with other processes that have been implemented at full scale. Technically, the success of the plant will become apparent with time. However the degree of contaminants in the source separated biowaste will need to be reduced, alternatively a more substantial mechanical separation stage may need to be retro-fitted before the biological treatment stage. Lessons can be learnt from other European systems regarding the public education and ‘incentives’ for citizens to source separate. It is unrealistic to expect citizens to ‘instantly’ provide a source separated biowaste suitable for AD with no mechanical separation stages. The citizens of Västerås (Sweden) source separated their kitchen waste for 5 years prior to an anaerobic digestion system being set up. This gave the local government and the digestion company ample chance to take action to reduce the levels of
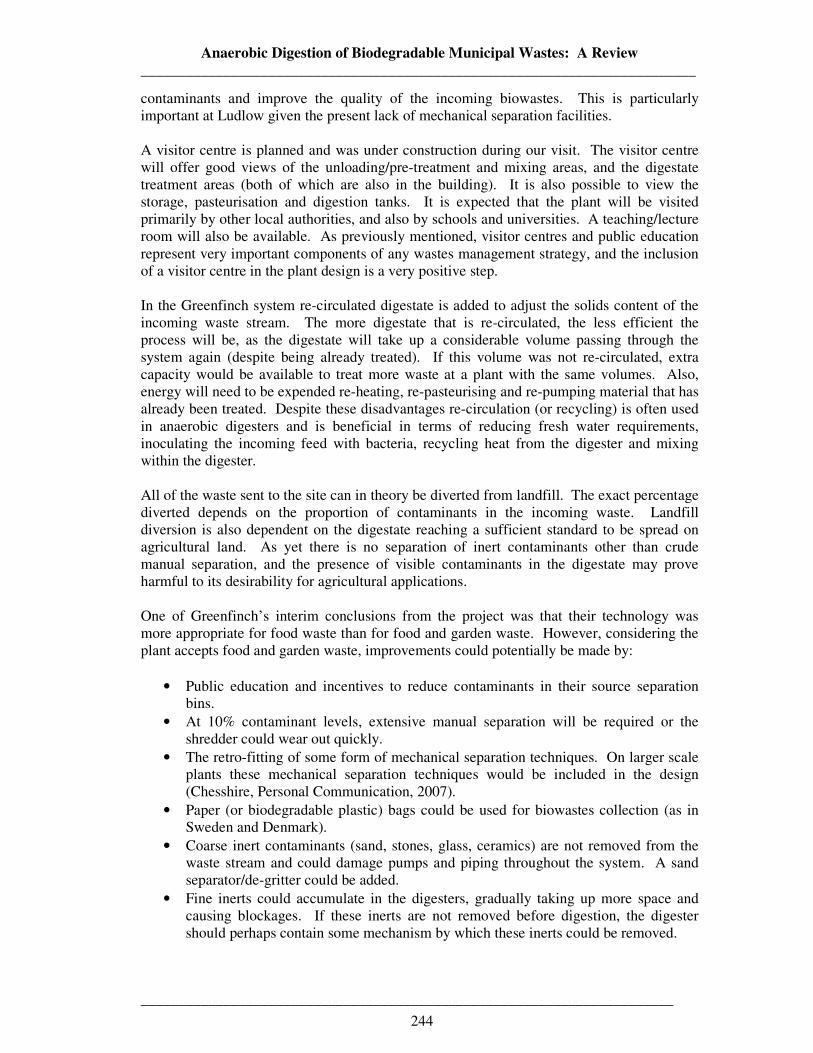
Anaerobic Digestion of Biodegradable Municipal Wastes: A Review __________________________________________________________________________
_______________________________________________________________________
244
contaminants and improve the quality of the incoming biowastes. This is particularly important at Ludlow given the present lack of mechanical separation facilities. A visitor centre is planned and was under construction during our visit. The visitor centre will offer good views of the unloading/pre-treatment and mixing areas, and the digestate treatment areas (both of which are also in the building). It is also possible to view the storage, pasteurisation and digestion tanks. It is expected that the plant will be visited primarily by other local authorities, and also by schools and universities. A teaching/lecture room will also be available. As previously mentioned, visitor centres and public education represent very important components of any wastes management strategy, and the inclusion of a visitor centre in the plant design is a very positive step. In the Greenfinch system re-circulated digestate is added to adjust the solids content of the incoming waste stream. The more digestate that is re-circulated, the less efficient the process will be, as the digestate will take up a considerable volume passing through the system again (despite being already treated). If this volume was not re-circulated, extra capacity would be available to treat more waste at a plant with the same volumes. Also, energy will need to be expended re-heating, re-pasteurising and re-pumping material that has already been treated. Despite these disadvantages re-circulation (or recycling) is often used in anaerobic digesters and is beneficial in terms of reducing fresh water requirements, inoculating the incoming feed with bacteria, recycling heat from the digester and mixing within the digester. All of the waste sent to the site can in theory be diverted from landfill. The exact percentage diverted depends on the proportion of contaminants in the incoming waste. Landfill diversion is also dependent on the digestate reaching a sufficient standard to be spread on agricultural land. As yet there is no separation of inert contaminants other than crude manual separation, and the presence of visible contaminants in the digestate may prove harmful to its desirability for agricultural applications. One of Greenfinch’s interim conclusions from the project was that their technology was more appropriate for food waste than for food and garden waste. However, considering the plant accepts food and garden waste, improvements could potentially be made by:
• Public education and incentives to reduce contaminants in their source separation bins.
• At 10% contaminant levels, extensive manual separation will be required or the shredder could wear out quickly.
• The retro-fitting of some form of mechanical separation techniques. On larger scale plants these mechanical separation techniques would be included in the design (Chesshire, Personal Communication, 2007).
• Paper (or biodegradable plastic) bags could be used for biowastes collection (as in Sweden and Denmark).
• Coarse inert contaminants (sand, stones, glass, ceramics) are not removed from the waste stream and could damage pumps and piping throughout the system. A sand separator/de-gritter could be added.
• Fine inerts could accumulate in the digesters, gradually taking up more space and causing blockages. If these inerts are not removed before digestion, the digester should perhaps contain some mechanism by which these inerts could be removed.
Anaerobic Digestion of Biodegradable Municipal Wastes: A Review __________________________________________________________________________
_______________________________________________________________________
245
• After the de-watering stage is operational, the recycling of process water will be more effective than recycling digestate.
• Transport of de-watered digestate to farmland may be cheaper than transport of digestate with its present higher water content, although the solid and liquid fractions of the digestate will both be sent to farms.
• The building of solid and liquid digestate storage facilities at the farms to which the digestate will be sent. This would allow farmers to accumulate the products, and apply them at the times of peak plant growth for maximum impact. Perhaps these storage facilities are already a part of the system, or are planned, but no mention was made of them.
All of the above suggestions would increase the costs of the project. This project is a trial scale project, and as such the plant is not ideally suited to achieve significant financial benefit from gate fees and energy production revenues. The Ludlow facility must be regarded (especially by decision makers) for what it is: A trial scale process, from which lessons will be learned, and solutions to problems found. To summarise, it is felt that the Ludlow plant may experience operational difficulties as a result of the unforeseen levels of inorganic contaminants contained in the incoming waste stream. The installation of a mechanical pre-treatment stage, including a sand separator, will increase capital costs considerably but provide more stable operation and reduce on-going operational costs. The economics of the plant would also be greatly improved at full scale, perhaps with other organic wastes being co-digested. It is unclear how sand and other inert inorganics will be removed from the digester. The sedimentation of these fine inerts may prove problematic if no removal mechanism has been included in the digester design.
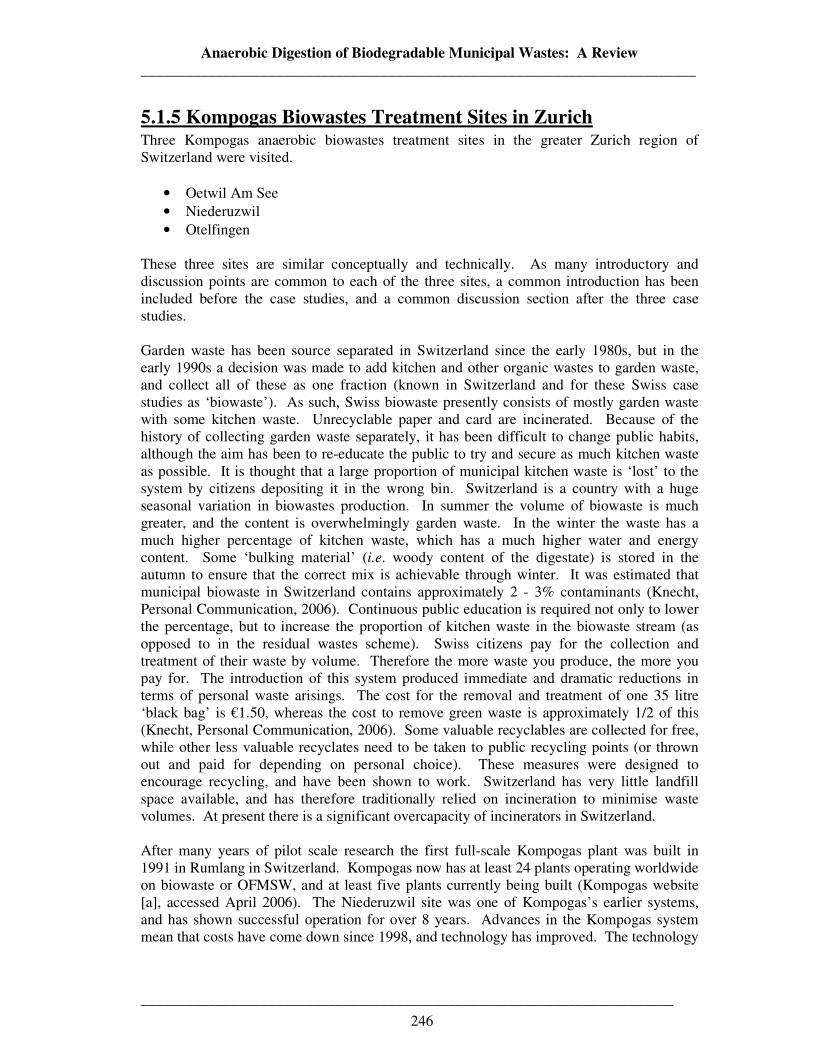
Anaerobic Digestion of Biodegradable Municipal Wastes: A Review __________________________________________________________________________
_______________________________________________________________________
246
5.1.5 Kompogas Biowastes Treatment Sites in Zurich Three Kompogas anaerobic biowastes treatment sites in the greater Zurich region of Switzerland were visited.
• Oetwil Am See • Niederuzwil • Otelfingen
These three sites are similar conceptually and technically. As many introductory and discussion points are common to each of the three sites, a common introduction has been included before the case studies, and a common discussion section after the three case studies. Garden waste has been source separated in Switzerland since the early 1980s, but in the early 1990s a decision was made to add kitchen and other organic wastes to garden waste, and collect all of these as one fraction (known in Switzerland and for these Swiss case studies as ‘biowaste’). As such, Swiss biowaste presently consists of mostly garden waste with some kitchen waste. Unrecyclable paper and card are incinerated. Because of the history of collecting garden waste separately, it has been difficult to change public habits, although the aim has been to re-educate the public to try and secure as much kitchen waste as possible. It is thought that a large proportion of municipal kitchen waste is ‘lost’ to the system by citizens depositing it in the wrong bin. Switzerland is a country with a huge seasonal variation in biowastes production. In summer the volume of biowaste is much greater, and the content is overwhelmingly garden waste. In the winter the waste has a much higher percentage of kitchen waste, which has a much higher water and energy content. Some ‘bulking material’ (i.e. woody content of the digestate) is stored in the autumn to ensure that the correct mix is achievable through winter. It was estimated that municipal biowaste in Switzerland contains approximately 2 - 3% contaminants (Knecht, Personal Communication, 2006). Continuous public education is required not only to lower the percentage, but to increase the proportion of kitchen waste in the biowaste stream (as opposed to in the residual wastes scheme). Swiss citizens pay for the collection and treatment of their waste by volume. Therefore the more waste you produce, the more you pay for. The introduction of this system produced immediate and dramatic reductions in terms of personal waste arisings. The cost for the removal and treatment of one 35 litre ‘black bag’ is €1.50, whereas the cost to remove green waste is approximately 1/2 of this (Knecht, Personal Communication, 2006). Some valuable recyclables are collected for free, while other less valuable recyclates need to be taken to public recycling points (or thrown out and paid for depending on personal choice). These measures were designed to encourage recycling, and have been shown to work. Switzerland has very little landfill space available, and has therefore traditionally relied on incineration to minimise waste volumes. At present there is a significant overcapacity of incinerators in Switzerland. After many years of pilot scale research the first full-scale Kompogas plant was built in 1991 in Rumlang in Switzerland. Kompogas now has at least 24 plants operating worldwide on biowaste or OFMSW, and at least five plants currently being built (Kompogas website [a], accessed April 2006). The Niederuzwil site was one of Kompogas’s earlier systems, and has shown successful operation for over 8 years. Advances in the Kompogas system mean that costs have come down since 1998, and technology has improved. The technology
Anaerobic Digestion of Biodegradable Municipal Wastes: A Review __________________________________________________________________________
_______________________________________________________________________
247
can be considered proven and reliable, and its modular structure gives extra flexibility to the process in that it can be scaled up easily. Because of the plug flow system, an extra pasteurisation stage should not be necessary to meet ABPR, meaning less heat energy is consumed on-site. Wastewater is also minimal as dry-digestion is used and excess liquid is spread to farmland. Each site co-digests source separated municipal kitchen and garden waste (approximately 80%) and industrial organic waste (approximately 20%). The industrial organic waste is usually restaurant or fast food restaurant waste, food processing waste or supermarket food waste. Pre-treatment, digestion and post AD treatment are similar at all three sites, as is the end use for the liquid fertiliser and solid soil improver. Kompogas own and operate many of the plants they have built, but also offer varying levels of service to private clients. Many Kompogas sites are owned and operated independently, as individual legal entities, but remain part of the Kompogas group. Plants can be built, started up and handed over to clients, with differing levels of service included over different periods of time. All Kompogas digesters operate in the thermophilic temperature range, at 55 – 60oC. All digesters are based on a 14 day retention time, a 30% TS content and a maximum particle size of 50 mm. All the key criteria are kept constant, but plant managers are free to experiment with the system and make superficial modifications as they see fit. More details of the Kompogas anaerobic digestion systems can be observed on the Kompogas website (www.kompogas.ch/en/). The three sites visited will be described in more detail below.
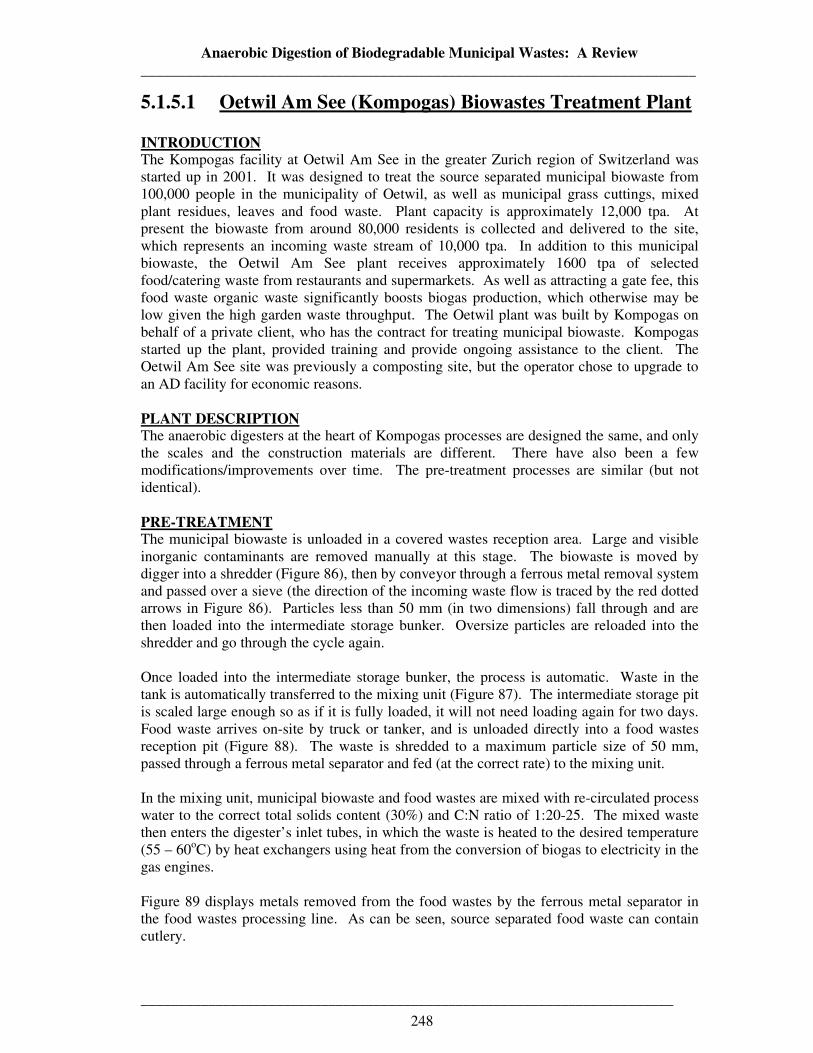
Anaerobic Digestion of Biodegradable Municipal Wastes: A Review __________________________________________________________________________
_______________________________________________________________________
248
5.1.5.1 Oetwil Am See (Kompogas) Biowastes Treatment Plant INTRODUCTION The Kompogas facility at Oetwil Am See in the greater Zurich region of Switzerland was started up in 2001. It was designed to treat the source separated municipal biowaste from 100,000 people in the municipality of Oetwil, as well as municipal grass cuttings, mixed plant residues, leaves and food waste. Plant capacity is approximately 12,000 tpa. At present the biowaste from around 80,000 residents is collected and delivered to the site, which represents an incoming waste stream of 10,000 tpa. In addition to this municipal biowaste, the Oetwil Am See plant receives approximately 1600 tpa of selected food/catering waste from restaurants and supermarkets. As well as attracting a gate fee, this food waste organic waste significantly boosts biogas production, which otherwise may be low given the high garden waste throughput. The Oetwil plant was built by Kompogas on behalf of a private client, who has the contract for treating municipal biowaste. Kompogas started up the plant, provided training and provide ongoing assistance to the client. The Oetwil Am See site was previously a composting site, but the operator chose to upgrade to an AD facility for economic reasons. PLANT DESCRIPTION The anaerobic digesters at the heart of Kompogas processes are designed the same, and only the scales and the construction materials are different. There have also been a few modifications/improvements over time. The pre-treatment processes are similar (but not identical). PRE-TREATMENT The municipal biowaste is unloaded in a covered wastes reception area. Large and visible inorganic contaminants are removed manually at this stage. The biowaste is moved by digger into a shredder (Figure 86), then by conveyor through a ferrous metal removal system and passed over a sieve (the direction of the incoming waste flow is traced by the red dotted arrows in Figure 86). Particles less than 50 mm (in two dimensions) fall through and are then loaded into the intermediate storage bunker. Oversize particles are reloaded into the shredder and go through the cycle again. Once loaded into the intermediate storage bunker, the process is automatic. Waste in the tank is automatically transferred to the mixing unit (Figure 87). The intermediate storage pit is scaled large enough so as if it is fully loaded, it will not need loading again for two days. Food waste arrives on-site by truck or tanker, and is unloaded directly into a food wastes reception pit (Figure 88). The waste is shredded to a maximum particle size of 50 mm, passed through a ferrous metal separator and fed (at the correct rate) to the mixing unit. In the mixing unit, municipal biowaste and food wastes are mixed with re-circulated process water to the correct total solids content (30%) and C:N ratio of 1:20-25. The mixed waste then enters the digester’s inlet tubes, in which the waste is heated to the desired temperature (55 – 60oC) by heat exchangers using heat from the conversion of biogas to electricity in the gas engines. Figure 89 displays metals removed from the food wastes by the ferrous metal separator in the food wastes processing line. As can be seen, source separated food waste can contain cutlery.
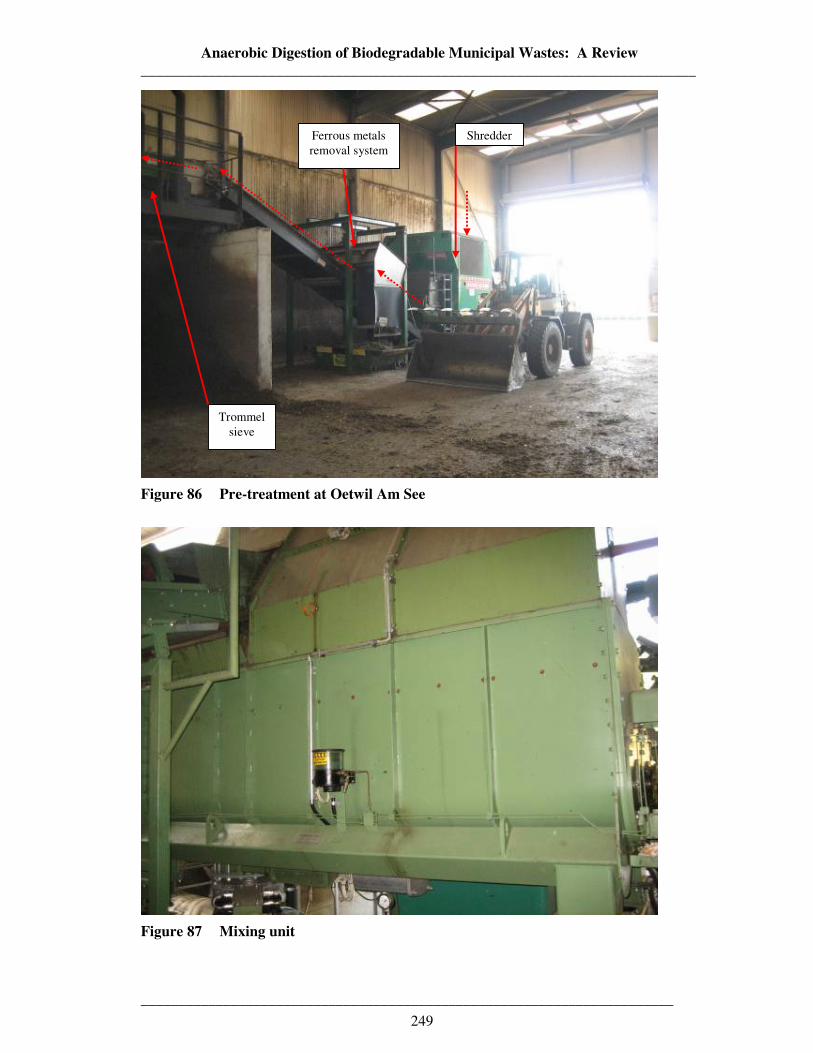
Anaerobic Digestion of Biodegradable Municipal Wastes: A Review __________________________________________________________________________
_______________________________________________________________________
249
Figure 86 Pre-treatment at Oetwil Am See
Figure 87 Mixing unit
Ferrous metals removal system
Trommel sieve
Shredder
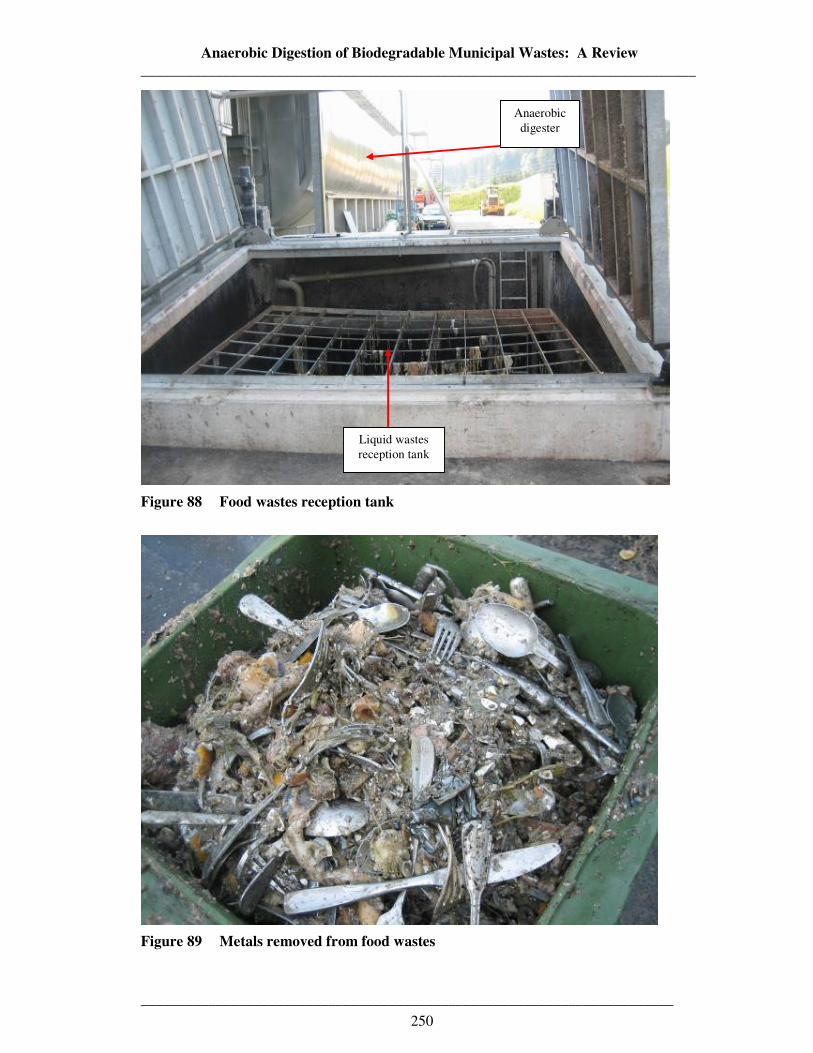
Anaerobic Digestion of Biodegradable Municipal Wastes: A Review __________________________________________________________________________
_______________________________________________________________________
250
Figure 88 Food wastes reception tank
Figure 89 Metals removed from food wastes
Liquid wastes reception tank
Anaerobic digester
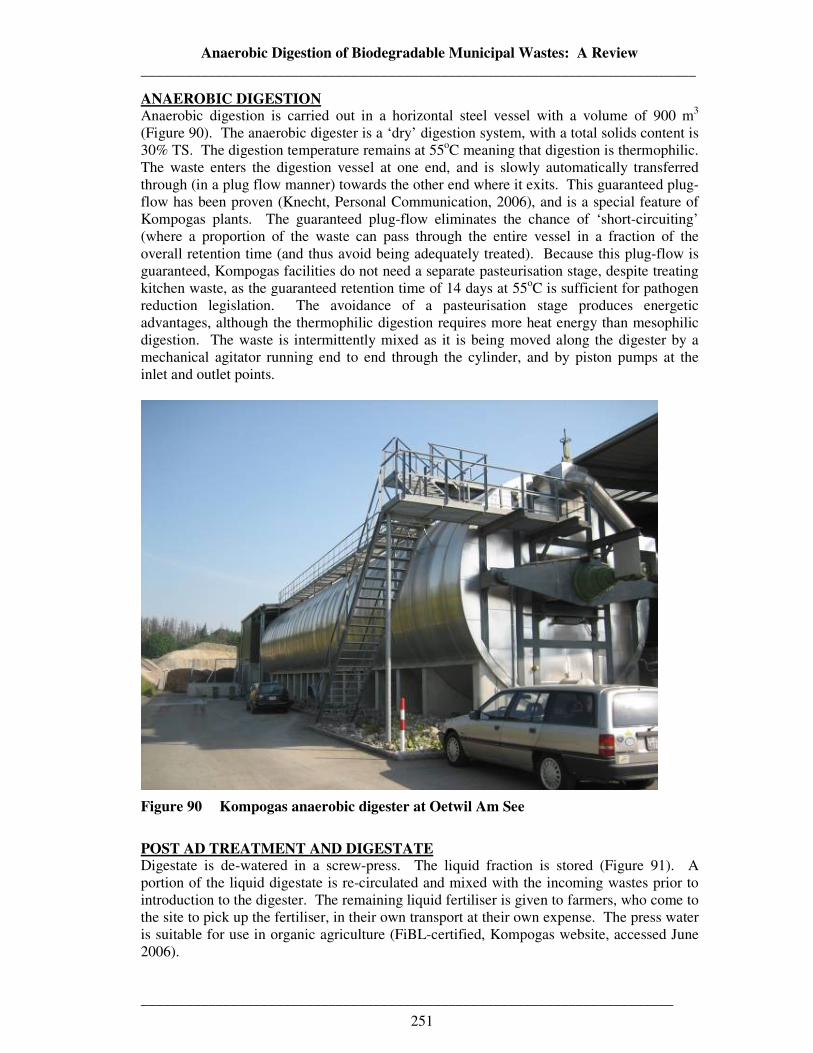
Anaerobic Digestion of Biodegradable Municipal Wastes: A Review __________________________________________________________________________
_______________________________________________________________________
251
ANAEROBIC DIGESTION Anaerobic digestion is carried out in a horizontal steel vessel with a volume of 900 m3 (Figure 90). The anaerobic digester is a ‘dry’ digestion system, with a total solids content is 30% TS. The digestion temperature remains at 55oC meaning that digestion is thermophilic. The waste enters the digestion vessel at one end, and is slowly automatically transferred through (in a plug flow manner) towards the other end where it exits. This guaranteed plug-flow has been proven (Knecht, Personal Communication, 2006), and is a special feature of Kompogas plants. The guaranteed plug-flow eliminates the chance of ‘short-circuiting’ (where a proportion of the waste can pass through the entire vessel in a fraction of the overall retention time (and thus avoid being adequately treated). Because this plug-flow is guaranteed, Kompogas facilities do not need a separate pasteurisation stage, despite treating kitchen waste, as the guaranteed retention time of 14 days at 55oC is sufficient for pathogen reduction legislation. The avoidance of a pasteurisation stage produces energetic advantages, although the thermophilic digestion requires more heat energy than mesophilic digestion. The waste is intermittently mixed as it is being moved along the digester by a mechanical agitator running end to end through the cylinder, and by piston pumps at the inlet and outlet points.
Figure 90 Kompogas anaerobic digester at Oetwil Am See
POST AD TREATMENT AND DIGESTATE Digestate is de-watered in a screw-press. The liquid fraction is stored (Figure 91). A portion of the liquid digestate is re-circulated and mixed with the incoming wastes prior to introduction to the digester. The remaining liquid fertiliser is given to farmers, who come to the site to pick up the fertiliser, in their own transport at their own expense. The press water is suitable for use in organic agriculture (FiBL-certified, Kompogas website, accessed June 2006).
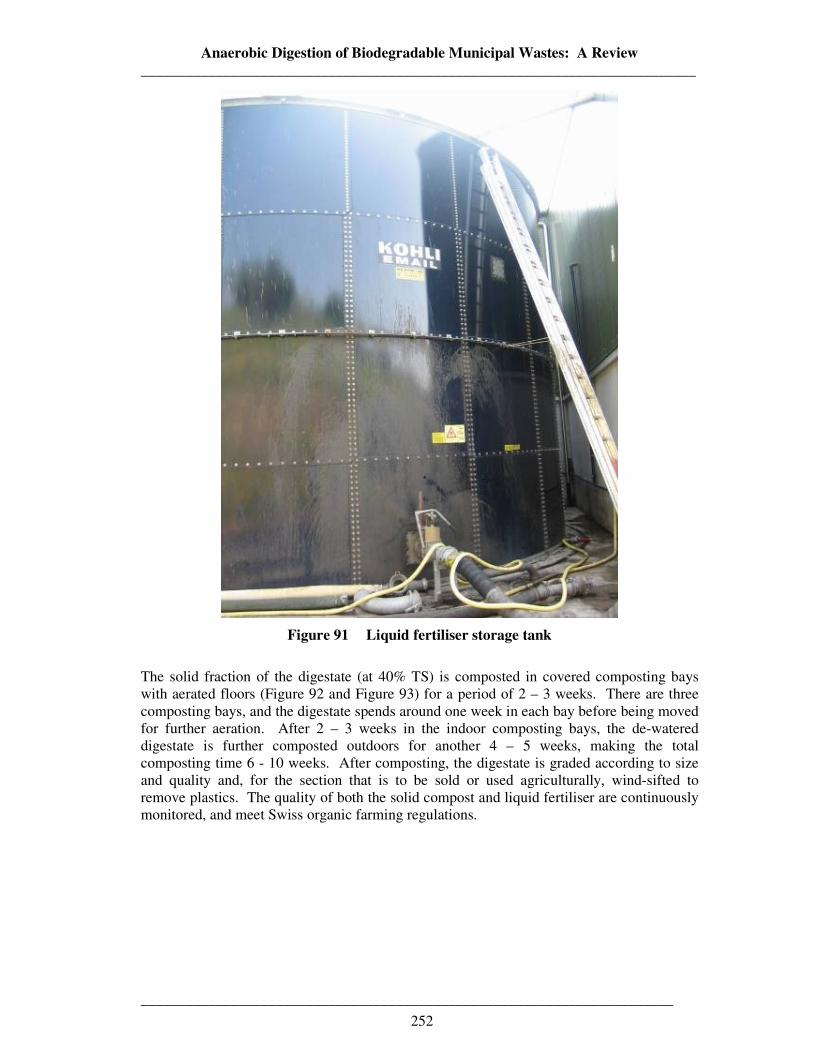
Anaerobic Digestion of Biodegradable Municipal Wastes: A Review __________________________________________________________________________
_______________________________________________________________________
252
Figure 91 Liquid fertiliser storage tank
The solid fraction of the digestate (at 40% TS) is composted in covered composting bays with aerated floors (Figure 92 and Figure 93) for a period of 2 – 3 weeks. There are three composting bays, and the digestate spends around one week in each bay before being moved for further aeration. After 2 – 3 weeks in the indoor composting bays, the de-watered digestate is further composted outdoors for another 4 – 5 weeks, making the total composting time 6 - 10 weeks. After composting, the digestate is graded according to size and quality and, for the section that is to be sold or used agriculturally, wind-sifted to remove plastics. The quality of both the solid compost and liquid fertiliser are continuously monitored, and meet Swiss organic farming regulations.
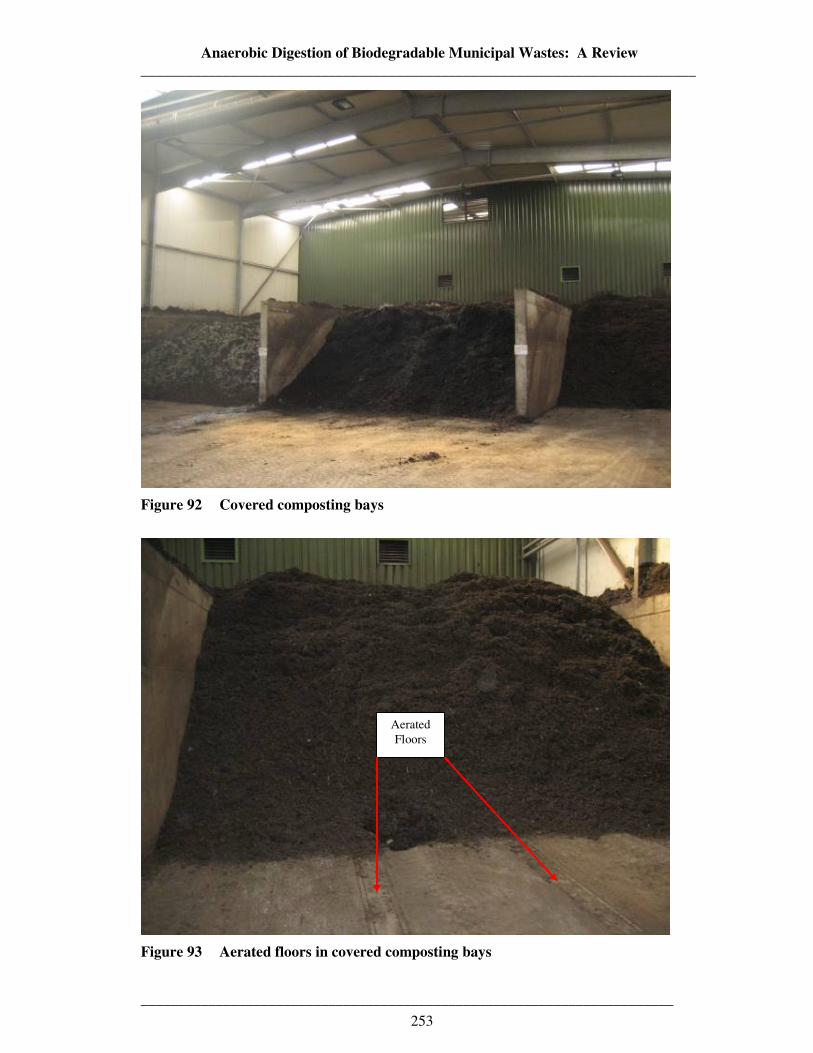
Anaerobic Digestion of Biodegradable Municipal Wastes: A Review __________________________________________________________________________
_______________________________________________________________________
253
Figure 92 Covered composting bays
Figure 93 Aerated floors in covered composting bays
Aerated Floors
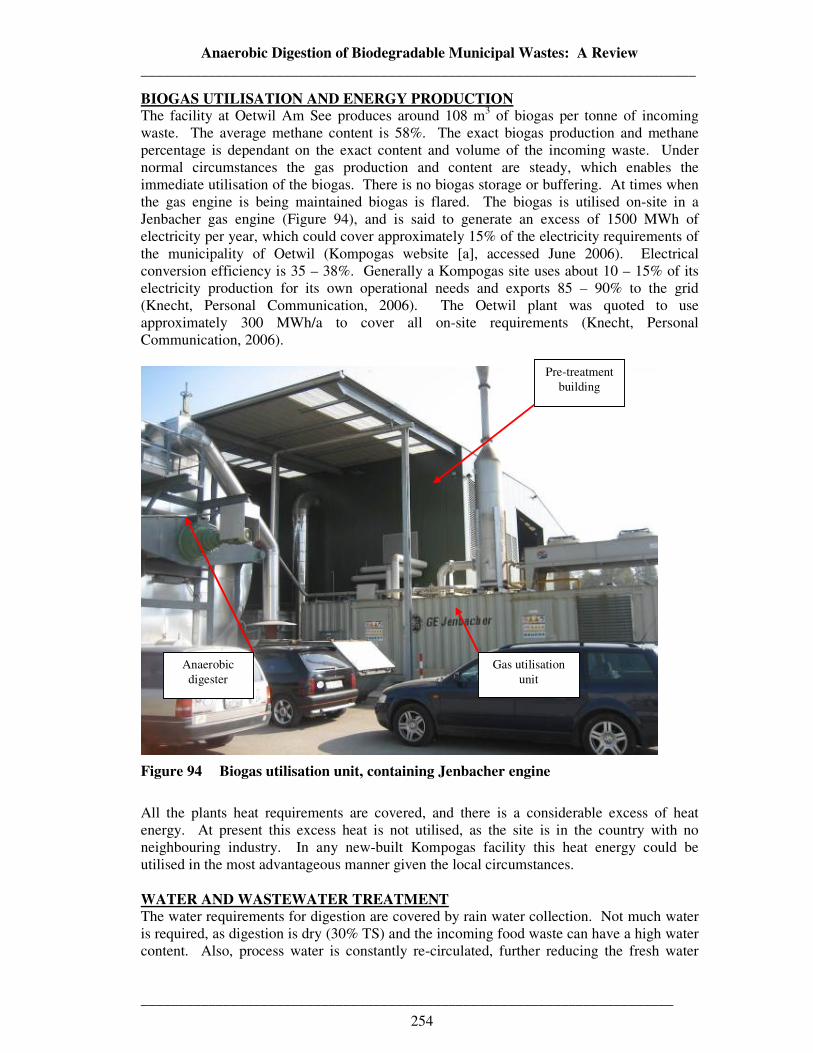
Anaerobic Digestion of Biodegradable Municipal Wastes: A Review __________________________________________________________________________
_______________________________________________________________________
254
BIOGAS UTILISATION AND ENERGY PRODUCTION The facility at Oetwil Am See produces around 108 m3 of biogas per tonne of incoming waste. The average methane content is 58%. The exact biogas production and methane percentage is dependant on the exact content and volume of the incoming waste. Under normal circumstances the gas production and content are steady, which enables the immediate utilisation of the biogas. There is no biogas storage or buffering. At times when the gas engine is being maintained biogas is flared. The biogas is utilised on-site in a Jenbacher gas engine (Figure 94), and is said to generate an excess of 1500 MWh of electricity per year, which could cover approximately 15% of the electricity requirements of the municipality of Oetwil (Kompogas website [a], accessed June 2006). Electrical conversion efficiency is 35 – 38%. Generally a Kompogas site uses about 10 – 15% of its electricity production for its own operational needs and exports 85 – 90% to the grid (Knecht, Personal Communication, 2006). The Oetwil plant was quoted to use approximately 300 MWh/a to cover all on-site requirements (Knecht, Personal Communication, 2006).
Figure 94 Biogas utilisation unit, containing Jenbacher engine
All the plants heat requirements are covered, and there is a considerable excess of heat energy. At present this excess heat is not utilised, as the site is in the country with no neighbouring industry. In any new-built Kompogas facility this heat energy could be utilised in the most advantageous manner given the local circumstances. WATER AND WASTEWATER TREATMENT The water requirements for digestion are covered by rain water collection. Not much water is required, as digestion is dry (30% TS) and the incoming food waste can have a high water content. Also, process water is constantly re-circulated, further reducing the fresh water
Anaerobic digester
Gas utilisation unit
Pre-treatment building
Anaerobic Digestion of Biodegradable Municipal Wastes: A Review __________________________________________________________________________
_______________________________________________________________________
255
requirement. As with the other Kompogas facilities treating source separated biowastes, process water is collected by farmers as a fertiliser, meaning that no wastewater treatment is necessary. EXHAUST AIR TREATMENT All exhaust air from the wastes reception, mechanical separation/preparation stages and the indoor composting hall are treated by biofilter to minimise odour. VISUAL AND LOCAL IMPACT The out-of-town site neighbours a separately managed landfill site. There is no noticeable odour outside the plant, despite the reception area doors being left open. This is the operators responsibility, and Kompogas recommend that doors should be closed when not in use. Due to the horizontal digester the site is low-lying, and does not impact visually on the surrounding agricultural area. COSTS AND ECONOMICS The capital cost was given as £2.54 million (€4.01 million using 2001 exchange rates) in Ritchie (2003). Exact economic figures in terms of capital and operational costs were not made available by Kompogas. When pressed for a ‘ball park figure’, it was estimated that the capital cost for a 10,000 tpa Kompogas plant such as the Oetwil Am See plant would be in the region of £2.5 million, which would work out around £250/tonne of waste treated per year. As with other digestion systems, the cost per tonne decreases with the economy of scale, although due to the modular nature of the system this decrease in costs per tonne treated with increasing scale is not as marked as for other non-modular systems. It was estimated that the recently installed Kompogas facility in Passau (Germany) cost around €10 million (£6.7 million). The capacity of this plant was 40,000 tpa, making the cost per tonne of waste treated in the region of €250/tonne (£168/tonne). It was stressed that Kompogas are reluctant to give any data on costs for anything other than a tender for an actual project. This is because of the tendency of decision makers to head straight for ‘the bottom line’, without considering the ‘bigger picture’, including factors such as quality and reliability. This is a position common to most suppliers of quality reliable anaerobic digestion systems, as the ‘best’ solution is seldom the cheapest solution. CHALLENGES AND DISCUSSION All of the incoming waste stream (except contaminants) are diverted from landfill. Outputs are high quality compost, liquid fertilisers, and energy. The Kompogas systems, can be considered reliable and proven, and are particularly (but not exclusively) suited to localised biowastes treatment, due to the smaller scale of the plants. Points common to all three Kompogas facilities visited are discussed further in Section 5.1.5.4.
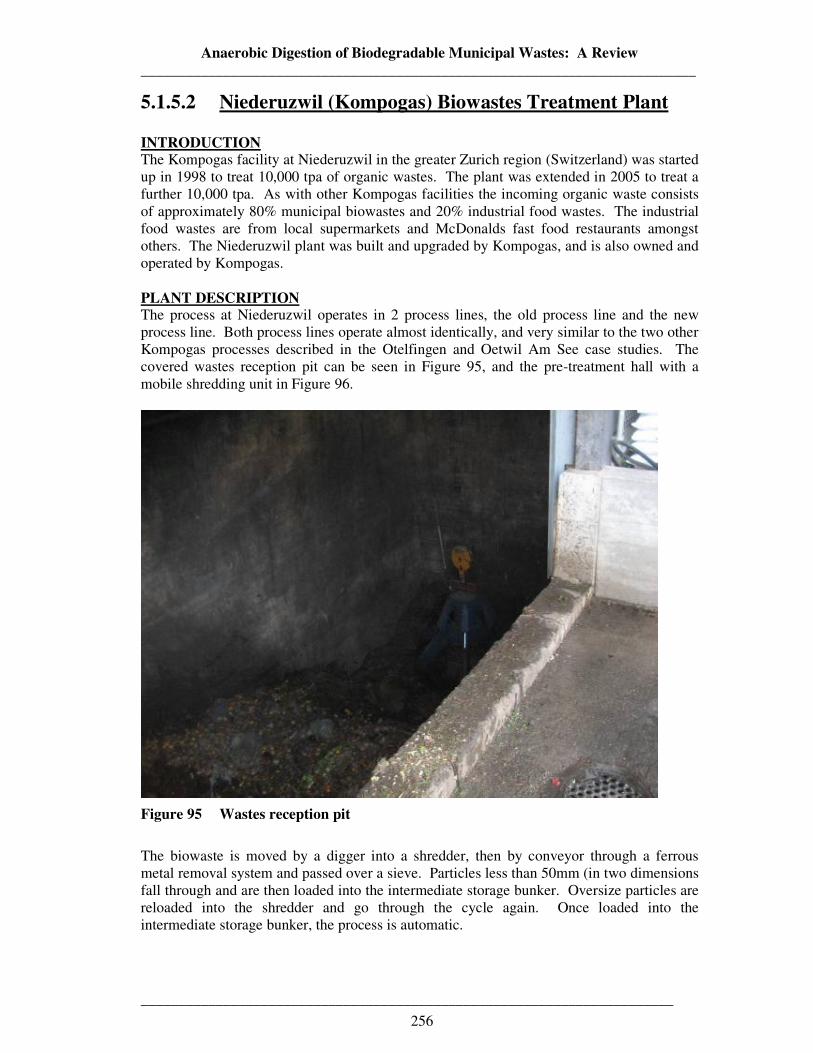
Anaerobic Digestion of Biodegradable Municipal Wastes: A Review __________________________________________________________________________
_______________________________________________________________________
256
5.1.5.2 Niederuzwil (Kompogas) Biowastes Treatment Plant INTRODUCTION The Kompogas facility at Niederuzwil in the greater Zurich region (Switzerland) was started up in 1998 to treat 10,000 tpa of organic wastes. The plant was extended in 2005 to treat a further 10,000 tpa. As with other Kompogas facilities the incoming organic waste consists of approximately 80% municipal biowastes and 20% industrial food wastes. The industrial food wastes are from local supermarkets and McDonalds fast food restaurants amongst others. The Niederuzwil plant was built and upgraded by Kompogas, and is also owned and operated by Kompogas. PLANT DESCRIPTION The process at Niederuzwil operates in 2 process lines, the old process line and the new process line. Both process lines operate almost identically, and very similar to the two other Kompogas processes described in the Otelfingen and Oetwil Am See case studies. The covered wastes reception pit can be seen in Figure 95, and the pre-treatment hall with a mobile shredding unit in Figure 96.
Figure 95 Wastes reception pit
The biowaste is moved by a digger into a shredder, then by conveyor through a ferrous metal removal system and passed over a sieve. Particles less than 50mm (in two dimensions fall through and are then loaded into the intermediate storage bunker. Oversize particles are reloaded into the shredder and go through the cycle again. Once loaded into the intermediate storage bunker, the process is automatic.
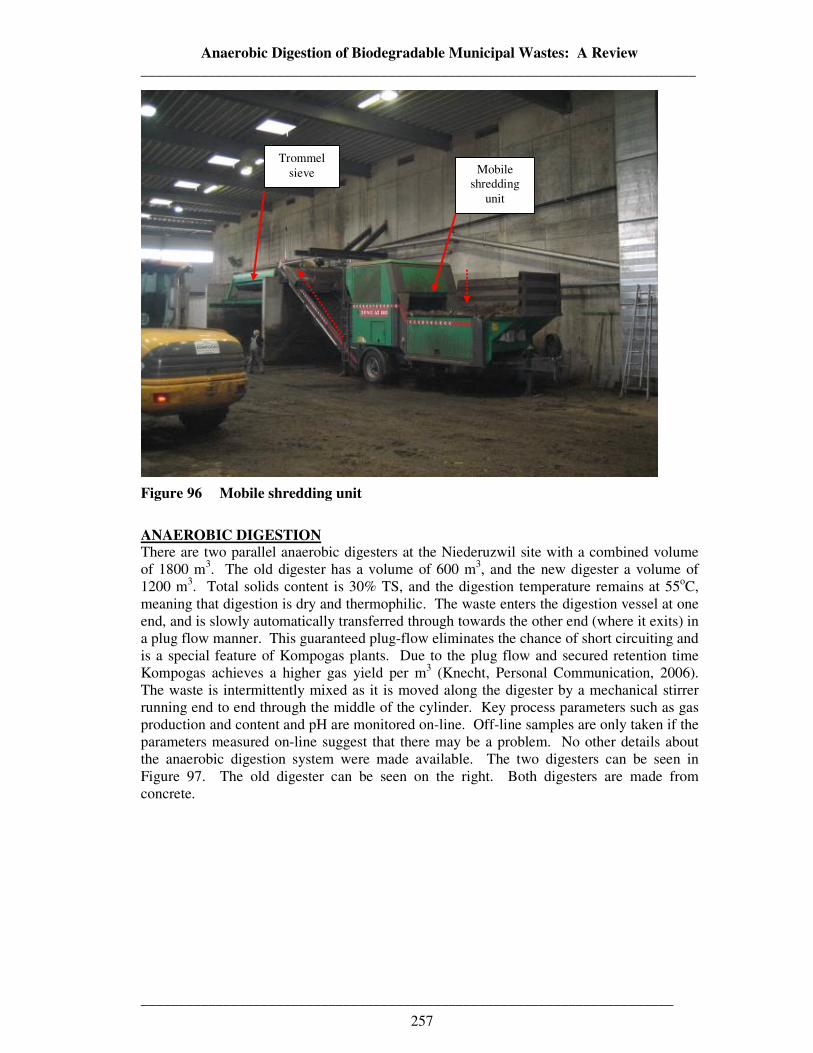
Anaerobic Digestion of Biodegradable Municipal Wastes: A Review __________________________________________________________________________
_______________________________________________________________________
257
Figure 96 Mobile shredding unit
ANAEROBIC DIGESTION There are two parallel anaerobic digesters at the Niederuzwil site with a combined volume of 1800 m3. The old digester has a volume of 600 m3, and the new digester a volume of 1200 m3. Total solids content is 30% TS, and the digestion temperature remains at 55oC, meaning that digestion is dry and thermophilic. The waste enters the digestion vessel at one end, and is slowly automatically transferred through towards the other end (where it exits) in a plug flow manner. This guaranteed plug-flow eliminates the chance of short circuiting and is a special feature of Kompogas plants. Due to the plug flow and secured retention time Kompogas achieves a higher gas yield per m3 (Knecht, Personal Communication, 2006). The waste is intermittently mixed as it is moved along the digester by a mechanical stirrer running end to end through the middle of the cylinder. Key process parameters such as gas production and content and pH are monitored on-line. Off-line samples are only taken if the parameters measured on-line suggest that there may be a problem. No other details about the anaerobic digestion system were made available. The two digesters can be seen in Figure 97. The old digester can be seen on the right. Both digesters are made from concrete.
Trommel sieve Mobile
shredding unit

Anaerobic Digestion of Biodegradable Municipal Wastes: A Review __________________________________________________________________________
_______________________________________________________________________
258
Figure 97 Two anaerobic digesters at Niederuzwil
POST AD TREATMENT AND DIGESTATE UTILISATION Approximately 7000 – 9000 tonnes of digestate is produced per year. Depending on the quality grading and the local requirements and markets the composted digestate can be either sold for horticulture (high income), sold to farmers (low income), given to farmers (no income but free removal), sold to the public (high or low income depending on grade), given to the public (no income but free removal) or sold to biomass-based CHP plants (low income). At the Niederuzwil site, as with other Kompogas sites, digestate is de-watered in screw presses (Figure 98), composted indoors in composting bays for around 2 – 3 weeks (Figure 99), and then composted outdoors for a further 3 – 4 weeks. As with other sites a proportion of the process liquid is re-circulated, and the rest is picked up from the site by farmers for land application as a fertiliser. Usual post-AD post composting treatment involves wind-sifting to remove plastic contaminants and grading according to particle size. The coarsest fraction, consisting mainly of woody matter, is not wind-sifted, as it is usually sold or given to biomass-based CHP schemes or to incinerators. In the winter, a lot of this material is kept to ‘bulk up’ the incoming waste, which contains less garden waste and has a higher water content than in the other seasons. There are various uses for the various grades of solid digestate/compost, ranging from selling the highest grade (Figure 100), selling the medium grade to the public (see Figure 101 and Figure 102 for prices) or having farmers pick it up (for free or for a fee, depending on the grade). The exact grade that the compost/soil improver is upgraded to depends on the orders or contracts that the individual plant has, which depend very much on local conditions. Both solid compost and liquid fertilisers are continuously monitored for quality, and meet the requirements of the Swiss Organic Farmers Regulations.
Biogas utilisation
units
Old anaerobic digester
New anaerobic digester
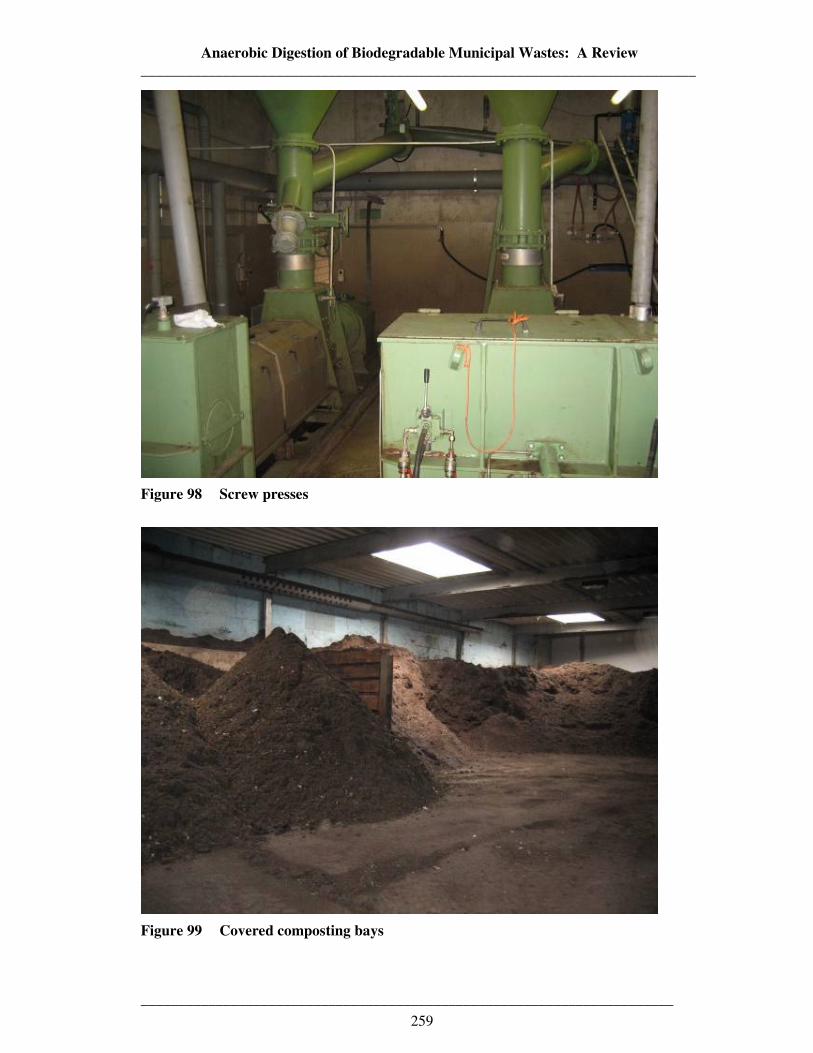
Anaerobic Digestion of Biodegradable Municipal Wastes: A Review __________________________________________________________________________
_______________________________________________________________________
259
Figure 98 Screw presses
Figure 99 Covered composting bays
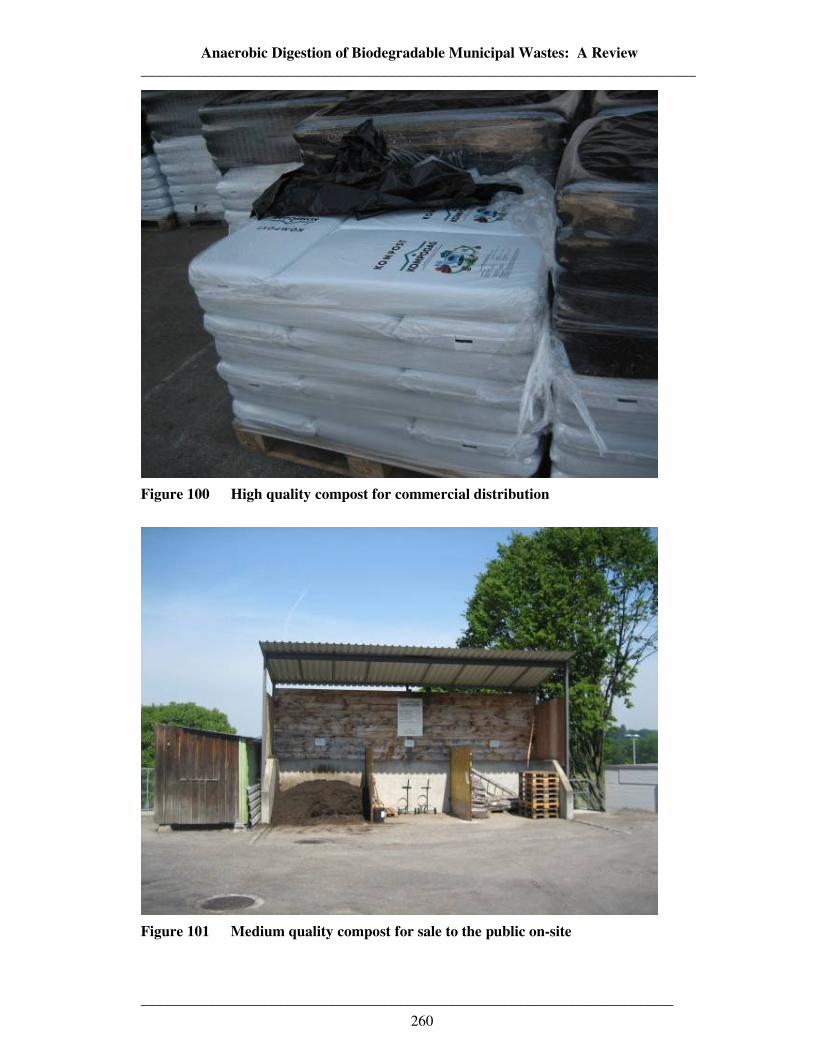
Anaerobic Digestion of Biodegradable Municipal Wastes: A Review __________________________________________________________________________
_______________________________________________________________________
260
Figure 100 High quality compost for commercial distribution
Figure 101 Medium quality compost for sale to the public on-site
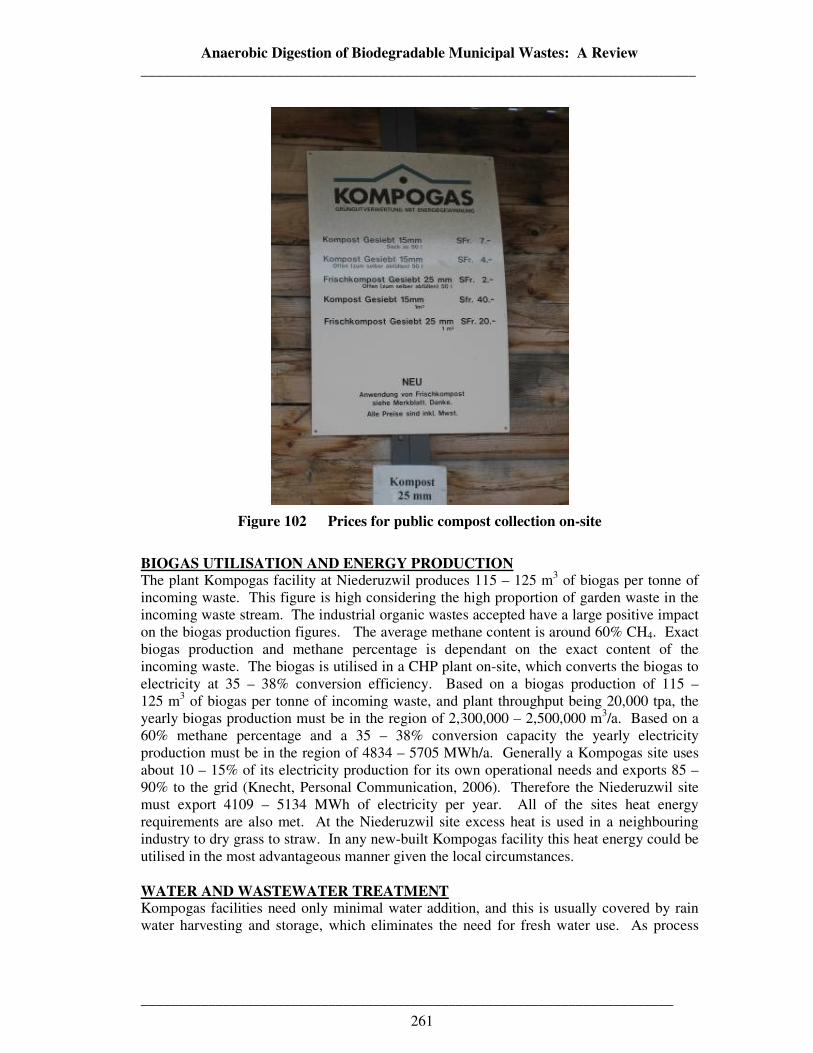
Anaerobic Digestion of Biodegradable Municipal Wastes: A Review __________________________________________________________________________
_______________________________________________________________________
261
Figure 102 Prices for public compost collection on-site
BIOGAS UTILISATION AND ENERGY PRODUCTION The plant Kompogas facility at Niederuzwil produces 115 – 125 m3 of biogas per tonne of incoming waste. This figure is high considering the high proportion of garden waste in the incoming waste stream. The industrial organic wastes accepted have a large positive impact on the biogas production figures. The average methane content is around 60% CH4. Exact biogas production and methane percentage is dependant on the exact content of the incoming waste. The biogas is utilised in a CHP plant on-site, which converts the biogas to electricity at 35 – 38% conversion efficiency. Based on a biogas production of 115 – 125 m3 of biogas per tonne of incoming waste, and plant throughput being 20,000 tpa, the yearly biogas production must be in the region of 2,300,000 – 2,500,000 m3/a. Based on a 60% methane percentage and a 35 – 38% conversion capacity the yearly electricity production must be in the region of 4834 – 5705 MWh/a. Generally a Kompogas site uses about 10 – 15% of its electricity production for its own operational needs and exports 85 – 90% to the grid (Knecht, Personal Communication, 2006). Therefore the Niederuzwil site must export 4109 – 5134 MWh of electricity per year. All of the sites heat energy requirements are also met. At the Niederuzwil site excess heat is used in a neighbouring industry to dry grass to straw. In any new-built Kompogas facility this heat energy could be utilised in the most advantageous manner given the local circumstances. WATER AND WASTEWATER TREATMENT Kompogas facilities need only minimal water addition, and this is usually covered by rain water harvesting and storage, which eliminates the need for fresh water use. As process
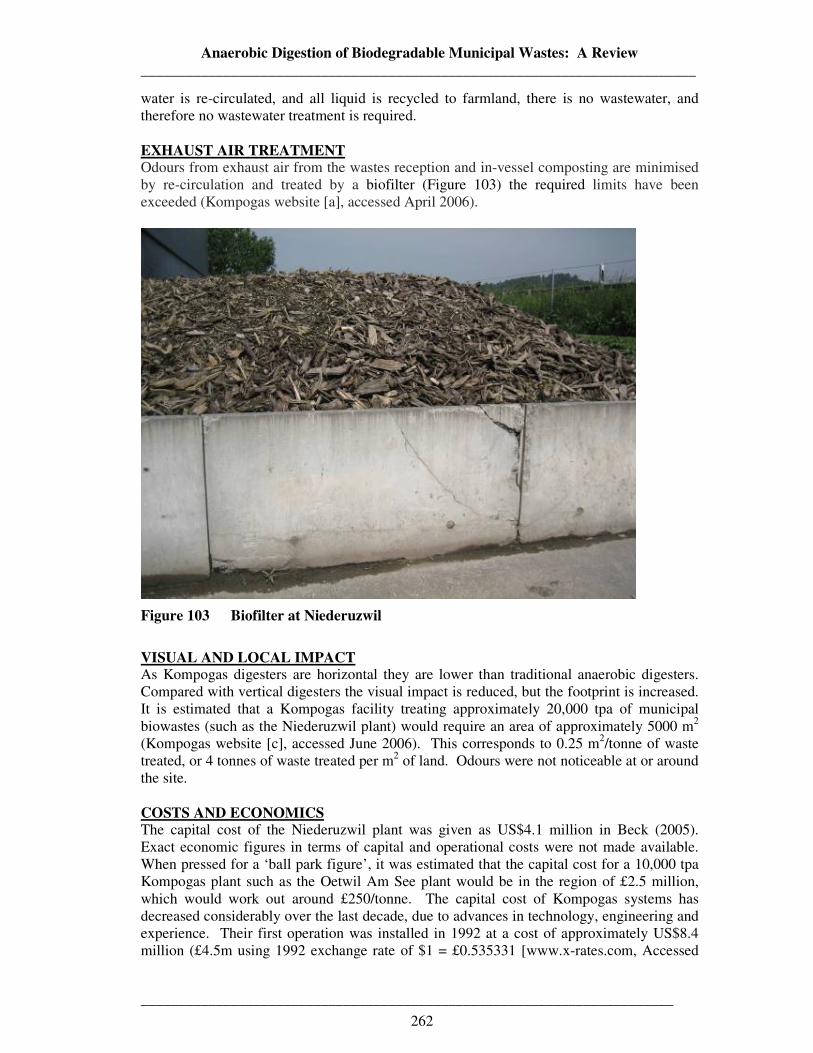
Anaerobic Digestion of Biodegradable Municipal Wastes: A Review __________________________________________________________________________
_______________________________________________________________________
262
water is re-circulated, and all liquid is recycled to farmland, there is no wastewater, and therefore no wastewater treatment is required. EXHAUST AIR TREATMENT Odours from exhaust air from the wastes reception and in-vessel composting are minimised by re-circulation and treated by a biofilter (Figure 103) the required limits have been exceeded (Kompogas website [a], accessed April 2006).
Figure 103 Biofilter at Niederuzwil
VISUAL AND LOCAL IMPACT As Kompogas digesters are horizontal they are lower than traditional anaerobic digesters. Compared with vertical digesters the visual impact is reduced, but the footprint is increased. It is estimated that a Kompogas facility treating approximately 20,000 tpa of municipal biowastes (such as the Niederuzwil plant) would require an area of approximately 5000 m2 (Kompogas website [c], accessed June 2006). This corresponds to 0.25 m2/tonne of waste treated, or 4 tonnes of waste treated per m2 of land. Odours were not noticeable at or around the site. COSTS AND ECONOMICS The capital cost of the Niederuzwil plant was given as US$4.1 million in Beck (2005). Exact economic figures in terms of capital and operational costs were not made available. When pressed for a ‘ball park figure’, it was estimated that the capital cost for a 10,000 tpa Kompogas plant such as the Oetwil Am See plant would be in the region of £2.5 million, which would work out around £250/tonne. The capital cost of Kompogas systems has decreased considerably over the last decade, due to advances in technology, engineering and experience. Their first operation was installed in 1992 at a cost of approximately US$8.4 million (£4.5m using 1992 exchange rate of $1 = £0.535331 [www.x-rates.com, Accessed
Anaerobic Digestion of Biodegradable Municipal Wastes: A Review __________________________________________________________________________
_______________________________________________________________________
263
April 2006]) with an annual processing capacity of 11,000 tonnes and an installed cost of US$764/tonne (£409/t). Using more refined engineering practices, the plant in Niederuzwil was built for an installed cost of US$388/tonne (£208/t) (Beck 2004). On an installed cost/tonne, this experience reflects a reduction in capital expense of nearly 50%. Capital costs quoted here do not include exhaust air treatment. The Niederuzwil site exports approximately 4109 – 5134 MWh of electricity per year. At current UK average prices this would be worth £441,718 - £551,905, based on £107.50/MWh (NFPA website, accessed September 2006). As an alternative or in combination, the biogas can be upgraded to natural gas standards for the CO2-neutral operation of vehicles or it can be fed into the natural gas network. If biogas is upgraded and used as a transport fuel, Kompogas quote figures of the biogas from 1 tonne of kitchen waste corresponding to around 70 litres of petrol (Kompogas website, accessed April 2006, see also Section 2.6.1.8). Using these figures, provided the infrastructure was in place, petrol savings could amount to £50/tonne of waste treated (based on £0.90/litre). For a 20,000 tpa site such as Niederuzwil the income from petrol savings alone would amount to approximately £1,260,000/a assuming a petrol price of £0.90/litre. This figure would rise and fall with petrol prices, and does not consider infrastructure costs or the impact of the costs of finance and taxes. CHALLENGES AND DISCUSSION All of the incoming waste stream (except contaminants) are diverted from landfill. Outputs are high quality compost, liquid fertilisers, and energy. The Kompogas systems can be considered a reliable and proven option for localised biowastes treatment. Points common to all three Kompogas facilities visited are discussed further in Section 5.1.5.4.
Anaerobic Digestion of Biodegradable Municipal Wastes: A Review __________________________________________________________________________
_______________________________________________________________________
264
5.1.5.3 Otelfingen (Kompogas) Biowastes Treatment Plant INTRODUCTION The Kompogas facility at Otelfingen in the greater Zurich region (Switzerland) (Figure 104), started up in 1996, has a capacity of 12,500 tpa of biowaste. The plant treats 10,000 tpa of source separated municipal biowaste from approximately 100,000 people in the municipality of Otelfingen (Zurich, Switzerland). The plant also receives 2500 tpa of food waste from Migros (Switzerland’s biggest supermarket chain). This means that the municipal biowaste to industrial/commercial food waste ratio is the 80:20 that is standard for most Kompogas systems. Biowaste has been separately collected from households in the Zurich region since the late 1980s, and contains kitchen, garden and yard waste. Biowaste is collected from households once weekly and delivered to the facility. At Otelfingen, the biogas is used not only to produce electrical and thermal energy, but is also upgraded and used as a vehicle fuel. Kompogas company vehicles use this fuel, as does a large proportion of the Migros fleet. The biogas fuel is also available to the public. The Otelfingen site is a BOO (build, own and operate) facility, in which Kompogas were fully responsible for the planning, construction and ongoing operation of the plant. Due in part to its proximity to the airport the Otelfingen site is a Kompogas ‘showpiece’ site, which attracts many visitors. The plant is attractive, freshly painted, entirely covered, and well landscaped. As well as the public compost pick-up point and the biogas filling station, the site was geared towards receiving visitors, as described below. VISITOR ATTRACTIONS AT OTELFINGEN As mentioned above Otelfingen serves as a PR focal point for Kompogas. The site receives many visits from schools, universities and other interested parties. The interactive visitor centre is impressive (Figure 105, Figure 106 and Figure 107) with displays demonstrating the full nutrient and organic cycles and how the implementation of AD systems can ‘close the loop’. The visitor centre also contains a meeting centre, surrounded by a go-kart track, in which the go-karts are powered by biogas. The site also has a demonstration greenhouse (Figure 106), in which vegetables are grown direct from lumps of digestate surrounded by sand (Figure 107). The process water was used direct to grow plants. Everything in the greenhouse, and even its siting a few metres from the plant had a symbolic message. The vegetables growing direct from the digestate proved that the solid output was indeed beneficial, a ‘product’ and no longer a waste. The goats and fish fed on products from the greenhouse included animal production in the loop. There was even a symbolic link between the kart-track and the greenhouse to imply that the plants could use the CO2 produced by the carts. Also on site were fishponds and attractive gardens all fertilised with Kompogas compost.
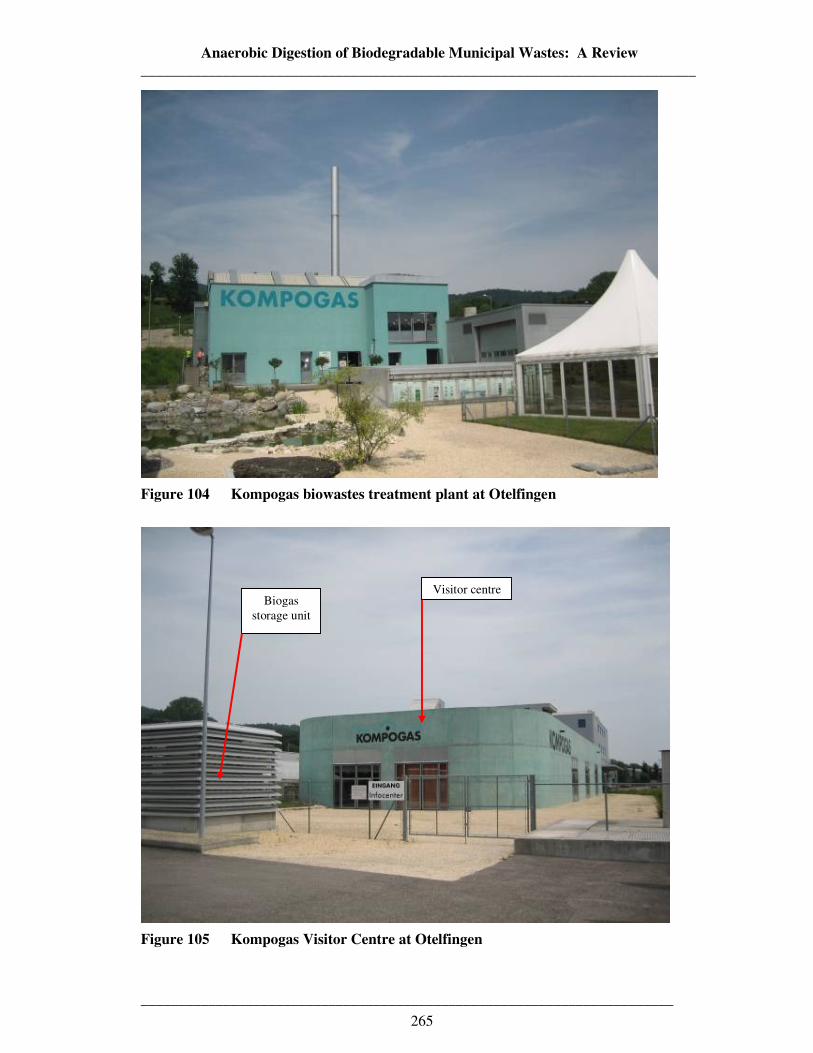
Anaerobic Digestion of Biodegradable Municipal Wastes: A Review __________________________________________________________________________
_______________________________________________________________________
265
Figure 104 Kompogas biowastes treatment plant at Otelfingen
Figure 105 Kompogas Visitor Centre at Otelfingen
Biogas storage unit
Visitor centre
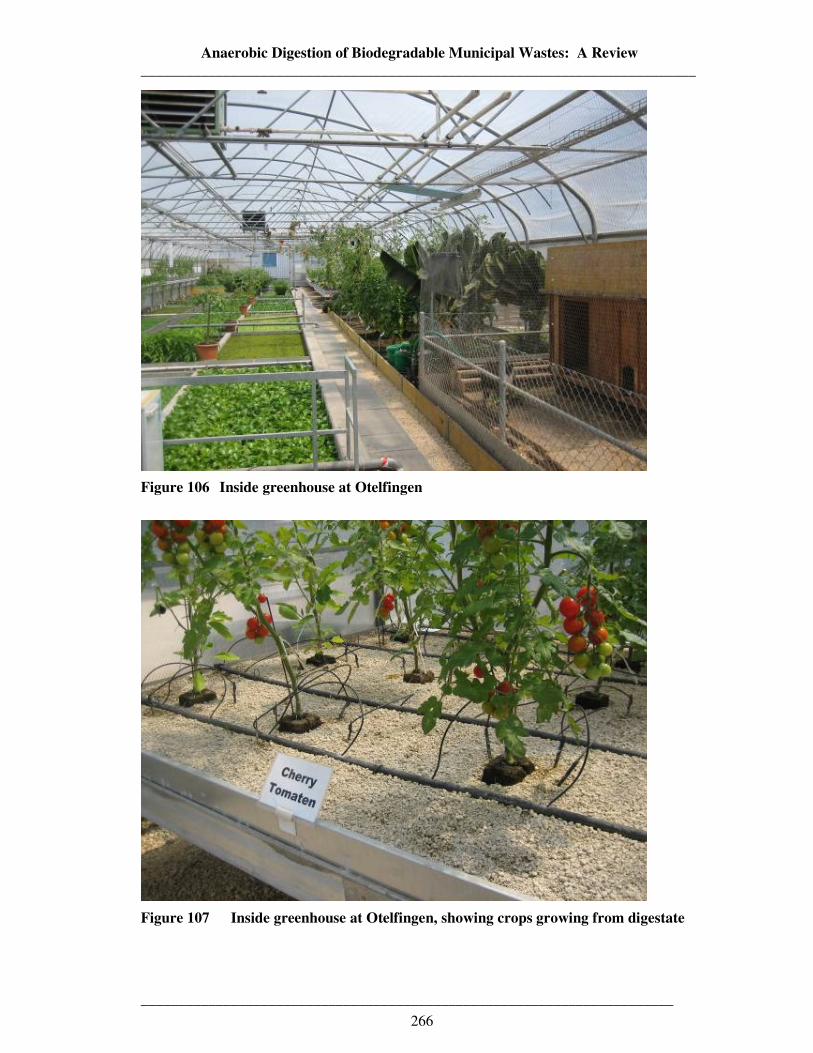
Anaerobic Digestion of Biodegradable Municipal Wastes: A Review __________________________________________________________________________
_______________________________________________________________________
266
Figure 106 Inside greenhouse at Otelfingen
Figure 107 Inside greenhouse at Otelfingen, showing crops growing from digestate
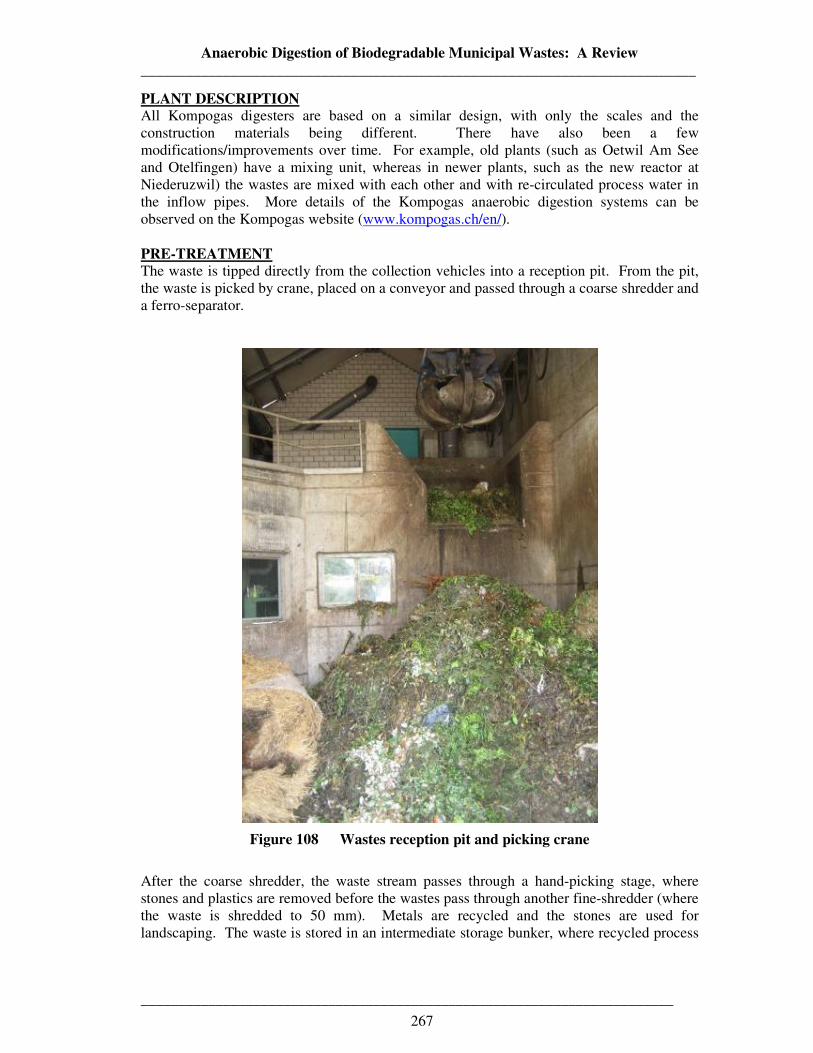
Anaerobic Digestion of Biodegradable Municipal Wastes: A Review __________________________________________________________________________
_______________________________________________________________________
267
PLANT DESCRIPTION All Kompogas digesters are based on a similar design, with only the scales and the construction materials being different. There have also been a few modifications/improvements over time. For example, old plants (such as Oetwil Am See and Otelfingen) have a mixing unit, whereas in newer plants, such as the new reactor at Niederuzwil) the wastes are mixed with each other and with re-circulated process water in the inflow pipes. More details of the Kompogas anaerobic digestion systems can be observed on the Kompogas website (www.kompogas.ch/en/). PRE-TREATMENT The waste is tipped directly from the collection vehicles into a reception pit. From the pit, the waste is picked by crane, placed on a conveyor and passed through a coarse shredder and a ferro-separator.
Figure 108 Wastes reception pit and picking crane
After the coarse shredder, the waste stream passes through a hand-picking stage, where stones and plastics are removed before the wastes pass through another fine-shredder (where the waste is shredded to 50 mm). Metals are recycled and the stones are used for landscaping. The waste is stored in an intermediate storage bunker, where recycled process
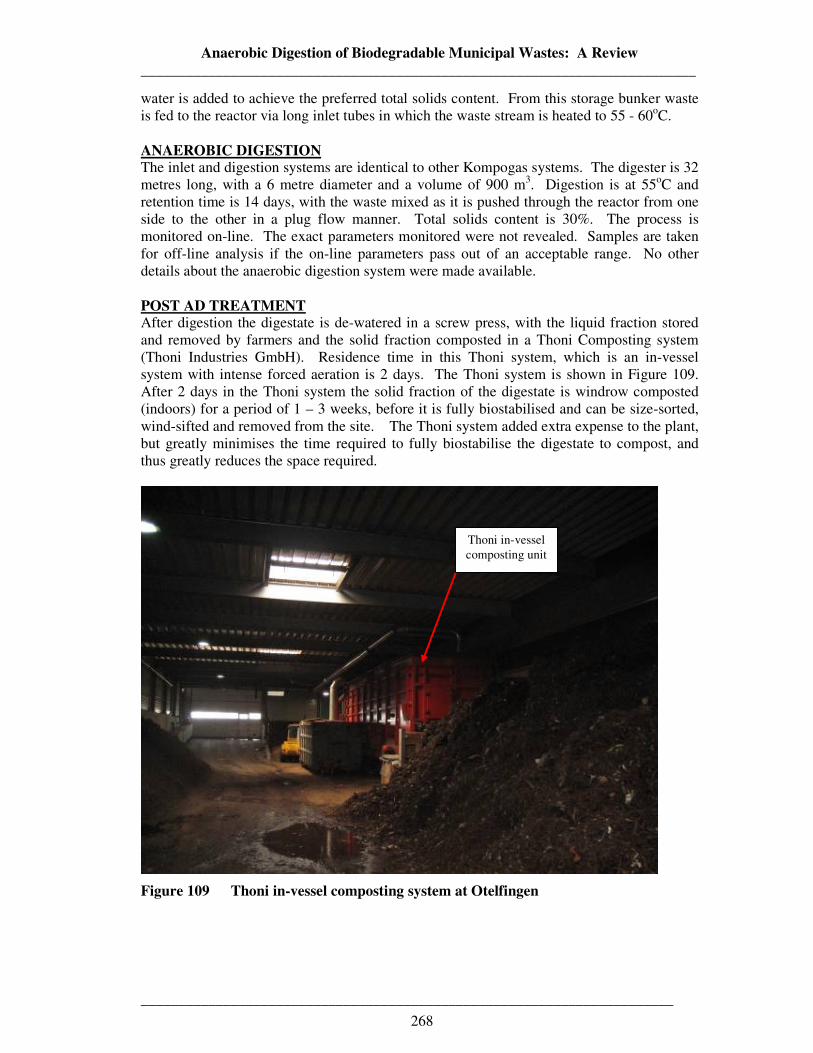
Anaerobic Digestion of Biodegradable Municipal Wastes: A Review __________________________________________________________________________
_______________________________________________________________________
268
water is added to achieve the preferred total solids content. From this storage bunker waste is fed to the reactor via long inlet tubes in which the waste stream is heated to 55 - 60oC. ANAEROBIC DIGESTION The inlet and digestion systems are identical to other Kompogas systems. The digester is 32 metres long, with a 6 metre diameter and a volume of 900 m3. Digestion is at 55oC and retention time is 14 days, with the waste mixed as it is pushed through the reactor from one side to the other in a plug flow manner. Total solids content is 30%. The process is monitored on-line. The exact parameters monitored were not revealed. Samples are taken for off-line analysis if the on-line parameters pass out of an acceptable range. No other details about the anaerobic digestion system were made available. POST AD TREATMENT After digestion the digestate is de-watered in a screw press, with the liquid fraction stored and removed by farmers and the solid fraction composted in a Thoni Composting system (Thoni Industries GmbH). Residence time in this Thoni system, which is an in-vessel system with intense forced aeration is 2 days. The Thoni system is shown in Figure 109. After 2 days in the Thoni system the solid fraction of the digestate is windrow composted (indoors) for a period of 1 – 3 weeks, before it is fully biostabilised and can be size-sorted, wind-sifted and removed from the site. The Thoni system added extra expense to the plant, but greatly minimises the time required to fully biostabilise the digestate to compost, and thus greatly reduces the space required.
Figure 109 Thoni in-vessel composting system at Otelfingen
Thoni in-vessel composting unit

Anaerobic Digestion of Biodegradable Municipal Wastes: A Review __________________________________________________________________________
_______________________________________________________________________
269
DIGESTATE After post-AD composting, the digestate is graded into different grades, according to size. Those grades that will be sold or used agriculturally pass through a wind-sifter to remove plastics and therefore enhance quality. After size separation, the bulky fraction of the digestate (which consists mainly of wood, bark and plastics) is sold to local CHP plants. In this case the local CHP plant that receives the bulky digestate is the local prison. The best quality grades are bagged and sold to horticultural industries and private gardeners, while the intermediate grades are removed from the site by local farmers. There is also point outside the site gates where the public can come and pick up medium grade digestate for their own personal use (Figure 110).
Figure 110 Public compost pick-up point at Otelfingen
At Otelfingen (unlike at other sites where the compost attracts a revenue) this compost can be picked up for free. At Otelfingen the majority of the digestate is picked up by local farmers (for free, but at their own expense) and spread to land. The final compost (one of many grades) is shown in Figure 111.
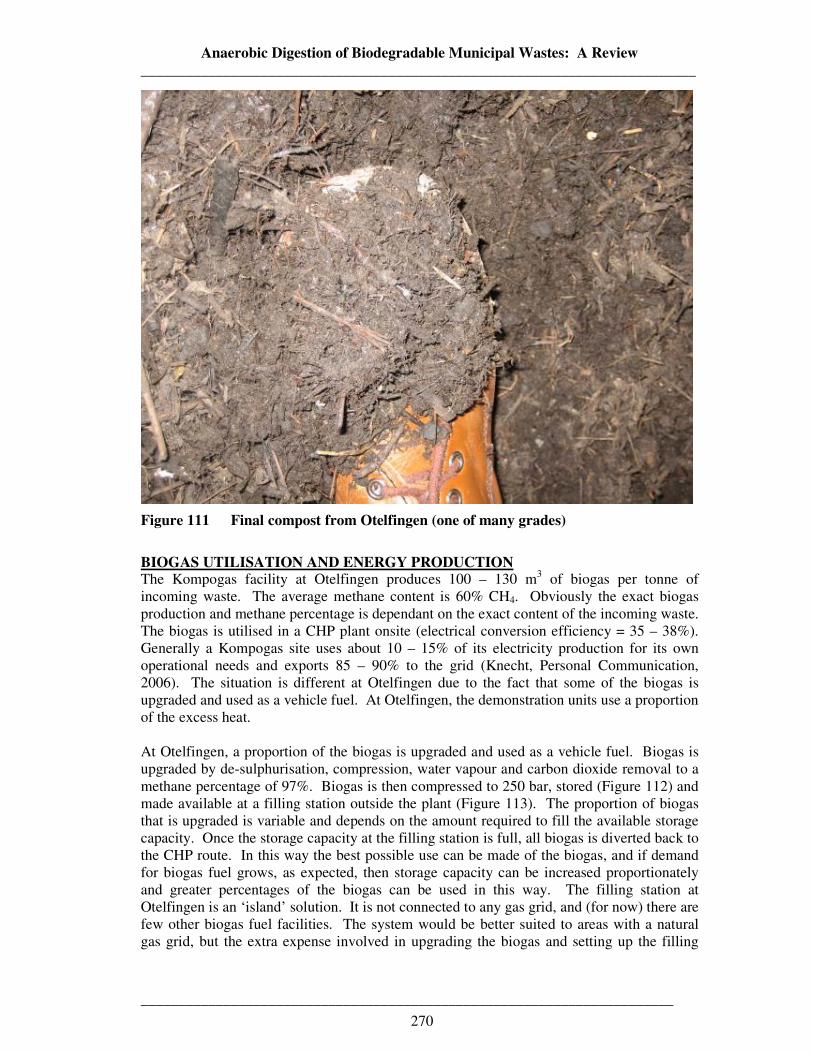
Anaerobic Digestion of Biodegradable Municipal Wastes: A Review __________________________________________________________________________
_______________________________________________________________________
270
Figure 111 Final compost from Otelfingen (one of many grades)
BIOGAS UTILISATION AND ENERGY PRODUCTION The Kompogas facility at Otelfingen produces 100 – 130 m3 of biogas per tonne of incoming waste. The average methane content is 60% CH4. Obviously the exact biogas production and methane percentage is dependant on the exact content of the incoming waste. The biogas is utilised in a CHP plant onsite (electrical conversion efficiency = 35 – 38%). Generally a Kompogas site uses about 10 – 15% of its electricity production for its own operational needs and exports 85 – 90% to the grid (Knecht, Personal Communication, 2006). The situation is different at Otelfingen due to the fact that some of the biogas is upgraded and used as a vehicle fuel. At Otelfingen, the demonstration units use a proportion of the excess heat. At Otelfingen, a proportion of the biogas is upgraded and used as a vehicle fuel. Biogas is upgraded by de-sulphurisation, compression, water vapour and carbon dioxide removal to a methane percentage of 97%. Biogas is then compressed to 250 bar, stored (Figure 112) and made available at a filling station outside the plant (Figure 113). The proportion of biogas that is upgraded is variable and depends on the amount required to fill the available storage capacity. Once the storage capacity at the filling station is full, all biogas is diverted back to the CHP route. In this way the best possible use can be made of the biogas, and if demand for biogas fuel grows, as expected, then storage capacity can be increased proportionately and greater percentages of the biogas can be used in this way. The filling station at Otelfingen is an ‘island’ solution. It is not connected to any gas grid, and (for now) there are few other biogas fuel facilities. The system would be better suited to areas with a natural gas grid, but the extra expense involved in upgrading the biogas and setting up the filling
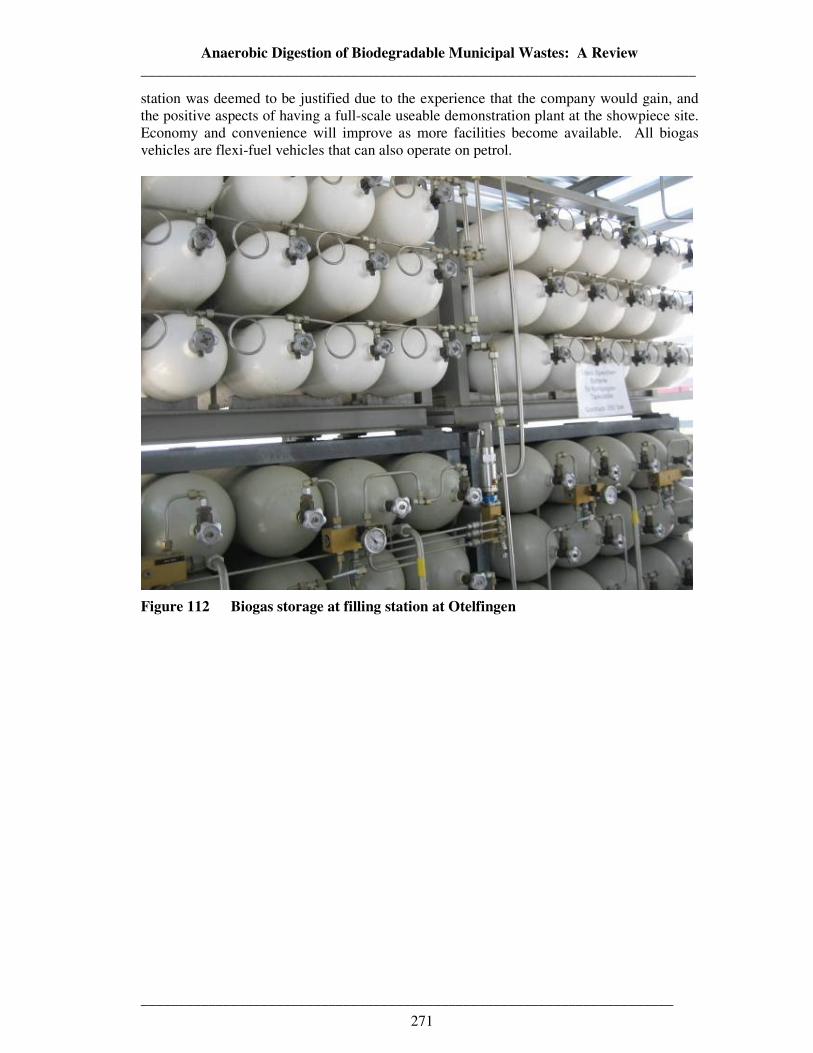
Anaerobic Digestion of Biodegradable Municipal Wastes: A Review __________________________________________________________________________
_______________________________________________________________________
271
station was deemed to be justified due to the experience that the company would gain, and the positive aspects of having a full-scale useable demonstration plant at the showpiece site. Economy and convenience will improve as more facilities become available. All biogas vehicles are flexi-fuel vehicles that can also operate on petrol.
Figure 112 Biogas storage at filling station at Otelfingen
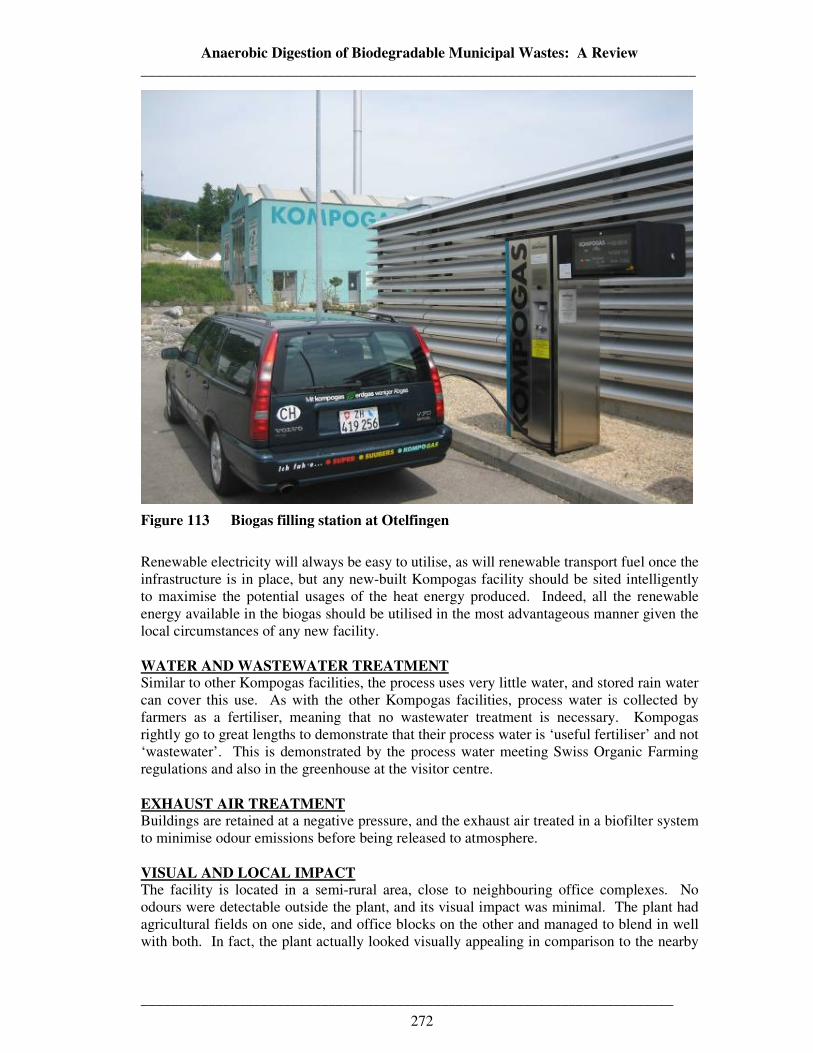
Anaerobic Digestion of Biodegradable Municipal Wastes: A Review __________________________________________________________________________
_______________________________________________________________________
272
Figure 113 Biogas filling station at Otelfingen
Renewable electricity will always be easy to utilise, as will renewable transport fuel once the infrastructure is in place, but any new-built Kompogas facility should be sited intelligently to maximise the potential usages of the heat energy produced. Indeed, all the renewable energy available in the biogas should be utilised in the most advantageous manner given the local circumstances of any new facility. WATER AND WASTEWATER TREATMENT Similar to other Kompogas facilities, the process uses very little water, and stored rain water can cover this use. As with the other Kompogas facilities, process water is collected by farmers as a fertiliser, meaning that no wastewater treatment is necessary. Kompogas rightly go to great lengths to demonstrate that their process water is ‘useful fertiliser’ and not ‘wastewater’. This is demonstrated by the process water meeting Swiss Organic Farming regulations and also in the greenhouse at the visitor centre. EXHAUST AIR TREATMENT Buildings are retained at a negative pressure, and the exhaust air treated in a biofilter system to minimise odour emissions before being released to atmosphere. VISUAL AND LOCAL IMPACT The facility is located in a semi-rural area, close to neighbouring office complexes. No odours were detectable outside the plant, and its visual impact was minimal. The plant had agricultural fields on one side, and office blocks on the other and managed to blend in well with both. In fact, the plant actually looked visually appealing in comparison to the nearby
Anaerobic Digestion of Biodegradable Municipal Wastes: A Review __________________________________________________________________________
_______________________________________________________________________
273
office blocks. With the entire process covered in an attractive freshly painted building, the go-kart track, greenhouses, fishponds and the attractive visitor centre the site was more like a tourist attraction than a wastes treatment plant. COSTS AND ECONOMICS No costs were given for the site at Otelfingen. Were it not for the extra demonstration features the plant would have cost something similar to other Kompogas plants of the same scale. The capital cost was given as US$5.35 million in Beck (2004). This would work out at €4.17 million (or £3.45 million) using 1996 exchange rates. The extra features for demonstration, such as the visitor centre, the greenhouse and the kart-track will have increased costs considerably. The biogas filling station would not be economic at present. As an investment for the future it appears sound, as the advantage (and experience) of having the demonstration plant in place will give Kompogas a significant advantage in the future, when oil prices dictate that biogas as a transport fuel will be economic. CHALLENGES AND DISCUSSION Discussions and conclusions common to all three Kompogas case studies will be discussed in Section 5.1.5.4.
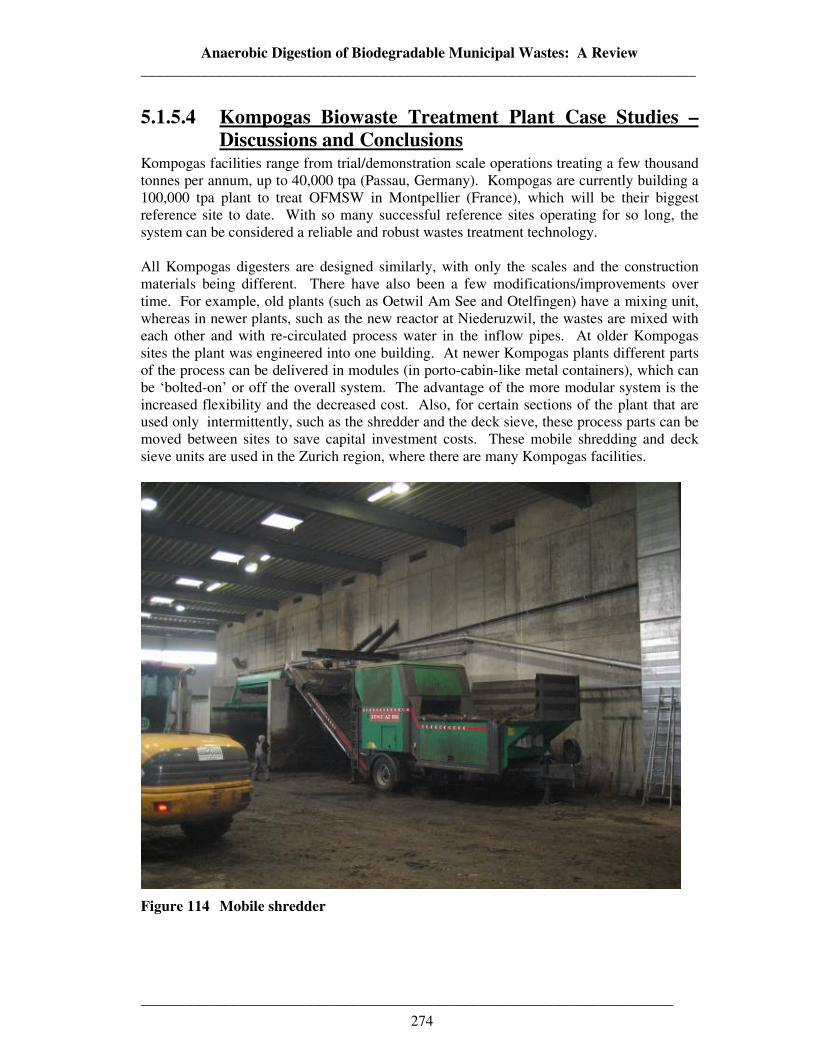
Anaerobic Digestion of Biodegradable Municipal Wastes: A Review __________________________________________________________________________
_______________________________________________________________________
274
5.1.5.4 Kompogas Biowaste Treatment Plant Case Studies – Discussions and Conclusions
Kompogas facilities range from trial/demonstration scale operations treating a few thousand tonnes per annum, up to 40,000 tpa (Passau, Germany). Kompogas are currently building a 100,000 tpa plant to treat OFMSW in Montpellier (France), which will be their biggest reference site to date. With so many successful reference sites operating for so long, the system can be considered a reliable and robust wastes treatment technology. All Kompogas digesters are designed similarly, with only the scales and the construction materials being different. There have also been a few modifications/improvements over time. For example, old plants (such as Oetwil Am See and Otelfingen) have a mixing unit, whereas in newer plants, such as the new reactor at Niederuzwil, the wastes are mixed with each other and with re-circulated process water in the inflow pipes. At older Kompogas sites the plant was engineered into one building. At newer Kompogas plants different parts of the process can be delivered in modules (in porto-cabin-like metal containers), which can be ‘bolted-on’ or off the overall system. The advantage of the more modular system is the increased flexibility and the decreased cost. Also, for certain sections of the plant that are used only intermittently, such as the shredder and the deck sieve, these process parts can be moved between sites to save capital investment costs. These mobile shredding and deck sieve units are used in the Zurich region, where there are many Kompogas facilities.
Figure 114 Mobile shredder
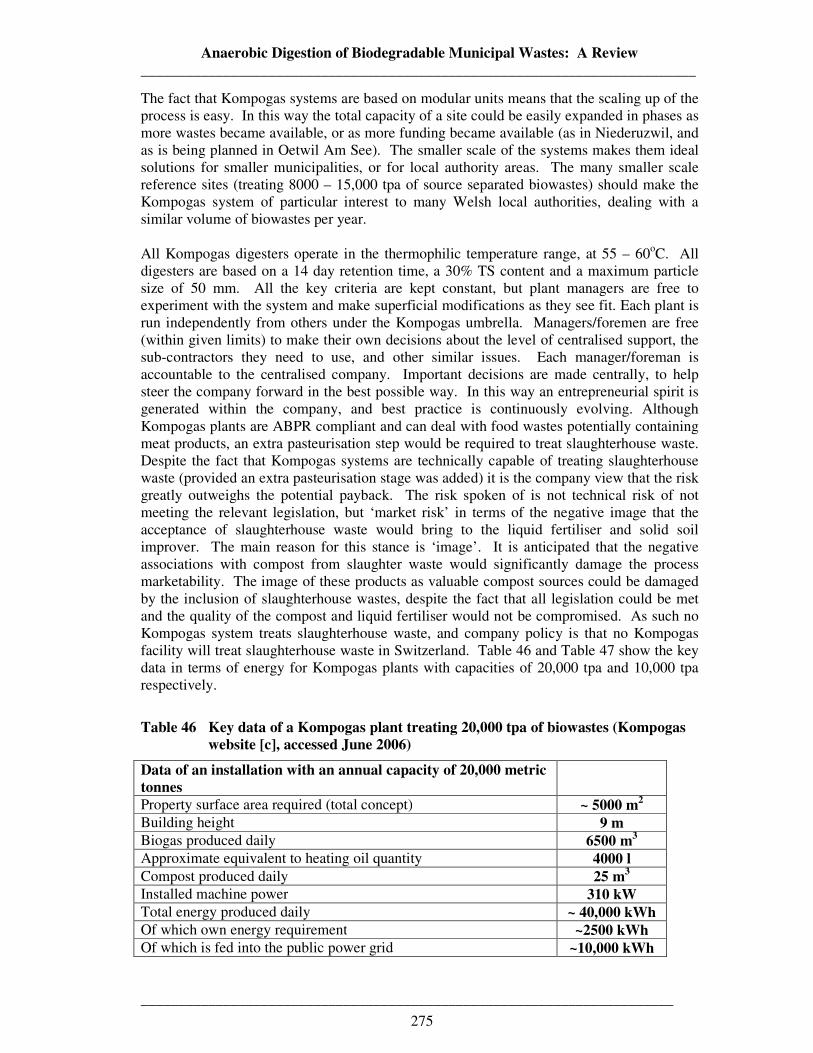
Anaerobic Digestion of Biodegradable Municipal Wastes: A Review __________________________________________________________________________
_______________________________________________________________________
275
The fact that Kompogas systems are based on modular units means that the scaling up of the process is easy. In this way the total capacity of a site could be easily expanded in phases as more wastes became available, or as more funding became available (as in Niederuzwil, and as is being planned in Oetwil Am See). The smaller scale of the systems makes them ideal solutions for smaller municipalities, or for local authority areas. The many smaller scale reference sites (treating 8000 – 15,000 tpa of source separated biowastes) should make the Kompogas system of particular interest to many Welsh local authorities, dealing with a similar volume of biowastes per year. All Kompogas digesters operate in the thermophilic temperature range, at 55 – 60oC. All digesters are based on a 14 day retention time, a 30% TS content and a maximum particle size of 50 mm. All the key criteria are kept constant, but plant managers are free to experiment with the system and make superficial modifications as they see fit. Each plant is run independently from others under the Kompogas umbrella. Managers/foremen are free (within given limits) to make their own decisions about the level of centralised support, the sub-contractors they need to use, and other similar issues. Each manager/foreman is accountable to the centralised company. Important decisions are made centrally, to help steer the company forward in the best possible way. In this way an entrepreneurial spirit is generated within the company, and best practice is continuously evolving. Although Kompogas plants are ABPR compliant and can deal with food wastes potentially containing meat products, an extra pasteurisation step would be required to treat slaughterhouse waste. Despite the fact that Kompogas systems are technically capable of treating slaughterhouse waste (provided an extra pasteurisation stage was added) it is the company view that the risk greatly outweighs the potential payback. The risk spoken of is not technical risk of not meeting the relevant legislation, but ‘market risk’ in terms of the negative image that the acceptance of slaughterhouse waste would bring to the liquid fertiliser and solid soil improver. The main reason for this stance is ‘image’. It is anticipated that the negative associations with compost from slaughter waste would significantly damage the process marketability. The image of these products as valuable compost sources could be damaged by the inclusion of slaughterhouse wastes, despite the fact that all legislation could be met and the quality of the compost and liquid fertiliser would not be compromised. As such no Kompogas system treats slaughterhouse waste, and company policy is that no Kompogas facility will treat slaughterhouse waste in Switzerland. Table 46 and Table 47 show the key data in terms of energy for Kompogas plants with capacities of 20,000 tpa and 10,000 tpa respectively.
Table 46 Key data of a Kompogas plant treating 20,000 tpa of biowastes (Kompogas website [c], accessed June 2006)
Data of an installation with an annual capacity of 20,000 metric tonnes
Property surface area required (total concept) ~ 5000 m2 Building height 9 m Biogas produced daily 6500 m3 Approximate equivalent to heating oil quantity 4000 l Compost produced daily 25 m3 Installed machine power 310 kW Total energy produced daily ~ 40,000 kWh Of which own energy requirement ~2500 kWh Of which is fed into the public power grid ~10,000 kWh
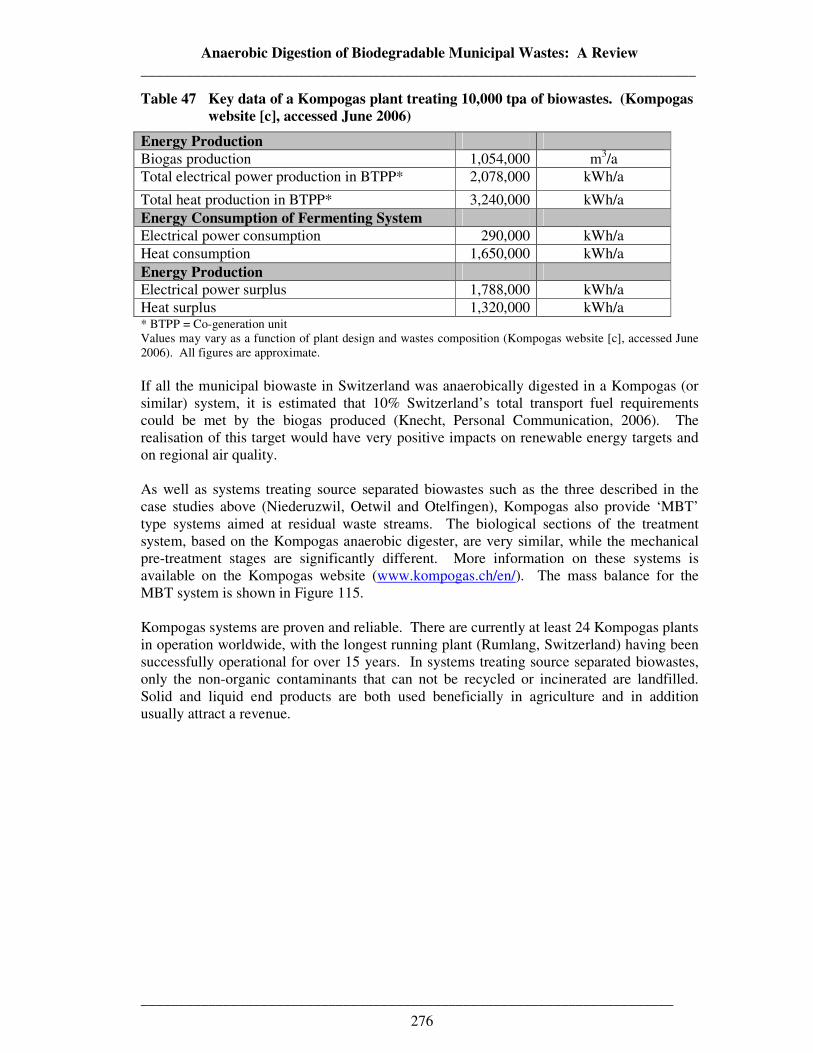
Anaerobic Digestion of Biodegradable Municipal Wastes: A Review __________________________________________________________________________
_______________________________________________________________________
276
Table 47 Key data of a Kompogas plant treating 10,000 tpa of biowastes. (Kompogas website [c], accessed June 2006)
Energy Production Biogas production 1,054,000 m3/a Total electrical power production in BTPP* 2,078,000 kWh/a
Total heat production in BTPP* 3,240,000 kWh/a Energy Consumption of Fermenting System Electrical power consumption 290,000 kWh/a Heat consumption 1,650,000 kWh/a Energy Production Electrical power surplus 1,788,000 kWh/a Heat surplus 1,320,000 kWh/a * BTPP = Co-generation unit Values may vary as a function of plant design and wastes composition (Kompogas website [c], accessed June 2006). All figures are approximate. If all the municipal biowaste in Switzerland was anaerobically digested in a Kompogas (or similar) system, it is estimated that 10% Switzerland’s total transport fuel requirements could be met by the biogas produced (Knecht, Personal Communication, 2006). The realisation of this target would have very positive impacts on renewable energy targets and on regional air quality. As well as systems treating source separated biowastes such as the three described in the case studies above (Niederuzwil, Oetwil and Otelfingen), Kompogas also provide ‘MBT’ type systems aimed at residual waste streams. The biological sections of the treatment system, based on the Kompogas anaerobic digester, are very similar, while the mechanical pre-treatment stages are significantly different. More information on these systems is available on the Kompogas website (www.kompogas.ch/en/). The mass balance for the MBT system is shown in Figure 115. Kompogas systems are proven and reliable. There are currently at least 24 Kompogas plants in operation worldwide, with the longest running plant (Rumlang, Switzerland) having been successfully operational for over 15 years. In systems treating source separated biowastes, only the non-organic contaminants that can not be recycled or incinerated are landfilled. Solid and liquid end products are both used beneficially in agriculture and in addition usually attract a revenue.

Anaerobic Digestion of Biodegradable Municipal Wastes: A Review __________________________________________________________________________
_______________________________________________________________________
277
Figure 115 Mass balance of Kompogas MBT systems, treating residual wastes (Kompogas website [c], accessed August 2006)
Anaerobic Digestion of Biodegradable Municipal Wastes: A Review __________________________________________________________________________
_______________________________________________________________________
278
5.1.6 Salzburg Siggerwiesen Wastes Treatment Site INTRODUCTION The SAB (Salzburger Abfallbeseitigung GmbH) waste treatment facility at Bergheim-Siggerwiesen contains a separate biowastes treatment facility. The anaerobic digester was built by OWS Dranco and commenced operation in 1993. The SAB waste treatment facility is a fully integrated waste management facility with many different waste streams treated in different treatment lines on the same site. The SAB site is owned by the Region of Salzburg, through the public corporation ‘Conservation Association of Greater Salzburg’, and treats the waste from the city of Salzburg (population 150,000) and 83 surrounding areas in Salzburgerland and adjacent Upper Austria. Municipal waste (from approximately 400,000 people) and commercial and industrial wastes (from over 3000 enterprises) are treated at one site (with a total area of 800,000 m2) by the following process lines:
• Recycling facility. • Hazardous wastes collection station, storage and treatment. • Windrow composting of garden waste. • Landfill site for non-recyclable residual substances. • Anaerobic digestion and composting of organic waste. On-site conversion and use
of electricity and heat from biogas. • MBT plant for residual wastes, from which:
• Recyclables are recovered. • High calorific non-recyclables are baled and sent by train to incinerator for
energy recovery. • Organic fraction is in-vessel composted.
Although this report will primarily focus on the biowaste stream, it is worth noting the integrated and well-planned nature of the site, and the regional waste management strategy as a whole. The MBT plant treating the residual waste stream, for which in-vessel composting is the biological process, was not visited but is briefly described at the end of the case study. There is also a wastewater treatment facility (population equivalent 680,000) on site (Figure 116). Sludge from this wastewater treatment site is anaerobically digested at the wastewater treatment plant (rather than co-digested with the source separated BMW) for volume reduction and biogas production. The remaining sludge (approximately 20,000 tpa) is then incinerated. The wastewater treatment site can be observed at the bottom of the photograph. In the top right is the landfill site, and the top left is the wastes reception facilities, the MBT facility, the hazardous waste treatment facilities and the biowaste treatment facility. The green anaerobic digester can be seen approximately two thirds up Figure 116 on the left. The MBT plant, in the top left of Figure 116, is shown in more detail in Figure 117.
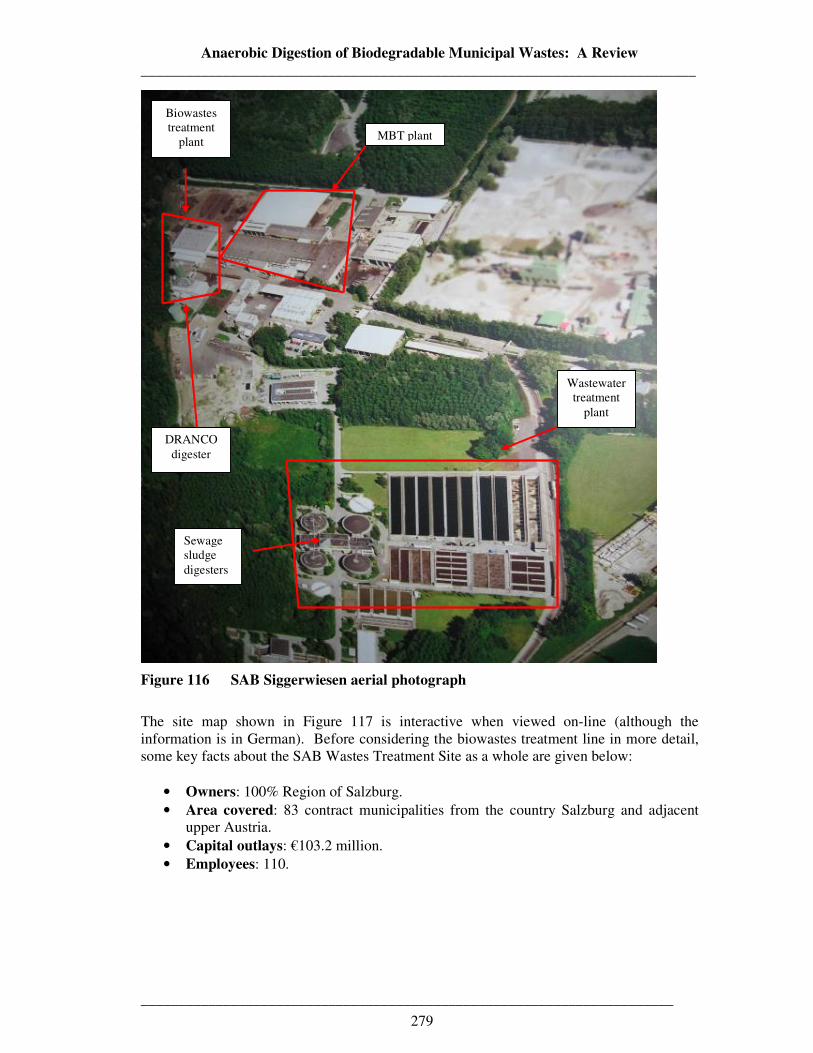
Anaerobic Digestion of Biodegradable Municipal Wastes: A Review __________________________________________________________________________
_______________________________________________________________________
279
Figure 116 SAB Siggerwiesen aerial photograph
The site map shown in Figure 117 is interactive when viewed on-line (although the information is in German). Before considering the biowastes treatment line in more detail, some key facts about the SAB Wastes Treatment Site as a whole are given below:
• Owners: 100% Region of Salzburg. • Area covered: 83 contract municipalities from the country Salzburg and adjacent
upper Austria. • Capital outlays: €103.2 million. • Employees: 110.
DRANCO digester
Sewage sludge digesters
Wastewater treatment
plant
MBT plant
Biowastes treatment
plant
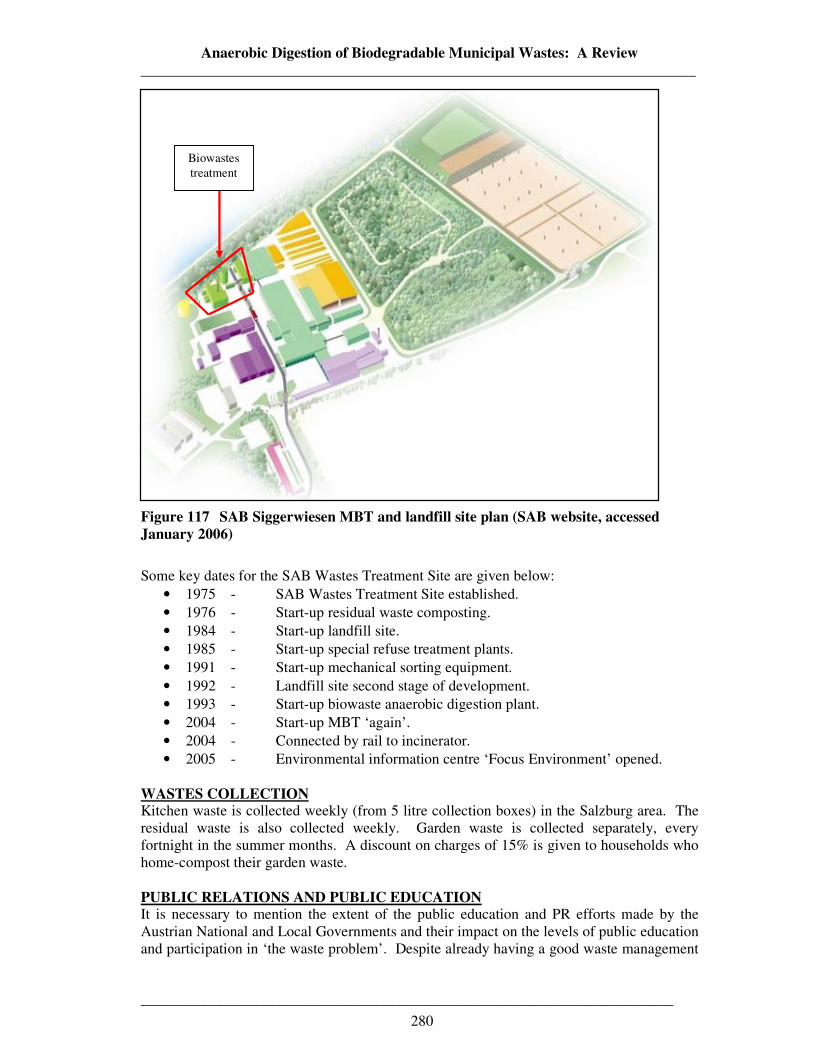
Anaerobic Digestion of Biodegradable Municipal Wastes: A Review __________________________________________________________________________
_______________________________________________________________________
280
Figure 117 SAB Siggerwiesen MBT and landfill site plan (SAB website, accessed January 2006)
Some key dates for the SAB Wastes Treatment Site are given below:
• 1975 - SAB Wastes Treatment Site established. • 1976 - Start-up residual waste composting. • 1984 - Start-up landfill site. • 1985 - Start-up special refuse treatment plants. • 1991 - Start-up mechanical sorting equipment. • 1992 - Landfill site second stage of development. • 1993 - Start-up biowaste anaerobic digestion plant. • 2004 - Start-up MBT ‘again’. • 2004 - Connected by rail to incinerator. • 2005 - Environmental information centre ‘Focus Environment’ opened.
WASTES COLLECTION Kitchen waste is collected weekly (from 5 litre collection boxes) in the Salzburg area. The residual waste is also collected weekly. Garden waste is collected separately, every fortnight in the summer months. A discount on charges of 15% is given to households who home-compost their garden waste. PUBLIC RELATIONS AND PUBLIC EDUCATION It is necessary to mention the extent of the public education and PR efforts made by the Austrian National and Local Governments and their impact on the levels of public education and participation in ‘the waste problem’. Despite already having a good waste management
Biowastes treatment
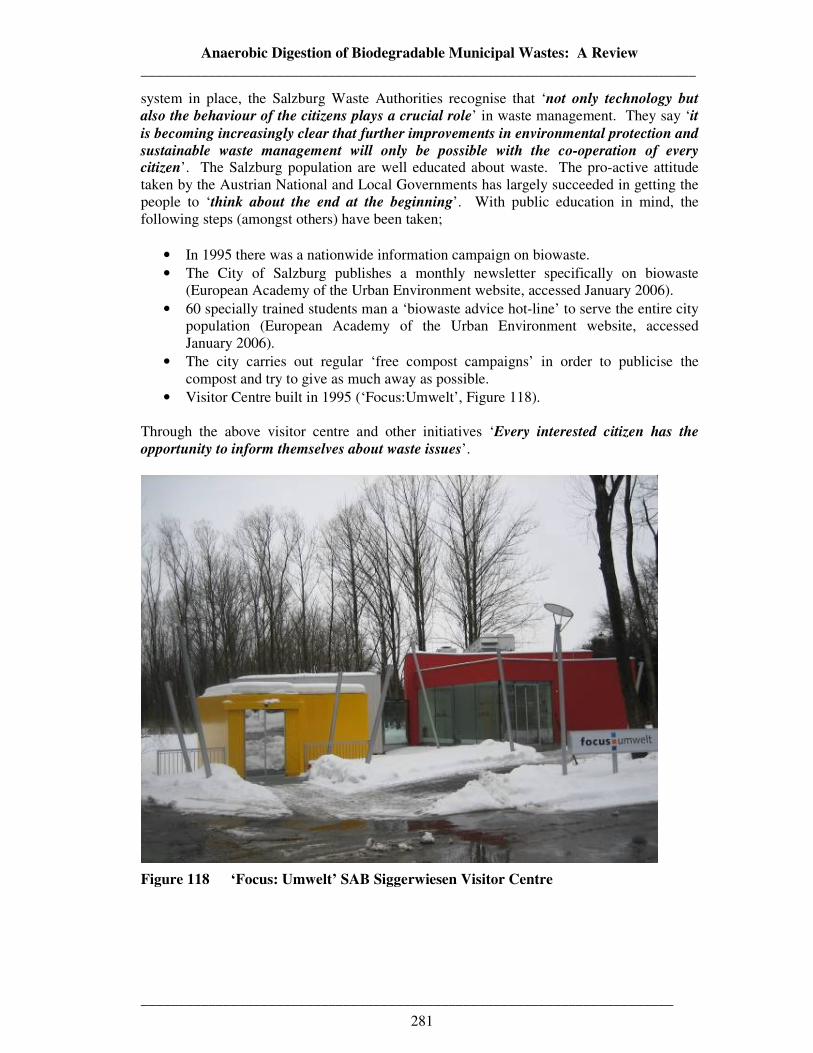
Anaerobic Digestion of Biodegradable Municipal Wastes: A Review __________________________________________________________________________
_______________________________________________________________________
281
system in place, the Salzburg Waste Authorities recognise that ‘not only technology but
also the behaviour of the citizens plays a crucial role’ in waste management. They say ‘it is becoming increasingly clear that further improvements in environmental protection and
sustainable waste management will only be possible with the co-operation of every citizen’. The Salzburg population are well educated about waste. The pro-active attitude taken by the Austrian National and Local Governments has largely succeeded in getting the people to ‘think about the end at the beginning’. With public education in mind, the following steps (amongst others) have been taken;
• In 1995 there was a nationwide information campaign on biowaste. • The City of Salzburg publishes a monthly newsletter specifically on biowaste
(European Academy of the Urban Environment website, accessed January 2006). • 60 specially trained students man a ‘biowaste advice hot-line’ to serve the entire city
population (European Academy of the Urban Environment website, accessed January 2006).
• The city carries out regular ‘free compost campaigns’ in order to publicise the compost and try to give as much away as possible.
• Visitor Centre built in 1995 (‘Focus:Umwelt’, Figure 118).
Through the above visitor centre and other initiatives ‘Every interested citizen has the
opportunity to inform themselves about waste issues’.
Figure 118 ‘Focus: Umwelt’ SAB Siggerwiesen Visitor Centre
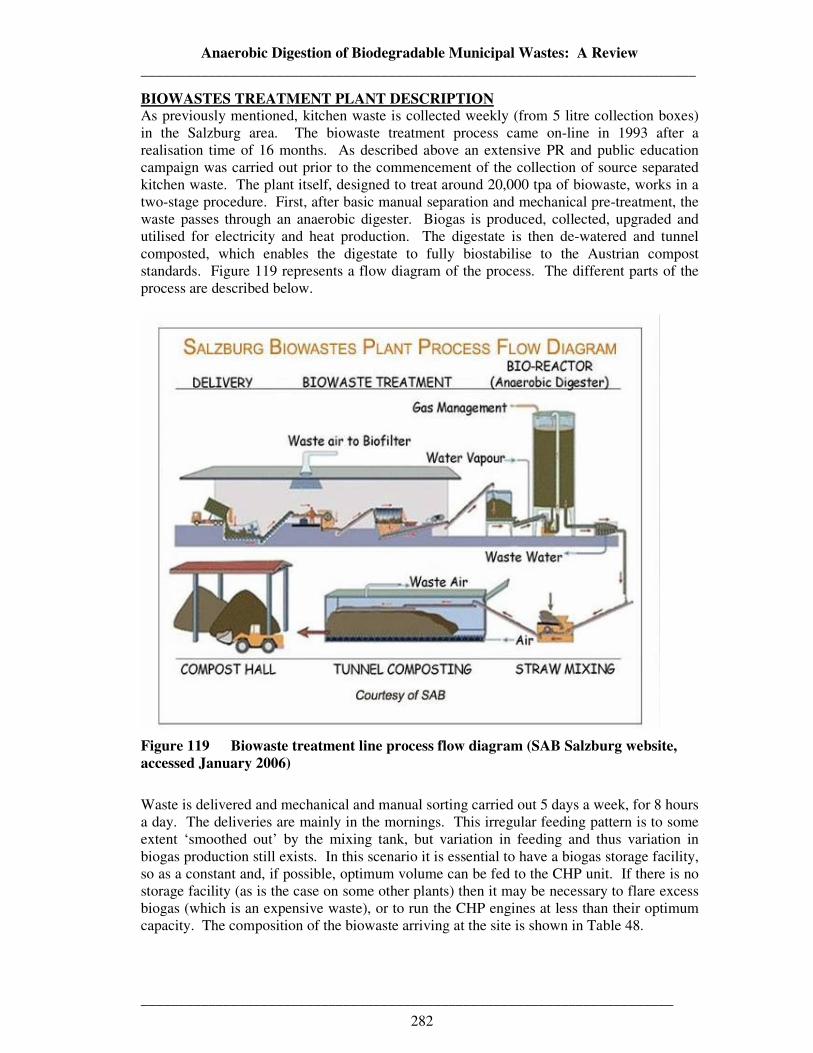
Anaerobic Digestion of Biodegradable Municipal Wastes: A Review __________________________________________________________________________
_______________________________________________________________________
282
BIOWASTES TREATMENT PLANT DESCRIPTION As previously mentioned, kitchen waste is collected weekly (from 5 litre collection boxes) in the Salzburg area. The biowaste treatment process came on-line in 1993 after a realisation time of 16 months. As described above an extensive PR and public education campaign was carried out prior to the commencement of the collection of source separated kitchen waste. The plant itself, designed to treat around 20,000 tpa of biowaste, works in a two-stage procedure. First, after basic manual separation and mechanical pre-treatment, the waste passes through an anaerobic digester. Biogas is produced, collected, upgraded and utilised for electricity and heat production. The digestate is then de-watered and tunnel composted, which enables the digestate to fully biostabilise to the Austrian compost standards. Figure 119 represents a flow diagram of the process. The different parts of the process are described below.
Figure 119 Biowaste treatment line process flow diagram (SAB Salzburg website, accessed January 2006)
Waste is delivered and mechanical and manual sorting carried out 5 days a week, for 8 hours a day. The deliveries are mainly in the mornings. This irregular feeding pattern is to some extent ‘smoothed out’ by the mixing tank, but variation in feeding and thus variation in biogas production still exists. In this scenario it is essential to have a biogas storage facility, so as a constant and, if possible, optimum volume can be fed to the CHP unit. If there is no storage facility (as is the case on some other plants) then it may be necessary to flare excess biogas (which is an expensive waste), or to run the CHP engines at less than their optimum capacity. The composition of the biowaste arriving at the site is shown in Table 48.
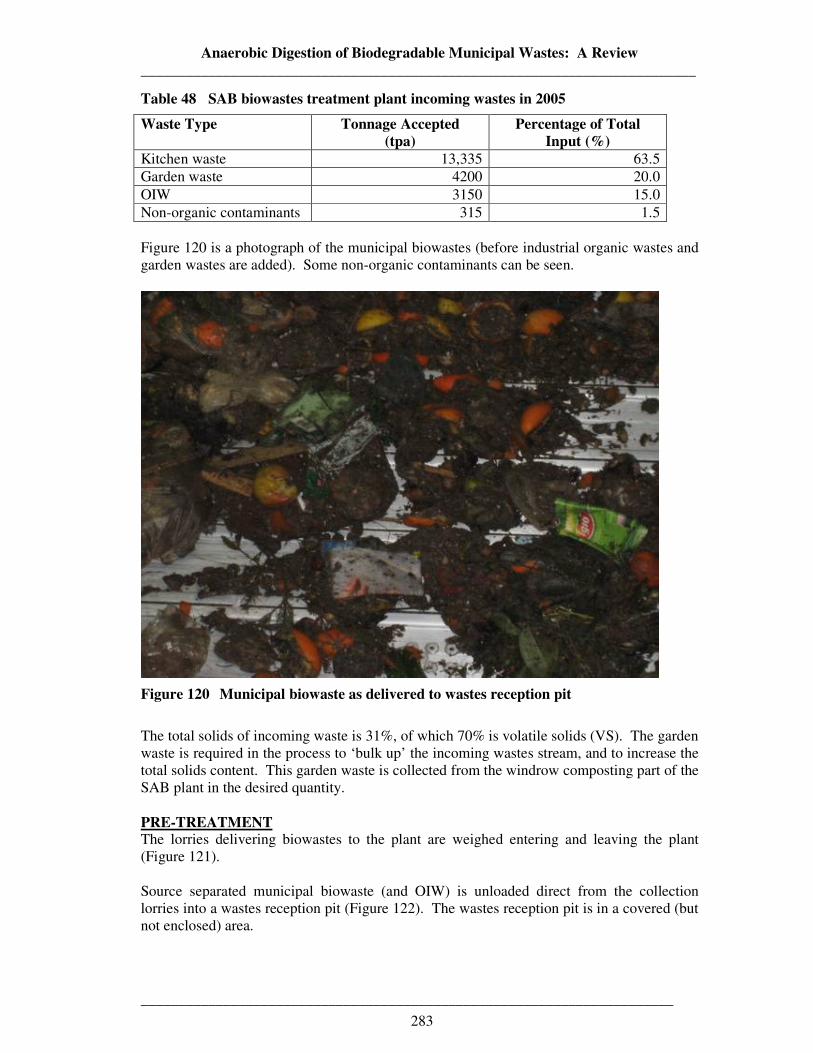
Anaerobic Digestion of Biodegradable Municipal Wastes: A Review __________________________________________________________________________
_______________________________________________________________________
283
Table 48 SAB biowastes treatment plant incoming wastes in 2005
Waste Type Tonnage Accepted (tpa)
Percentage of Total Input (%)
Kitchen waste 13,335 63.5 Garden waste 4200 20.0 OIW 3150 15.0 Non-organic contaminants 315 1.5 Figure 120 is a photograph of the municipal biowastes (before industrial organic wastes and garden wastes are added). Some non-organic contaminants can be seen.
Figure 120 Municipal biowaste as delivered to wastes reception pit
The total solids of incoming waste is 31%, of which 70% is volatile solids (VS). The garden waste is required in the process to ‘bulk up’ the incoming wastes stream, and to increase the total solids content. This garden waste is collected from the windrow composting part of the SAB plant in the desired quantity. PRE-TREATMENT The lorries delivering biowastes to the plant are weighed entering and leaving the plant (Figure 121). Source separated municipal biowaste (and OIW) is unloaded direct from the collection lorries into a wastes reception pit (Figure 122). The wastes reception pit is in a covered (but not enclosed) area.
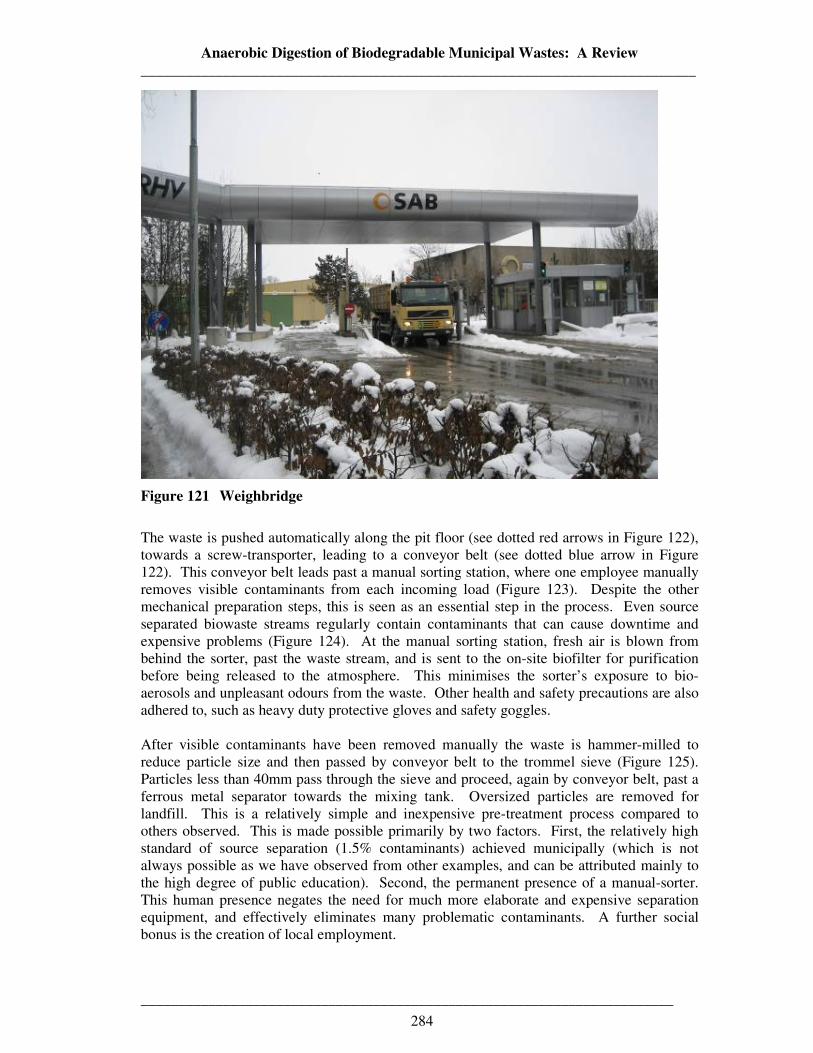
Anaerobic Digestion of Biodegradable Municipal Wastes: A Review __________________________________________________________________________
_______________________________________________________________________
284
Figure 121 Weighbridge
The waste is pushed automatically along the pit floor (see dotted red arrows in Figure 122), towards a screw-transporter, leading to a conveyor belt (see dotted blue arrow in Figure 122). This conveyor belt leads past a manual sorting station, where one employee manually removes visible contaminants from each incoming load (Figure 123). Despite the other mechanical preparation steps, this is seen as an essential step in the process. Even source separated biowaste streams regularly contain contaminants that can cause downtime and expensive problems (Figure 124). At the manual sorting station, fresh air is blown from behind the sorter, past the waste stream, and is sent to the on-site biofilter for purification before being released to the atmosphere. This minimises the sorter’s exposure to bio-aerosols and unpleasant odours from the waste. Other health and safety precautions are also adhered to, such as heavy duty protective gloves and safety goggles. After visible contaminants have been removed manually the waste is hammer-milled to reduce particle size and then passed by conveyor belt to the trommel sieve (Figure 125). Particles less than 40mm pass through the sieve and proceed, again by conveyor belt, past a ferrous metal separator towards the mixing tank. Oversized particles are removed for landfill. This is a relatively simple and inexpensive pre-treatment process compared to others observed. This is made possible primarily by two factors. First, the relatively high standard of source separation (1.5% contaminants) achieved municipally (which is not always possible as we have observed from other examples, and can be attributed mainly to the high degree of public education). Second, the permanent presence of a manual-sorter. This human presence negates the need for much more elaborate and expensive separation equipment, and effectively eliminates many problematic contaminants. A further social bonus is the creation of local employment.
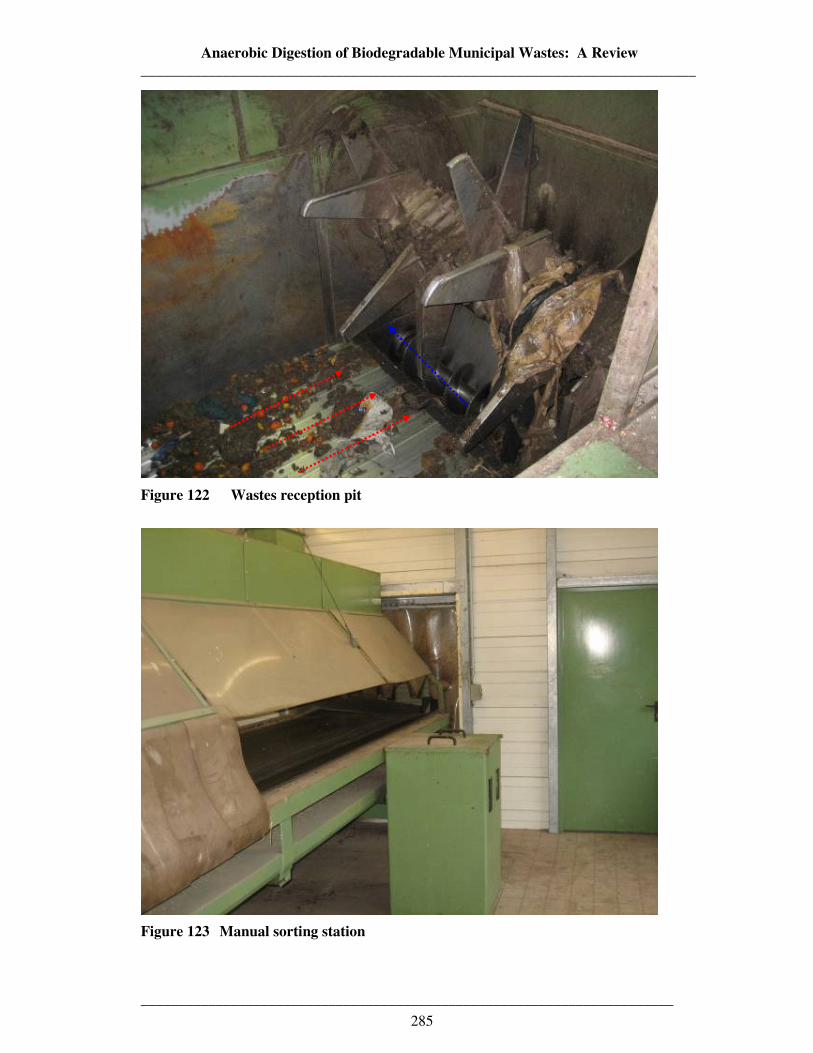
Anaerobic Digestion of Biodegradable Municipal Wastes: A Review __________________________________________________________________________
_______________________________________________________________________
285
Figure 122 Wastes reception pit
Figure 123 Manual sorting station

Anaerobic Digestion of Biodegradable Municipal Wastes: A Review __________________________________________________________________________
_______________________________________________________________________
286
Figure 124 Example of biowaste contaminants
Figure 125 Trommel sieve
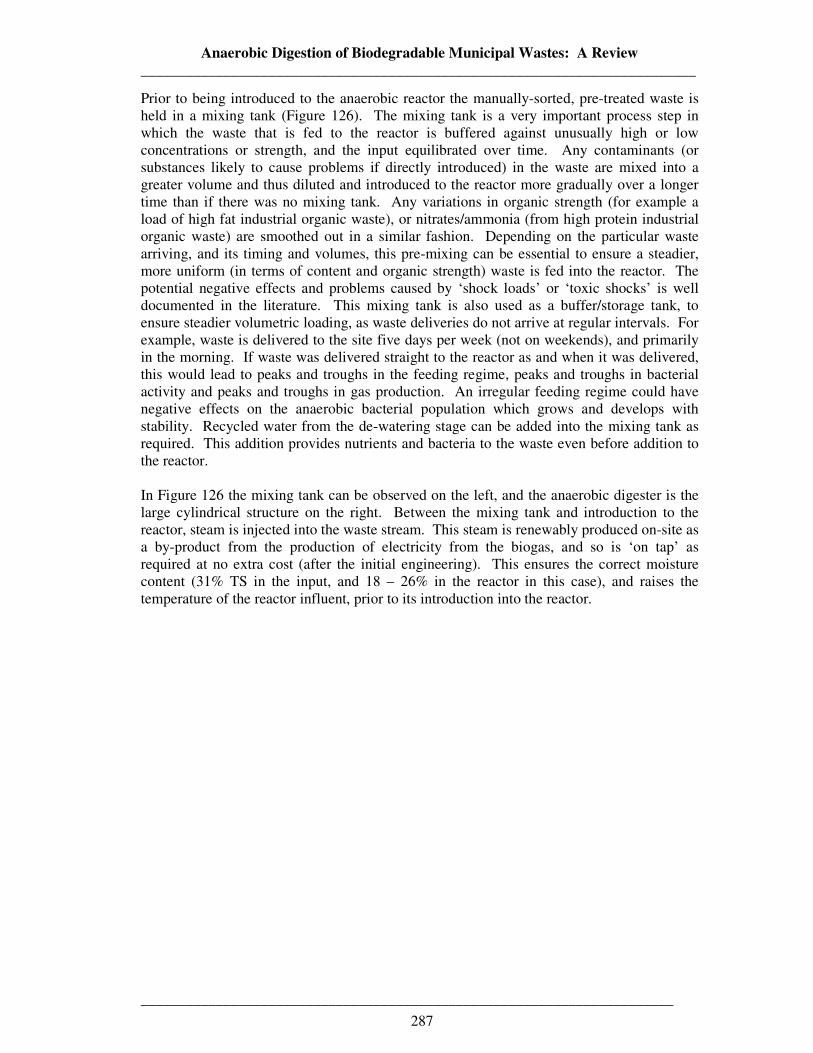
Anaerobic Digestion of Biodegradable Municipal Wastes: A Review __________________________________________________________________________
_______________________________________________________________________
287
Prior to being introduced to the anaerobic reactor the manually-sorted, pre-treated waste is held in a mixing tank (Figure 126). The mixing tank is a very important process step in which the waste that is fed to the reactor is buffered against unusually high or low concentrations or strength, and the input equilibrated over time. Any contaminants (or substances likely to cause problems if directly introduced) in the waste are mixed into a greater volume and thus diluted and introduced to the reactor more gradually over a longer time than if there was no mixing tank. Any variations in organic strength (for example a load of high fat industrial organic waste), or nitrates/ammonia (from high protein industrial organic waste) are smoothed out in a similar fashion. Depending on the particular waste arriving, and its timing and volumes, this pre-mixing can be essential to ensure a steadier, more uniform (in terms of content and organic strength) waste is fed into the reactor. The potential negative effects and problems caused by ‘shock loads’ or ‘toxic shocks’ is well documented in the literature. This mixing tank is also used as a buffer/storage tank, to ensure steadier volumetric loading, as waste deliveries do not arrive at regular intervals. For example, waste is delivered to the site five days per week (not on weekends), and primarily in the morning. If waste was delivered straight to the reactor as and when it was delivered, this would lead to peaks and troughs in the feeding regime, peaks and troughs in bacterial activity and peaks and troughs in gas production. An irregular feeding regime could have negative effects on the anaerobic bacterial population which grows and develops with stability. Recycled water from the de-watering stage can be added into the mixing tank as required. This addition provides nutrients and bacteria to the waste even before addition to the reactor. In Figure 126 the mixing tank can be observed on the left, and the anaerobic digester is the large cylindrical structure on the right. Between the mixing tank and introduction to the reactor, steam is injected into the waste stream. This steam is renewably produced on-site as a by-product from the production of electricity from the biogas, and so is ‘on tap’ as required at no extra cost (after the initial engineering). This ensures the correct moisture content (31% TS in the input, and 18 – 26% in the reactor in this case), and raises the temperature of the reactor influent, prior to its introduction into the reactor.
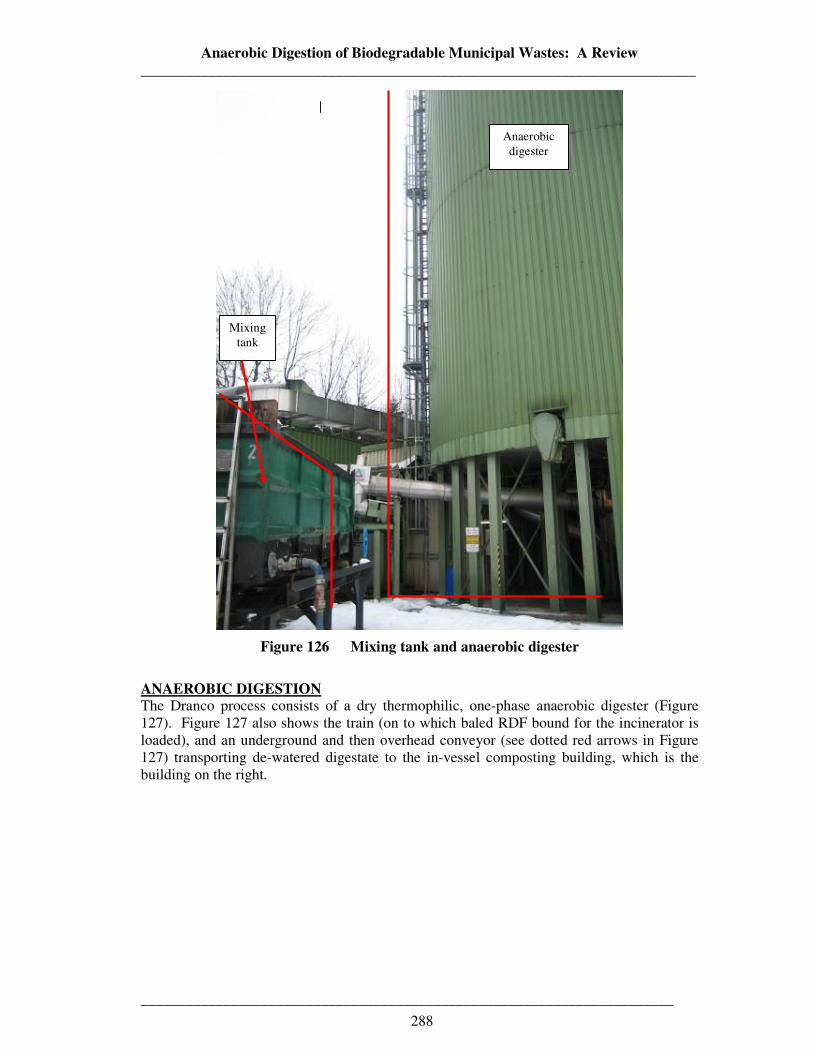
Anaerobic Digestion of Biodegradable Municipal Wastes: A Review __________________________________________________________________________
_______________________________________________________________________
288
Figure 126 Mixing tank and anaerobic digester
ANAEROBIC DIGESTION The Dranco process consists of a dry thermophilic, one-phase anaerobic digester (Figure 127). Figure 127 also shows the train (on to which baled RDF bound for the incinerator is loaded), and an underground and then overhead conveyor (see dotted red arrows in Figure 127) transporting de-watered digestate to the in-vessel composting building, which is the building on the right.
Anaerobic digester
Mixing tank
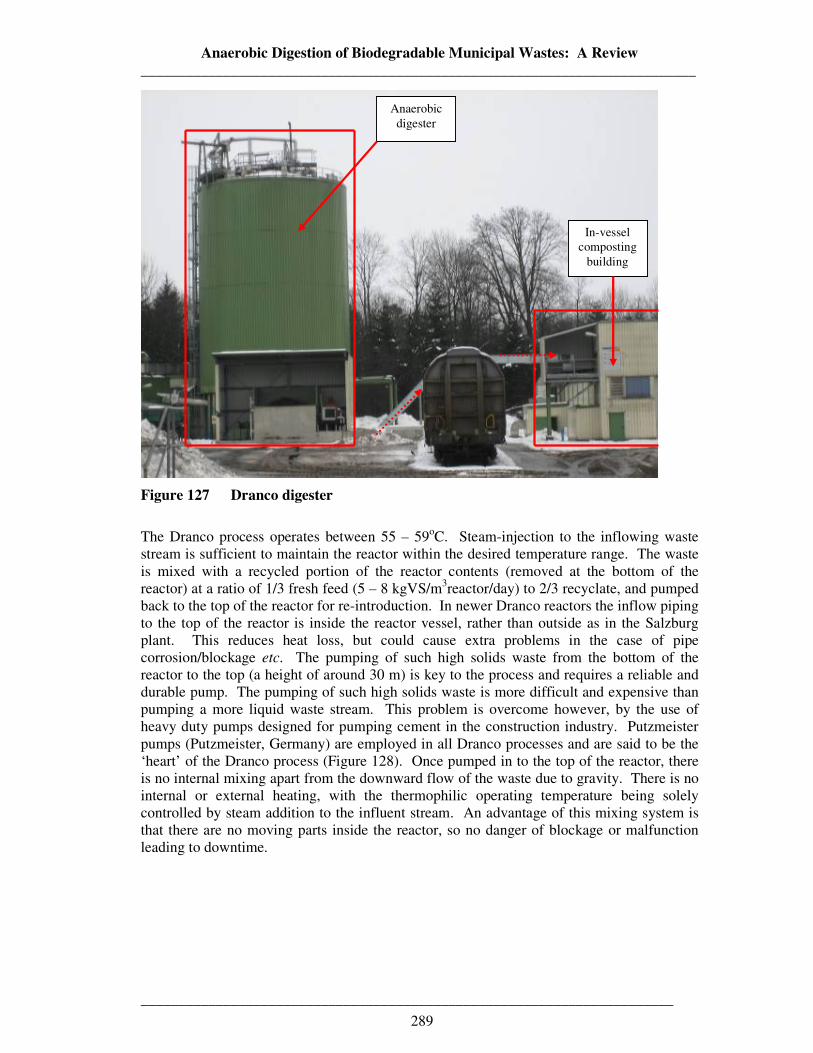
Anaerobic Digestion of Biodegradable Municipal Wastes: A Review __________________________________________________________________________
_______________________________________________________________________
289
Figure 127 Dranco digester
The Dranco process operates between 55 – 59oC. Steam-injection to the inflowing waste stream is sufficient to maintain the reactor within the desired temperature range. The waste is mixed with a recycled portion of the reactor contents (removed at the bottom of the reactor) at a ratio of 1/3 fresh feed (5 – 8 kgVS/m3reactor/day) to 2/3 recyclate, and pumped back to the top of the reactor for re-introduction. In newer Dranco reactors the inflow piping to the top of the reactor is inside the reactor vessel, rather than outside as in the Salzburg plant. This reduces heat loss, but could cause extra problems in the case of pipe corrosion/blockage etc. The pumping of such high solids waste from the bottom of the reactor to the top (a height of around 30 m) is key to the process and requires a reliable and durable pump. The pumping of such high solids waste is more difficult and expensive than pumping a more liquid waste stream. This problem is overcome however, by the use of heavy duty pumps designed for pumping cement in the construction industry. Putzmeister pumps (Putzmeister, Germany) are employed in all Dranco processes and are said to be the ‘heart’ of the Dranco process (Figure 128). Once pumped in to the top of the reactor, there is no internal mixing apart from the downward flow of the waste due to gravity. There is no internal or external heating, with the thermophilic operating temperature being solely controlled by steam addition to the influent stream. An advantage of this mixing system is that there are no moving parts inside the reactor, so no danger of blockage or malfunction leading to downtime.
Anaerobic digester
In-vessel composting
building
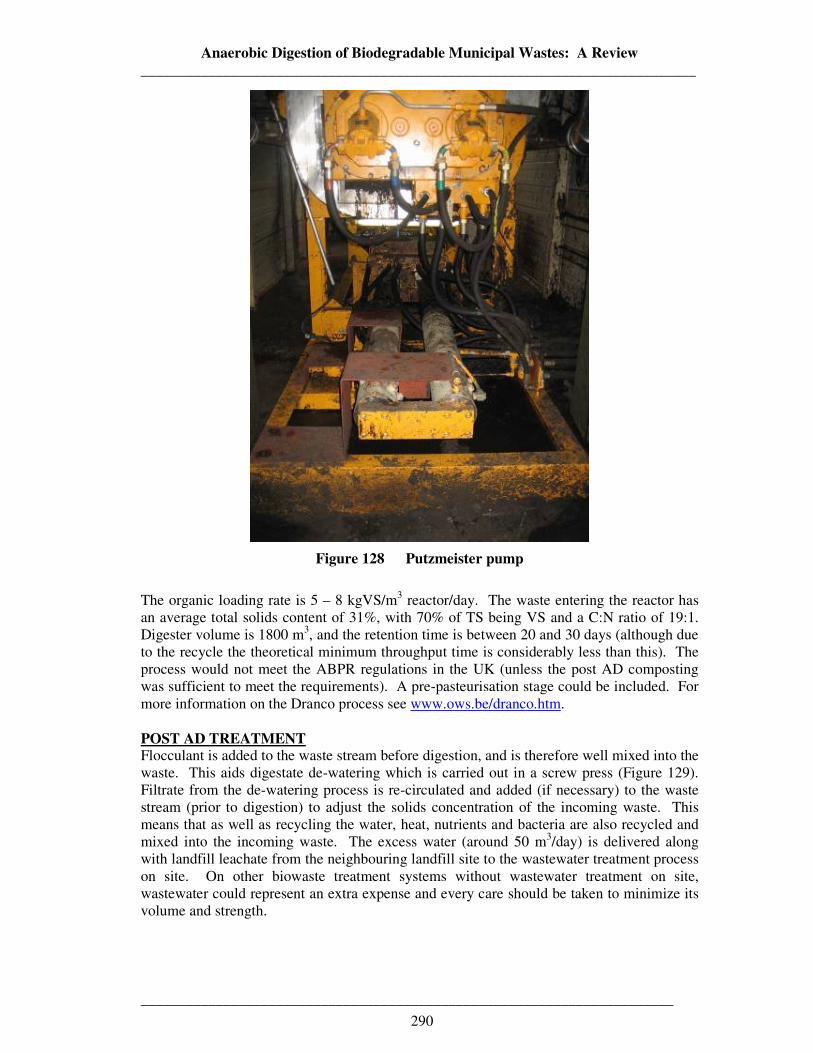
Anaerobic Digestion of Biodegradable Municipal Wastes: A Review __________________________________________________________________________
_______________________________________________________________________
290
Figure 128 Putzmeister pump
The organic loading rate is 5 – 8 kgVS/m3 reactor/day. The waste entering the reactor has an average total solids content of 31%, with 70% of TS being VS and a C:N ratio of 19:1. Digester volume is 1800 m3, and the retention time is between 20 and 30 days (although due to the recycle the theoretical minimum throughput time is considerably less than this). The process would not meet the ABPR regulations in the UK (unless the post AD composting was sufficient to meet the requirements). A pre-pasteurisation stage could be included. For more information on the Dranco process see www.ows.be/dranco.htm. POST AD TREATMENT Flocculant is added to the waste stream before digestion, and is therefore well mixed into the waste. This aids digestate de-watering which is carried out in a screw press (Figure 129). Filtrate from the de-watering process is re-circulated and added (if necessary) to the waste stream (prior to digestion) to adjust the solids concentration of the incoming waste. This means that as well as recycling the water, heat, nutrients and bacteria are also recycled and mixed into the incoming waste. The excess water (around 50 m3/day) is delivered along with landfill leachate from the neighbouring landfill site to the wastewater treatment process on site. On other biowaste treatment systems without wastewater treatment on site, wastewater could represent an extra expense and every care should be taken to minimize its volume and strength.
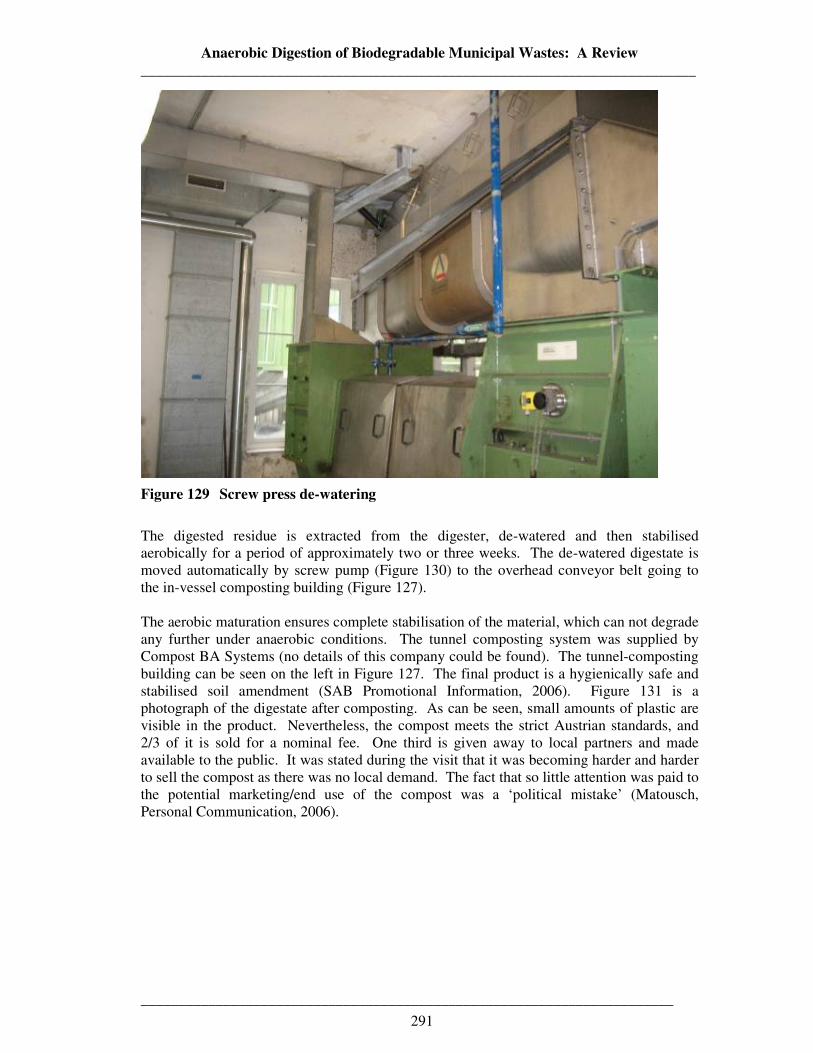
Anaerobic Digestion of Biodegradable Municipal Wastes: A Review __________________________________________________________________________
_______________________________________________________________________
291
Figure 129 Screw press de-watering
The digested residue is extracted from the digester, de-watered and then stabilised aerobically for a period of approximately two or three weeks. The de-watered digestate is moved automatically by screw pump (Figure 130) to the overhead conveyor belt going to the in-vessel composting building (Figure 127). The aerobic maturation ensures complete stabilisation of the material, which can not degrade any further under anaerobic conditions. The tunnel composting system was supplied by Compost BA Systems (no details of this company could be found). The tunnel-composting building can be seen on the left in Figure 127. The final product is a hygienically safe and stabilised soil amendment (SAB Promotional Information, 2006). Figure 131 is a photograph of the digestate after composting. As can be seen, small amounts of plastic are visible in the product. Nevertheless, the compost meets the strict Austrian standards, and 2/3 of it is sold for a nominal fee. One third is given away to local partners and made available to the public. It was stated during the visit that it was becoming harder and harder to sell the compost as there was no local demand. The fact that so little attention was paid to the potential marketing/end use of the compost was a ‘political mistake’ (Matousch, Personal Communication, 2006).
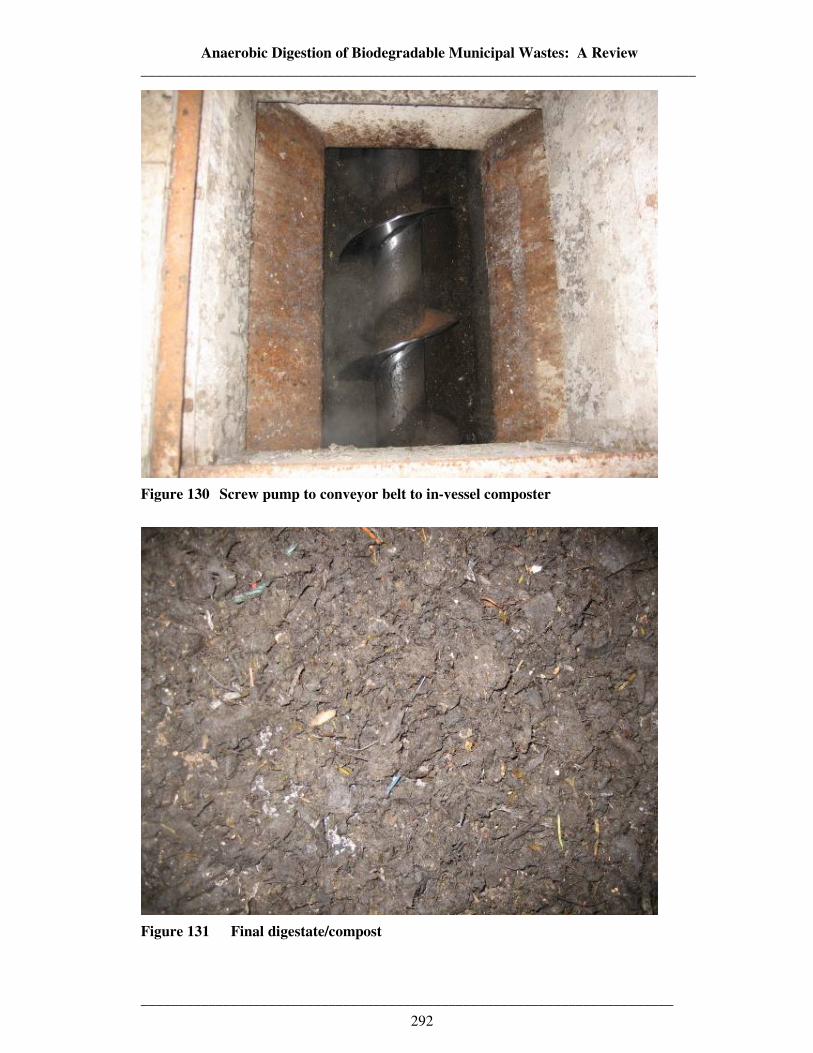
Anaerobic Digestion of Biodegradable Municipal Wastes: A Review __________________________________________________________________________
_______________________________________________________________________
292
Figure 130 Screw pump to conveyor belt to in-vessel composter
Figure 131 Final digestate/compost
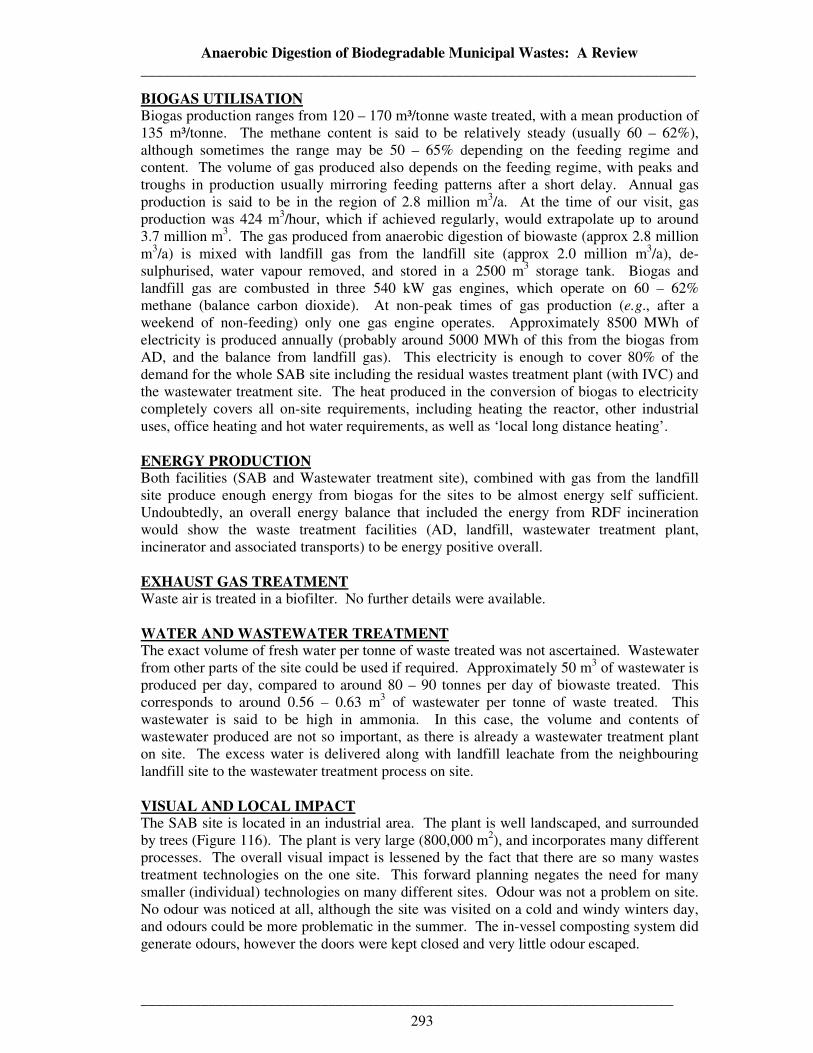
Anaerobic Digestion of Biodegradable Municipal Wastes: A Review __________________________________________________________________________
_______________________________________________________________________
293
BIOGAS UTILISATION Biogas production ranges from 120 – 170 m³/tonne waste treated, with a mean production of 135 m³/tonne. The methane content is said to be relatively steady (usually 60 – 62%), although sometimes the range may be 50 – 65% depending on the feeding regime and content. The volume of gas produced also depends on the feeding regime, with peaks and troughs in production usually mirroring feeding patterns after a short delay. Annual gas production is said to be in the region of 2.8 million m3/a. At the time of our visit, gas production was 424 m3/hour, which if achieved regularly, would extrapolate up to around 3.7 million m3. The gas produced from anaerobic digestion of biowaste (approx 2.8 million m3/a) is mixed with landfill gas from the landfill site (approx 2.0 million m3/a), de-sulphurised, water vapour removed, and stored in a 2500 m3 storage tank. Biogas and landfill gas are combusted in three 540 kW gas engines, which operate on 60 – 62% methane (balance carbon dioxide). At non-peak times of gas production (e.g., after a weekend of non-feeding) only one gas engine operates. Approximately 8500 MWh of electricity is produced annually (probably around 5000 MWh of this from the biogas from AD, and the balance from landfill gas). This electricity is enough to cover 80% of the demand for the whole SAB site including the residual wastes treatment plant (with IVC) and the wastewater treatment site. The heat produced in the conversion of biogas to electricity completely covers all on-site requirements, including heating the reactor, other industrial uses, office heating and hot water requirements, as well as ‘local long distance heating’. ENERGY PRODUCTION Both facilities (SAB and Wastewater treatment site), combined with gas from the landfill site produce enough energy from biogas for the sites to be almost energy self sufficient. Undoubtedly, an overall energy balance that included the energy from RDF incineration would show the waste treatment facilities (AD, landfill, wastewater treatment plant, incinerator and associated transports) to be energy positive overall. EXHAUST GAS TREATMENT Waste air is treated in a biofilter. No further details were available. WATER AND WASTEWATER TREATMENT The exact volume of fresh water per tonne of waste treated was not ascertained. Wastewater from other parts of the site could be used if required. Approximately 50 m3 of wastewater is produced per day, compared to around 80 – 90 tonnes per day of biowaste treated. This corresponds to around 0.56 – 0.63 m3 of wastewater per tonne of waste treated. This wastewater is said to be high in ammonia. In this case, the volume and contents of wastewater produced are not so important, as there is already a wastewater treatment plant on site. The excess water is delivered along with landfill leachate from the neighbouring landfill site to the wastewater treatment process on site. VISUAL AND LOCAL IMPACT The SAB site is located in an industrial area. The plant is well landscaped, and surrounded by trees (Figure 116). The plant is very large (800,000 m2), and incorporates many different processes. The overall visual impact is lessened by the fact that there are so many wastes treatment technologies on the one site. This forward planning negates the need for many smaller (individual) technologies on many different sites. Odour was not a problem on site. No odour was noticed at all, although the site was visited on a cold and windy winters day, and odours could be more problematic in the summer. The in-vessel composting system did generate odours, however the doors were kept closed and very little odour escaped.
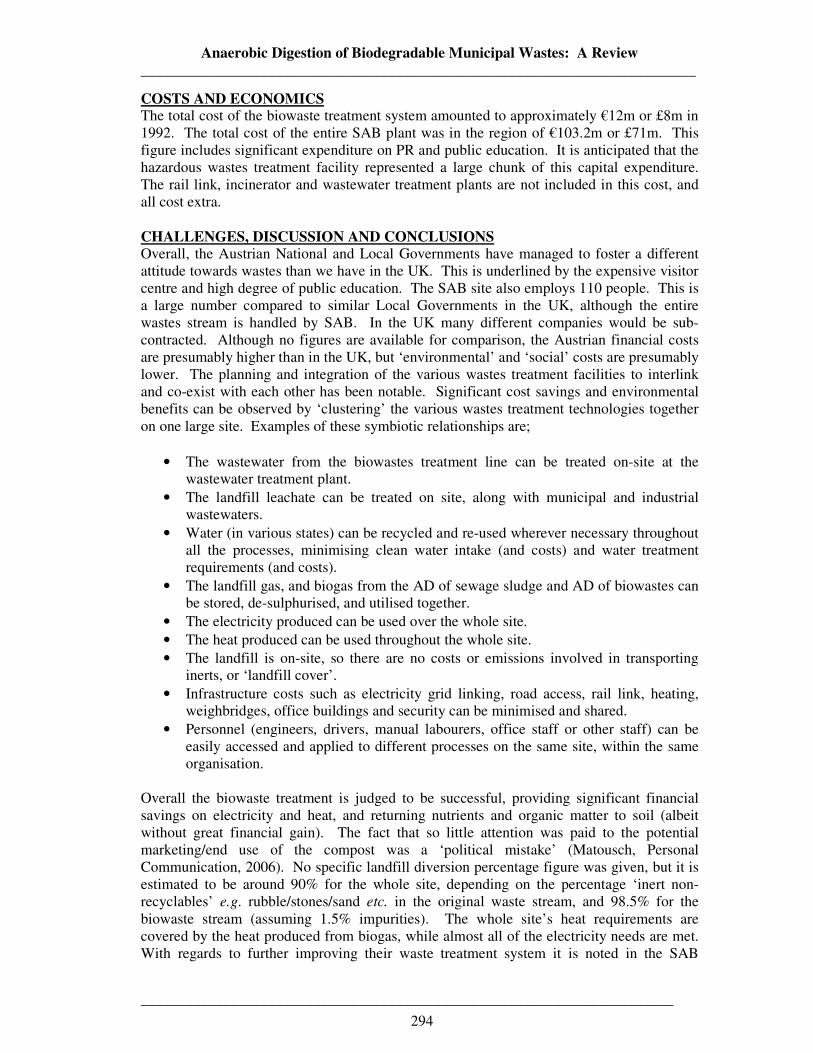
Anaerobic Digestion of Biodegradable Municipal Wastes: A Review __________________________________________________________________________
_______________________________________________________________________
294
COSTS AND ECONOMICS The total cost of the biowaste treatment system amounted to approximately €12m or £8m in 1992. The total cost of the entire SAB plant was in the region of €103.2m or £71m. This figure includes significant expenditure on PR and public education. It is anticipated that the hazardous wastes treatment facility represented a large chunk of this capital expenditure. The rail link, incinerator and wastewater treatment plants are not included in this cost, and all cost extra. CHALLENGES, DISCUSSION AND CONCLUSIONS Overall, the Austrian National and Local Governments have managed to foster a different attitude towards wastes than we have in the UK. This is underlined by the expensive visitor centre and high degree of public education. The SAB site also employs 110 people. This is a large number compared to similar Local Governments in the UK, although the entire wastes stream is handled by SAB. In the UK many different companies would be sub-contracted. Although no figures are available for comparison, the Austrian financial costs are presumably higher than in the UK, but ‘environmental’ and ‘social’ costs are presumably lower. The planning and integration of the various wastes treatment facilities to interlink and co-exist with each other has been notable. Significant cost savings and environmental benefits can be observed by ‘clustering’ the various wastes treatment technologies together on one large site. Examples of these symbiotic relationships are;
• The wastewater from the biowastes treatment line can be treated on-site at the wastewater treatment plant.
• The landfill leachate can be treated on site, along with municipal and industrial wastewaters.
• Water (in various states) can be recycled and re-used wherever necessary throughout all the processes, minimising clean water intake (and costs) and water treatment requirements (and costs).
• The landfill gas, and biogas from the AD of sewage sludge and AD of biowastes can be stored, de-sulphurised, and utilised together.
• The electricity produced can be used over the whole site. • The heat produced can be used throughout the whole site. • The landfill is on-site, so there are no costs or emissions involved in transporting
inerts, or ‘landfill cover’. • Infrastructure costs such as electricity grid linking, road access, rail link, heating,
weighbridges, office buildings and security can be minimised and shared. • Personnel (engineers, drivers, manual labourers, office staff or other staff) can be
easily accessed and applied to different processes on the same site, within the same organisation.
Overall the biowaste treatment is judged to be successful, providing significant financial savings on electricity and heat, and returning nutrients and organic matter to soil (albeit without great financial gain). The fact that so little attention was paid to the potential marketing/end use of the compost was a ‘political mistake’ (Matousch, Personal Communication, 2006). No specific landfill diversion percentage figure was given, but it is estimated to be around 90% for the whole site, depending on the percentage ‘inert non-recyclables’ e.g. rubble/stones/sand etc. in the original waste stream, and 98.5% for the biowaste stream (assuming 1.5% impurities). The whole site’s heat requirements are covered by the heat produced from biogas, while almost all of the electricity needs are met. With regards to further improving their waste treatment system it is noted in the SAB
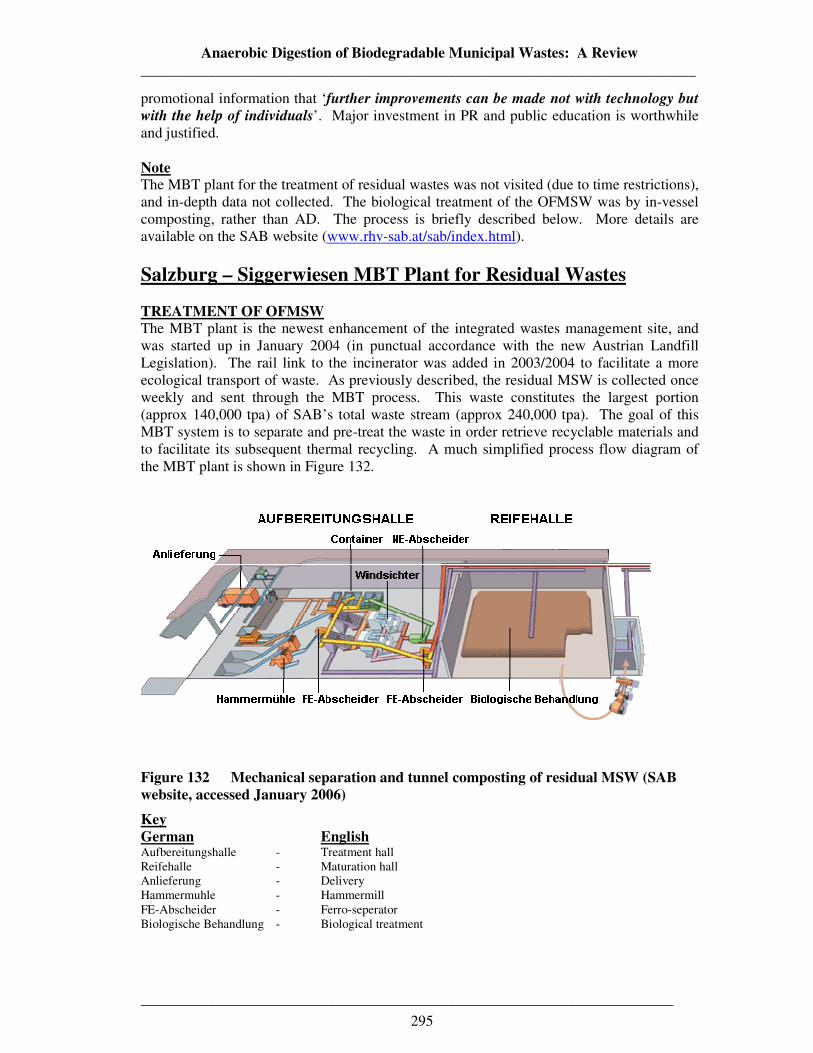
Anaerobic Digestion of Biodegradable Municipal Wastes: A Review __________________________________________________________________________
_______________________________________________________________________
295
promotional information that ‘further improvements can be made not with technology but
with the help of individuals’. Major investment in PR and public education is worthwhile and justified. Note The MBT plant for the treatment of residual wastes was not visited (due to time restrictions), and in-depth data not collected. The biological treatment of the OFMSW was by in-vessel composting, rather than AD. The process is briefly described below. More details are available on the SAB website (www.rhv-sab.at/sab/index.html).
Salzburg – Siggerwiesen MBT Plant for Residual Wastes TREATMENT OF OFMSW The MBT plant is the newest enhancement of the integrated wastes management site, and was started up in January 2004 (in punctual accordance with the new Austrian Landfill Legislation). The rail link to the incinerator was added in 2003/2004 to facilitate a more ecological transport of waste. As previously described, the residual MSW is collected once weekly and sent through the MBT process. This waste constitutes the largest portion (approx 140,000 tpa) of SAB’s total waste stream (approx 240,000 tpa). The goal of this MBT system is to separate and pre-treat the waste in order retrieve recyclable materials and to facilitate its subsequent thermal recycling. A much simplified process flow diagram of the MBT plant is shown in Figure 132.
Figure 132 Mechanical separation and tunnel composting of residual MSW (SAB website, accessed January 2006)
Key German English Aufbereitungshalle - Treatment hall Reifehalle - Maturation hall Anlieferung - Delivery Hammermuhle - Hammermill FE-Abscheider - Ferro-seperator Biologische Behandlung - Biological treatment
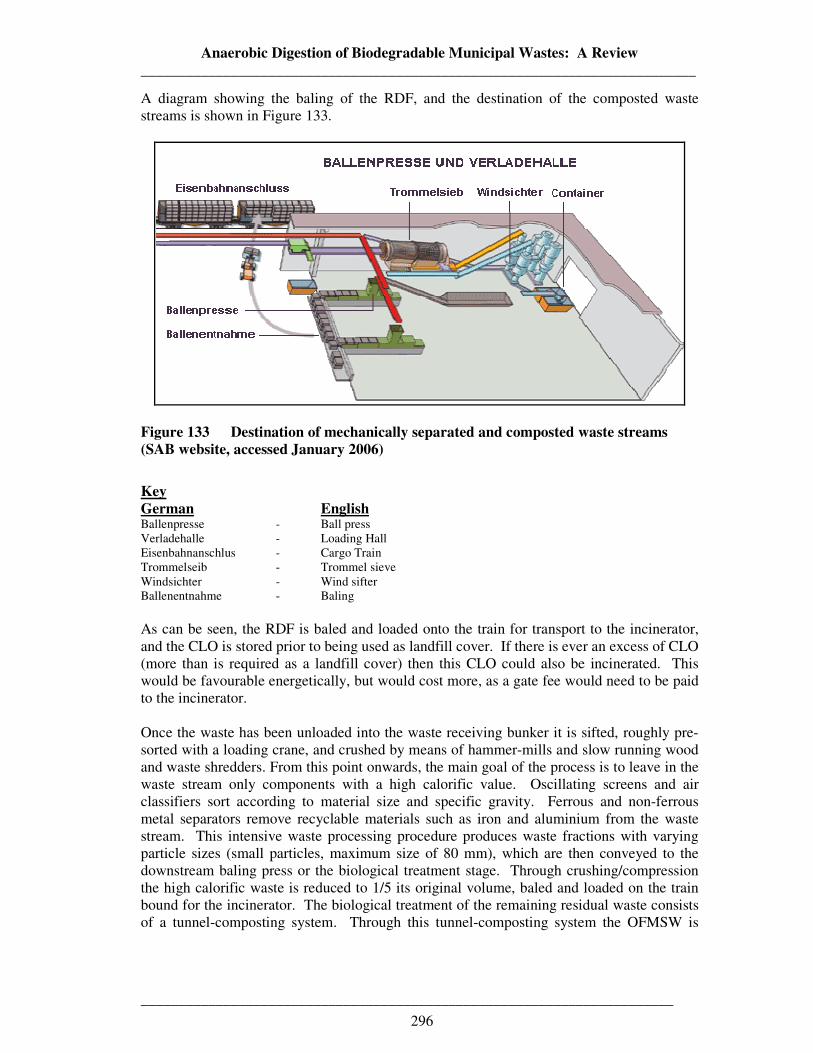
Anaerobic Digestion of Biodegradable Municipal Wastes: A Review __________________________________________________________________________
_______________________________________________________________________
296
A diagram showing the baling of the RDF, and the destination of the composted waste streams is shown in Figure 133.
Figure 133 Destination of mechanically separated and composted waste streams (SAB website, accessed January 2006)
Key German English Ballenpresse - Ball press Verladehalle - Loading Hall Eisenbahnanschlus - Cargo Train Trommelseib - Trommel sieve Windsichter - Wind sifter Ballenentnahme - Baling As can be seen, the RDF is baled and loaded onto the train for transport to the incinerator, and the CLO is stored prior to being used as landfill cover. If there is ever an excess of CLO (more than is required as a landfill cover) then this CLO could also be incinerated. This would be favourable energetically, but would cost more, as a gate fee would need to be paid to the incinerator. Once the waste has been unloaded into the waste receiving bunker it is sifted, roughly pre-sorted with a loading crane, and crushed by means of hammer-mills and slow running wood and waste shredders. From this point onwards, the main goal of the process is to leave in the waste stream only components with a high calorific value. Oscillating screens and air classifiers sort according to material size and specific gravity. Ferrous and non-ferrous metal separators remove recyclable materials such as iron and aluminium from the waste stream. This intensive waste processing procedure produces waste fractions with varying particle sizes (small particles, maximum size of 80 mm), which are then conveyed to the downstream baling press or the biological treatment stage. Through crushing/compression the high calorific waste is reduced to 1/5 its original volume, baled and loaded on the train bound for the incinerator. The biological treatment of the remaining residual waste consists of a tunnel-composting system. Through this tunnel-composting system the OFMSW is
Anaerobic Digestion of Biodegradable Municipal Wastes: A Review __________________________________________________________________________
_______________________________________________________________________
297
fully biostabilised. The biostabilised output is then mixed with the un-recyclable inerts (such as stones, sand and glass pieces) and landfilled. Depending on the level of contamination of the biostabilised output from the tunnel composting of OFMSW, its calorific value (which could be easily tested), and the Austrian incineration legislation, it may be possible to pelletise this ‘compost’ and send it to the incinerator for energy recovery. This solution would be energetically preferable to landfilling. More details about the process are available on the SAB website (www.rhv-sab.at/sab/index.html).
Anaerobic Digestion of Biodegradable Municipal Wastes: A Review __________________________________________________________________________
_______________________________________________________________________
298
5.1.7 Vaasa (Stormossen) Wastes Treatment Plant INTRODUCTION The Stormossen Wastes Treatment and Disposal site is a few kilometres outside the town of Vaasa (Finland). The town of Vaasa is located on Finland’s west coast (latitude 63°N) and has approximately 60,000 inhabitants. It is a popular tourist destination and prides itself on its beautiful scenery and ‘green’ image. In the mid-1980s, Vaasa was confronted with a major environmental problem. The town’s landfill (which received the majority of municipal waste) was rapidly running out of space and there was no suitable site on which to construct a replacement facility. The problem was made even more difficult because the landfill belonging to the neighbouring town of Mustasaari was also running out of space. As a result, the two communities decided to develop an advanced waste treatment system, which would dramatically reduce the amount of landfill space needed in the future (Fujita Research website, accessed June 2006). The goal originally set for the new treatment system was to reduce the quantity of waste disposed in landfills by 70%. This was to be achieved by six methods:
• Source sorting of waste. • Achieving high recovery of metals, furniture and other recyclable goods. • Using biodegradable waste to produce biogas and humus (soil). • Using biogas produced as fuel in electricity generation. • Using humus produced in park maintenance. • Burning combustible waste to produce electricity.
Reducing the amount of waste sent to landfills requires fairly good separation of different types of waste. Thus, several years before the new waste plants were up and running, it was decided to ask every household in the region to begin sorting their domestic waste. The aim of such an early start was to get citizens accustomed to sorting waste, but an immediate benefit was also noted. The levels of waste produced per household began to fall. It became obvious that merely thinking about waste was affecting the way people bought packaged goods, causing them to behave in a more ‘environmentally-friendly’ manner. Over 90% of the population sorted their waste correctly, and some 80% expressed positive comments about the sorting process. For this reason the local government had cause to believe the ‘Vaasa Project’ would be a great success from an early stage (Fujita Research website, accessed June 2006). The heart of the Vaasa project, the Stormossen Wastes Treatment Plant, began operation in 1991. The plant receives waste from Vaasa, Mustasaari, and (since 1994) the Ekorosk waste company. In total the plant receives ‘kitchen waste’ from around 300,000 people. The MBT plant at Stormossen treats 42,000 tpa of ‘kitchen waste’, with 15,000 tpa progressing to the biological treatment stage. In the Vaasa region ‘kitchen waste’ includes packaging material, such as unrecyclable paper and card, and unrecyclable plastics, as can be observed in Figure 134. The plant is owned by Ab Avfallsservice Stormossen Jatehuoloto Oy (Stormossen), which is owned by the city of Vaasa (50%) and 7 surrounding municipalities (shown in Figure 135). The eight shareholding municipalities (shown in Figure 135 in yellow) have a combined population of 96,000. The Stormossen plant also receives ‘kitchen waste’ from Ekorosk province (to the north of the owning municipalities) and Botniarosk (to the south of the owning municipalities). Ab ASJ Oy has 35 employees and had a turnover of approximately
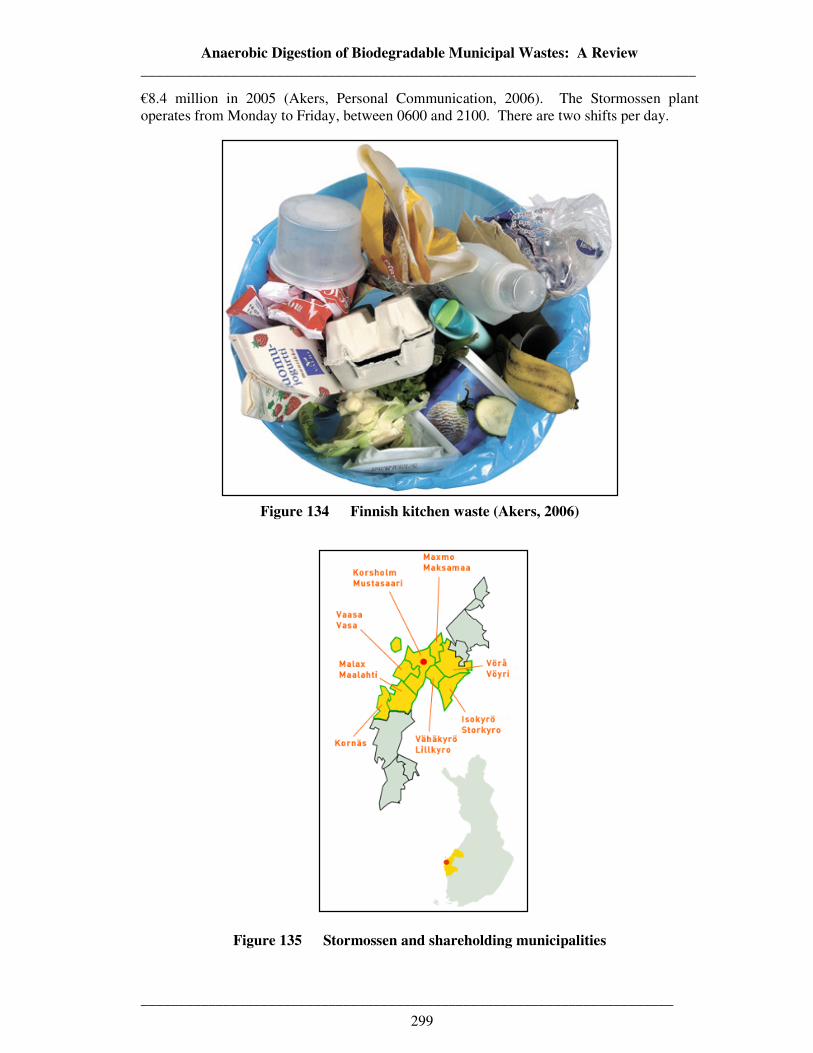
Anaerobic Digestion of Biodegradable Municipal Wastes: A Review __________________________________________________________________________
_______________________________________________________________________
299
€8.4 million in 2005 (Akers, Personal Communication, 2006). The Stormossen plant operates from Monday to Friday, between 0600 and 2100. There are two shifts per day.
Figure 134 Finnish kitchen waste (Akers, 2006)
Figure 135 Stormossen and shareholding municipalities
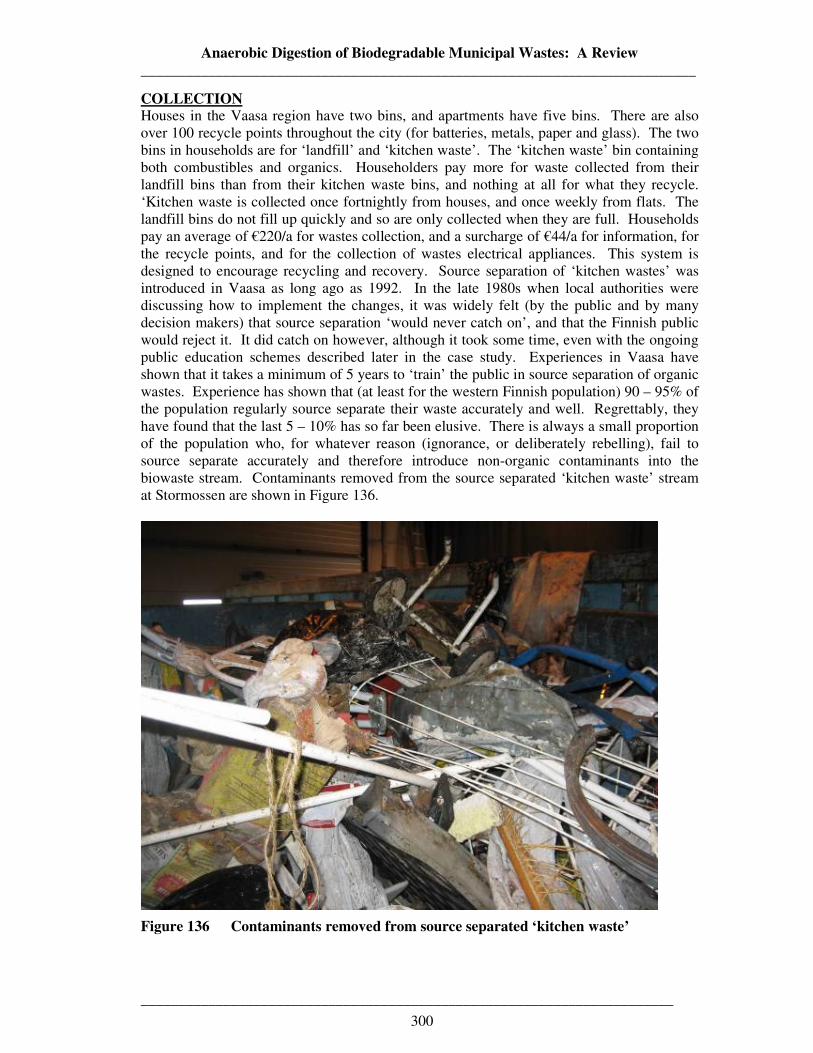
Anaerobic Digestion of Biodegradable Municipal Wastes: A Review __________________________________________________________________________
_______________________________________________________________________
300
COLLECTION Houses in the Vaasa region have two bins, and apartments have five bins. There are also over 100 recycle points throughout the city (for batteries, metals, paper and glass). The two bins in households are for ‘landfill’ and ‘kitchen waste’. The ‘kitchen waste’ bin containing both combustibles and organics. Householders pay more for waste collected from their landfill bins than from their kitchen waste bins, and nothing at all for what they recycle. ‘Kitchen waste is collected once fortnightly from houses, and once weekly from flats. The landfill bins do not fill up quickly and so are only collected when they are full. Households pay an average of €220/a for wastes collection, and a surcharge of €44/a for information, for the recycle points, and for the collection of wastes electrical appliances. This system is designed to encourage recycling and recovery. Source separation of ‘kitchen wastes’ was introduced in Vaasa as long ago as 1992. In the late 1980s when local authorities were discussing how to implement the changes, it was widely felt (by the public and by many decision makers) that source separation ‘would never catch on’, and that the Finnish public would reject it. It did catch on however, although it took some time, even with the ongoing public education schemes described later in the case study. Experiences in Vaasa have shown that it takes a minimum of 5 years to ‘train’ the public in source separation of organic wastes. Experience has shown that (at least for the western Finnish population) 90 – 95% of the population regularly source separate their waste accurately and well. Regrettably, they have found that the last 5 – 10% has so far been elusive. There is always a small proportion of the population who, for whatever reason (ignorance, or deliberately rebelling), fail to source separate accurately and therefore introduce non-organic contaminants into the biowaste stream. Contaminants removed from the source separated ‘kitchen waste’ stream at Stormossen are shown in Figure 136.
Figure 136 Contaminants removed from source separated ‘kitchen waste’
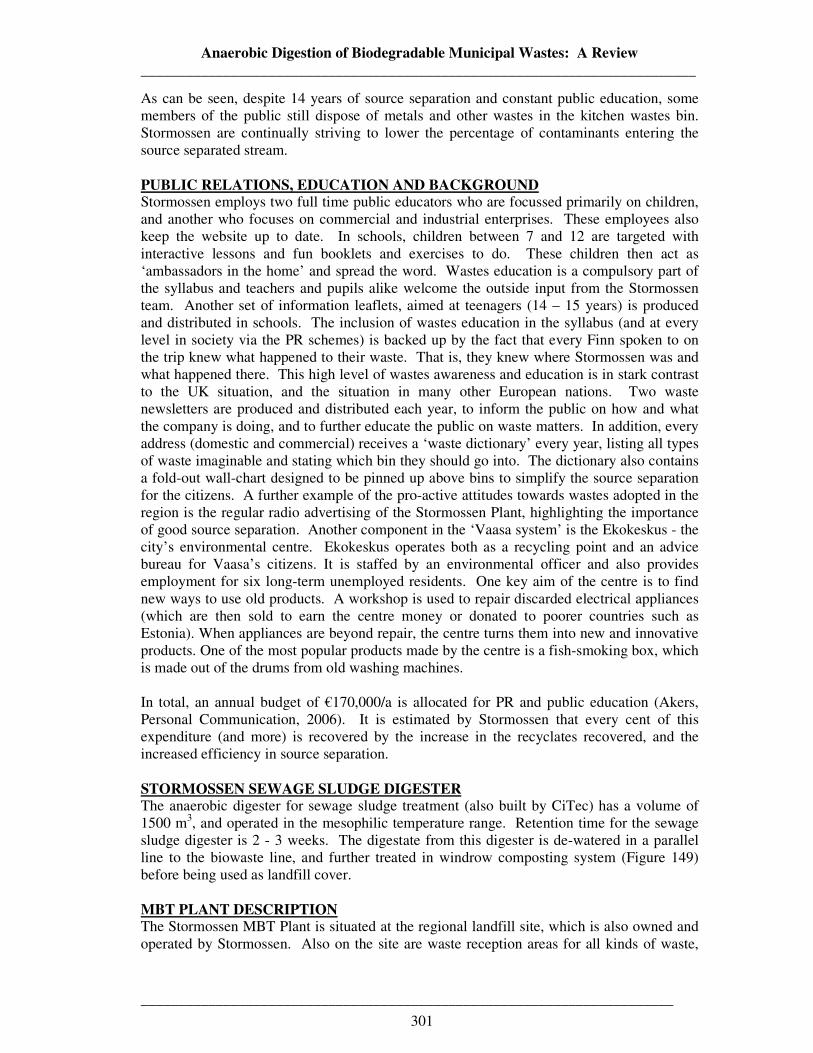
Anaerobic Digestion of Biodegradable Municipal Wastes: A Review __________________________________________________________________________
_______________________________________________________________________
301
As can be seen, despite 14 years of source separation and constant public education, some members of the public still dispose of metals and other wastes in the kitchen wastes bin. Stormossen are continually striving to lower the percentage of contaminants entering the source separated stream. PUBLIC RELATIONS, EDUCATION AND BACKGROUND Stormossen employs two full time public educators who are focussed primarily on children, and another who focuses on commercial and industrial enterprises. These employees also keep the website up to date. In schools, children between 7 and 12 are targeted with interactive lessons and fun booklets and exercises to do. These children then act as ‘ambassadors in the home’ and spread the word. Wastes education is a compulsory part of the syllabus and teachers and pupils alike welcome the outside input from the Stormossen team. Another set of information leaflets, aimed at teenagers (14 – 15 years) is produced and distributed in schools. The inclusion of wastes education in the syllabus (and at every level in society via the PR schemes) is backed up by the fact that every Finn spoken to on the trip knew what happened to their waste. That is, they knew where Stormossen was and what happened there. This high level of wastes awareness and education is in stark contrast to the UK situation, and the situation in many other European nations. Two waste newsletters are produced and distributed each year, to inform the public on how and what the company is doing, and to further educate the public on waste matters. In addition, every address (domestic and commercial) receives a ‘waste dictionary’ every year, listing all types of waste imaginable and stating which bin they should go into. The dictionary also contains a fold-out wall-chart designed to be pinned up above bins to simplify the source separation for the citizens. A further example of the pro-active attitudes towards wastes adopted in the region is the regular radio advertising of the Stormossen Plant, highlighting the importance of good source separation. Another component in the ‘Vaasa system’ is the Ekokeskus - the city’s environmental centre. Ekokeskus operates both as a recycling point and an advice bureau for Vaasa’s citizens. It is staffed by an environmental officer and also provides employment for six long-term unemployed residents. One key aim of the centre is to find new ways to use old products. A workshop is used to repair discarded electrical appliances (which are then sold to earn the centre money or donated to poorer countries such as Estonia). When appliances are beyond repair, the centre turns them into new and innovative products. One of the most popular products made by the centre is a fish-smoking box, which is made out of the drums from old washing machines. In total, an annual budget of €170,000/a is allocated for PR and public education (Akers, Personal Communication, 2006). It is estimated by Stormossen that every cent of this expenditure (and more) is recovered by the increase in the recyclates recovered, and the increased efficiency in source separation. STORMOSSEN SEWAGE SLUDGE DIGESTER The anaerobic digester for sewage sludge treatment (also built by CiTec) has a volume of 1500 m3, and operated in the mesophilic temperature range. Retention time for the sewage sludge digester is 2 - 3 weeks. The digestate from this digester is de-watered in a parallel line to the biowaste line, and further treated in windrow composting system (Figure 149) before being used as landfill cover. MBT PLANT DESCRIPTION The Stormossen MBT Plant is situated at the regional landfill site, which is also owned and operated by Stormossen. Also on the site are waste reception areas for all kinds of waste,
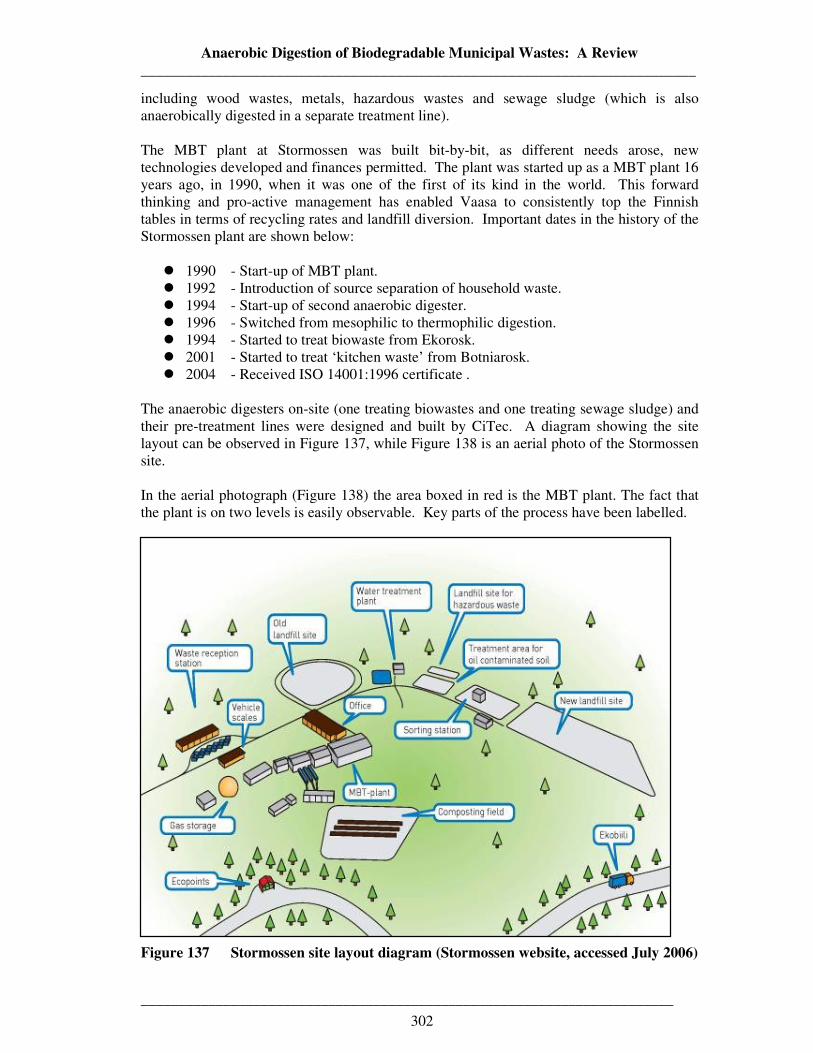
Anaerobic Digestion of Biodegradable Municipal Wastes: A Review __________________________________________________________________________
_______________________________________________________________________
302
including wood wastes, metals, hazardous wastes and sewage sludge (which is also anaerobically digested in a separate treatment line). The MBT plant at Stormossen was built bit-by-bit, as different needs arose, new technologies developed and finances permitted. The plant was started up as a MBT plant 16 years ago, in 1990, when it was one of the first of its kind in the world. This forward thinking and pro-active management has enabled Vaasa to consistently top the Finnish tables in terms of recycling rates and landfill diversion. Important dates in the history of the Stormossen plant are shown below:
� 1990 - Start-up of MBT plant. � 1992 - Introduction of source separation of household waste. � 1994 - Start-up of second anaerobic digester. � 1996 - Switched from mesophilic to thermophilic digestion. � 1994 - Started to treat biowaste from Ekorosk. � 2001 - Started to treat ‘kitchen waste’ from Botniarosk. � 2004 - Received ISO 14001:1996 certificate .
The anaerobic digesters on-site (one treating biowastes and one treating sewage sludge) and their pre-treatment lines were designed and built by CiTec. A diagram showing the site layout can be observed in Figure 137, while Figure 138 is an aerial photo of the Stormossen site. In the aerial photograph (Figure 138) the area boxed in red is the MBT plant. The fact that the plant is on two levels is easily observable. Key parts of the process have been labelled.
Figure 137 Stormossen site layout diagram (Stormossen website, accessed July 2006)
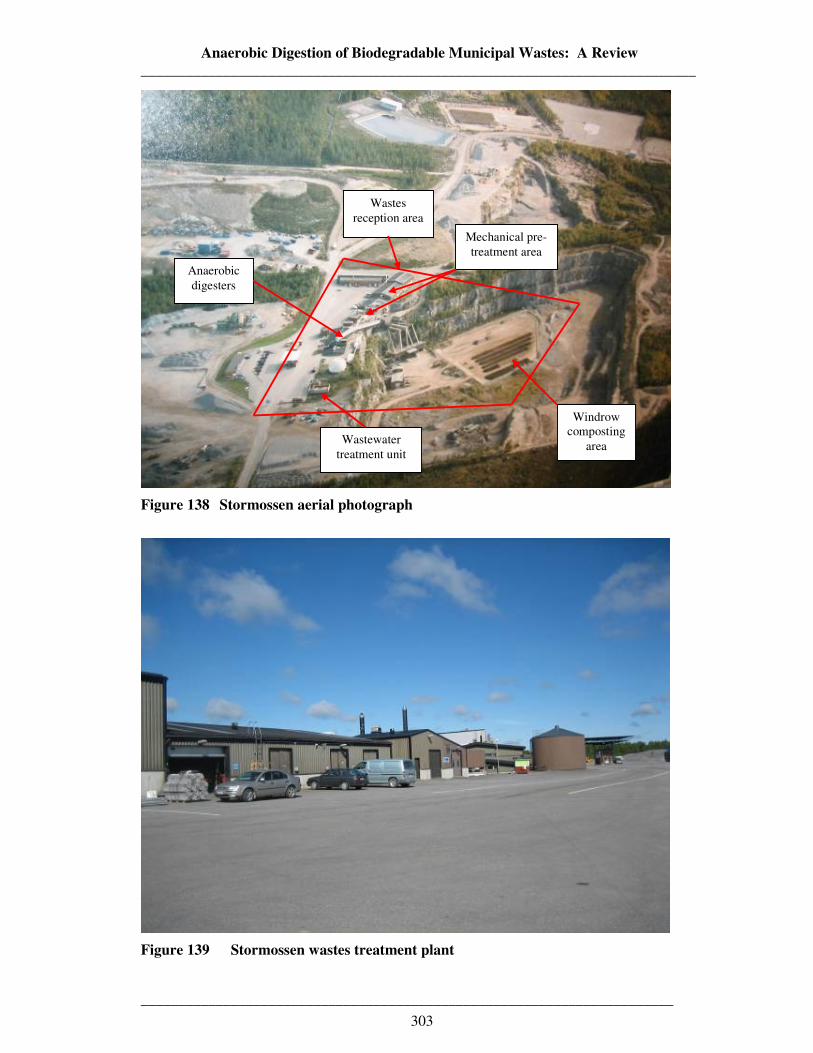
Anaerobic Digestion of Biodegradable Municipal Wastes: A Review __________________________________________________________________________
_______________________________________________________________________
303
Figure 138 Stormossen aerial photograph
Figure 139 Stormossen wastes treatment plant
Anaerobic digesters
Wastes reception area
Mechanical pre-treatment area
Windrow composting
area Wastewater treatment unit
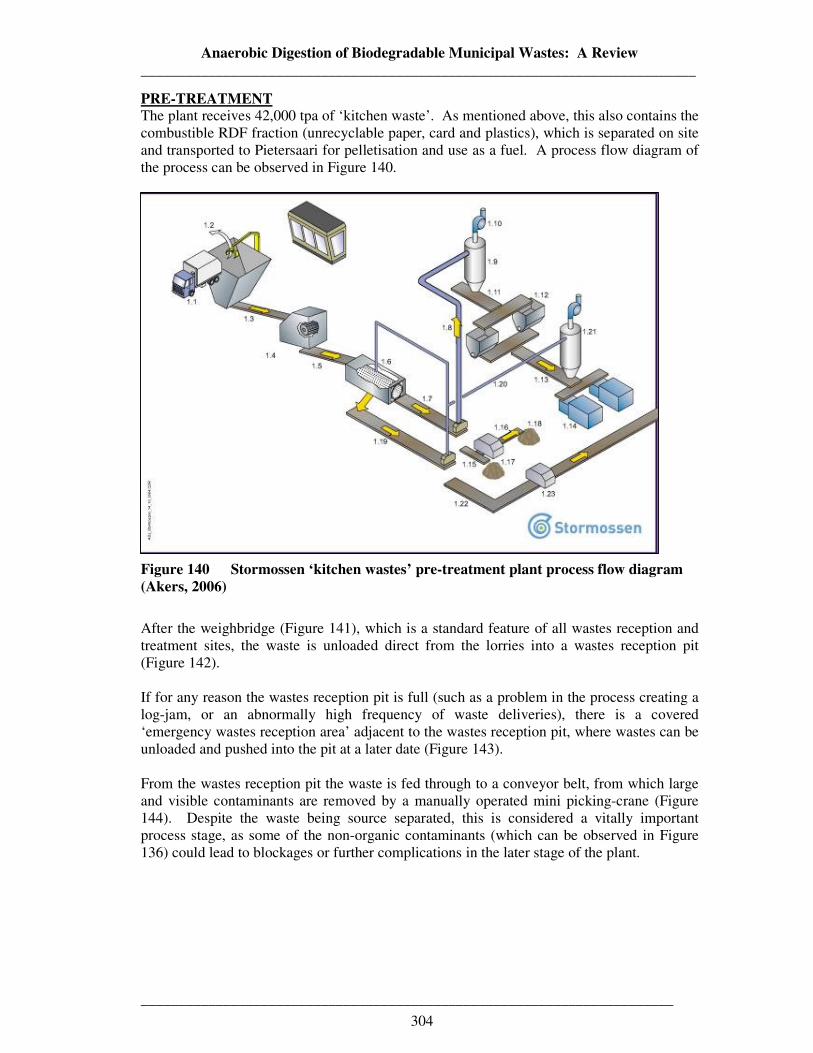
Anaerobic Digestion of Biodegradable Municipal Wastes: A Review __________________________________________________________________________
_______________________________________________________________________
304
PRE-TREATMENT The plant receives 42,000 tpa of ‘kitchen waste’. As mentioned above, this also contains the combustible RDF fraction (unrecyclable paper, card and plastics), which is separated on site and transported to Pietersaari for pelletisation and use as a fuel. A process flow diagram of the process can be observed in Figure 140.
Figure 140 Stormossen ‘kitchen wastes’ pre-treatment plant process flow diagram (Akers, 2006)
After the weighbridge (Figure 141), which is a standard feature of all wastes reception and treatment sites, the waste is unloaded direct from the lorries into a wastes reception pit (Figure 142). If for any reason the wastes reception pit is full (such as a problem in the process creating a log-jam, or an abnormally high frequency of waste deliveries), there is a covered ‘emergency wastes reception area’ adjacent to the wastes reception pit, where wastes can be unloaded and pushed into the pit at a later date (Figure 143). From the wastes reception pit the waste is fed through to a conveyor belt, from which large and visible contaminants are removed by a manually operated mini picking-crane (Figure 144). Despite the waste being source separated, this is considered a vitally important process stage, as some of the non-organic contaminants (which can be observed in Figure 136) could lead to blockages or further complications in the later stage of the plant.
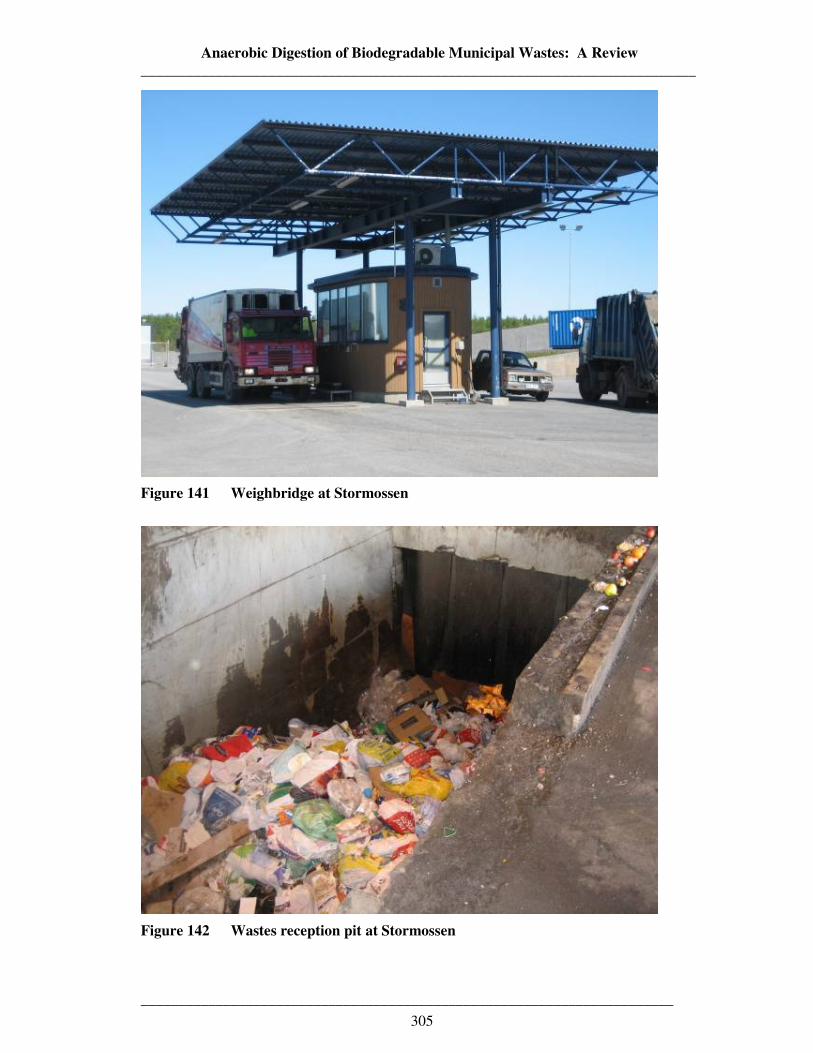
Anaerobic Digestion of Biodegradable Municipal Wastes: A Review __________________________________________________________________________
_______________________________________________________________________
305
Figure 141 Weighbridge at Stormossen
Figure 142 Wastes reception pit at Stormossen

Anaerobic Digestion of Biodegradable Municipal Wastes: A Review __________________________________________________________________________
_______________________________________________________________________
306
Figure 143 Emergency wastes reception area, dropping into wastes reception pit
Figure 144 Mini-crane for removal of large non-organic contaminants
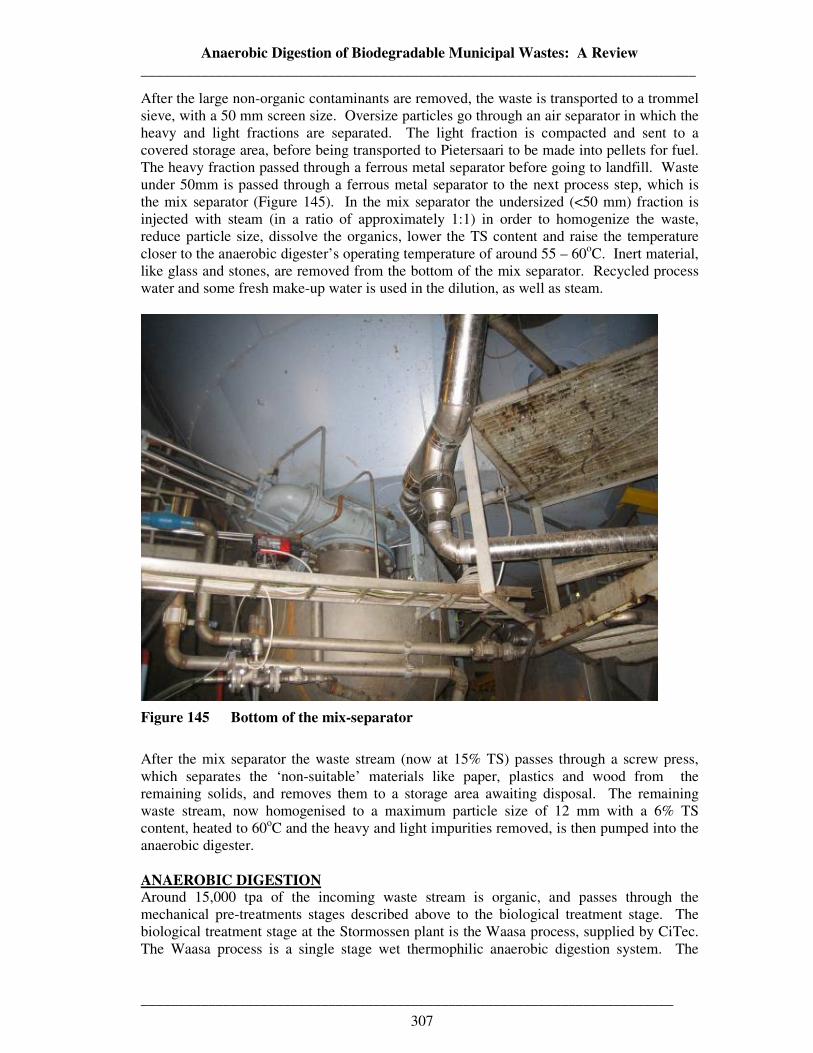
Anaerobic Digestion of Biodegradable Municipal Wastes: A Review __________________________________________________________________________
_______________________________________________________________________
307
After the large non-organic contaminants are removed, the waste is transported to a trommel sieve, with a 50 mm screen size. Oversize particles go through an air separator in which the heavy and light fractions are separated. The light fraction is compacted and sent to a covered storage area, before being transported to Pietersaari to be made into pellets for fuel. The heavy fraction passed through a ferrous metal separator before going to landfill. Waste under 50mm is passed through a ferrous metal separator to the next process step, which is the mix separator (Figure 145). In the mix separator the undersized (<50 mm) fraction is injected with steam (in a ratio of approximately 1:1) in order to homogenize the waste, reduce particle size, dissolve the organics, lower the TS content and raise the temperature closer to the anaerobic digester’s operating temperature of around 55 – 60oC. Inert material, like glass and stones, are removed from the bottom of the mix separator. Recycled process water and some fresh make-up water is used in the dilution, as well as steam.
Figure 145 Bottom of the mix-separator
After the mix separator the waste stream (now at 15% TS) passes through a screw press, which separates the ‘non-suitable’ materials like paper, plastics and wood from the remaining solids, and removes them to a storage area awaiting disposal. The remaining waste stream, now homogenised to a maximum particle size of 12 mm with a 6% TS content, heated to 60oC and the heavy and light impurities removed, is then pumped into the anaerobic digester. ANAEROBIC DIGESTION Around 15,000 tpa of the incoming waste stream is organic, and passes through the mechanical pre-treatments stages described above to the biological treatment stage. The biological treatment stage at the Stormossen plant is the Waasa process, supplied by CiTec. The Waasa process is a single stage wet thermophilic anaerobic digestion system. The
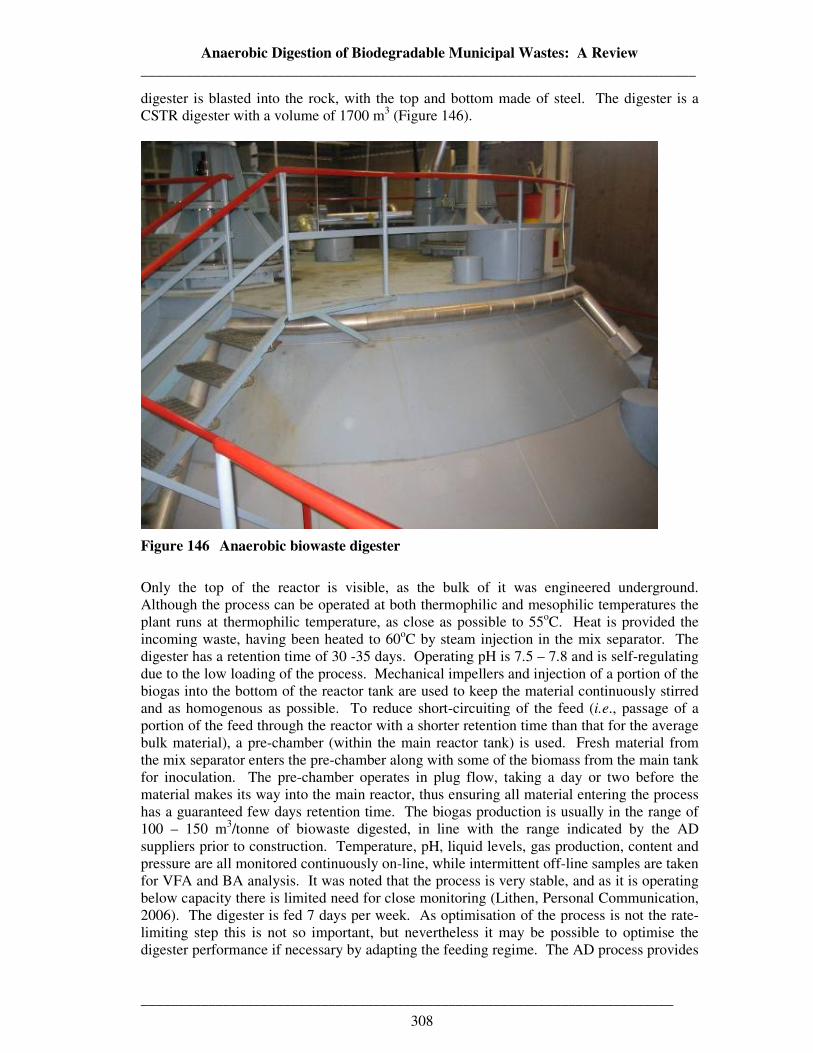
Anaerobic Digestion of Biodegradable Municipal Wastes: A Review __________________________________________________________________________
_______________________________________________________________________
308
digester is blasted into the rock, with the top and bottom made of steel. The digester is a CSTR digester with a volume of 1700 m3 (Figure 146).
Figure 146 Anaerobic biowaste digester
Only the top of the reactor is visible, as the bulk of it was engineered underground. Although the process can be operated at both thermophilic and mesophilic temperatures the plant runs at thermophilic temperature, as close as possible to 55oC. Heat is provided the incoming waste, having been heated to 60oC by steam injection in the mix separator. The digester has a retention time of 30 -35 days. Operating pH is 7.5 – 7.8 and is self-regulating due to the low loading of the process. Mechanical impellers and injection of a portion of the biogas into the bottom of the reactor tank are used to keep the material continuously stirred and as homogenous as possible. To reduce short-circuiting of the feed (i.e., passage of a portion of the feed through the reactor with a shorter retention time than that for the average bulk material), a pre-chamber (within the main reactor tank) is used. Fresh material from the mix separator enters the pre-chamber along with some of the biomass from the main tank for inoculation. The pre-chamber operates in plug flow, taking a day or two before the material makes its way into the main reactor, thus ensuring all material entering the process has a guaranteed few days retention time. The biogas production is usually in the range of 100 – 150 m3/tonne of biowaste digested, in line with the range indicated by the AD suppliers prior to construction. Temperature, pH, liquid levels, gas production, content and pressure are all monitored continuously on-line, while intermittent off-line samples are taken for VFA and BA analysis. It was noted that the process is very stable, and as it is operating below capacity there is limited need for close monitoring (Lithen, Personal Communication, 2006). The digester is fed 7 days per week. As optimisation of the process is not the rate-limiting step this is not so important, but nevertheless it may be possible to optimise the digester performance if necessary by adapting the feeding regime. The AD process provides
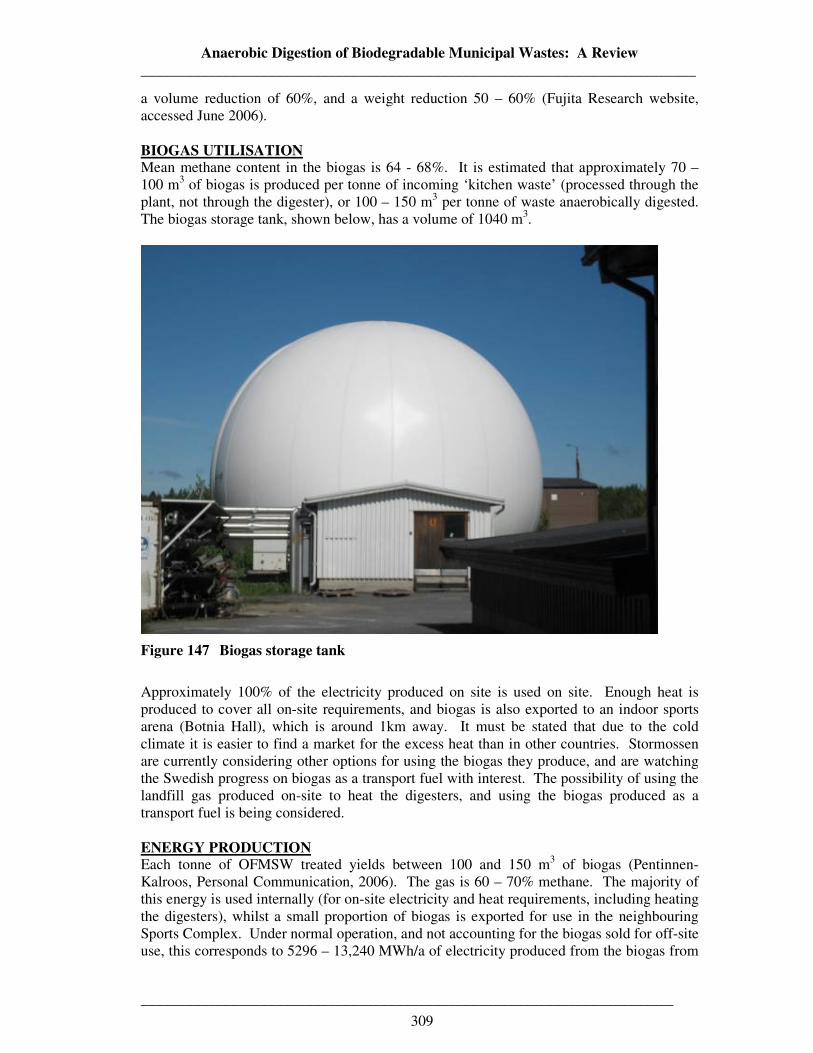
Anaerobic Digestion of Biodegradable Municipal Wastes: A Review __________________________________________________________________________
_______________________________________________________________________
309
a volume reduction of 60%, and a weight reduction 50 – 60% (Fujita Research website, accessed June 2006). BIOGAS UTILISATION Mean methane content in the biogas is 64 - 68%. It is estimated that approximately 70 – 100 m3 of biogas is produced per tonne of incoming ‘kitchen waste’ (processed through the plant, not through the digester), or 100 – 150 m3 per tonne of waste anaerobically digested. The biogas storage tank, shown below, has a volume of 1040 m3.
Figure 147 Biogas storage tank
Approximately 100% of the electricity produced on site is used on site. Enough heat is produced to cover all on-site requirements, and biogas is also exported to an indoor sports arena (Botnia Hall), which is around 1km away. It must be stated that due to the cold climate it is easier to find a market for the excess heat than in other countries. Stormossen are currently considering other options for using the biogas they produce, and are watching the Swedish progress on biogas as a transport fuel with interest. The possibility of using the landfill gas produced on-site to heat the digesters, and using the biogas produced as a transport fuel is being considered. ENERGY PRODUCTION Each tonne of OFMSW treated yields between 100 and 150 m3 of biogas (Pentinnen-Kalroos, Personal Communication, 2006). The gas is 60 – 70% methane. The majority of this energy is used internally (for on-site electricity and heat requirements, including heating the digesters), whilst a small proportion of biogas is exported for use in the neighbouring Sports Complex. Under normal operation, and not accounting for the biogas sold for off-site use, this corresponds to 5296 – 13,240 MWh/a of electricity produced from the biogas from
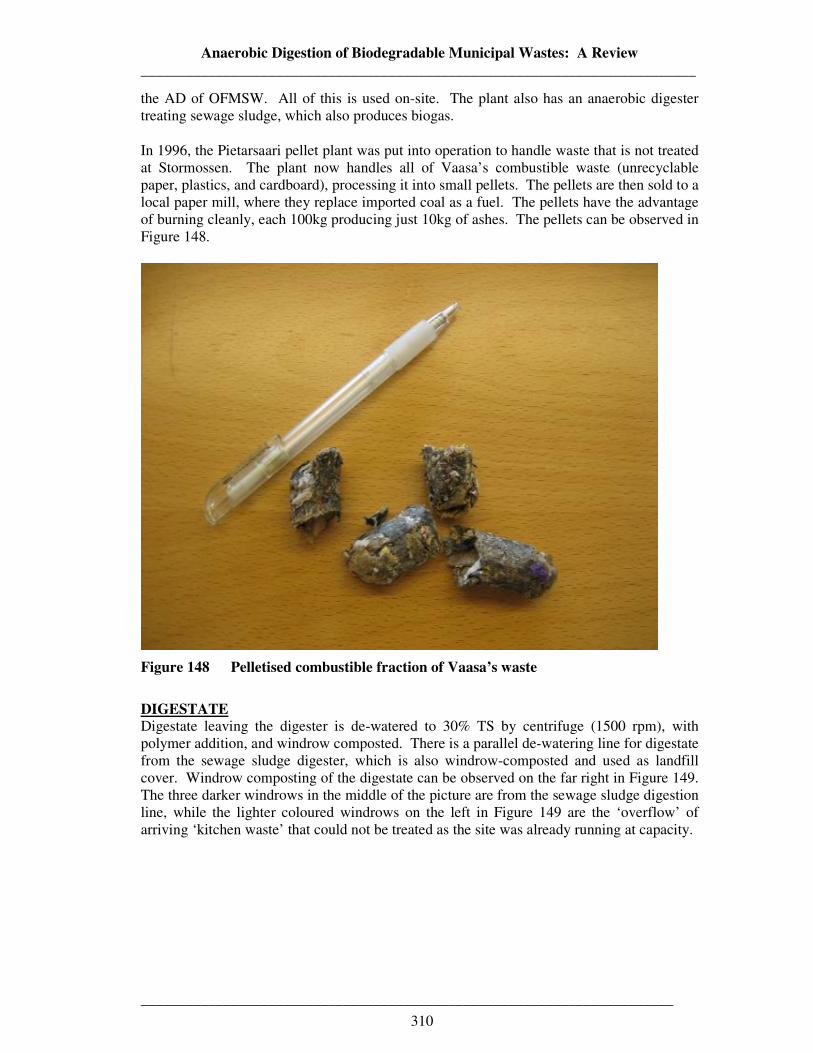
Anaerobic Digestion of Biodegradable Municipal Wastes: A Review __________________________________________________________________________
_______________________________________________________________________
310
the AD of OFMSW. All of this is used on-site. The plant also has an anaerobic digester treating sewage sludge, which also produces biogas.
In 1996, the Pietarsaari pellet plant was put into operation to handle waste that is not treated at Stormossen. The plant now handles all of Vaasa’s combustible waste (unrecyclable paper, plastics, and cardboard), processing it into small pellets. The pellets are then sold to a local paper mill, where they replace imported coal as a fuel. The pellets have the advantage of burning cleanly, each 100kg producing just 10kg of ashes. The pellets can be observed in Figure 148.
Figure 148 Pelletised combustible fraction of Vaasa’s waste
DIGESTATE Digestate leaving the digester is de-watered to 30% TS by centrifuge (1500 rpm), with polymer addition, and windrow composted. There is a parallel de-watering line for digestate from the sewage sludge digester, which is also windrow-composted and used as landfill cover. Windrow composting of the digestate can be observed on the far right in Figure 149. The three darker windrows in the middle of the picture are from the sewage sludge digestion line, while the lighter coloured windrows on the left in Figure 149 are the ‘overflow’ of arriving ‘kitchen waste’ that could not be treated as the site was already running at capacity.
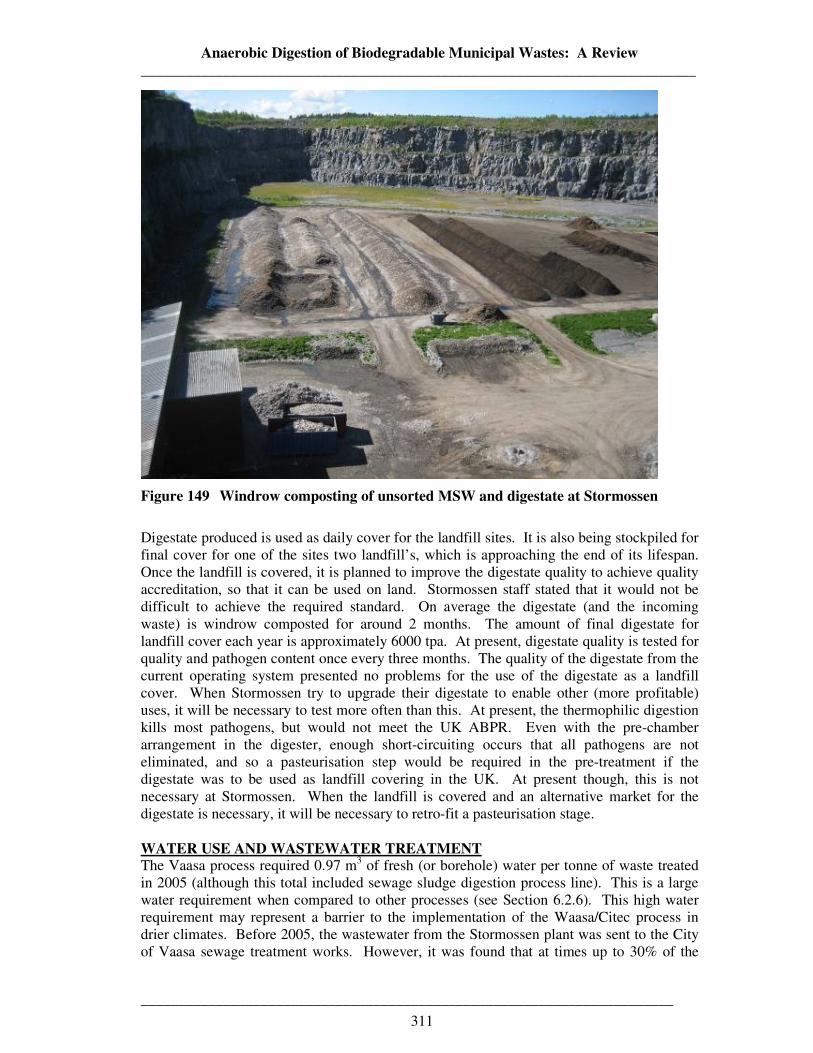
Anaerobic Digestion of Biodegradable Municipal Wastes: A Review __________________________________________________________________________
_______________________________________________________________________
311
Figure 149 Windrow composting of unsorted MSW and digestate at Stormossen
Digestate produced is used as daily cover for the landfill sites. It is also being stockpiled for final cover for one of the sites two landfill’s, which is approaching the end of its lifespan. Once the landfill is covered, it is planned to improve the digestate quality to achieve quality accreditation, so that it can be used on land. Stormossen staff stated that it would not be difficult to achieve the required standard. On average the digestate (and the incoming waste) is windrow composted for around 2 months. The amount of final digestate for landfill cover each year is approximately 6000 tpa. At present, digestate quality is tested for quality and pathogen content once every three months. The quality of the digestate from the current operating system presented no problems for the use of the digestate as a landfill cover. When Stormossen try to upgrade their digestate to enable other (more profitable) uses, it will be necessary to test more often than this. At present, the thermophilic digestion kills most pathogens, but would not meet the UK ABPR. Even with the pre-chamber arrangement in the digester, enough short-circuiting occurs that all pathogens are not eliminated, and so a pasteurisation step would be required in the pre-treatment if the digestate was to be used as landfill covering in the UK. At present though, this is not necessary at Stormossen. When the landfill is covered and an alternative market for the digestate is necessary, it will be necessary to retro-fit a pasteurisation stage. WATER USE AND WASTEWATER TREATMENT The Vaasa process required 0.97 m3 of fresh (or borehole) water per tonne of waste treated in 2005 (although this total included sewage sludge digestion process line). This is a large water requirement when compared to other processes (see Section 6.2.6). This high water requirement may represent a barrier to the implementation of the Waasa/Citec process in drier climates. Before 2005, the wastewater from the Stormossen plant was sent to the City of Vaasa sewage treatment works. However, it was found that at times up to 30% of the