
Anaerobic Digestion Feasibility Study - King County
113
Anaerobic Digestion Feasibility Study King County, Washington October 2, 2017
Transcript of Anaerobic Digestion Feasibility Study - King County

Anaerobic Digestion Feasibility Study
King County, Washington October 2, 2017

Anaerobic Digestion Feasibility Study
This page is intentionally left blank.

Anaerobic Digestion Feasibility Study
King County, Washington
Prepared by: Tim Raibley, P.E Andrea Ramirez, P.E Pepi Ursillo, P.E.

Anaerobic Digestion Feasibility Study
Certificate of Engineer King County Anaerobic Digestion Feasibility Study The material and data contained in this report were prepared under the direction and supervision of the undersigned, whose seal as a professional engineer, licensed to practice in the State of Washington, is affixed below.
_____________________________________
Tim Raibley, P.E. 44393 Exp. Nov. 12, 2018 HDR

Anaerobic Digestion Feasibility Study
October 2, 2017 | i
Contents
Executive Summary ................................................................................................................................. 1
1 Introduction .................................................................................................................................... 6 1.1 Project Background .............................................................................................................. 6
2 Organics Management in King County............................................................................................ 7 2.1 Collection ............................................................................................................................. 7
2.1.1 King County Cities.................................................................................................... 7 2.1.2 Vashon Island .......................................................................................................... 8 2.1.3 Other Unincorporated Areas of King County ............................................................. 8 2.1.4 City of Seattle .......................................................................................................... 8
2.2 Processing ........................................................................................................................... 9 2.2.1 Compost Facilities .................................................................................................... 9 2.2.2 Pilot Projects .......................................................................................................... 11
2.3 Anaerobic Digestion Facilities ............................................................................................. 12 2.3.1 Wastewater Treatment Plants ................................................................................ 12 2.3.2 Dairy Digesters ...................................................................................................... 13 2.3.3 Proposed AD Projects ............................................................................................ 15
2.4 Quantities and Characteristics ............................................................................................ 17 2.4.1 Materials Controlled by the King County Solid Waste Division ................................ 17 2.4.2 Materials Not Controlled by the King County Solid Waste Division .......................... 18
3 Overview of Anaerobic Digestion Technologies ............................................................................ 21 3.1 Technology Overview ......................................................................................................... 21 3.2 AD Process Overview ......................................................................................................... 21
3.2.1 Preprocessing Sorting Systems .............................................................................. 23 3.2.2 Preprocessing Press Systems ................................................................................ 25 3.2.3 Other Types of Preprocessing Systems .................................................................. 28
3.3 Processing Types for Anaerobic Digestion Systems ............................................................ 30 3.3.1 Co-digestion at a Wastewater Treatment Plant (Wet Digestion, Low-Solids) ........... 31 3.3.2 Wet Digestion – Stirred Tank .................................................................................. 34 3.3.3 Wet Digestion – Plug Flow ..................................................................................... 37 3.3.4 Dry Fermentation ................................................................................................... 39
3.4 Large-Scale Versus Small-Scale Systems .......................................................................... 41 3.4.1 Small-Scale – Distributed Systems ......................................................................... 41 3.4.2 Large-Scale – Centralized Systems ........................................................................ 42
4 Exploration of Potential Anaerobic Digestion Development Opportunities ..................................... 43 4.1 Exploration of Potential Partnerships .................................................................................. 44 4.2 Renton Wastewater Treatment Plant (County Wastewater Treatment Division) ................... 45 4.3 Cedar Grove ....................................................................................................................... 47 4.4 Impact Bioenergy................................................................................................................ 48 4.5 Lenz Enterprises................................................................................................................. 50 4.6 PacifiClean ......................................................................................................................... 50 4.7 Waste Management ........................................................................................................... 51 4.8 Recology ............................................................................................................................ 51

Anaerobic Digestion Feasibility Study
ii | October 2, 2017
5 Potential Partnerships Technical Observations ............................................................................. 52
6 Potential Partnership Consideration of Strategies ......................................................................... 54 6.1 Strategy 1: Distributed/Managed Anaerobic Digestion from Source-Separated
Organics ............................................................................................................................. 54 6.2 Strategy 2: Distributed/Independent Anaerobic Digestion from Source-Separated
Organics or Organic Fraction of Municipal Solid Waste ....................................................... 58 6.3 Strategy 3: Centralized Wastewater Treatment Plan Dedicated or Co-digested
Anaerobic Digestion using the Organic Fraction of Municipal Solid Waste ........................... 60 6.4 Strategy 4: Regional Anaerobic Digestion at County Transfer Stations from the
Organic Fraction of Municipal Solid Waste .......................................................................... 63 6.5 Strategy 5: Mandatory Diversion Program ........................................................................... 66 6.6 Summary of Key Benefits and Limitations of Strategies....................................................... 70
7 Economic Analysis ....................................................................................................................... 71 7.1 Identification of Three Scenarios for Economic and GHG Analysis ...................................... 71 7.2 Scenario 1 – Small Distributed AD System.......................................................................... 72 7.3 Scenario 2 – AD at the South WWTP .................................................................................. 73 7.4 Scenario 3 – Dedicated Anaerobic Digestion at County Transfer Stations ........................... 75
8 Greenhouse Gas Analysis ............................................................................................................ 79 8.1 WARM................................................................................................................................ 79 8.2 WARM General Assumptions ............................................................................................. 79 8.3 GHG Scenarios .................................................................................................................. 81 8.4 GHG Results ...................................................................................................................... 82
Tables
Table ES-1. Overview of Scenario Costs ................................................................................................ 4 Table 2-1. Projected Tons Recovered and Disposed, King County Organics .......................................... 18 Table 2-2. Annual Tons of Organic Materials from Seattle Self-Haul, Residential and Commercial
Generators ................................................................................................................................ 19 Table 6-1. Strategy Benefits and Limitations .......................................................................................... 70 Table 7-1. Scenario 1: Summary of Costs for Small Distributed Digester Unit ......................................... 73 Table 7-2. Scenario 2: Co-Digestion at South WWTP after Bow Lake Transfer Station ........................... 74 Table 7-3. Scenario 3A: Mid-sized MSW System (60,000 tons per year) at Transfer Station ................... 77 Table 7-4. Scenario 3B: Large Volume MSW System at Bow Lake Transfer Station ............................... 77 Table 7-5. Overview of Cost per Scenario .............................................................................................. 78 Table 8-1. WARM Results ..................................................................................................................... 83

Anaerobic Digestion Feasibility Study
October 2, 2017 | iii
Figures
Figure 2-1. Estimated Tons Recovered and Disposed by Material Type, King County Organics, 2012 ......................................................................................................................................... 18
Figure 3-1. Flow Diagram for Generic Anaerobic Digestion Process ....................................................... 23 Figure 3-2. Mechanical Sorting - Disc Screen of Organics Feedstock ..................................................... 24 Figure 3-3. Manual Sorting of Organics .................................................................................................. 24 Figure 3-4. Rothmuhle Biogas Plant: Incoming Organic Material Stream (SSO) ..................................... 26 Figure 3-5. FITEC, Rothmuhle Biogas Plant: Biosqueeze Unit ............................................................... 26 Figure 3-6. FITEC, Rothmuhle Biogas Plant: Extruded Solid Fraction from Biosqueeze Unit .................. 27 Figure 3-7. Anaergia, OREX, Kaiserslautern: Feed Hopper (right), OREX Press (bottom left) ................. 27 Figure 3-8. Anaergia, OREX, Kaiserslautern: Organics Polishing System............................................... 28 Figure 3-9. 250 Tons per Day CORe® System in New York, NY ............................................................. 29 Figure 3-10. Receiving and Feed-in Station Tank Located Adjacent to the NYCDEP WWTP
Anaerobic Digesters .................................................................................................................. 29 Figure 3-11. The NYCDEP WWTP Anaerobic Digesters ........................................................................ 30 Figure 3-12. Food Waste Delivery at EBMUD WWTP ............................................................................ 32 Figure 3-13. Food Waste at Marin Sanitary Service ............................................................................... 33 Figure 3-14. Food Waste and FOG Receiving Facility at CSMA ............................................................. 34 Figure 3-15. Clean World Anaerobic Digestion Facility in Sacramento, California ................................... 35 Figure 3-16. CNG Fueling Station from Biogas Produced at the Clean World Anaerobic Digestion
Facility in Sacramento California ............................................................................................... 35 Figure 3-17. Biogas Upgrading System at the Clean World Anaerobic Digestion Facility in
Sacramento, California .............................................................................................................. 36 Figure 3-18. JC-Biomethane’s Anaerobic Digestion Facility in Junction City, Oregon .............................. 37 Figure 3-19. Illustration of a Horizontal Plug Flow Digester..................................................................... 38 Figure 3-20. Vertical Plug Flow Digester ................................................................................................ 38 Figure 3-21. Example of Bunker type - Dry Fermentation Process.......................................................... 39 Figure 3-22. ZWED Dry Fermentation Facility in San Jose, California .................................................... 40 Figure 3-23. ZWED Dry Fermentation Facility Bunkers in San Jose, California ....................................... 41 Figure 4-1. Waste Management Facilities in King County and Surrounding Areas .................................. 44 Figure 4-2. Renton Wastewater Treatment Plant .................................................................................... 46 Figure 4-3. Cedar Grove Everett Facility ................................................................................................ 48 Figure 4-4. Impact 25 Series Bioenergy System ..................................................................................... 49 Figure 4-5. Compost Turning at Lenz Enterprises .................................................................................. 50
Appendices
Appendix 1 – Renton Waste Water Treatment Plant Appendix 2 – Cedar Grove Appendix 3 – Impact Bioenergy Appendix 4 – Lenz Enterprises Appendix 5 – Waste Management Appendix 6 – WARM Results

Anaerobic Digestion Feasibility Study
iv | October 2, 2017
This page is intentionally left blank.

Anaerobic Digestion Feasibility Study
October 2, 2017 | 1
Executive Summary The King County Comprehensive Solid Waste Management Plan includes the following goals for improving the County’s solid waste system:
· Reaching zero waste of its resources; and
· Extending the life of the Cedar Hills Regional Landfill (CHRL).
To accomplish these goals, the King County Solid Waste Division (SWD) is exploring the viability of implementing a food waste1 to anaerobic digestion (AD) program. If attractive, the conversion of food waste to renewable energy or vehicle fuels could assist King County (County) in reaching its goal of increased diversion, extending the life of CHRL, as well as reducing its greenhouse gas footprint in accordance with the its Strategic Climate Action Plan.
Some of the most technically advanced composting facilities in the nation are located in the greater Puget Sound region. Because of this infrastructure and the long-standing tradition of collecting and composting source-separated organics (SSO), the markets for compost derived from SSO are fully developed. However, nearly one quarter of the County’s landfilled waste still consists of organic materials (such as food, yard trimmings and compostable paper). Capturing sufficient quantities of SSO that is of a suitable quality necessary for an AD facility poses unique challenges. To address this issue, this report explores whether local composters would be interested in using AD in addition to existing composting operations to manage food waste. HDR concludes the following key insights gained from this exploration:
1. The County reports nearly 300,000 tons of organic material are disposed of at the CHRL annually, despite a robust existing composting infrastructure operating at near-capacity levels.
2. The King County region benefits from a robust, privately owned compost infrastructure which composts the majority of green/yard waste feedstock. These private entities have a history of controlling these materials upstream of the County’s waste management infrastructure. Consequently, this study does not consider the digestion of co-collected green/yard wastes. This is an important differentiator from several communities who have recently employed dry fermentation systems using a co-collected yard/food waste feedstock. While the dry fermentation systems processing yard/food waste are attractive in terms of low cost, they were not included in the final scenario analysis due to the lack of availability of green/yard waste.
3. Capturing organic materials for AD will require increased generator participation for source-separated, low contamination feedstock, or the implementation of mechanical methods to extract organics from municipal solid waste (MSW).
1 The Washington Department of Ecology categorizes organics processing facilities that accept four sub-types for
food waste including: food waste pre- consumer; food processing waste; food waste post-consumer; and food waste all other. Source: WA State Composted Materials for 2015. August 2016.

Anaerobic Digestion Feasibility Study
2 | October 2, 2017
4. SSO materials are already being collected under private agreements with existing composters in the region who have expressed concerns about whether the County’s program would compete or otherwise interfere with these arrangements.
5. A County-implemented program or policy to impose source separation of organic materials beyond the current private, voluntary collection system will require new collection systems and mandates on generators to divert additional organics from MSW into the organics program.
6. Separating the organic fraction from MSW has a unique set of challenges. Several methods have been attempted, including:
· Mechanical equipment that squeezes MSW and extracts an organics-rich cake-like material for further refinement before digestion;
· Mechanical screening systems that separate materials by size and density; and · Optical sorting systems that separate materials according to their light refraction
properties.
Each of these methods has limitations and produces different types of organics-rich materials with different compositions, contamination levels, and appropriateness for different types of digestion. The use of these materials for digestion will likely necessitate further processing either prior to digestion or after digestion as a part of the digestate management process.
7. The method of digestion could vary according to the type and quality of feedstock material. Wet digestion systems tend to be well suited to SSO that is high in food waste and low in contamination. Dry digestion systems tend to be well suited to stackable yard trimmings that contain food waste blended in a 50/50 ratio.
8. The County’s South Plant (Renton) wastewater treatment plant (WWTP) has very limited excess digester capacity and there is no available land for additional digesters.
9. The study demonstrates that AD of food waste is complex and expensive, relative to landfilling or composting. Managing feedstock sources from MSW, including the screening and preprocessing, in addition to the post digestion management of solids, creates especially costly additions to the AD system. However, the cost of these systems can vary significantly depending on the quality of the feedstock, specifically the level of contamination. Therefore, the County may wish to further explore a SSO AD partnership with a local private composter to secure a feedstock as clean as possible if costs are crucial to the program.
10. Existing private sector haulers and composters have developed existing infrastructure to process SSO. The study reveals potentially significant capital and operational cost savings if SSO material can be secured for AD processing. Two key indicators contribute to this finding: · Wet digestion systems tend to be well suited to SSO that is high in food waste
and low in contamination. · The cost of preprocessing MSW is significant, contributing nearly one third of the
overall system cost.
11. Although SSO is currently being collected under private agreements, an AD program could benefit from a cooperative agreement with the existing organics haulers to

Anaerobic Digestion Feasibility Study
October 2, 2017 | 3
provide an appropriate quantity and quality of SSO for a digestion process. This could be true for both Scenario 2 (use of the Renton WWTP) and Scenario 3 (dedicated digesters at County facilities).
12. Another option is for the County to engage with the private haulers processing SSO to explore the availability and use of SSO for AD. Partnering with an SSO hauler would avoid undermining their existing organics collection systems and take advantage of existing business relationships and collection routes. A partnership between the County and organics private haulers and processors is not projected to increase the County recycling rate because SSO is already being diverted and processed as compost.
13. To improve the region’s recycling rate, the County could also explore options for increasing the amount and quality of SSO. One possibility is mandatory separation; another is a subscription-based organics diversion program with incentives for businesses to provide high-quality, consistent SSO for a digester.
Considering the likely quality and quantity of feedstock available for digestion as well as the variety of pre-treatment and digestion technologies available to process the material, HDR offered five strategies for the County’s consideration. Each strategy considered employing different ways of reducing the quantity of organic materials that are landfilled. From this larger list of strategies, the County selected three scenarios for further economic and environmental analysis:
Scenario 1. Small Distributed Systems: Small highly distributed AD systems across the County, each representing approximately 1,000 tons per year, privately owned and operated.
Scenario 2. AD at the South WWTP. The use of digester capacity at the South WWTP in Renton (South Plant), to digest previously prepared organic slurry derived from mixed, wet MSW. Conceptually, the preprocessing could take place at the Bow Lake Transfer Station, which could be equipped with a preprocessing press system to squeeze high moisture content wastes rich in food. The press would produce a cake-like material from the organic fraction of MSW that could be further processed to create a slurry of organic material that would be hauled by a pump truck to the South Plant for receipt and digestion. As an alternative, the use of digester capacity using a system similar to that of the Central Marin WWTP experience was considered. The Central Marin facility processes a very clean SSO that requires less preprocessing and consequently has a lower cost range.
Scenario 3. Dedicated AD at the County Transfer Stations. The conceptual development of a dedicated high solids AD system at the Bow Lake, Houghton, Factoria or Algona Transfer Stations that could use the same preprocessing press system as described in Scenario 2, but could also digest the organic slurry at the County’s transfer stations using a higher solids, smaller volume digestion process than the traditional WWTP process at the South Plant. A second, larger dedicated high solids AD system was also evaluated for the County’s Bow Lake Transfer Station because this facility receives the largest quantity of material compared to the County’s other transfer stations. The larger throughput rate is expected to provide some improved economies of scale. Two sizes of processing systems were modeled based on the transfer station options.
Anaerobic Digestion Feasibility Study
4 | October 2, 2017
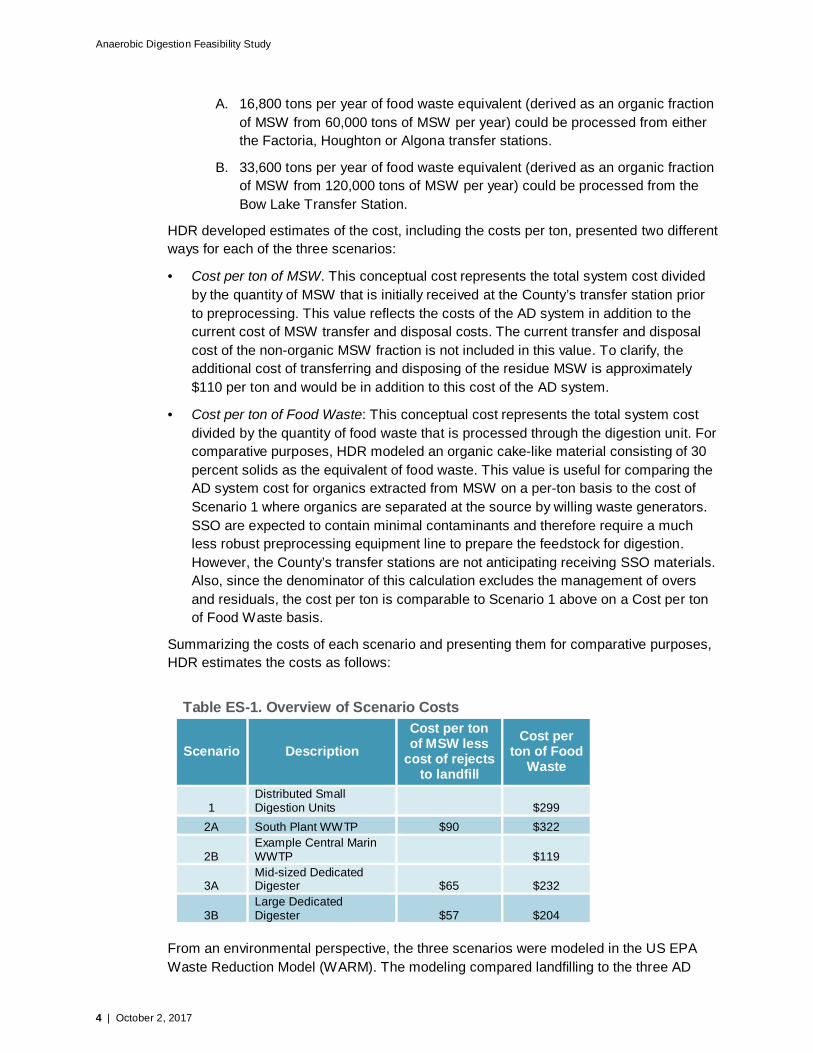
A. 16,800 tons per year of food waste equivalent (derived as an organic fraction of MSW from 60,000 tons of MSW per year) could be processed from either the Factoria, Houghton or Algona transfer stations.
B. 33,600 tons per year of food waste equivalent (derived as an organic fraction of MSW from 120,000 tons of MSW per year) could be processed from the Bow Lake Transfer Station.
HDR developed estimates of the cost, including the costs per ton, presented two different ways for each of the three scenarios:
· Cost per ton of MSW. This conceptual cost represents the total system cost divided by the quantity of MSW that is initially received at the County’s transfer station prior to preprocessing. This value reflects the costs of the AD system in addition to the current cost of MSW transfer and disposal costs. The current transfer and disposal cost of the non-organic MSW fraction is not included in this value. To clarify, the additional cost of transferring and disposing of the residue MSW is approximately $110 per ton and would be in addition to this cost of the AD system.
· Cost per ton of Food Waste: This conceptual cost represents the total system cost divided by the quantity of food waste that is processed through the digestion unit. For comparative purposes, HDR modeled an organic cake-like material consisting of 30 percent solids as the equivalent of food waste. This value is useful for comparing the AD system cost for organics extracted from MSW on a per-ton basis to the cost of Scenario 1 where organics are separated at the source by willing waste generators. SSO are expected to contain minimal contaminants and therefore require a much less robust preprocessing equipment line to prepare the feedstock for digestion. However, the County’s transfer stations are not anticipating receiving SSO materials. Also, since the denominator of this calculation excludes the management of overs and residuals, the cost per ton is comparable to Scenario 1 above on a Cost per ton of Food Waste basis.
Summarizing the costs of each scenario and presenting them for comparative purposes, HDR estimates the costs as follows:
Table ES-1. Overview of Scenario Costs
Scenario Description Cost per ton of MSW less
cost of rejects to landfill
Cost per ton of Food
Waste
1 Distributed Small Digestion Units $299
2A South Plant WWTP $90 $322
2B Example Central Marin WWTP $119
3A Mid-sized Dedicated Digester $65 $232
3B Large Dedicated Digester $57 $204
From an environmental perspective, the three scenarios were modeled in the US EPA Waste Reduction Model (WARM). The modeling compared landfilling to the three AD

Anaerobic Digestion Feasibility Study
October 2, 2017 | 5
scenarios. The WARM results show AD provides considerable reduction in greenhouse gas (GHG) emissions compared to landfilling.

Anaerobic Digestion Feasibility Study
6 | October 2, 2017
1 Introduction 1.1 Project Background
Consistent with the King County Strategic Climate Action Plan and Comprehensive Solid Waste Management Plans, the King County Solid Waste Division (SWD) is interested in diverting organics from the landfill for beneficial use in order to recover usable resources and extend the useful life of the Cedar Hills Regional Landfill (CHRL). In support of this effort, HDR is providing assistance in evaluating anaerobic digestion (AD) options and recommending an implementation strategy for AD technology in the King County (County) solid waste system. SWD commissioned this AD feasibility study to determine if there is an implementable strategy to manage portions of the organic materials generated in the County differently from current practices.
This AD feasibility study is intended to help identify the most appropriate AD options for the County, if any, and recommend an AD strategy for SWD.

Anaerobic Digestion Feasibility Study
October 2, 2017 | 7
2 Organics Management in King County This section provides an overview of the current condition of organic materials management in the County, the current types of processing technologies, and where those sources of feedstock are being generated. These conditions vary throughout the County according to location. SWD does not have control over organics collection in the City of Seattle and has limited control over organics collection in other cities. SWD has the authority to:
· Use the Comprehensive Solid Waste Planning process to influence the siting of new organics facilities, as permits for new solid waste facilities require consistency with the Comprehensive Solid Waste Management Plan;2
· Prohibit the disposal of specific materials at County-owned landfill or transfer stations;
· Make agreements with cities to accept materials collected by city-sponsored programs; and
· Establish source-separation requirements for specific materials for residents in unincorporated areas via the service level ordinance.
The following discussions cover the existing organics collection systems, existing processing technologies, corresponding capacities and by-products, and the quantities and characteristics of organic material controlled in the region.
2.1 Collection Collection varies by city and unincorporated areas of the County. In general, each city contracts with a hauler for organics collection, and then haulers contract with processors. There are some contracts directly between generators and processing facilities.
SWD has identified key jurisdictions and/or target area types to consider in this feasibility study:
· King County cities
· Vashon Island
· Other Unincorporated Areas of King County
· City of Seattle
2.1.1 King County Cities All cities in the County, with the exception of Skykomish, offer weekly or bi-weekly combined yard trimmings and food waste organics collection. Some cities embed the organics collection service cost in the garbage collection service rate. Others offer separate, additional subscription fees for organics collection.
2 Organics sources, collection, and processing in “Organics in KC 6-1.docx” file provided by Morgan John

Anaerobic Digestion Feasibility Study
8 | October 2, 2017
2.1.2 Vashon Island SWD is partnering with the nonprofit organization Zero Waste Vashon (ZWV) for a program to accept yard trimmings and food waste at the County’s Vashon Recycling and Transfer Station. The program began in October 2015, and during the first twelve months it diverted 584 tons of yard trimmings and food waste from disposal, to be composted at Cedar Grove. Based upon the first of three waste characterization studies of material collected during the pilot, 98.6 percent of organics collected are yard trimmings, 1.2 percent food, and 0.1 percent compostable paper.
2.1.3 Other Unincorporated Areas of King County The County ensures that garbage and recycling collection and disposal services are available in the County’s unincorporated areas.
Private solid waste collection services companies provide collection of recycling and garbage in the County, except in Enumclaw and Skykomish, which operate their own collection systems. Three national companies, Waste Management, Inc., Recology/Cleanscapes, and Republic Services, provide most of the collection services in the County. These companies do business under several different company names depending on which area of the County they serve. Waste Connections, Inc. provides hauling services on Vashon Island.
Some residents and businesses choose to haul their own waste to any of the eight County-operated transfer stations or the CHRL. Yard trimmings collection is offered at four of the County transfer stations – Bow Lake, Cedar Falls, Enumclaw and Shoreline. The new Factoria station will collect yard trimmings upon opening in 2017.
2.1.4 City of Seattle Recology/Cleanscapes and Waste Management hold the contracts for residential and commercial garbage, recycling, and organics collection in Seattle. The current contracts began in March 2009 and will continue until 2017 or longer if the City grants extensions. City residents have combined yard trimmings and food waste collection every week. Approximately 60 percent of the collected material is sent to the contracted processing facility, Lenz Enterprises. The remaining material was contracted to be sent to the PacifiClean facility in Quincy, Washington. However, the PacifiClean facility is no longer being used due to the apple maggot quarantine, so all materials previously directed there are now being sent to the Cedar Grove composting facility. Cedar Grove also processes much of the commercial organics generated in Seattle, which Cedar Grove collects directly from customers in the City limits.
Currently, all single-family customers must subscribe to the weekly organics collection service. Residents can elect to backyard compost their yard trimmings and food wastes. Customers may choose from three sizes of wheeled carts. The cost of service is set to increase with an increasing container size to encourage onsite backyard composting. Customers set out their organics carts at the curb or alley on the same collection day as garbage. Extra organics, properly contained, may be set out for a fee.

Anaerobic Digestion Feasibility Study
October 2, 2017 | 9
Multi-Family Residential Organics service was optional until September 2011, when it became a requirement. The building manager determines container size and collection frequency according to the needs of the building.
Commercial customers with organics have several options for collection of these voluntarily separated materials. They may use one of the two City-contracted collection services or a private collection service. Typically, the collected organics are taken directly to the compost facility instead of to a transfer facility. If customers subscribe to the City-contract cart-based organics (residential-type) service, the materials are taken to a City transfer facility before going to the processor.
2.2 Processing Cedar Grove Composting (Cedar Grove or CG) processes much of the organics generated within the County, either at its Maple Valley or Everett locations. The majority of Seattle’s curbside organic material (60%) is delivered and processed by Lenz Enterprises. However, the processing contract for Seattle’s residential organics is currently out to bid.
Recent reports indicate the existing compost infrastructure in the region has processing capacity to manage current quantities as well as future quantities of organics, based on projected growth in the region. Although these reports relied on the assumption that PacifiClean’s facility would be operational, the projections still indicate the other existing facilities are capable of managing the organic flow rates without the PacifiClean facility. Cedar Grove also has the option of contracting out additional processing to other facilities in the region, if its processing capacity becomes fully utilized during peak yard trimmings season. The 2015 Market Analysis Assessment for the region stated that, including the capacity of the expected PacifiClean operation, the western Washington facilities have been estimated to have approximately 30-40 percent of their permitted capacity still available per year, meaning they could accept approximately 150,000 to 200,000 additional tons of organics.3 However, PacifiClean has since ceased operations and the effect on the region’s capacity to accommodate the quantities of organics excluding the PacifiClean facility has not been analyzed.
2.2.1 Compost Facilities According to the 2015 Market Analysis Assessment, almost all the organic feedstock materials generated and source-separated within the County are being processed at compost facilities, creating soil amendments as the marketable by-products.4
2.2.1.1 Cedar Grove Composting
Cedar Grove is the largest compost facility in the County that is permitted to take food waste, so much of the County’s organic materials are brought there, either directly or via a transfer station.
3 Cascadia Consulting Group. King County Waste Monitoring Program Market Assessment for Recyclable Materials.
February 2015. 4 Ibid.

Anaerobic Digestion Feasibility Study
10 | October 2, 2017
Current organics processing includes yard trimmings, all food waste, compostable (food soiled) paper and other approved food packaging.
Cedar Grove has explored ways to improve its operations. In 2010, they announced a collaboration to build an AD facility at their Everett facility and integrate it with their processes. The project included plans to generate biogas for automotive fuel or for producing electricity.5 These plans were not successful, however, and Cedar Grove withdrew their plans to add AD to their facility.
2.2.1.2 PacifiClean in Quincy, WA
PacifiClean had a contract with the City of Seattle to transport municipal yard trimmings to its composting facility in Quincy. Prior to initiating this program, PacifiClean was stopped from transporting waste from Western Washington in 2015 after apple maggot larva was found in the feedstock. In lieu of the Quincy site, this portion of Seattle’s materials has been delivered to Cedar Grove’s Maple Valley facility.
2.2.1.3 Lenz Enterprises in Stanwood, WA
Lenz Enterprises accepts organic materials at their Recycling Compost Facility in Stanwood in Snohomish County. They compost the yard trimmings, food waste, and ground wood waste and sell the resulting GreenBlenz and Certified Organic GreenBlenz compost products at their facility. The majority of Seattle’s residential organic materials (60%) are delivered and processed by Lenz Enterprises. The facility also sells various other landscaping products and services.
2.2.1.4 Silver Springs Organics in Rainier, WA
Silver Springs Organics (owned by Waste Connections, Inc.) is a commercial composting facility in Rainier in Thurston County. Silver Springs accepts yard trimmings, garden, wood, food and farm wastes.
2.2.1.5 Sawdust Supply Company and GroCo Compost
Sawdust Supply Company began in 1912 by taking scrap materials from local sawmills. It now also offers blower truck services, soil amendments, mulch and other landscaping materials. They offer three soil amendment products that are produced through composting operations. The GroCo soil conditioner product is produced from composting a blend of sawdust and biosolids from WWTPs. The STEERCO compost is produced by composting cattle manure, fir-hemlock sawdust, and nitrogen, for up to one year. The BEAUTI-MULCH compost is produced by composting clean green yard trimmings.6
2.2.1.6 Decentralized On-site Composting
Decentralized on-site composting occurs as a typically small quantity process and sites of varying sizes are located at single-family homes, farms, and institutions. They may also be found at businesses or industrial facilities.
5 Seattle Solid Waste Management Plan, revised 2013 6 Saw Dust Supply Co., Inc. Products webpage. http://www.sawdustsupply.com/products. Accessed July 2016.

Anaerobic Digestion Feasibility Study
October 2, 2017 | 11
Seattle uses surveys to estimate the amount of organics management occurring in Seattle households. The surveys are conducted every 5 years and results are used to generate estimates for backyard food and yard trimmings composting and for estimating the amount of grass-cycling undertaken in the City.
There have been several programs provided by or supported financially in part by the City of Seattle, with the purpose of encouraging residential backyard composting of food and yard trimmings.
· The Natural Lawn and Garden Hotline, operated by Seattle Tilth Association
· Discount compost bins
· Education and hands-on training programs for residents and landscape professionals
· Collection of home gas mowers for recycling, as part of the Mayor’s Climate Change Initiative
Seattle and King County partnered with retailers for the Northwest Natural Yard Days program, which provided discounts or rebates on items to encourage home composting and grass-cycling, like mulching mowers and soaker hoses. The Northwest Natural Yard Days program ran for 12 years, before ending in 2009.
Backyard composting in Seattle peaked between 2000 and 2005. After vegetative food waste was allowed in the yard trimmings carts in 2005, backyard composting began to decline. With the 2009 change to allow all food waste and requiring all single family accounts to have organics carts, Seattle increasingly encouraged residents to use the curbside service, and the decline in backyard composting continued. In 2000, 46 percent of Seattle households did backyard composting of yard trimmings. That declined to 40 percent in 2005 and then to 30 percent in 2010. Backyard composting of food waste showed a similar decline during the same period, from 31 percent down to 20 percent of households. These declines led the City of Seattle to stop subsidizing programs for backyard compost bins and green cone composters in 2011.7
2.2.2 Pilot Projects There are three alternative organics treatment pilot projects currently being funded by the City of Seattle8.
2.2.2.1 Impact Bioenergy at Fremont Brewing Co.
Impact Bioenergy produces small-scale bioenergy systems that are prefabricated and portable. In April 2016, Fremont Brewing Co. in Seattle became the first location to employ the HORSE AD25 system, which can process 135 to 960 pounds of organics per day into renewable energy and soil co-products in a footprint of 160 square feet. The brewery’s system has 175 cubic feet of gas storage and a 4-kilowatt (kW) electrical generator. The system is expected to process 25,000 tons of organics per year. It will run on brewery waste only for the first three months of operation, and then may add other
7 Seattle Solid Waste Management Plan, revised 2013 8 http://your.kingcounty.gov/solidwaste/garbage-recycling/commercial-grants.asp

Anaerobic Digestion Feasibility Study
12 | October 2, 2017
feedstocks. The project is being funded by a grant from the City of Seattle, augmented by a crowdsourcing campaign that generated over $36,000.9
2.2.2.2 WISErg at PCC Natural Markets
Unlike traditional organics processing systems, the WISErg Harvester system is designed to process organic materials at the source (the initial market is grocery stores), before the materials begin to decompose. The completely automated on-site system tracks feedstock inputs and processes the feedstock through a proprietary aerobic, anabolic process in order to preserve nutrients and reduce greenhouse gas production. The slurry created by the on-site system is collected and transported to a WISErg facility, which further processes the slurry into liquid fertilizer.10
The Issaquah location of PCC Natural Markets (PCC) was the location of the first installed WISErg Harvester in March 2012. PCC is the largest consumer-owned natural food retail co-operative in the United States, with ten locations in the Puget Sound region. There are now WISErg Harvesters operating at the Issaquah, Edmonds and Redmond PCC stores.11
2.2.2.3 WISErg at Pike Place Market A WISErg Harvester unit was installed at Pike Place Market in March 2016, as a partnership between the Pike Place Market Preservation and Development Authority (PDA) and Seattle Public Utilities (SPU). The system was planned to process food scraps from 19 different food vendors. SPU planned to utilize data collected from the pilot project.12
Four months into the pilot project’s operation, it was shut down due to odor issues that WISErg had been unable to resolve. Although it was considered a success from a diversion standpoint, the proximity to market patrons made intermittent odor problems too apparent.13
2.3 Anaerobic Digestion Facilities 2.3.1 Wastewater Treatment Plants
One option for digesting organic materials is the use of digester capacity at local WWTPs. Sources of appropriate organic materials could include fats, oils, and grease (FOG), food waste, and other forms of municipal organics. The use of WWTP capacity to
9 Fletcher, Katie. “Impact Bioenergy’s microdigester testing waste at Seattle brewery.” Biomass Magazine. May 31,
2016. Available at: http://www.biomassmagazine.com/articles/13325/impact-bioenergyundefineds-microdigester-testing-waste-at-seattle-brewery.
10 Wiserg.com 11 Chapman, Diana. “WISErg: A new solution to the old problem of food waste.” Sound Consumer, June 2015.
Available at: http://www.pccnaturalmarkets.com/sc/1506/wiserg.html. 12 “Pike Place Market Installs WISErg Harvester™ to Recycle Food Waste.” Pike Place Market Preservation and
Development Authority Press Release, March 17, 2016. Available at: http://pikeplacemarket.org/sites/default/files/PPM_WISErg%2003_16_16.pdf.
13 Farley, Glenn. “Pike Place to Remove Food Waste Recycler Over Big Stink.” KING5 News. July 29, 2016. Available at http://www.king5.com/tech/science/environment/pike-place-to-remove-food-waste-recycler-over-big-stink/284336694.

Anaerobic Digestion Feasibility Study
October 2, 2017 | 13
process organic materials has been considered by agencies, such as the East Bay Municipal Utility District (EBMUD), for nearly a decade. Numerous other WWTPs have explored these concepts under net-zero energy goals, climate-action goals or other related goals. Similar concepts could be viable in the King County region. The following WWTPs were considered for this AD feasibility study.
2.3.1.1 King County West Point Wastewater Treatment Plant
The King County West Point WWTP (West Point) is located next to Discovery Park in Seattle. West Point treats wastewater from homes and businesses in Seattle, Shoreline, north Lake Washington, north King County and parts of south Snohomish County. Seattle’s combined stormwater/wastewater sewer system also flows into West Point.
Approximately 90 million gallons per day of wastewater is treated at this facility during the dry months. During the rainy season, West Point provides secondary treatment for flows up to 300 million gallons per day (mgd) and provides primary treatment and disinfection for flows exceeding 300 mgd and up to 440 mgd.14
2.3.1.2 King County South Treatment Plant in Renton
The King County South WWTP (South Plant but also referred to as the Renton Plant) is located in Renton, Washington. South Plant treats wastewater from homes and businesses in cities located east and south of Lake Washington. Approximately 90 mgd of wastewater is treated at this facility during the dry months. During peak flows in the rainy season, South Plant can treat approximately 300 mgd.15
HDR staff and SWD staff toured the Renton Plant on June 1, 2016.
2.3.2 Dairy Digesters
2.3.2.1 Rainier Biogas – Enumclaw Plateau
The Rainier Biogas, LLC digester and manure management operation is located in Enumclaw, Washington. It was designed with a capacity of 32,000 metric tons, to serve three local family farms with a total of 1,200 cows. The project was projected to avoid 4,000 metric tonnes of greenhouse gas emissions annually.
The sealed, heated concrete digester was designed as a plug flow digester that would collect the methane biogas from the decomposing manure and feed it into a 1-megawatt electric generator, which would generate renewable energy that could be sold to Puget Sound Electricity. The project was initially financed by Native Energy through the sale of Help Build™ carbon offsets. Native Energy provides carbon offsets, renewable energy credits, and carbon accounting software to its customers.16 The project also received a $492,000 United States Department of Energy grant through King County.17
14 http://www.kingcounty.gov/environment/wtd/About/System/West.aspx 15 http://www.kingcounty.gov/environment/wtd/About/System/South.aspx 16 http://www.nativeenergy.com/rainier-farm-biogas-project.html#jumb 17 http://www.blackdiamondnow.net/black-diamond-now/2014/01/manure-digester-and-cow-power-really-works.html

Anaerobic Digestion Feasibility Study
14 | October 2, 2017
The project commenced December 1, 2012. It underwent its first project verification process through the Climate Action Reserve (CAR) for the period from December 1, 2012, to April 30, 2014. The verification process showed that the project began receiving manure from four different dairies beginning in October 2012. A fifth dairy began delivering manure in December 2013. The digester operates one Guascor engine and a Martin Machinery generator. Excess gas is burned in an auxiliary flare. The solid portion of the effluent stream is used as bedding material for cows at the participating dairies. The liquid fraction is also returned to the participating dairies to be stored for land application. The biogas control system and combustion devices are operated by Farm Power. The verification report cited two notices of violation for exceeding permitted levels of hydrogen sulfide (H2S) emissions – June 12, 2013, and October 3 through 14, 2013. The project was found to have not achieved any emission reductions for December 2012. It was found to have achieved a reduction of 2,189 tons of carbon dioxide equivalents (tCO2e) in 2013, and an additional reduction of 912 tCO2e in the first four months of 2014.18
2.3.2.2 Werkhoven Dairy/QualcoEnergy Dairy Manure Digester (Snohomish County) This dairy manure digester is located on the Werkhoven Farm in Monroe, Washington. Initial funding for this manure digester was provided by the Department of Energy and the Department of Agriculture. The digester now generates $25,000 per month from electricity sales to Snohomish County Public Utility District (PUD).19
The project was a partnership between Qualco Energy, the Werkhoven family, the Tulalip tribes and Snohomish County PUD. Qualco Energy allows researchers from Washington State University to study manure and nutrient management at the facility.
Dairy manure is collected by washing down the cow barn floor and collecting wash water, via underground pipe, into a lagoon where mixing begins. In addition to dairy manure, the digester also accepts leftovers and expired foods and drinks from restaurants, wastes from food processing plants, and animal blood. The lagoon mixture is pumped underground to the digester, which is made up of five underground chambers. The digester is generally kept about three-quarters full. The entire digester system is underground, which virtually eliminates odors. The digester itself is at a depth of 20 feet, and maintains a temperature of 100 degrees.
The biogas is sent to the generator building next to the digester, which houses the 450-kilowatt generator. The amount of power generated can power 300 homes. The digester currently produces twice as much gas as the generator can use. Excess gas is flared, and is being evaluated for potential uses such as heating greenhouses. A second generator is being considered. The solid portion of the digester effluent is used as compost, which is currently given away to local farmers. Liquid effluent is sprayed on fields.20
18 First Environment, Inc. Verification Report for Rainier Biogas, LLC, Enumclaw, Washington, Climate Action
Reserve - CAR822. October 2015. Available at https://thereserve2.apx.com/mymodule/reg/TabDocuments.asp?r=111&ad=Prpt&act=update&type=PRO&aProj=pub&tablename=doc&id1=822
19 http://www.regenis.net/news/jon-van-nieuwenhuyzen/ 20 http://envirogorge.com/turning-manure-into-money/

Anaerobic Digestion Feasibility Study
October 2, 2017 | 15
2.3.3 Proposed AD Projects SWD has awarded four 2016 Commercial Food Waste Grants for projects that demonstrate on-site processing of commercial food waste.21
· Anaerobic Digester Digestate Field Testing, Impact Bioenergy · Commercial Food Waste Outreach Project, City of Auburn · Increasing Food Waste Diversion in Diverse Communities, Cedar Grove
Composting, Inc. · Vashon Island Distributed Bioenergy Feasibility & Possible Demonstration,
Impact Bioenergy
The specifics of each of these are provided in the following sections.
2.3.3.1 Anaerobic Digester Digestate Field Testing Grant recipient: Impact Bioenergy Grant amount: $29,982 Grant period: June 2016 – July 15, 2018
This project will demonstrate the diversion of small business organics from the solid waste system and conversion of that resource into renewable energy and liquid soil amendment for application on agricultural land.
The specific focus of this project is to document the commercial value of anaerobically digested food waste and how it can be used beneficially within a community, avoiding trucking, export from the county, and the associated greenhouse gas emissions and loss of soil carbon. The approach for this project is to fully integrate zero waste, renewable energy, soil tilth, food production, diversity and support of people that have less equity and social influence in the local community.
Project tracking will include conclusions about increases in jobs, retaining money in King County by building a circular economy, reducing truck use, traffic congestion, and diesel emissions in King County.
Commercial food waste will be collected from Seattle Tilth operations, Taylor Farms (Kent), Schilling Cider (Auburn), and the Auburn Food Bank. Liquid soil amendment will be used at Seattle Tilth’s Red Barn Ranch Farm Incubator.
21 http://your.kingcounty.gov/solidwaste/garbage-recycling/commercial-grants.asp

Anaerobic Digestion Feasibility Study
16 | October 2, 2017
2.3.3.2 Commercial Food Waste Outreach Project Grant recipient: City of Auburn Grant amount: $29,990 Grant period: August 2016 – July 15, 2018
The goal of this project is to increase diversion of food waste from moderate to large food generating businesses in the city to local composting facilities and/or organizations that will provide food for low income residents in Auburn.
The city will encourage them to enhance existing food waste prevention, donation or composting programs or start a new program by offering to provide education and training about best practices for waste prevention, composting food waste and/or donation of edible food products. Businesses contacted will include the Auburn School District kitchen departments, restaurants, food manufacturers and distributors, grocery stores and non-profit food donation locations in the city.
2.3.3.3 Increasing Food Waste Diversion in Diverse Communities Grant Recipient: Cedar Grove Composting, Inc. Grant amount: $30,000 Grant period: June 2016 – July 15, 2018
This project will increase diversion of commercial food waste from landfill disposal by focusing on restaurants and farmer’s markets in economically and culturally diverse cities in suburban King County.
Partnerships will be formed with 10 restaurants, with a preference for those whose owners are people of color, foreign born and/or whose primary language is not English, to conduct restaurant waste audits and implement customized food waste recycling programs. The goal is to divert of a minimum of 70 percent of the waste stream for selected restaurants.
The project will also work with the Burien Farmer’s Market and Renton Farmer’s Market to provide signage to market vendors and training on best practices for farmer’s market vendor composting. This element will help establish a firm diversion infrastructure that puts each market vendor in the best position to maximize food waste diversion.
2.3.3.4 Vashon Island Distributed Bioenergy Feasibility & Possible Demonstration Grant recipient: Impact Bioenergy Grant amount: $30,057 Grant period: June 2016 – July 15, 2018

Anaerobic Digestion Feasibility Study
October 2, 2017 | 17
This project will 1) create and utilize a software tool to facilitate the diversion of edible and inedible food waste from disposal, 2) conduct a feedstock assessment, and 3) conduct a feasibility study to establish feasibility, gather requirements and design a community-digester operating system for Vashon Island, which can also serve as a template for others.
The project provides a mechanism for Vashon Island to develop Community Supported Biocycling® (CSB®) - an alternative, locally based economic model of production and distribution. CSB is designed to close the loop on the Community Supported Agriculture movement by integrating co-products and services into the hyper-local food system, such as low-carbon fuel vehicle sharing and a liquid organic fertilizer co-product of the food waste AD process.
Other projects include an AD project using a tunnel digester that was planned by Orbit Energy for construction in Des Moines, Washington, with an agreement to sell the energy produced to Puget Sound Energy (PSE). The project was reportedly not completed because Orbit Energy lost their lease on the land before the project funding could be secured.22
2.4 Quantities and Characteristics Organics are generated from the following major source categories in King County:
· Single-family residential
· Multi-family residential
· Commercial
· Institutions
· King County Wastewater
· Agriculture
Depending on where these sources are located, SWD may or may not have direct control over where the materials are hauled and processed.
2.4.1 Materials Controlled by the King County Solid Waste Division Figure 2-1 illustrates Cascadia’s estimates of the organics generated in the County (excluding Seattle) in 2012. Yard trimmings made up the largest portion of the recovered organics, while food waste made up the largest portion of the disposed organics. Annual tons of municipal solid waste (MSW) disposal, recycling, and diversion by material type were provided by SWD. In order to estimate the quantities of recoverable materials in the diversion streams, County MSW composition data from 2011 were applied to the 2012 MSW tons disposed. Please note that these estimates include only the material types examined in the Cascadia study.
22 http://www.bizjournals.com/charlotte/blog/power_city/2015/03/construction-starts-on-charlotte-food-waste-
power.html

Anaerobic Digestion Feasibility Study
18 | October 2, 2017
Figure 2-1. Estimated Tons Recovered and Disposed by Material Type, King County Organics, 2012
Source: Cascadia Consulting Group. King County Waste Monitoring Program Market Assessment for Recyclable Materials. February 2015.
SWD staff estimated that approximately 412,000 tons will be disposed and 594,000 tons of organics will be recovered in 2030, assuming no major programmatic or policy changes. Table 2-1 shows projected tons for County organics, assuming a status quo future, where recycling and disposal tons increase at the same rate (i.e., the recycling rate remains constant).
Table 2-1. Projected Tons Recovered and Disposed, King County Organics
2012 2020* 2030*
Recovered 398,000 509,000 594,000
Disposed 278,00 353,000 412,000
Total Recoverable Materials 676,000 862,000 1,006,000
Source: Cascadia Consulting Group. King County Waste Monitoring Program Market Assessment for Recyclable Materials. February 2015. *These estimates assume a static recycling rate.
2.4.2 Materials Not Controlled by the King County Solid Waste Division SWD has no control over organic materials collected through residential curbside routes. As mentioned in Section 2.1, cities have contracts with their haulers and all organics are

Anaerobic Digestion Feasibility Study
October 2, 2017 | 19
hauled to private compost facilities. Some fraction of these organics collected from the cities in the County may be available, if a local composter or a city were to be interested in a partnership.
2.4.2.1 Seattle
Seattle Public Utilities has Organics Programs Reports that compile two years of monthly data and annual historical data since 1997. The data is categorized into residential (single and multi-family), self-haul, and commercial (contract and non-contract) organics. Reports are currently published quarterly. Seattle reported its most attractive gains in organics diversion by targeting food scraps and compostable paper. Beginning in 2005, customers could put all foods (except meat and dairy) and compostable paper in the organics cart. In 2009, the City allowed meat and dairy to also be placed in the carts. The change also included weekly organics collection and mandatory sign-up for organics carts. As of 2009, the new program began to yield increased diversion. The expectation at that time was that the quantity of organic material collected would continue to increase, as the program was intended to ramp up over the following few years.
Ordinance 122751 banned the use of expanded polystyrene (EPS) food service containers, cups, and plates in Seattle beginning January 1, 2009. The ordinance also required all food service businesses to use compostable or recyclable food service products instead. Seattle and Cedar Grove began encouraging restaurants to use compostable food service products through stakeholder outreach and public education. Seattle expected that using compostable food service products would result in diverting 4,500 tons of leftover food and 1,500 tons of compostable products per year. Approximately 2,000 Seattle restaurants were using organics collection services by mid-2011.23 Organics were banned from the garbage containers beginning January 1, 2015. Table 2-2 shows the steady increase in tons of organic materials collected since 2009.
Table 2-2. Annual Tons of Organic Materials from Seattle Self-Haul, Residential and Commercial Generators
Organics Program 2009 2010 2011 2012 2013 2014 2015
Self-Haul 10,149 7,682 6,794 6,593 6,290 4,199 4,167
Residential 74,230 79,952 79,813 83,666 82,390 82,588 89,213
Commercial 31,724 37,252 40,782 42,612 46,081 50,111 58,462
Total 116,103 124,886 127,389 132,871 134,761 136,898 151,842
Source: Seattle Public Utilities, Economic Services Section. Organics Reports, accessible at http://www.seattle.gov/Util/Documents/Reports/SolidWasteReports/index.htm. Accessed July 2016.
Self-haul organics data is collected through scale house data at transfer stations. As a check, scale house data is also collected for organics hauled from the transfer stations to the processing facilities.
Seattle’s residential collection contracts included requirements for reporting, so that all residential data is provided by haulers for every truck trip through a Seattle neighborhood
23 Ibid.

Anaerobic Digestion Feasibility Study
20 | October 2, 2017
to a processing center. Composition studies are performed periodically on the curbside waste materials. The curbside organics composition is estimated using a statistical model called the Seattle Discards Model, which uses historical data to estimate the amounts of food waste versus yard trimmings in the curbside organic materials stream.
Commercial organics data is compiled from the annual reports from recyclers and processors as required by Seattle. Reports are analyzed in order to make sure that material is not double-counted. Detailed trip level data is also reported for organics tons collected under City of Seattle commercial collection contracts.24
24 Seattle Solid Waste Plan 2011 Revision

Anaerobic Digestion Feasibility Study
October 2, 2017 | 21
3 Overview of Anaerobic Digestion Technologies
3.1 Technology Overview AD is the biological decomposition of organic materials in the absence of oxygen under controlled conditions. This process reduces the volume of organic materials fed to the AD process. By consuming the organic materials, anaerobic bacteria produce a biogas (primarily methane and carbon dioxide). The remaining solid material (digestate) contains non-digested solids and depending on the material’s moisture content, can be dewatered to reduce its water content and then further processed through aerobic composting to produce a soil amendment. Dewatering yields a liquid byproduct that requires further management.
AD is commonly used to treat wastewater solids and agricultural sources such as manures; however, it has also been used as a way of treating some portions of the MSW waste stream. Early versions of these processes were employed in the US in the 1980s. However, for the most part, these facilities ceased to operate years ago due to a variety of issues. However, the technology continued to be developed and utilized in Europe, and the advanced technology has been recently reintroduced into North America, in combination with aerobic composting to bio-stabilize the process residue. AD facilities are successfully operating in Europe due in large part to European Union policies that banned landfilling of unprocessed waste, but also due to high tipping fees and high prices paid for energy.
There are several types of AD technology. Wet systems can be classified further into high or low solids systems, based on the percent of solids in the slurry feedstock. Dry systems process feedstock with a high enough solids content to be stacked.
Feedstocks for AD vary according to the type of technology, but in broad terms, they include MSW-derived organics, manure, food waste, grass clippings, and for some technologies, yard trimmings, brush and WWTP biosolids. Biologically inert materials that might be contained in the digestion feedstock, such as metals, glass, and plastics, are undesirable and considered contaminates and either must be removed prior to digestion (for wet type systems) or be screened-out during or after digestion (for dry type systems). If feedstock is below the desired moisture content for the chosen technology type, water is added to the AD system.
There are several factors that influence the design and performance of AD. These factors include: the concentration and composition of nutrients in the feedstock, temperature of the AD reactor, retention time of the material in the reactor, volatile solids loading, pH, and volatile acid concentration.
3.2 AD Process Overview Prior to digestion, the organic materials need to be prepared to meet certain specifications, which vary for each of the types of digestion technology. The first feature

Anaerobic Digestion Feasibility Study
22 | October 2, 2017
of the equipment process line is the preparation of feedstock by the removal of contaminants prior to digestion. The first step is the preprocessing phase to remove the inorganic fraction before entering the AD vessel. Preprocessing can involve a variety of technologies including screens, air classifiers, and magnets, but can also include devices such as presses to extract the organic fraction from the inorganic fraction. After sorting, the remaining organic material is typically reduced to a smaller and more consistent size with a shredding machine. In general, wet systems require more preprocessing to remove contaminants because these contaminants can cause AD operational problems and damage mechanical equipment.
The resulting AD feedstock is then typically mixed with water or other liquid food waste organics, but not necessarily, before entering a digester vessel. Dry systems do not require additional water. The lack of oxygen in the vessel allows specific microorganisms (anaerobic) to grow, reproduce, and break down the organic fraction of the waste. Conditions within the vessel are kept optimal for process efficiency, but the process occurs naturally. The material remains in the sealed vessel until the organic fraction has been substantially degraded. The resulting products are digestate, liquid (if the digestate is dewatered), and biogas.
The biogas typically has an energy value of approximately 600 British Thermal Units per standard cubic food (BTU/scf) and can be utilized in a reciprocating engine or gas turbine to produce electricity and heat. It can also be cleaned and injected into the natural gas network, or it can be compressed into a vehicle fuel.
The solid and liquid fraction may then enter a dewatering device (also referred to as a separator), depending on the liquid content, where the liquid fraction is pressed out of the solid fraction. The requirements for separation depend on the moisture content required for the process and the type of solid/liquid product which is generated.
As noted earlier, the digestate can be dewatered to achieve a higher solids content desired for composting or other uses of the digestate. If dewatered, the liquid from the dewatering process is either used in the process again, marketed as a fertilizer depending on the quality, or disposed of in a sanitary sewer.
The remaining digestate can be treated further with aerobic composting to produce compost that can be marketed as a soil amendment. Before marketing the soil amendment, additional screening is often required to remove contaminants such as small bits of plastic and other impurities.
Figure 3-1 provides a flow diagram of a generic AD system.

Anaerobic Digestion Feasibility Study
October 2, 2017 | 23
Figure 3-1. Flow Diagram for Generic Anaerobic Digestion Process
3.2.1 Preprocessing Sorting Systems The use of mechanical screens combined with manual sorting is one method of preprocessing in practice at existing AD facilities. Mechanical sorting involves the use of a bag-breaker or ‘reducer’ to liberate the contents of bagged waste materials. Following bag-opening, the use of manual and/or mechanical screening is used. Mechanical screening consists of the use of a disc screen or rotating trommel screen, typically separating out materials under two inches in diameter as the ‘organic rich’ material. Manual sorting can consist of either extracting organics from the material stream, or extracting contamination from the material stream, leaving the organic materials for processing. Photographs of the two inch minus disc screen and manual sorting were taken of the Newby Island Resource Recovery Park organics preprocessing line that prepares organic feedstock for the Zero Waste Energy Development (ZWED) Company dry fermentation digester in San Jose, California, in Figure 3-2 and Figure 3-3 respectively.

Anaerobic Digestion Feasibility Study
24 | October 2, 2017
Figure 3-2. Mechanical Sorting - Disc Screen of Organics Feedstock
Photo credit: HDR (2015)
Figure 3-3. Manual Sorting of Organics
Photo credit: HDR (2015)

Anaerobic Digestion Feasibility Study
October 2, 2017 | 25
3.2.2 Preprocessing Press Systems The use of a press to extract the organic fraction from mixed waste is becoming increasingly popular where the organic content of mixed waste is high, or where the digestion process requires a low-solids slurry. Several forms of waste presses have been developed and employed, primarily in Europe, to process a variety of feedstock materials. The process is referred to as bio-squeeze, extrusion or press and can include a variety of ancillary systems to remove contaminants that are extruded with the liquid content of the feedstock. The press system can be designed to function on SSO or on mixed waste. These systems employ a similar process whereby the feedstock material is compressed into a sieve that allows the wet fraction to release through the holes in the sieve.
Figure 3-5 and Figure 3-6 show the Fitec Biosqueeze unit extruding organic rich cake from a combined yard trimmings and food waste SSO stream. Similar to other organic processes developed in Europe, if mixed waste is the feedstock, the remaining solid fraction following this process is typically landfilled or incinerated in energy-from-waste facilities.
Figure 3-7 and Figure 3-8 show the Anaergia OREX press extruding an organic rich cake from a wet mixed municipal waste stream.
Depending on the feedstock material, the wet fraction typically consists of a cake-like material containing between 30 to 45 percent solids. If SSO is processed (and if the SSO does not contain contaminants), the pressed-cake can be either diluted for a variety of wet digestion processes, or blended with woody biomass/yard trimmings and digested in a dry digestion process. If mixed wastes are processed, the press cake contains fragments of contaminants (film plastic, glass, ceramic, grit and metals). Although this material can be blended with biomass and digested in a dry digestion system, there are also processes that allow this material to be processed further for use in liquid digestion systems. Several municipal wastewater treatment facilities are exploring the use of the press on mixed waste and wet mixed waste (industrial, commercial and institutional sources). These systems employ further processes including diluting the press-cake (to the range of 8 to 10 percent solids content) for grit removal and hydra-cyclone processes to remove solids and floatables. After dilution, the slurry is passed through a cyclone to remove light (floating) contaminants and heavy (sinking) contaminants. The ‘clean’ slurry can then be ready for a low solids type digester. The contaminants removed require hauling and disposal as solid waste.
These facilities have been employed in stand-alone locations such as transfer stations where the separation process can occur prior to transport to remote digestion or disposal locations.

Anaerobic Digestion Feasibility Study
26 | October 2, 2017
Figure 3-4. Rothmuhle Biogas Plant: Incoming Organic Material Stream (SSO)
Photo credit: HDR
Figure 3-5. FITEC, Rothmuhle Biogas Plant: Biosqueeze Unit

Anaerobic Digestion Feasibility Study
October 2, 2017 | 27
Figure 3-6. FITEC, Rothmuhle Biogas Plant: Extruded Solid Fraction from Biosqueeze Unit
Photo credit: HDR
Figure 3-7. Anaergia, OREX, Kaiserslautern: Feed Hopper (right), OREX Press (bottom left)

Anaerobic Digestion Feasibility Study
28 | October 2, 2017
Figure 3-8. Anaergia, OREX, Kaiserslautern: Organics Polishing System
Photo credit: HDR
3.2.3 Other Types of Preprocessing Systems There are other systems that are currently successfully deployed in the USA on a full scale basis in major metropolitan areas using a combination of mechanical sorting and particle size reduction that produce a bio-slurry product. One such system is Waste Management’s proprietary CORe® process, a centralized organics recycling system that produces an engineered bioslurry (EBS®). The CORe system is typically located at a transfer station where haulers can transport and off load SSO for inert decontamination and processing into a consistent and fully characterized high quality engineered bioslurry product. The EBS product is then transferred by sealed tanker to a receiving station located at the WWTP for introduction into the AD system, conversion into biogas and production of renewal fuel or energy. The CORe system produces an EBS product that typically ranges from 14 to18 percent solids that is easily pumped into and mixed in wet AD system.
Waste Management currently has four full-scale CORe systems employed in the USA, one of which is located in NYC. Working in conjunction with the NYC Department of Environmental Protection (NYCDEP), this public-private project converts SSO into renewable fuel for pipeline injection. Figure 3-9 shows a 250 ton per day (tpd) CORe system processing SSO from commercial haulers as well schools, residences and institutional locations throughout NYC.
This approach has become increasingly popular because of all preprocessing steps occur off site at an existing solid waste transfer location and quality standards for engineered bioslurry are established and monitored prior to product delivery into municipal AD systems.

Anaerobic Digestion Feasibility Study
October 2, 2017 | 29
Figure 3-9. 250 Tons per Day CORe® System in New York, NY
Photo courtesy of Waste Management
After production of the EBS is complete, the product is transported by sealed tanker to the WM receiving station located at the NYCDEP Newtown Creek WWTP for co-digestion. Figure 3-10 shows the CORe system EBS holding tank. Figure 3-11 the company’s EBS receiving and feed-in station tank in the foreground, located adjacent to the NYCDEP WWTP anaerobic digesters.
Figure 3-10. Receiving and Feed-in Station Tank Located Adjacent to the NYCDEP WWTP Anaerobic Digesters
Photo courtesy of Waste Management

Anaerobic Digestion Feasibility Study
30 | October 2, 2017
Figure 3-11. The NYCDEP WWTP Anaerobic Digesters
Photo courtesy of Waste Management
3.3 Processing Types for Anaerobic Digestion Systems AD is widely used on a commercial-scale for industrial and agricultural wastes, as well as municipal wastewater solids. AD technology has been applied on a larger scale in Europe on mixed MSW and SSO, but until recently there has been limited commercial-scale application in North America. The City of Toronto operates two commercial-scale plants that are designed specifically for processing SSO: the Dufferin Organic Processing Facility and the Newmarket AD Facility. More recently, new full-scale co-digestion projects are now in operation in Southern California, New York City and Boston. The Los Angeles County Sanitary District WWTP (Carson, CA); NYCDEP Newtown Creek WWTP (New York City, NY), and Greater Lawrence Sanitary District (North Andover, MA) all receive an engineered bioslurry from Waste Management for co-digesting with wastewater sludge for renewable energy production. There are a number of smaller facilities in the U.S. operating on either mixed MSW, SSO, or in some cases, co-digestion with wastewater sludge.
AD can be categorized into two types of processes.
· Wet systems require the MSW or SSO feedstock to be prepared into liquid slurry. The slurry undergoes the AD process in a tank or similar type of container. Wet systems can be treated in either of the following levels of solids:
- Low-Solids: typically less than 10 percent solids; and
- High-Solids: between 10 and 25 percent solids in a liquid slurry or paste.
· Dry systems, often referred to as Dry Fermentation, do not prepare or preprocess the feedstock to the extent preprocessing is practiced for wet systems; instead, the feedstock is retained in a stacked pile as a stationary solid matrix. Bacteria-rich liquid is applied to the top of the pile to maintain moisture, absorb organic material in the

Anaerobic Digestion Feasibility Study
October 2, 2017 | 31
pile, and allow anaerobic bacteria to consume the organics to produce biogas. Dry systems process the feedstock as a solid, and typically operate as a batch type process in bunkers or garage type containers as shown on Figure 3-23 below.
3.3.1 Co-digestion at a Wastewater Treatment Plant (Wet Digestion, Low-Solids) One option for digesting organic materials is the use of digester capacity at WWTPs such as the South Plant located in Renton, Washington. Sources of appropriate organic materials could include FOG from restaurant grease traps, food waste, and other forms of municipal organics. The use of WWTP AD facilities to process organic materials has been considered by agencies, such as the East Bay Municipal Utility District (EBMUD), NYCDEP Newtown Creek, Greater Lawrence Sanitary District (GLSD) in MA and Los Angeles County Sanitary District (LACSD) in Southern California. For over a decade, EBMUD has been refining its food waste digestion program to generate renewable energy EBMUD employed a pilot facility to convert 20 to 40 tpd of restaurant food scraps to electrical power. Based on the success of the pilot project, EBMUD plans to grow this recycling program. Recycling food scraps at EBMUD supports local zero waste and landfill reduction goals and mandates. EBMUD uses AD to convert these food scraps into renewable energy.25 NYCDEP Newtown Creek WWTP currently uses AD to convert approximately 80 to 90 tpd of SSO into renewable energy. In Carson, CA, LACSD currently uses AD to convert approximately 85 to 95 tpd of SSO into renewable energy. In North Andover, MA, GLSD currently uses AD to convert 45 tpd of SSO into renewable energy. Each of these systems employ the Waste Management CORe to produce an engineered bioslurry product that is prepared off-site and transported to the WWTP for co-digestion.
Numerous other WWTPs have explored these concepts under net-zero energy goals, climate-action goals or other related goals. Similar concepts could be viable for the South Plant if there is surplus digestion capacity. Alternatively, AD systems for digesting solely food waste and other organics could potentially be co-located at local WWTP.
25 https://www3.epa.gov/region9/waste/features/foodtoenergy/

Anaerobic Digestion Feasibility Study
32 | October 2, 2017
Figure 3-12. Food Waste Delivery at EBMUD WWTP
Photo courtesy of EBMUD
Another example of WWTP’s digestion of food waste includes the Central Marin Sanitary Authority (CSMA) Commercial Food to Energy (F2E) program. This program uses the digester capacity at WWTPs for digesting municipal organic waste and FOG. However, unlike the EBMUD example above, the F2E program processes a clean food waste feedstock, nearly completely free of contamination. CSMA and the local waste hauler, Marin Sanitary Service, have developed a unique approach to the digestion of municipal organics by placing the obligation of feedstock cleanliness on the waste generator. Marin Sanitary Service employs a rigorous screening, education and training program on the waste generators that has resulted in nearly contaminant-free food waste. The picture in Figure 3-13 below illustrates the feedstock Marin Sanitary Service collects. Since the food waste contains so little contamination, the processes to prepare the food waste are simple and low cost.

Anaerobic Digestion Feasibility Study
October 2, 2017 | 33
Figure 3-13. Food Waste at Marin Sanitary Service
Photo courtesy of Central Marin
Once collected, food wastes are delivered to Marin Sanitary Service where they are unloaded, visually checked for contamination (typically film plastics), and ground to one-inch minus before being transported to the CMSA WWTP. The CMSA has been equipped with a below-grade receiving tank into which the ground food waste is unloaded. The receiving tank also receives FOG. Figure 3-14 shows the food waste and FOG receiving facility.

Anaerobic Digestion Feasibility Study
34 | October 2, 2017
Figure 3-14. Food Waste and FOG Receiving Facility at CSMA
Photo courtesy of Central Marin
The food waste and FOG are blended in a below grade tank, processed through a simple paddle wheel to remove large solids, and injected into the digester. CMSA improved their biogas upgrade and boiler system to accommodate the increased biogas. Central Marin reports the incased biogas production has allowed them to significantly reduce their use of natural gas for cogeneration and digester heat.
The limitation of this program is the requirement of a relatively pristine feedstock that requires both an educated/supportive generator and a diligent waste collector. Because of these limitations, the quantity of material available in a community is restricted by the number of generators who are willing to separate their organic wastes to such high levels of cleanliness. However, as illustrated in the economics below, the program has a very low cost.
3.3.2 Wet Digestion – Stirred Tank Clean World operates a 150 tpd wet-type AD facility located in Sacramento, California. This facility as shown in Figure 3-15 uses high-solids AD (HSAD) in a mixed tank reactor design for the digestion. The facility processes commercial organics, such as food waste and agricultural residues, and produces compressed natural gas that is used to fuel the adjacent waste collection fleet owned by Atlas Disposal (Figure 3-16 and Figure 3-17).

Anaerobic Digestion Feasibility Study
October 2, 2017 | 35
Figure 3-15. Clean World Anaerobic Digestion Facility in Sacramento, California
Photo credit: HDR
Figure 3-16. CNG Fueling Station from Biogas Produced at the Clean World Anaerobic Digestion Facility in Sacramento California
Photo credit: HDR

Anaerobic Digestion Feasibility Study
36 | October 2, 2017
Figure 3-17. Biogas Upgrading System at the Clean World Anaerobic Digestion Facility in Sacramento, California
Photo credit: HDR
In late 2013, JC-Biomethane began operations of a 100 tpd wet-type AD facility located in Junction City, Oregon. This facility, shown in Figure 3-18, uses a mixed reactor design for the digestion. It is planned to accept commercial organics, such as food waste and agricultural residues to produce approximately 1.5 megawatt (MW) of power. Public records indicate the facility is experiencing difficulty performing at levels initially anticipated.26
26 http://www.eugeneweekly.com/20160616/news-features/taxpayer-subsidized-biogas-plant-underperforms-asks-
massive-tax-break

Anaerobic Digestion Feasibility Study
October 2, 2017 | 37
Figure 3-18. JC-Biomethane’s Anaerobic Digestion Facility in Junction City, Oregon
Photo credit: Register-Guard News
3.3.3 Wet Digestion – Plug Flow Wet digestion - Plug Flow is a common practice in agricultural manures and industrial digestion systems where feedstock sources are relatively homogenous and where the availability or cost of dilution water is either not available or undesirable. Plug flow digestion is typically performed using high solids ratios above 20 percent solids. As such, the material is too viscous for mixing and behaves more as a solid than a liquid. Displacement pumps that have the ability to pass solids are typically used to inject the feedstock into the digester. Due to the lack of mixing, the feedstock passes through the digester as a plug, hence the name plug flow. The digestion unit can be vertical to take advantage of gravity to pass the contents through the digestion process. The unit may also be horizontal and employ a slow rotating agitator along its axis to move the contents from the entry to the exit. Retention times vary according to manufacturer but range between one to three weeks. The following are examples of plug flow digesters.

Anaerobic Digestion Feasibility Study
38 | October 2, 2017
Figure 3-19. Illustration of a Horizontal Plug Flow Digester
Illustration credit: Eisenmann Corporation
Figure 3-20. Vertical Plug Flow Digester
Photo credit: OWS

Anaerobic Digestion Feasibility Study
October 2, 2017 | 39
3.3.4 Dry Fermentation Dry fermentation can occur in a variety of ways. Some of the more common types of dry digestion include bunker or garage-style facilities. Bunker-type dry fermentation facilities consist of a series of concrete bunkers equipped with airtight ceilings and doors, as shown in Figure 3-21. Waste material, typically in the form of a blend of yard trimmings /garden waste blended with food waste, similar to that of a compost material is placed in the bunker and sprayed with a bacterial rich inoculant to begin the digestion process. The organic materials remain stacked in the bunker the entire digestion process (between three to four weeks), during which time liquids are circulated through the media and biogas is extracted from the bunker.
Figure 3-21. Example of Bunker type - Dry Fermentation Process
Illustration credit: Kompoferm
There are two different preprocessing systems typically used for this type of technology. The first includes using an aggressive preprocessing system that could remove most of the contaminants present in the feedstock. The preprocessing system may include hand sorting and some mechanical sorting to remove contaminants prior to digestion. These types of preprocessing systems generally remove a small portion of the organics along with the contaminants. Although some of the biogas potential will be lost with this loss of organics, this method allows for a smaller AD footprint since it will not be accommodating as much inert material mixed in with the organics.
The second planning approach allows all of the feedstock, including contamination, to be processed by the AD. As there is no pumping of the feedstock required, the system is not in danger of damage from contamination like glass and other inert materials. This option would result in a larger digester requirement but would produce slightly more biogas, as no organics would be lost in preprocessing. However, the resulting digestate requires extensive post-digestion processing to separate the organic materials from the

Anaerobic Digestion Feasibility Study
40 | October 2, 2017
waste/contamination materials before the organic fraction could be considered an acceptable compost product.
Some facilities use a balance of the two approaches. The ZWED Dry Fermentation Facility in San Jose (see Figure 3-22 and Figure 3-23) accepts wet commercial waste that goes through preprocessing intended to bring the contamination levels to 30 percent or lower. The digestate produced from the facility is then composted, and is further processed to remove remaining contamination.
Figure 3-22. ZWED Dry Fermentation Facility in San Jose, California
Photo credit: ZWED

Anaerobic Digestion Feasibility Study
October 2, 2017 | 41
Figure 3-23. ZWED Dry Fermentation Facility Bunkers in San Jose, California
Photo credit: HDR
3.4 Large-Scale Versus Small-Scale Systems 3.4.1 Small-Scale – Distributed Systems
Small-scale distributed systems could be attractive in terms of environmental impacts. Small-scale distributed AD systems are somewhat common for agricultural applications in Europe.27 These systems produce a distributed source of biogas used for industry as an offset to utility natural gas. As interest in AD is growing in the U.S., some small-scale systems are being tested in a variety of agricultural locations as well as some trial urban settings. The single-largest advantage of small-scale systems is the avoidance of expensive collection and transport. These systems can completely eliminate waste hauling when sited on-site at the generator location. Other advantages are local resiliency in the form of energy independence, emergency response and disaster preparedness, local food production, and job creation. Odor control on small units usually includes multiple systems in series since many locations are urban with close neighbors (biofilters, carbon filters, neutralizer-atomizers). Beneficial use of the digestate is usually also local and small scale. Small-scale systems are typically associated with localized ‘circular’ economies that minimize trucking in and out of a community. The drawbacks of small-scale systems include the relative lack of economies of scale on an individual
27 https://waste-management-world.com/a/small-scale-anaerobic-digestion-to-boost-biogas-markets
Bunker Door

Anaerobic Digestion Feasibility Study
42 | October 2, 2017
basis, the requirement for customization of the digestion technology to the specific feedstock, and the requirement for operational staff to support the operations and maintenance of the distributed facilities.
3.4.2 Large-Scale – Centralized Systems There has been a recent increase in the use of AD technologies at commercial-scale plants in North America. Two facilities that process commercial organics and/or co-collected green/food wastes using a dry digestion technology and operating in the 100 to 300 tpd range have been recently developed in the San Francisco Bay Area in California. Three facilities that process pre-consumer SSO using a high-solids mixed tank digestion process and operating in the 50 to 100 tpd range have been constructed in the Sacramento area in California. Two facilities that process post-consumer SSO are operating in the Greater Toronto Area: the Dufferin Organic Processing Facility in Toronto and the CCI Energy Facility in Newmarket, Canada.
Harvest Power’s Energy Garden and Composting facility in Richmond, British Columbia, includes AD of organics such as unsaleable food products, FOG, liquid waste, supermarket waste, and agricultural wastes. The facility includes depackaging equipment for preprocessing. Digestate is turned into compost and sold. Biogas produced is converted into electricity. The facility is the first commercial scale high solids AD in Canada, and began producing energy in mid-2012. It is estimated to have the potential to generate about 1 MW of energy per year.28
New York, Los Angeles and Boston have all taken leadership positions in the implementation of large, full-scale systems for the conversion of food wastes into renewable energy. As previously discussed in Section 3.3.1, the NYCDEP, LACSD, and GLSD have been co-digesting SSO from centralized preprocessing systems owned and operated by Waste Management. WM has employed its proprietary CORe process to produce and deliver a high quality characterized engineered bio slurry, EBS product, for co-digestion under long term commitments to these municipally operated WWTP AD facilities. The WM CORe systems receive commercial, industrial and institutional food waste streams that include contaminant fractions and process the waste streams to produce and provide a consistent high quality decontaminated engineered bio slurry (EBS) product for renewable energy production at the municipal WWTP facilities. These facilities are all targeted to manage 250 to 500 tpd inbound SSO equivalent.
Larger facilities have to incorporate strategies to mitigate odor impact. The odor is typically not from the digestion process itself but rather in the waste receiving, preprocessing, and post-processing operations. Strategies can include rapid-roll doors for trucks entering and exiting the facility, shortening the time between off-loading of the material and preprocessing, and covering the digestate that is staged for transfer.
28 http://www.harvestpower.com/locations/bc_richmond

Anaerobic Digestion Feasibility Study
October 2, 2017 | 43
4 Exploration of Potential Anaerobic Digestion Development Opportunities SWD staff identified several potential opportunities for developing AD locally and these opportunities were evaluated during this project. The potential opportunities include:
· Implementing a small-scale AD for Vashon Island, where there is a very motivated constituency and cost savings if transportation off island is eliminated. SWD has engaged Impact Bioenergy through a grant program to perform a feedstock assessment and a feasibility study of employing a community-digester operating system.
· The grant program also includes the development of a software tool to facilitate the diversion of food waste. It also includes a feedstock assessment, and preparation of a feasibility study to establish feasibility, gather requirements and design a community-digester operating system for Vashon Island, which can also serve as a template for others. Since the grant program’s study and resulting pilot program are still underway, this AD Feasibility Study does not include the results of the grant program for Vashon Island.
· Partnering with existing compost facilities to identify AD capacity for select feedstocks and opportunities to manage digestate from potential facilities. HDR has communicated with the existing compost facility owners to explore possible AD implementation concepts. Exploration of further partnership opportunities may be considered in the future.
· Utilizing available space at Bow Lake Recycling and Transfer Station for a small-scale AD unit to process mixed organics with some contamination or a source separated clean organics stream. Depending on the quantity and quality of organic material that can be captured at this facility, the Bow Lake facility may be a potential location to house a preprocessing system to extract organic materials from the waste stream. Sorted organic materials might either be treated through a small-scale on-site facility or shipped elsewhere for digestion.
· Partnering with King County’s Wastewater Treatment Division to process food waste at one of their existing treatment plants. On June 2, 2016, SWD staff and HDR met with the Renton WWTP staff to discuss possible interest in receiving/processing food waste at the Renton facility. Further consideration of the use of the Renton WWTP may be explored in the future.
· Supplying yard trimmings to a biosolids composting operation. Although most WWTP biosolids management programs in the region employ land application procedures in eastern Washington (with the exception of small quantities land applied on nearby forest lands), the possibility of providing WWTP/composters of biosolids with wood/yard trimmings is an attractive option. Recent cessation of biomass incinerators throughout the US has resulted in an over-supply of biomass, some of which could be beneficially used to compost biosolids. From the perspective of this study, the efforts associated with the management of biosolids is limited to

Anaerobic Digestion Feasibility Study
44 | October 2, 2017
encouraging WWTP operators to determine the viability of their biosolids management plans apart from SWD assistance.
4.1 Exploration of Potential Partnerships HDR explored the potential for partnerships between SWD and private industry and/or other public agencies including other County divisions or departments. HDR conducted interviews/collaborative meetings with the following potential partner organizations:
· County Wastewater Treatment Division
· Cedar Grove Compost
· Impact Bioenergy
· Lenz Enterprises
· Pacific Clean
· Waste Management
· Recology
To assist the reader’s appreciation of the proximity, each of these potential partners are located as shown on the attached map. Key facilities in the King County waste management system and other nearby facilities are also shown.
Figure 4-1. Waste Management Facilities in King County and Surrounding Areas
This report provides an overview of the insights gained from these meetings, the relevance to the insights gained from the existing conditions and technology overview and the process for determining an overall recommended approach for organics management. The discussions explored the possibilities of partnering in the development of AD facilities in the King County region by focusing on the following areas:

Anaerobic Digestion Feasibility Study
October 2, 2017 | 45
A. Current feedstock sources and compatibility with private facility technologies (preprocessing and composting technology)
B. Collection method (curbside, commercial, other, or combination)
C. SSO vs. mixed solid waste or other materials
D. Contaminant screening and removal, and impact of contaminants on AD
E. Pretreatment and post-treatment of various feedstocks
F. Problems/risks associated with various feedstocks
G. Optimal and acceptable feedstock combinations
H. Management of residues
I. Facility development possibilities
J. Facility operation compatibility with current infrastructure
K. Potential facility ownership models
L. Who is best suited to manage by-product processing and marketing
M. Possible funding of facilities
HDR concluded the potential partnership analysis identifying five strategies for SWD to consider for implementing an organics program in the region, which will be discussed prior to proceeding with the Phase 2 evaluations.
4.2 Renton Wastewater Treatment Plant (County Wastewater Treatment Division) Partnership Background Representatives of SWD and HDR’s consulting team visited the Renton WWTP on June 1, 2016, to better understand the history of interaction between SWD and the Wastewater Treatment Division and to explore opportunities for managing organic materials. The facility operators provided insights on past projects at the plant to explore the co-digestion of food waste and wastewater and conducted a tour of the WWTP. The Renton WWTP was used to model a typical food waste co-digestion project with the plant’s existing anaerobic digesters. Capacity for such a project may not be at the Renton WWTP, however, because the facility operators pointed out that if one digester were out of service (which can be 6 to 9 months at a time), then the plant would be operating at full capacity. The tour and conversation were informative and provided relevant context for project planning.

Anaerobic Digestion Feasibility Study
46 | October 2, 2017
Figure 4-2. Renton Wastewater Treatment Plant
Photo credit: King County
Through conversation with the operators, the project team learned that the Renton WWTP has explored co-digestion of both food processing waste (from manufacturing of food products) and of FOG, and currently receives a limited amount of food processing waste. No preprocessing is currently performed at the WWTP. To date, the operators have developed a preliminary design and cost estimate to construct a FOG receiving/handling facility, but the project has not yet been implemented. The preliminary design concept anticipates that haulers would deliver the FOG to the WWTP and pay a tip fee. The operators also noted that dairy digesters in western Washington currently process much of the FOG feedstocks that are readily available, as these manure-based digesters can take up to 35 percent non-manure feedstocks (such as FOG), as allowed by the Washington Administrative Code.
The Renton WWTP produces scrubbed biogas (“biomethane” or “renewable natural gas”) from the AD biogas. The operators have the option of injecting the pipeline quality biomethane into the natural gas pipeline for sale to PSE or sending it to turbines to produce electricity for sale to PSE (net-metering). Historically, the vast majority of the biomethane has been injected into the natural gas pipeline. However, the current price of natural gas is unusually low and the operators have determined that it is more cost-effective to produce and sell electricity. The facility is in the process of securing high-value Renewable Identification Numbers (RINs) and plans to switch back to injecting biomethane into the natural gas pipeline as soon as the RINs are secured this year.
The Renton WWTP operators identified the following areas of concern for WWTP digesters when considering the introduction of food waste as a co-digestion feedstock:

Anaerobic Digestion Feasibility Study
October 2, 2017 | 47
· Contamination and the necessary pretreatment of feedstock
· Increased polymer usage due to reduced dewaterability of the digested solids associated with co-digestion of food waste
· Additional costs for thickening and dewatering of solids
· Additional staffing and related operations costs that would require approval and on-going financial commitment
While there are noted technical challenges to co-digesting food waste at the WWTP, the operators also identified a need for the addition of one full-time employee to oversee such an operation. There was some discussion indicating that increasing the staff levels to accommodate the operation may be challenged by budget constraints. The operators also noted that Renton’s Sustainability Study (2014) described the need to explore the digestion of municipal organics at the Renton WWTP. In general, the plant operators were open-minded about exploring a food waste co-digestion project at the facility.
The plant operators noted that the additional AD capacity required at the plant for food waste digestion should be implemented as a dedicated anaerobic digester for the food waste, not combined with existing digesters used for wastewater. Finally, it was noted anecdotally that the West Point WWTP has limited digester capacity and strict truck trip limits and would not be a candidate for imported organics digestion.
The purpose of the Renton WWTP is to serve the community sewerage services. Its capability of accepting FOG and food waste is limited by the facility’s current and future needs. See Appendix 1 for detailed responses to each of the focus areas listed in Section 1.
4.3 Cedar Grove Partnership Background Cedar Grove Compost (CG) owns and operates two compost facilities in the region: one in Maple Valley and another in Everett. The facilities process green, yard, food and commercial organic materials. CG processes the majority of the City of Seattle’s SSO that was contracted to PacifiClean, but is processed locally due to the apple maggot quarantine limitations of the PacifiClean facility.
As a precursor to exploring CG’s interest in implementing AD, the following discussion provides an overview of the recent attempt of CG to implement an AD facility and its current plans resulting from that experience.
Cedar Grove has explored ways to improve its operations. In 2010, they announced a collaboration to build an AD facility at their Everett facility and integrate it with their processes. The project was to have received and processed mixed food/yard trimmings that would be compatible with the CG composting facility program. The goal of the AD project was to anaerobically digest the more putrescible materials (food waste, vegetables, meats, dairy products, etc.) in the enclosed AD where the beneficial biogas by-product could be captured and converted to renewable energy.29 However, due to
29 Seattle Solid Waste Management Plan, revised 2013

Anaerobic Digestion Feasibility Study
48 | October 2, 2017
concerns from the neighboring community (about odor and impacts), the project was unable to proceed.
Figure 4-3. Cedar Grove Everett Facility
Photo credit: HDR (2012)
CG is currently exploring the development of a pilot high-solids plug flow type digester at the Maple Valley site, which it hopes to use to demonstrate that the digestion process can occur without concern for fugitive odors. The facility would be equipped with a preprocessing system to screen/shred the material into pulp-like thickened slurry prior to digestion. The digester would be a horizontal digester equipped with paddle-like mixers that would both mix and convey the contents of the digester from beginning to end. The digester would have a retention time of several weeks. After the digester has been demonstrated at the Maple Valley CG facility site, CG hopes to replicate the use of this type of digester at the locations of some of its larger volume customers. CG would service the digesters and also provide its customers with implementation assistance, maintenance and related support. CG will offer to collect the digestate (post digestion) which would be transferred to its composting facilities for post-digestion blending and subsequent composting. Biogas generated by the digestion unit would be used by the customer in whatever form they prefer. CG believes this model (decentralized/distributed digestion) will have a greater chance of success than a centralized digestion unit like the one it attempted to develop.
4.4 Impact Bioenergy Partnership Background Impact Bioenergy has developed two AD systems that are designed to provide on-site generation of energy from food waste and similar organic materials. These systems,

Anaerobic Digestion Feasibility Study
October 2, 2017 | 49
listed below, are intended to be skid-mounted or freight trailer-sized devices for mobile deployment:
· The Nautilus AD185 Series Bioenergy Systems are designed to process between 1,000 to 5,000 pounds of organic material per day. The energy production ranges from between 111,000 BTU/hour to 555,000 BTU/hour. Gas storage is included to allow daily energy production to match peak demand patterns. Feedstock preparation, power generation, output separation, and odor control are included. The Nautilus is a freight truck-sized device that can be readily deployed to a site for use.
· The Impact 25 Series Bioenergy Systems are designed to process 135 pounds of organic material per day. This can reduce the environmental footprint of small generators such as a cafeteria or restaurant. Each device is the size of a shipping container and can be readily placed at a site for use.
Figure 4-4. Impact 25 Series Bioenergy System
Photo credit: Impact Bioenergy
Impact Bioenergy has developed equipment sized to process organic materials from individual generators/sources to regional-scale facilities. It envisions identifying generators who prefer to have the devices located on their property for on-site treatment of organics waste and to capture the biogas for renewable energy. Impact Bioenergy assumes the private organic material generator would own the equipment located on its property. However, if the larger Impact Bioenergy devices (Nautilus) were to be selected for a County site (such as transfer station sites), the County could own the facilities. See appendix 3 for detailed responses to each of the focus areas listed in Section 1.

Anaerobic Digestion Feasibility Study
50 | October 2, 2017
4.5 Lenz Enterprises Partnership Background Lenz Enterprises currently processes SSO and yard trimmings from cities in King County, including the majority of Seattle’s SSO (the smaller portion of Seattle’s SSO goes to Cedar Grove).
Mr. Lenz and Mr. Wheeler have researched AD for over a decade and have been working with two local committees to develop AD projects in the State. While they have not found a profitable business model in which an AD project has been successfully developed through to sustained operations, they remain interested in King County’s AD initiative and wish to remain informed and involved in the developments as they happen.
While removal of contamination that accompanies food waste in the SSO they receive is the biggest challenge in their operation, they are able to clean their feedstocks to the degree that their compost end products can be sold with a reasonable margin and high level of acceptance.
Lenz appears to be supportive of the County’s goals to implement an AD program. However, Mr. Lenz and Mr. Wheeler indicated an interest in receiving digestate from AD facilities and producing compost as a viable by-product using their existing compost facility. See appendix 4 for detailed responses to each of the focus areas listed in Section 1.
Figure 4-5. Compost Turning at Lenz Enterprises
Photo credit: Biocycle (12/17/14)
4.6 PacifiClean PacifiClean Environmental was awarded the contract to process yard/green/food waste from the City of Seattle. However the Washington State Department of Agriculture (WSDA) implemented emergency rules under their Pest Program that specifies methods to prevent the introduction, escape or spread of apple maggots beyond the quarantine area. Under these emergency rules, ‘municipal green waste’ generated in the quarantine

Anaerobic Digestion Feasibility Study
October 2, 2017 | 51
area is defined as a ‘regulated commodity’ and subject to strict controls. The emergency rules prohibit the transportation of collected organics from western Washington to the PacifiClean facility which is located outside the quarantine area. To comply with these conditions, the City’s organic materials are being delivered to Cedar Grove for composting as an interim measure until further notice.
4.7 Waste Management Waste Management (WM) serves the region with waste collection services. HDR discussed the potential for partnerships with Matt Sterns of Waste Management (WM). WM has invested in technologies to convert organic materials to energy, including its Centralized Organic Recycling equipment (CORe) process, which allows it to produce biogas for electricity and fuel. WM reports the system is capable of collecting commercial food waste, screens it in one of its CORe facility to remove contaminants, and blends into bioslurry. WM’s intentions are to deliver the bioslurry to municipal WWTPs, where it is anaerobically digested to increase the production of biogas. WM reports that adding approximately 7 percent organic material in the form of bioslurry to the plants’ anaerobic digesters increases energy output by over 70 percent. The technology is still being piloted by WM, and there are projects in New York City and Los Angeles, with another one being developed in Boston. WM also reports the technology is modular and could be implemented at a any of the three WM owned properties in the region.
4.8 Recology Recology/Cleanscapes provides waste collection services in the greater Puget Sound region, specifically the current organics collection win the City of Seattle. Recology owns and operates the Cleanscapes waste and recycling facilities. Recology does not operate a composting or digestion facility in the region but has composting capabilities in Oregon and California. The current contracts began in March 2009 and will continue until 2017 or longer if extensions are granted by the City. City residents have combined yard and food waste collection every week. Approximately half of the collected material is sent to the contracted processing facility, Lenz Enterprises. Recology is reportedly exploring the development of a dedicated digester at one of its facilities in California, although specifics of this project are not known. However, Recology is open to assisting the County in support of its goal of diverting recoverable materials from landfilling and securing the highest/best use of resources.

Anaerobic Digestion Feasibility Study
52 | October 2, 2017
5 Potential Partnerships Technical Observations HDR offers the following insights gained from prior research and the meetings and interviews undertaken for this task.
1. Several private compost companies provide for the collection and processing of source separated yard trimmings with food waste into compost in the greater King County region. Despite this robust infrastructure, the County reports nearly 300,000 tons of organic material is disposed of at the CHRL annually.
2. Capturing organic materials for AD will require increased generator participation for source separated/low contamination feedstock or the implementation of mechanical methods to extract organics from MSW.
3. SSO materials are already being collected under private agreements with some existing composters in the region who have expressed concerns about whether the County’s program would compete or otherwise interfere with these arrangements.
4. A County-implemented program or policy to impose source separation of organic materials beyond the current voluntary/private collection system will require new collection systems and mandates on generators to divert additional organics from MSW into the organics program.
5. Separating the organic fraction from MSW has a unique set of challenges. Several methods have been attempted, including:
a. Mechanical equipment that squeezes MSW and extracts the liquid content for further refinement before digestion;
b. Mechanical screening systems that separate materials by size/density; and
c. Optical sorting systems that separate materials according to their light refraction properties.
Each of these methods has limitations and produces different types of organic feedstocks. The use of these feedstocks for digestion will likely necessitate further processing either prior to digestion or after digestion as a part of the digestate management process.
6. The method of digestion could vary according to the type and quality of feedstock. Wet digestion systems tend to be well suited to SSO that is high in food waste and low in contamination. Dry digestion systems tend to be well suited to stackable yard trimmings that contains food waste but is blended in the range of a 50/50 ratio.
7. The use of existing WWTP digester capacity where operating processes employ low solids content (e.g., in the range of 4 percent by volume) is feasible, but this type of technology is exclusive to public facilities for wastewater treatment.
8. The private sector has developed high solids systems with relatively small tanks because their feedstocks are different from the low solids feedstocks of the WWTP systems (which are designed to process wastewater). High solids systems could be

Anaerobic Digestion Feasibility Study
October 2, 2017 | 53
continuously stirred, plug flow or stackable dry systems, depending on the composition of the feedstock.
9. The study demonstrates that any form of AD is complex and expensive, relative to landfilling and composting. Managing feedstock sources from MSW including the screening, preprocessing in addition to the post digestion management of solids and the associated odor control systems are especially costly additions to the AD system. With that in mind, the County may wish to further explore a SSO AD partnership with a local private composter.
10. Existing private sector haulers and composters have developed an existing infrastructure that processes SSO. The study revealed potentially significant capital and operational cost savings if SSO material can be secured for AD processing. Two key indicators contribute to this finding: · Wet digestion systems tend to be well suited to SSO that is high in food waste
and low in contamination. · The cost of preprocessing MSW is significant, contributing to nearly one third of
the overall system cost.
11. Although SSO is currently being collected under private agreements, an AD program could benefit from a cooperative agreement with the existing organics haulers to provide an appropriate quantity and quality of SSO for a digestion process. This could be true for both Scenario 2 (use of the Renton WWTP) and Scenario 3 (dedicated digesters).
12. It is therefore recommended the County engage the private haulers processing SSO to explore the availability and use of SSO for AD. Partnering with an SSO hauler would avoid undermining their existing organic systems and take advantage of existing business relationships and collection routes. A partnership between the County and organics private haulers and processors is not projected to increase the County recycling rate because SSO is already being diverted and processed as compost.
13. To improve the region’s recycling rate, the county should also explore options for increasing the amount of SSO, as well as the quality. Mandatory separation is one possibility; another is a subscription-based organics diversion program with incentives for businesses to provide high-quality, consistent SSO for a digester.

Anaerobic Digestion Feasibility Study
54 | October 2, 2017
6 Potential Partnership Consideration of Strategies Based on insights gained from prior research and the meetings with potential partners described above, HDR provided the following potential strategies for SWD to select for further evaluation for implementing an AD program in the region.
Private Sector Solutions – These strategies could be enhanced if the County and/or the cities in the County encourage or require organics generators to separate organics from MSW.
· Strategy 1: Distributed/managed AD using SSO, with digestate/composting under service agreement
· Strategy 2: Distributed/independently owned AD using SSO and free market management programs for downstream digestate
Public Sector Solutions – These strategies assume that the County and/or the cities in the County will direct MSW to facilities for processing the organic fraction.
· Strategy 3: Centralized WWTP (presumably Renton WWTP) using either SSO processed off-site (using technologies similar to the CORe offered by WM or others) or the organic fraction of MSW (OFMSW) from distributed squeeze systems.
· Strategy 4: Regional dedicated AD using MSW preprocessing and possibly AD facilities at County Transfer Stations, digestate service agreement to privately owned composting facilities.
· Strategy 5: Implementation of a mandatory program whereby all waste generators in King County are required to separate organics for processing.
6.1 Strategy 1: Distributed/Managed Anaerobic Digestion from Source-Separated Organics This strategy employs distributed/managed AD systems using SSO, with digestate composting under service agreement.
This strategy consists of the distribution of up to several dozen digesters distributed throughout the region wherein each digester would be located with a tributary feedstock shed consisting of generators who would understand the system and be actively engaged in the system’s success. For economies of scale, each of the digesters would be sized to accept between 5,000 and 10,000 tons of feedstock per year. This strategy is based on the assumption that organic material generators can and will produce a high quality feedstock suitable for digestion with minimal preprocessing when the generators are engaged to the degree that they have a sense of ownership/responsibility for the digestion facility’s success. This strategy would encourage interested organic material generators to subscribe to services and dedicate their organic materials to the facility. As a subscription service, the generators would understand the cause and effect of the organic materials/contamination levels so that the digestion byproducts are high quality,

Anaerobic Digestion Feasibility Study
October 2, 2017 | 55
requiring minimal effort and cost to make marketable, resulting in the most economically attractive outcome possible. Gaseous byproducts (primarily methane but also carbon dioxide, odor causing hydrocarbons, etc.) will be converted to renewable energy in various forms, depending on the needs of the individual generators and/or host site owner. Solid and liquid byproducts will be managed by a service provider under a relatively long-term agreement to assure market stability and bank financing ability.
The most important feature of this strategy is reliance on the existing private sector organics service companies to develop educated generator participation that results in minimal contamination at the source generator and generator buy-in for digester by-product off take/beneficial uses. The riskiest aspect of this strategy is that distributed/small digestion units may require unanticipated levels of servicing to avoid nuisance odors. This should be validated with a demonstration project or pilot as large scale and centralized facilities have struggled with nuisance odors as well.
The following descriptions address the key topics as they relate to this strategy.
A. Current feedstock sources and compatibility with private facility technologies (preprocessing and composting technology)
Private organics processing facilities, such as CG, could provide a managed and distributed AD under a service agreement. CG was the only composter interviewed by HDR that expressed interest in the approach. CG has a long-standing relationship with many of the generators throughout the region. CG would identify generators whose participation in the current organics diversion program is well suited to providing feedstock that would be compatible with the digestion technology they have selected to demonstrate at its pilot facility. As such, the feedstock could vary according to the individual participants. This situation could be beneficial in securing buy-in from the generators to provide feedstock materials with low contamination levels. There are examples of facilities where this type of system has worked well. For example, the Harvest Power facility in Orlando, Florida operates on a subscription basis. Consequently, the feedstock contains very little contamination.
B. Collection method (curbside, commercial, other, or combination)
This strategy would site a variety of digesters to service relatively small localized tributary waste sheds. Some clarification as to how the organics would be collected from the generators and delivery/input into the digester would be needed. The collection method would be categorized as ‘source separated – curbside collected – subscription.’
C. SSO vs. mixed solid waste or other materials. Materials would be source-separated and committed to the digestion facility near the generator for a duration that matched a bankable return on investment. One of the key benefits of this strategy is that the generators would have a stake in the digester, so presumably the feedstock would contain very low contamination as described in ‘A’ above.

Anaerobic Digestion Feasibility Study
56 | October 2, 2017
D. Contaminant screening and removal, and impact of contaminants on AD
The presence of contamination and the necessity to remove it has become a significant issue for facilities. As noted above, one of the key differentiators of this strategy is the generator’s engagement with the process and subsequent individual contributions in terms of delivering pristine feedstock, so as to minimize the level of contaminate removal required.
E. Pretreatment and post-treatment of various feedstocks
This strategy feeds into CG’s current vertical integrated business plan around managing the post-treatment process. CG would provide an off-take type agreement to manage the removal/stabilization/composting of digestate at one of its composting facilities. As described above, its selection of a portable plug-flow form of digestion, resulting in a digestate that CG would consider compatible with its covered, aerated compost program to reach a high quality to compete in the compost market. Post-treatment systems that CG would employ include screening and air-classification/densimetric separation.
F. Problems/risks associated with various feedstocks
This strategy relies on CG being actively involved in the feedstock collection and delivery to the digester, in part to protect the digester from contamination introduced by generators. This ‘hands-on’ approach minimizes risks by identifying problems as they arise. This strategy employs the use of ‘natural consequences’ to police the feedstock, which will allow the generators to refine their feedstock to the appropriate materials for the digester. The digestate from the digesters is anticipated to be more stable, less odorous and to contain less contamination when blended into compost for further processing.
G. Optimal and acceptable feedstock combinations.
CG anticipates the optimal feedstock for the distributed AD devices will vary according to the organic material generator. The high-solids plug-flow type of digester has been used in Europe to process a variety of feedstock such as animal manure, dairy waste, food manufacturing wastes, etc.
H. Management of residues
CG’s goal of implementing the distributed digestion units is to retain control of the digestate which CG hopes to compost. Again, depending on the quantity of contamination in the feedstock, the digestate should contain less contamination for composting. In theory, the quantity of residues should be reduced when these AD devices are being managed correctly.
I. Facility development possibilities This strategy is early in the evolution of development so it is premature at this time to forecast how facilities would be developed. CG would likely need to work with generators to identify preferred sites throughout the region to locate the digesters. This strategy has the benefit of offering relatively small/modular sized digestion devices that could incur less public opposition, provided the demonstration device performs well. Conversely, one

Anaerobic Digestion Feasibility Study
October 2, 2017 | 57
of the challenges associated with developing multiple digestion facilities is the need to repeat the development/approval process multiple times. This will add cost to the system. Depending on the subscription participation levels, development of digestion facilities may not be viable where feedstock commitment levels are low, resulting in unfavorable economies of scale. To some extent, the pilot project at the CG facility will play a crucial role in understanding how the organic material generators will be willing to accept the device on their property.
J. Facility operation compatibility with current infrastructure
This strategy relies on the assumption a private entity overseeing the entire process (from feedstock to by-products) is responsible for operations. This holistic overview approach places the responsibility for performing operations of the digester in context with the entire system, thereby preventing ‘finger pointing’ when challenges arise. This strategy is well suited to be complementary with the existing composting infrastructure insomuch as it allows for the capture of highly putrescible organics close to the source, with capture and conversion of the most odorous emissions under anaerobic conditions where they can be destroyed/converted to a renewable form of distributed energy. The type of energy (renewable natural gas, electricity, heat) has yet to be identified and is likely to be a function of needs of the host site. To support operations, CG would need to develop a new staff of appropriately trained operators and maintenance personnel who would be readily available to deploy services to the distributed AD devices. The current composting infrastructure is compatible to process the digestate generated by the distributed AD devices.
K. Potential facility ownership models
This strategy presumes the AD equipment could be owned by the organic material generator or by CG under a lease/manage option. This model would most likely not require public investment.
L. Who is best suited to manage by-product processing and marketing
The beneficial use of the biogas by-products would likely be selected by the host site for each of the digester locations. This strategy allows the beneficial use of biogas to potentially offset existing power demands as well as provide other environmentally preferable options. This will allow the generators and/or host to be more participatory in the system. Solid and liquid by-products would be managed by CG, who would provide an umbrella service contract for off-take and management. CG will remain in control of the solids (digestate) from the digesters for composting and related by-product marketing.
M. Possible funding of facilities
This strategy is too premature in its development to identify funding options, although the preliminary goal would be to entice individual generators and/or site hosts to seek funding as part of energy offsets or environmental, non-fiscal benefits.

Anaerobic Digestion Feasibility Study
58 | October 2, 2017
6.2 Strategy 2: Distributed/Independent Anaerobic Digestion from Source-Separated Organics or Organic Fraction of Municipal Solid Waste This strategy employs a distributed/independently owned AD using SSO and free market management programs of the downstream digestate. For economies of scale, each of the digesters would be sized to accept between 500 to 1,000 tons of feedstock per year. This strategy is based on the assumption organic material generators will elect to own/manage and benefit from the use of a digester dedicated to suit their individual needs. Consequently, for the purposes of comparison, this strategy assumes the organic material generator would manage its affairs to provide the appropriate feedstock, manage its by-products and benefit from its biogas production.
The most important feature of this strategy is reliance on the organic material generators to desire/purchase/implement enough digestion units to impact the overall goal of reducing the quantity of organics currently being landfilled. Similar to strategy 1 above, this strategy also relies on educated generator participation that result in minimal contamination at the source generator and generator buy-in for digester by-product off take/beneficial uses. As with strategy 1, the riskiest aspect of this strategy is that distributed/small digestion units may require unanticipated levels of servicing to avoid nuisance odors. This should be validated with a demonstration project or pilot as large scale and centralized facilities have struggled with nuisance odors as well.
The following descriptions address the key topics as they relate to this strategy.
A. Current feedstock sources and compatibility with private facility technologies (preprocessing and composting technology)
Feedstock sources could be SSO or the OFMSW. If independently owned, digestion facilities are relatively small (e.g., the Impact Bioenergy sized devices that process in the range of 100 to 5,000 pounds of material per day) SSO could be an ideal feedstock. However, as feedstock volumes increase the likelihood of contamination and the need for preprocessing becomes likely.
B. Collection method (curbside, commercial, other, or combination)
Again assuming these facilities are independently owned, there would be no formal collection method for this strategy.
C. SSO vs. mixed solid waste or other materials
Owners of AD devices would need to understand the necessity of providing SSO to the digestion units. If the likelihood of contamination levels is high enough to necessitate preprocessing, this strategy assumes the owner would either alter the feedstock source or implement appropriate preprocessing methods.

Anaerobic Digestion Feasibility Study
October 2, 2017 | 59
D. Contaminant screening and removal, and impact of contaminants on AD
Contaminant screening and removal would be necessary and would most likely occur by the generator/owner. The presence of contamination would have an effect on the selection of the dedicated digestion technology.
E. Pretreatment and post-treatment of various feedstocks
This strategy assumes SSO would negate the need for pretreatment of feedstock materials before digestion.
F. Problems/risks associated with various feedstocks
The individual digester owners would need to identify and resolve problems with contamination but as a generator/owner, the assumption is that they would acquire an adequate understanding of the digestion process to mitigate problems as they arise. Also, the assumption that the digestion device supplier would provide an on-going technical support team to identify problems and offer remedies to the digester owners.
G. Optimal and acceptable feedstock combinations
At this level of the analysis there is no optimal and acceptable feedstock combination identified. Impact Bioenergy reports its equipment is capable of digesting food, paper, grass, and liquids.
H. Management of residues Residues from the distributed/dedicated digester units could be managed in a variety of ways. Individual concessions could be awarded to local composters to compost the digestate from the digestion units.
I. Facility development possibilities
The typical facility for this strategy is as a locally owned/operated device that serves a commercial enterprise, institution, college campus, community HOA or similar semi-regional entity.
J. Facility operation compatibility with current infrastructure
Similar to strategy 1 above the digestion technology provider would provide on-going technical support to the owner of the digestion facility as a contracted operator service. As a local example, Impact Bioenergy is providing an ongoing technical support service through a lease to a restaurant/pub/marina on Bainbridge Island.
K. Potential facility ownership models
This strategy is based on the assumption the private organic material generator would own a facility located on its property.
L. Who is best suited to manage by-product processing and marketing
The upgrading and beneficial use of the biogas could be contracted to a private entity could be ideally suited to manage its use (depending on tax benefits, etc.). This strategy
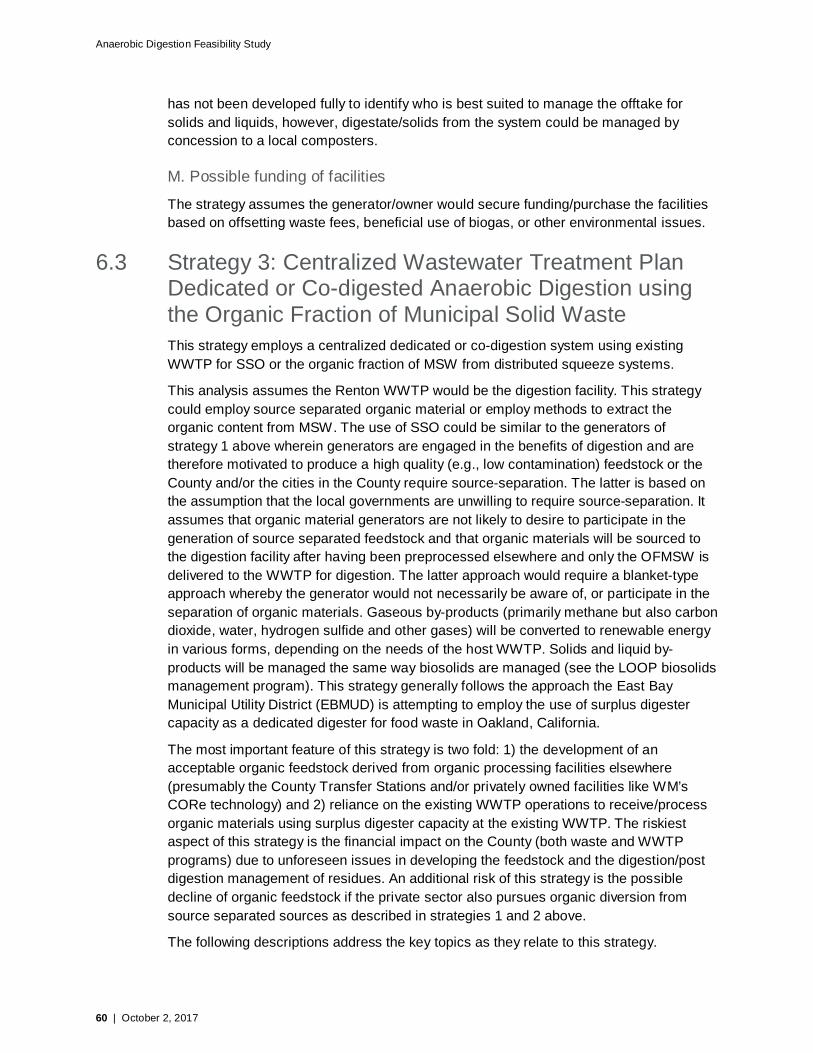
Anaerobic Digestion Feasibility Study
60 | October 2, 2017
has not been developed fully to identify who is best suited to manage the offtake for solids and liquids, however, digestate/solids from the system could be managed by concession to a local composters.
M. Possible funding of facilities
The strategy assumes the generator/owner would secure funding/purchase the facilities based on offsetting waste fees, beneficial use of biogas, or other environmental issues.
6.3 Strategy 3: Centralized Wastewater Treatment Plan Dedicated or Co-digested Anaerobic Digestion using the Organic Fraction of Municipal Solid Waste This strategy employs a centralized dedicated or co-digestion system using existing WWTP for SSO or the organic fraction of MSW from distributed squeeze systems.
This analysis assumes the Renton WWTP would be the digestion facility. This strategy could employ source separated organic material or employ methods to extract the organic content from MSW. The use of SSO could be similar to the generators of strategy 1 above wherein generators are engaged in the benefits of digestion and are therefore motivated to produce a high quality (e.g., low contamination) feedstock or the County and/or the cities in the County require source-separation. The latter is based on the assumption that the local governments are unwilling to require source-separation. It assumes that organic material generators are not likely to desire to participate in the generation of source separated feedstock and that organic materials will be sourced to the digestion facility after having been preprocessed elsewhere and only the OFMSW is delivered to the WWTP for digestion. The latter approach would require a blanket-type approach whereby the generator would not necessarily be aware of, or participate in the separation of organic materials. Gaseous by-products (primarily methane but also carbon dioxide, water, hydrogen sulfide and other gases) will be converted to renewable energy in various forms, depending on the needs of the host WWTP. Solids and liquid by-products will be managed the same way biosolids are managed (see the LOOP biosolids management program). This strategy generally follows the approach the East Bay Municipal Utility District (EBMUD) is attempting to employ the use of surplus digester capacity as a dedicated digester for food waste in Oakland, California.
The most important feature of this strategy is two fold: 1) the development of an acceptable organic feedstock derived from organic processing facilities elsewhere (presumably the County Transfer Stations and/or privately owned facilities like WM’s CORe technology) and 2) reliance on the existing WWTP operations to receive/process organic materials using surplus digester capacity at the existing WWTP. The riskiest aspect of this strategy is the financial impact on the County (both waste and WWTP programs) due to unforeseen issues in developing the feedstock and the digestion/post digestion management of residues. An additional risk of this strategy is the possible decline of organic feedstock if the private sector also pursues organic diversion from source separated sources as described in strategies 1 and 2 above.
The following descriptions address the key topics as they relate to this strategy.

Anaerobic Digestion Feasibility Study
October 2, 2017 | 61
A. Current feedstock sources and compatibility with private facility technologies (preprocessing and composting technology)
There are no current feedstock sources that meet this strategy. This strategy could rely on SSO however, due in part to the nature of this strategy as a ‘centralized’ approach, it is generally believed that organic material generators will not be engaged to the degree they would with a decentralized digestion approach. Consequently, it is more likely the feedstock sources would be derived from the organic fraction of MSW as described in strategy 4 below whereby the County Transfer Stations would be equipped with preprocessing equipment to source feedstock to the centralized WWTP.
B. Collection method (curbside, commercial, other, or combination)
Again assuming the organic material generators would not participate to the level necessary to minimize contamination, this strategy would rely on the existing collection of MSW and delivery of that waste to the County Transfer Stations where preprocessing systems would be located to extract the organic fraction of MSW. The OFMSW would then be directed to the centralized WWTP by way of a pump-able slurry to be delivered in a pump truck or equivalent.
C. SSO vs. mixed solid waste or other materials
This strategy assumes preprocessing will be needed to prepare an organic material suitable for insertion to the WWTP. Insomuch as the WWTP does not manage solid wastes, the WWTP is not well suited to conduct waste preprocessing at its site. The feedstock would need to arrive at the WWTP in a condition that is suitable for digestion without further processing. Consequently, pristine SSO, bioslurry type materials (from a CORe or similar technology) or the OFMSW produced from a squeeze type system would be an acceptable feedstock to be received at the WWTP.
D. Contaminant screening and removal, and impact of contaminants on AD
Contaminant screening and removal would need to occur off-site of the WWTP. These functions would need to occur upstream of the WWTP such that organic materials would be delivered to the WWTP in a pumper-type truck (similar to grease trap liquids). The presence of contamination in potential co-digestion feedstocks is problematic, as the operators do not currently have the capacity to remove contamination. The operators also expressed extant internal challenges associated with adding staff to operate such a facility.
E. Pretreatment and post-treatment of various feedstocks
As mentioned above, this strategy assumes pretreatment of feedstocks would occur off-site (presumably at the County Transfer Stations or privately owned preprocessing facilities) and not at the South WWTP. Regarding post-treatment, the WWTP is currently considering the acquisition of its biosolids composter (GroCo) which does the post-treatment of biosolids. While the South WWTP currently has a very robust biosolids management program (consisting primarily of land application of biosolids in eastern WA), given the aforementioned challenges with post-treatment of biosolids, the addition of a food waste in a co-digestion program could result in changes to biosolids quality

Anaerobic Digestion Feasibility Study
62 | October 2, 2017
and/or quantity which could result in additional costs or constraints for the biosolids management program.
F. Problems/risks associated with various feedstocks
It is understood that the County’s WWTPs are not currently equipped to manage highly variable feedstock in terms of its nitrogen, volatile solids, and other key indicator rates. Select streams of organics could be handled with limited to no processing, but in general, pretreatment of SSO would require significant capital and operational investment. Given the mixed waste feedstock materials received at the County’s facilities, the report includes the use of distributed squeeze systems or similar preprocessing systems for this strategy.
G. Optimal and acceptable feedstock combinations.
The optimal WWTP feedstock (beyond its current sludge feedstock) is FOG, and they have proceeded with preliminary design of the necessary facilities. The challenges noted were the maturity of the marketplace and the potential variability of the quantity and quality of FOG available as a feedstock. Beyond FOG, the WWTP could presumably consider other digestible feedstock sources but further research in terms of their effect on gas production, retention time, solids content, dewatering/biosolids management and related issues would be needed.
H. Management of residues
The majority of biosolids produced in the western Washington are currently land applied in central and eastern Washington. There is concern however that application rates may need to be reduced if imported organics increase the phosphorus content of the biosolids. Additionally, if effluent nitrogen removal were required by the state, the operators noted that the current footprint of the WWTP would effectively double in area, and the excess land available on site should be preserved.
I. Facility development possibilities
The WWTP’s primary focus is the management of sewage that is delivered to the plant through its conveyance network. The addition of new infrastructure and processes requires necessary investments in capital and operation, and so efficiencies from co-location may not be as robust as envisioned.
J. Facility operation compatibility with current infrastructure
Although in theory some economies of scale were anticipated, the WWTP infrastructure and staffing levels appear to be fully utilized such that, the addition of a food/FOG co-digestion program will require a new set of operator/maintenance staff that services the process. For the system to function correctly, maintenance, biogas upgrade/use and effluent treatment/discharge will be necessary. The current WWTP infrastructure is compatible to process select feedstocks, but specific considerations will be necessary for the majority of applications.

Anaerobic Digestion Feasibility Study
October 2, 2017 | 63
K. Potential facility ownership models
Any potential capital project at the District’s WWTPs would be owned and operated by King County.
L. Who is best suited to manage by-product processing and marketing
The Renton WWTP does not need additional energy in the form of heat. The Renton facility currently flares excess biogas when it cannot be beneficially utilized in the electrical or natural gas grids. The County’s Wastewater Treatment Division currently manages the biosolids from the Renton WWTP and is best-suited to manage potential by-products of a food waste digestion project. If a dedicated digestion/solids management program is employed, other by-product processors such as local composters could be considered.
M. Possible funding of facilities The development of WWTP dedicated or co-digestion projects would be funded by King County.
6.4 Strategy 4: Regional Anaerobic Digestion at County Transfer Stations from the Organic Fraction of Municipal Solid Waste This strategy assumes the use of a regional dedicated AD system using MSW preprocessing and possibly AD facilities at County Transfer Stations, digestate service agreement to privately owned composting facilities.
This strategy consists of the use of a series of regional dedicated digestion facilities being fed the OFMSW. This analysis assumes that the County transfer stations are the locations where organic rich waste could be preprocessed (presumably using a squeeze type device, although other systems such as optical sorting could also be considered). The OFMSW would be directed to digestion units that could be either co-located at each of the County Transfer Stations or elsewhere, depending on the unique circumstances of each site and of the tributary waste shed of each of the transfer stations. This strategy is based on the assumption that organic material generators are not likely to desire to participate in the generation of source separated feedstock and that organic materials will be sourced to the digestion facility after having been preprocessed elsewhere and only the OFMSW is delivered to the WWTP for digestion. This strategy would be a blanket type approach whereby the generator would not necessarily be aware of, or participate in the separation of organic materials. Gaseous by-products (primarily methane but also carbon dioxide, percaptions, etc.) will be converted to renewable energy in various forms, depending on the needs of each of the sites. Solids and liquid by-products could be managed using off-take agreements with composters
The key issues needed for this strategy to be viable include:
1. Development of an acceptable organic feedstock derived from organic processing facilities elsewhere (presumably the County Transfer Stations), and

Anaerobic Digestion Feasibility Study
64 | October 2, 2017
2. Development of appropriate dedicated digestion units capable of processing the feedstock derived by the County.
The riskiest aspect of this strategy is the financial impact on the County (both waste and dedicated digesters) due to unforeseen issues in developing the feedstock and the digestion/post digestion management of residues. Similar to strategy 3 above, an additional risk if this strategy is the possible decline of organic feedstock if the private sector also pursues organic diversion from source separated sources as described in strategies 1 and 2 above.
The following descriptions address the key topics as they relate to this strategy.
A. Current feedstock sources and compatibility with private facility technologies (preprocessing and composting technology)
This strategy assumes the deployment of organic preprocessing systems at each of the County Transfer Stations whereby organic rich wastes could be extracted from MSW and directed to regionally located digestion facilities. This strategy could be compatible with private composting facilities if the feedstock sought by the County were limited to the organics found in the MSW, and not to seek organic materials sourced by existing composters.
B. Collection method (curbside, commercial, other, or combination)
This strategy relies on the current waste collection methods and delivery of wastes to the County Transfer Stations where preprocessing systems would be located to extract the organic fraction of MSW. The OFMSW would then be directed to the digestion units if located on-site (at the transfer stations) or to regionally located dedicated digesters.
C. SSO vs. mixed solid waste or other materials
This strategy assumes organics are extracted from mixed wastes at the County Transfer Stations. Although SSO could be received for preprocessing, such materials would compete with the privately controlled organics (strategy 1 above) which would undermine the privately controlled organic streams. Also, this strategy is bases on the assumption that most of the organic materials in the County’s control would necessitate extensive preprocessing to remove the OFMSW. Consequently, the small quantity of SSO that may arrive at the County’s transfer station is assumed to be inconsequential to the overall waste quantity on an annual basis.
D. Contaminant screening and removal, and impact of contaminants on AD
This strategy assumes contaminant screening and removal would occur at the County Transfer Stations. Contaminant removal could occur by employing a squeeze-type device which extracts the liquid portion of waste under very high pressures (2000 psi), or the use of mechanical/optical sorting systems are under development in other portions of the US/Europe. The presence of contamination would have an effect on the selection of the dedicated digestion technology.

Anaerobic Digestion Feasibility Study
October 2, 2017 | 65
E. Pretreatment and post-treatment of various feedstocks
This strategy assumes pretreatment of feedstocks would occur at the County Transfer Stations. See item ‘D’ above for possible methods.
F. Problems/risks associated with various feedstocks
The problems/risks of various feedstock sources and their influence on the performance of the digestion technology would require further exploration. One of the benefits of this strategy is that different digestion technologies could be employed at different transfer stations, if needed. This provides some flexibility to explore dry fermentation in some locations where the feedstock is primarily stackable (e.g., yard trimmings from residential neighborhoods) compared to using a plug-flow digestion technology at locations where the feedstock is primarily pump-able (e.g., food waste from downtown restaurants).
G. Optimal and acceptable feedstock combinations. At this level of the analysis there is no optimal and acceptable feedstock combination identified. The flexibility of this system (see item ‘F’ above) allows this strategy to explore a wider variety of feedstock sources.
H. Management of residues
Residues from the distributed/dedicated digester units could be managed in a variety of ways. Individual concessions could be awarded to local composters to compost the digestate from the digestion units. Residues would be directed to the County’s CHRL from each of the Transfer Stations, making this attribute particularly efficient compared to other strategies.
I. Facility development possibilities
The use of each of the County Transfer Stations as a possible site to locate the preprocessing and possibly the digestion units would need to be studied on an individual basis.
J. Facility operation compatibility with current infrastructure
Digestion facility operation would need to be a contracted service or a new County staffed program. Further consideration of this issue would be needed to identify the preferred approach.
K. Potential facility ownership models
This strategy is based on the assumption the County would own the facilities located on County Transfer Stations sites. Depending on the each of the transfer station’s unique circumstances, off-site location of the dedicated digesters could imply that private ownership of the digestion facilities is a possibility.
L. Who is best suited to manage by-product processing and marketing
The upgrading and beneficial use of the biogas could be contracted to a private entity would could be ideally suited to manage its use (depending on tax benefits, etc.).

Anaerobic Digestion Feasibility Study
66 | October 2, 2017
Depending on the needs of the individual transfer stations, the need to wield power to on-site uses would require further study. Digestate/solids from the system could be managed by concession to local composters.
M. Possible funding of facilities
Although elements of the system could be privatized (e.g., biogas upgrade/conversion to energy), the most of the infrastructure in this strategy is assumed to be a public investment.
6.5 Strategy 5: Mandatory Diversion Program This strategy implementation of a set of policies, bans, and enforcement programs that require organics to no longer be placed in the waste. This strategy would be complimentary with the City of Seattle Municipal Code (sections 21.36.082 and 21.36.083) that require that residents and businesses do not put food scraps, compostable paper, yard trimmings, and recyclables in their garbage.
In the City of Seattle, all commercial establishments that generate food waste or compostable paper are required to subscribe to food and yard trimmings service, compost their food waste on site, or self-haul their food waste to a transfer station for processing. Similarly, residential customers are required to place food waste in the green bin for subsequent processing.
This strategy is potentially complementary with strategies 1 and 2 where privately owned digesters could be developed in response to the prohibition of placing organics in the garbage can. Such policies could generate larger quantities of food/organic materials from the region than the voluntary measures described in these two strategies. The policy may also produce feedstock with larger quantities of contamination that may need more robust preprocessing prior to digestion. Depending on how the policy/program is crafted, those who subscribe to participate in the program and produce higher quality feedstock (with minimal contamination) could benefit from an equivalent or similar acknowledgement that their system is AD compliant.
Similar to strategy 4, this strategy is also based on the assumption that organic material generators are not likely to voluntarily separate organic materials to prepare a suitable feedstock for AD. However, unlike strategy 4 where infrastructure is needed to extract the OFMSW, this strategy would mandate organics be placed in the appropriate bin for processing.
This strategy could also be complimentary with strategy 3 where organic materials will be sourced to the digestion facility after having been preprocessed elsewhere and only the OFMSW is delivered to the WWTP for digestion.
The most important feature of this strategy three fold: 1) implementation of a set of policies/bans that obligate waste generators to separate their organic materials which will in turn entice the development of competitive infrastructure to process the organics, 2) allowances in the program to recognize those that participate in private facilities as a subscription service as having met an equivalent to the mandatory program, and 3) development of publicly owned infrastructure to process organic materials from the region by those who do not subscribe to a privately operated program. Apart from the

Anaerobic Digestion Feasibility Study
October 2, 2017 | 67
technical risks of managing the collection, digestion and on-going operations aspects of this strategy, the riskiest aspect of this strategy is the financial impact on the County to develop the infrastructure if the private sector’s development of facilities accommodates the demand, leaving the County owned systems unsupported financially. This is somewhat similar to strategy 3 above where the possible decline of organic feedstock if the private sector also pursues organic diversion from source-separated sources as described in strategies 1 and 2 above.
The following descriptions address the key topics as they relate to this strategy.
A. Current feedstock sources and compatibility with private facility technologies (preprocessing and composting technology) This strategy assumes the deployment of both high quality source separated organic feedstock and also the need for organic preprocessing systems at each of the County Transfer Stations to manage the mandated organic materials feedstock. As such, this strategy would be compatible with private composting facilities if the feedstock sought by the County were limited to the organics found in the MSW, and not to seek organic materials sourced by existing composters.
B. Collection method (curbside, commercial, other, or combination)
This strategy would need to expand the current yard trimmings program to a mandatory program to assure compliance with the program. An allowance to opt-out of the county-run mandatory collection program for those to participate in private service agreements would be needed if compatibility with strategies 1 and 2 is desired.
C. SSO vs. mixed solid waste or other materials
This strategy assumes organics are separated at the source. However, based on HDR’s experience elsewhere, robust preprocessing systems are expected to be required to extract contaminants from the SSO, or conversely, to extract organic materials/slurry from the SSO. Similar to strategy 4, these preprocessing systems could be at the County Transfer Stations.
D. Contaminant screening and removal, and impact of contaminants on AD
This strategy assumes contaminant screening and removal would be necessary. Preprocessing could occur at the County Transfer Stations, but given the mandatory program quantities, could also be performed at private facilities. Similar to strategy 4, contaminant removal could occur by employing a squeeze-type device which extracts the liquid portion of waste under very high pressures (2000 psi), or the use of mechanical/optical sorting systems are under development in other portions of the US/Europe. The WM CORe technology would be one of the possible methods used to remove contaminants.
E. Pretreatment and post-treatment of various feedstocks
This strategy assumes pretreatment of feedstocks could occur at private or public facilities.

Anaerobic Digestion Feasibility Study
68 | October 2, 2017
F. Problems/risks associated with various feedstocks
The problems/risks of various feedstock sources from a mandatory program and its influence on the performance of the digestion technology would require further exploration. One of the benefits of this strategy is that the quantities of organics generated from this strategy would likely be much greater than the other strategies. The higher quantities of materials are more likely to foster improved economies of scale compared to the relatively small quantities of materials anticipated in strategies 1 and 2.
G. Optimal and acceptable feedstock combinations.
At this level of the analysis there is no optimal and acceptable feedstock combination identified. The flexibility of this system (see item ‘F’ above) allows this strategy to explore a wider variety of feedstock sources.
H. Management of residues Residues from the digestion processes could be managed in a variety of ways. Individual concessions could be awarded to local composters to compost the digestate from the digestion units. Residues would be directed to the County’s CHRL at each of the Transfer Stations, making this attribute particularly efficient compared to other strategies.
I. Facility development possibilities
Both preprocessing and digestion units could be developed privately or on public property (similar to strategy 4’s use of each of the County Transfer Stations). For example WM reports their CORe technology (preprocessing) could be deployed at any of their three properties in the region and that digestion could be performed at County owned sites or the Renton or Brightwater WWTP facilities.
J. Facility operation compatibility with current infrastructure
Digestion facility operation could be performed by private or public entities. Further consideration of this issue would be needed to identify the preferred approach.
K. Potential facility ownership models
This strategy is based on the assumption the County would enforce a mandatory diversion program that would allow both private or publicly owned facilities.
L. Who is best suited to manage by-product processing and marketing The upgrading and beneficial use of the biogas could be contracted to a private entity would could be ideally suited to manage its use (depending on tax benefits, etc.). Depending on the needs of the individual transfer stations, the need to wield power to on-site uses would require further study. Digestate/solids from the system could be managed by concession to local composters.

Anaerobic Digestion Feasibility Study
October 2, 2017 | 69
M. Possible funding of facilities
Although elements of the system could be privatized (e.g., biogas upgrade/conversion to energy), the most of the infrastructure in this strategy is assumed to be a public investment.
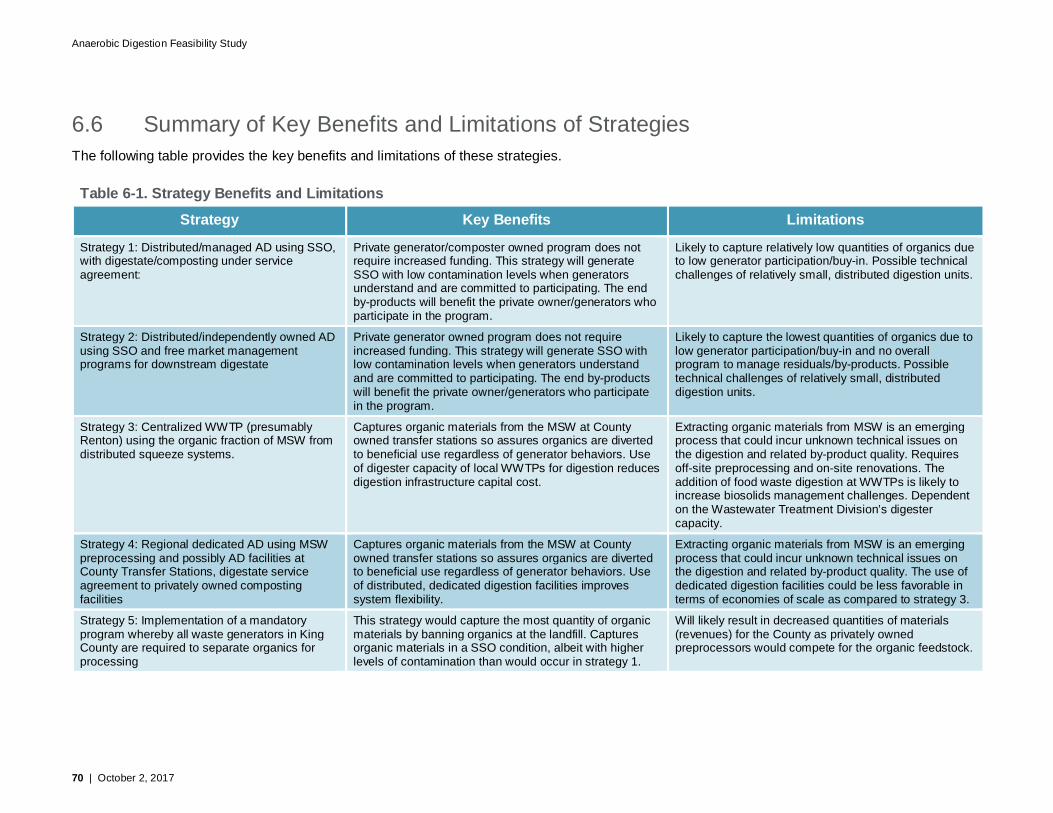
Anaerobic Digestion Feasibility Study
70 | October 2, 2017
6.6 Summary of Key Benefits and Limitations of Strategies The following table provides the key benefits and limitations of these strategies.
Table 6-1. Strategy Benefits and Limitations Strategy Key Benefits Limitations
Strategy 1: Distributed/managed AD using SSO, with digestate/composting under service agreement:
Private generator/composter owned program does not require increased funding. This strategy will generate SSO with low contamination levels when generators understand and are committed to participating. The end by-products will benefit the private owner/generators who participate in the program.
Likely to capture relatively low quantities of organics due to low generator participation/buy-in. Possible technical challenges of relatively small, distributed digestion units.
Strategy 2: Distributed/independently owned AD using SSO and free market management programs for downstream digestate
Private generator owned program does not require increased funding. This strategy will generate SSO with low contamination levels when generators understand and are committed to participating. The end by-products will benefit the private owner/generators who participate in the program.
Likely to capture the lowest quantities of organics due to low generator participation/buy-in and no overall program to manage residuals/by-products. Possible technical challenges of relatively small, distributed digestion units.
Strategy 3: Centralized WWTP (presumably Renton) using the organic fraction of MSW from distributed squeeze systems.
Captures organic materials from the MSW at County owned transfer stations so assures organics are diverted to beneficial use regardless of generator behaviors. Use of digester capacity of local WWTPs for digestion reduces digestion infrastructure capital cost.
Extracting organic materials from MSW is an emerging process that could incur unknown technical issues on the digestion and related by-product quality. Requires off-site preprocessing and on-site renovations. The addition of food waste digestion at WWTPs is likely to increase biosolids management challenges. Dependent on the Wastewater Treatment Division’s digester capacity.
Strategy 4: Regional dedicated AD using MSW preprocessing and possibly AD facilities at County Transfer Stations, digestate service agreement to privately owned composting facilities
Captures organic materials from the MSW at County owned transfer stations so assures organics are diverted to beneficial use regardless of generator behaviors. Use of distributed, dedicated digestion facilities improves system flexibility.
Extracting organic materials from MSW is an emerging process that could incur unknown technical issues on the digestion and related by-product quality. The use of dedicated digestion facilities could be less favorable in terms of economies of scale as compared to strategy 3.
Strategy 5: Implementation of a mandatory program whereby all waste generators in King County are required to separate organics for processing
This strategy would capture the most quantity of organic materials by banning organics at the landfill. Captures organic materials in a SSO condition, albeit with higher levels of contamination than would occur in strategy 1.
Will likely result in decreased quantities of materials (revenues) for the County as privately owned preprocessors would compete for the organic feedstock.

Anaerobic Digestion Feasibility Study
October 2, 2017 | 71
7 Economic Analysis 7.1 Identification of Three Scenarios for Economic and
GHG Analysis Following submittal of the five strategies described in Section 6 above, the County selected three scenarios for further economic and environmental analysis.
The three selected scenarios included:
Scenario 1. Small Distributed System: Small highly distributed AD systems, each representing approximately 1,000 tons per year of SSO, privately owned and operated. (Similar to strategy 2 above).
Scenario 2. AD at the South WWTP. The use of digester capacity at the South WWTP in Renton (South Plant), to digest previously prepared organic slurry derived from mixed, wet MSW. The preprocessing could take place at the Bow Lake Transfer Station, that would be equipped with a preprocessing/press system to squeeze high moisture content wastes rich in food waste. The press would produce a cake-like material from the MSW which would be further processed to create a slurry of organic material that would be hauled by a pump truck to the South Plant for receipt and digestion. (Essentially strategy 3 above).
Scenario 3. Dedicated AD at the County Transfer Stations. This scenario assumes that a dedicated high solids AD system will be developed at one of four possible transfer stations (Bow Lake, Houghton, Factoria, or Algona). The system would use the same preprocessing/press system as described in Scenario 2, but the organic slurry produced would be digested at the same location, using a high solids digestion process with a smaller volume than the traditional WWTP. All would require approximate average hauling distances of 20 miles from generators to the transfer station. Two sizes of processing systems were modeled based on the transfer station options.
A. 16,800 tons per year of food waste equivalent (derived as an organic fraction of MSW from 60,000 tons of MSW per year) could be processed from either the Factoria, Houghton or Algona transfer stations.
B. 36,000 tons per year of food waste equivalent (derived as an organic fraction of MSW from 120,000 tons of MSW per year) could be processed from the Bow Lake Transfer Station.
This study focuses on the economic and environmental differences of the scenarios, including their respective cost and relative GHG footprint. The costs for this analysis have been prepared using a series of reference projects scaled up or down for relevance to the County conditions. The digestion of food waste in the US is an emerging field, so the number of reference facilities is limited. In addition, HDR has reached out to several technology providers, requesting their input regarding performance metrics and approximate costs. In order to secure their input regarding costs, yet protect their proprietary information, HDR has entered into Non-disclosure Agreements (NDA) with each of the firms and therefore cannot release information that they deem as confidential. However, the combination of HDR’s industry experience and input from

Anaerobic Digestion Feasibility Study
72 | October 2, 2017
others has been used to develop a set of cost estimates for each scenario, which include estimates for:
· Preliminary operations (preprocessing/contaminant removal) cost of the facility on a dollars per ton basis;
· An order of magnitude capital cost of the facility on a dollars per ton basis ;
· The cost of transportation or transfer of the material on a dollars per ton basis; and
· Revenues from biogas and other by-products on a dollars per ton basis.
These values are presented below for each of the scenarios. The relative costs for each scenario can be used to compare to avoided costs of the current landfilling system on a dollars-per-ton basis.
In addition to the economics of these scenarios, the GHG impacts have been estimated for each of the three strategies selected, for comparison with the GHG impacts of the current practice of landfilling or composting the material.
7.2 Scenario 1 – Small Distributed AD System This scenario represents the use of small AD systems distributed throughout the region, each representing approximately 1,000 tons per year, privately owned and operated. As noted in the Potential Partnerships analysis (submitted previously under separate cover), this scenario relies on the waste generator to separate their food wastes in such a manner that contamination is as little as possible, thereby allowing each of the digestion units to function as a digester and not a mixed waste processing system. Other key aspects of this scenario include the expectation that digester by-products, such as heat or electricity are desired at each of the AD unit locations. The riskiest aspect of this scenario is that dozens of distributed/small digestion units will likely require significant servicing to keep them operational and prevent them from becoming public nuisances due to odor issues, as normal fluctuations in the process occur.
In terms of economic risks, each of the digestion units will need to be financially self-sufficient. The cost of these systems has been estimated using input from Impact Bioenergy, BioFerm and Eisenmann. Each of these firms offers small-scale digestion units that could be sourced to function as envisioned in this scenario.
The economics of this scenario are illustrated in Table 7-1.

Anaerobic Digestion Feasibility Study
October 2, 2017 | 73
Table 7-1. Scenario 1: Summary of Costs for Small Distributed Digester Unit
Description Capital Cost
Annual cost
Cost per ton of SSO
Cost per ton of food waste
Preprocessing equipment at each unit $500,000 $64,752 $77 $65
Overs and Rejects taken to the landfill $3,465 $3 $3
Site and Building Improvements at each site $211,751 $15,581 $15 $16
Digester and biogas upgrade equipment $800,000 $149,364 $142 $149
Digestate and Effluent Management $60,000 $92,782 $93 $93
Biogas cleanup and conversion included in Digester cost above $0
Biogas revenues -$27,442 -$26 -$27
Total $1,571,751 $298,502 $304 $299
7.3 Scenario 2 – AD at the South WWTP This scenario includes the use of the South Plant in Renton to digest an organic slurry feedstock derived from an organic slurry prepared from mixed wet MSW at the Bow Lake Transfer Station. The transfer station would be equipped with a preprocessing/press system to squeeze high moisture content wastes rich in food waste. The press would create a cake like material from the MSW, which would be processed to develop a slurry of organic material that would be hauled by pump truck to the South Plant for receipt and digestion.
This scenario is based on the assumption that organic material generators are not as likely to participate in the generation of source-separated feedstock. The organic materials will be sourced to the digestion facility after having been preprocessed elsewhere and only an organic slurry of food waste is delivered to the WWTP for digestion. An important feature of this scenario is the development of an acceptable organic feedstock derived from organic processing facilities that are not located on the South Plant site. However, once delivered to the South Plant, the scenario relies on the existing WWTP operations to receive/process the organic slurry using surplus digester capacity at the existing WWTP.
This scenario generally follows the approach the East Bay Municipal Utility District (EBMUD). They are also attempting to employ the use of surplus digester capacity as a dedicated digester for food waste in Oakland, California.
Based on a 2006 Food Waste Digestion Study prepared for King County, the South Plant is capable of digesting 8,300 tons per year of food waste equivalent material that HDR has modeled at a solids content of 30 percent. In order to derive this quantity of food waste equivalent material and relying on the manufacturer’s assertions of performance metrics, an estimated 42,300 tons of wet MSW would be received and preprocessed/pressed at the Bow Lake Transfer Station. The 8,300 tons of food waste

Anaerobic Digestion Feasibility Study
74 | October 2, 2017
would be diluted to 15 percent solids for further processing to remove fine contaminants and to produce a pump-able slurry for delivery to the South Plant.
The cost estimate portrays the cost per ton of two sources as follows:
· Cost per ton of MSW to the wet line. This cost represents the total system cost divided by the quantity of MSW that is initially received at the County’s transfer station prior to preprocessing. This value reflects the cost of the AD system in addition to the current cost of MSW transfer and disposal costs. The current transfer and disposal cost of the non-organic MSW fraction is not included in this value. To clarify, the additional cost of transferring and disposing of the residue MSW would be approximately $110 per ton and would be in addition to this cost of the AD system.
· Cost per ton of Food Waste. This cost represents the total system cost divided by the quantity of material that equates to food waste that is processed through the digestion unit. For comparative purposes, an organic cake-like material consisting of 30 percent solids was modeled as the equivalent of food waste. This value is useful for comparing the AD system cost to the cost of Scenario 1, where SSO is envisioned to be processed. SSO is expected to contain minimal contaminants and therefore require a much less robust preprocessing equipment line to prepare the feedstock for digestion. However, the County’s transfer stations are not anticipating receiving SSO materials. Also, since the denominator of this calculation excludes the management of overs and residuals, the cost per ton is comparable to Scenario 1 above on a Cost per ton of Food Waste basis.
The economics of Scenario 2 are illustrated in Table 7-2.
Table 7-2. Scenario 2: Co-Digestion at South WWTP after Bow Lake Transfer Station
Description Capital Cost
Annual cost
Cost per ton of
MSW to wet line
Cost per ton of Food Waste
Preprocessing equipment at Bow Lake $6,700,000 $869,000 $29 $105
Site and Building Improvements at Bow Lake $3,328,000 $155,000 $5 $19
Transfer of slurry to South Plant $135,000 $5 $16 South Plant processing (inclusive of solids management)a $5,140,000 $1,517,000 $46 $164 Biogas cleanup and conversion (using existing infrastructure)b $27,000 $1 $3
Biogas revenues -$122,000 -$3 -$15
Total $13,949,000 $2,427,000 $82 $292 a WWTP processing includes grit and floatables removal in addition to residual solids management b Note that existing biogas cleaning infrastructure is being replaced in 2019 due to stricter biomethane quality standards and, as a result, biogas scrubbing costs are anticipated to increase.
Alternatively, if the collected feedstock can be as free of contamination as the materials described in the Central Marin F2E program in Section 3.3.1, the use of the WWTP could be substantially less costly. A pilot program using the County’s existing WWTP could be developed to receive voluntary SSO and FOG. HDR contacted Central Marin and Marin

Anaerobic Digestion Feasibility Study
October 2, 2017 | 75
Sanitary Service to capture the information below.30 The table below illustrates the cost of the combined Marin Sanitary Service and Central Marin WWTP Commercial F2E program. These costs reflect the capital improvements at Marin Sanitary Service to install the food waste receiving and preprocessing system, and the capital improvements at Central Marin WWTP to install the food waste slurry and FOG receiving facility and biogas upgrading system. The annual operating budget illustrates the cost to implement a customer screening and education program that results in the very low contamination, high quality of feedstock, which makes this program viable. Central Marin charges a tip fee of $22 per ton to cover their operating costs.
Central Marin reports there was no increase in biosolids for the first 2 years of operation, and only a slight increase in the third year. At this time, Central Marin reports no measurable increase in the cost of managing biosolids from the added food and FOG materials. Central Marin had been purchasing natural gas for its digester heating needs. The increased quantity of biogas from the food waste and FOG program has allowed Central Marin to reduce the purchase of natural gas significantly. Therefore, Central Marin reports there has been no increase in the cost or revenues from biogas at this time.
The costs in Table 7-3 reflect the existing facility currently operating at 2,300 tons per year of food waste and FOG processed at the facility, but increased to its design capacity of 4,600 tons per year.
Table 7-3. Voluntary Source Separated Organics and Co-Digestion at WWTP Similar to Central Marin F2E Program
Description Capital Cost
Annual Amortized
Capital Cost
Annual Operating
Cost
Cost per Ton of SSO
Preprocessing equipment to grind & produce a slurry from SSO $530,000a $69,000 $130,500b $43
WWTP co-digestion improvements $1,900,000b $246,059 $102,920d $76
Total $2,430,000 $315,059 $233,460 $119 a Preprocessing capital costs based on Marin Sanitary Service capital cost for preprocessing equipment. b Preprocessing annual cost excludes collection. c WWTP digester improvement costs based on Central Marin food waste and FOG receiving station and biogas upgrade costs, which are capable of processing 4,600 tons per year. d Central Marin charges $22 per ton to cover its operating cost.
7.4 Scenario 3 – Dedicated Anaerobic Digestion at County Transfer Stations The development of a dedicated high solids AD system at County transfer stations that would use the same preprocessing, press system as described in Scenario 2 but would digest the organic slurry using a higher solids-smaller tankage digestion process than the traditional WWTP process at the South Plant.
30 Conversations with Jason Dow of Central Marin and Kim Scheibly of Marin Sanitary Service

Anaerobic Digestion Feasibility Study
76 | October 2, 2017
This scenario assumes the use of several regional, dedicated digestion facilities being fed the OFMSW derived from preprocessing, press type facilities installed at the County’s waste transfer facilities. Based on the 2015 Waste Composition Study, the County transfer stations are the location where organic rich waste could be preprocessed (presumably using a squeeze type device, although other systems such as optical sorting could also be considered). The OFMSW would be directed to digestion units co-located at the Bow Lake Transfer Station and possibly one other of the County’s transfer stations, depending on the unique circumstances of each site and of the quantity and quality of the waste delivered to the other transfer stations. Like Scenario 2, this scenario is also based on the assumption that organic material generators are not as likely to participate in the generation of source separated feedstock and that organic materials will be squeezed from the organic fraction of the municipal waste prior to being fed to the dedicated AD at the transfer station. Gaseous by-products (primarily methane but also carbon dioxide, and other potentially odorous emissions) will be converted to renewable energy in various forms, depending on the needs of each of the sites. Solids and liquid by-products could be managed using off-take agreements with composters.
One of the key features of this scenario is the development of an acceptable organic feedstock derived from a preprocessing/press system by processing relatively organic-rich loads of wet MSW. A risk of this scenario is the financial impact on the County (due to unforeseen issues in developing the feedstock and the digestion/post digestion management of residues. Similar to scenario 2 above, an additional risk of this scenario is the possible decline of organic feedstock if the private sector also pursues organic diversion from source separated sources. This could result in a decrease in organic-rich MSW at the County’s transfer stations.
This cost estimate also portrays the cost per ton of two sources as follows:
· Cost per ton of MSW to the wet line. Similar to Scenario 2 above, this cost represents the additional AD system cost divided by the quantity of MSW that is initially received at the County’s transfer station prior to preprocessing but does not include residual waste transfer and disposal, which are already a cost of the current MSW transfer and disposal system. Again, if the cost for disposal of overs and rejects were excluded from this category, the resulting cost per ton of MSW would be approximately $55 per ton for the residuals requiring disposal.
· Cost per ton of Food Waste. Similar to Scenario 2 above, this cost represents the total system cost divided by the quantity of material that equates to food waste that is processed through the digestion unit, using the same cake-like material composition of 30 percent solids as the equivalent of food waste. Again, this value is useful for comparing the AD system cost to the cost of Scenario 1 where SSO are envisioned being processed.
The economics of Scenario 3 are illustrated on Table 7-3.

Anaerobic Digestion Feasibility Study
October 2, 2017 | 77
Table 7-3. Scenario 3A: Mid-sized MSW System (60,000 tons per year) at Transfer Station
Description Capital Cost
Annual cost
Cost per ton of MSW to
wet line
Cost per ton of food
waste Preprocessing equipment at each other transfer station $6,700,000 $1,143,000 $19 $68
Site and Building Improvements at each transfer station $5,550,000 $408,000 $7 $24
Dedicated Digester $6,572,000 $1,245,000 $21 $74 Dewatering and solids management cost $1,000,000 $1,140,000 $19 $68
Effluent Management $201000 $3 $18
Biogas cleanup and conversion $2,600,000 $303,000 $5 $18
Biogas revenues -$216,000 -$4 -$18
Total $22,422,000 $4,131,000 $69 $246
As an added option of this scenario, the cost of a larger digestion unit at the Bow Lake transfer station was also explored. The use of a larger preprocessing/press system and larger tanks revealed the following economics as illustrated on Table 7-4.
Table 7-4. Scenario 3B: Large Volume MSW System at Bow Lake Transfer Station
Description Capital Cost
Annual cost
Cost per ton of
MSW to wet line
Cost per ton of food
waste Preprocessing equipment at Bow Lake (OREX 1000) $9,800,000 $1,961,000 $16 $58
Site and Building Improvements at Bow Lake $8,538,000 $628,000 $5 $19
Dedicated Digester $10,374,000 $1,965,000 $16 $58 Dewatering and solids management cost $1,515,717 $2,235,000 $19 $67
Effluent Management $401,000 $3 $12
Biogas cleanup and conversion $3,941,000 $397,000 $3 $12
Biogas revenues -$617,000 -$5 -$18
Total $34,169,247 $6,970,000 $58 $207

Anaerobic Digestion Feasibility Study
78 | October 2, 2017
Summarizing the costs of each scenario and presenting them for comparative purposes, HDR estimates the costs as follows:
Table 7-5. Overview of Cost per Scenario
Scenario Description Cost per ton of MSW less cost
of rejects to landfill
Cost per ton of Food
Waste
1 Distributed Small Digestion Units
$299
2 South Plant WWTP $90 $322
2B Example Central Marin WWTP $119
3A Mid-sized Dedicated Digester $65 $232
3B Large Dedicated Digester $57 $204
Anaerobic Digestion Feasibility Study
October 2, 2017 | 79
8 Greenhouse Gas Analysis A GHG emissions model was prepared comparing status quo operations of disposing of food waste (landfilling) to anaerobically digesting the food waste in each of three Scenarios. The U.S. EPA Waste Reduction Model (WARM), Version 14, was used to evaluate GHG emissions from landfill operations versus AD operations. There are limitations to the model and to the assumptions made for each scenario; therefore, results should be seen as illustrative of overall GHG reduction potential. One such limitation is that the model does not offer different types of AD technology options beyond the classification of wet and dry systems. In addition, WARM is only able to model AD systems that convert the resulting biogas to electricity and heat. No other options for beneficial use of biogas, such as compressed natural gas (CNG) fuel, are available in WARM at this time.
8.1 WARM The Waste Reduction Model (WARM) was created by the U.S. EPA as a tool to help managers and policy makers understand and compare the emissions and offsets resulting from different materials management options (e.g., landfill disposal, composting, etc.) for materials commonly found in the waste stream. Only anthropogenic emissions are considered as GHG emissions in WARM. Biogenic emissions are considered to be carbon that was originally removed from the atmosphere through natural processes, like photosynthesis, and would eventually return to the atmosphere through a natural degradation process. Anthropogenic emissions result from human activities and are subject to human control, which are considered disruptive to the naturally occurring carbon cycles and balance.
Although the GHG emissions results of WARM are presented as occurring in a discrete year, the results actually indicate the full life-cycle benefits of each waste management alternative, which may accrue over the long-term. The emissions shown for each scenario in WARM represent the estimate for net GHG emission, which include gross manufacturing and production emissions, any increases in carbon stocks, and any avoided utility emissions. No scenario results in zero emissions, as there are emissions associated with manufacturing or producing the materials modeled and then processing them for reuse, conversion, or disposal.
8.2 WARM General Assumptions Material Hauling
WARM allows input of the distances from the curb to the landfill, combustor, material recovery facility, composting facility, and anaerobic digester. For the WARM inputs for the King County AD Study model, the location of the “curb” is assumed to be where the waste is generated. These generators are distributed throughout the County. Consequently, the scenarios that require transporting waste from the generators to the CHRL or a transfer station assume an average distance for all hauling trips.
Anaerobic Digestion Feasibility Study
80 | October 2, 2017
One of the limitations of WARM is that it does not allow users to vary hauling distances for the digestate produced from AD facilities. For the purposes of this evaluation, the digestate hauling distances are assumed to be approximately equal for all of the AD scenarios, so that the emissions from this step in the materials management process are not a differentiating factor.
Landfill
CHRL is located in an area receiving approximately 57 inches of rain per year. For the purposes of modeling landfill gas generation, the “wet” designation in WARM (receiving greater than 40 inches of precipitation annually) was chosen for the modeling. Since landfill disposal creates an anaerobic environment that generates methane (CH4) that would not have been generated without human intervention, WARM counts this as anthropogenic GHG emissions. CHRL recovers landfill gas for energy and King County’s engineers estimate a 98 percent landfill gas recovery rate. The WARM analysis assumes that the landfill has a landfill gas recovery system with typical operating efficiency (using collection in Years 0-1: 0 percent; Years 2-4: 50 percent; Years 5-14: 75 percent; Years 15 to 1 year before final cover: 82.5 percent; Final cover: 90 percent). Carbon dioxide (CO2) in the landfill gas, as well as that produced by combusting landfill gas in the flare, is not counted, as it is considered biogenic. WARM also assumes a level of biogenic carbon storage, as well as emissions produced by landfill operating equipment. The inclusion of biogenic carbon storage in landfills differentiates WARM from most other life cycle emissions accounting models that estimate biogenic carbon storage separately and do not include it as an emissions credit. WARM assumes that for every wet ton of food waste buried in the landfill, 0.07 metric tons of CO2 equivalents (MTCO2e) will stay sequestered as carbon in the landfill.
Anaerobic Digestion
WARM offers GHG modeling for both a continuous single-stage, wet, mesophilic digester and a single-stage, dry, mesophilic digester. After conducting a literature review and discussions with stakeholders, the EPA found little evidence that methane yields differed significantly for different AD reactor configurations within these two classifications. Dry AD is more appropriate for feedstocks that contain a blend of yard trimmings and food waste. There are two options available for the handling of digestate from the AD system: applying the dewatered digestate directly to agricultural land, or further curing the dewatered digestate before land application. All of the King County AD scenarios in the GHG model assume the use of wet AD and that the digestate is dewatered and land applied.
All AD systems are assumed to use the biogas produced by AD for electricity generation and to heat the digester. The EPA has identified other uses for biogas, but WARM does not currently offer multiple options for modeling the beneficial use of biogas generated from either type of AD system. Wet AD systems require electricity for preprocessing (grinding, screening and mixing) the feedstock, pumping and mixing within the AD system, and dewatering the digestate. Electricity that is generated beyond what is required to operate the AD facility is sold to the regional electricity grid, where it is assumed to offset electricity generation in the power sector. Electricity generation efficiency, operation time, and emission offsets are based on the same assumptions that

Anaerobic Digestion Feasibility Study
October 2, 2017 | 81
WARM uses for landfill gas to energy systems. Although the WARM results are based on using biogas to produce renewable electricity, they can still be considered indicative of the GHG benefits that would be gained from using the biogas to produce CNG or pipeline quality biomethane. All uses of biogas reflect biogas upgrading and conditioning, and eventual conversion to energy using an internal combustion engine, although the biogas upgrade requirements are more stringent for conversion to CNG and pipeline injection (requiring more energy for biogas cleanup). However, the GHG emissions from these differences is likely minimal. In all cases, use of the biomethane would offset the use other fuels produced from fossil fuels, resulting in GHG emissions reductions.
The AD process has anthropogenic emissions produced through preprocessing and digester operations, collection and combustion of biogas, and fugitive CH4 and N2O emissions generated during digestate decomposition. CO2 generated from decomposition after digestate is added to soil is considered biogenic. GHG credits are generated through nitrogen and phosphorous fertilizer offsets, net electricity offsets, and anthropogenic carbon storage, or carbon sink, from the application of digestate to agricultural soils.
Feedstock
The only feedstock considered in this WARM analysis, for all scenarios, is food waste. WARM allows the input of food waste in the following categories:
1. Food Waste (non-meat) 2. Food Waste (meat only) 3. Individual Materials
· Beef · Poultry · Grains · Bread · Fruits and Vegetables · Dairy Products
4. Food Waste
Because detailed information is not available at this time, all materials were input to WARM in the Food Waste category. WARM assumes that the Food Waste is comprised of the individual food waste materials in proportions that match those found in the U.S. Department of Agriculture (USDA) Economic Research Service (ERS) Food Availability (per Capita) Data System (2010). There is currently no differentiation in WARM between the composition of residential and commercial food waste. For modeling purposes, the organic fraction of MSW derived through a preprocessing/press type of system is assumed to be equivalent to food waste feedstock.
8.3 GHG Scenarios Each of the GHG scenarios is based on a different materials management option. GHG emissions were modeled for each of the scenarios as follows:
Baseline Scenario: Landfill. The Baseline for all Scenarios is landfilling the food waste. This assumes that waste is transported 40 miles on average to the CHRL.
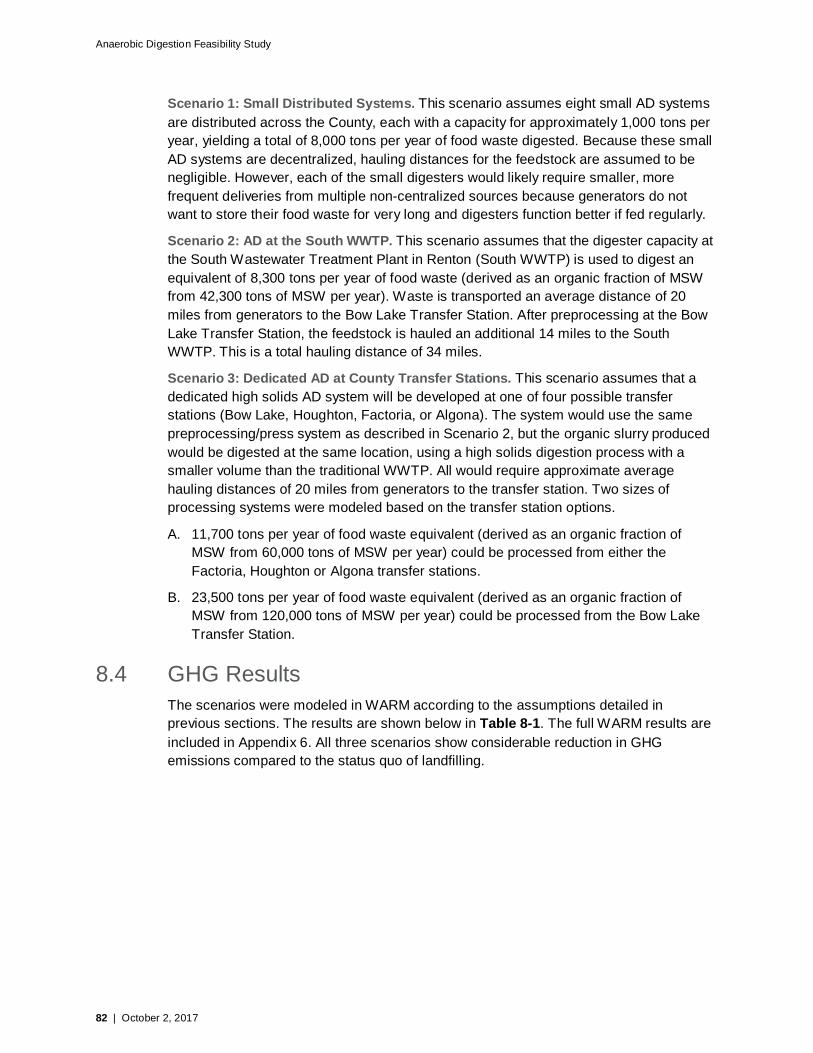
Anaerobic Digestion Feasibility Study
82 | October 2, 2017
Scenario 1: Small Distributed Systems. This scenario assumes eight small AD systems are distributed across the County, each with a capacity for approximately 1,000 tons per year, yielding a total of 8,000 tons per year of food waste digested. Because these small AD systems are decentralized, hauling distances for the feedstock are assumed to be negligible. However, each of the small digesters would likely require smaller, more frequent deliveries from multiple non-centralized sources because generators do not want to store their food waste for very long and digesters function better if fed regularly.
Scenario 2: AD at the South WWTP. This scenario assumes that the digester capacity at the South Wastewater Treatment Plant in Renton (South WWTP) is used to digest an equivalent of 8,300 tons per year of food waste (derived as an organic fraction of MSW from 42,300 tons of MSW per year). Waste is transported an average distance of 20 miles from generators to the Bow Lake Transfer Station. After preprocessing at the Bow Lake Transfer Station, the feedstock is hauled an additional 14 miles to the South WWTP. This is a total hauling distance of 34 miles.
Scenario 3: Dedicated AD at County Transfer Stations. This scenario assumes that a dedicated high solids AD system will be developed at one of four possible transfer stations (Bow Lake, Houghton, Factoria, or Algona). The system would use the same preprocessing/press system as described in Scenario 2, but the organic slurry produced would be digested at the same location, using a high solids digestion process with a smaller volume than the traditional WWTP. All would require approximate average hauling distances of 20 miles from generators to the transfer station. Two sizes of processing systems were modeled based on the transfer station options.
A. 11,700 tons per year of food waste equivalent (derived as an organic fraction of MSW from 60,000 tons of MSW per year) could be processed from either the Factoria, Houghton or Algona transfer stations.
B. 23,500 tons per year of food waste equivalent (derived as an organic fraction of MSW from 120,000 tons of MSW per year) could be processed from the Bow Lake Transfer Station.
8.4 GHG Results The scenarios were modeled in WARM according to the assumptions detailed in previous sections. The results are shown below in Table 8-1. The full WARM results are included in Appendix 6. All three scenarios show considerable reduction in GHG emissions compared to the status quo of landfilling.

Anaerobic Digestion Feasibility Study
October 2, 2017 | 83
Table 8-1. WARM Results
Scenario Materials
Management Option
Feedstock Quantity
Processed (tons per year)
Total GHG Emissions (MTCO2E)
GHG Emissions per Ton
Feedstock (MTCO2E)
Scenario 1 Status Quo Landfill 8,000 3,479 0.43
Scenario 1 AD Wet AD 8,000 -860 -0.11
Scenario 2 Status Quo Landfill 8,300 3,610 0.43
Scenario 2 AD Wet AD 8,300 -846 -0.10
Scenario 3A Status Quo Landfill 11,700 5,089 0.43
Scenario 3A AD Wet AD 11,700 -1,219 -0.10
Scenario 3B Status Quo Landfill 23,500 10,221 0.43
Scenario 3B AD Wet AD 23,500 -2,448 -0.10
Note: Negative values denote net GHG emission reductions or carbon storage from a materials management practice.

Anaerobic Digestion Feasibility Study
84 | October 2, 2017
Appendix 1 – Renton Waste Water Treatment Plant The following responses were provided by the Renton WWTP.
A. Current feedstock sources and compatibility with private facility technologies (preprocessing and composting technology) The Renton WWTP currently receives only wastewater and a limited amount of food processing waste (from food manufacturing). Renton staff report the WWTP cannot currently commit to dedicating digester capacity to accept additional organic materials because they are reserving capacity to provide system redundancy in case a digester goes down for maintenance. However, for the purposes of this study, it is presumed that the County is open to the idea of exploring options to add food waste at its WWTPs. The District previously conducted a study to assess the feasibility of adding a FOG receiving/handling facility at one or more of its WWTPs. The decision was made to not pursue this option at this time.
B. Collection method (curbside, commercial, other, or combination)
The Renton WWTP does not currently have the capability to receive unprocessed SSO or MSW. Collection and pretreatment of SSO or OFMSW would need to be performed by others (the County or private entities) at locations other than the WWTP. Following preprocessing, the liquid fraction of the SSO or OFMSW could be transported to the WWTP in liquid pumper trucks or by conveyance using the sanitary sewer system (assuming capacity and discharge permit levels are met). If transmitted by pumper truck, the WWTP facility would likely require renovation to perform the functions of receiving, storage, and metering/in-feed rates into the WWTP digesters. Renton has explored the possibility of receiving FOG. Renton anticipates the potential future FOG facility would require haulers to deliver FOG to the WWTP.
C. SSO vs. mixed solid waste or other materials
The Renton WWTP could develop a co-digestion system for either SSO or OFMSW if processed through one of the technologies available for the extraction of organics from mixed solid waste.
D. Contaminant screening and removal, and impact of contaminants on AD The presence of contamination in potential co-digestion feedstocks is problematic, as the operators do not currently have the capacity to remove contamination. The operators also expressed extant internal challenges associated with adding staff to operate such a facility.
E. Pretreatment and post-treatment of various feedstocks
Pretreatment of co-digestion feedstocks at Renton would be challenged by the same staffing concerns previously expressed. The plant is currently considering the acquisition

Anaerobic Digestion Feasibility Study
October 2, 2017 | 85
of its biosolids composter (GroCo) which does the post-treatment of biosolids. While the Renton WWTP currently has a very robust biosolids management program, given the aforementioned challenges with post-treatment of co-digestion biosolids, the addition of a food waste digestate would be challenging.
F. Problems/risks associated with various feedstocks
The Renton WWTP is not currently equipped to manage a wide variety of feedstocks. Select streams of organics could be handled with limited to no processing, but in general, pretreatment of SSO would require significant capital and operational investment.
G. Optimal and acceptable feedstock combinations.
The optimal feedstock to add to the Renton WWTP is FOG, and they have completed a study of the needed pretreatment facilities. The challenges noted concern the maturity of the marketplace and the general scarcity of FOG available as a feedstock.
H. Management of residues
The majority of biosolids produced in western Washington are currently land applied in eastern Washington. There is concern however that application rates may need to be reduced if imported organics increase the phosphorus content of the biosolids. Additionally, if nitrogen removal is required by the state, the operators noted that the current footprint of the WWTP would effectively need to be doubled in area. Therefore, the excess land currently available on site needs to be reserved. Management of an additional waste stream to the system would be subjected to the same challenges and risks the plant is facing today.
I. Facility development possibilities
The WWTP’s primary focus is the management of sewage that is delivered to the plant through its conveyance network. The addition of new infrastructure and processes requires necessary investments in capital and operation, and so efficiencies from co-location may not be a robust option.
J. Facility operation compatibility with current infrastructure
Although in theory some economies of scale are anticipated, the WWTP infrastructure and staffing levels appear to be fully utilized such that any addition of a food waste/FOG co-digestion program will require a new set of operator/maintenance staff for the new process. For the system to function correctly, maintenance, biogas upgrade/use and effluent treatment/discharge will be necessary. The current WWTP infrastructure is compatible to process select feedstocks, but specific considerations for upgrades and expansions will be necessary for the majority of applications.
K. Potential facility ownership models
Any potential capital project at the Renton WWTP would be owned and operated by King County.

Anaerobic Digestion Feasibility Study
86 | October 2, 2017
L. Who is best suited to manage by-product processing and marketing
The County’s Wastewater Treatment Division currently manages the biosolids from the Renton WWTP and is best suited to manage potential by-products of a food waste or OFMSW digestion project. If a dedicated digestion/solids management program is employed, other by-product processors such as local composters could be considered.
M. Possible funding of facilities
The development of a Renton WWTP co-digestion project would be funded by King County.
Anaerobic Digestion Feasibility Study
October 2, 2017 | 87
Appendix 2 – Cedar Grove The following responses were provided by Steve Banchero of Cedar Grove Compost (CG) and Jerry Bartlett who had previously worked representing CG when CG sought to develop its own AD project.
A. Current feedstock sources and compatibility with private facility technologies (preprocessing and composting technology)
CG currently manages a wide variety of feedstock sources including residential co-collected yard and food waste, commercial organics, wood waste and a variety of industrial organic materials. As a consequence, CG has invested in the equipment and resources to provide preprocessing for these diverse feedstocks.
B. Collection method (curbside, commercial, other, or combination) CG uses a variety of collection methods, including receiving City-collected residential co-collected yard/food waste, receiving commercial organics from collection services provided by others, and commercial/institutional organics bin collection services provided by CG.
C. SSO vs. mixed solid waste or other materials.
CG reports they prefer to receive SSO with the lowest contamination possible. However, they also report that they receive materials from some sources (such as special events, some commercial generators, etc.) that could be categorized as having been sourced from mixed waste.
D. Contaminant screening and removal, and impact of contaminants on AD
The presence of contamination and the necessity to remove it has become a significant issue for CG. As noted above, CG has invested in preprocessing systems designed to remove contaminants. However, these preprocessing systems are costly to implement in terms of initial capital investment, maintenance, labor, and disposal of residues (contaminants extracted from the feedstock). Contamination includes several material types (e.g., film plastics, glass, containers) and can require different types of removal processes.
E. Pretreatment and post-treatment of various feedstocks
CG employs pretreatment and post-treatment of the materials they currently compost. In its plans to employ a high solids plug-flow type of AD, they explored ways to expand its pretreatment and post-treatment systems to assure the resulting compost would reach a high quality to compete in the compost market. Pretreatment systems consist of mechanized screening devices, manual sort conveyors, magnets and other contaminant removal systems. Post-treatment systems include screening and air-classification/densimetric separation.
Anaerobic Digestion Feasibility Study
88 | October 2, 2017
F. Problems/risks associated with various feedstocks
Apart from the increasing quantity of contamination, CG does not necessarily envision problems with its feedstocks. Its plans for the distributed AD devices will, by natural consequences, allow the generators to refine its feedstocks to the appropriate materials for the digester. The digestate from the digesters is anticipated to be more stable, less odorous and to contain less contamination when blended into compost for further processing.
G. Optimal and acceptable feedstock combinations.
CG anticipates the optimal feedstock for the distributed AD devices will vary according to the organic material generator. The high-solids plug-flow type of digester has been used in Europe to process a variety of feedstocks such as animal manure, dairy waste, and food manufacturing wastes.
H. Management of residues
CG’s goal of implementing the distributed digestion units is to retain control of the residues, which CG hopes to compost. Again, depending on the quantity of contamination, the digestate should contain less contamination for composting. In theory, the quantity of residues should reduce when these AD devices are being managed correctly.
I. Facility development possibilities
Having attempted and failed facility to develop an AD system on its site, CG is keenly aware of the limitations of facility development. Challenges associated with developing facilities where AD devices are distributed throughout the region onto the sites of organic material generators are unknown at this time. To some extent, the pilot project at the CG facility will play a crucial role in understanding how organic material generators will be willing to accept the device on its property.
J. Facility operation compatibility with current infrastructure
Operations and maintenance of the distributed AD devices will require a new set of mobile operator/maintenance staff that service the devices. For the system to function correctly, maintenance of the AD device, biogas upgrade/use and effluent treatment/discharge will be necessary. The current composting infrastructure is compatible to process the digestate generated by the distributed AD devices.
K. Potential facility ownership models
The CG approach presumes the AD equipment could be owned by the organic material generator or by CG under a lease/manage option. This model would most likely not require public investment.
L. Who is best suited to manage by-product processing and marketing
CG believes its model will distribute the power generation aspects of the biogas so that individual organic material generators will also seek offsets for producing their own

Anaerobic Digestion Feasibility Study
October 2, 2017 | 89
power. CG will remain in control of the solids (digestate) from the digesters for composting and related by-product marketing.
M. Possible funding of facilities
CG is hopeful that the funding of these facilities will be undertaken by the organic material generators.
Contact Information Contact: Jerry Bartlett Phone 206-939-0712 Email: Bartlett Ventures, [email protected]
Contact: Steven Banchero Phone 206-948-6009 Email [email protected]
Reference Information http://www.ecoverse.net/brand/tiger
http://www.biofermenergy.com/wp-content/uploads/2014/03/Tech_EUCOlino_Compact-Digester.pdf
http://www.biofermenergy.com/wp-content/uploads/2014/03/2014_EUCO_Plug-Flow-Digester_BIOFerm-Energy-Systems.pdf

Anaerobic Digestion Feasibility Study
90 | October 2, 2017
Appendix 3 – Impact Bioenergy The following is a synopsis of responses from Jan Allen of Impact Bioenergy for each of the topics covered in this report.
A. Current feedstock sources and compatibility with private facility technologies (preprocessing and composting technology)
Impact Bioenergy has developed equipment sized to process organic materials from an individual source (the HORSE AD25, 135 to 960 pounds per day) or as a regional facility (the Nautilus AD185, 1000 to 5,000 pounds per day and the OX AD550 (1,200 to 6,000 pounds per day). As such, the size of facility could be selected based on the needs of the generator or waste shed. However, Mr. Allen reports some preprocessing is likely to be needed given the possibility that some generators do not adequately control contamination levels in the feedstock and the scale increases toward the higher throughput rates. Some preprocessing efforts described in strategy 4 may be appropriate for this technology.
B. Collection method (curbside, commercial, other, or combination)
Impact Bioenergy anticipates the individual organic material generators would develop a way to manage collection of the feedstock. The issue of collection has two differing possibilities; 1) if the AD device is sized small enough to serve a single entity where organic materials can be managed by the generator, or 2) if the AD is sized larger to serve a region, it is anticipated that the combined collection/preprocessing system would be similar to strategy 4 (County Transfer Stations where each facility would be equipped with preprocessing equipment, as space is available). Collection could also be a co-op or shared community-scale system
C. SSO vs. mixed solid waste or other materials.
Given the likelihood of contamination levels high enough to necessitate preprocessing, this strategy assumes either SSO from a single generator that doesn’t require preprocessing; OFMSW derived from a preprocessing system similar to strategy 4 would be the likely feedstock.
D. Contaminant screening and removal, and impact of contaminants on AD
Impact Bioenergy assumes contaminant screening and removal would be necessary upstream of the equipment. Lacking a better option, this strategy relies on the preprocessing to occur at the County Transfer Stations. Contaminant removal could occur by employing a squeeze-type device which extracts the liquid portion of waste under very high pressures (2000 psi), the use of a centrifugal device to extract liquid, or the use of mechanical/optical sorting systems are under development in other portions of the US/Europe.
E. Pretreatment and post-treatment of various feedstocks
This strategy assumes pretreatment of multi-family feedstock materials is necessary before materials can be digested, particularly for the larger collection vehicles that serve

Anaerobic Digestion Feasibility Study
October 2, 2017 | 91
multiple types of accounts, hence the possibility of contamination is higher. Groceries, restaurants, and industrial food manufacturers will require less pretreatment. Reliance on the pretreatment at the County’s transfer stations would be one possibility of resolving the need for pretreatment. Variable tip fees based on contamination rates have been successful in British Columbia.
F. Problems/risks associated with various feedstocks
Impact Bioenergy anticipates there could be problems with contamination from generators, again particularly for the larger/regional applications. Further exploration of the problems/risks of various feedstock sources and their influence on the performance of the digestion technology is needed. However, the possible problems with various feedstock sources could be minimized if pretreatment of the material occurs at the County Transfer Stations.
G. Optimal and acceptable feedstock combinations
At this level of the analysis there is no optimal or acceptable feedstock combination identified. Impact Bioenergy reports its equipment is capable of digesting food, paper, grass, and liquids. Work is reportedly underway on a third device: a modular high solids ‘dry’ AD system to allow cardboard, paper, and woody materials as well.
H. Management of residues
Residues from the distributed/dedicated digester units could be managed in a variety of ways. Individual concessions could be awarded to local composters to compost the digestate from the digester units. Residues would be directed to the County’s Cedar Hills Regional Landfill at each of the Transfer Stations, making this strategy particularly efficient compared to other partnership options.
I. Facility development possibilities
Impact Bioenergy envisions a variety of possible facility development scenarios. They range from the placement of regional digestion units (similar to strategy 1), the use of each of the County Transfer Stations (similar to strategy 4) or other applications such as individual units at grocery stores, restaurants, etc. (for which the individual user would most likely not rely on the County’s preprocessing and provide SSO as the likely feedstock).
J. Facility operation compatibility with current infrastructure
Impact Bioenergy has not sufficiently developed its approach to identify how facility operation would be performed. However, a similar model to CG’s approach, where Impact Bioenergy would provide support to the owner of the digestion facility as a contracted operator service, is assumed. Further consideration of this issue would be needed to identify the preferred approach.
K. Potential facility ownership models
Impact Bioenergy assumes the private organic material generator would own or lease a facility located on its property. However, if the larger Impact Bioenergy devices (Nautilus

Anaerobic Digestion Feasibility Study
92 | October 2, 2017
or OX) were to be selected at the County site, the County could own the facilities located on County transfer station sites.
L. Who is best suited to manage by-product processing and marketing
The upgrading and beneficial use of the biogas could be contracted to a private entity would could be ideally suited to manage its use (depending on tax benefits, etc.). Impact Bioenergy suggests this would be an attractant to the generators so resolution of this issue would be developed on an individual basis to identify who is best suited to manage the offtake for solids and liquids; however, digestate/solids from the system could be managed by concession to local composters.
M. Possible funding of facilities
Although elements of the system could be owned by the County, (e.g., digesters located on County transfer station sites), most of the infrastructure in this strategy is assumed to be a private investment. Waste reduction, diversion, or efficiency grants (similar to onsite organics recycling or utility-sponsored energy efficiency grants) may be cost-effective for both the waste generators and King County.
Contact Information
Contact: Jan Allen Phone 206-250-3252 Email: [email protected]
Reference Information
http://impactbioenergy.com
Anaerobic Digestion Feasibility Study
October 2, 2017 | 93
Appendix 4 – Lenz Enterprises The following responses were provided by Jason Lenz and Edward Wheeler of Lenz Enterprises.
A. Current feedstock sources and compatibility with private facility technologies (preprocessing and composting technology)
Currently, the majority of the feedstock for its facility is SSO which can have 2-6 percent contamination. They also receive self-haul yard trimmings, which is typically clean material with little contamination. Lenz has researched and employed many different preprocessing methods including picking off a conveyor belt, picking off the floor with manual labor, picking with an excavator, trommel pre-screens, shredding, and grinding with large grates. They have found there is no silver bullet technique. They are currently manually removing contamination on the tipping floor and during active composting, and using mechanical separation during screening. The SSO (90 percent yard trimmings and 10 percent food waste) composts very well in its reversing aerated static piles (ECS technology) and makes a high quality compost end product.
B. Collection method (curbside, commercial, other, or combination)
Lenz’s organic feedstocks come through three different hauling pathways: 1) from King County Transfer Stations in Lenz-owned walking floor trucks, 2) direct haul by haulers with contracts in the region around the facility, and 3) from commercial contractors. They do not generally receive pure industrial/commercial/institutional (ICI) food waste, as ICI food waste is usually mixed into residential waste in each truck or at the transfer station.
C. SSO organics vs. mixed solid waste or other materials.
Lenz has only processed SSO into compost. Physical contamination removal is the single most difficult part of its conversion process from waste to valuable compost end product. They have researched MSW processing technologies and implementation both here and in Europe and Asia and while they would be open to learning about various MSW preprocessing and MSW digestion processes, available technologies have not proven either efficient or reliable enough for a sound investment. They have, and continue to research and investigate all available contamination removal systems (e.g., densimetric tables for removal of glass, ballistic density separation, etc.) with manufacturers. However, facts provided by the manufactures and companies who have implemented these technologies fail to prove that they can cost effectively treat, clean, and compost the organic fraction of MSW to the standard that Lenz currently achieves with its targeted SSO process.
D. Contaminant screening and removal, and impact of contaminants on AD
Lenz operates a composting facility, so its focus is on the quality of its composted end product. Contamination removal is the most difficult aspect of its process. Glass is particularly difficult. Despite trying the full gamut of mechanical equipment for preprocessing, they have found manual picking on a hard static surface to be the most effective at removal of the wide array of physical contamination. The removal of

Anaerobic Digestion Feasibility Study
94 | October 2, 2017
contamination cannot be conducted by Doda/Tiger/Scott rotating sheer type removal systems because of the high percentage of woody material and green material, which do not process well in these rotary systems. These mechanical systems are also very slow and with 300+ tpd, an excessive number of these mechanical units would be required to process a day’s worth of tonnage. Despite the challenges and cost, Lenz is able to produce a high-quality compost end-product that can be sold to some of the highest-end markets in Washington State.
E. Pretreatment and post-treatment of various feedstocks
Lenz has tried a wide array of mechanical system including: star screens, trommel screens, air lift separators, and also manual picking of contamination out of end-product screens. Lenz has found that all of these system work reasonably well for removing 95 percent of the contamination that the system was designed to remove. Contamination removal using multiple technologies at several different stages of the composting process is removing contaminants well enough to create a saleable product.
F. Problems/risks associated with various feedstocks
The contamination that accompanies the food waste fraction of SSO is the most challenging. That said, this material can still be profitably cleaned, composted, screened, and sold as a finished compost end product to high end markets.
G. Optimal and acceptable feedstock combinations
Yard trimmings from landscape contractors are the easiest feedstock to process into a quality end product. Biochemically, the mixture of yard trimmings and food waste is excellent for composting and makes a hot pile with lots of biological activity that makes a fine end product. The challenge with SSO is the contamination that tends to accompany the food waste fraction of SSO. This contamination does not come from all sources. Even with commercial food waste, some generators do an excellent job and others do a poor job.
H. Management of residues
Metal and glass are recycled. Some hard plastic is recycled. Back haul of trash is conducted periodically to the King County Transfer Stations per contractual arrangements.
I. Facility development possibilities
Lenz would be interested in developing additional processing facilities in King County. They wish to remain informed and consulted should SWD seek partners.
J. Facility operation compatibility with current infrastructure
Lenz processes a considerable fraction of SSO food waste from residential and commercial generators in King County. If this food waste were diverted, either through different collection or transport to an independent SSO AD facility, or if the SSO food waste were shunted back into the MSW stream and treated in an independent MSW AD, they would lose considerable tonnage from this source. They would entertain evaluating

Anaerobic Digestion Feasibility Study
October 2, 2017 | 95
the viability of composting a clean organic digestate fraction that resulted from the preprocessing and AD of a food waste stream. This evaluation would need to occur using actual materials to accurately evaluate the efficacy of the process.
K. Potential facility ownership models
Lenz’s current business model is to own facilities and receive a term agreement for a set amount of feedstock. This business models works well as it allows full authority and responsibility for the facility. Lenz is open to operation/consulting for a facility given the right conditions.
L. Who is best suited to manage by-product processing and marketing
Lenz anticipates managing/marketing the solid byproducts as they have the infrastructure and are best suited to manage/market these materials.
M. Possible funding of facilities
Funding is available in many sources, private funds, grants, government sponsored low-interest loans, municipal bonds, etc. Lenz is open to exploring any scenario that is financially feasible.
Contact Information
Contact: Jason Lenz Phone: 360-629-2933 Email: Jason Lenz, [email protected]
Reference Information
Web: http://greenblenz.com/

Anaerobic Digestion Feasibility Study
96 | October 2, 2017
Appendix 5 – Waste Management The following responses were developed based on the conversation with WM.
A. Current feedstock sources and compatibility with private facility technologies (preprocessing and composting technology)
The WM CORe technology has been demonstrated to receive and preprocess commercial and residential organic material streams with relatively high quantities of contamination. The CORe system produces an engineered bioslurry (EBS) product that is suitable for digestion at WWTPs. The process is operating at full scale by WM in New York City, Los Angeles, and Boston, with an additional facility under construction in Northern New Jersey. WM reports the CORe process is scalable and could be implemented at any of the three WM owned properties in the region.
B. Collection method (curbside, commercial, other, or combination)
WM reports typical curbside collection methods can be used to capture organics. They would characterize the organics as SSO but acknowledge that relatively high levels of contamination would be acceptable. The CORe system is equipped to segregate the contamination from the organics made into the bioslurry product mentioned above.
C. SSO organics vs. mixed solid waste or other materials
Again, the material would be categorized as SSO but does not necessarily need to be pristine or free of contamination. The CORe system is not designed to extract organics from MSW.
D. Contaminant screening and removal, and impact of contaminants on AD
The CORe system is capable of removing contamination to produce a bioslurry that is acceptable to WWTPs for co-digestion.
E. Pretreatment and post-treatment of various feedstocks
WM reports the use of the CORe system to pretreat feedstock material but no discussion of post-treatment has occurred. From WM’s perspective the post-treatment process would be whatever process the WWTP currently employs for its biosolids.
F. Problems/risks associated with various feedstocks WM would need to evaluate the condition of the SSO to determine if there are problems with the feedstock. However, based on the pilot/demonstration projects currently underway, it seems WM would be able to isolate problematic feedstock sources and reject them temporarily while remedies to the feedstock could be identified. Again, the CORe pretreatment system appears to be compatible with the Renton/Brightwater WWTP digestion and could mitigate the pretreatment issues identified by the Renton WWTP staff.

Anaerobic Digestion Feasibility Study
October 2, 2017 | 97
G. Optimal and acceptable feedstock combinations.
The optimal feedstock for WM’s CORe appears to be SSO material with minimal contamination; however, relatively high levels of contamination are reportedly acceptable.
H. Management of residues
WM’s involvement in the organics AD technology has been focused on the production and testing of the CORe pretreatment technology for production of a bioslurry that WWTPs can digest. Consequently, residues from the digestion process are expected to be a biosolids type product that the WWTPs would manage. WM is capable of managing the residues in the form of contamination that is removed from the CORe pretreatment system.
I. Facility development possibilities WM reports they could place CORe systems at the County’s transfer stations and/or any of the three properties WM owns in the region. They do not see site development as a challenging issue.
J. Facility operation compatibility with current infrastructure
WM anticipates the implementation of the CORe technology pretreatment system to be compatible primarily with the existing AD infrastructure at the Renton WWTP.
K. Potential facility ownership models
WM intends to retain ownership of the CORe technology pretreatment process.
L. Who is best suited to manage by-product processing and marketing
As described above, the WM CORe model is in the feedstock preparation aspect of the process and not necessarily the AD/by-product portion of the process. Consequently, WM would defer to the AD owner to manage by-products.
M. Possible funding of facilities
WM reports they would be interested in developing pilot or full scale CORe systems in support of a regional organics program. Their development model anticipates some form of a waste flow agreement to support the necessary funding of these facilities.
Reference Information:
Matt Stern Area Director of Recycling Operations, Pacific Northwest BC Area [email protected] Waste Management 13469 SW Highway 18 McMinnville, Oregon 97128 Tel 503.894.1160

Anaerobic Digestion Feasibility Study
98 | October 2, 2017
This page is intentionally left blank.

Anaerobic Digestion Feasibility Study
October 2, 2017 | 99
Appendix 6 – WARM Results

Anaerobic Digestion Feasibility Study
100 | October 2, 2017
This page is intentionally left blank.

GHG Emissions Analysis -- Summary ReportVersion 14GHG Emissions Waste Management Analysis for King County AD Feasibility StudyPrepared by: Scenario 1Project Period for this Analysis: 01/01/17 to 12/31/17Note: If you wish to save these results, rename this file (e.g., WARM-MN1) and save it. Then the "Analysis Inputs" sheet of the "WARM" file will be blank when you are ready to make another model run.
GHG Emissions from Baseline Waste Management (MTCO2E): 3,479 GHG Emissions from Alternative Waste Management Scenario (MTCO2E): (860)
MaterialTons
Recycled Tons Landfilled Tons CombustedTons
CompostedTons Anaerobically
Digested Total MTCO2E MaterialTons Source
Reduced Tons Recycled Tons Landfilled Tons Combusted Tons CompostedTons Anaerobically
Digested Total MTCO2EChange
(Alt - Base) MTCO2EFood Waste NA 8,000.0 - - - 3,479 Food Waste - NA - - - 8,000.0 (860) (4,339)
0 0 00 0 00 0 00 0 00 0 00 0 00 0 00 0 00 0 00 0 00 0 00 0 00 0 00 0 00 0 00 0 00 0 00 0 00 0 00 0 00 0 00 0 00 0 00 0 00 0 00 0 00 0 00 0 00 0 00 0 00 0 00 0 00 0 00 0 00 0 00 0 00 0 00 0 00 0 00 0 00 0 00 0 00 0 00 0 00 0 00 0 00 0 00 0 00 0 00 0 00 0 00 0 00 0 0
Total Change in GHG Emissions (MTCO2E): (4,339)
This is equivalent to…
a) For explanation of methodology, see the EPA WARM Documentation:
gannual emissions from 914
Conserving 488,268
Conserving 180,802
Conserving 23
0.00025%
0.00021%
Note: a negative value (i.e., a value in parentheses) indicates an emission reduction; a positive value
Solid Waste Management and Greenhouse Gases: A Life-Cycle Assessment of Emissions and Sinks
-- available on the Internet at http://epa.gov/epawaste/conserve/tools/warm/SWMGHGreport.html
Passenger Vehicles
Gallons of Gasoline
Cylinders of Propane Used for Home Barbeques
Railway Cars of Coal
Annual CO2 emissions from the U.S. transportation sector
c) The GHG emissions results estimated in WARM indicate the full life-cycle benefits waste management alternatives. Due to the timing of the GHG emissions from the waste management pathways, (e.g., avoided landfilling and increased recycling), the actual GHG implications may accrue over the long-term. Therefore, one should not interpret the GHG emissions implications as occurring all in one year, but rather through time.
Annual CO2 emissions from the U.S. electricity sector
b) Emissions estimates provided by this model are intended to support voluntary GHG measurement and reporting initiatives.

GHG Emissions Analysis -- Summary ReportVersion 14GHG Emissions Waste Management Analysis for King County AD Feasibility StudyPrepared by: Scenario 2Project Period for this Analysis: 01/01/17 to 12/31/17Note: If you wish to save these results, rename this file (e.g., WARM-MN1) and save it. Then the "Analysis Inputs" sheet of the "WARM" file will be blank when you are ready to make another model run.
GHG Emissions from Baseline Waste Management (MTCO2E): 3,610 GHG Emissions from Alternative Waste Management Scenario (MTCO2E): (846)
MaterialTons
Recycled Tons Landfilled Tons CombustedTons
CompostedTons Anaerobically
Digested Total MTCO2E MaterialTons Source
Reduced Tons Recycled Tons Landfilled Tons Combusted Tons CompostedTons Anaerobically
Digested Total MTCO2EChange
(Alt - Base) MTCO2EFood Waste NA 8,300.0 - - - 3,610 Food Waste - NA - - - 8,300.0 (846) (4,456)
0 0 00 0 00 0 00 0 00 0 00 0 00 0 00 0 00 0 00 0 00 0 00 0 00 0 00 0 00 0 00 0 00 0 00 0 00 0 00 0 00 0 00 0 00 0 00 0 00 0 00 0 00 0 00 0 00 0 00 0 00 0 00 0 00 0 00 0 00 0 00 0 00 0 00 0 00 0 00 0 00 0 00 0 00 0 00 0 00 0 00 0 00 0 00 0 00 0 00 0 00 0 00 0 00 0 0
Total Change in GHG Emissions (MTCO2E): (4,456)
This is equivalent to…
a) For explanation of methodology, see the EPA WARM Documentation:
gannual emissions from 938
Conserving 501,364
Conserving 185,651
Conserving 24
0.00026%
0.00022%
Note: a negative value (i.e., a value in parentheses) indicates an emission reduction; a positive value
Solid Waste Management and Greenhouse Gases: A Life-Cycle Assessment of Emissions and Sinks
-- available on the Internet at http://epa.gov/epawaste/conserve/tools/warm/SWMGHGreport.html
Passenger Vehicles
Gallons of Gasoline
Cylinders of Propane Used for Home Barbeques
Railway Cars of Coal
Annual CO2 emissions from the U.S. transportation sector
c) The GHG emissions results estimated in WARM indicate the full life-cycle benefits waste management alternatives. Due to the timing of the GHG emissions from the waste management pathways, (e.g., avoided landfilling and increased recycling), the actual GHG implications may accrue over the long-term. Therefore, one should not interpret the GHG emissions implications as occurring all in one year, but rather through time.
Annual CO2 emissions from the U.S. electricity sector
b) Emissions estimates provided by this model are intended to support voluntary GHG measurement and reporting initiatives.

GHG Emissions Analysis -- Summary ReportVersion 14GHG Emissions Waste Management Analysis for King County AD Feasibility StudyPrepared by: Scenario 3AProject Period for this Analysis: 01/01/17 to 12/31/17Note: If you wish to save these results, rename this file (e.g., WARM-MN1) and save it. Then the "Analysis Inputs" sheet of the "WARM" file will be blank when you are ready to make another model run.
GHG Emissions from Baseline Waste Management (MTCO2E): 5,089 GHG Emissions from Alternative Waste Management Scenario (MTCO2E): (1,219)
MaterialTons
Recycled Tons Landfilled Tons CombustedTons
CompostedTons Anaerobically
Digested Total MTCO2E MaterialTons Source
Reduced Tons Recycled Tons Landfilled Tons Combusted Tons CompostedTons Anaerobically
Digested Total MTCO2EChange
(Alt - Base) MTCO2EFood Waste NA 11,700.0 - - - 5,089 Food Waste - NA - - - 11,700.0 (1,219) (6,308)
0 0 00 0 00 0 00 0 00 0 00 0 00 0 00 0 00 0 00 0 00 0 00 0 00 0 00 0 00 0 00 0 00 0 00 0 00 0 00 0 00 0 00 0 00 0 00 0 00 0 00 0 00 0 00 0 00 0 00 0 00 0 00 0 00 0 00 0 00 0 00 0 00 0 00 0 00 0 00 0 00 0 00 0 00 0 00 0 00 0 00 0 00 0 00 0 00 0 00 0 00 0 00 0 00 0 0
Total Change in GHG Emissions (MTCO2E): (6,308)
This is equivalent to…
a) For explanation of methodology, see the EPA WARM Documentation:
gannual emissions from 1,328
Conserving 709,769
Conserving 262,821
Conserving 34
0.00036%
0.00031%
Note: a negative value (i.e., a value in parentheses) indicates an emission reduction; a positive value
Solid Waste Management and Greenhouse Gases: A Life-Cycle Assessment of Emissions and Sinks
-- available on the Internet at http://epa.gov/epawaste/conserve/tools/warm/SWMGHGreport.html
Passenger Vehicles
Gallons of Gasoline
Cylinders of Propane Used for Home Barbeques
Railway Cars of Coal
Annual CO2 emissions from the U.S. transportation sector
c) The GHG emissions results estimated in WARM indicate the full life-cycle benefits waste management alternatives. Due to the timing of the GHG emissions from the waste management pathways, (e.g., avoided landfilling and increased recycling), the actual GHG implications may accrue over the long-term. Therefore, one should not interpret the GHG emissions implications as occurring all in one year, but rather through time.
Annual CO2 emissions from the U.S. electricity sector
b) Emissions estimates provided by this model are intended to support voluntary GHG measurement and reporting initiatives.

GHG Emissions Analysis -- Summary ReportVersion 14GHG Emissions Waste Management Analysis for King County AD Feasibility StudyPrepared by: Scenario 3BProject Period for this Analysis: 01/01/17 to 12/31/17Note: If you wish to save these results, rename this file (e.g., WARM-MN1) and save it. Then the "Analysis Inputs" sheet of the "WARM" file will be blank when you are ready to make another model run.
GHG Emissions from Baseline Waste Management (MTCO2E): 10,221 GHG Emissions from Alternative Waste Management Scenario (MTCO2E): (2,448)
MaterialTons
Recycled Tons Landfilled Tons CombustedTons
CompostedTons Anaerobically
Digested Total MTCO2E MaterialTons Source
Reduced Tons Recycled Tons Landfilled Tons Combusted Tons CompostedTons Anaerobically
Digested Total MTCO2EChange
(Alt - Base) MTCO2EFood Waste NA 23,500.0 - - - 10,221 Food Waste - NA - - - 23,500.0 (2,448) (12,669)
0 0 00 0 00 0 00 0 00 0 00 0 00 0 00 0 00 0 00 0 00 0 00 0 00 0 00 0 00 0 00 0 00 0 00 0 00 0 00 0 00 0 00 0 00 0 00 0 00 0 00 0 00 0 00 0 00 0 00 0 00 0 00 0 00 0 00 0 00 0 00 0 00 0 00 0 00 0 00 0 00 0 00 0 00 0 00 0 00 0 00 0 00 0 00 0 00 0 00 0 00 0 00 0 00 0 0
Total Change in GHG Emissions (MTCO2E): (12,669)
This is equivalent to…
a) For explanation of methodology, see the EPA WARM Documentation:
gannual emissions from 2,667
Conserving 1,425,604
Conserving 527,889
Conserving 68
0.00073%
0.00063%
Note: a negative value (i.e., a value in parentheses) indicates an emission reduction; a positive value
Solid Waste Management and Greenhouse Gases: A Life-Cycle Assessment of Emissions and Sinks
-- available on the Internet at http://epa.gov/epawaste/conserve/tools/warm/SWMGHGreport.html
Passenger Vehicles
Gallons of Gasoline
Cylinders of Propane Used for Home Barbeques
Railway Cars of Coal
Annual CO2 emissions from the U.S. transportation sector
c) The GHG emissions results estimated in WARM indicate the full life-cycle benefits waste management alternatives. Due to the timing of the GHG emissions from the waste management pathways, (e.g., avoided landfilling and increased recycling), the actual GHG implications may accrue over the long-term. Therefore, one should not interpret the GHG emissions implications as occurring all in one year, but rather through time.
Annual CO2 emissions from the U.S. electricity sector
b) Emissions estimates provided by this model are intended to support voluntary GHG measurement and reporting initiatives.


