In-situ Bioremediation of Chlorinated Solvents An Assessment of
Upload
dangnguyetCategory
view
226download
0
Copyright © 2007True Blue Technologies Inc.
Anaerobic Bioremediation of Chlorinated Solvents in Groundwater Using
Edible Oil Substrate EOS®• Matt Sedor, M.S., Yonathon Yoseph, P.G., C.H.G. (Remediation
Sciences, Inc.)• Jeff Baker (Vironex, Inc. ),• John Sankey, P.Eng. (True Blue Technologies Inc.).
Given by John Sankey, P.Eng.,
True Blue Technologies

Slide 2
Copyright © 2006 EOS Remediation, Inc.
From this…

Slide 3
Copyright © 2006 EOS Remediation, Inc.
…to this in 18 months!

Anaerobic Bioremediation of Chlorinated Solvents in Groundwater Using
Edible Oil Substrate EOS®Site Intro
Anaerobic Bioremediation– Few slides
Options: What ferments to hydrogen?
Designing the Project
Preparing and Injecting Substrate
Results
Ground Water Characterization--What to Monitor?

Slide 5
Copyright © 2006 EOS Remediation, Inc.
Site Intro: Dry Cleaners Site Located in San Jose, California
Highest PCE and TCE concentrations in the January 2005 were 8,500 µg/L. After evaluating several alternatives, in situbioremediation was selected.The goal was to find a substrate that was long lasting and easily distributed into the saturated soils.

How Does Anaerobic Bio Work?• Growth-Promoting Biological
Reduction
Energy
+
Electron Donor(Food)
Electron Acceptor(something to breathe)
[O2, NO3, SO4, TCE, etc.]
Waste Products[CO2, N2, FeS2, Cl-]
+ +
(Drawing Modified from AFCEE and Wiedemeier)

Slide 7
Copyright © 2006 EOS Remediation, Inc.
What is Needed for Effective Anaerobic Bioremediation? • Organic substrates that
ferment to:– Acetate– Hydrogen (H2)
• Strongly reducing conditions (Sulfate Reducing or Methanogenic)
• Right halorespiring bacteria (Dehalococcoides for DCE / VC)
• Nutrients – Vitamins and trace minerals to
stimulate Dehalococcoidesgrowth
Source: AFCEE, Principles and Practices of Enhanced Anaerobic Bioremediation of Chlorinated Solvents, August 2004

OPTIONS:What quickly ferments to hydrogen?
•Soluble substrates (e.g., lactate, butyrate, propionate, acetate, molasses, and sugars).
•Solid substrates (e.g., bark mulch, compost, chitin and peat).
•Slow release substrates such as vegetable oil.

Slide 9
Copyright © 2006 EOS Remediation, Inc.
What lasts longer in-situ?
• Soybean oil • C56H100O6 (soybean oil1) + 50 H2O -B->
-B-> 28 CH3COOH (acetic acid) + 44 H2
1Represents weighted average of constituent fatty acids and glycerol.

How Many Electrons Can We Pump into the Ground?
e- Released
per mole per lb
Acetate 8 0.13
Lactate 12 0.13
Glucose 24 0.13
Soybean Oil 313 0.36
Canola Oil 319 0.36
Lard 311 0.36

Slide 11
Copyright © 2006 EOS Remediation, Inc.
Blender Lab Homogenizer
EOSSilverson High Shear Mixer
Soy/Lactate Emulsions

Slide 12
Copyright © 2006 EOS Remediation, Inc.
The Secret of Good Oil Distribution“Emulsions that do NOT Flocculate”
Dispersed Oil Droplets Flocculated Oil Droplets

Slide 13
Copyright © 2006 EOS Remediation, Inc.
Secrets of Good Emulsion Distribution“Use Emulsions that do NOT Flocculate”
Clogged pore

Slide 14
Copyright © 2006 EOS Remediation, Inc.
Technology Choice--EOS®
Why?• Slow release substrate
– Emulsified soybean oil (GRAS)– Small, uniform droplets– Negative surface charge
• Easily biodegradable substrate– Lactate
• Micronutrients– Amino acids, Trace nutrients, Vitamins
• Easy to inject and distributed throughout treatment area
• Solid reputation• Cost

Slide 15
Copyright © 2006 EOS Remediation, Inc.
Technology Choice—Proposed CostEOS598 B42 Cost-6600 lbs• $19,000
Drilling 12 points, injected 4,400 gallons of EOS mix and 22,700 gallons of flush water over a period of 6 days.
• $30,000
Plus monitoring and engineering

Slide 16
Copyright © 2006 EOS Remediation, Inc.
Designing the Injection at The Dry Cleaner Site“You need to make contact…with the contaminant

Slide 17
Copyright © 2006 EOS Remediation, Inc.
Radius of Influence?10ft to 100ft with EOS
From This
…..To This

Slide 18
Copyright © 2006 EOS Remediation, Inc.

Slide 19
Copyright © 2006 EOS Remediation, Inc.
Source Treatment with Barriers
GroundwaterFlow
• Barriers 0.5 to 1 year apart
• Advantages– Low cost
• Fewer injection points• Less oil and water
– Release of TOC enhances downgradient biodegradation
– Aquifer remains permeable• Disadvantage
– Longer clean-up time

Slide 20
Copyright © 2006 EOS Remediation, Inc.
Source Area Treatment

Slide 21
Copyright © 2006 EOS Remediation, Inc.
• How much do we inject?

Slide 22
Copyright © 2006 EOS Remediation, Inc.
Treatment Zone Dimensions
Treated Groundwater
EOS® Emulsion & Chase Water
Injection Point
Groundwater Flow
y
XSource Area
SourceArea
z
y
Treated Groundwater
EOS® Emulsion & Chase Water
y
XSource Area
SourceArea
X Barrier
Make barrier wider than plume width
Slide 23
Copyright © 2006 EOS Remediation, Inc.
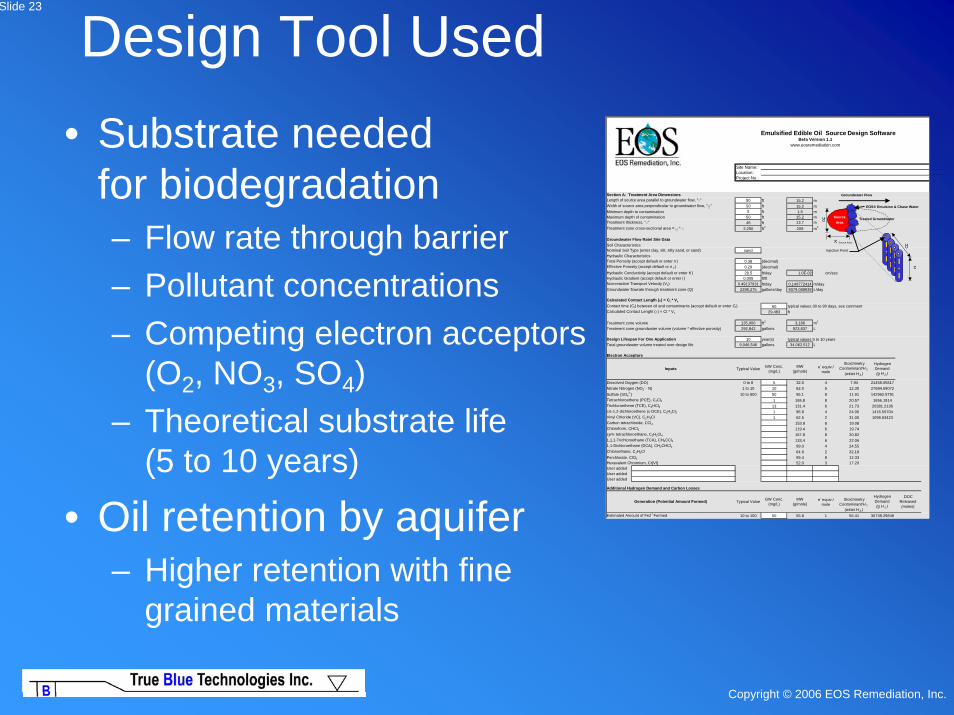
Design Tool Used• Substrate needed
for biodegradation– Flow rate through barrier– Pollutant concentrations– Competing electron acceptors
(O2, NO3, SO4)– Theoretical substrate life
(5 to 10 years)
• Oil retention by aquifer– Higher retention with fine
grained materials
Site Name:Location:Project No.:
Section A: Treatment Area DimensionsLength of source area parallel to groundwater flow, "x" 50 ft 15.2 mWidth of source area perpendicular to groundwater flow, "y" 50 ft 15.2 mMinimum depth to contamination 5 ft 1.5 mMaximum depth of contamination 50 ft 15.2 mTreatment thickness, "z" 45 ft 13.7 mTreatment zone cross-sectional area = y * z 2,250 ft2 209 m2
Groundwater Flow Rate/ Site DataSoil CharacteristicsNominal Soil Type (enter clay, silt, silty sand, or sand) sandHydraulic CharacteristicsTotal Porosity (accept default or enter n ) 0.38 (decimal)Effective Porosity (accept default or n e ) 0.29 (decimal)Hydraulic Conductivity (accept default or enter K ) 28.5 ft/day 1.0E-02 cm/secHydraulic Gradient (accept default or enter i ) 0.005 ft/ftNon-reactive Transport Velocity (Vx) 0.49137931 ft/day 0.149772414 m/dayGroundwater flowrate through treatment zone (Q) 2398.275 gallons/day 9079.088939 L/day
Calculated Contact Length (x) = Ct * Vx
Contact time (Ct) between oil and contaminants (accept default or enter Ct) 60 typical values 30 to 90 days, see commentCalculated Contact Lenght (x) = Ct * Vx 29.483 ft
Treatment zone volume 135,000 ft3 3,186 m2
Treatment zone groundwater volume (volume * effective porosity) 292,842 gallons 923,837 L
Design Lifespan For One Application 10 year(s) typical values 5 to 10 yearsTotal groundwater volume treated over design life 9,046,546 gallons 34,062,512 L
Electron Acceptors
Dissolved Oxygen (DO) 0 to 8 5 32.0 4 7.94 21458.05817Nitrate Nitrogen (NO3
- - N) 1 to 10 10 62.0 5 12.30 27684.59072Sulfate (SO4
2-) 10 to 500 50 96.1 8 11.91 142962.5791Tetrachloroethene (PCE), C2Cl4 1 165.8 8 20.57 1656.1914Trichloroethene (TCE), C2HCl3 13 131.4 6 21.73 20381.2136cis-1,2-dichloroethene (c-DCE), C2H2Cl2 1 96.9 4 24.05 1416.55704Vinyl Chloride (VC), C2H3Cl 1 62.5 2 31.00 1098.63423Carbon tetrachloride, CCl4 153.8 8 19.08Chloroform, CHCl3 119.4 6 19.74sym- tetrachloroethane, C2H2Cl4 167.8 8 20.821,1,1-Trichloroethane (TCA), CH3CCl3 133.4 6 22.061,1-Dichloroethane (DCA), CH2CHCl2 99.0 4 24.55Chloroethane, C2H5Cl 64.9 2 32.18Perchlorate, ClO4
- 99.4 8 12.33Hexavalent Chromium, Cr[VI] 52.0 3 17.20User addedUser addedUser added
Additional Hydrogen Demand and Carbon Losses
Estimated Amount of Fe2+ Formed 10 to 100 50 55.8 1 55.41 30738.29849
Emulsified Edible Oil Source Design SoftwareBeta Version 1.1
www.eosremediation.com
StoichmetryContaminant/H 2
(wt/wt H 2 )Inputs
e- equiv./mole
StoichmetryContaminant/H 2
(wt/wt H 2 )
Hydrogen Demand(g H 2 )
DOC Released(moles)
Generation (Potential Amount Formed) Typical Value GW Conc.(mg/L)
MW(g/mole)
Hydrogen Demand(g H 2 )
Typical Value GW Conc.(mg/L)
MW(g/mole)
e- equiv./mole
Treated Groundwater
EOS® Emulsion & Chase Water
Injection Point
Groundwater Flow
y
X Source Area
SourceArea
z
y

Slide 24
Copyright © 2006 EOS Remediation, Inc.
Determining Injection Well Spacing• Tradeoff
between– Well installation
cost
– Labor cost for injection
– Material cost for emulsion
Cost / Ft of 30 Ft Deep Barrier
050
100150200250300
0 5 10 15
Well Spacing
Cos
t per
ft
barr
ier (
$/ft)
Total WellsEOS Labor
Cost / Ft of 100 Ft Deep Barrier
0
500
1000
1500
2000
2500
0 10 20 30 40
Well Spacing
Cos
t per
ft
barr
ier (
$/ft)
Total WellsEOS Labor

Slide 25
Copyright © 2006 EOS Remediation, Inc.
Enhanced Anaerobic BioremediationUsing Emulsified Edible Oils
• Preparing and Injecting Emulsions

Slide 26
Copyright © 2006 EOS Remediation, Inc.
Injection System Design Options• Direct-push
technology– Using pressure
• Injection wells– Gravity feed– Low pressure

Slide 27
Copyright © 2006 EOS Remediation, Inc.
Emulsion Dilution Options• Continuous injection of
dilute emulsion without chase water– Dilution ratios range from 1:10 to 1:30– Depends on effective porosity
• Injected 4,400 gallons of EOS mix and 22,700 gallons of chase water
• Chase water used to distribute emulsion out into the formation

Slide 28
Copyright © 2006 EOS Remediation, Inc.
Emulsion Dilution• In-line metering
system– Eliminates labor and
equipment for field blending
– Adjustable dilution ratio
ContinuousMetering System

Ground Water CharacterizationWhat to Monitor
Indicator Parameters• Electron acceptors (O2, NO3, SO4)
– Low levels of O2 are not a major problem – High levels of SO4 increase substrate demand
• Electron donors (Mn, Fe, CH4, TOC)• ORP, PH• Degradation products• See EPA / AFCEE protocol for
MNA of Chlorinated Solvents

ClClCl
ClClClCCC
ClClCl
ClClClCCC
PCEPCE
ClClCl
ClClClCCC
ClClCl
HHHCCC
TCETCE ClClCl
HHHCCC
ClClCl
HHHCCC
ciscis--1,21,2--DCEDCE
ClClCl
ClClClCCC
HHH
HHHCCC 1,11,1--DCEDCE
HHH
ClClClCCC
ClClCl
HHHCCC transtrans--1,21,2--DCEDCE
HHH
HHHCCC
ClClCl
HHHCCC VinylVinyl
ChlorideChloride
HHH
HHHCCC
HHH
HHHCCC EtheneEthene
HHH
HHHCCC
HHH
HHHCCC EthaneEthane
OOO
CCCOOO
OOOCCC
OOOCl-ClCl-- Cl-ClCl--
Cl-ClCl-- Cl-ClCl--
Complete MineralizationComplete MineralizationHHH HHH
(Drawing Modified from AFCEE, Technology Transfer Division)
e-ee--
H+HH++H2HH22
Electron FlowElectron Flow
Cl-ClCl--
Degradation products

Slide 31
Copyright © 2006 EOS Remediation, Inc.
Anaerobic Bioremediation of Chlorinated Solvents in Groundwater Using Edible Oil Substrate EOS®
• Results

Slide 32
Copyright © 2006 EOS Remediation, Inc.
PLUME OF THE MAJOR CONTAMINANTSPre-Injection (injection April 2005)

Slide 33
Copyright © 2006 EOS Remediation, Inc.
PLUME OF THE MAJOR CONTAMINANTS6-months post-injection

Slide 34
Copyright © 2006 EOS Remediation, Inc.
PLUME OF THE MAJOR CONTAMINANTS9-months post-injection

Slide 35
Copyright © 2006 EOS Remediation, Inc.
PLUME OF THE MAJOR CONTAMINANTS12-months post-injection

Slide 36
Copyright © 2006 EOS Remediation, Inc.
PLUME OF THE MAJOR CONTAMINANTS15-months post-injection

Slide 37
Copyright © 2006 EOS Remediation, Inc.
PLUME OF THE MAJOR CONTAMINANTS18-months post-injection

RESULTS: CHART 1: MW-1A ANALYTICAL RESULTS VERSES TIME
Volatile Organic Compounds
010203040506070
5/21/2002 1/27/2005 7/14/2005 10/26/2005 1/18/2006
Date
Con
cent
ratio
n (m
icro
mol
es/li
ter)
PCE (micromoles/l) TCE (micromoles/l)Cis -1, 2-DCE (micromoles/l) Vinal Chloride (micromoles/l)
Methane, Ethane, and Ethene
0
0.05
0.1
0.15
0.2
0.25
5/21/2002 1/27/2005 7/14/2005 10/26/2005 1/18/2006
Date
Con
cent
ratio
n (m
illim
oles
/lite
r)
Methane (millimoles/l) Ethane (millimoles/l) Ethene (millimoles/l)
MW-1A Total Organic Carbon (TOC) and Dissolved Oxygen (DO)
0
200
400
600
800
1000
5/21/2002 1/27/2005 7/14/2005 10/26/2005 1/18/2006
Date
TOC
C
once
ntra
tion
(mg/
liter
)
0
0.2
0.4
0.6
0.8
1
DO
C
once
ntra
tion
(mg/
liter
)
TOC (mg/l) DO (mg/l)
Oxygen Reduction Potential (ORP) and pH
-180
-130
-80
-30
20
70
120
5/21/2002 1/27/2005 7/14/2005 10/26/2005 1/18/2006
Date
OR
P (m
illiV
olts
)5.7
5.9
6.1
6.3
6.5
6.7
6.9
pH
ORP (mV) pH

Slide 39
Copyright © 2006 EOS Remediation, Inc.
Project Conclusions• EOS® effectively distributed throughout treatment
area• Quickly established favorable geochemistry for
reductive dechlorination.• Dramatic improvements in groundwater conditions
compared to prior technologies• Substantial reductions in TCE observed.• Apply for decrease monitoring to every 6 months.• Apply for closure this year.

Slide 40
Copyright © 2006 EOS Remediation, Inc.
I would like to thank:
Matt Sedor, M.S., Yonathon Yoseph, P.G., C.H.G. (Remediation Sciences, Inc.)
Jeff Baker (Vironex, Inc. )Robert C. Borden and Christie Zawtocki, Michael D. Lee, Erica S Becvar,
Patrick E. Haas, Bruce M. Henry, AFCEE Protocol For Enhanced Anaerobic Bioremediation Using Edible Oils

Slide 41
Copyright © 2006 EOS Remediation, Inc.
For More InformationContact John Sankey, P.Eng• [email protected] or (604) 562-7836Visit www.eosremediation.com• Design Tool, Case Studies• Complete Product Line
– Chlorinated Solvent Site Remediation • EOS ® , emulsified soybean oil, for enhanced in situ
bioremediation• BAC 9, microbes for bioaugmentation
– Petroleum Site Cleanup Remediation • EOx™, a calcium-based oxygen releasing substrate for aerobic
bioremediation