ANACOSTIA WATERSHED TRASH REDUTION PLAN · anacostia watershed trash reduction plan table of...
29
December, 2008 ANACOSTIA WATERSHED TRASH REDUCTION PLAN PREPARED FOR: DISTRICT OF COLUMBIA DEPARTMENT OF THE ENVIRONMENT December, 2008 PREPARED BY: ANACOSTIA WATERSHED SOCIETY
Transcript of ANACOSTIA WATERSHED TRASH REDUTION PLAN · anacostia watershed trash reduction plan table of...

December, 2008
ANACOSTIA WATERSHED TRASH REDUCTION PLAN
PREPARED FOR:
DISTRICT OF COLUMBIA DEPARTMENT OF THE ENVIRONMENT
December, 2008
PREPARED BY: ANACOSTIA WATERSHED SOCIETY

ANACOSTIA WATERSHED TRASH REDUCTION PLAN ACKNOWLEDGEMENTS
Acknowledgements The raw data that was collected for this report was done with the assistance of two unpaid volunteers. Cynthia Collier provided 307 hours of work and Philip Collier provided 197 hours of work. Transects were surveyed in snow storms and streams were waded in the middle of the winter and data recorded with nearly frozen fingers. Mudflats, rabid raccoons, stray dogs, drug paraphernalia, water snakes, ticks, sewage, poison oak, and crawling through tangled log jams were daily occurrences. Few people would work so long and so hard for so little financial reward. We would like to thank the citizens who stopped us while we were working. Their thoughts and concerns about trash in their neighborhoods and streams were encouraging when we were hot and sweaty or cold and shivering. In thirty years of working to improve streams, never has there been an issue that the public was so concerned about and so wanted to succeed. Hopefully, we will not fail them.

ANACOSTIA WATERSHED TRASH REDUCTION PLAN TABLE OF CONTENTS
TABLE OF CONTENTS EXECTIVE SUMMARY CHAPTER 1 INTRODUCTION CHAPTER 2 ANACOSTIA BASIN DESCRIPTION CHAPTER 3 MONITORING DATA CHAPTER 4 BEST MANAGEMENT PRACTICES CHAPTER 5 EXISTING PROGRAMS CHAPTER 6 IMPLEMENTATION STRATEGY CHAPTER 7 IMPLEMENTATION SCHEDULE CHAPTER 8 LONGTERM MONITORING PROGRAM

ANACOSTIA WATERSHED TRASH REDUCTION PLAN EXECUTIVE SUMMARY
i
EXECUTIVE SUMMARY Background The District of Columbia is a partner in the Trash Free Potomac Watershed Treaty. The goal of the treaty is a trash free watershed by 2013. The Anacostia River, an urban tributary to the Potomac River, has a severe problem with excessive trash. This has resulted in both the District of Columbia and State of Maryland determining that pollution has impaired the quality of the river to the point that trash loads must be reduced. The two entities have agreed to use the Anacostia as a model of how to reduce trash in a river and move toward a trash free Potomac Watershed. The District Department of the Environment (DDOE) decided to undertake a systematic assessment of the types and sources of trash. This assessment is needed to develop a five year plan to make significant reductions in the amount of trash in the Anacostia River. The District of Columbia Water Quality Standards list the following provisions in 21 DCMR Chapter 11 that relate to trash in the rivers and streams: 1104.1 The surface waters of the District shall be free from substances
attributable to point or nonpoint sources discharged in amounts that do any one of the following:
(a) Settle to form objectionable deposits;
(b) Float as debris, scum, oil or other matter to form nuisances;
1104.3 Class A waters shall be free of discharges of untreated sewage, litter and
unmarked, submerged or partially submerged, man-made structures which would constitute a hazard to the users. Dry weather discharges of untreated sewage are prohibited.
1104.4 The aesthetic qualities of Class B waters shall be maintained. Pursuant to Section 303 (d) of the Federal Clean Water Act, DDOE evaluated the amount of trash in the Anacostia River and found the Anacostia River does not meet these standards. Consequently, a Total Maximum Daily Load (TMDL) must be prepared to restore the river. Anacostia Basin The Anacostia watershed is approximately 117,353 acres with the drainage area being 49% in Prince George’s County, 34% in Montgomery County, and 17% in the District of Columbia. Land use is mostly residential and forest. The watershed is 30% park and forest lands which are evenly dispersed throughout the watershed such as the National

ANACOSTIA WATERSHED TRASH REDUCTION PLAN EXECUTIVE SUMMARY ii
Park Service’s Anacostia Park and Greenbelt Park, and the US Department of Agriculture’s National Arboretum and Beltsville Agricultural Research Center. The industrial and manufacturing land use is largely confined to the tidal area of the basin such as Hickey Run, Lower Beaverdam Creek, and Indian Creek. These creek sub-watersheds contain impervious landuses as high as 80%. In the District, the Anacostia watershed is heavily urbanized. The Anacostia River watershed’s municipal separate storm sewer system (MS4) consists of 9,460 acres with 168 outfalls. The drains carry the rainwater into the streams and rivers when they discharge. The remaining areas are served by combined sewers that may overflow during rainstorms, discharging sanitary sewage, storm water, and trash to the river. In the study area shown by the figure below (Figure 1), the storm sewer areas are tan while the combined sewage overflow (CSO) areas are white. The red lines represent the storm sewers and the black lines represent the boundary of a storm sewer drainage basin.

ANACOSTIA WATERSHED TRASH REDUCTION PLAN EXECUTIVE SUMMARY
iii
Figure 1 Anacostia River Watershed Municipal Separate Storm Sewer System (MS4)

ANACOSTIA WATERSHED TRASH REDUCTION PLAN EXECUTIVE SUMMARY iv
In DC, the Anacostia basin has nine tributaries and Kingman Lake. It was divided into sub-watersheds and storm sewersheds for this study. The water quality of the Anacostia River is very poor. As a result, Total Maximum Daily Loads (TMDLs) have been calculated for twenty pollutants and assigned to the various sources that contribute those pollutants. The CSO’s are major sources of several of the pollutants. The District of Columbia Water and Sewer Authority (WASA) has developed a Long Term Control Plan (LTCP) to retrofit the CSO system, and this is now being implemented. The separate storm sewers in the District, which are regulated by an EPA permit, have also been assigned pollution load reductions which must be met. Monitoring Trash was monitored in the Anacostia River, Kingman Lake, the tributaries, various different land use transects, and by windshield counts of all of the streets in the MS4 areas. Transects were established at five locations on the main stem of the Anacostia River. Another four transects were placed at major outfalls along the shoreline of Kingman Lake and at the downstream entrance near the Northeast Boundary Sewer CSO. The transects consisted of different types of shoreline varying from mudflats to vertical seawalls. At each transect the amount and types of trash and debris in the stream channel were determined quarterly. Debris includes items such as tires, lumber, bicycles, shopping carts and furniture. Each tributary was divided into segments of approximately 500 - 1000 foot lengths and the amount and types of trash and debris in the stream channel were determined quarterly. Intermittent streams and stream segments were not monitored. Transects did not extend into the tidal zone of the tributaries.
Different types of land uses were selected for determining the amount of trash that could potentially be transported to a waterway. An attempt was made to have land use transects in all of the major basins. Transects were established and measured. Then quarterly detailed trash counts were conducted. The drainage basins of each tributary and or MS4 system were surveyed quarterly for trash on the streets that might reach the tributary. This was done by windshield survey of all of the streets quarterly. The streets were broken down into about one block or two block long segments. The monitoring team would drive along in a vehicle at about 20 mph. A person would count all of the visible trash that could be seen from the passenger side window. The visible space would be from about 10 feet from the curb of the road to a point 10-12 feet from the curb to private property. No attempt was made to identify types of trash. Only a gross count was made on one side of each street. The street

ANACOSTIA WATERSHED TRASH REDUCTION PLAN EXECUTIVE SUMMARY
v
transects under the landuse monitoring are related to the windshield surveys and can be used to adjust the data. Data Analysis In the main stem Anacostia River, trash was surveyed from upstream of the District border with Maryland (New York Avenue, NYA) down to where it joins the Potomac (Figure 2). The quantity of trash is governed by the potential of the area to trap and collect trash. Mudflats, riprap slope and tidal pools behind broken seawalls will collect large amounts of trash.
Figure 2 Anacostia River – Seasonal Variation of Total Trash
Anacostia River-Total Trash
0102030405060708090
100
NYA-MD NYA-DC Penn Ave Buzzard Pt Poplar Pt
Item
s/10
0' SummerFallWinterSpring
The largest categories of trash are plastic bags, Styrofoam products, snack wrappers (potato chip and candy bar packaging) and bottles and cans. They compose nearly 85 percent of the items (Figure 3).

ANACOSTIA WATERSHED TRASH REDUCTION PLAN EXECUTIVE SUMMARY vi
Figure 3 Anacostia River Trash Composition
Anacostia River Trash Composition
0
5
10
15
20
25
30
P. Bag
sStyr
o
F. Wrap
Bot&Cans
Paper
Debris
Other
Perc
ent
Percent
In the tributary streams, the plastic bags dominate all other categories (Figure 4). This appears to be related to the amount of brush and vegetation that will snag the bags. Bottles and cans, Styrofoam and snack wrappers are also prevalent. Paper products are not found in the streams except in very localized areas.
Figure 4 Stream Trash Composition
Streams Trash Composition
05
101520253035404550
P Bags Bot&Cans Styro Fd Wrap Paper Debris Other
Perc
ent

ANACOSTIA WATERSHED TRASH REDUCTION PLAN EXECUTIVE SUMMARY
vii
Plastic Bags in the streams doubled over the one year survey period (Figure 5). It is unclear whether this trend will continue on a long term basis.
Figure 5 Seasonal Variation of Plastic Bags in Streams
All Streams Plastic Bags
0
2000
4000
6000
8000
10000
12000
14000
16000
Summer Fall Winter Spring
Num
ber
Plastic Bags
The food wrappers increased over the study period (Figure 6).
Figure 6 All Streams Seasonal Food Wrappers
All Streams Seasonal Food Wrappers
0
1000
2000
3000
4000
5000
6000
7000
8000
Summer Fall Winter Spring
Food
Wra
pper
s

ANACOSTIA WATERSHED TRASH REDUCTION PLAN EXECUTIVE SUMMARY viii
There were not many glass bottles counted but there is a lot of broken glass (Figure 7). Even though the cans often sink, they can still be seen and identified. Plastic bottles float until they get enough sand and dirt inside to overcome their buoyancy.
Figure 7
Seasonal Variation of Total Drink Containers Found in Streams
All Streams Drink Containers
0
200
400
600
800
1000
1200
Liquo
r Bott
les
Beer B
ottles
Beer C
ans
Soft D
rink B
ottles
Soft D
rink C
ans
Water B
ottles
Sport D
rink B
ottles
Juice
Can
s
Juice
Bottles
Tota
l
SummerFallWinterSpring
The Anacostia River and Kingman Lake have about the same amount of trash per visible intertidal area. For streams, both sides and the bottom are counted. There were several fairly clean streams that had trash levels of 20 pieces per 100 feet or less. Pope Branch is an intermediately affected stream and Ft Chaplin, Ft Stanton, Watts Branch and Nash Run are heavily impacted by trash (Figure 8).

ANACOSTIA WATERSHED TRASH REDUCTION PLAN EXECUTIVE SUMMARY
ix
Figure 8 Annual Average Trash
Annual AverageTrash
020
4060
80100
120140
160
Anacos
tia
Kingman
Ft Dav
is1
Ft Dav
is2Tex
as
Ft DuP
Pope
Ft Cha
p
Ft Stan
t
Watt
sNash
Item
s/10
0'or
1000
sf
Trash
Various types of land uses were surveyed. The streets were surveyed, and were categorized as residential, commercial, or industrial. The trash from the street surveys was dominated by paper products (Figure 9).
Figure 9 Streets Trash Composition
Streets Trash Composition
05
101520
2530
3540
P Bags
Bot&Can
sStyr
o
Fd W
rapPap
er
Debris
Other
Perc
ent
%

ANACOSTIA WATERSHED TRASH REDUCTION PLAN EXECUTIVE SUMMARY x
Recreational areas were also surveyed. The buffer zone at the edges of a soccer field and a fishing area contained a lot of trash. In these areas, there was roughly the same number of glass beer bottles as beer cans. Buffer zones do a good job of trapping trash. However, the trash deteriorates the original purpose of the buffer zones which were created as wildlife habitat.
Figure 10 Seasonal Variation of Drink Containers on Land transects
Land Drink Containers
0
20
40
60
80
100
120
LiquorBot
BeerBot
BeerCan
SoftDrkBot
SoftDrkCan
WaterBot
SportDrkBot
JuiceCans
JuiceBot
Item
s
SummerFallWinterSpring
A windshield survey was conducted quarterly for each stream in an MS4 drainage basin. Trash was counted per block on one side. The windshield count achieved 85 percent accuracy when compared to detailed transect counts that were conducted on the same street. Some basins have cleaner streets than others as shown in Figure 11, but it appears that there are about 30 items per block on average for one side. In general, the residential streets had less trash than commercial streets.

ANACOSTIA WATERSHED TRASH REDUCTION PLAN EXECUTIVE SUMMARY
xi
Figure 11 Basin Trash
Basin Trash
0
10
20
30
40
50
60
Pope
FD-1FD-2
Texas
Pope M
S4
Chapli
n
Ft Dup
ont
Stckft
Watts
Nash
Ecap
Stanton
Stanton
MS4 Ely
Ft Dav
MS4
PennNay
lor
Kingman
Hickey
Item
s/bl
ock
Many different analyses were performed on the relationships between the amount of trash in a stream and the amount of trash on the streets. One problem with developing a simple relationship is that the streams are different lengths. One reason causing this is that they often originate and end in pipes. The channel roughness affects whether plastic bags and food wrappers are snagged and bottles are trapped. Data were converted to determine trash per acre in the drainage basin and then compared to average stream trash levels; however, this did not provide any valuable insight. The number of items per block as determined from the windshield survey is a good “indicator” of trash levels in a stream, but not a quantitative “predictor” (Figure 12).

ANACOSTIA WATERSHED TRASH REDUCTION PLAN EXECUTIVE SUMMARY xii
Figure 12 Stream Trash vs. Street Trash
Stream Trash vs Street Trash
0
20
40
60
80
100
120
140
160
FD-1 FD-2 Texas FtDuP
Pope FtChap
FtStant
Watts Nash
Item
s/ 1
00' o
r bl
ock
StreamStreets
The types of trash from the river were compared to the types found in the streams and on the land (Figures 13).
Figure 13 Trash Relationships
Trash Relationships
05
101520253035404550
P. Bag
sStyr
o
F. W
rap
Bot&Can
sPap
er
Debris
Other
Perc
ent River
StreamsLand
The data suggest a relationship between plastic bags and snack items and drink items. This would suggest that often when a person purchases a drink and a snack such as chips, the bag becomes litter, the drink container or cup becomes litter and the snack wrapper

ANACOSTIA WATERSHED TRASH REDUCTION PLAN EXECUTIVE SUMMARY
xiii
becomes litter. Paper products such as napkins and paper bags are common on the land but are seldom found in stream channels. Debris is constant. There is very little trash that does not have a relationship to eating or drinking. The ratio of bottles and cans found would be more uniform, but the bottles tend to be broken in the streams and there are a lot of glass fragments present in the streams. Best Management Practices There are many structural devices and management techniques available to reduce the amount of trash reaching the streams and rivers. Trash can be sorted into four components for best management practices (BMP) evaluation purposes. The first component is floatables, such as plastic drink bottles, foam cups and clamshells and woody debris which are about 15 percent of the trash. Next there are high density sinking objects such as glass bottles and aluminum beverage cans which comprise about 15 percent. Third, there is a very minor fraction of degradable objects such as paper bags and newspapers. Finally, some 70 percent of the trash that is observed in the streams is neutrally buoyant objects such as plastic bags and snack wrappers which will float under quiescent conditions while clean but are more likely to be entrained by velocity currents. Best management practices need to be able to remove all four trash components. Additionally, all other studies have found that at least 50 percent of captured material will be leaves, sticks, and twigs. Because there are 20 other total maximum daily load related pollutants that require reduction, it is more economical if a device or practice can not only remove trash but also the other pollutants. Because controlling the amount of trash that reaches a storm sewer and then discharges to a waterway is a relatively new concern, there is a significant amount of old and new technology that is available but has not been extensively tested for removing trash. The most promising and simplest technology is to place screens on the entrances to the storms sewers and use street sweepers to remove the trash and leaves that will collect there. End of the pipe structural devices have been tested in California and some were found to be effective. Low Impact Development techniques such as curb cuts can be adapted for trash removal by capturing this material in rain gardens and other pervious applications. Stormwater ponds and wetlands have been used in the District for many years to remove pollutants and they are effective. Existing Programs The MS4 permit issued to the District of Columbia by EPA, required the development of an Anacostia TMDL Implementation Plan for all of the listed pollutants. This plan was previously submitted by the District to EPA and was approved. It is a legally enforceable component of the permit. The plan relies heavily on street sweeping and catch basin cleaning. The Department of Public Works is conducting the study required by the plan to assess the need for vacuum assisted or regenerative air street sweepers which are much

ANACOSTIA WATERSHED TRASH REDUCTION PLAN EXECUTIVE SUMMARY xiv
more effective at removing pollutants from the streets than the older mechanical broom variety and the need for more frequent sweeping of more streets. As part of the retrofit of the combined sewer system, WASA achieved a 40% reduction of combined sewer overflows to the Anacostia River in September 2008, which also means that they achieved at least a 40% reduction in trash discharged from the combined system. The WASA skimmer boats are effective at removing the floatable component of trash once it has actually gotten into the river (Figure 14).
Figure 14
WASA Floatables Program
WASA Floatables Program
0
200
400
600
800
1000
1200
FY94
FY96
FY98
FY00
FY02
FY04
FY06
Tons Trash
There are five DC departments which enforce litter related regulations. In addition, there is the Clean City Coordinator who performs quarterly qualitative surveys of the neighborhoods. The data collected by this study demonstrate that the Earth Day river cleanup events sponsored by the Anacostia Watershed Society (AWS) and the Alice Ferguson Foundation (AFF) in April provide significant reductions of trash on the Anacostia River. Implementation Strategy The purpose of the implementation strategy is to lay out a plan that, when implemented, will make significant and measurable progress in achieving a trash free Anacostia River within five years. The results should be measureable in terms of less trash. The recommended plan will not only meet those objectives but exceed them.

ANACOSTIA WATERSHED TRASH REDUCTION PLAN EXECUTIVE SUMMARY
xv
Legislative Solutions The executive branch of DC government should work with the legislative branch to produce three pieces of legislation which will reduce trash not only in the Anacostia Basin, but also in Rock Creek and the Potomac River drainages. If legislation is not enacted, then the entire burden of the trash reduction will fall upon the shoulders of the WASA rate payers since rates paid through residents’ water bill for stormwater control will escalate. The legislative agenda should deal with 1) plastic bags, 2) foam cups, clamshells and plates, and 3) beverage bottles and cans. This will result in a 57% reduction of trash in the Anacostia River and a 66% reduction in the tributaries. Plastic Bags The most significant trash reductions can occur from political action. The single largest component of trash in the streams, and most likely in the river, is plastic bags. Legislation requiring convenience store, grocery and food items bags to be biodegradable or to eliminate the use of any kind of “free” bag will effectively remove 47% of the trash from the tributaries and 21 % from the main stem of the river. It is believed that the main stem number may be much greater than the data show due to the selection of the monitoring stations. A larger number of mudflat stations would most likely have produced a higher percentage of plastic bags. Alternatives to plastic bags are readily available and the data collected during this survey demonstrates that the alternatives are not a major source of trash. Paper bags such as those currently used by McDonalds and Wendy’s do not persist in the hydraulic transport from the streets and through the storms sewers to the streams. Two of the streams surveyed, Watts Branch and Ft. Stanton, are in very close proximity to these types of establishments. The McDonald’s on Watts Branch is actually on the shoreline and the only instances of their paper bags being in the stream were in the vicinity of the footbridge where it appeared that pedestrians discarded the bags right into the stream. There was a notable absence of the bags downstream, indicating that they disintegrate before being transported any appreciable distance. To confirm this, tests were conducted on paper bags which determined that disintegration begins immediately upon their getting wet. The paper within a short time simply ceases to exist as anything other than small pieces. The survey initially was designed to count the different types of plastic bags, but it was simply not feasible due to the abraded nature of the bags. While no quantitative data was compiled, it is a safe estimate that less than five percent of the bags were yard and leaf bags. Trying to remove plastic bags with treatment devices, such as grates and screens, is going to be very high maintenance due to the fact that only a few bags can quickly clog the openings thereby reducing the effectiveness of the device and causing bypasses. Using BMPs to remove plastic bags will be a long term financial burden on the rate payers. Each “free” plastic bag that becomes litter costs somebody else money to clean it up.
ANACOSTIA WATERSHED TRASH REDUCTION PLAN EXECUTIVE SUMMARY xvi
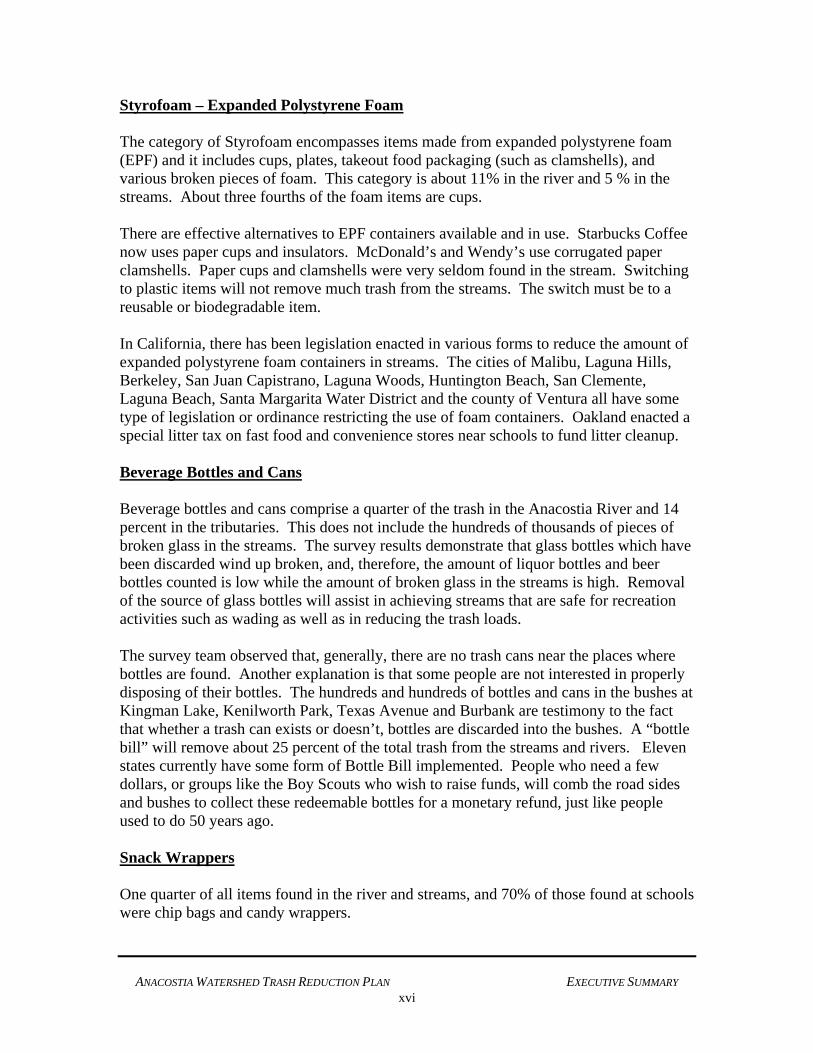
Styrofoam – Expanded Polystyrene Foam The category of Styrofoam encompasses items made from expanded polystyrene foam (EPF) and it includes cups, plates, takeout food packaging (such as clamshells), and various broken pieces of foam. This category is about 11% in the river and 5 % in the streams. About three fourths of the foam items are cups. There are effective alternatives to EPF containers available and in use. Starbucks Coffee now uses paper cups and insulators. McDonald’s and Wendy’s use corrugated paper clamshells. Paper cups and clamshells were very seldom found in the stream. Switching to plastic items will not remove much trash from the streams. The switch must be to a reusable or biodegradable item. In California, there has been legislation enacted in various forms to reduce the amount of expanded polystyrene foam containers in streams. The cities of Malibu, Laguna Hills, Berkeley, San Juan Capistrano, Laguna Woods, Huntington Beach, San Clemente, Laguna Beach, Santa Margarita Water District and the county of Ventura all have some type of legislation or ordinance restricting the use of foam containers. Oakland enacted a special litter tax on fast food and convenience stores near schools to fund litter cleanup. Beverage Bottles and Cans Beverage bottles and cans comprise a quarter of the trash in the Anacostia River and 14 percent in the tributaries. This does not include the hundreds of thousands of pieces of broken glass in the streams. The survey results demonstrate that glass bottles which have been discarded wind up broken, and, therefore, the amount of liquor bottles and beer bottles counted is low while the amount of broken glass in the streams is high. Removal of the source of glass bottles will assist in achieving streams that are safe for recreation activities such as wading as well as in reducing the trash loads. The survey team observed that, generally, there are no trash cans near the places where bottles are found. Another explanation is that some people are not interested in properly disposing of their bottles. The hundreds and hundreds of bottles and cans in the bushes at Kingman Lake, Kenilworth Park, Texas Avenue and Burbank are testimony to the fact that whether a trash can exists or doesn’t, bottles are discarded into the bushes. A “bottle bill” will remove about 25 percent of the total trash from the streams and rivers. Eleven states currently have some form of Bottle Bill implemented. People who need a few dollars, or groups like the Boy Scouts who wish to raise funds, will comb the road sides and bushes to collect these redeemable bottles for a monetary refund, just like people used to do 50 years ago. Snack Wrappers One quarter of all items found in the river and streams, and 70% of those found at schools were chip bags and candy wrappers.

ANACOSTIA WATERSHED TRASH REDUCTION PLAN EXECUTIVE SUMMARY
xvii
The estimates are that nearly 20% of the population is at risk from type II diabetes which has poor dietary habitats as a causative factor. Linked to this are high blood pressure, heart disease, obesity, high cholesterol, and gum disease. The types of trash that are found on the land and in the streams indicate that the local health departments have lost the battle with the TV advertising of candy and chips and soda and beer. The data show that the 70% of the trash at schools is snack wrappers. This is where the hearts and minds and bodies are lost. The District of Columbia Public Schools system (DCPS) needs to remove these materials from the schools. Schools should be a place to learn important skills for life such as good dietary habits. The Department of Health and DCPS need to deal with the children’s health, and in so doing, will improve the quality of the environment. The schools need to ensure that the children have food and snacks that are beneficial. The price to the taxpayer of later life health issues for people who suffer from these ailments is not estimated here, but clearly the number is enormous. Consideration should be given to a special litter tax on these types of items and the funds used to pay the costs of cleaning them up. Total Legislative Package A total legislative package that deals with plastic bags, EPF and drink bottles and cans has the ability to remove collectively 21%, 11%, and 25% of the items from the River. This is 57 % of the total Anacostia River trash. In the tributaries, the removal would be 47 %, 5 %, and 14% for a total removal of 66%. This is at no cost to the rate payers. Removing this material through other means will require capital expenditures and ongoing operation and maintenance costs to be paid for by the rate payers. Preliminary estimates are that it will cost DC rate payers an ADDITIONAL $32,400,000 to clean up other people’s poor disposal habits in the Anacostia basin alone. If the citizens in the other parts of the District wish to have cleaner streets, neighborhoods and streams, then additional costs will be incurred. These costs will be on top of the millions already being spent. Because a TMDL for trash is being created, which will be accompanied by a regulatory requirement in the EPA-issued stormwater permit that contains severe monetary penalties for non-compliance, there is no way to avoid the additional costs. Penalties under the Federal Clean Water Act can be up to $32,500 per day per violation. A violation would occur with each rainfall event and it rains about 100 days per year in DC. A year of non-compliance would cost $32,500,000, which will cost the same as compliance. The benefits of having clean neighborhoods are not weighed in this report which details how to achieve clean streams; but, it is believed that people would like to live in clean neighborhoods. New Programs The only new program recommended in this report is the development of a stream maintenance program. At one time there was a stream a maintenance program whose

ANACOSTIA WATERSHED TRASH REDUCTION PLAN EXECUTIVE SUMMARY xviii
function was to remove log jams and blockages. Many of the existing steam structures are in very poor shape, and the entrances to pipes are clogged because there is no agency responsible for maintaining them. This effort involves removing debris from streams, cutting up fallen trees and removing debris dams from inlet structures. The program was housed in the Department of Public Works when it existed. Enhancements to Existing Programs The Enhancements Package to the MS4 permit is a beneficial group of activities and programs and needs to be implemented. DC Water and Sewer Authority (WASA) It is recommended that DC Water and Sewer Authority (WASA) investigate the quantity of trash being discharged from CSOs. New York City uses floating skirted booms around the outfalls and skimmer boats to clean up the trash after rainfall events trigger CSOs, and WASA could adopt the same type of program since they already have skimmer boats and are experienced working in and around the booms at the railroad bridge. The current schedule is to clean all catch basin once a year. WASA should commission a study to determine whether some catch basins fill up more quickly, and then clean those out more frequently. Clean City Coordinator The office should build upon its existing Adopt a Block and Adopt a Storm Drain programs run through the Clean City Coordinator. The Cleanliness Surveys should be modified to be more quantitative. Actual counts of trash per block should be made and recorded. This could be a very useful tool in preventing litter from reaching the streams. District law requires property owners to sweep or keep clean the area in front of their homes or businesses, from the curb line out 18 inches into the roadway. The Clean City Coordinator should bring together the management of the District’s Departments of Transportation (DDOT), Consumer and Regulatory Affairs (DCRA), Environment (DDOE), Health (DOH) and Public Works (DPW) to consider developing common guidelines and standards for enforcing litter and trash regulations. The principal agencies should meet and agree to a “standard” for their inspectors. Such a standard might be 10 pieces of trash per 1000 square feet or 100 lineal feet. Agreement should be reached on enforcement actions to be taken once the standard is violated. Uniformity is not the desired goal. Less trash is what is desired. There should be a discussion of any areas at certain types of facilities where there is not sufficient enforcement. Gaps in enforcement should be eliminated.

ANACOSTIA WATERSHED TRASH REDUCTION PLAN EXECUTIVE SUMMARY
xix
District Department of the Environment (DDOE) The erosion control and stormwater regulations should require that all BMPs have trash and litter controls included. The design manual is currently being revised to include more Low Impact Development techniques. The BMPs in the manuals need to be reviewed to determine if the BMPs can be enhanced to remove even more trash. Inspectors should begin checking for construction debris and litter that can escape a site and get to a storm drain or stream. DDOE should review the water quality catch basin design and modify it as needed to capture more trash. This modified design should be piloted in a few high trash locations. DDOE needs to adopt a final regulatory definition of trash that can be used for design purposes for such things as mesh size of grates and screens. Trash monitoring should be conducted quarterly on the Anacostia River and a few of the larger tributaries. The DDOE is the water quality certification agency for all NPDES permits. They should “conditionally” certify all permits with a condition that the permittee develop and submit for approval a trash discharge elimination plan for the facility. Since trash is now listed as a pollutant, it is easy to legally require the reduction of the discharge of trash along with other pollutants. Department of Transportation (DOT) The Department of Transportation (DDOT) needs to review their policies and design criteria concerning grate spacing and reduce it to the final dimensions that are determined in the TMDLs. DDOT needs to retrofit their bridges to eliminate trash discharges to the river from bridge stormwater runoff. DDOT needs to make installing water quality catch basins a component of a major street work, not just reconstruction projects. An ideal time to install LID BMPs is during construction and replacement of sidewalks and of curbs & gutters. There are street endings and street “T”s where DDOT has allowed water to run off of roads in an uncontrolled manner, which causes severe gully erosion as well as trash to be transported overland.
ANACOSTIA WATERSHED TRASH REDUCTION PLAN EXECUTIVE SUMMARY xx
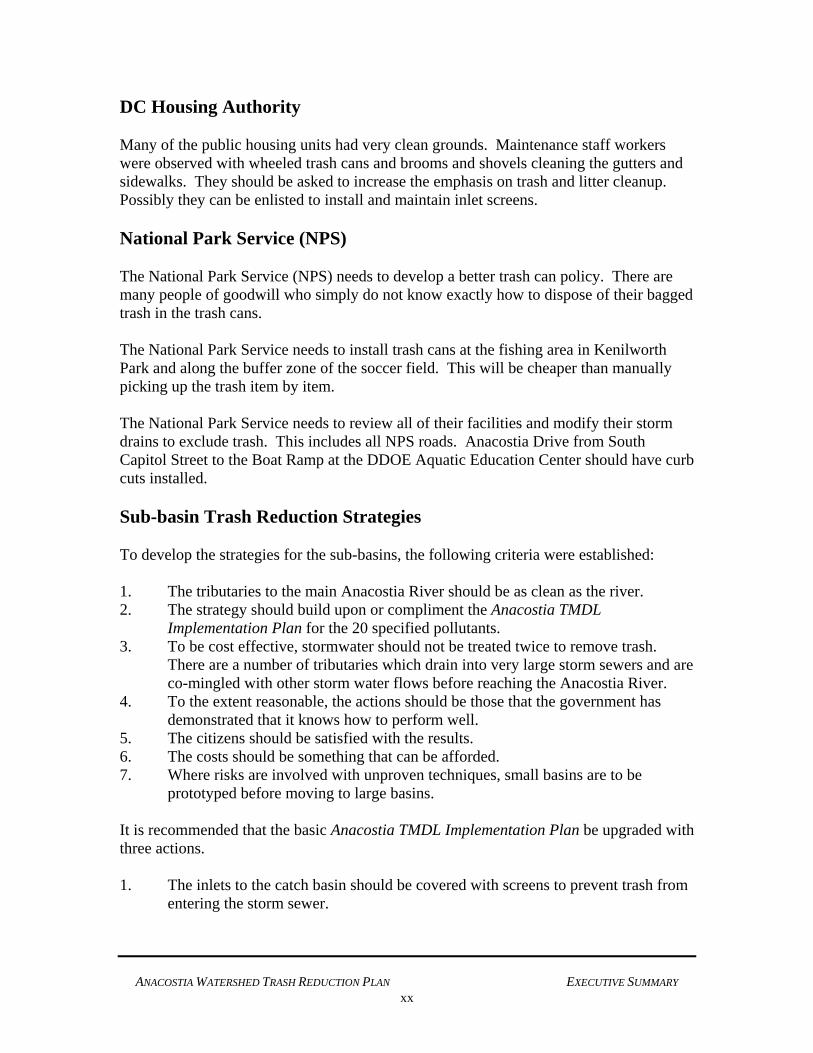
DC Housing Authority Many of the public housing units had very clean grounds. Maintenance staff workers were observed with wheeled trash cans and brooms and shovels cleaning the gutters and sidewalks. They should be asked to increase the emphasis on trash and litter cleanup. Possibly they can be enlisted to install and maintain inlet screens. National Park Service (NPS) The National Park Service (NPS) needs to develop a better trash can policy. There are many people of goodwill who simply do not know exactly how to dispose of their bagged trash in the trash cans. The National Park Service needs to install trash cans at the fishing area in Kenilworth Park and along the buffer zone of the soccer field. This will be cheaper than manually picking up the trash item by item. The National Park Service needs to review all of their facilities and modify their storm drains to exclude trash. This includes all NPS roads. Anacostia Drive from South Capitol Street to the Boat Ramp at the DDOE Aquatic Education Center should have curb cuts installed. Sub-basin Trash Reduction Strategies To develop the strategies for the sub-basins, the following criteria were established: 1. The tributaries to the main Anacostia River should be as clean as the river. 2. The strategy should build upon or compliment the Anacostia TMDL
Implementation Plan for the 20 specified pollutants. 3. To be cost effective, stormwater should not be treated twice to remove trash.
There are a number of tributaries which drain into very large storm sewers and are co-mingled with other storm water flows before reaching the Anacostia River.
4. To the extent reasonable, the actions should be those that the government has demonstrated that it knows how to perform well.
5. The citizens should be satisfied with the results. 6. The costs should be something that can be afforded. 7. Where risks are involved with unproven techniques, small basins are to be
prototyped before moving to large basins. It is recommended that the basic Anacostia TMDL Implementation Plan be upgraded with three actions. 1. The inlets to the catch basin should be covered with screens to prevent trash from
entering the storm sewer.
ANACOSTIA WATERSHED TRASH REDUCTION PLAN EXECUTIVE SUMMARY
xxi
2. High efficiency street sweepers should be purchased by DPW and the streets swept weekly to keep the screens clear.
3. The catch basins should be cleaned by WASA at a frequency that maximizes pollutant removal efficiency.
The basins for which these actions are the recommended are as follows;
1. Ft Davis 1 & 2 2. Watts Branch 3. Texas Avenue 4. Fort Stanton 5. Nash Run 6. Pope Branch 7. Ft. DuPont 8. Ft. Chaplin 9. Part of Kingman Lake drainage
End of pipe solutions adjacent to the Anacostia River which utilize constructed wetland systems are recommended for the following areas. It is recognized that the wetland system may be more expensive than screening and sweeping, but the environmental and habitat considerations are important to the restoration of the river itself. As has been noted throughout the report, wildlife is trying to colonize a lot of marginal areas.
1. Part of Kingman Lake MS4 Drainage (M & Maryland Avenue area) 2. Naylor MS4 3. Stickfoot MS4 4. Ely MS4
Schedule The five year schedule outlined below is developed following the concept of beginning work on the tributaries which are easiest to clean up using the easiest actions to accomplish. The more complicated and expensive actions are placed later in the schedule. Existing programs such as the Hickey Run BMP are compatible as currently planned. DPW will need to acquire more street sweepers, as the area and frequency of sweeping increases. Year 1 - 2009 Ft DuPont A. Screen catch basins B. Sweep Streets C. Curb Cuts D. Clean up debris

ANACOSTIA WATERSHED TRASH REDUCTION PLAN EXECUTIVE SUMMARY xxii
E. Fence F. Repair outfall Ft Davis 1 A. Screen catch basins B. Sweep Streets C. Curb Cuts D. Clean trash rack Ft Davis 2 A. Screen catch basins B. Sweep streets C. Curb Cuts D. Remove tires Nash Run
A. Install temporary netting system to protect the Kenilworth Aquatic Gardens
CSO Outfall #006 A. LID the MS4 Unscreened CSO Outfalls A. Conduct study of trash discharges and boom and skim WASA to study catch basin cleaning and performance Year 2- 2010 Ft Chaplin A. Screen catch basins B. Sweep streets C. Curb Cuts D. Clean trash rack Pope Branch and Pope MS4 A. Implement Restoration plan B. Screen catch basins C. Sweep streets D. Curb Cuts E. Clean trash rack Hickey Run BMP A. Proceed as planned B. Evaluate untreated outfalls

ANACOSTIA WATERSHED TRASH REDUCTION PLAN EXECUTIVE SUMMARY
xxiii
Kingman Lake A. Feasibility study for wetland at M and Maryland Year 3 - 2011 Texas Avenue and Pennsylvania Avenue A. Screen catch basins B. Sweep streets C. Curb Cuts D. Relocate storm sewer and treat. E. Clean Trash Rack Nash A. Screen catch basins B. Sweep streets Ft Stanton and MS4 A. Screen catch basins B. Sweep streets Kingman Lake A. Screen catch basins B Sweep streets C. Install LID and daylight for the M Street & Maryland Avenue area Ely MS4, Stickfoot MS4 and Naylor.
A. Initiate planning and design for wetlands. Year 4 -2012 Watts Branch A. Screen catch basins B. Sweep streets C. LID East Capitol MS4 A. Screen catch basins B. Sweep streets C. LID Fort Davis MS4 A. Screen catch basins B. Sweep streets

ANACOSTIA WATERSHED TRASH REDUCTION PLAN EXECUTIVE SUMMARY xxiv
Year 5 - 2013 Ely, Stickfoot and Naylor MS4’s A. Construction of wetlands. Costs The present cost of a trash free Anacostia River is about $32.4 million (Table 1). The schedule recommended is not a constant average expenditure. Instead, it is based upon working in small drainages, and monitoring to ensure that the selected methods will work under the conditions found in the District of Columbia. If a more constant expenditure is desired, then some of the more expensive and larger basins can be moved up in the schedule. The costs can be greatly reduced with legislative solutions for plastic bags, Styrofoam and beverage cans and bottles.
Table 1 Cost Table: Basin Screen and Sweep and Wetland Creation
Basin S&S Wetland Pope $940,903 FD-1 308,530 FD-2 158,004 Texas 622,043 Pope MS4 310,674 Chaplin 954,070 Ft DuPont 281,690 Stickfoot $3,887,967Watts 6,233,968 Nash 1,959,372 E Cap MS4 5,868,800 Stanton 344,110 StantonMS4 861,877 Ely 2,704,673Ft Davis MS4 947,298 Penn 1,119,542 Kingman 423,926 557,838Naylor 3,887,967Subtotal $21,334,811 $11,038,448 Total = $32,373,259
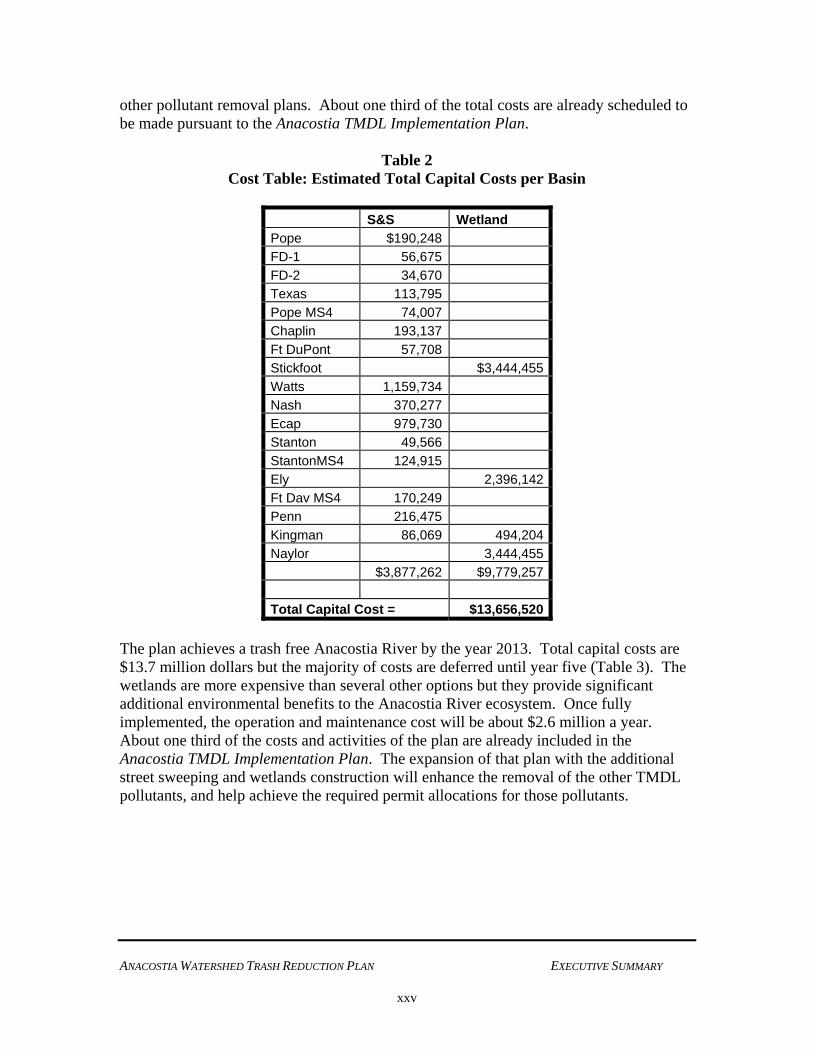
Estimated total capital costs per basin are shown below in Table 2. Construction of wetlands is expensive on a per acre basis. The plan has a capital cost of $13.7 M which is beyond the fundable range of the storm water fee revenue that is produced. The costs can be reduced if the legislative packages are implemented. Costs may be reduced if the wetlands are cost shared with the Corp of Engineers. It is compatible and complements
ANACOSTIA WATERSHED TRASH REDUCTION PLAN EXECUTIVE SUMMARY
xxv
other pollutant removal plans. About one third of the total costs are already scheduled to be made pursuant to the Anacostia TMDL Implementation Plan.
Table 2 Cost Table: Estimated Total Capital Costs per Basin
S&S Wetland Pope $190,248 FD-1 56,675 FD-2 34,670 Texas 113,795 Pope MS4 74,007 Chaplin 193,137 Ft DuPont 57,708 Stickfoot $3,444,455Watts 1,159,734 Nash 370,277 Ecap 979,730 Stanton 49,566 StantonMS4 124,915 Ely 2,396,142Ft Dav MS4 170,249 Penn 216,475 Kingman 86,069 494,204Naylor 3,444,455 $3,877,262 $9,779,257 Total Capital Cost = $13,656,520
The plan achieves a trash free Anacostia River by the year 2013. Total capital costs are $13.7 million dollars but the majority of costs are deferred until year five (Table 3). The wetlands are more expensive than several other options but they provide significant additional environmental benefits to the Anacostia River ecosystem. Once fully implemented, the operation and maintenance cost will be about $2.6 million a year. About one third of the costs and activities of the plan are already included in the Anacostia TMDL Implementation Plan. The expansion of that plan with the additional street sweeping and wetlands construction will enhance the removal of the other TMDL pollutants, and help achieve the required permit allocations for those pollutants.

ANACOSTIA WATERSHED TRASH REDUCTION PLAN EXECUTIVE SUMMARY xxvi
Table 3 Cost Table: Capital Costs by Year
Capital Cost Year 1 $149,054Year 2 $457,393Year 3 $1,455,305Year 4 $2,309,714Year 5 $9,285,053Total $13,656,520
As mentioned previously, the plan has a moderate capital cost and a high O&M cost. A high capital and low O&M cost plan can be used, but it leaves the Anacostia River clean and the neighborhoods dirty. The recommended plan achieves a beautiful District of Columbia for the citizens at home and down by the river. Long-Term Monitoring Program A long-term monitoring program will be necessary to document improvements achieved by the trash reduction implementation plan. A simplified version of the monitoring conducting for this study is recommended. The data collected using the simplified plan, including the composition of trash, should be accurate enough to help DOE prioritize resources and chose the institutional and structural trash controls for implementation. The recommended stations to be monitored are:
1. Anacostia – Mudflat above New York Avenue Bridge 2. Anacostia – Poplar Point 3. Kingman Lake – Below Benning Road Bridge 4. Fort Stanton – From end of the stream at the grate to 100 feet upstream 5. Ft Dupont - Minnesota Avenue to 100 ft down stream 6. Ft Davis 1 - From grate to 100 feet upstream 7. Texas Avenue - From grate to 100 feet upstream 8. Pope- From grate to 100 feet upstream 9. Nash - From Anacostia Drive to 100 feet upstream 10. Watts - From the foot bridge between Jay Street and Deanne Avenue in
Kenilworth Park to a point 100 ft downstream. 11. Ft Chaplin - From grate at C Street to 100 feet upstream
Once a trash reduction plan, including institutional and structural controls, has been implemented in a tributary drainage basin, the tributary should be cleaned up and then monitored to insure that there are no uncontrolled sources remaining.