An updated analysis of homogeneous temperature data at ...
18
Australian Meteorological and Oceanographic Journal 63 (2013) 285–302 285 An updated analysis of homogeneous temperature data at Pacific Island stations David A. Jones, Dean A. Collins 1 , Simon McGree, Blair Trewin, Eden Skilling, How- ard Diamond, Ofa Fa’anunu, David Hiriasia, Sébastien Hugony, Rod Hutchinson, Kasis Inape, Lee Jacklick, Philip Malsale, Terencio Moniz, Maria Ngemaes, Alan Porteous, Sunny Seuseu, Lloyd Tahani, Franklin Teimitsi, Ueneta Toorua, Maarametua Vaiimene, Varanisese Vuniyayawa and Hilia Vavae Pacific Climate Change Science Program – http://pacificclimatechangescience.org (Manuscript received July 2012; revised November 2012) In this paper we report on the development of a new homogeneous dataset for Pacific Island station temperatures, and the variability and change that these data show. We have worked closely with meteorological services in the Pacific and East Timor to collate and rehabilitate historical climate records, incorporating homoge- neity assessment and adjustment where appropriate to produce reliable analyses of temperature trends. Overall, these homogeneity adjustments create no systematic bias compared to the raw data since the early 1960s, but improve both spatial and temporal consistency at the individual station level for both variability and trends. The updated homogeneous records indicate that mean temperatures have in- creased at all available Pacific island stations over 1961–2010, with rates rang- ing from +0.04 to +0.33 ºC/decade, across the network as a whole. The strongest warming trends are found in Papua New Guinea and French Polynesia, while none of the homogeneous station records show cooling over the past 70, 50 or 30 years. Trends in maximum and minimum temperatures are very similar to those of mean temperature at most stations, apart from in Fiji, Tonga and Niue where there is a tendency for greater warming for maximum temperatures. The amount of warming in the wet and dry seasons is also similar at most stations, although stations in Fiji, Tonga and Niue display more warming during the wet season. A simple regional mean of Pacific island series shows a trend of +0.16 °C/de- cade over 1961–2010 and indicates that 2010 was the warmest year on record av- eraged across the stations available at time of analysis. This regional mean station series compares well with a regional mean series extracted from a global gridded dataset for the last 50 years. Overall, the warming in Pacific Island temperature records over the past half-century is consistent with that expected from human- induced global warming and is large relative to natural interannual variability as- sociated with factors such as the El Niño-Southern Oscillation. Introduction Inhabitants of small islands are amongst the most vulnerable to climate change, with long-term climate change posing threats to agriculture, water supplies, health, livelihoods and even the existence of small island countries (UNFCCC 2005, Mimura et al. 2007). It is therefore important to understand the range of climate variability experienced in the past to help identify potential adaptation options, as well as provide context for the interpretation of projected climate changes for the future. Recognising the vulnerability of smaller countries in the western Pacific to climate change, the Australian government established a program of climate research called the Pacific Climate Change Science Program (PCCSP 2 ) to meet high- priority science needs to support climate change adaptation 2 The PCCSP has subsequently moved under a new program of work called the Pacific-Australia Climate Change Science and Adaptation Plan- ning Program. The majority of the work reported in this paper was fund- ed through the PCCSP. 1 Deceased, date of death 9/11/2011. Corresponding author address: David Jones, Bureau of Meteorology, National Climate Centre, GPO Box 1289 Melbourne, Victoria 3001. Email: [email protected]
Transcript of An updated analysis of homogeneous temperature data at ...

Australian Meteorological and Oceanographic Journal 63 (2013) 285–302
285
An updated analysis of homogeneous temperature data at Pacific Island stations
David A. Jones, Dean A. Collins1 , Simon McGree, Blair Trewin, Eden Skilling, How-ard Diamond, Ofa Fa’anunu, David Hiriasia, Sébastien Hugony, Rod Hutchinson, Kasis
Inape, Lee Jacklick, Philip Malsale, Terencio Moniz, Maria Ngemaes, Alan Porteous, Sunny Seuseu, Lloyd Tahani, Franklin Teimitsi, Ueneta Toorua, Maarametua Vaiimene,
Varanisese Vuniyayawa and Hilia Vavae Pacific Climate Change Science Program – http://pacificclimatechangescience.org
(Manuscript received July 2012; revised November 2012)
In this paper we report on the development of a new homogeneous dataset for Pacific Island station temperatures, and the variability and change that these data show. We have worked closely with meteorological services in the Pacific and East Timor to collate and rehabilitate historical climate records, incorporating homoge-neity assessment and adjustment where appropriate to produce reliable analyses of temperature trends. Overall, these homogeneity adjustments create no systematic bias compared to the raw data since the early 1960s, but improve both spatial and temporal consistency at the individual station level for both variability and trends.
The updated homogeneous records indicate that mean temperatures have in-creased at all available Pacific island stations over 1961–2010, with rates rang-ing from +0.04 to +0.33 ºC/decade, across the network as a whole. The strongest warming trends are found in Papua New Guinea and French Polynesia, while none of the homogeneous station records show cooling over the past 70, 50 or 30 years. Trends in maximum and minimum temperatures are very similar to those of mean temperature at most stations, apart from in Fiji, Tonga and Niue where there is a tendency for greater warming for maximum temperatures. The amount of warming in the wet and dry seasons is also similar at most stations, although stations in Fiji, Tonga and Niue display more warming during the wet season.
A simple regional mean of Pacific island series shows a trend of +0.16 °C/de-cade over 1961–2010 and indicates that 2010 was the warmest year on record av-eraged across the stations available at time of analysis. This regional mean station series compares well with a regional mean series extracted from a global gridded dataset for the last 50 years. Overall, the warming in Pacific Island temperature records over the past half-century is consistent with that expected from human-induced global warming and is large relative to natural interannual variability as-sociated with factors such as the El Niño-Southern Oscillation.
Introduction
Inhabitants of small islands are amongst the most vulnerable to climate change, with long-term climate change posing threats to agriculture, water supplies, health, livelihoods and even the existence of small island countries (UNFCCC 2005, Mimura et al. 2007). It is therefore important to understand the range of climate variability experienced in the past to
help identify potential adaptation options, as well as provide context for the interpretation of projected climate changes for the future.
Recognising the vulnerability of smaller countries in the western Pacific to climate change, the Australian government established a program of climate research called the Pacific Climate Change Science Program (PCCSP2) to meet high-priority science needs to support climate change adaptation
2The PCCSP has subsequently moved under a new program of work called the Pacific-Australia Climate Change Science and Adaptation Plan-ning Program. The majority of the work reported in this paper was fund-ed through the PCCSP.
1Deceased, date of death 9/11/2011.
Corresponding author address: David Jones, Bureau of Meteorology, National Climate Centre, GPO Box 1289 Melbourne, Victoria 3001. Email: [email protected]

286 Australian Meteorological and Oceanographic Journal 63:2 June 2013
(e.g. Holmes 1877, 1881) and were often detailed and of good quality. The establishment of the South-West Pacific as the fifth region of the International Meteorological Organization in 1937, and the Second World War, prompted further expansion of observation networks from the early 1940s onwards. In the following decades, observation and forecasting needs for military and civil aviation, weather forecasting, tropical cyclone warnings and further economic activity (e.g. agriculture, forestry, mining and tourism) provided the main impetus for network development (Krishna 2009).
In recent decades, the observation of Pacific Ocean temperatures has benefited from the deployment of numerous international observation systems, such as arrays of moored buoys, drifting buoys, and Argo ocean profiling floats. These in situ observations are complemented by extensive satellite observations of sea-surface temperature (SST) which are now available at spatial scales of tens of kilometres and at daily intervals (e.g. Reynolds et al. 2007) as well as observations of the free atmosphere through, for example, GPS profiles and tropospheric temperatures from microwave sounding units. These systems have greatly enhanced the monitoring of climate variability and change in the Pacific, and have contributed to improved understanding of the underpinning physics governing the climate of the region (e.g. Sen Gupta and McNeil 2012).
Despite the increasing diversity of data types, land-based observation stations provide the longest available instrumental records of temperature and have clearer relevance for climate change over land where people live and most economic activity is undertaken. Consequently, the analysis of multi-decadal temperature trends remains reliant
in vulnerable countries in the region. Partner countries to this science program included the Cook Islands, East Timor, Federated States of Micronesia, Fiji, Kiribati, Marshall Islands, Nauru, Niue, Palau, Papua New Guinea, Samoa, Solomon Islands, Tonga, Tuvalu and Vanuatu (Fig. 1). We subsequently refer to these 15 countries that were formally part of the PCCSP as the ‘partner countries’, noting that a number of additional countries have also supplied data and expertise including New Zealand, the United States and Australia. The PCCSP sought to improve the understanding of past and future climate change in the western Pacific, as well as build local capacity through the provision of education, training and awareness of climate change science more generally (Power et al. 2011, Australian Bureau of Meteorology and CSIRO 2011).
A primary aim of this particular study is to improve the security and accessibility of historical temperature records and to analyse long-term variability and trends. The results described here are based on updated and improved temperature records developed through collaboration between scientists from the national meteorological services in the region.
Historical temperature observations in the Pacific region and data availability The Pacific region has a long history of in situ surface observations which has resulted in a wealth of information for defining climate variability and trends. The earliest known climate observations in the Pacific began in 1851 at Malua, Samoa (Turner 1861) and in 1861 at Levuka, Fiji (Smythe 1864). Such observations were usually taken out of meteorological interest by individual European settlers
Fig. 1. Map showing the location of the 15 Pacific Island countries and East Timor providing temperature data for this study.

Jones et al.: An updated analysis of homogeneous temperature data at Pacific Island stations 287
we will show), they have clear impacts at the station and even national scale. Most of the data used in this study have been obtained from the national meteorological services of the Pacific Island countries. For several stations records have been extended back in time with data in colonial and international data archives.
In many cases the amount of available hardcopy data is currently much greater than the amount in digital form (Australian Bureau of Meteorology and CSIRO 2011) meaning that current analyses are incomplete. In addition, the earliest observation summaries from the region were often sent to the home country of previous administrations, and/or published elsewhere (e.g. in Australia and New Zealand). A pressing issue is to determine how much of this historical data remains in colonial archives in paper formats and how to add this to the national and international archives used in studies such as this (Page et al. 2004). The search for digitised and hardcopy climate data records from the Pacific region remains ongoing, and a focus of future work for the authors as well as international partners such as through the Atmospheric Circulation Reconstructions over the Earth project (Allan et al. 2011). The authors of this paper are now collaborating closely to progress many of these issues, with activities to digitise outstanding records, introduce new data management practices and to support infrastructure investment more generally in the region.
Previous studies of Pacific temperature station trendsThe study of temperature trends in the Pacific is not new. Previous scientific studies have used in situ temperature data to show that substantial warming occurred across the Pacific region during the later half of the twentieth century (Salinger 1995, Folland et al. 2003). To describe the regional variations in this warming, Salinger (1995), followed by Folland et al. (2003), divided the region into four distinct zones according to the main climatological features of the South Pacific. In the southeast trades region (defined as all stations located in the sub-tropics to the southwest of the South Pacific Convergence Zone (SPCZ) in the southeast trade wind belt) annual temperatures were found to have increased significantly but at a lower rate than for the south Pacific as a whole. For an extensive central Pacific region (all stations located between the Intertropical Convergence Zone (ITCZ) and SPCZ in an area of divergent easterly winds) warming was determined to be slightly less than for the other regions. In a New Zealand region (defined as a large southern area including Campbell Island, New Zealand, Chatham Islands and Nuku’alofa in southern Tonga) mean temperature was found to have warmed at a rate comparable to the global average. In a region close to where the SPCZ merges with the ITCZ (western Kiribati and Tuvalu) significant warming was also found.
As the impacts of warming are often felt in the tails of the maximum and minimum temperature distributions, other studies have focused on changes in extreme daily temperatures, rather than means. Manton et al. (2001)
on these important records (e.g. Trewin 2013). Station data also provide valuable baseline data for newer observation systems.
Unfortunately, there has been a degradation of climate observation networks in most Pacific Island countries since the 1980s (Basher et al. 1990, Brook et al. 1991). Many long-term stations have closed and numerous quality problems have crept into climate records, largely due to an ongoing lack of resources and training, difficult access to remote stations, and intermittent supplies of equipment and parts. SPREP (2001) assessed Pacific climate stations against key climate monitoring principles (Karl et al. 1995) and found these to be generally poorly met. Comparison observations for changes in location and instrumentation are generally not taken, station metadata is often not recorded and rarely available electronically, homogeneity assessments are not routine, instrument exposures can be poor, and instruments are often substandard, missing or faulty. While similar problems are evident in many parts of the world, they appear to be quite acute in the Pacific region for reasons described previously.
Attempts to shore up the Pacific surface observation networks with automated systems have had mixed success. For example, nine automatic weather stations (AWSs) were installed in Fiji in the 1990s primarily for weather forecasting operations. Six of these replaced manual stations where three-hourly observations had been previously conducted for several decades. The AWSs initially worked well for real-time observations. However, with time, data transmission and sensor problems arose which could not be fully rectified. As data loggers were not included when the AWSs were first installed, data was lost when transmission failed. Manual daily observations have resumed at key sites several years later to compensate for missing data and verify AWS recordings. Government funding has recently allowed the Fiji Meteorological Service to replace four of the nine AWSs (with data loggers added) with three to be installed over 2012–13.
Pacific Islands observed station data is available from several sources. Within the region, data is typically managed by the local national meteorological services. Digital and paper records (mainly pre-independence) are also available in former colonial meteorological and non-meteorological archives (New Zealand, Australia, UK and USA). More recently a substantial proportion of climate records from PCCSP partner countries have been transmitted internationally (through SYNOP and CLIMAT electronic messages) and are available via the National Oceanic and Atmospheric Administration (NOAA) in the USA. It is also worth mentioning that international archives including those in New Zealand and Australia do not cover the full range of stations available or the complete record length. Reconciliation between multiple sources of data is a common issue in regional or global-scale datasets (e.g. Brohan et al. 2006). While these data issues are unlikely to impact the analysis of climate change in a gross sense (as
288 Australian Meteorological and Oceanographic Journal 63:2 June 2013
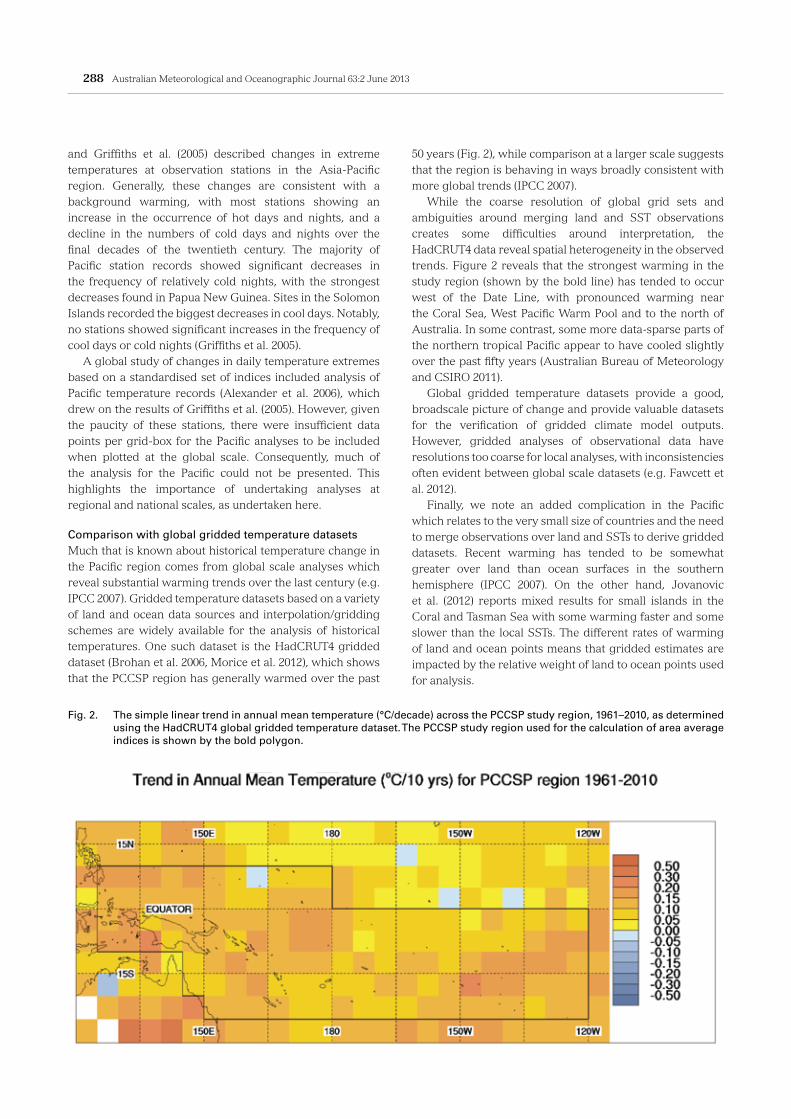
50 years (Fig. 2), while comparison at a larger scale suggests that the region is behaving in ways broadly consistent with more global trends (IPCC 2007).
While the coarse resolution of global grid sets and ambiguities around merging land and SST observations creates some difficulties around interpretation, the HadCRUT4 data reveal spatial heterogeneity in the observed trends. Figure 2 reveals that the strongest warming in the study region (shown by the bold line) has tended to occur west of the Date Line, with pronounced warming near the Coral Sea, West Pacific Warm Pool and to the north of Australia. In some contrast, some more data-sparse parts of the northern tropical Pacific appear to have cooled slightly over the past fifty years (Australian Bureau of Meteorology and CSIRO 2011).
Global gridded temperature datasets provide a good, broadscale picture of change and provide valuable datasets for the verification of gridded climate model outputs. However, gridded analyses of observational data have resolutions too coarse for local analyses, with inconsistencies often evident between global scale datasets (e.g. Fawcett et al. 2012).
Finally, we note an added complication in the Pacific which relates to the very small size of countries and the need to merge observations over land and SSTs to derive gridded datasets. Recent warming has tended to be somewhat greater over land than ocean surfaces in the southern hemisphere (IPCC 2007). On the other hand, Jovanovic et al. (2012) reports mixed results for small islands in the Coral and Tasman Sea with some warming faster and some slower than the local SSTs. The different rates of warming of land and ocean points means that gridded estimates are impacted by the relative weight of land to ocean points used for analysis.
and Griffiths et al. (2005) described changes in extreme temperatures at observation stations in the Asia-Pacific region. Generally, these changes are consistent with a background warming, with most stations showing an increase in the occurrence of hot days and nights, and a decline in the numbers of cold days and nights over the final decades of the twentieth century. The majority of Pacific station records showed significant decreases in the frequency of relatively cold nights, with the strongest decreases found in Papua New Guinea. Sites in the Solomon Islands recorded the biggest decreases in cool days. Notably, no stations showed significant increases in the frequency of cool days or cold nights (Griffiths et al. 2005).
A global study of changes in daily temperature extremes based on a standardised set of indices included analysis of Pacific temperature records (Alexander et al. 2006), which drew on the results of Griffiths et al. (2005). However, given the paucity of these stations, there were insufficient data points per grid-box for the Pacific analyses to be included when plotted at the global scale. Consequently, much of the analysis for the Pacific could not be presented. This highlights the importance of undertaking analyses at regional and national scales, as undertaken here.
Comparison with global gridded temperature datasetsMuch that is known about historical temperature change in the Pacific region comes from global scale analyses which reveal substantial warming trends over the last century (e.g. IPCC 2007). Gridded temperature datasets based on a variety of land and ocean data sources and interpolation/gridding schemes are widely available for the analysis of historical temperatures. One such dataset is the HadCRUT4 gridded dataset (Brohan et al. 2006, Morice et al. 2012), which shows that the PCCSP region has generally warmed over the past
Fig. 2. The simple linear trend in annual mean temperature (°C/decade) across the PCCSP study region, 1961–2010, as determined using the HadCRUT4 global gridded temperature dataset. The PCCSP study region used for the calculation of area average indices is shown by the bold polygon.

Jones et al.: An updated analysis of homogeneous temperature data at Pacific Island stations 289
Homogeneity assessment and adjustmentThe raw data from the Pacific Island countries was analysed for trends and variability, revealing numerous local inhomogeneities and artificial shifts and biases over time, consistent with global experience (e.g. Trewin 2010). Common sources of inhomogeneity in the temperature records included shifts in site location, changes to exposure, instrumentation and observation practice. Urbanisation of the surrounding environment is another source of artificial warming bias in temperature records for many parts of the world, but is not such an issue for the relatively small population centres in the Pacific, particularly given the location of many sites away from major towns. We note that there is very little difference between day and night temperature trends, and between SST data and our station data which we show later, suggesting that urban heating is minor or absent in our data.
Scientific rigour requires that long climate records be tested and, if necessary, adjusted for inhomogeneities. The creation of a homogenous climate record allows the calculation of meaningful trends and enables data from any time in the series to be directly compared to data from any other point in time. The preparation of high-quality datasets requires the detection of artificial shifts in data (‘detection’), followed by corrections (‘homogenisation’) making a two part process. Trewin (2013) provides a recent detailed discussion of homogenisation, with a focus on daily datasets for Australia, while Menne et al. (2010) describe recent experience for the US.
To develop the homogeneous datasets used here, each data series was initially inspected visually to assess its suitability for homogenisation. Some records were considered too short, incomplete or of insufficient quality to produce a viable homogeneous record and were subsequently removed from further analysis. In some cases the earliest part of the raw data record was not included in the homogeneous version to avoid data considered beyond rehabilitation (e.g. too numerous gaps, spikes or obvious errors). Each record that passed these initial checks was considered for homogenisation. This involved a combination of visual examinations, neighbour comparisons and the RHtestsV3 statistical test developed by Environment Canada specifically for identifying multiple inhomogenieties in climate data records (Wang 2009). For the most part the homogeneity assessment was restricted to monthly data, with very little daily data available for this study.
There are a number of methods that appear in the scientific literature for the preparation of high-quality/homogenised datasets (e.g. Jones et al. 1986; Della-Marta et al. 2004, Reeves et al. 2007, Trewin 2013). Factors that may influence the method of choice include the temporal resolution of data, the availability of overlap data and reference series and the completeness of metadata. The choice of RHtestsV3 was based on the ability to run the software on a laptop or personal computer, making it particularly useful in developing countries for maintaining data beyond the current
For local studies there is presently no substitute for good quality station observations. Consequently, this study is based on station data only, though recognising the limitations mentioned previously. We make no attempt to interpolate into data voids, for example. The cost of this station based approach is that trends cannot be computed for some countries of interest (such as East Timor here) due to a lack of data, and while we calculate a Pacific temperature index, we are mindful that a logical weighting for stations is not obvious given the predominance of ocean in the region.
Data and methodology
Station data collationThe primary mechanism used to collate the regional dataset of monthly temperature station data used in this study was a research and training workshop held in Darwin, Australia, in June 2010. This workshop was sponsored by the PCCSP and modelled on previous workshops designed to analyse trends in climate extremes at a regional level (e.g. Peterson and Manton 2008). Typically such workshops involve participants from several nations across a region being invited to come together with data from their country to undertake analyses using standard definitions and methods. Not only does this allow direct comparisons, it also helps to build links between researchers across the region and encourages data and expertise sharing. These types of workshops have proven highly successful in breaking down the barriers to data exchange. Apprehensions hindering data exchange persist in many countries, often in relation to the potential loss of commercial value.
The Darwin workshop was attended by representatives from the national meteorological services in PCCSP partner countries, in addition to French Polynesia, New Caledonia, New Zealand (NIWA), United States (NOAA) and Australia. The participants were asked to contribute monthly maximum and minimum temperature data from the best and longest climate station records in their country (1–3 stations for small countries, 5–7 for large ones). Ideally, these records needed to be at least 25 years long, and at least 80 per cent complete. Each monthly value should be based on at least 25 daily data values. If no records longer than 25 years were available then shorter records were contributed. Data collated at the workshop was supplemented with data sourced from the Australian Bureau of Meteorology, NIWA and NOAA archives, as well as partner country databases in subsequent follow-up visits and emails. We note that our final temperature analyses reported in this paper do not include data for all participating countries/territories, as sufficient data for analysis was not provided in all cases.
Overall, data from a total of 53 stations was sourced for East Timor and the Pacific Islands region. However, not all these were considered suitable for rehabilitation for a variety of reasons. Very little data could be sourced for Nauru and East Timor, preventing the calculation of meaningful trends for these two countries in this study.

290 Australian Meteorological and Oceanographic Journal 63:2 June 2013
The non-use of a reference series does lower the confidence of the homogeneity tests, with a consequence that some inhomogeneities may remain undetected. However, initial testing, using sites with good metadata (station information) histories, revealed that RHtestsV3 was able to detect known changes successfully without a reference series. This is probably because the detection of inhomogeneities in tropical Pacific records is aided by relatively small temperature variability on interannual time scales. Consequently, the ‘signal’ of the inhomogeneity is often large relative to the ‘noise’ of background variation.
Potential break points identified visually (e.g. Fig. 3(a)) and/or statistically (e.g. Fig. 3(b)) were confirmed with station metadata where possible. Metadata were drawn from a range of sources including local manuscripts and field books, personal communication and published reports (e.g. Salinger et al. 1995). RHtestsV3 allows multiple change points that exist in a data series to be detected, and adjusted for. It is based on the penalised maximal t test (Wang et al. 2007) and the penalised maximal F test (Wang 2008a), which are embedded in a recursive testing algorithm (Wang 2008b), with the lag-1 autocorrelation (if any) of the time series being empirically taken into account. The time series being tested may have zero-trend or a linear trend throughout the whole period of record. The problem of uneven distribution of false alarm rate and detection power is also greatly alleviated by using empirical penalty functions.
RHtestsV3 includes a provision for Quantile-Matching (QM) adjustments (Wang et al. 2010) as well as mean-adjustments. All adjustments to Pacific Islands data have been made using the QM technique. The objective of the QM adjustments is to adjust the series so that the empirical distributions of all segments of the de-trended base series match each other; the adjustment value depends on the empirical frequency of the datum to be adjusted (i.e. it varies from one datum to another in the same segment, depending on their corresponding empirical frequencies). As a result, the shape of the distribution is often adjusted (including, but not limited to, the adjustment to the mean), although the tests are meant to detect mean-shifts (thus, a change in the distribution without a shift in the mean could go undetected); and the QM adjustments can account for a seasonality of discontinuity (e.g. it is possible that winter and summer temperatures are adjusted differently because they belong to the lower and upper quartiles of the distribution, respectively). Importantly, the annual cycle, lag-1 autocorrelation, and linear trend of the base series are estimated in tandem while accounting for all identified shifts (Wang 2008b); and the trend component estimated for the base series is preserved in the QM adjustment algorithm (Wang et al. 2010).
Ideally data would only be adjusted at those change points that could be confirmed by metadata. Due to the lack of station history information for several countries, some inhomogeneities were firstly identified through visual inspection then adjusted if RHtestsV3 found the potential
study. In addition, the method has been extensively tested in Australia for application to isolated stations (Jovanovic et al. 2012) as well as a variety of data types (Jovanovic et al. 2008, 2011) providing confidence in its suitability for the current purpose. Reeves et al. (2007) describe an in-depth comparison of homogeneity methods applied to climate data and conclude that the two-phase regression approach used here is ‘optimal’ for the considered climate series, though we note that Trewin (2013) found it to work less well for the adjustment of daily data. RHtestsV3 runs in the ‘R’ environment for statistical computing and is freely available via the internet, another advantage for developing country users. Experience at the Darwin workshop and subsequently revealed that climatologists could typically gain the skills to apply RHtestsV3 with only a few days of training owing to the simple design of the code and the extensive training and written material which is available.
As described by Trewin (2013), the preferred method for homogeneity adjustment is through the use of parallel measurements under the original and changed conditions/location allowing a direct calculation of the impact of a change. Unfortunately, there are almost no examples of parallel observations in the Pacific, meaning that homogeneity testing requires statistical tests applied to individual time series. The power of a homogeneity test is increased if the candidate series can be compared against an independent, highly-correlated, homogeneous reference series (e.g. Trewin 2013). A difference series between a candidate and reference series would be expected to have less noise than the candidate series alone, and thus the signal-to-noise ratio for a signal of given magnitude would be higher. A statistically significant change in the relationship between the two series over time is used to flag a potential discontinuity in the candidate series. However, due to the vast distances between observation sites in the Pacific, most sites being examined in this study did not have a reference temperature site available for comparison.
A strong correlation usually exists between local SSTs and island temperatures on longer timescales (e.g. Fig. 8). Consequently, an attempt was made to use the Extended Reconstructed Sea Surface Temperature Version 3 (NOAA_ERSST_V3) described by Smith and Reynolds (2003, 2004) and Smith et al. (2007) to form reference series for remote islands for the detection of inhomogeneities. For the subtropical sites, e.g. Norfolk Island and Lord Howe Island in the southwest Pacific, the correlations between land temperatures and local SSTs were found to be strong. However, others in the equatorial Pacific, particularly near the cold tongue, showed rather poorer correlations on annual timescale, despite similar long-term trends. Ultimately, noting this inconsistency, no reference series were used for most of the homogeneity testing. One advantage of not using SSTs as a reference series is that the station data and the SST data remain independent in this study and can then subsequently be compared to provide an independent check on results and associated conclusions.

Jones et al.: An updated analysis of homogeneous temperature data at Pacific Island stations 291
detection of inhomogeneities in island records (e.g. Fig. 3(a)). Secondly, many of the larger islands have steep topography so even a relatively short site move may involve considerable change in elevation or exposure. Thirdly, many islands are subject to prevailing wind directions e.g. southeast trade winds. Consequently, a site move that includes a change in exposure to these winds may affect the temperatures recorded at the station, most usually through a change in the DTR.
Homogeneous temperature records were produced for 37 stations located in the partner countries. To help describe the regional patterns of change, these were supplemented by homogeneous records from three Australian islands (Jovanovic et al. 2012), one New Zealand island, and five French Polynesian stations, resulting in a homogeneous Pacific island network of 46 stations. The distribution of stations is shown by the bubbles on Fig. 5,
change point statistically significant (without supporting metadata). Whilst all attempts to make homogeneity adjustments as objective as possible were made, ultimately some subjective decisions were required based on available evidence.
The main sources of inhomogeneity in the Pacific temperature record were found to be observation site relocations, modification of the surrounding environment and Stevenson Screen changes. The largest adjustments were required for site moves. There are three main reasons for this. Firstly, being on islands, many observation stations are located relatively close to the ocean. The ocean acts to moderate land temperatures. A site move that alters the distance of a station to the ocean has a particularly strong influence on the diurnal temperature variation. For this reason a simple visual inspection of Diurnal Temperature Range (DTR) was found to be a powerful first step in the
Fig. 3. (a) Time series of raw monthly diurnal temperature range anomalies (°C) at Nadi, Fiji with three inhomogeneities identified using the RHtest statistical software. (b) The resulting raw and adjusted minimum temperature series for Nadi accounting for the two site moves in May 1965 and April 1998 identified by RHtest and supported by the station metadata.

292 Australian Meteorological and Oceanographic Journal 63:2 June 2013
Rarotonga, Nadi, Suva, and Hanan Airport) are shown in Fig. 4. The completeness of these records is relatively good, with most having only a few missing ‘years’. All six records show warming, with trends ranging from +0.05 °C/decade at Rarotonga (1930–2009) to +0.23 °C/decade at Port Moresby (1940–2009). The other 46 station records are shorter and of mixed completeness.
Consistent with other parts of the globe, most of the warmest years on record have occurred since 1990. At the three sites with complete 2010 data supplied at time of writing (Nadi, Suva, and Hanan Airport), 2010 was amongst the top three warmest years on record. At Port Moresby, Apia, Nadi, and Suva, warming has been so strong that the warmer years at the start of the record are actually cooler than the cooler years at the end of the record. This clearly represents a significant shift in the climatology of these locations. Interannual variability about the background trends can be seen in the annual mean series at all stations, much of this associated with the El Niño–Southern Oscillation (ENSO). This natural variability is generally relatively small compared to the background trend.
Seventy, fifty and thirty-year trends at stationsTo investigate the evolution of temperature change across the southwest Pacific, station trends were calculated for the past 70, 50 and 30 years and plotted spatially. For a trend to be calculated and plotted, 80 per cent of annual mean values needed to be available in a station series period being analysed. The sign and magnitudes of these station trends are shown in Fig. 5. To compare island trends with those from continental stations, trends from an Australian high-quality temperature dataset (Trewin 2001) are also shown though these are not used in the area averages described later. We note that the Trewin (2001) data are homogenised at the monthly timescale and so are directly comparable with our Pacific region station data.
As described earlier, sustained observation network growth did not commence in the Pacific until the Second World War. Consequently, there are very few continuous records starting before 1940. The 11 homogenous island records available from 1941 show warming trends in annual mean temperature ranging from +0.05 °C/decade at Rarotonga to +0.22 °C/decade at Port Moresby (Fig. 5(a)). Trend values for other stations can be calculated at http://www.bom.gov.au/climate/pccsp/. The trend of the simple 11 station average is 0.13 °C/decade from 1941 (Table 1).
A greater number of homogeneous island records (32) are available from 1961 (Fig. 5(b)), and these generally show stronger warming trends than for the post-1940 period. Island station trends range from +0.04 °C/decade at Rotuma to +0.33 °C/decade at Tahiti, with an all-island simple average trend of +0.16 °C/decade since 1961. The strongest warming is in Papua New Guinea and French Polynesia, where most trends are greater than +0.20 °C/decade. The warming in Papua New Guinea is comparable with trends in eastern Australia for the 50-year period. Trends for other partner
with station details listed in Appendix A. Of the 37 partner country stations, all but one (Wewak in Papua New Guinea) required homogeneity adjustments to either the minimum temperature or maximum temperature series or both, with most stations requiring one to three adjustments. Adjustments were mostly less than 0.5 °C. In some instances positive and negative adjustments equal out resulting in no or little difference between the overall trend in the raw and homogenised series while in aggregate the sum of adjustments has little effect except prior to 1960.
Due to the challenges associated with obtaining metadata records and reference series for Pacific island stations, it is possible that undetected inhomogeneities remain in some records. However, these are likely to be small and have minimal impact on the overall conclusions which we report as larger inhomogeneities will usually be evident visually and/or be detected by the statistical analysis. The major inhomogeneities are likely to have been identified and addressed, making the dataset the best currently available to examine temperature trends at Pacific island stations. The dataset is also considered a ‘living’ dataset in that when additional records are discovered or digitised they may be included. Similarly, if new metadata information is found that suggests an inhomogeneity has been missed in a record then it will be reassessed and, if necessary, a new homogeneous version produced. Finally, we note a current effort by the authors to digitise the large volumes of daily temperature data for the region. As Trewin (2013) has recently shown for Australia, the use of daily data can be important for characterising the nature of inhomogeneities and it is our future intention to develop a parallel set of high-quality data at the daily timescale.
It is hoped that the new dataset is not only suitable for monitoring and analysis of climate change, but will also lead to better validation and interpretation of regional climate projections, and help identify possible adaptation options for people living throughout the Pacific. Homogenised temperature series for all stations can be found at http://www.bom.gov.au/climate/pccsp/, including monthly and seasonal series of maximum, mean and minimum temperatures and DTR
Results
Annual mean temperature series at Pacific island stationsAnnual mean maximum and minimum temperature series were calculated for all stations by averaging the 12 monthly values for each year. If a year contained one or more missing monthly values, no annual value was determined. Annual mean temperature series were then generated from the simple averages of the annual mean maximum and minimum series. Where an annual mean maximum and/or minimum value was missing no annual mean value was calculated for that year.
The six longest homogeneous annual mean temperature series from partner countries (Port Moresby, Apia,

Jones et al.: An updated analysis of homogeneous temperature data at Pacific Island stations 293
Fig. 4. Homogeneous annual mean temperature series for the six longest stations in the study set. These are (a) Port Moresby 1940–2008, (b) Apia 1930–2009, (c) Rarotonga 1930–2009, (d) Nadi 1942–2010, (e) Suva 1942–2010 and (f) Hanan Airport 1941–2010.
(a) (b)
(c) (d)
(e) (f)
country stations are mostly between of +0.10 and 0.15 °C/decade since 1961 and positive everywhere.
Most (36) of the homogeneous mean temperature records have trends available from 1981. Trends are similar to 1961–2010 trends, ranging from +0.04 °C/decade at Rotuma to +0.33 °C/decade at Funafuti and Henderson (Fig. 5(c)), with an average of +0.18 °C/decade (Table 1). The strongest station trends are again found in Papua New Guinea and French Polynesia, with values generally greater than +0.20
°C/decade. Trends in Papua New Guinea over this time do not seem to have been moderated by large increases in rainfall (Australian Bureau of Meteorology and CSIRO 2011), as has occurred across parts of northern Australia. Other partner country station trends are mostly around +0.10–0.15 °C/decade since 1981. An area of reduced trends is apparent in stations to the near north of the equator, consistent with the early HadCRU temperature data (Fig. 2).
Overall, the trends in the updated homogenous island

294 Australian Meteorological and Oceanographic Journal 63:2 June 2013
Fig. 5. Trends in homogeneous annual mean temperature at Pacific island stations over (a) 1941–2010, (b) 1961–2010 and (c) 1981–2010. Trends in Australian continental stations are included for comparison. Units are °C/decade. Stations with abso-lute trend values of less than 0.025 °C/decade are highlighted with an asterix for the purposes of clarity.
(a)
(b)
(c)

Jones et al.: An updated analysis of homogeneous temperature data at Pacific Island stations 295
influenced by increased rainfall (Smith 2005) and changes in cloud cover (Jovanovic et al. 2011).
Maximum and minimum temperature trends at stationsTrends in annual mean minimum and maximum temperatures at individual stations were also calculated. At most stations the trends in maxima and minima since 1961 are very similar, with no systematic change in the DTR detected. Similar results have been found by Jovanovic et al. (2012) for tropical/subtropical islands of Australia, and reported at the global scale for the most recent periods (Vose et al. 2005, IPCC 2007). The very small changes in the DTR across the network support the earlier suggestion of minimal urban contamination of the data, and contrasts somewhat with Australia where increases in rainfall are reflected in a decline in DTR (Fawcett et al. 2012).
Trends in minimum and maximum temperatures for locations in temperate regions tend to be influenced by changes in rainfall (e.g. Jones and Trewin 2000, Nicholls 2004). Hence, if a site has become wetter over a particular
station records are remarkably consistent in showing sustained warming across the Pacific. None of the available homogeneous island station records show cooling trends over the past 70, 50 or 30 years. This highlights the large signal (warming) to noise (natural variability) ratio that exists in temperatures in this region of the tropics. While tropical regions including the Pacific are projected to show lower rates of warming than many higher-latitude regions under the enhanced greenhouse effect (e.g. IPCC 2007, Australian Bureau of Meteorology and CSIRO 2011), in part because of the larger fraction of oceans, the effect of this warming could well be more significant as it occurs in regions with very low temperature variability overall. We also note that while the region has seen substantial variations in climate drivers, with major shifts in ENSO (e.g. Power and Smith 2007), the South Pacific Convergence Zone (Folland et al. 2002) and rainfall (Salinger et al. 2001, Griffiths et al. 2002) such variations are not sufficient to change the overall pattern of warming. This stands in contrast to Australia where cooling trends exist in parts of northern Australia over the 1981–2010 period,
Fig. 6. Trends in homogeneous (a) May–October and (b) November–April mean temperature at Pacific island stations over 1961–2010. Units are °C/decade. Stations with absolute trend values of less than 0.025 °C/decade are highlighted with an asterix for the purposes of clarity.
(a)
(b)

296 Australian Meteorological and Oceanographic Journal 63:2 June 2013
bounded by the half-way points between themselves and their neighbouring stations. Consequently, in this study, regional mean values were based on a simple average across all stations that have an anomaly available for a given year. A simple regional mean of this type will be susceptible to variations in the available network in individual years, although the use of anomalies should reduce any systematic biases which may arise from this.
Figure 7 shows the regional mean annual temperature time series for 1940 to 2010. The series shows persistent warming since 1960. Most of the warmest years on record in the regional series have occurred during the last two decades, with 2010 the warmest on record for the region by some margin, though with rather limited station coverage. The record warm conditions in 2010 are consistent with record warm SSTs reported by the Australian Bureau of Meteorology (2011) in tropical parts and the record warm global temperature during the year (Blunden et al. 2011).
The influence of ENSO can be seen in the interannual variability of the regional temperature series, but is complicated by the strong trend in annual temperatures which is not shared by ENSO measures such as the Southern Oscillation Index (SOI; Drosdowsky and Williams 1991). We also note that the correlation of temperature with the SOI shows a dipole across the southwest Pacific being positive near and to the southwest of the SPCZ in countries such as Fiji and Papua New Guinea, with negative correlations occurring close to the Pacific Cold Tongue and generally north and east of Samoa.
The detrended PCCSP temperatures series (not shown) correlates most strongly with 12-month average SOI when the SOI leads by some six to nine months. For example, the 12-month SOI (for March to February) shows a correlation of –0.49 with January to December (detrended) temperatures—in other words near 25 per cent of the variability of annual temperatures around the trend is attributable to ENSO variability. The lack of a trend in the SOI values in recent decades means that ENSO is not able to explain the warming trend in the PCCSP region, in agreement with the recent global analyses for global temperature (Foster and Rahmstorf 2011). This means that ENSO, which is the strongest modulator of year-to-year temperature variability in the region, is not the driver for the longer-term warming trend.
Homogeneous versus raw station data trendsTo investigate the effect of applying homogeneity adjustments, maps of trends in the raw (unadjusted) mean temperature series were also calculated (not shown), while the station average temperature for the raw data is shown in Fig. 7 (denoted as ‘raw’). In aggregate the raw data show similar variability and trends to the adjusted data, although there are substantial differences, both positive and negative, in some cases at the station level. We note that the regional annual mean series was calculated for the raw data using the same network and method as for the homogeneous data
period, warming in maximum temperatures over that period tends to be subdued, whilst warming in minimum temperatures tends to be enhanced, in part due to increased overnight cloud cover. The opposite tends to occur for sites that have become drier. However, this effect is generally not observed at tropical Pacific island sites where maxima and minima appear to be increasing at similar rates at most stations, whatever the rainfall trend. This suggests that SST changes have a greater influence on island temperatures than local hydrological processes impacting on the surface energy balance. Nevertheless, in Fiji and Tonga, where maximum temperatures have increased more than minimum temperatures since 1961, there is a weak decline in wet season rainfall at most stations which has possibly contributed to the difference.
Wet and dry season trends at stationsAs well as annual mean temperature series, six-month mean series were produced for the May–October and November–April periods to allow warming to be compared between ‘wet’ and ‘dry’ seasons. Warming is evident in both seasons, with very similar trend values at most stations (Fig. 6). However, stations located in Fiji, Tonga and Niue show a weak bias toward greater warming during the southern hemisphere wet season. This wet season warming is strongest in the daytime maximum temperatures.
Across the island stations located in the southern hemisphere, the average warming trend since 1961 is 0.18 °C/decade during the wet (November–April) and 0.16 °C/decade during the dry (May–October); the higher values during the wet are mainly due to the greater warming in Fiji, Tonga and Niue. For the seven northern hemisphere series available from 1961 the mean trend during the wet (May–October) is 0.14 °C/decade, compared with 0.15 °C/decade for the dry (November–April). The small difference in warming between seasons in the station-based series is supported by the gridded HadCRU dataset.
Regional annual mean temperature anomaliesTo examine historical temperature changes at the regional scale, a time series of regional annual mean temperature was created. To reduce the impact of biases associated with observation network changes with time, such means are usually based on anomaly data. Temperature anomalies usually have greater spatial consistency than absolute values owing to the lesser effect of topography, latitude and longitude on anomalies compared to absolute temperature (Jones et al. 2009).
The station temperature series were converted to anomaly series using a standard 1961–1990 normal, and averaged for each year to create a regional mean value for the PCCSP study region (see Fig. 2). Often an area-weighted mean is used to give greater weighting to those stations that represent larger proportions of the region. However, given the vast distances between sites in the Pacific, many stations are not considered representative of the huge area
Jones et al.: An updated analysis of homogeneous temperature data at Pacific Island stations 297
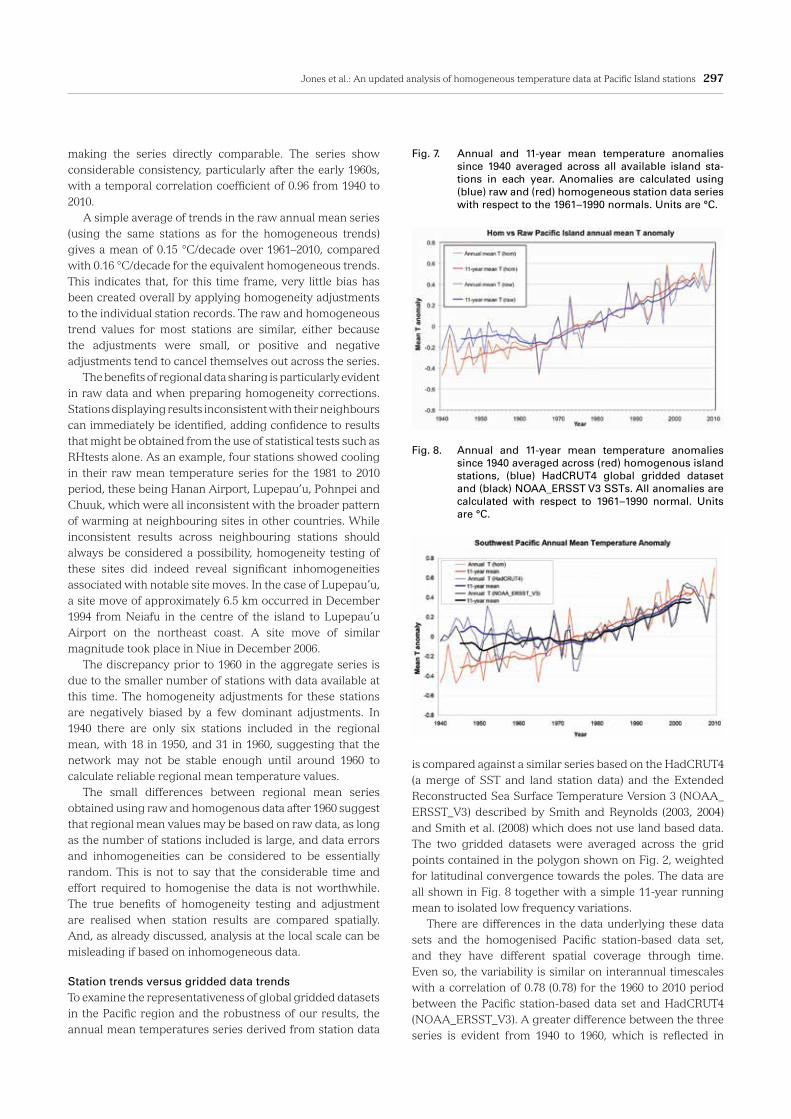
is compared against a similar series based on the HadCRUT4 (a merge of SST and land station data) and the Extended Reconstructed Sea Surface Temperature Version 3 (NOAA_ERSST_V3) described by Smith and Reynolds (2003, 2004) and Smith et al. (2008) which does not use land based data. The two gridded datasets were averaged across the grid points contained in the polygon shown on Fig. 2, weighted for latitudinal convergence towards the poles. The data are all shown in Fig. 8 together with a simple 11-year running mean to isolated low frequency variations.
There are differences in the data underlying these data sets and the homogenised Pacific station-based data set, and they have different spatial coverage through time. Even so, the variability is similar on interannual timescales with a correlation of 0.78 (0.78) for the 1960 to 2010 period between the Pacific station-based data set and HadCRUT4 (NOAA_ERSST_V3). A greater difference between the three series is evident from 1940 to 1960, which is reflected in
making the series directly comparable. The series show considerable consistency, particularly after the early 1960s, with a temporal correlation coefficient of 0.96 from 1940 to 2010.
A simple average of trends in the raw annual mean series (using the same stations as for the homogeneous trends) gives a mean of 0.15 °C/decade over 1961–2010, compared with 0.16 °C/decade for the equivalent homogeneous trends. This indicates that, for this time frame, very little bias has been created overall by applying homogeneity adjustments to the individual station records. The raw and homogeneous trend values for most stations are similar, either because the adjustments were small, or positive and negative adjustments tend to cancel themselves out across the series.
The benefits of regional data sharing is particularly evident in raw data and when preparing homogeneity corrections. Stations displaying results inconsistent with their neighbours can immediately be identified, adding confidence to results that might be obtained from the use of statistical tests such as RHtests alone. As an example, four stations showed cooling in their raw mean temperature series for the 1981 to 2010 period, these being Hanan Airport, Lupepau’u, Pohnpei and Chuuk, which were all inconsistent with the broader pattern of warming at neighbouring sites in other countries. While inconsistent results across neighbouring stations should always be considered a possibility, homogeneity testing of these sites did indeed reveal significant inhomogeneities associated with notable site moves. In the case of Lupepau’u, a site move of approximately 6.5 km occurred in December 1994 from Neiafu in the centre of the island to Lupepau’u Airport on the northeast coast. A site move of similar magnitude took place in Niue in December 2006.
The discrepancy prior to 1960 in the aggregate series is due to the smaller number of stations with data available at this time. The homogeneity adjustments for these stations are negatively biased by a few dominant adjustments. In 1940 there are only six stations included in the regional mean, with 18 in 1950, and 31 in 1960, suggesting that the network may not be stable enough until around 1960 to calculate reliable regional mean temperature values.
The small differences between regional mean series obtained using raw and homogenous data after 1960 suggest that regional mean values may be based on raw data, as long as the number of stations included is large, and data errors and inhomogeneities can be considered to be essentially random. This is not to say that the considerable time and effort required to homogenise the data is not worthwhile. The true benefits of homogeneity testing and adjustment are realised when station results are compared spatially. And, as already discussed, analysis at the local scale can be misleading if based on inhomogeneous data.
Station trends versus gridded data trendsTo examine the representativeness of global gridded datasets in the Pacific region and the robustness of our results, the annual mean temperatures series derived from station data
Fig. 7. Annual and 11-year mean temperature anomalies since 1940 averaged across all available island sta-tions in each year. Anomalies are calculated using (blue) raw and (red) homogeneous station data series with respect to the 1961–1990 normals. Units are °C.
Fig. 8. Annual and 11-year mean temperature anomalies since 1940 averaged across (red) homogenous island stations, (blue) HadCRUT4 global gridded dataset and (black) NOAA_ERSST V3 SSTs. All anomalies are calculated with respect to 1961–1990 normal. Units are °C.

298 Australian Meteorological and Oceanographic Journal 63:2 June 2013
individual stations’ results. Consequently, one of the key outputs from this project is a web-based climate change data portal to facilitate interactive access, visualisation and analysis of historical climate data from across the study region (http://www.bom.gov.au/climate/pccsp/). Innovative web navigation tools and spatial overlays were designed to help the user identify and select observation stations. Both the raw and homogeneous versions of all temperature data are available for analysis, comparison and download and updated periodically as new data is made available through digitisation and other data rescue activities.
Conclusions and recommendations
Pacific island temperature records have been assessed and adjusted for homogeneity. These rehabilitated records provide a picture of pervasive warming in the Pacific islands over the past few decades. Warming is found in mean, maximum and minimum temperatures, across every station, over all seasons, and over all time periods longer than 30 years. The trends are supported by observations of warming in the oceans in the region, and are largely unrelated to any trends in ENSO and station level rainfall. The obvious explanation for such consistent results is human-induced global warming, a suggestion that awaits future comprehensive attribution investigation.
The recent rate of warming averaged across the Pacific Island countries of +0.17 °C/decade for 1981–2010 is similar to the global warming trends reported in IPCC (2007) for the similar period (1979–2005), with the warming tending to be slightly higher over land than the surrounding oceans. In addition, we find that 2010 was the warmest year in the historical record for the study region, consistent with global observations (WMO 2011). There is less good agreement for trends during the earliest years of our study, in part owing to a marked decline in the amount of data which is currently available for this study.
Given their location, remoteness and lack of urban contamination, the longest operating temperature stations of the Pacific provide valuable information for monitoring climate change. Consequently, there is a need to assist partner countries improve meteorological instrumentation. In particular, there has been a notable reduction in recent years in the number of climate stations and quality of climate data in East Timor, Nauru, Kiribati, Tuvalu ,and the Northern Cook Islands. As little is known about trends in this region, priority should be given to these countries for assistance with the improvement of climate observations. Improvements in the management of station metadata are also required. Compared to earlier decades, little metadata is currently being documented in many Pacific countries and this will continue to hinder the homogenisation of temperature data going forwards.
As recognised in earlier study (e.g. Page et al. 2004) the data collation phase of this study has confirmed that much data remains in hardcopy formats for some partner countries.
lower correlations between our data and the HadCRUT4 (in particular) for the longer 1940 to 2010 period (0.65). We note that our station series shows higher correlations with the earlier HadCRUT3 data (Brohan et al. 2006) with a correlation of 0.77 for 1940 to 2010, which implies that the latest updates to the HadCRU data appear to have increased the uncertainty in the earlier period rather than reduced them.
Overall the global datasets show slightly lower rates of warming over the 1941–2010, 1951–2010 and 1961–2010 periods but the trend values show convergence with time. The different trends reflect early disagreement between the data, particularly in the first ten years, when the global data are around 0.2 to 0.3 °C warmer than our station series; a lesser difference persists until about 1970 (the station-based series then has consistently slightly warmer anomalies in the later part of the record, but this is substantially an artefact of the influence of the pre-1970 data on the respective 1961–1990 normals). This difference is partly attributable to the rather small number of stations available in our series, although there are also known biases in global SST datasets in the 1940s, due to changes in measurement technologies (Thompson et al. 2008, Kennedy et al. 2011). The HadCRUT4 data appears to be anomalously warm around World War II, being substantially warmer than the earlier HadCRUT3 data, the NOAA SST dataset and our homogenised station average.
More recently the data are in close agreement. As an example the 30-year trends (1981–2010) are statistically indistinguishable ranging from +0.17 °C/decade for the homogenised data to 0.15 °C/decade and 0.14 °C/decade for the HadCRUT4 and NOAA_ERSST_V3 sets. The more rapid rate of warming evident in the station land data is consistent with the general observation of greater warming over land than ocean, but may also be partly attributable to the station data being concentrated to the west of the Date Line where recent warming has tended to be somewhat stronger in recent decades.
The last few years show greater disagreement between the two gridded datasets and the homogenised station series. This is not surprising as there are delays in the digitisation and transmission of data, and recent inhomogeneities and station moves are harder to detect near the end of a series. In addition, the station network is less complete in recent years which means that a simple station average will tend to show some variations simply as a result of changes in geographical location of stations.
Sharing the result and ensuring timeliness of data
The main objective of this study has been to provide high-quality station data which can be used confidently for the analysis of temperatures changes in the individual PCCSP partner countries. There is a limit to how much information can be delivered in reports and related science papers about

Jones et al.: An updated analysis of homogeneous temperature data at Pacific Island stations 299
doi: http://dx.doi.org/10.1175/2011BAMS3218.1Australian Bureau of Meteorology and CSIRO. 2011. Climate Change in
the Pacific: Scientific Assessment and New Research. Volume 1: Region-al Overview, 257pp. Accessible via http://www.cawcr.gov.au/projects/PCCSP/publications.html
Basher, R.E., Collen, C., Fitzharris, B.B., Hay, J.E., Mullan, A.B. and Sa-linger, J. 1990. Preliminary studies for South Pacific climate change. Report of a study contracted under the New Zealand Climate Change programme, New Zealand Meteorological Service, Wellington, 70pp.
Blunden, J., Arndt, D.S., Baringer, M.O. 2011. State of the Climate in 2010. Bull. Am. Meteorol. Soc., 92, S1–S236, doi: http://dx.doi.org/10.1175/1520–0477–92.6.S1
Brohan, P., Kennedy, J.J., Harris, I., Tett, S.F.B. and Jones, P.D. 2006. Uncertainty estimates in regional and global observed temperature changes: a new dataset from 1850. J. Geophys. Res., 111, D12106, doi:10.1029/2005JD006548.
Brook, R.R., Basher, R.E., Bruce, J.P., Parsons, S.A., and Sullivan, M.E. 1991. The changing climate in paradise. Feasibility study on climate monitoring and impacts in the South West Pacific. Bureau of Meteorol-ogy, Melbourne, Australia, 145pp.
Bureau of Meteorology. 2011. Annual Climate Summary 2010. Bureau of Meteorology, Melbourne, Australia. ISBN 1837–8854, 20pp. Acces-sible via http://www.bom.gov.au/climate/annual_sum/annsum.shtml .
Della-Marta P., Collins D. and Braganza K. 2004. Updating Australia’s high-quality annual temperature dataset. Aust. Meteorol. Mag., 53, 75–93.
Drosdowsky, W. and Williams, M. 1991. The southern oscillation in the Australian region. Part I: anomalies at the extremes of the oscillation, J. Clim., 4, 619–38.
Fawcett, R.J.B., Trewin, B.C., Braganza, K, Smalley, R., Jovanovic, B. and Jones D.A. 2012. On the sensitivity of Australian temperature variabil-ity and trends to analysis methods and observation networks. CAW-CR Research Report 50, Centre for Australian Weather and Climate Research, Melbourne.
Folland, C.K., Renwick, J.A., Salinger, M.J., and Mullan, A.B. 2002. Rela-tive influences of the Interdecadal Pacific Oscillation and ENSO on the South Pacific Convergence Zone. Geophys. Res. Lett., 29, DOI:10.1029/2001GL014201.
Folland, C.K., Salinger, M.J., Jiang, N. and Rayner, N.A. 2003. Trends and variation in South Pacific island and ocean surface temperatures. J. Clim., 16, 2859–74.
Foster, G. and Rahmstorf, S. 2011. Global temperature evolution 1979–2010. Environmental Research Letters, 6, 044022 doi:10.1088/1748–9326/6/4/044022.
Griffiths, G.M., Chambers, L.E., Haylock, M.R. , Manton, M.J. , Nicholls, N., Baek, H. -J. , Choi, Y., Della-Marta, P.M., Gosai, A., Iga, N., Lata, R., Laurent, V., Maitrepierre, L., Nakamigawa, H., Ouprasitwong, M., Solofa, D., Tahani, L., Thuy, D.T., Tibig, L., Trewin, B., Vediapan, K. and Zhai, P. 2005. Change in Mean Temperature as a Predictor of Extreme Temperature Change in the Asia-Pacific Region. Int. J. Climatol., 25, 1301–30.
Griffiths, G.M., Salinger, M.J., and Leleu, I. 2003. Trends in extreme daily rainfall across the South Pacific and relationship to the South Pacific Convergence Zone. Int. J. Climatol., 23, 847–69.
Holmes, R.L. 1877, The climate of Fiji; Results of meteorological observa-tions made at Delanasau, Bay of islands, North Coast of the province of Bua, Vanualeru, Fiji, during the five years ending December 31st, 1875. Q. J. R. Meteorol. Soc., 3. 260–77. doi: 10.1002/qj.4970032103
Holmes, R.L. 1881. The climate of Fiji: Result of meteorological observa-tions taken at Delanasau, Bua, Vanua Levu, Fiji, 1871–1880. Q. J. R. Meteorol. Soc., 7, 222–43. doi: 10.1002/qj.4970074004.
Jones, D.A. and Trewin, B.C. 2000. On the relationships between the El Niño–Southern Oscillation and Australian land surface temperature. Int. J. Climatol., 20, 697–719.
Jones, D.A., Wang, W. and Fawcett, R. 2009. High-quality spatial climate data sets for Australia. Aust. Meteorol. Oceanogr. J., 58, 233–48.
Jones P.D., Raper, S.C.B., Bradley, R.S., Diaz, H.F., Kelly P.M., Wigley, T.M.L. 1986. Northern Hemisphere surface air temperature variations: 1851–1984. J. Clim. Appl. Meteorol., 25, 161–79.
Jovanovic B., Jones D.A. and Collins D. 2008. A high quality monthly pan evaporation dataset for Australia. Climatic Change, 87, 517–35.
International projects already exist to recover historical climate data, not just for the Pacific region, but for the whole globe e.g. the Atmospheric Circulation Reconstructions over the Earth (ACRE) project (http://www.met-acre.org). The next phase of this project will contribute to this international effort, with data digitisation in partner countries identified as a key activity. It is also well recognised that there are significant gaps in temperature records for Nauru and East Timor. Future data recovery efforts will place a high priority on filling data voids for these partner countries, including obtaining colonial records held remotely. The spatial consistency shown by temperature data means that we do not expect the conclusions of this paper to materially change when new data are added through digitisation, but uncertainty is likely to be reduced and a number of data gaps such as East Timor are likely to be filled. It may also be possible to shed more light on reasons for the larger differences between the three temperature datasets in the 1940 to 1960 period when current digital data holdings are less extensive.
Acknowledgements
This study was fully funded by the Australian Government’s International Climate Change Adaptation Initiative, and delivered through the Pacific Climate Change Science Program. It has only been made possible through the contributions of historical data and station history information from meteorological and climate organisations located in Cook Islands, East Timor, Federated States of Micronesia, Fiji, French Polynesia, Kiribati, Marshall Islands, Nauru, New Zealand, Niue, Palau, Papua New Guinea, Samoa, Solomon Islands, Tonga, Tuvalu, the USA, and Vanuatu. The authors thank the heads of these agencies for permitting access to their data and appreciate the assistance employees of these organisations have provided including those not listed as co-authors. The authors are particularly grateful to Dr Jim Salinger for metadata and personal knowledge about several Pacific island stations, and Dr Xiaolan Wang for assistance in training partner country representatives in data homogeneity testing and providing the authors with advice and software.
The authors acknowledge the tireless contribution—in difficult circumstances—made to this paper by their colleague, Mr Dean Collins (deceased).
ReferencesAlexander, L.V., Zhang, X., Peterson, T.C., Caesar, J., Gleason, B., Tank,
A.M.G.K., Haylock, M., Collins, D., Trewin, B., Rahimzadeh, F., Tagi-pour, A., Kumar, K.P., Revadekar, J., Griffiths, G., Vincent, L., Stephen-son, D.B., Burn, J., Aguilar, E., Brunet, M., Taylor, M., New, M., Zhai, P., Rusticucci, M. and Vazquez-Aguirre, J.L. 2006. Global observed changes in daily climate extremes of temperature and precipitation. J. Geophys. Res., 111, 1–22.
Allan, R., Brohan, P., Compo, G.P, Stone R., Luterbacher J., Brönnimann S. 2011. The International Atmospheric Circulation Reconstructions over the Earth (ACRE) Initiative. Bull. Am. Meteorol. Soc., 92, 1421–5.

300 Australian Meteorological and Oceanographic Journal 63:2 June 2013
Salinger, M.J., Basher, R.E., Fitzharris, J.E., Hay, J.E., Jones, P.D., Macveigh, J.P. and Schmidely-Leleu, I. 1995. Climate trends in the Southwest Pacific. Int. J. Climatol., 15, 285–302.
Salinger, M.J., Renwick J.R. and Mullan, A.B. 2001. Interdecadal Pacific Oscillation and South Pacific Climate. Int. J. Climatol., 21, 1705–21.
Smith, I.N. 2004. Trends in Australian rainfall – are they unusual? Aust. Meteorol. Mag., 53, 163–73.
Smith, T.M. and Reynolds, R.W. 2003. Extended Reconstruction of Glob-al Sea Surface Temperatures Based on COADS Data (1854–1997). J. Clim., 16, 1495–510.
Smith, T.M. and Reynolds, R.W. 2004. Improved extended reconstruction of SST (1854–1997). J. Clim., 17, 2466–77.
Smith, T.M., Reynolds R.W., Peterson, T.C., and Lawrimore, J. 2008. Im-provements to NOAA’s Historical Merged Land-Ocean Surface Tem-perature Analysis (1880–2006). J. Clim., 21, 2283–96.
Smythe, S.M.B. 1864. Ten months in the Fiji Islands, with an introduction and appendix by Colonial W.J. Smythe, John Henry and James Parker, Oxford and London. Accesible via http://books.google.com/
SPREP. 2001. Status of the Pacific regional Global Climate Observing System (GCOS) systematic observations. Regional summary report, SPREP, Samoa.
Sen Gupta, A. and McNeil, B. 2012. Variability and change in the ocean, in The Future of the World’s Climate, edited by A. Henderson-Sellers and K. McGuffie, pp. 141–165, Elsevier, Amsterdam.
Thompson, D., Kennedy, J., Wallace, J. and Jones, P. 2008. A large dis-continuity in mid-20th century global-mean surface temperatures. Nature, 453, 646–9, doi:10.1038/nature06982.
Trewin, B.C. 2001. Extreme temperature events in Australia. PhD Thesis, School of Earth Sciences, University of Melbourne, Australia.
Trewin, B.C. 2010. Exposure, instrumentation and observing practice ef-fects on land temperature measurements. Wiley Interdisciplinary Re-views: Climatic Change, 1, 490–506.
Trewin, B.C. 2013. A daily homogenised temperature data set for Austra-lia. Int. J. Climatol., 33, 1510–29.
Turner, G. 1861. Nineteen years in Polynesia: missionary life, travels, and researches in the islands of the Pacific, John Snow, London. Accessible via http://books.google.com/
UNFCCC. 2005. Climate change, small island developing States. Issued by the Climate Change Secretariat (UNFCCC), Bonn, Germany. ISBN 92 9219 012 1. 32pp.
Vose, R.S., Wuertz, D., Peterson, T.C. and Jones, P.D. 2005. An intercom-parison of trends in surface air temperature analyses at the global, hemispheric, and grid-box scale. Geophys. Res. Lett., 32, L18718, doi:10.1029/2005GL023502.
Wang, X.L. 2008a. Penalized maximal F-test for detecting undocumented mean-shifts without trend-change. J. Atmos. Oceanic Tech., 25, 368–84. DOI:10.1175/2007/JTECHA982.1.
Wang, X.L. 2008b. Accounting for autocorrelation in detecting mean-shifts in climate data series using the penalized maximal t or F test. J. Appl. Meteor. Climatol., 47, 2423–44.
Wang, X.L. 2009. A quantile matching adjustment algorithm for Gauss-ian data series. Climate Research Division, Atmospheric Science and Technology Directorate, Science and Technology Branch, Environ-ment Canada. 5 pp. Accesible via http://cccma.seos.uvic.ca/ETCCD-MI/software.shtml .
Wang, X. L., H. Chen, Y. Wu, Y. Feng, and Q. Pu. 2010. New techniques for detection and adjustment of shifts in daily precipitation data series. J. Appl. Meteor. Climatol. 49, 2416–36.
Wang, X.L., Wen, Q.H. and Wu, Y. 2007. Penalized maximal t test for de-tecting undocumented mean change in climate data series. J. Appl. Meteor. Climatol., 46, 916–31. DOI:10.1175/JAM2504.1
WMO. 2011. WMO statement on the status of the global climate in 2010. World Meteorological Organization. CH-1211 Geneva 2, Switzerland, ISBN 978 92 63 11074 9. 20pp. Accesible via http://www.wmo.int/pag-es/publications/showcase/documents/1074_en.pdf .
Jovanovic, B., Collins, D., Braganza, K, Collins, D, Jakob, D. and Jones, D.A. 2011. A high quality monthly total cloud amount dataset for Aus-tralia. Climatic Change, 108, 485–517.
Jovanovic, B., Collins, D., Braganza, K., Collins, D. and Jones, D.A. 2012. Climate variations and change evident in high-quality climate data for Australia’s Antarctic and remote island weather stations. Aust. Met. Oceanogr. J., 62, 247–61.
Karl T.R., Derr, V.E., Easterling, D.R., Folland, C.K., Hofmann, D.J., Levi-tus, S., Nicholls, N., Parker, D.E. and Withee, G.W. 1995. Critical issues for long-term climate monitoring. Climatic Change, 31, 185–221.
Kennedy, J.J, Rayner, N.A., Smith, R.O., Parker, D.E. and Saunby, M. 2011. Reassessing biases and other uncertainties in sea surface temperature observations measured in situ since 1850: 2. Biases and homogeniza-tion. J. Geophys. Res., 116, D14104, doi:10.1029/2010JD015220.
Krishna, R. 2009. Brief history of the Fiji Meteorological Service, Infor-mation Sheet No. 2. Climate Services Division, Fiji Meteorological Service.
Manton, M.J., Della-Marta, P.M., Haylock, M.R., Hennessy, K.J., Nicholls, N., Chambers, L.E., Collins, D.A., Daw, G., Finet, A., Gunawan, D., Inape, K., Isobe, H., Kestin, T.S., Lefale, P., Leyu, C.H., Lwin, T., Mai-trepierre, L., Ouprasitwong, N., Page, C.M., Pahalad, J., Plummer, N., Salinger, M.J., Suppiah, R., Tran, V.L., Trewin, B., Tibig I. and Yee, D. 2001. Trends in extreme daily rainfall and temperature in Southeast Asia and the South Pacific: 1961–1998. Int. J. Climatol., 21, 269–84.
Morice, C.P., Kennedy, J.J., Rayner, N.A. and Jones P.D. 2012. Quantify-ing uncertainties in global and regional temperature change using an ensemble of observational estimates: The HadCRUT4 dataset. J. Geo-phys. Res., doi:10.1029/2011JD017187, in press.
IPCC. 2007. Climate Change 2007: The Physical Science Basis. Contribu-tion of Working Group I to the Fourth Assessment Report of the In-tergovernmental Panel on Climate Change [Solomon, S., D. Qin, M. Manning, Z. Chen, M. Marquis, K.B. Averyt, M. Tignor and H.L. Miller (eds.)]. Cambridge University Press, Cambridge, United Kingdom and New York, NY, USA, 996 pp.
Menne, M.J., Williams Jr., C.N. and Palecki, M.A. 2010. On the reliability of the U.S. surface temperature record. J. Geophys. Res., 115, D11108, doi:10.1029/2009JD013094.
Mimura, N., Nurse, L., McLean, R.F., Agard, J., Briguglio, L., Lefale, P., Payet, R.and Sem, G. 2007. Small islands. Climate Change 2007: Im-pacts, Adaptation and Vulnerability. Contribution of Working Group II to the Fourth Assessment Report of the Intergovernmental Panel on Climate Change, M.L. Parry, O.F. Canziani, J.P. Palutikof, P.J. van der Linden and C.E. Hanson, Eds., Cambridge University Press, Cam-bridge, UK, 687–716.
Nicholls, N. 2004. The changing nature of Australian droughts. Climatic Change, 63, 323–36.
Page C.M., Nicholls N., Plummer N., Trewin, B.C., Manton M.J., Alexan-der L., Chambers L.E., Choi Y., Collins D.A., Gosai A., Della-Marta P., Haylock M.R., Inape K., Laurent V., Maitrepierre L., Makmur . E.P., Nakamigawa H., Ouprasitwong N., McGree S., Pahalad J., Salinger M. J., Tibig L., Tran, K.T., Vediapan, D. and Zhai, P. 2004. Data rescue in the South-east Asia and South Pacific region: Challenges and Opportuni-ties. Bull. Am. Meteorol. Soc., 85, 1483–9.
Peterson, T.C, and Manton, M.J. 2008. Monitoring changes in climate ex-tremes: a tale of international collaboration. Bull. Am. Meteorol. Soc., 89, 1266–71.
Power, S. and Smith, I. 2007. Weakening of the Walker Circulation and ap-parent dominance of El Niño both reach record levels, but has ENSO really changed? Geophys. Res. Lett., 34, doi:10.129/2007/GL30854.
Power, S.B., Andreas, S., Cambers, G., Jones, D., Hennessy, K. 2011. The Pacific Climate Change Science Program. Bull. Am. Meteorol. Soc., 92, 1409–11.
doi: http://dx.doi.org/10.1175/BAMS-D-10–05001.1 Reeves, J., Chen, J., Wang, X.L., Lund, R., Lu, Q. 2007. A review and
comparison of changepoint detection techniques for climate data. J. Appl. Meteorol. . Climatol., 46, 900–15. DOI: 10.1175/JAM2493.1.
Reynolds, R.W., Smith, T.M., Liu, C., Chelton, D.B., Casey, K.S. and Schlax, M.G. 2007. Daily High-Resolution-Blended Analyses for Sea Surface Temperature. J. Clim., 20, 5473–96. doi: http://dx.doi.org/10.1175/2007JCLI1824.1
Salinger, M.J. 1995. Southwest Pacific temperatures: trends in maximum and minimum temperatures. Atmos. Res., 37, 87–99.

Jones et al.: An updated analysis of homogeneous temperature data at Pacific Island stations 301
Appendix A
List of Pacific island stations with homogeneous annual mean temperature data used in this study, their locations and period of record.
Country Station Longitude LatitudeAvailable period of homogenous
record
Australia
Willis Island 149.98°E 16.30°S 1939–2010
Norfolk Island Aero 167.94°E 29.04°S 1944–2010
Lord Howe Island Aero 159.08°E 31.54°S 1940–2010
Cook Islands
Rarotonga 159.80°W 21.20°S 1930–2009
Penrhyn 158.05°W 9.03°S 1950–1995
Aitutaki 159.77°W 18.83°S 1934–1995
Federated States of Micronesia
Pohnpei 158.22°E 6.97°N 1952–2010
Yap 138.08°E 9.48°N 1952–2010
Chuuk 151.83°E 7.45°N 1952–2010
Fiji Islands
Rotuma 177.05°E 12.50°S 1958–2010
Nadi Airport 177.45°E 17.77°S 1943–2010
Suva 178.45°E 18.15°S 1942–2010
Ono–I–Lau 178.72°W 20.67°S 1946–2008
French Polynesia
Rapa 144.33°W 27.62°S 1952–2010
Atuona 139.03°W 9.82°S 1961–2010
Tahiti-Faaa 149.62°W 17.55°S 1958–2010
Takaroa 145.03°W 14.48°S 1958–2010
Rikitea 134.97°W 23.13°S 1981–2010
Kiribati
Tarawa 172.92°E 1.35°N 1948–2009
Butaritari 172.78°E 3.03°N 1957–2009
Kanton 171.71°W 2.77°S 1987–2010
Marshall IslandsKwajalein/Bucholz Aaf 167.73°E 8.73°N 1960–2010
Majuro 171.38°E 7.08°N 1956–2010
Niue Hanan Airport 169.93°W 19.08°S 1941–2010
New Zealand Raoul Island 177.92°W 29.25°S 1941–2010
Palau Koror 134.48°E 7.33°N 1953–2010
Papua New Guinea
Wewak 143.67°E 3.58°S 1957–2008
Madang 145.80°E 5.22°S 1951–2004
Port Moresby 147.22°E 9.38°S 1940–2007
Momote 147.42°E 2.05°S 1951–2006
Kavieng 150.82°E 2.57°S 1962–2007
Misima 152.83°E 10.68°S 1957–2008
Samoa Apia 171.78°W 13.80°S 1930–2010
Solomon Islands
Munda 157.27°E 8.33°S 1962–2008
Honiara 159.97°E 9.42°S 1951–2010
Henderson 160.05°E 9.42°S 1975–2010
Santa Cruz 165.80°E 10.70°S 1971–2010
TongaLupepau'u (Vava’u) 173.97°W 18.58°S 1957–2010
Nuku'alofa 175.18°W 21.13°S 1949–2010
Tuvalu Funafuti 179.22°E 8.50°S 1946–2010

302 Australian Meteorological and Oceanographic Journal 63:2 June 2013
Country Station Longitude LatitudeAvailable period of homogenous
record
Vanuatu
Sola 167.55°E 13.85°S 1951–2010
Pekoa Airport 167.22°E 15.52°S 1974–2010
Bauerfield Airport 168.30°E 17.70°S 1948–2010
Lamap (Malekula) 167.80°E 16.42°S 1961–2005
White Grass Airport 169.22°E 19.45°S 1973–2009
Aneityum 169.77°E 20.23°S 1949–2010
![MCCI IN AN HOMOGENEOUS POOL: LESSONS LEARNT FROM …...benchmark [10] and from updated data presented in the final MCCI program report [4]. The temperature of upper walls receiving](https://static.fdocuments.net/doc/165x107/6075f4cd6c570d27650ff55a/mcci-in-an-homogeneous-pool-lessons-learnt-from-benchmark-10-and-from-updated.jpg)