An Rx for Treasury Managers When Healthcare Reform Arrives · An Rx for Treasury Managers When...
35
An Rx for Treasury Managers When Healthcare Reform Arrives Rick Noble, CTP Staff Vice President WellPoint, Inc. October 29, 2013 Las Vegas, NV Dale Sorenson, CTP Vice President Associated Bank
Transcript of An Rx for Treasury Managers When Healthcare Reform Arrives · An Rx for Treasury Managers When...
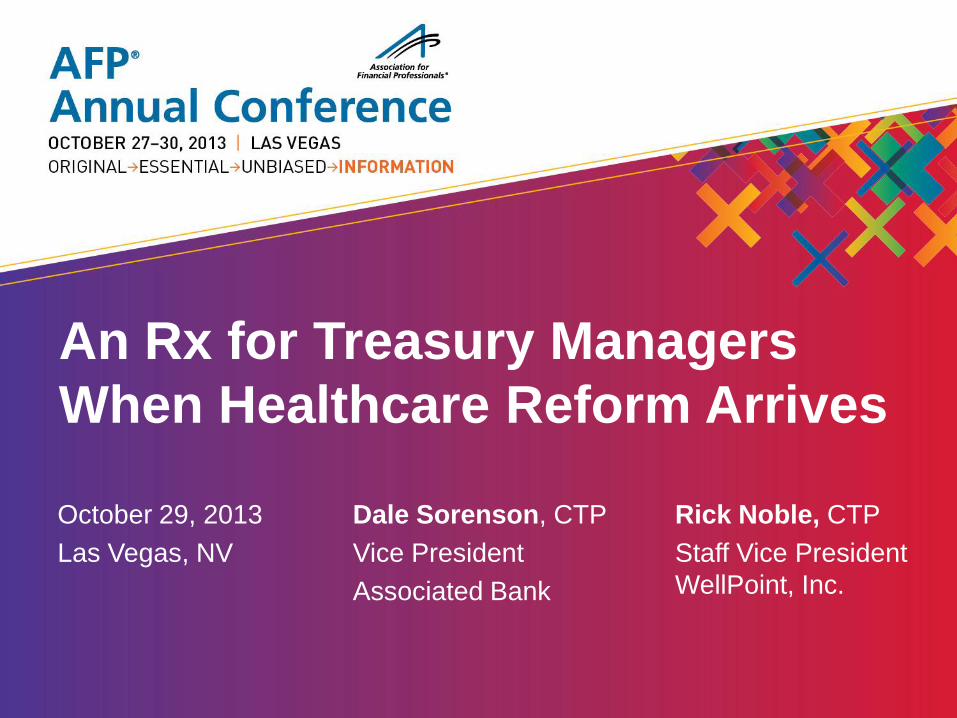
An Rx for Treasury Managers
When Healthcare Reform Arrives
Rick Noble, CTP
Staff Vice President
WellPoint, Inc.
October 29, 2013
Las Vegas, NV
Dale Sorenson, CTP
Vice President
Associated Bank
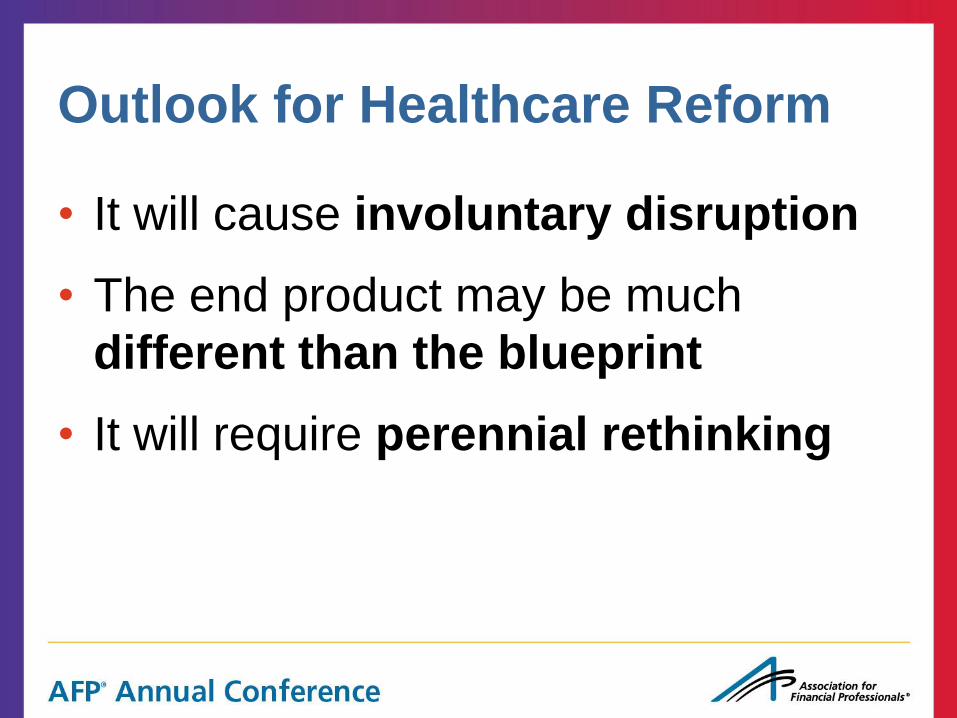
Outlook for Healthcare Reform
• It will cause involuntary disruption
• The end product may be much
different than the blueprint
• It will require perennial rethinking
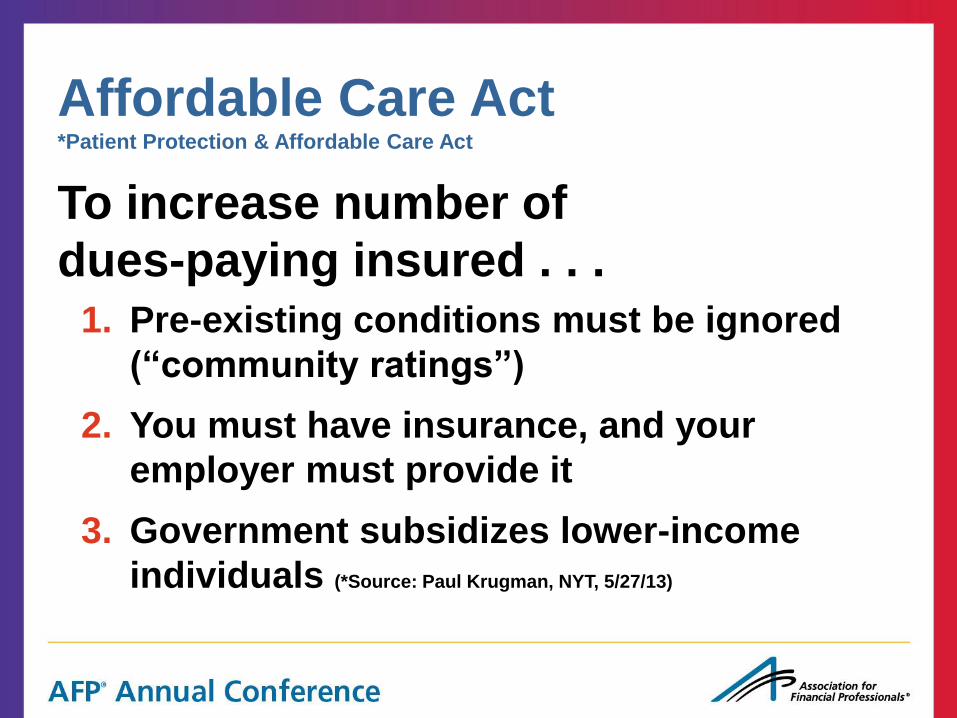
Affordable Care Act *Patient Protection & Affordable Care Act
To increase number of
dues-paying insured . . . 1. Pre-existing conditions must be ignored
(“community ratings”)
2. You must have insurance, and your
employer must provide it
3. Government subsidizes lower-income
individuals (*Source: Paul Krugman, NYT, 5/27/13)
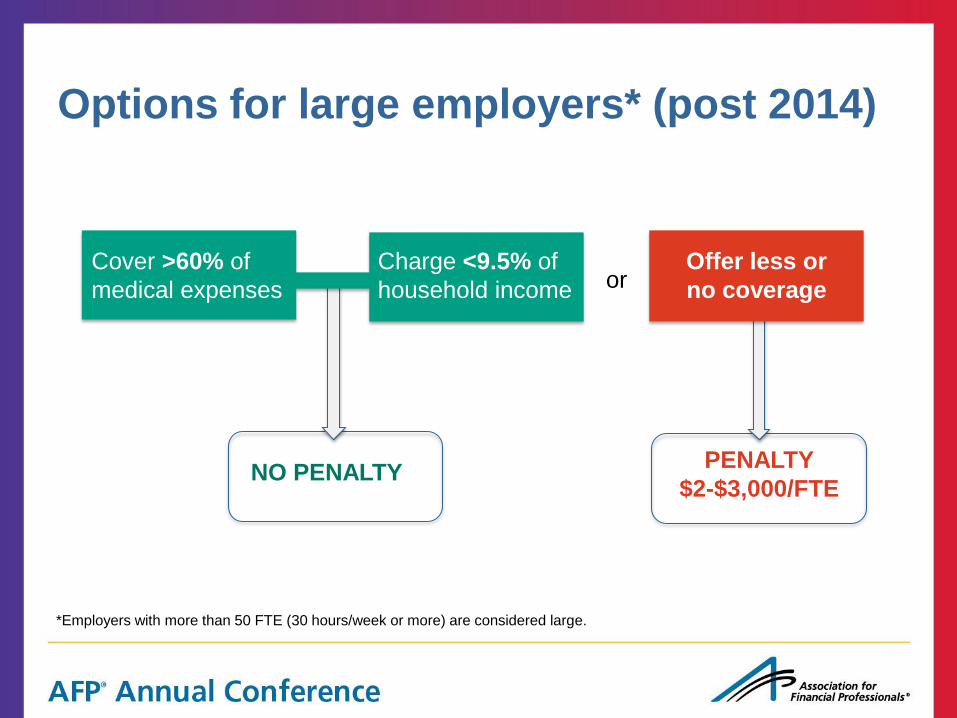
Options for large employers* (post 2014)
Cover >60% of
medical expenses
Charge <9.5% of
household income Less insurance
and/or more pay or
NO PENALTY PENALTY
$2-$3,000/FTE
Offer less or
no coverage
*Employers with more than 50 FTE (30 hours/week or more) are considered large.
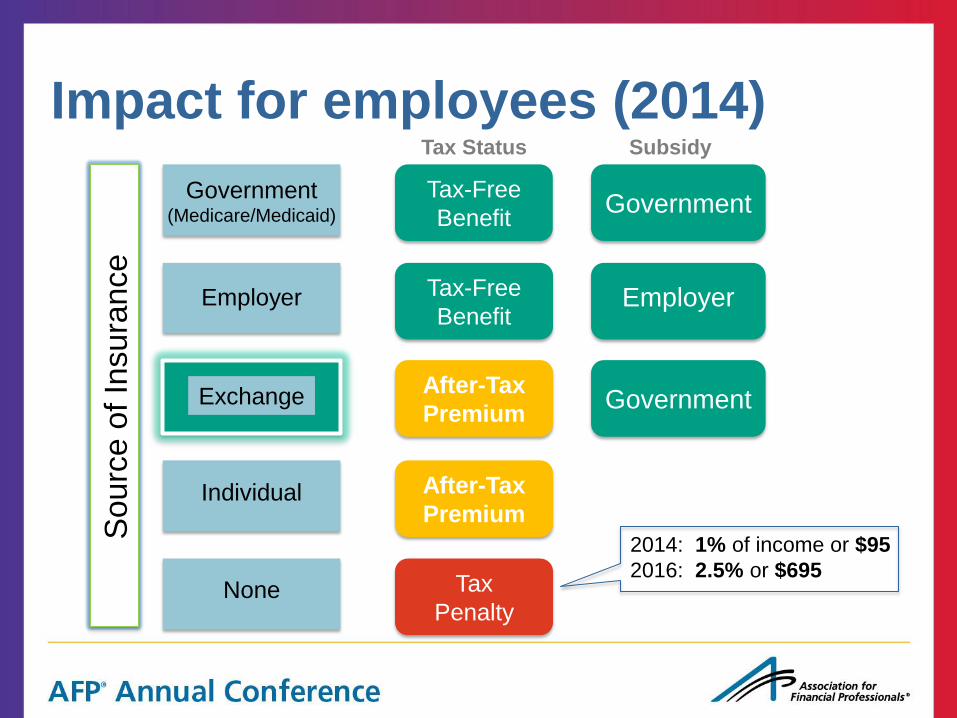
Impact for employees (2014)
Government (Medicare/Medicaid)
Employer
Individual
None
Exchange S
Tax Status
Sourc
e o
f In
sura
nce
Subsidy
Tax
Free
Government
Government
Tax
Penalty
Tax
Penalty
Tax-Free
Benefit
Employer
2014: 1% of income or $95
2016: 2.5% or $695
Tax-Free
Benefit
After-Tax
Premium
After-Tax
Premium
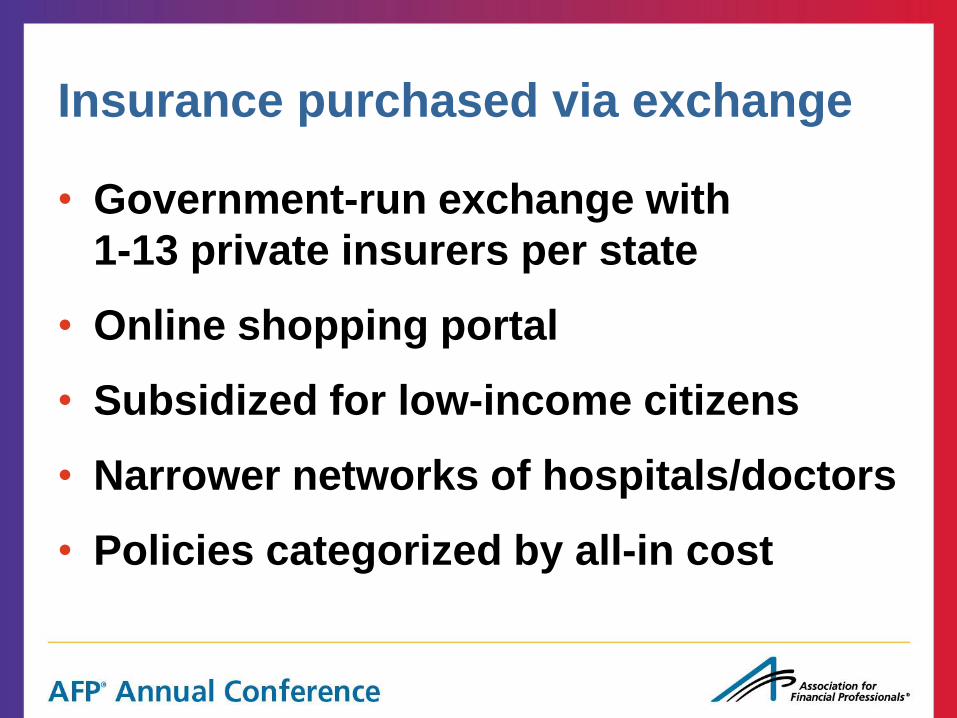
Insurance purchased via exchange
• Government-run exchange with
1-13 private insurers per state
• Online shopping portal
• Subsidized for low-income citizens
• Narrower networks of hospitals/doctors
• Policies categorized by all-in cost
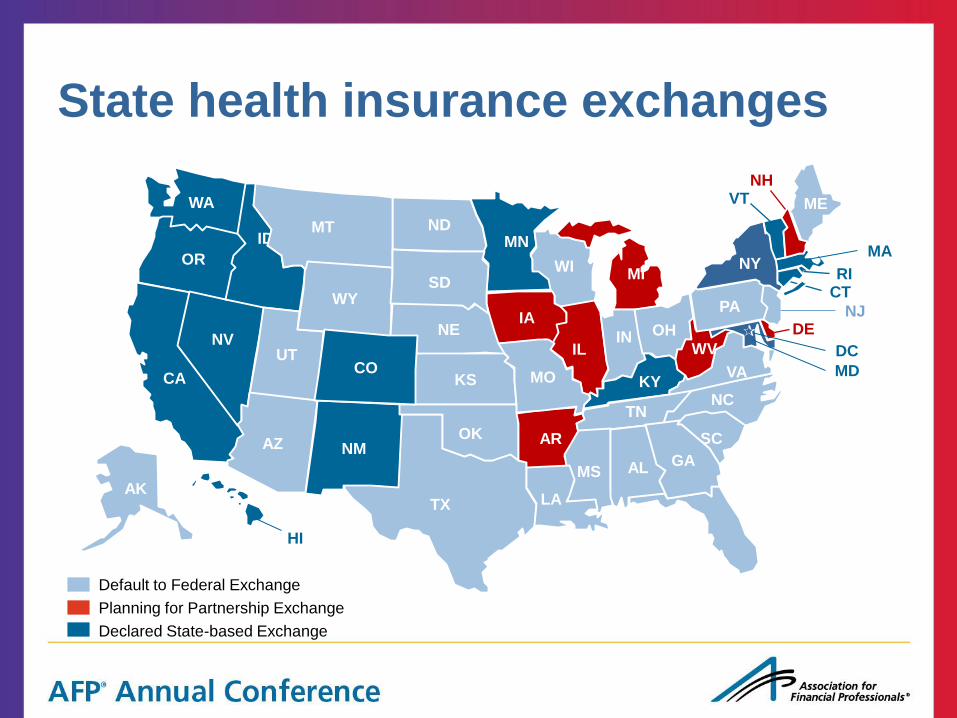
State health insurance exchanges
Default to Federal Exchange
Planning for Partnership Exchange
Declared State-based Exchange
MA
ME
CT
TX
FL
WA
OR
ID
UT
WY
AZ NM
ND
NE
KS
OK AR
MN
IA
MI
IL
KY
TN
MS AL
SC
NC
WV
PA
CA
NV
WI
IN
NY
NH
MT
SD
LA
GA
MO CO
AK
OH
VA
VT
RI
DE NJ
MD
DC
HI
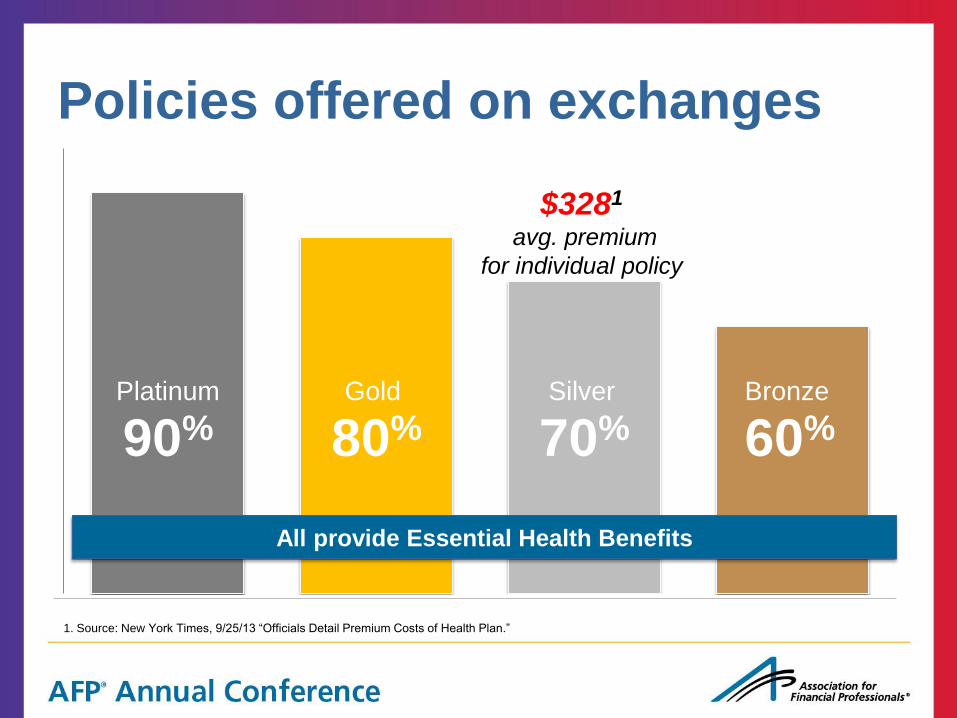
Policies offered on exchanges
$3281 avg. premium
for individual policy
Platinum Gold Silver Bronze
90% 80% 70% 60%
All provide Essential Health Benefits
1. Source: New York Times, 9/25/13 “Officials Detail Premium Costs of Health Plan.”
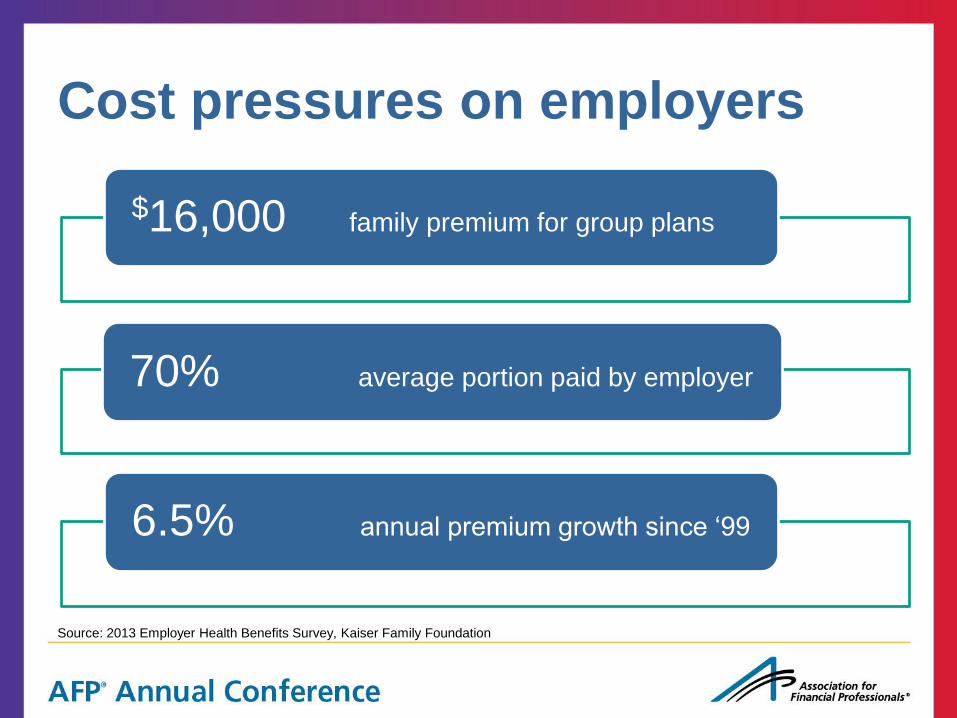
Cost pressures on employers
$16,000 family premium for group plans
70% average portion paid by employer
6.5% annual premium growth since ‘99
Source: 2013 Employer Health Benefits Survey, Kaiser Family Foundation
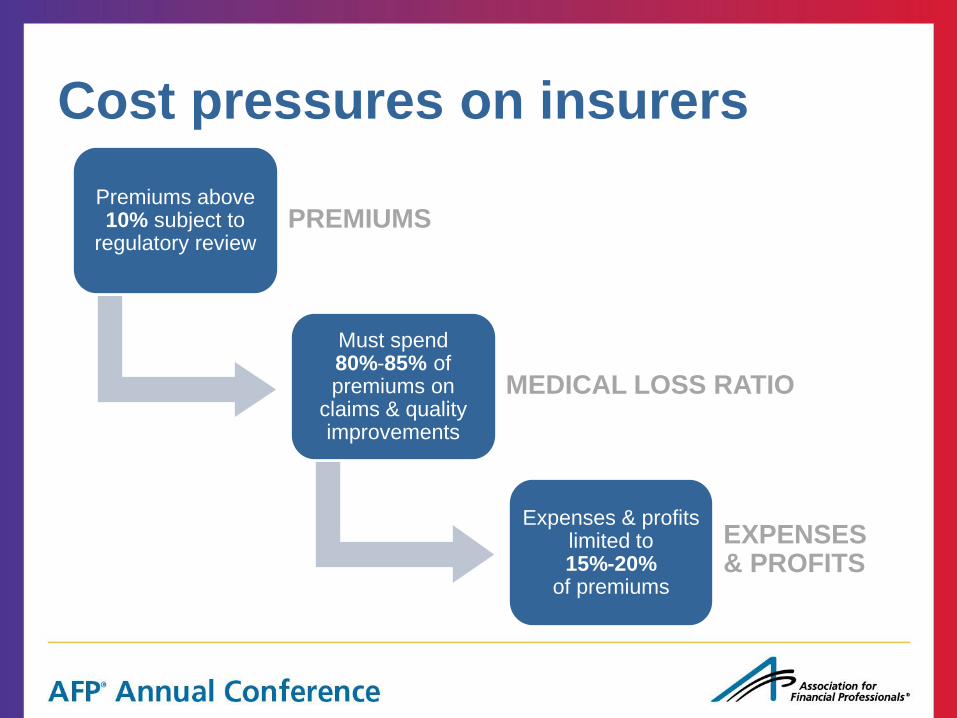
Cost pressures on insurers
Premiums above 10% subject to
regulatory review PREMIUMS
Must spend 80%-85% of premiums on
claims & quality improvements
MEDICAL LOSS RATIO
Expenses & profits limited to 15%-20%
of premiums
EXPENSES & PROFITS
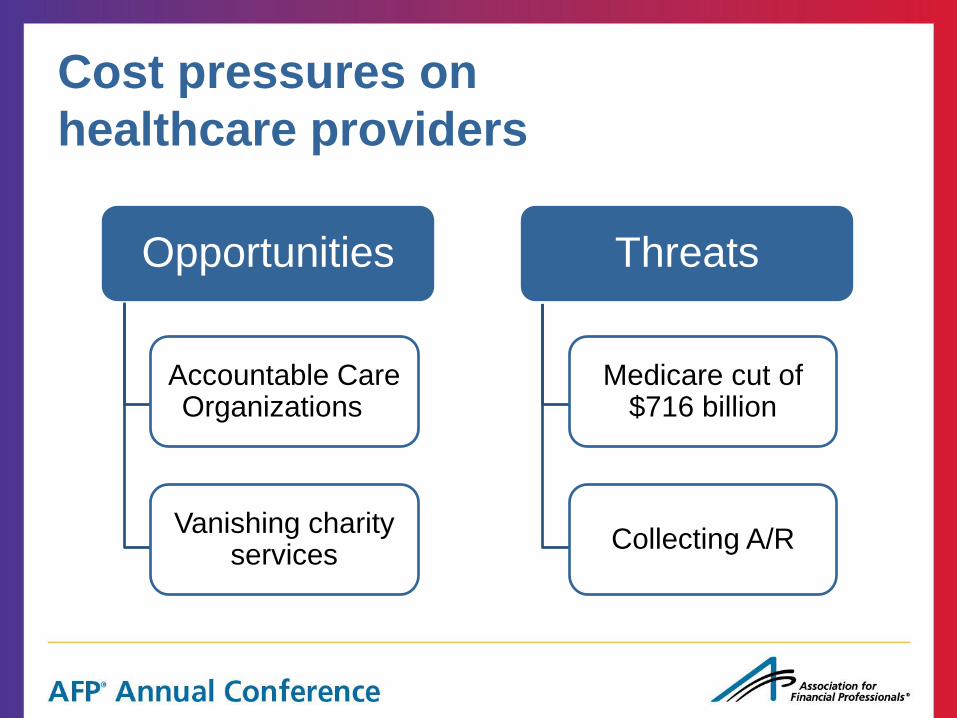
Cost pressures on
healthcare providers
Opportunities
Accountable Care Organizations
Vanishing charity services
Medicare cut of $716 billion
Collecting A/R
Threats
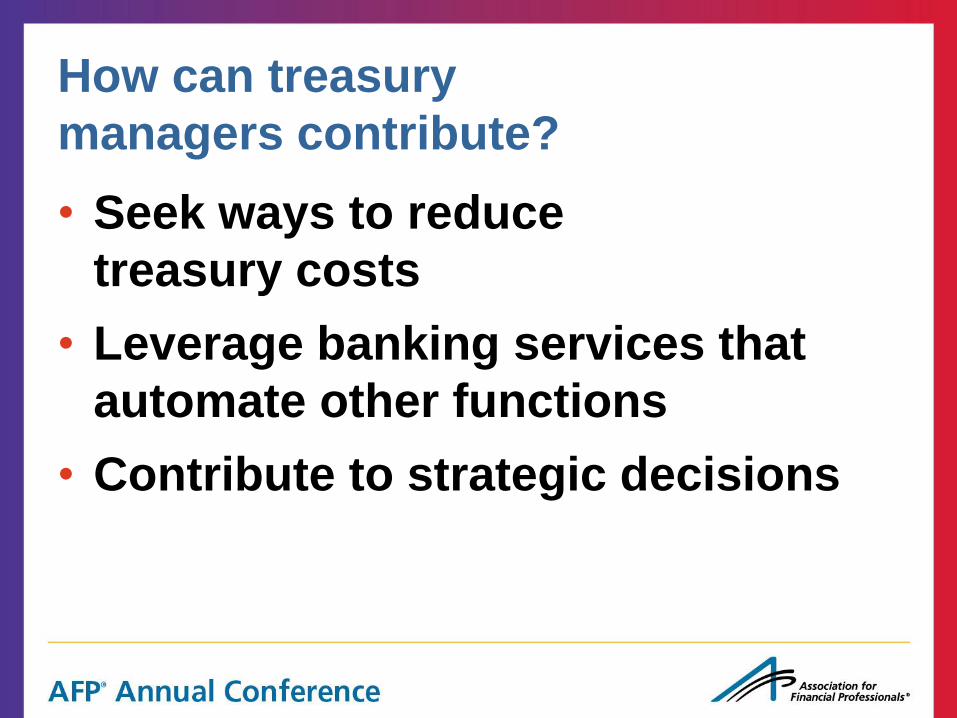
How can treasury
managers contribute?
• Seek ways to reduce
treasury costs
• Leverage banking services that
automate other functions
• Contribute to strategic decisions
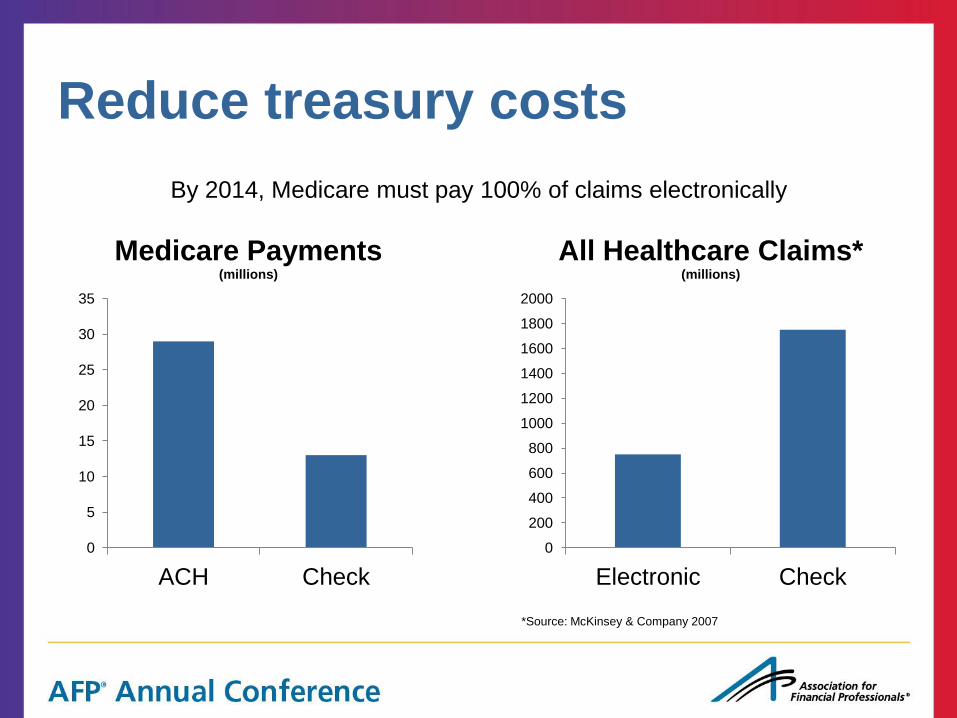
Reduce treasury costs
0
5
10
15
20
25
30
35
ACH Check
Medicare Payments (millions)
0
200
400
600
800
1000
1200
1400
1600
1800
2000
Electronic Check
All Healthcare Claims* (millions)
By 2014, Medicare must pay 100% of claims electronically
*Source: McKinsey & Company 2007
Leverage banking services to
automate other functions
ACH &
Banks
For ACH health care payments, TRN
(Trace Reassociation Number) accelerates cash application (9/20/13)
ERA (Electronic
remittance advice)
Medicare
or
Insurer
Hospital
Medical
Provider
$ + TRN $ + TRN
TRN TRN
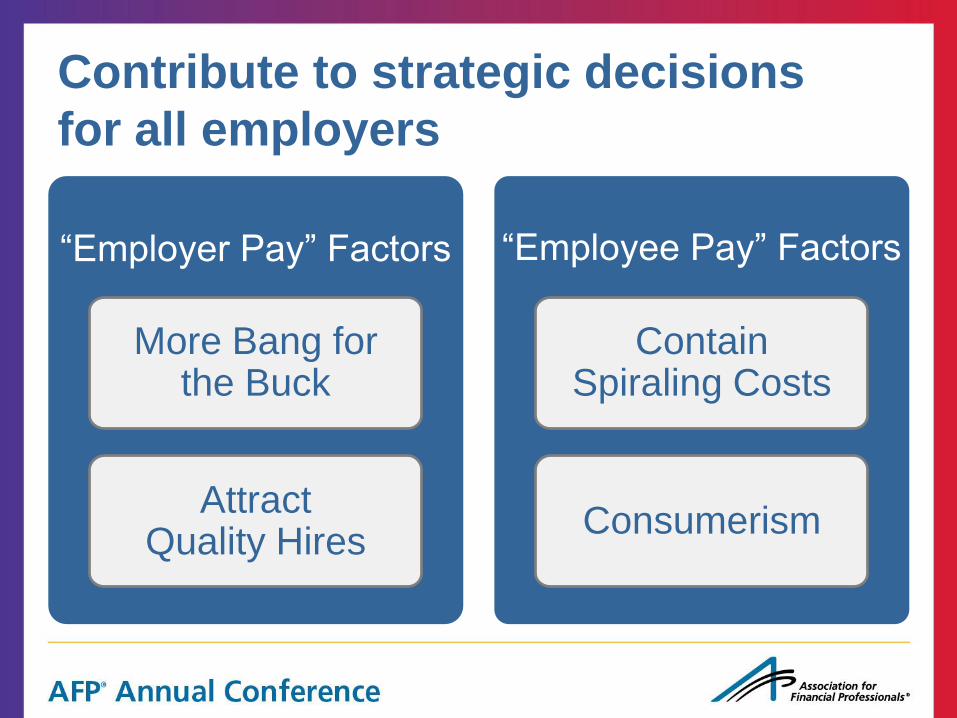
Contribute to strategic decisions
for all employers
“Employer Pay” Factors
More Bang for the Buck
Attract Quality Hires
“Employee Pay” Factors
Contain Spiraling Costs
Consumerism
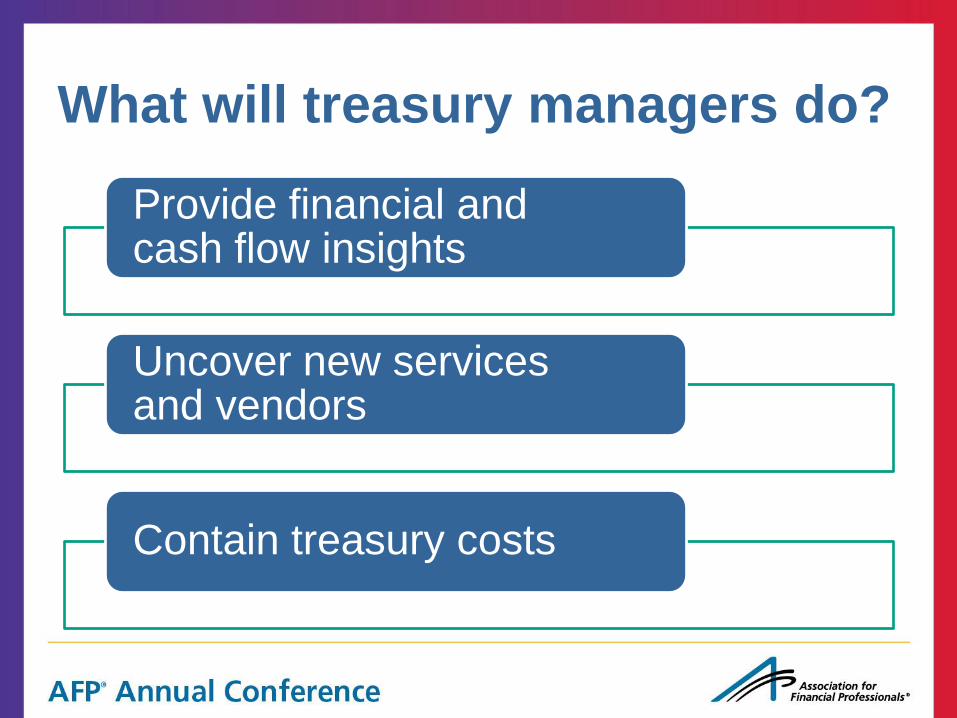
What will treasury managers do?
Provide financial and cash flow insights
Uncover new services and vendors
Contain treasury costs
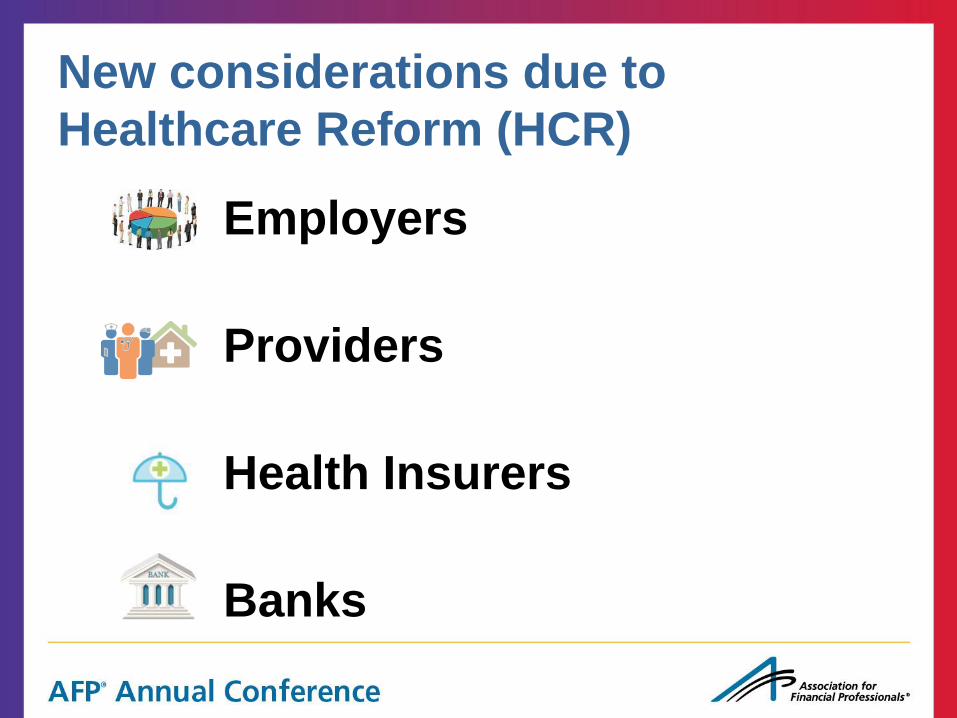
New considerations due to
Healthcare Reform (HCR)
Employers
Providers
Health Insurers
Banks
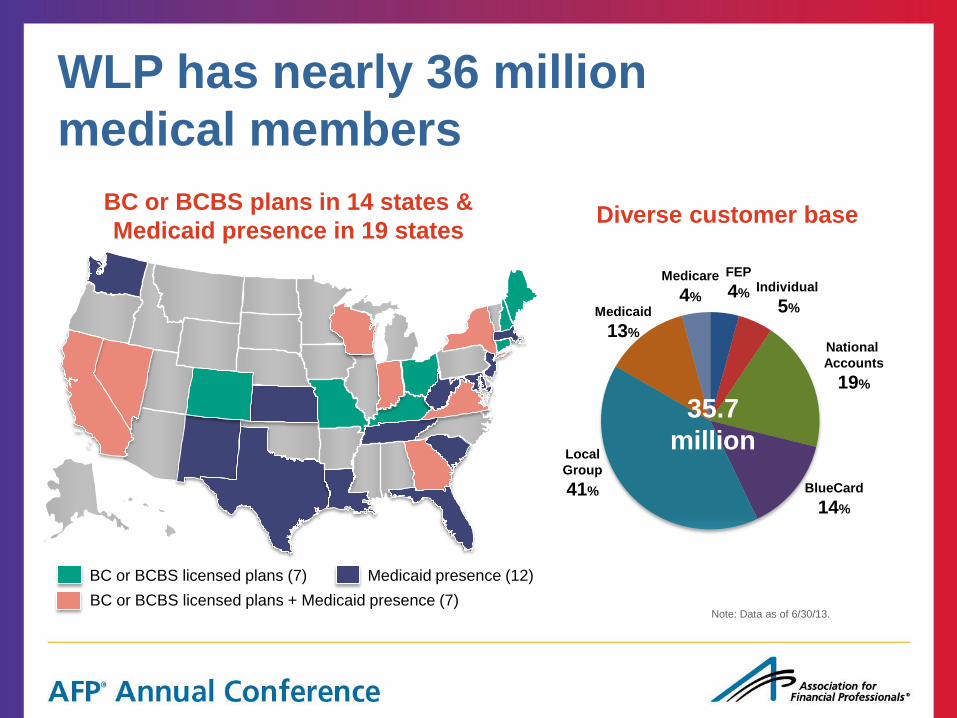
WLP has nearly 36 million
medical members
Note: Data as of 6/30/13.
Medicare
4%
BlueCard
14%
Medicaid
13%
Individual
5%
National
Accounts
19%
Local
Group
41%
FEP
4%
BC or BCBS plans in 14 states &
Medicaid presence in 19 states Diverse customer base
35.7
million
`
BC or BCBS licensed plans (7) Medicaid presence (12)
BC or BCBS licensed plans + Medicaid presence (7)
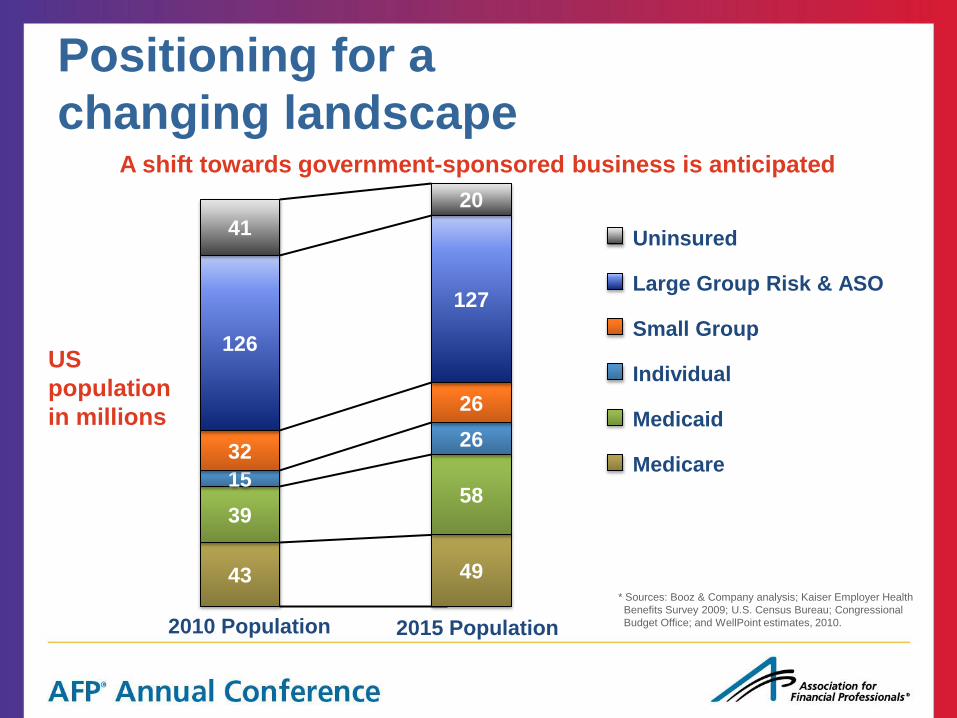
Positioning for a
changing landscape
* Sources: Booz & Company analysis; Kaiser Employer Health
Benefits Survey 2009; U.S. Census Bureau; Congressional
Budget Office; and WellPoint estimates, 2010.
43 49
39 58
15
26 32
26
126
127
41
20
Uninsured
Large Group Risk & ASO
Small Group
Individual
Medicaid
Medicare
2010 Population 2015 Population
A shift towards government-sponsored business is anticipated
US
population
in millions

Employers
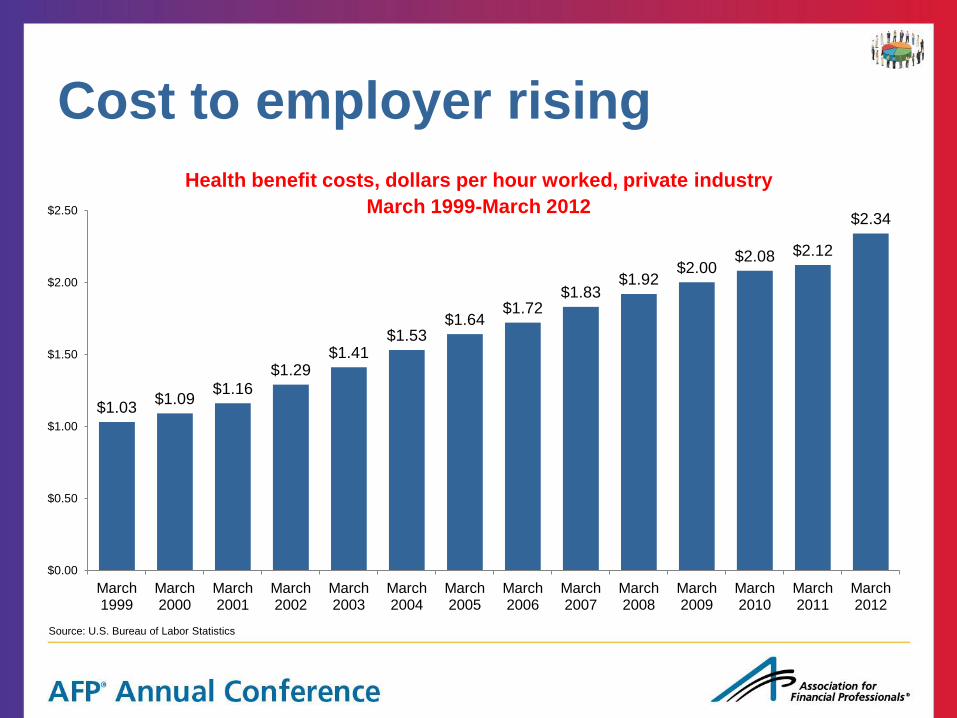
Cost to employer rising
Health benefit costs, dollars per hour worked, private industry
March 1999-March 2012
$1.03 $1.09
$1.16 $1.29
$1.41 $1.53
$1.64 $1.72
$1.83 $1.92
$2.00 $2.08 $2.12
$2.34
$0.00
$0.50
$1.00
$1.50
$2.00
$2.50
March 1999
March 2000
March 2001
March 2002
March 2003
March 2004
March 2005
March 2006
March 2007
March 2008
March 2009
March 2010
March 2011
March 2012
Source: U.S. Bureau of Labor Statistics
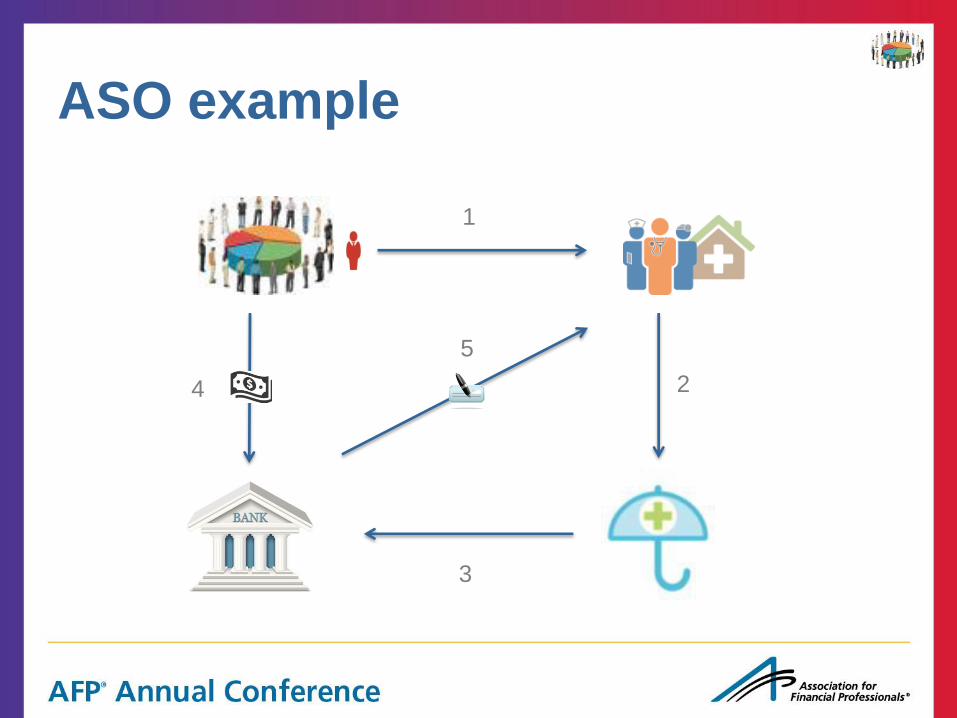
ASO example
1
2
3
4
5
Providers
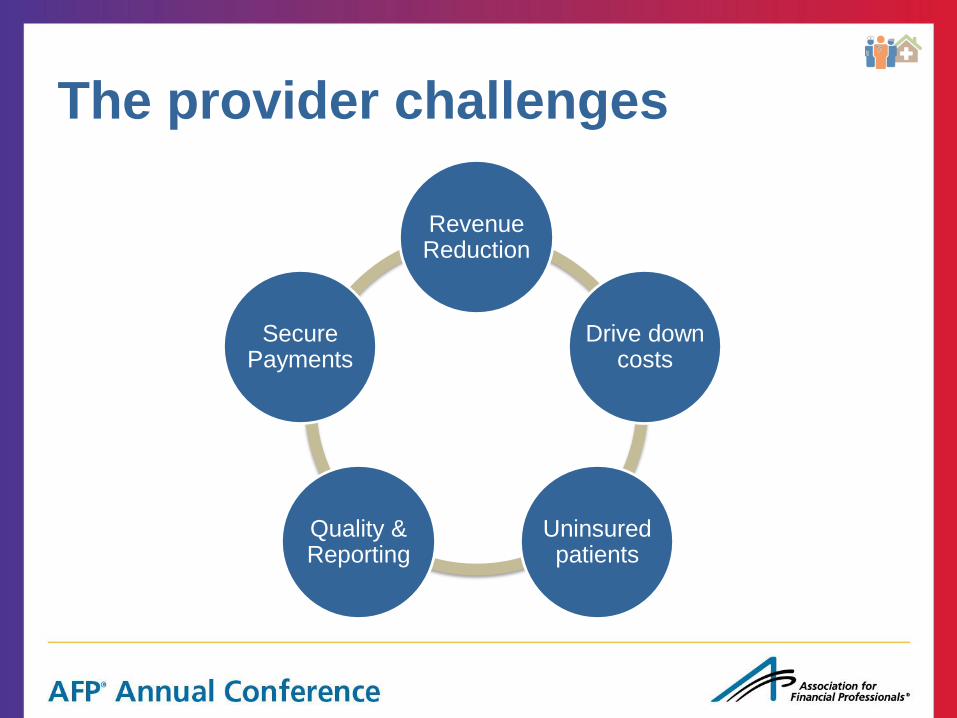
The provider challenges
Revenue Reduction
Drive down costs
Uninsured patients
Quality & Reporting
Secure Payments
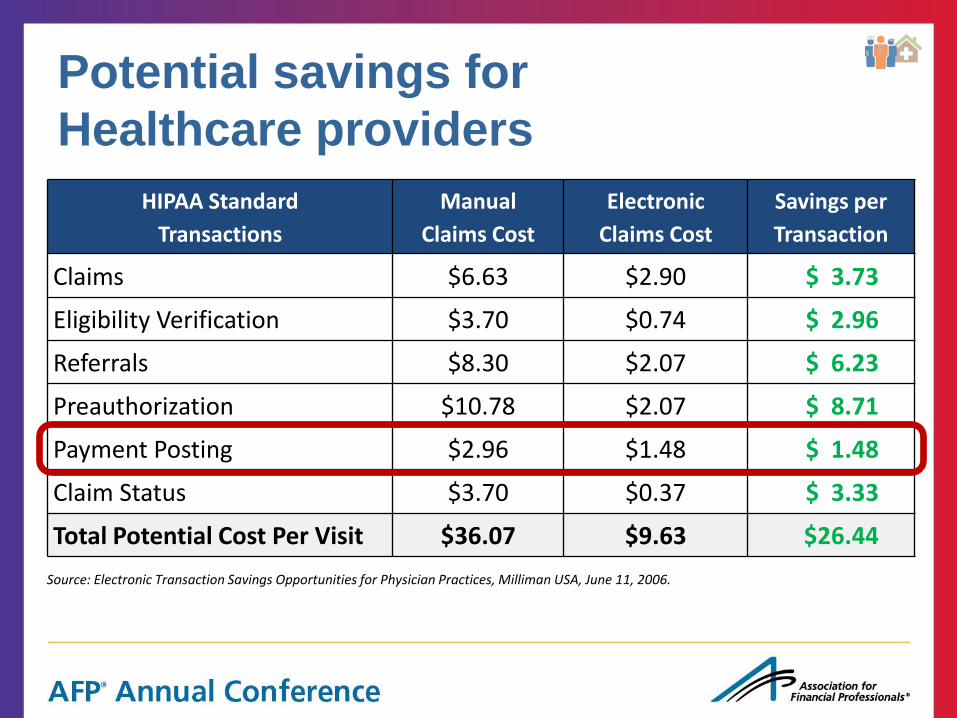
HIPAA Standard
Transactions
Manual
Claims Cost
Electronic
Claims Cost
Savings per
Transaction
Claims $6.63 $2.90 $ 3.73
Eligibility Verification $3.70 $0.74 $ 2.96
Referrals $8.30 $2.07 $ 6.23
Preauthorization $10.78 $2.07 $ 8.71
Payment Posting $2.96 $1.48 $ 1.48
Claim Status $3.70 $0.37 $ 3.33
Total Potential Cost Per Visit $36.07 $9.63 $26.44
Potential savings for
Healthcare providers
Source: Electronic Transaction Savings Opportunities for Physician Practices, Milliman USA, June 11, 2006.
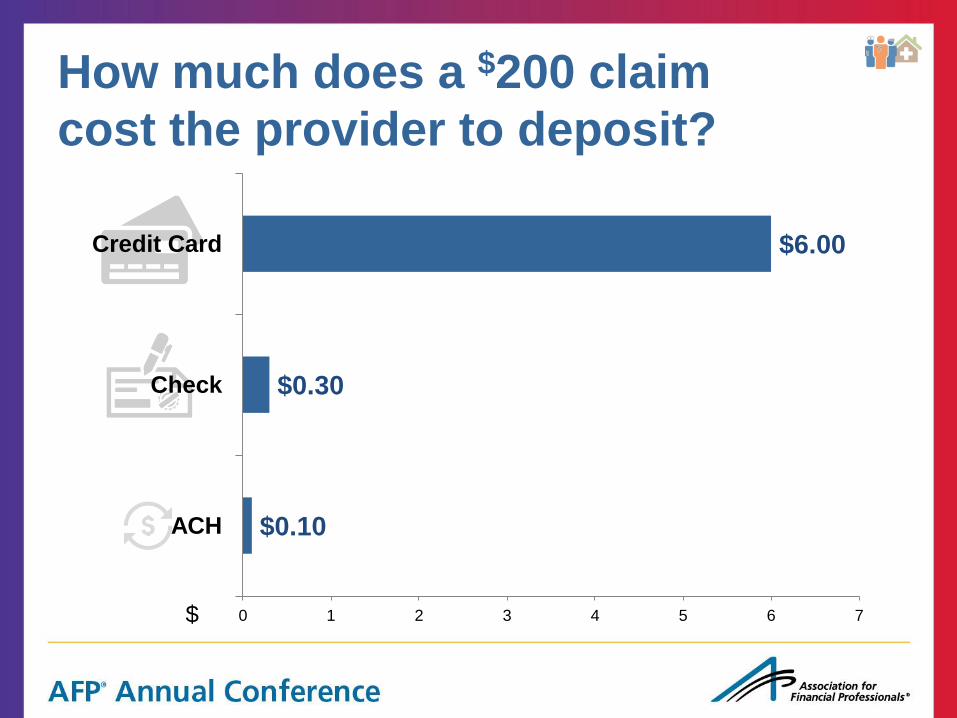
How much does a $200 claim
cost the provider to deposit?
$0.10
$0.30
$6.00
0 1 2 3 4 5 6 7
ACH
Check
Credit Card
$
Health Insurers
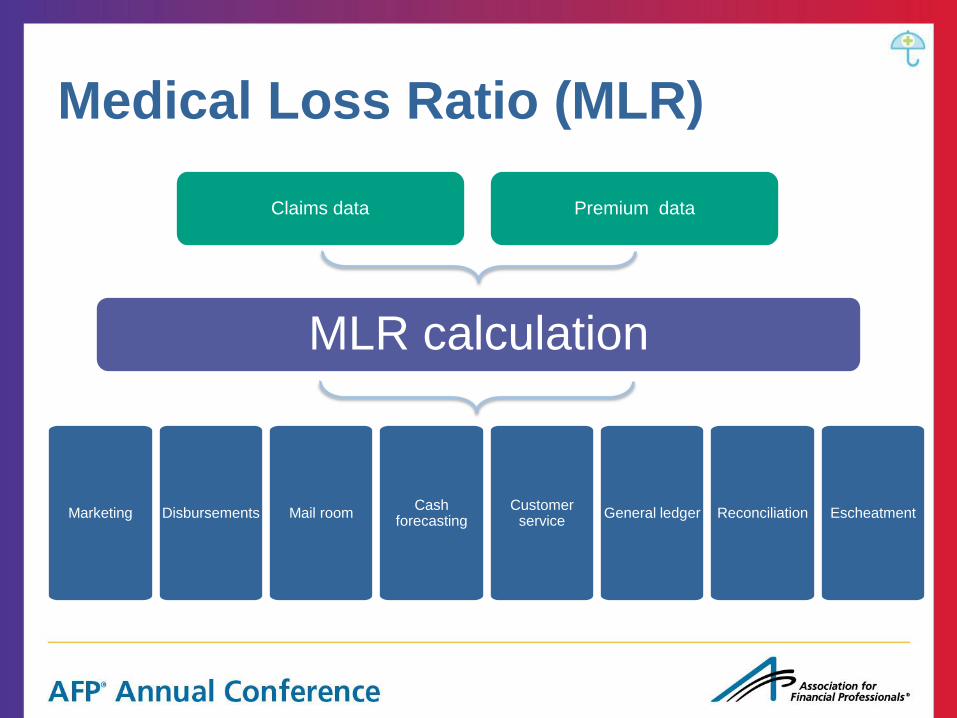
MLR calculation
Marketing Disbursements Mail room Cash
forecasting Customer
service General ledger Reconciliation Escheatment
Medical Loss Ratio (MLR)
Claims data Premium data
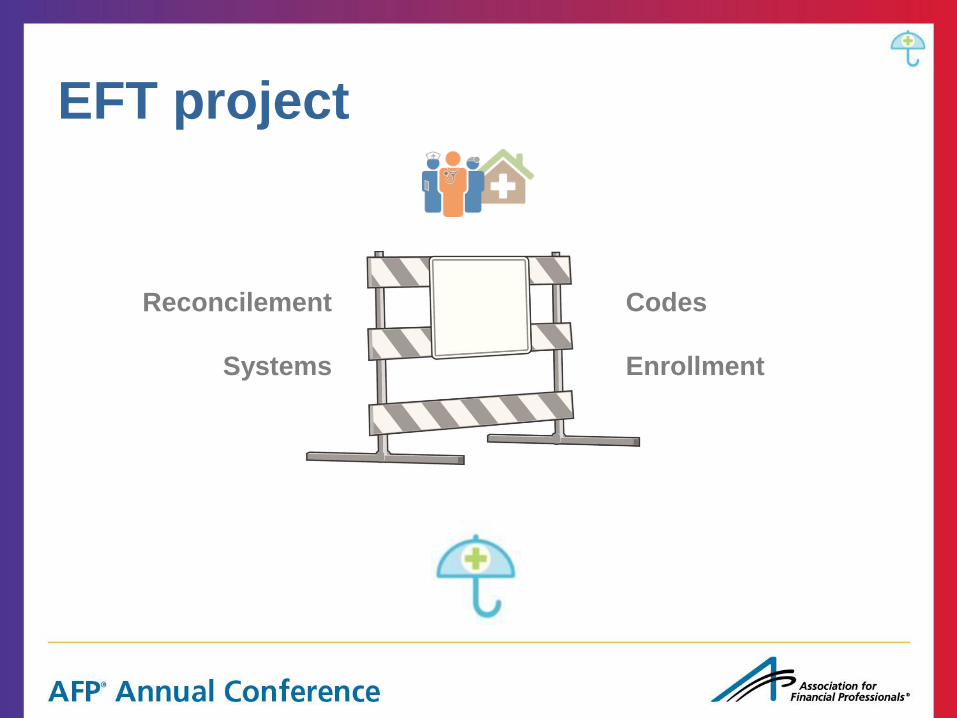
EFT project
Reconcilement
Systems
Codes
Enrollment
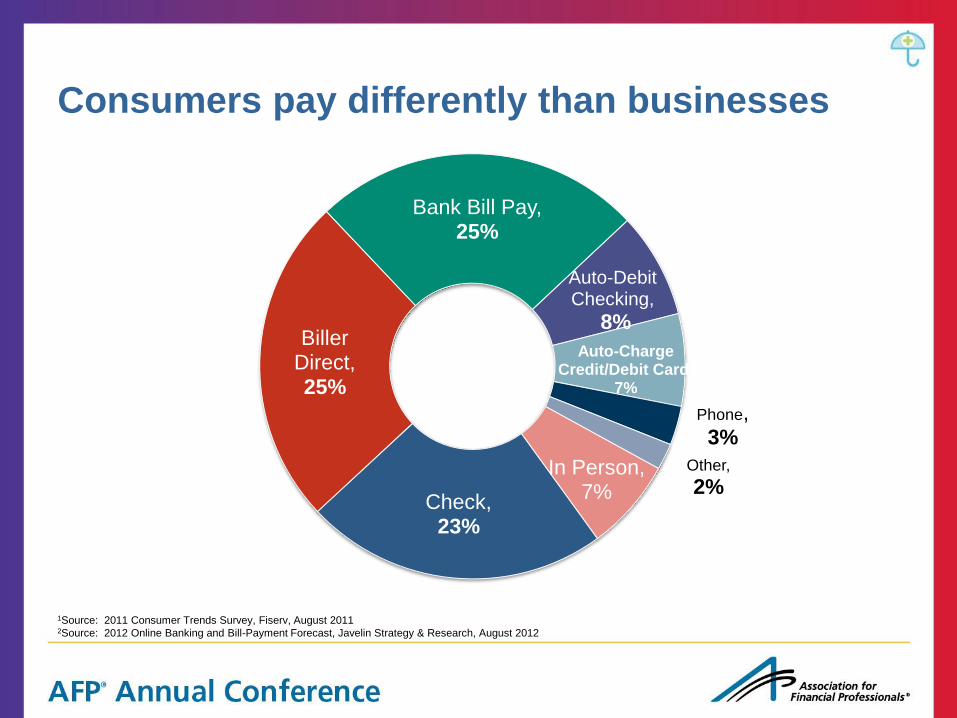
Consumers pay differently than businesses
1Source: 2011 Consumer Trends Survey, Fiserv, August 2011 2Source: 2012 Online Banking and Bill-Payment Forecast, Javelin Strategy & Research, August 2012
Check, 23%
Biller Direct, 25%
Bank Bill Pay, 25%
Auto-Debit Checking,
8%
Auto-Charge Credit/Debit Card,
7%
Phone, 3%
Other,
2% In Person,
7%
Banks
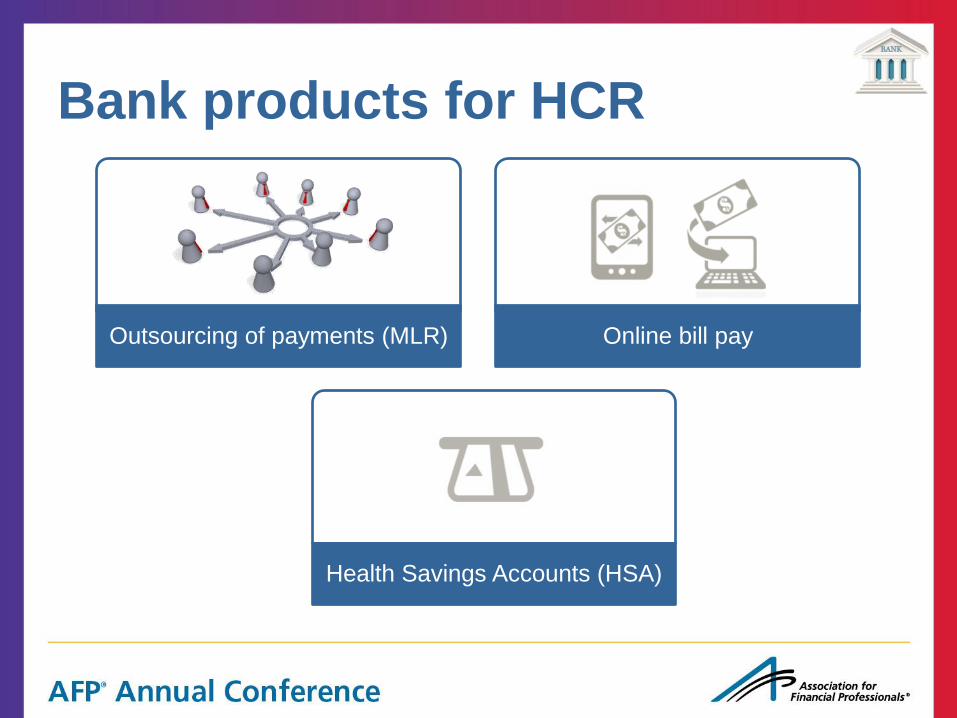
Bank products for HCR
Outsourcing of payments (MLR) Online bill pay
Health Savings Accounts (HSA)

Can you relate?
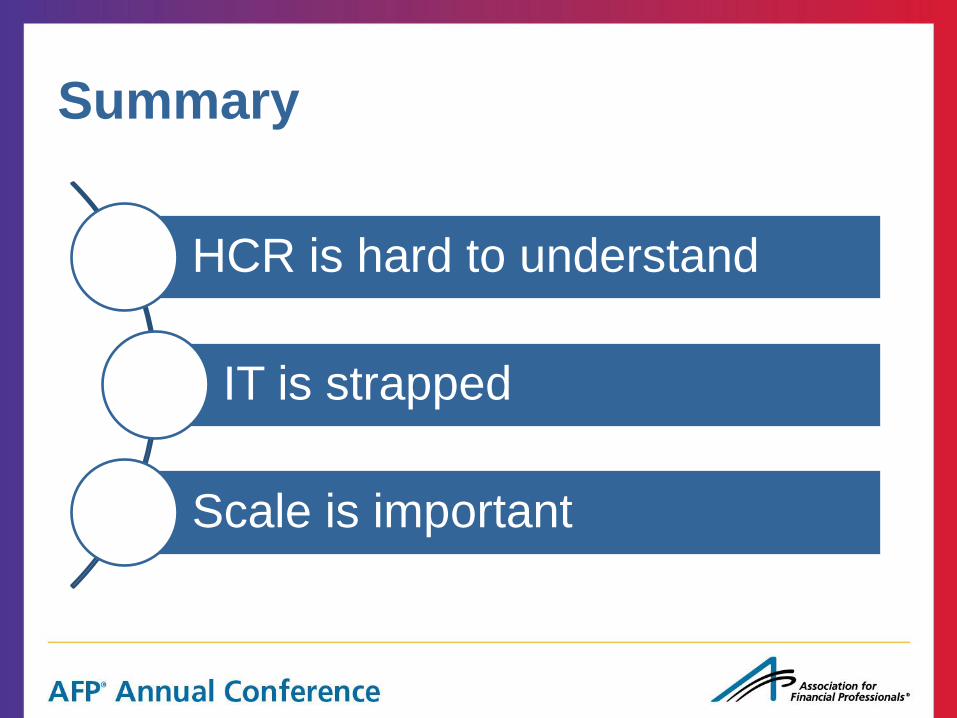
Summary
HCR is hard to understand
IT is strapped
Scale is important
Dale R. Sorenson
Vice President
Associated Bank
312-552-2447
Rick Noble
Staff Vice President
WellPoint, Inc.
317-488-6538