An Overview of the TG 100 Methodology for Risk Analysis ... Spring Presentations/Palta... · An...
39
An Overview of the TG100 Methodology for RiskAnalysis Based Quality Management for Radiation Therapy Jatinder R Palta PhD, FAAPM, FASTRO Professor and Chair Medical Physics, VCU National Chief of Physics, VHA
Transcript of An Overview of the TG 100 Methodology for Risk Analysis ... Spring Presentations/Palta... · An...
An Overview of the TG�100
Methodology for Risk�Analysis
Based Quality Management for
Radiation Therapy
Jatinder R Palta PhD, FAAPM, FASTROProfessor and Chair Medical Physics, VCU
National Chief of Physics, VHA

Disclosure
I am the Vice President of the Center for the
Assessment of Radiological Sciences (CARS),
a non%profit Patient Safety Organization
listed with the Agency for Healthcare
Research and Quality. � The Center is dedicated to improving patient safety
in radiotherapy and radiology

Learning Objectives
� To understand the motivation for a change
from prescriptive QA to risk%based QM
� To understand the basic concept of risk%
based systems approach to quality%
management development
� To learn the vocabulary of the systems
approach

About TG�100 Report
� Title of the report of TG 100, “Application of Risk%Analysis Methods to Radiation Therapy Quality Management”.
� TG members:
Saiful Huq (Chair)
Dick Fraass
Peter Dunscombe
John Gibbons, Jr.
Geoff Ibbott
Arno Mundt
Sasa Mutic
Jatinder Palta
Frank Rath
Bruce Thomadsen
Jeff Williamson

What is TG 100?
� Originally TG%100 charge was to produce a prescriptive QA guidance for technologies new since TG 40.
� After about a year of finding that no two facilities perform IMRT similarly enough that a prescriptive list would work, TG 100 looked to new approaches.
� They finally settled on a systems approach to QM.

What Was Wrong
with the Old Approach?
� The old approach to QA mostly looked at tests
to see if equipment was working (at the time of
the test).
� Most of the time, events happen following an
individual’s error, not machine failure.
� In part, that is because of all the good QA we did.
� But, the QA did nothing to prevent the effects
of human errors.

What Else Was Wrong
with the Old Approach?
� The number of tests were proliferating.
� Time spent in QA left little time of other things
(like thinking).
� The number of events were not decreasing.
� Also, clinical workflow/processes differed
between facilities.
Some Systems�Based Principles
� Recognize that most incidents result from human failures rather than equipment failures.
� Most of the time, those in health care want to do a good job.
� Often, when someone fails, it is because something led them to the wrong action (or inaction).
� The goal is to design the “system:”
� to support staff and equipment to prevent failures
� to be resilient to failures

Very Important Principles
� Recognize that humans will fail – to err is human.
� Recognize that equipment can fail.
What does TG 100 Look Like?
The report comes in two volumes:
� The first is a tutorial on techniques to address quality and safety.
� The second is using the techniques to establish a quality%management program for IMRT as practiced at one of the author’s institution.
Vocabulary 1
� Failure – not achieving the desired end or goal.
� Error – a failure to execute a planned action as intended.
� Mistake – a failure to make an appropriate plan.
� Error of commission – an error occurring while taking an action, also referred to as a blunder.
� Error of omission – an error consisting of failing to take an action when necessary.

Vocabulary 2
� Quality Control – those activities that force a
level of quality on a process.
� Quality Assurance – those activities that give
you confidence that the desired quality is
likely.
� Quality Management – all activities preformed
to achieve the desired quality.
TG�100’s Approach to Risk�
Assessment�Based QM
� TG 100 considered various tools and
approaches to development of QM.
� The approach chosen was felt to be the
easiest adapted in the clinical environment
and had a history of successful application in
health care.

TG�100 Risk�Assessment�Based
QM Development
1. Understand the process – Process Map
2. Assess the hazards % FMEA
3. Establish the failure propagation % Fault Tree
4. Address the hazards
a. Roughly from the greatest risk and most severe
b. Use the most effective tools available
5. Test and evaluate
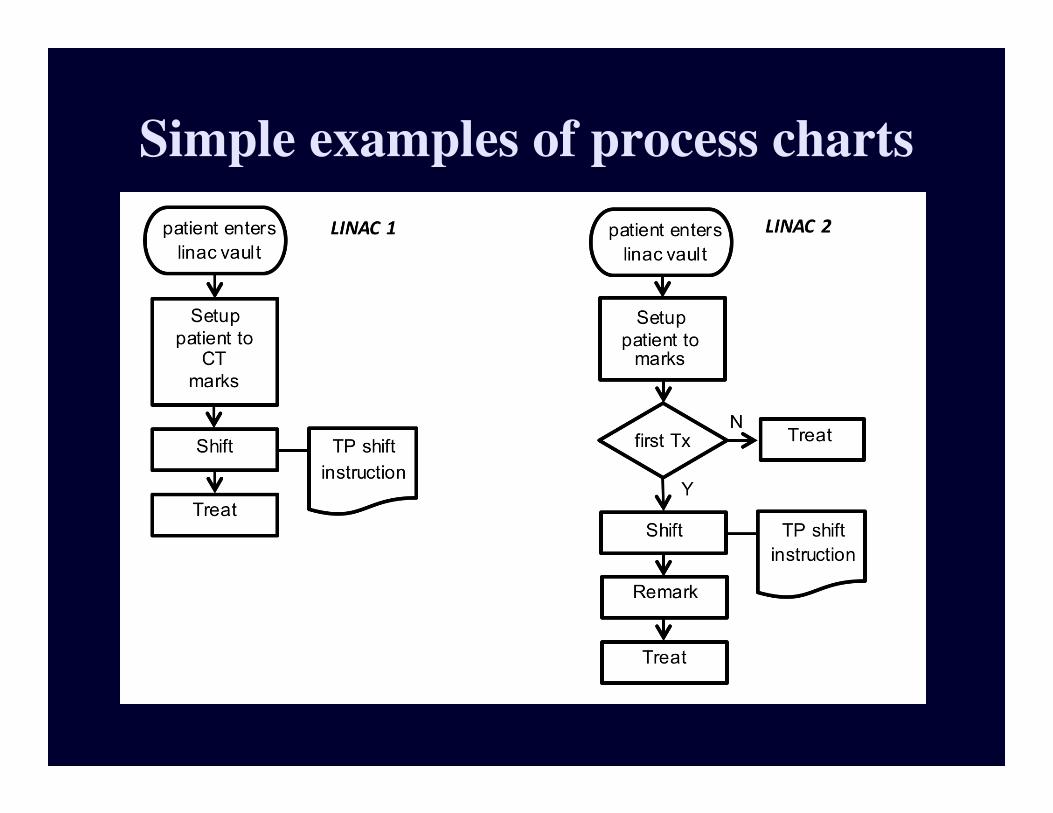
Simple examples of process charts
Successful treatment
Imaging and
diagnosis
12 Subsequent
treatments
Chart filing
Immobilization
equipment
fabricated
Immobilization equipment
documented,
labeled, and stored
Immobilization for
Imaging study
Set up data
documented
Time out
Positioning
Imaging (port films, CBCT, etc) 27
Documentation
Treatment 3
Treatment 3
Documentation
Immobilization
equipment
documented,
labeled, and stored
Scheduling
Approve
plan 7, 20
7 RTP anatomy
contouring
1 Patient database
information entered
Data into electronic
Database 22
Data into written
chart 22
Review of patient
medical history
Immobilization
equipment fabricated
Import and fuse images 16
MD: delineate
GTV/CTV 2,5
PTV construction
Edit density map
for artifacts
Delineate ROIs and
planning structures
Indicate motion/uncertainty
Management 13, 14
Specify registration goals 23, 38
Specify protocol for delineating
target and structures 17
Specify images for
target/structure delineation 11
Specify dose limits and goals 26
Suggest initial guidelines for
treatment parameters
Enter prescription
And planning constraints 18, 21, 45
Setup fields
Setup dose
calc parameters
Optimization/
Dose calculation 12, 31
Evaluate plan 10, 28
6 Initial treatment
planning directive
8 Treatment planning
2 Immobilization
and positioning
3 CT simulation
9 Plan
approval
11 Initial treatment
Patient Identified
Special Instructions
(pacemakers, allergies,
preps, etc.) 9
Account for previous treatments
or chemotherapy 4
Motion management 8
Tx Unit operation
and calibration 3Information on
Previous or
concomitant treatment 22
Protocol for delineation
of targets 17
Patient ID
Treatment Site
Treatment settings
Imaging
Motion
Management 8
Protocol for PTV
Margin 6
Specify PTV Margin
Select Images 25
4D imaging correct 13
Optimization
ROI 33, 44
Optimization
settings 45
Treatment accessories 24
Boolean operations 29, 46
Changes noted 32, 34
Patient information 35
Monitor Pt/Tx 37, 43
Monitor Pt/Tx 37, 43
Specify ROI for optimization 19
Treatment settings
Positioning
Pt prep 35
Changes correct 40, 42Run leaf sequencer
Pt changes noted 42
Imaging Studies
Patient prepped
(contrast, tattoos,
BBs etc.)
Treatment accessories 24
4 Other imaging
Patient informed
Of imaging requirements
Images
Interpreted 1
Position
patient
Make images
5 Transfer
images
Transfer
Other datasets
Transfer CT
Dataset 41
Create case
4D representation
Save patient
Calculate dose
to optimization points
and dose distribution 12, 31
Heterogeneity correction 30
Evaluate leaf sequencer
Evaluate delivery
system limitations
Complete formal
prescription 36
Manual data entry and plan modification 39
Specify treatment course
Delivery protocols
Scheduling
Automatic data entry and plan modification
Prepare DRR and other images
Check version of
plan and patient ID
Annotate localization anatomy
Order fields
Prepare paper chart
Prepare electronic chart 15
Transfer patient data to treatment delivery 15
Define localization imaging
10 Plan
preparation
Enter demographics
Patient Position
Recorded in database
Patient information
Tx Unit operation
and calibration 3
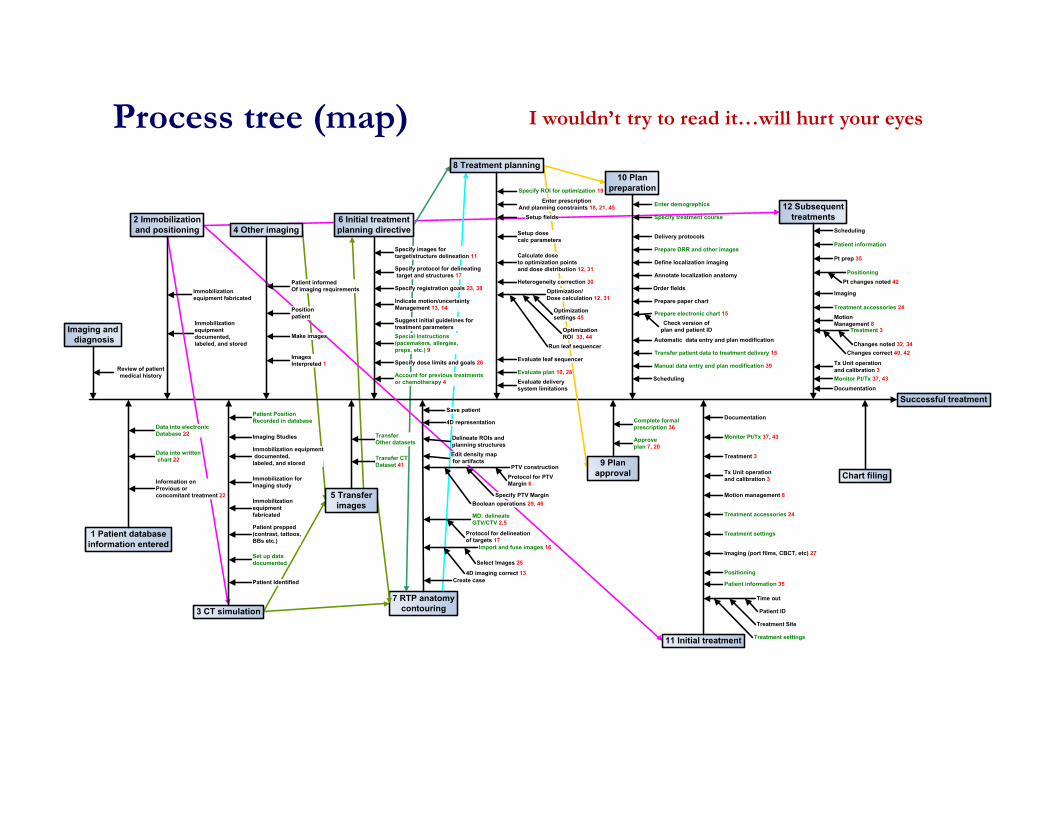
Process tree (map) I wouldn’t try to read it…will hurt your eyes

Verify patient
setup
Register EPID and
pseudo radiograph
Load
EPID
Load
Pseudo%
radiograph
Determine patient
Shifts and rotations
Reimage if necessary a
Verify beam outlinesSelect beam in
record & verify
Image
SetparametersVerify clearance
and achievabilityRegister beam
outline c plan
Repeat for
each beamb
b
Approval to treat
Review setup images
Review beam images
Approve treatment
if good
Day 1 imaging verification
EPID imaging
for localization
Place patient on table
Align mold marks
Pt in mold
Align all
marks
Make AP image
Set
mu
Set gantryMake
exposure Set field size
Set machineMake lateral image
Set
mu
Set gantryMake
exposure
Set machineVerify images are adequate
Approve patient position
a
Process Tree

Process Tree for Prostate
Implants with Loaded Needles
Successful treatment
2 Prepare patient
Identify patient
Anesthetize patient
RO holds stylet
and removes needle
RO inserts needle into
indicated hole in template
RO rotates probe and mounting
bracket to match previous images
5 Review
implant
1 Gathering
materials
MP brings plan to procedure
room identifying needle
location and depth
MP brings needles to
Procedure room
RO checks images along whole
superior;Inferior range
RO scans through
Images looking for gaps
RO adds extra sources
if needed and available
3 Position US
probe
4 Insertion of
needles and sources
MP finds needle in
package or container
MP brings planning images
to procedure room
RO pushes needle until
tip shows at desired depth
Prepare and insert US probe
MP hands needle
to RO
RO determines
starting needle
Bring patient into
procedure room
Move patient to table
Scrub patient
RO selects next needle
1, 4,6,7
2,5,21
3,9,19
8,16,17,18
10,11
12,13,24
14,25
15,20
22,23
1,6,7,18,20
2,5
3,4
8
9,11,12,13
14,15,16,
17
10,
19

Failure Modes and
Effects Analysis � FMEA
Step
Func%
tionPotentialFailure
PotentialCause ofFailure
Potential Effects ofFailure
Current
ControlsO S D RPN
Local
Intermediate
End
(Patient)

Risk Probability Number
� Values for O, S, and D between 1 and 10,
(1 = low danger, 10 = high).
� In industry, RPN <125, little concern, however, in medicine,
RPN > 40 might warrant some consideration.
� How to determine values?
� O = likelihood of occurrence;� S = severity of the effects of the
failure; � D = likelihood failure would go
undetected.
O S D RPN

Probability that a Specific Cause
will Result in a Failure Mode (O)
Qualitative
Review
Ranking Frequency of
Occurrence
Failure is unlikely 1 1/10,000
2 2/10,000
Relatively few
failures
3 5/10,000
4 1/1000
5 <0.2%
Occasional failures 6 <0.5%
7 <1.0%
Repeated failures 8 <2.0%
9 <5.0%
Failures are
inevitable
10 >5.0%
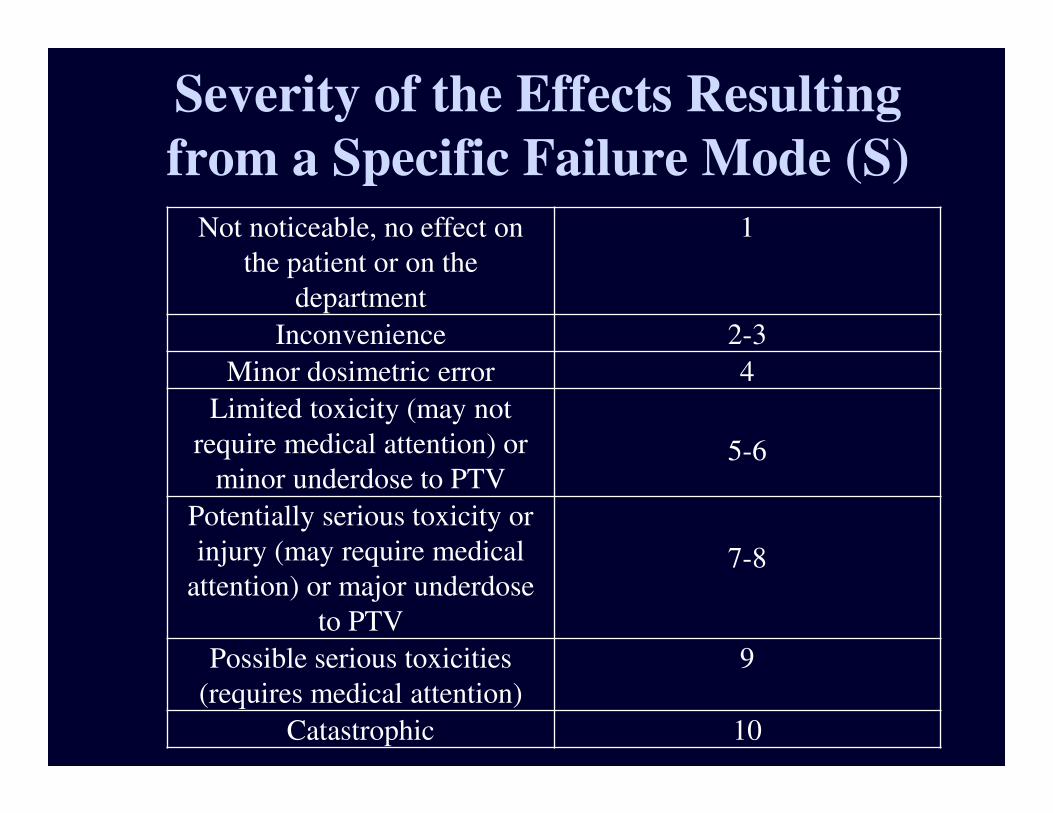
Severity of the Effects Resulting
from a Specific Failure Mode (S)
Not noticeable, no effect on
the patient or on the
department
1
Inconvenience 2-3
Minor dosimetric error 4
Limited toxicity (may not
require medical attention) or
minor underdose to PTV5-6
Potentially serious toxicity or
injury (may require medical
attention) or major underdose
to PTV
7-8
Possible serious toxicities
(requires medical attention)
9
Catastrophic 10

Probability that a Failure Mode will go
Undetected (D)
Detection Ability of
Failure Mode in %
Probability that
failure mode
goes undetected
in %
Ranking
99.99 0.01 1
99.80 0.20 2
99.50 0.50 3
99.00 1.00 4
98.00 2.00 5
95.00 5.00 6
90.00 10.00 7
85.00 15.00 8
80.00 20.00 9
Extreme likelihood >20.00 10

Sample FMEA Topic
Step Potential Failure
Modes
Potential Cause of
Failure
Potential Effects of
Failure
O S D RPN Comments
Specify images
for target and
structure
delineation, etc
Specify use of
incorrect image
set
Viz.; wrong phase
of 4D CT selected
for planning;
wrong MR for
target volume
delineation
Ignorance of available
imaging studies
Miscommunication
Ambiguous labeling of
image sets
Inadequate training
Software error
User error
Wrong anatomical
model (leading to
systematic geometric
and dosimetric errors)
8 8 8 512 4D CT gating.
Specify protocol for delineating
target and
structure
Incomplete/
incorrect list of
specified
structures and
corresponding
image sets
Ignorance of available
imaging studies
Miscommunication
Ambiguous labeling of
image sets
Lack of explicit
protocol
User error
Wrong anatomical
model (leading to
systematic geometric
and dosimetric errors)
8 9 3 216
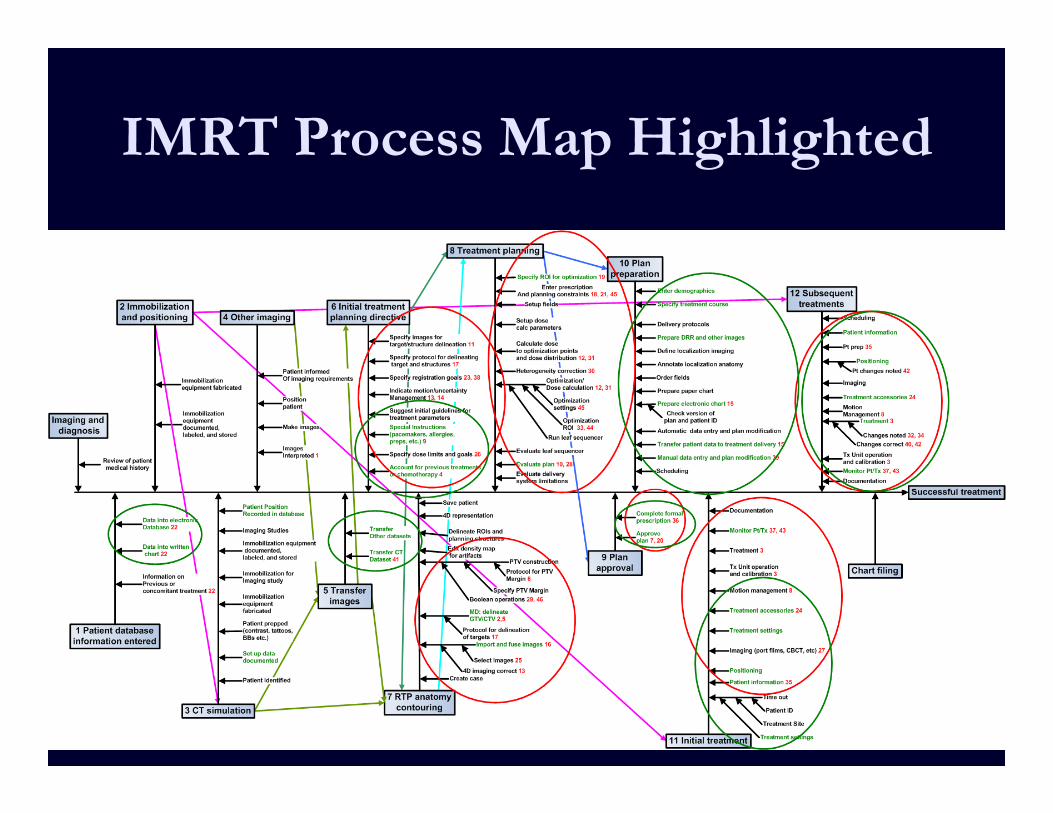
IMRT Process Map Highlighted
Establish the Failure
Propagation Pattern
� This is the fault tree analysis.
� For the fault tree
�Begin at the failure
�Ask what are all the possible causes
�Relate the causes through logical gates
�For each cause, ask what would be the cause
�Repeat as needed
Characteristics of Fault Trees
� Some fault trees are deep and some broad (and various combinations).
� OR gates indicate increased hazard, AND gates indicate protection.
� Common causes indicate particularly hazardous causes
� May show as a single box leading to multiple boxes
� May simply be a cause, e.g., “lack of training” showing
up often, even though each may be a different training
lacking.

Example: Calculation Fault Tree
Error in
Calculation
Error in
Input Data
Error in
Data Entry
Error in
Calculation
Algorithm
Error in
Prescription

Example:
Calculation Fault
Tree with QMError in
Calculation
Error in
Input Data
Error in
Data Entry
Error in
Calculation
Algorithm
Error in
PrescriptionError in QC Error in QC
Error in QCError in QC
Error in QA
Error in PT
Calculation
Or
Sources placed in wrong location
Patient misidentified
US probe misaligned
Incorrect dose, dose
distribution, location
US images inadequate
Human error: Omission – Time-out not performed
Training – patient identified incorrectly
Or
Training – Probe cover not correctly
filled
Human Failure: Inattention/Poor performance -Temp/ate not
seated properly
Human Failure: Inattention/Poor performance -
Probe cover not correctly filled
Or
RO fails to match the volume study
images
US images inadequate – QA
failure
Human Failure: Poor performance
Changes in prostate
Or
RO fails to align images along the
range
Training failure
Human Failure: Inattention/Poor
performance
US images inadequate – QA
failure
Or
Or
Training failure: US images
inadequate – Needle order
Human failure: US images inadequate
– Needle order
RO fails to image adequately Or
MP fails to hand the correct needle
to ROPoor demarcation
of needles
Human Failure: Inattention/Poor
performance
Confusion between packages
Or
MP drops needle Or
Poor room layout
Human failure: MP slips
RO fails to insert needle properly
RO fails to insert into correct hole
RO fails to insert needle to correct
depth
Or
Human Failure: Inattention
Bad viewing conditions
Confusion between holes
Or
US images inadequate – QA
failure
Training Failure
Human Failure: Inattention/Poor
performanceOr
Confusion between planes
RO fails to hold stylet stable during
retraction
Human failure: RO fails to hold stylet
Human failure: RO pushes on stylet
Or
RO selects next needle that obscures
subsequent needles
Training Failure
Human Failure: Inattention/Poor
performance
Or
Or
RO erroneously modifies source
distribution
RO adds unnecessary
sources
Or
RO fails to add necessary
additional sources
US images inadequate – QA
failure
Training Failure
Or
US images inadequate – QA
failure
Training Failure
Or
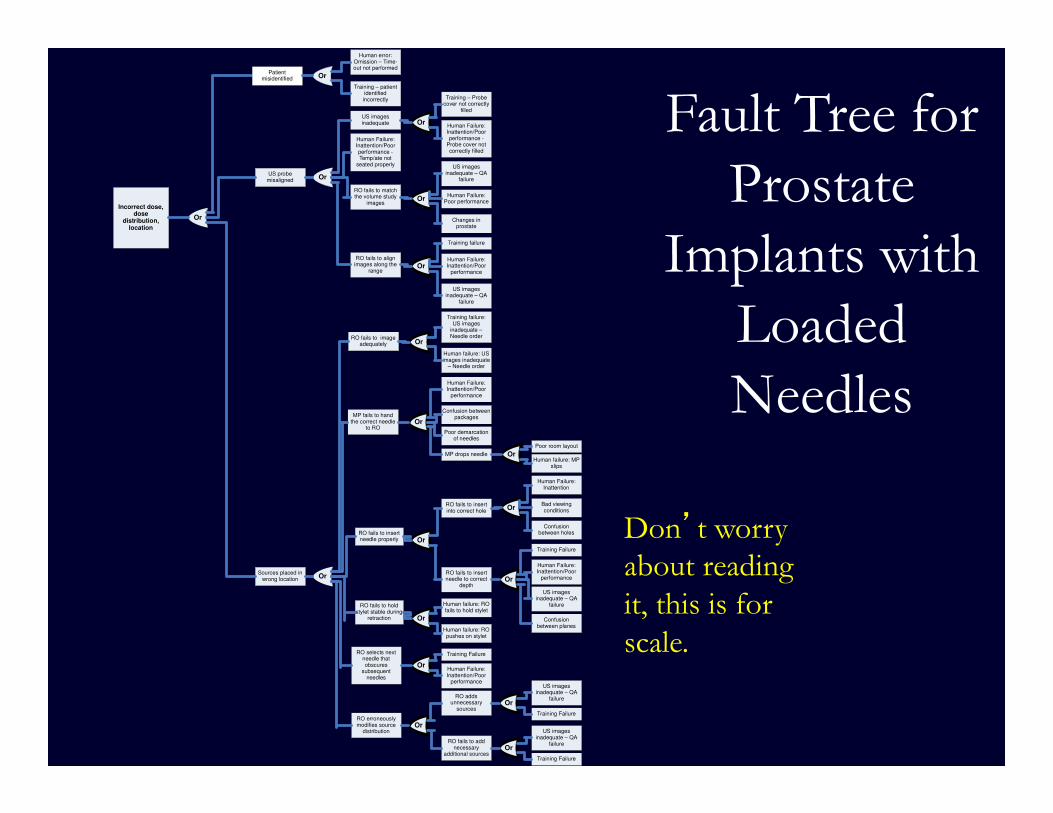
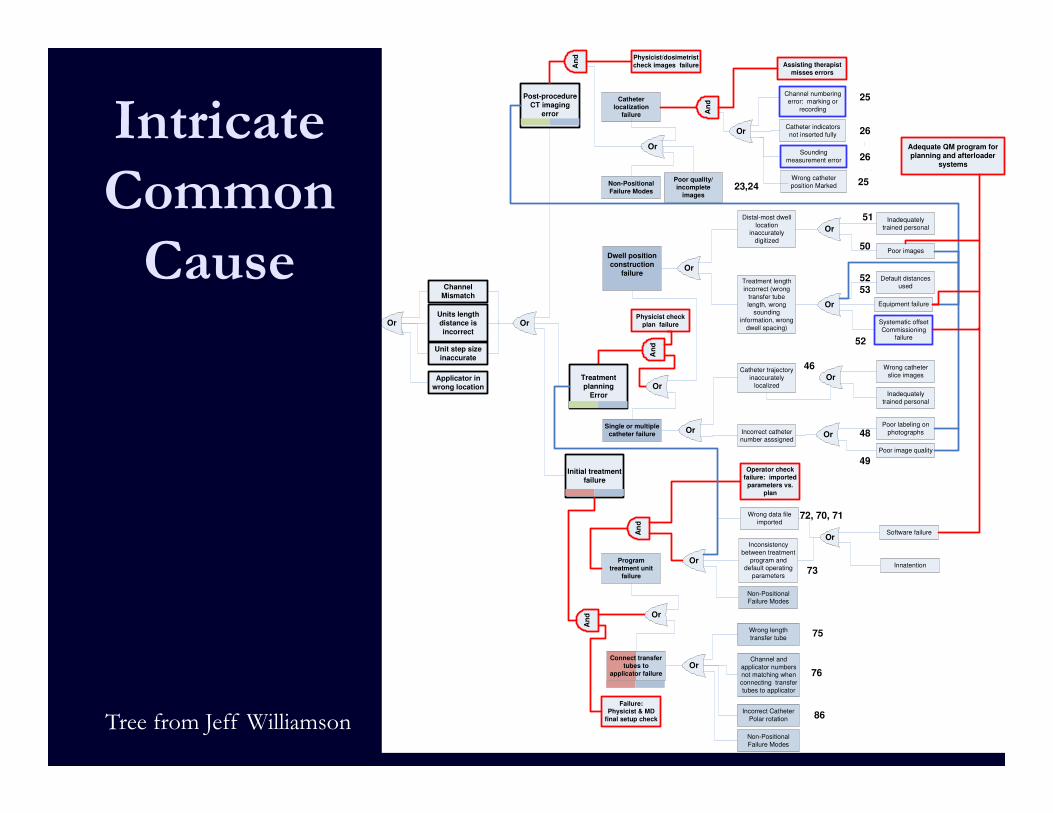
Fault Tree for
Prostate
Implants with
Loaded
Needles
Don’t worry about reading
it, this is for
scale.
Program
treatment unit
failure
Wrong data file
imported
Inconsistency
between treatment
program and default operating
parameters
Software failure
InnatentionOr
Or
Units length
distance is
incorrect
Unit step size
inaccurate
Applicator in
wrong location
Or
Single or multiple
catheter failure
Catheter trajectory
inaccurately
localized
Incorrect catheter number asssigned
Wrong catheter
slice images
Inadequately
trained personal
Poor labeling on
photographs
Poor image quality
OrOr
Or
Dwell position
construction
failure
Distal-most dwell
location inaccurately
digitized
Treatment length
incorrect (wrong
transfer tube
length, wrong sounding
information, wrong
dwell spacing)
Inadequately
trained personal
Poor images
Default distances used
Equipment failure
Or
Or
Or
48
Or
Systematic offset
Commissioning failure
Catheter
localization failure
Wrong catheter
position Marked
Catheter indicators
not inserted fully
Or
Or
Non-Positional
Failure Modes
Post-procedure
CT imaging
error
Sounding
measurement error
Channel numbering error: marking or
recording
Channel and
applicator numbers not matching when
connecting transfer
tubes to applicator
Wrong length
transfer tube
OrConnect transfer
tubes to
applicator failure
Non-Positional Failure Modes
Poor quality/
incomplete
images
Initial treatment
failure
Or
An
d
Operator check
failure: imported
parameters vs.
plan
An
d
Physicist check
plan failure
An
d Physicist/dosimetrist
check images failure
Adequate QM program for
planning and afterloader
systems
Treatment
planning
Error
Failure: Physicist & MD
final setup check
An
d
Channel
Mismatch
Or
Non-Positional
Failure Modes
An
d
Assisting therapist
misses errors
Incorrect Catheter
Polar rotation
26
25
26
25
23,24
51
49
50
46
52
52 53
73
75
72, 70, 71
86
76
Intricate
Common
Cause
Tree from Jeff Williamson
When Bad Things Happen
� First step is to recognize that humans and equipment will fail – Expect that.
� Then set up procedures to try to prevent failures from negatively affecting the patient.
� This can be done by eliminating the cause, or
� Interrupting the propagation.

What to Do?
� Start with the branches of the fault tree that corresponds to the branches of the process tree with the greatest hazard, either RPN or severity.
� Might as well start with the top of the branch, even though that is completely arbitrary.
� Consider the possible interventions.
� Work through the branch, maybe by RPN until the numbers are too low to consider.
Precautions and Limitations
� Adoption of risk%based, individualized QM programs
is a significant paradigm shift
� Development of a QM program without a sound
multidisciplinary understanding of the entire clinical
process can lead to an ineffective and/or inefficient
QM program
� Large%scale implementation is a long term process
requiring close cooperation among individual
physicists, physicians, managers, executives, scientific
societies, and regulators

Precautions and Limitations
� Learn the process by applying it to a small problem first
� Testing of QM changes and re%evaluation of the (new) process are crucial
� The only way to maintain a highly effective and efficient QM program is through continuous process analysis, redesign, and resource allocation
Precautions and Limitations
� The IMRT analysis performed by TG%100 is an example
to show how the analysis is done – not to be taken and
used directly.
� Documenting the specific process (and risks) at each
clinic are an important component of the method
� Using a broad group of staff is important – the TG%100
example was done by physicists alone, on a generic
example process
� The QM checks proposed by TG%100 are a starting
point, for consideration and incorporation into the QM
program defined by each institution. These
recommendations are not complete, nor appropriate for
all situations.

Precautions and Limitations
� Our risk environment is different from typical FMEA industrial applications. They have normal people as their target.
� In the RadOnc environment, we have to balance risks – risk of problems during treatment compared to the clear risk of major problems if treatment does not happen. This is a very different tradeoff situation.
� It is important to proceed with care to accommodate the different risk environment that we operate in.

� TG%100 introduces a new risk%based paradigm for design
of QM programs in Radiation Oncology
� All failures are system failure
� Through the use of a detailed example (IMRT planning
and delivery), TG%100 illustrates how this approach can
be applied, using tools like FMEA (Failure Modes +
Effects Analysis) and FTA (Fault Tree Analysis)
� To begin, start on a small process, and involve a
dedicated and broadly based group of people who
participate in the process
� As with any new paradigm, pay special attention to the
warnings and limitations to the method
Conclusions
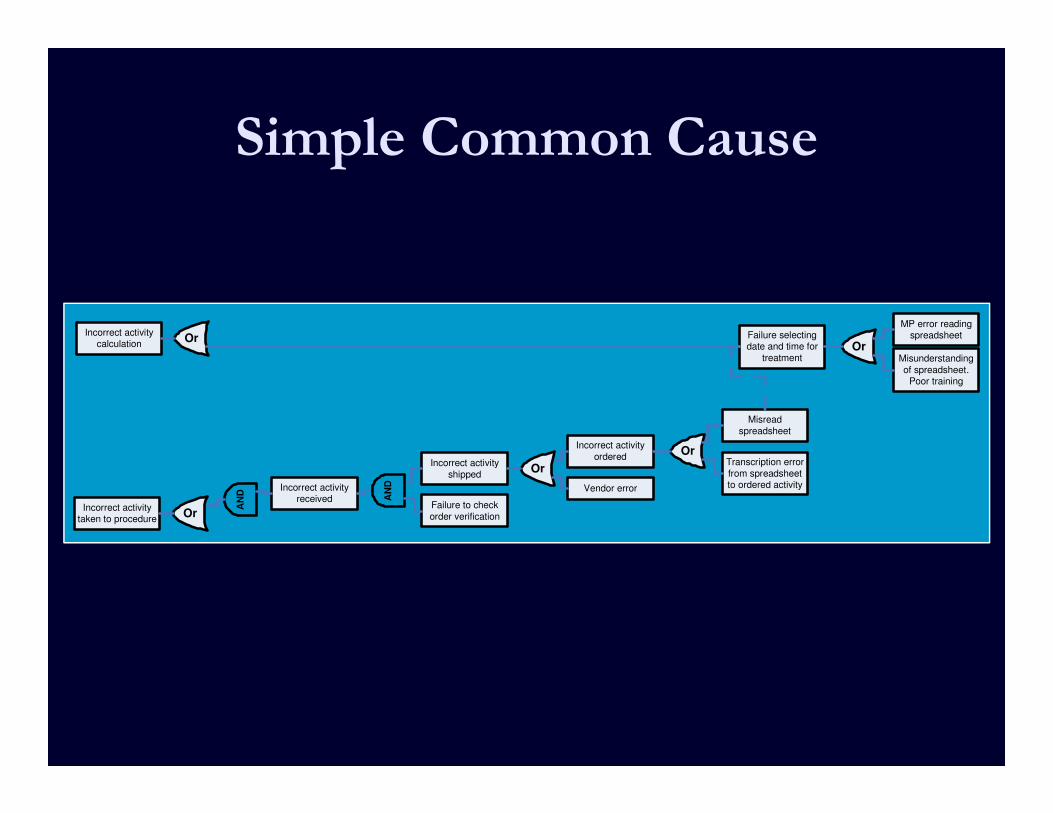
Simple Common Cause
Incorrect activity calculation
Failure selecting date and time for
treatment
MP error reading spreadsheet
Misunderstanding
of spreadsheet. Poor training
OrOr
Incorrect activity
ordered
Misread
spreadsheet
Transcription error
from spreadsheet to ordered activity
Or
Incorrect activity received
Incorrect activity
shipped
AN
D
Or
Vendor error
Failure to check
order verificationIncorrect activity
taken to procedure
AN
D
Or