AN OVERVIEW OF THE PENSION/OPEB LANDSCAPEcrr.bc.edu/wp-content/uploads/2016/10/wp_2016-11.pdf ·...
35
AN OVERVIEW OF THE PENSION/OPEB LANDSCAPE Alicia H. Munnell and Jean-Pierre Aubry CRR WP 2016-11 October 2016 Center for Retirement Research at Boston College Hovey House 140 Commonwealth Avenue Chestnut Hill, MA 02467 Tel: 617-552-1762 Fax: 617-552-0191 http://crr.bc.edu Alicia H. Munnell is the Peter F. Drucker Professor of Management Sciences at Boston College’s Carroll School of Management and director of the Center for Retirement Research at Boston College (CRR). Jean-Pierre Aubry is associate director of state and local research at the CRR. The research reported herein was supported by the Center’s Partnership Program. The findings and conclusions expressed are solely those of the authors and do not represent the opinions or policy of the partners or the Center for Retirement Research at Boston College. © 2016, Alicia H. Munnell and Jean-Pierre Aubry. All rights reserved. Short sections of text, not to exceed two paragraphs, may be quoted without explicit permission provided that full credit, including © notice, is given to the source.
Transcript of AN OVERVIEW OF THE PENSION/OPEB LANDSCAPEcrr.bc.edu/wp-content/uploads/2016/10/wp_2016-11.pdf ·...

AN OVERVIEW OF THE PENSION/OPEB LANDSCAPE
Alicia H. Munnell and Jean-Pierre Aubry
CRR WP 2016-11 October 2016
Center for Retirement Research at Boston College
Hovey House 140 Commonwealth Avenue
Chestnut Hill, MA 02467 Tel: 617-552-1762 Fax: 617-552-0191
http://crr.bc.edu
Alicia H. Munnell is the Peter F. Drucker Professor of Management Sciences at Boston College’s Carroll School of Management and director of the Center for Retirement Research at Boston College (CRR). Jean-Pierre Aubry is associate director of state and local research at the CRR. The research reported herein was supported by the Center’s Partnership Program. The findings and conclusions expressed are solely those of the authors and do not represent the opinions or policy of the partners or the Center for Retirement Research at Boston College. © 2016, Alicia H. Munnell and Jean-Pierre Aubry. All rights reserved. Short sections of text, not to exceed two paragraphs, may be quoted without explicit permission provided that full credit, including © notice, is given to the source.

Introduction
It is impossible to discuss municipal finance without considering the cost of pensions and
other post-retirement employee benefits (OPEB), the largest of which is retiree health insurance.
These costs have received enormous press coverage, usually incorporating sweeping generalities
about the burden of employee post-retirement benefits for the nation as a whole. Much is made
of the bankruptcies in Vallejo, California (2008); Prichard, Alabama (2010); Central Falls,
Rhode Island (2011); Stockton, California (2015); and Detroit, Michigan (2015). At the state
level, the pension situation in Illinois, New Jersey, and Connecticut is often described as typical.
No one mentions Delaware, Florida, Georgia, Tennessee, and North Carolina – states that have
done a good job of providing reasonable benefits, paying their required contributions, and
accumulating assets. The point is that the picture at the state and local level is extremely
heterogeneous, so it is crucial to look at the numbers state by state and locality by locality.
This paper provides a comprehensive accounting of pension and OPEB liabilities for state
and local governments and the fiscal burden that they pose. The analysis includes plans serving
more than 800 entities: 50 states, 178 counties, 173 major cities, and 415 school districts related
to the sample of cities and counties. The analysis apportions the liabilities of state-administered
cost-sharing plans to participating local governments for a more accurate picture of which
governmental entity is actually responsible for funding pension and OPEB liabilities. The cost
analysis calculates, separately, pension and OPEB costs as a percentage of own-source revenue
for states, cities, and counties. It then combines pension and OPEB costs to obtain the overall
burden of these programs. Finally, it adds debt service costs to provide a comprehensive picture
of government revenue commitments to long-term liabilities.
The discussion proceeds as follows. The first section establishes the framework for
analysis, describing the role of new standards from the Government Accounting Standards Board
(GASB 68) in allocating the liability in cost-sharing plans between states and localities. In order
not to muddy the waters, wherever possible we have adopted assumptions similar to Michael
Cembalest (2016) at JP Morgan. The second section presents 2014 pension data at the state and
local level as a percentage of revenues. The third section shifts to OPEB costs and reports
current and required payments for states, cities, and counties. The fourth section brings together
pension and OPEB costs, and adds the cost of servicing debt for each level of government. The

2
final section concludes that the situation varies enormously among states, cities, and counties.
Some look very bad, while others are managing their affairs effectively.
Establishing the Framework
Calculating the burden of pensions and OPEBs on government revenues requires several
steps. The first is to follow GASB 68 and to reallocate to cities and counties their share of state
liabilities and assets. The second is to select a particular measure of required contributions and
the appropriate interest rate to discount promised benefits. The third is to select the appropriate
revenue base for calculating the burden. As with Cembalest (2016), for both pensions and
OPEBs, actual contributions are collected directly from government Comprehensive Annual
Financial Reports (CAFRs) and government revenue and interest expense on debt come directly
from the Census of Governments.
Applying GASB 68
In an effort to increase the visibility of pension commitments, GASB Statement 68 moves
pension funding information from the footnotes of financial statements to the balance sheets of
employers. It also requires employers that participate in so-called “cost-sharing” plans to
provide information regarding their share of the state pension on their books.
A “cost-sharing” plan is a type of multiple-employer plan; the other type is an agent plan.
In agent plans, assets are pooled for investment purposes but the plan maintains separate
accounts so that each employer’s share of the pooled assets is legally available to pay benefits for
only its employees. In cost-sharing plans, the pension obligations, as well as the assets, are
pooled, and the assets can be used to pay the benefits of any participating employer. For
employers participating in agent plans, their share of the plan has always appeared in the notes of
their financial statements, so the only change is moving that information into the balance sheet.
In contrast, until 2015, employers participating in cost-sharing plans did not report their share, so
including their share of state plan assets and liabilities on the balance sheets is a major change.
Figure 1 illustrates the flow of pension payments from city governments to various
pension plans to which they contribute. The story would be similar for counties. For most city
governments, pension payments include contributions to city-administered plans (often covering
general employees and/or police and fire); contributions to non-teacher plans administered at the

3
state level; and, very occasionally, contributions to state teacher plans. Generally, teacher plans
receive their contributions from school districts, which raise their own revenue. An analysis of
school district programs is presented in Appendix A because these programs do not fit easily into
the fiscal format presented below.1
The government financial reports for 2015 include the share of pension liabilities for
entities participating in cost-sharing plans. The exercise presented below, however, uses 2014
data because that is the latest year available for many cities and counties. As a result, we
estimate the allocation based on a city’s or county’s Annual Required Contribution (ARC) for a
given state plan as a percentage of the plan’s total ARC. If ARC information is not available, the
apportionment is based on the ratio of a city’s actual contributions to the state plan’s total actual
contributions. More than half the cities (104 of the 173) and counties (97 of the 178) in our
sample participate in cost-sharing state plans and are affected by GASB 68. Figure 2 shows the
impact of the new GASB 68 reporting on the distribution of pension liabilities. Of course, when
GASB 68 shifts the recognition of liabilities from the states to the cities and counties, it reduces
the unfunded liability for the states by a corresponding amount. Both the pension and OPEB
data presented below attribute the liabilities and the assets to the governmental entities ultimately
responsible for payment.
Calculating the Expense of Pensions and OPEBs
Calculating the annual pension and OPEB burden requires three steps. The first is
selecting an interest rate for discounting future benefit promises. The second is defining the
contribution concept. The final step involves adjusting the reported data to align with the
selected concepts.
Choosing a discount rate. In 2014, the nominal, long-term return assumption used by
state and local pension plans averaged 7.6 percent, ranging from 6.25 percent to 8.50 percent.
(The following discussion does not get into the debate by some financial economists that
sponsors should use a riskless rate to discount promised benefits.) Figure 3 shows that during
the 1955-2014 period, the average rolling 10- and 30-year nominal returns for a hypothetical
1 These types of direct contributions made by the city or school district to the pension plan are represented by the solid lines in the Figure. Occasionally, cities transfer funds to the school district, which is represented by the dotted line in the Figure.

4
portfolio (65 percent stocks/35 percent bonds) exceeded the long-term return assumption by at
least 100 basis points. Therefore, the average long-term nominal return assumption appears
quite reasonable based on history, particularly over longer periods. But, many investment
experts suggest that future equity returns could be considerably below historical averages (see
Table 1), and returns on bonds are at historically low levels. To be conservative and consistent
with the Cembalast (2016) analysis, we have adopted a nominal return of 6 percent.
Selecting the concept. For both pensions and OPEBs, the annual required payment
consists of two components – one to cover costs of benefits accruing in the current year (the
normal cost) and another to amortize the plan’s unfunded actuarial liability. Two problems arise,
however. First, many plans do not pay their required contribution, either as a policy choice or
because their plan is subject to a statutory contribution rate that is less than the full required
contribution. Second, in a number of cases the amortization payment is structured in such a way
that the unfunded liability will never be paid off. Specifically, sponsors set the amortization
payment as a fixed percentage of future payrolls – assumed to grow annually – and then reset the
amortization payment each year as the 30-year amortization period rolls forward. Another
alternative, followed by nearly half of the plans in our sample, is to use a closed 30-year
amortization period but “start over” periodically by resetting the 30-year period midway through
– just as the required payments begin to escalate substantially. While this approach produces
better outcomes than relying on an open 30-year amortization period, it still does not produce full
funding.
Thus, the pension expense can be measured in a number of ways: 1) how much plans
actually contribute; 2) the plan’s annual ARC; and 3) a required contribution that will actually
pay off the unfunded liability. To be consistent with a recent analysis by Cembalest (2016), we
have adopted options 1 and 3 – “actual” and “required,” where required is defined as the normal
cost plus a 30-year amortization of the unfunded liability in level dollar payments.
Adjusting the reported data. The goal is to recalculate the pension and OPEB ARCs to
reflect a 30-year level-dollar amortization of the UAAL at a 6-percent discount rate. The first
step is to separate the ARC into the normal cost and amortization payment components, because
the adjustments affect each component differently. For many of the major plans, data on the two
components are readily available through the Public Plans Database. In cases where the
government is participating in a cost-sharing state pension plan for which data are available, the

5
government's ARC is assumed to reflect the proportion of normal costs to amortization payment
for the state plan as a whole. When plan data are not available, the funded ratio and interest rate
are used to estimate the amortization payment, with the remaining amount being attributed to
normal costs. The results of this approach show that the normal cost amounts to about a third of
the pension ARC and about half of the OPEB ARC.
Once the ARCs have been separated into their normal-cost and amortization-payment
components, each portion is adjusted separately. The normal cost is adjusted using an actuarial
rule-of-thumb that assumes a 22-percent increase in the normal cost for each 1-percent change in
the discount rate. The adjustment for the amortization payment involves three steps: 1) re-
discounting the accrued liability using an actuarial rule-of-thumb that assumes a 12.5 percent
change for each 1-percent change in the discount rate; 2) calculating a new UAAL using the
actuarial assets and the re-discounted liability; and 3) calculating an amortization payment for
the new UAAL assuming a 6-percent interest rate and 30-year amortization period. The adjusted
normal cost and amortization payments are then re-combined to get a new required contribution
– one that will actually pay off the unfunded liability.
Our results for states align closely with Cembalest (2016); Cembalest (2016) did not
address cities or counties. A few discrepancies remain, however, due to the following four
factors (listed in order of impact): 1) our method for parsing out the normal cost and
amortization payment is based on actual plan data, while Cembalest (2016) backs out the results
using a multi-step process; 2) we adopt a 6-percent discount rate for all pension plans, even
those using a lower rate for reporting; 3) our adjustments to the normal cost and amortization are
based on actuarial rules-of-thumb rather than the duration and yield curve; and 4) our pension
and OPEB data are based on 2014 reported data, rather than 2015.
Selecting the Appropriate Revenue Base
The final step is to select the appropriate revenue base. The decision is more difficult
than it first appears, because each level of government receives not only revenues it raises itself
but also transfers from higher levels of government, and it pays money to lower levels. Thus,
one could use either own-source revenues or net revenues (own-source plus net transfers). At the
state level, the decision is relatively easy; the money the states receive from the federal
government roughly equals the amount the states pay to counties, cities, and school districts.

6
That is, own-source and net revenues are roughly the same (see Table 2). For consistency with
Cembalest (2016), we use own-source revenues at the state level. In addition to revenue from
own-sources, this measure includes other general revenue, interest on the general fund, and
liquor store profits.
Deciding on a revenue base for counties, cities, and school districts is more difficult,
because these entities get, on average, 33 percent, 20 percent, and 55 percent of their revenues
from other governments. For counties and school districts, most of the money comes from the
state; for cities, a substantial share also comes from the federal government. Using own-source
revenue as the denominator overstates the drain on the locality’s total resources, but provides a
sense of the tax increase required if pension or OPEB costs come in higher than expected. The
following analysis reports costs as a percentage of own-source revenues in the text, but the
results based on net revenues (own-source plus net transfers) are presented in Appendix B.
Pension Contributions as a Percentage of Own-Source Revenues
The data for this analysis include pension and OPEB liabilities from 50 states, 178
counties, 174 major cities, and 415 school districts related to the sample cities and counties. By
payrolls, the sample accounts for 100 percent of states, 46 percent of counties, 43 percent of
cities, and 26 percent of school districts (see Figure 4). Only about 40 percent of the pension
liabilities in state-administered plans are the responsibility of state government; the other 60
percent are the responsibility of the local governments.
Figure 5 shows current and required (with a 6-percent discount rate and level-dollar
amortization over 30 years) pension contributions as a percentage of own-source revenues by
state. The states are ranked by their final standing once pension, OPEB, and interest cost have
been combined, so they are not in perfect descending order. Nevertheless, the costs vary
dramatically from a high of 29 percent of own-source revenues in Illinois to a low of 1 percent in
Nebraska. Note, however, that the costs are below 10 percent of revenues in all but nine states
and below 5 percent of revenues in 24 states.
Figure 6 presents current and required pension contributions for counties. As discussed
above, these costs are a high percentage of own-source revenues in part because own-source
revenues account for only two thirds of total county resources. However, even reducing these
percentages by a third still leaves many California counties with substantial costs (see Appendix
7
B, Figure 20). Given that the money to pay county pension costs must come from either the state
or county own-source revenues, it is interesting to calculate combined pension costs for
California, Maryland, and Virginia – three states where counties play a major role. That is, the
numerator includes the current and required pension costs for the state and the counties in that
state, and the denominator includes the state own-source revenues and the counties’ own-source
revenues. This constructed state/county pension cost burden is compared with the state pension
cost alone (see Figure 7). The calculation highlights the importance of considering counties in
those states where they play a significant role.
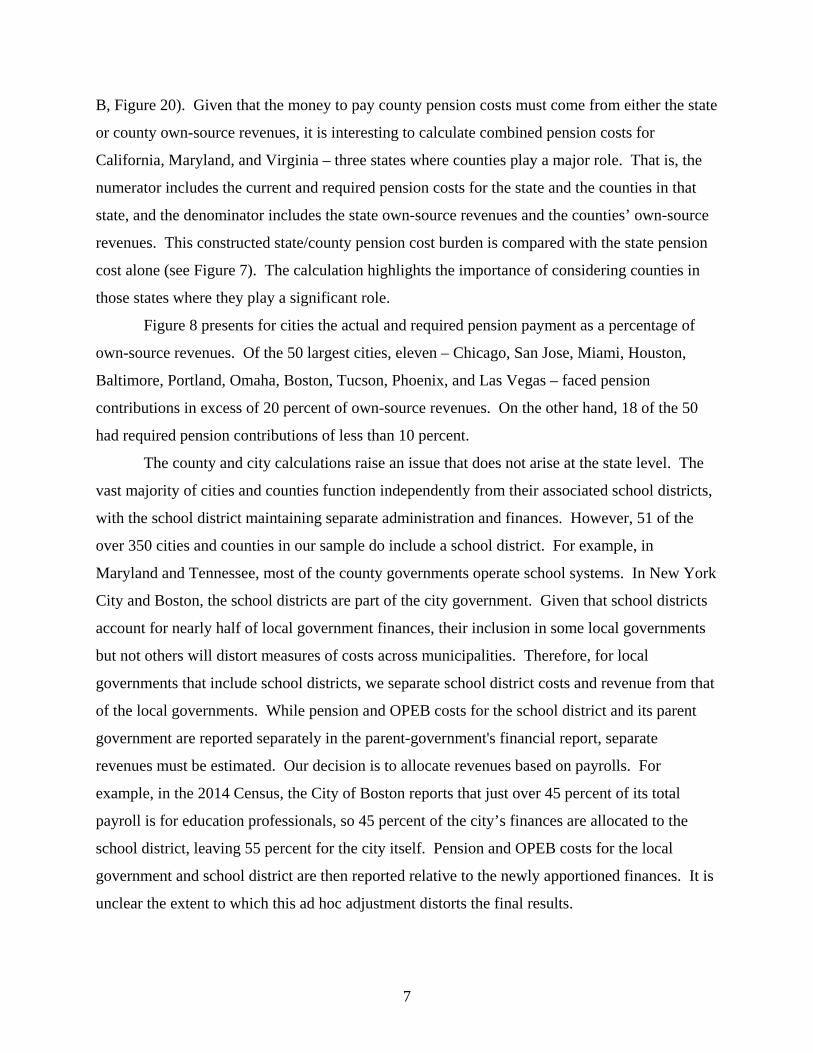
Figure 8 presents for cities the actual and required pension payment as a percentage of
own-source revenues. Of the 50 largest cities, eleven – Chicago, San Jose, Miami, Houston,
Baltimore, Portland, Omaha, Boston, Tucson, Phoenix, and Las Vegas – faced pension
contributions in excess of 20 percent of own-source revenues. On the other hand, 18 of the 50
had required pension contributions of less than 10 percent.
The county and city calculations raise an issue that does not arise at the state level. The
vast majority of cities and counties function independently from their associated school districts,
with the school district maintaining separate administration and finances. However, 51 of the
over 350 cities and counties in our sample do include a school district. For example, in
Maryland and Tennessee, most of the county governments operate school systems. In New York
City and Boston, the school districts are part of the city government. Given that school districts
account for nearly half of local government finances, their inclusion in some local governments
but not others will distort measures of costs across municipalities. Therefore, for local
governments that include school districts, we separate school district costs and revenue from that
of the local governments. While pension and OPEB costs for the school district and its parent
government are reported separately in the parent-government's financial report, separate
revenues must be estimated. Our decision is to allocate revenues based on payrolls. For
example, in the 2014 Census, the City of Boston reports that just over 45 percent of its total
payroll is for education professionals, so 45 percent of the city’s finances are allocated to the
school district, leaving 55 percent for the city itself. Pension and OPEB costs for the local
government and school district are then reported relative to the newly apportioned finances. It is
unclear the extent to which this ad hoc adjustment distorts the final results.

8
The overall picture emerging from the pension exercise is that required pension payments
are an extraordinarily large percentage of own-source revenues for a small percentage of states,
counties, and cities, but many governmental entities appear to have their pension costs under
control. Pensions, however, are just one component of the required payments facing
governments. In addition, most state and local governments provide other post-employment
benefits (OPEBs), the largest of which is retiree health insurance. 2
OPEB Contributions as a Percentage of Own-Source Revenues
Retiree health plans have received increased attention in recent years due to rapidly rising
health costs and new reporting guidelines from the GASB. These GASB 45 guidelines, which
were released in 2004 and became effective in 2007, require states and localities to change the
way they account for the cost of retiree health plans from a cash to an accrual basis, essentially
applying to OPEB plans the standards used for pensions. 3 Specifically, public sector employers
must regularly report for their retiree health plans the actuarial accrued liability, the actuarial
value of assets, the unfunded liability, the funded ratio, and the ARC payment. Soon, GASB 75
will supersede GASB 45, and narrow the allowable actuarial cost methods that can be used for
reporting liabilities as well as require the liability of cost-sharing OPEB plans to be apportioned
to participating employers.4
Although GASB 45 does not require sponsors to establish trust funds or move toward full
funding, it provides an incentive to fund by allowing them to use a higher rate to discount future
benefit promises once they set up a trust and commit to paying the ARC.5 That is, with funding,
the actuary can discount obligations by the expected long-term return on plan assets rather than
the lower short-term rate used for plans without funding.
The data for the OPEB analysis span the same sample of over 800 government entities
used in the pension analysis. The provision of OPEB benefits, however, is much less centralized
2 OPEB costs also include dental, vision, life insurance, disability, and long-term care. 3 Implementation of GASB 45 was phased in over a three-year period, with the largest governments – those with total annual revenues of $100 million or more – required to report their liabilities in their FY2008 financial statements; see U.S. Government Accountability Office (2009). Also relevant is GASB 43, Financial Reporting for Postemployment Benefit Plans Other Than Pensions, which was released shortly before GASB 45. 4 Like GASB 67 and 68 have already done for pensions, GASB 74 and 75 will also introduce a blended discount rate and require unfunded liabilities to be reported on the plan sponsor’s balance sheet for OPEBs. 5Technically, setting up a trust is sufficient for the use of a higher discount rate under GASB 45. However, the use of the more favorable rate only applies to the extent that accumulated resources are estimated to be sufficient to fund required payments.

9
than that of pensions. In the case of pensions, state-administered plans cover not only state
employees, but also nearly all teachers and about 70 percent of local government employees
(generally those in smaller cities and towns). The 30 percent of local employees who are not
covered by state pension plans are covered primarily by large city or county plans. Thus, a
sample that includes all state-administered plans and a reasonable number of major city and
county plans will cover most state and local pension liabilities.
Such is not the case with retiree health care plans. State-administered OPEB plans are
often limited to state employees, excluding both local government employees and teachers.
Thus, it is important to explore the extent to which both large and small local governments and
school districts provide their own retiree health insurance.6 Large local governments and school
districts are included in our sample; small ones are not. If one were attempting to account for
total OPEB costs, it would be necessary to make estimates for these excluded entities.
A comprehensive estimate of OPEBs shows that two-thirds of the liabilities are at the
local level, whereas for pensions two thirds are at the state level. Second, unfunded OPEB
benefits amount to 28 percent of unfunded pension benefits – when pension benefits are
calculated with an interest rate comparable to OPEBs. And, finally, while OPEB liabilities are
large, several factors, such as greater flexibility in adjusting benefits and increasing retirement
ages, limit their potential drain on state and local resources.7
For the current analysis, where the focus is states, large counties, and large cities,
complete OPEB data are available. Figures 9-11 show – for states, counties, and large cities –
current and required OPEB payments as a percentage of own-source revenues. States with large
required pension payments also tend have large OPEB costs – the four of the five costliest states
in terms of OPEB also have pension costs that are over 10 percent of revenues. At the county
and city level, the high costs are more evenly distributed among the entities shown. On balance,
required OPEB costs equal about a third of required pension costs.
Pension, OPEB, and Interest Payments as a Percentage of Own-Source Revenues
The final section pulls together current and required payments for pensions and OPEBs,
and adds interest payments. The interest expense comes directly from the Census of
6 Prior research explored retiree health for teachers at the state level only (Clark 2010). 7 For further discussion, see Kearney et al. (2009) and Clark (2009).

10
Governments. The only adjustment made is that, when school districts are combined with either
cities or counties, interest expense is allocated based on education and non-education payrolls.
Following Cembalest (2016), contributions at the 15-percent and 25-percent level are bold lines
reflecting thresholds where concerns start to be raised and where the government’s situation
becomes untenable, respectively.
The results for states are shown in Figure 12. The good news is that 36 states have
required payments below 15 percent of own-source revenues and 23 of those states face
payments below 10 percent. The bad news is that five states – Illinois, Connecticut, and New
Jersey, Hawaii, and Kentucky – face required payments in excess of 25 percent of revenues and
Massachusetts, Rhode Island, and Delaware face payments in excess of 20 percent. Figure 13
breaks down the required payment into pensions, OPEB, and interest; pensions and OPEB
swamp interest across the board. This pattern is not surprising given that U.S. states have about
$500 billion of bonds supported by state tax collections and $0.5-$1.5 trillion of unfunded
liability depending on the interest rate used to discount the benefits.
Figures 14 and 15 present the results for counties and cities, respectively. Even
accounting for the fact that own-source revenues are only 67 percent of county and 80 percent of
city net revenues, costs are extremely high. Eight counties in California have costs in excess of
30 percent of own-source revenues. In terms of cities, Chicago, Detroit, San Jose, Miami City,
Houston, Baltimore, Wichita, and Portland lead the list, all with costs in excess of 40 percent of
revenues.
The question of course is what the worst-off states, counties, and municipalities can do to
improve their situation. Four options exist. One is to pray for higher returns. Unfortunately
returns would have to be consistently in the 10-15 percent range for the next 30 years to solve the
problem – an unlikely outcome given today’s financial markets. A second option is to raise
taxes to meet the required commitments. Unfortunately, many of the states with the greatest
burden already have relatively high taxes. A third option is to cut other spending by 10 to 20
percent. A final option is to raise employee contributions far beyond what they are already
contributing to their plans. Clearly, those governments in the worst shape face an enormous
challenge.

11
Conclusion
The cost of pensions and OPEBs has become a front-burner issue in any discussion of
municipal finance. While news headlines emphasize cases of jurisdictions in extreme financial
distress, the key takeaway from this paper is that the picture at the state and local level is
extremely heterogeneous. Therefore, a full understanding of the issue requires looking at the
numbers state by state and locality by locality. It is also important to capture localities
comprehensively, including cities, counties, and school districts.
Based on a large sample of states and localities, the analysis finds that required pension
payments are an extraordinarily high percentage of own-source revenues – more than 20 percent
– for a handful of states, counties, and cities, but most jurisdictions have their costs under
control. Adding in OPEB costs, of course, raises the total spending requirements but the overall
story remains similar. For example, eight states face costs in excess of 20 percent of own-source
revenues, but 23 states have costs below 10 percent. Cities, counties, and school districts also
show considerable variation.
The small minority of jurisdictions facing dire circumstances have only unpalatable
options: some combination of raising taxes, cutting spending, and/or hiking employee
contributions. Unfortunately, these jurisdictions tend to have less flexibility in making major
fiscal changes and raising employee contributions runs the risk of making it harder to recruit and
retain top-notch workers. In short, these governments face an enormous challenge.

12
References Bogle, John C., and Michael W. Nolan. 2015. "Occam’s Razor Redux: Establishing Reasonable
Expectations for Financial Market Returns." The Journal of Portfolio Management 42(1): 119-134.
Cembalest, Michael. 2016. “The ARC and the Covenants, 2.0: An Update on the Long-term
Credit Risk of US States.” Eye on the Market (May 19). New York, NY: J.P. Morgan. Cembalest, Michael. 2014. “The ARC and the Covenants: Assessing the Ability of States to
Service Debt, Pension and Retiree Health Care Costs in a World of Finite Resources.” Eye on the Market: Special Publication (June 5). New York, NY: J.P. Morgan.
Clark, Robert L. 2010. “Retiree Health Plans for Public School Teachers After GASB 43 and
45.” Education Finance and Policy, Fall, 438-462. Clark, Robert L. 2009. “Will Public Sector Retiree Health Benefit Plans Survive? Economic and
Policy Implications of Unfunded Liabilities.” American Economic Review, May, 533-537.
French, Kenneth. 2015. “Index Portfolios formed on B/M, E/P, CE/P, and D/P.” Available at:
http://mba.tuck.dartmouth.edu/pages/faculty/ken.french/data_library.html
Governmental Accounting Standards Board (GASB). 2015. Accounting and Financial Reporting for Postemployment Benefits Other Than Pensions. Statement No. 75. Norwalk, CT.
Governmental Accounting Standards Board (GASB). 2012. Accounting and Financial Reporting
for Pensions- An Amendment of GASB Statement No. 27. Statement No. 68. Norwalk, CT: GASB.
Governmental Accounting Standards Board (GASB). 2004. Accounting and Financial Reporting
by Employers for Postemployment Benefits Other Than Pensions. Statement No. 45. Norwalk, CT: GASB.
Governmental Accounting Standards Board (GASB). 2004. Financial Reporting for
Postemployment Benefit Plans Other Than Pension Plans. Statement No. 43. Norwalk, CT: GASB.
GMO. 2016. “GMO Quarterly Letter.” (First Quarter). Boston, MA. Goldman Sachs. 2016. “The Last Innings.” New York, NY. Kearney, Richard C., Robert L. Clark, Jerrell D. Coggburn, Dennis M. Daley, and Christina
Robinson. 2009. At a Crossroads: the Financing and Future of Health Benefits for State and Local Government Retirees. Report prepared for the Center for State and Local Government Excellence. Washington, DC.

13
McKinsey Global Institute. 2016. “Diminishing Returns: Why Investors May Need to Lower Their Expectations.” New York, NY.
Morningstar. 2015a. “What Market Experts Are Saying About Returns.” Chicago, IL. Morningstar, Inc. 2015b. Ibbotson Stocks, Bonds, Bills, and Inflation (SBBI) Classic Yearbook.
Chicago, IL.
Munnell, Alicia H. and Jean-Pierre Aubry. 2016. “The Impact of GASB 68: How Will State Unfunded Liabilities Affect Major Cities?” State and Local Pension Plans Issue in Brief 47. Chestnut Hill, MA: Center for Retirement Research at Boston College.
Munnell, Alicia H. Jean-Pierre Aubry, and Caroline V. Crawford. 2016. “How Big a Burden Are
State and Local OPEB Benefits?” State and Local Pension Plans Issue in Brief 48. Chestnut Hill, MA: Center for Retirement Research at Boston College.
Research Affiliates. 2016. “Expected Returns.” Asset Allocation. Newport Beach, CA. U.S. Census Bureau. 2012. Washington, DC. U.S. Census Bureau. 2012. “Government Employment and Payroll.” Washington, DC. Available
at: http://www.census.gov/govs/apes/

14
Table 1. Expected Nominal Returns for U.S. Equities from Selected Financial Firms, 2015-16 Firm Average annual nominal returns (%) Horizon (years)
Bogle and Nolana 7.0 % 10
Charles Schwab 6.3 10
Goldman Sachs 4.7-5.5 5
GMO -0.1 7
McKinsey Slow growth: 6.0 – 6.5 Growth recovery: 8.0 – 9.0
20
Morningstarb 6-7 Next few decades
Research Affiliatesc 3.2 10
a The authors are both affiliated with Vanguard’s Bogle Financial Markets Research Center. b Josh Peters, Morningstar Director of Equity-Income Strategy. c Research Affiliates projects a 1.2 percent real equity return; the projection is converted to a nominal value by adding 2 percent inflation. Sources: Bogle and Nolan (2015); GMO (2016); Goldman Sachs (2016); McKinsey Global Institute (2016); Morningstar (2015a); Research Affiliates (2016).
Table 2. Sources of Total Net Revenue, by Level of Government, 2014
Level of government
Intergovernmental transfers Own-source
revenue Inflows from: Outflows Net transfers Federal State Local State 42.2 % 0.0 % 1.1 % 40.2 % 3.1 % 96.9 % County 3.8 30.4 2.5 3.7 32.9 67.1 City 6.8 13.1 3.1 2.7 20.3 79.7 School district 1.1 51.8 3.7 1.6 54.9 45.1 Total 20.5 16.5 2.3 18.6 20.6 79.4 Source: U.S. Census Bureau (2014).

15
Figure 1. Contributions from Cities and Towns to Pension Plans
Source: Munnell and Aubry (2016).
Figure 2. Distribution of Pension Liability Before and After GASB 68, in Billions
Sources: Authors’ calculations based on various FY 2014 plan and government financial reports and actuarial valuations; and U.S. Census Bureau (2014).
Local Plans State Plans42% 58%
General EmployeesPolice and Fire
Schools District (1) (District CAFR -1)
Teachers (Primarily)
Percent of Total Local Pension Contributions
General Employees
City (City CAFR)Teachers (rarely)
$3,823
$198 $408$95
$1,585
$682
$1,136 $1,122
$0
$1,000
$2,000
$3,000
$4,000
$5,000
States Counties Cities School districts
By government administrationBy government responsibility

16
Figure 3. 10-Year and 30-Year Geometric Nominal Returns for Hypothetical Portfolios of 65 Percent Stocks and 35 Percent Bonds, 1955-2014
Sources: Authors’ calculations from Morningstar, Inc. (2015b); and French (2015). Figure 4. Percentage of State, County, Local, and School District Payrolls Covered by Sample, 2012
Source: Authors’ calculations based on U.S. Census Bureau (2012).
0%
4%
8%
12%
16%
1955 1964 1973 1982 1991 2000 2009
Assumption: 7.6%10-year: 9.1%30-year: 10.1%
100%
46% 43%
26%
0%
25%
50%
75%
100%
States Counties Cities School districts

17
Figure 5. States: Current and Required Pension Payments as a Percentage of Own-Source Revenue, 2014
Sources: Authors’ calculations based on various FY 2014 plan and government financial reports and actuarial valuations; and U.S. Census Bureau (2014).
0%
10%
20%
30%
40%
50%
60%
70%IL N
JC
T HI
KY
MA RI
DE
MD LA AK SC WV PA CA TX ME IN NH VT
CO
MO
NY
MT
NM MS
MI
AL
WA
GA
VA SD OH
NV
OK KS
WI
AR
OR
NC
TN FL UT ID WY
MN AZ IA ND NE
Required paymentsCurrent payments

18
Figure 6. Large Counties: Current and Required Pension Payments as a Percentage of Own-Source Revenue, 2014
Sources: Authors’ calculations based on various FY 2014 plan and government financial reports and actuarial valuations; and U.S. Census Bureau (2014).
0%
10%
20%
30%
40%
50%
60%
70%Fr
esno
, CA
Sacr
amen
to, C
AK
ern,
CA
Los A
ngel
es, C
AO
rang
e, C
AC
ook
Cou
nty,
ILSa
n D
iego
, CA
Prin
ce G
eorg
es C
ount
y, M
DFa
irfax
, VA
San
Ber
nard
ino,
CA
Wak
e, N
CW
ayne
, MI
Ham
ilton
, OH
Sant
a C
lara
, CA
Cla
rk, N
VR
iver
side
, CA
Mec
klen
burg
, NC
Esse
x C
ount
y, N
JM
ilwau
kee,
WI
Tarr
ant,
TXA
lam
eda,
CA
Du
Page
Cou
nty,
ILH
arris
, TX
Trav
is, T
XM
aric
opa
Cou
nty,
AZ
Mia
mi-D
ade,
FL
Con
tra C
osta
, CA
Mac
omb,
MI
Kin
g, W
AA
llegh
eny,
PA
Bro
war
d C
ount
y, F
LC
uyah
oga,
OH
Fran
klin
, OH
Ora
nge,
FL
Col
lin C
ount
y, T
XPi
ma,
AZ
Wes
tche
ster
, NY
Erie
, NY
Hill
sbor
ough
, FL
Salt
Lake
, UT
Hen
nepi
n, M
NEl
Pas
o C
ount
y, T
XM
ontg
omer
y C
ount
y, M
DSt
Lou
is, M
OD
alla
s, TX
Bex
ar, T
XFu
lton,
GA
Pine
llas,
FLSh
elby
, TN
Pier
ce C
ount
y, W
A
Required paymentsCurrent payments

19
Figure 7. States and Counties: Required Pension Payments as a Percentage of Revenue, Selected States 2014
Sources: Authors’ calculations based on various FY 2014 plan and government financial reports and actuarial valuations; and U.S. Census Bureau (2014).
10.1%
11.8%
5.6%
7.3%
10.4%
4.2%
0%
5%
10%
15%
CA MD VA
State and countyState only

20
Figure 8. Large Cities: Current and Required Pension Payments as a Percentage of Own-Source Revenue, 2014
Sources: Authors’ calculations based on various FY 2014 plan and government financial reports and actuarial valuations; and U.S. Census Bureau (2014).
0%
10%
20%
30%
40%
50%
60%
70%C
hica
go, I
LD
etro
it C
ity, M
ISa
n Jo
se, C
AM
iam
i City
, FL
Hou
ston
, TX
Bal
timor
e, M
DW
ichi
ta, K
SPo
rtlan
d, O
RO
mah
a, N
EB
osto
n, M
AM
esa,
AZ
Milw
auke
e, W
ID
alla
s, TX
Tucs
on, A
ZPh
oeni
x, A
ZN
ew Y
ork
City
, NY
Oak
land
City
, CA
Loui
svill
e-Je
ffer
son
Cou
nty,
KY
Las V
egas
, NV
Fort
Wor
th, T
XSa
cram
ento
City
, CA
Min
neap
olis
, MN
Atla
nta,
GA
Alb
uque
rque
City
, NM
San
Fran
cisc
o, C
ALo
s Ang
eles
, CA
Hon
olul
u, H
IC
olum
bus C
ity, O
HPh
ilade
lphi
a, P
AC
ity o
f Cle
vela
nd, O
HN
ashv
ille
& D
avid
son
Cou
nty,
TN
El P
aso,
TX
Fres
no, C
AA
ustin
, TX
Virg
inia
Bea
ch, V
AC
harlo
tte, N
CSa
n D
iego
, CA
City
and
Cou
nty
of D
enve
r, C
OJa
ckso
nvill
e, F
LIn
dian
apol
is, I
NK
ansa
s City
, MO
Mem
phis
, TN
Long
Bea
ch C
ity, C
ATu
lsa
City
, OK
Ral
eigh
City
, NC
Seat
tle, W
AO
klah
oma
City
, OK
Was
hing
ton
DC
, DC
San
Ant
onio
, TX
Col
orad
o Sp
rings
, CO
Required paymentsCurrent payments

21
Figure 9. States: Current and Required OPEB Payments as a Percentage of Own-Source Revenue, 2014
Sources: Authors’ calculations based on various FY 2014 plan and government financial reports and actuarial valuations; and U.S. Census Bureau (2014).
0%
10%
20%
30%
40%
50%
60%
70%IL N
JC
T HI
KY
MA RI
DE
MD LA AK SC WV PA CA TX ME IN NH VT
CO
MO
NY
MT
NM MS
MI
AL
WA
GA
VA SD OH
NV
OK KS
WI
AR
OR
NC ID TN FL UT
WY
MN AZ IA ND NE
Required PaymentsCurrent Payments

22
Figure 10. Large Counties: Current and Required OPEB Payments as a Percentage of Own-Source Revenue, 2014
Sources: Authors’ calculations based on various FY 2014 plan and government financial reports and actuarial valuations; and U.S. Census Bureau (2014).
0%10%20%30%40%50%60%70%
Fres
no, C
ASa
cram
ento
, CA
Ker
n, C
ALo
s Ang
eles
, CA
Ora
nge,
CA
Coo
k C
ount
y, IL
San
Die
go, C
APr
ince
Geo
rges
Cou
nty,
MD
Fairf
ax, V
ASa
n B
erna
rdin
o, C
AW
ake,
NC
Way
ne, M
IH
amilt
on, O
HSa
nta
Cla
ra, C
AC
lark
, NV
Riv
ersi
de, C
AM
eckl
enbu
rg, N
CEs
sex
Cou
nty,
NJ
Milw
auke
e, W
ITa
rran
t, TX
Ala
med
a, C
AD
u Pa
ge C
ount
y, IL
Har
ris, T
XTr
avis
, TX
Mar
icop
a C
ount
y, A
ZM
iam
i-Dad
e, F
LC
ontra
Cos
ta, C
AM
acom
b, M
IK
ing,
WA
Alle
ghen
y, P
AB
row
ard
Cou
nty,
FL
Cuy
ahog
a, O
HFr
ankl
in, O
HO
rang
e, F
LC
ollin
Cou
nty,
TX
Pim
a, A
ZW
estc
hest
er, N
YEr
ie, N
YH
illsb
orou
gh, F
LSa
lt La
ke, U
TH
enne
pin,
MN
El P
aso
Cou
nty,
TX
Mon
tgom
ery
Cou
nty,
MD
St L
ouis
, MO
Dal
las,
TXB
exar
, TX
Fulto
n, G
APi
nella
s, FL
Shel
by, T
NPi
erce
Cou
nty,
WA
Required paymentsCurrent payments

23
Figure 11. Large Cities: Current and Required OPEB Payments as a Percentage of Own-Source Revenue, 2014
Sources: Authors’ calculations based on various FY 2014 plan and government financial reports and actuarial valuations; and U.S. Census Bureau (2014).
0%
10%
20%
30%
40%
50%
60%
70%C
hica
go, I
LD
etro
it C
ity, M
ISa
n Jo
se, C
AM
iam
i City
, FL
Hou
ston
, TX
Bal
timor
e, M
DW
ichi
ta, K
SPo
rtlan
d, O
RO
mah
a, N
EB
osto
n, M
AM
esa,
AZ
Milw
auke
e, W
ID
alla
s, TX
Tucs
on, A
ZPh
oeni
x, A
ZN
ew Y
ork
City
, NY
Oak
land
City
, CA
Loui
svill
e-Je
ffer
son
Cou
nty,
KY
Las V
egas
, NV
Fort
Wor
th, T
XSa
cram
ento
City
, CA
Min
neap
olis
, MN
Atla
nta,
GA
Alb
uque
rque
City
, NM
San
Fran
cisc
o, C
ALo
s Ang
eles
, CA
Hon
olul
u, H
IC
olum
bus C
ity, O
HPh
ilade
lphi
a, P
AC
ity o
f Cle
vela
nd, O
HN
ashv
ille
& D
avid
son
Cou
nty,
TN
El P
aso,
TX
Fres
no, C
AA
ustin
, TX
Virg
inia
Bea
ch, V
AC
harlo
tte, N
CSa
n D
iego
, CA
City
and
Cou
nty
of D
enve
r, C
OJa
ckso
nvill
e, F
LIn
dian
apol
is, I
NK
ansa
s City
, MO
Mem
phis
, TN
Long
Bea
ch C
ity, C
ATu
lsa
City
, OK
Ral
eigh
City
, NC
Seat
tle, W
AO
klah
oma
City
, OK
Was
hing
ton
DC
, DC
San
Ant
onio
, TX
Col
orad
o Sp
rings
, CO
Required paymentsCurrent payments

24
Figure 12. States: Current and Required Pension, OPEB, and Interest Payments as a Percentage of Own-Source Revenue, 2014
Sources: Authors’ calculations based on various FY 2014 plan and government financial reports and actuarial valuations; and U.S. Census Bureau (2014).
0%
10%
20%
30%
40%
50%
60%
70%IL N
JC
T HI
KY
MA RI
DE
MD LA AK SC WV PA CA TX ME IN NH VT
CO
MO
NY
MT
NM MS
MI
AL
WA
GA
VA SD OH
NV
OK KS
WI
AR
OR
NC
TN FL UT ID WY
MN AZ IA ND NE
Required paymentsCurrent payments

25
Figure 13. States: Required Payments for Pensions, OPEB, and Interest Payments as a Percentage of Own-Source Revenue, 2014
Sources: Authors’ calculations based on various FY 2014 plan and government financial reports and actuarial valuations; and U.S. Census Bureau (2014).
0%
10%
20%
30%
40%
50%
60%
70%IL N
JC
T HI
KY
MA RI
DE
MD LA AK SC WV PA CA TX ME IN NH VT
CO
MO
NY
MT
NM MS
MI
AL
WA
GA
VA SD OH
NV
OK KS
WI
AR
OR
NC ID TN FL UT
WY
MN AZ IA ND NE
Debt serviceRequired OPEB paymentsRequired pension payments

26
Figure 14. Large Counties: Current and Required Pension, OPEB, and Interest Payments as a Percentage of Own-Source Revenue, 2014
Source: Authors’ calculations based on various FY 2014 plan and government financial reports and actuarial valuations; and U.S. Census Bureau (2014).
0%
10%
20%
30%
40%
50%
60%
70%Fr
esno
, CA
Sacr
amen
to, C
AK
ern,
CA
Los A
ngel
es, C
AO
rang
e, C
AC
ook
Cou
nty,
ILSa
n D
iego
, CA
Prin
ce G
eorg
es C
ount
y, M
DFa
irfax
, VA
San
Ber
nard
ino,
CA
Wak
e, N
CW
ayne
, MI
Ham
ilton
, OH
Sant
a C
lara
, CA
Cla
rk, N
VR
iver
side
, CA
Mec
klen
burg
, NC
Esse
x C
ount
y, N
JM
ilwau
kee,
WI
Tarr
ant,
TXA
lam
eda,
CA
Du
Page
Cou
nty,
ILH
arris
, TX
Trav
is, T
XM
aric
opa
Cou
nty,
AZ
Mia
mi-D
ade,
FL
Con
tra C
osta
, CA
Mac
omb,
MI
Kin
g, W
AA
llegh
eny,
PA
Bro
war
d C
ount
y, F
LC
uyah
oga,
OH
Fran
klin
, OH
Ora
nge,
FL
Col
lin C
ount
y, T
XPi
ma,
AZ
Wes
tche
ster
, NY
Erie
, NY
Hill
sbor
ough
, FL
Salt
Lake
, UT
Hen
nepi
n, M
NEl
Pas
o C
ount
y, T
XM
ontg
omer
y C
ount
y, M
DSt
Lou
is, M
OD
alla
s, TX
Bex
ar, T
XFu
lton,
GA
Pine
llas,
FLSh
elby
, TN
Pier
ce C
ount
y, W
A
Debt serviceRequired OPEB paymentsRequired pension payments

27
Figure 15. Large Cities: Current and Required Pension, OPEB, and Interest Payments as a Percentage of Own-Source Revenue, 2014
Source: Authors’ calculations based on various FY 2014 plan and government financial reports and actuarial valuations; and U.S. Census Bureau (2014).
0%
10%
20%
30%
40%
50%
60%
70%C
hica
go, I
LD
etro
it C
ity, M
ISa
n Jo
se, C
AM
iam
i City
, FL
Hou
ston
, TX
Bal
timor
e, M
DW
ichi
ta, K
SPo
rtlan
d, O
RO
mah
a, N
EB
osto
n, M
AM
esa,
AZ
Milw
auke
e, W
ID
alla
s, TX
Tucs
on, A
ZPh
oeni
x, A
ZN
ew Y
ork
City
, NY
Oak
land
City
, CA
Loui
svill
e-Je
ffer
son
Cou
nty,
KY
Las V
egas
, NV
Fort
Wor
th, T
XSa
cram
ento
City
, CA
Min
neap
olis
, MN
Atla
nta,
GA
Alb
uque
rque
City
, NM
San
Fran
cisc
o, C
ALo
s Ang
eles
, CA
Hon
olul
u, H
IC
olum
bus C
ity, O
HPh
ilade
lphi
a, P
AC
ity o
f Cle
vela
nd, O
HN
ashv
ille
& D
avid
son
Cou
nty,
TN
El P
aso,
TX
Fres
no, C
AA
ustin
, TX
Virg
inia
Bea
ch, V
AC
harlo
tte, N
CSa
n D
iego
, CA
City
and
Cou
nty
of D
enve
r, C
OJa
ckso
nvill
e, F
LIn
dian
apol
is, I
NK
ansa
s City
, MO
Mem
phis
, TN
Long
Bea
ch C
ity, C
ATu
lsa
City
, OK
Ral
eigh
City
, NC
Seat
tle, W
AO
klah
oma
City
, OK
Was
hing
ton
DC
, DC
San
Ant
onio
, TX
Col
orad
o Sp
rings
, CO
Debt serviceRequired OPEB paymentsRequired pension payments

28
Appendix A
Figure 16. Large School Districts: Current and Required Pension Payments as a Percentage of Own-Source Revenue, 2014
Source: Authors’ calculations based on various FY 2014 plan and government financial reports and actuarial valuations; and U.S. Census Bureau (2014).
0%
20%
40%
60%
80%
100%
120%
140%
Syra
cuse
, NY
Buf
falo
, NY
Cla
rk C
ount
y Sc
h D
ist,
NV
Yon
kers
City
, NY
Los A
ngel
es U
nif S
ch D
ist,
CA
City
of C
hica
go S
choo
l Dis
trict
299
, IL
Roc
hest
er C
ity, N
YPh
ilade
lphi
a Sc
hool
Dis
trict
, PA
Cob
b C
o Sc
h D
istri
ct, G
AH
illsb
orou
gh C
o Sc
h D
ist,
FLW
ake,
NC
New
Yor
k C
ity, N
YG
uilfo
rd, N
CSp
ringf
ield
, MA
Duv
al C
o Sc
h D
ist,
FLB
row
ard
Co
Scho
ol D
ist,
FLSa
n D
iego
City
Uni
f Sch
Dis
t, C
APr
ovid
ence
City
, RI
Mec
klen
burg
, NC
Dur
ham
Cou
nty,
NC
Man
ches
ter C
ity, N
HPi
nella
s Co
Sch
Dis
t, FL
Ora
nge
Co
Sch
Boa
rd, F
LFa
irfax
, VA
Fred
eric
k, M
DM
iam
i-Dad
e C
ount
y Pu
blic
Sch
ool D
istri
ct, F
LA
ncho
rage
, AK
Cyp
ress
-Fai
rban
ks In
d Sc
hool
Dis
trict
907
, TX
Wor
cest
er C
ity, M
AA
rling
ton,
VA
New
port
New
s, V
AV
irgin
ia B
each
, VA
Fairb
anks
Nor
th S
tar B
orou
gh, A
KR
ichm
ond,
VA
Nor
folk
, VA
Mon
tgom
ery,
TN
Che
sape
ake,
VA
Dal
las I
nd S
ch D
t 905
, TX
New
Hav
en C
ity, C
TSh
elby
, TN
Hou
ston
Ind
Sch
Dis
t 912
, TX
Bal
timor
e, M
DK
nox,
TN
Bos
ton,
MA
Ham
ilton
, TN
Har
tford
, CT
Ann
e A
rund
el C
ount
y, M
DN
ashv
ille
& D
avid
son
Cou
nty,
TN
Was
hing
ton
DC
, DC
Prin
ce G
eorg
es C
ount
y, M
D
Required paymentsCurrent payments

29
Figure 17. Large School Districts: Current and Required OPEB Payments as a Percentage of Own-Source Revenue, 2014
Source: Authors’ calculations based on various FY 2014 plan and government financial reports and actuarial valuations; and U.S. Census Bureau (2014).
0%
20%
40%
60%
80%
100%
120%
140%Sy
racu
se, N
YB
uffa
lo, N
YC
lark
Cou
nty
Sch
Dis
t, N
VY
onke
rs C
ity, N
YLo
s Ang
eles
Uni
f Sch
Dis
t, C
AC
ity o
f Chi
cago
Sch
ool D
istri
ct 2
99, I
LR
oche
ster
City
, NY
Phila
delp
hia
Scho
ol D
istri
ct, P
AC
obb
Co
Sch
Dis
trict
, GA
Hill
sbor
ough
Co
Sch
Dis
t, FL
Wak
e, N
CN
ew Y
ork
City
, NY
Gui
lford
, NC
Sprin
gfie
ld, M
AD
uval
Co
Sch
Dis
t, FL
Bro
war
d C
o Sc
hool
Dis
t, FL
San
Die
go C
ity U
nif S
ch D
ist,
CA
Prov
iden
ce C
ity, R
IM
eckl
enbu
rg, N
CD
urha
m C
ount
y, N
CM
anch
este
r City
, NH
Pine
llas C
o Sc
h D
ist,
FLO
rang
e C
o Sc
h B
oard
, FL
Fairf
ax, V
AFr
eder
ick,
MD
Mia
mi-D
ade
Cou
nty
Publ
ic S
choo
l Dis
trict
, FL
Anc
hora
ge, A
KC
ypre
ss-F
airb
anks
Ind
Scho
ol D
istri
ct 9
07, T
XW
orce
ster
City
, MA
Arli
ngto
n, V
AN
ewpo
rt N
ews,
VA
Virg
inia
Bea
ch, V
AFa
irban
ks N
orth
Sta
r Bor
ough
, AK
Ric
hmon
d, V
AN
orfo
lk, V
AM
ontg
omer
y, T
NC
hesa
peak
e, V
AD
alla
s Ind
Sch
Dt 9
05, T
XN
ew H
aven
City
, CT
Shel
by, T
NH
oust
on In
d Sc
h D
ist 9
12, T
XB
altim
ore,
MD
Kno
x, T
NB
osto
n, M
AH
amilt
on, T
NH
artfo
rd, C
TA
nne
Aru
ndel
Cou
nty,
MD
Nas
hvill
e &
Dav
idso
n C
ount
y, T
NW
ashi
ngto
n D
C, D
CPr
ince
Geo
rges
Cou
nty,
MD
Required paymentsCurrent payments

30
Figure 18. Large School Districts: Current and Required Pension, OPEB, and Interest Payments as a Percentage of Own-Source Revenue, 2014
Source: Authors’ calculations based on various FY 2014 plan and government financial reports and actuarial valuations; and U.S. Census Bureau (2014).
0%
20%
40%
60%
80%
100%
120%
140%Sy
racu
se, N
YB
uffa
lo, N
YC
lark
Cou
nty
Sch
Dis
t, N
VY
onke
rs C
ity, N
YLo
s Ang
eles
Uni
f Sch
Dis
t, C
AC
ity o
f Chi
cago
Sch
ool D
istri
ct 2
99, I
LR
oche
ster
City
, NY
Phila
delp
hia
Scho
ol D
istri
ct, P
AC
obb
Co
Sch
Dis
trict
, GA
Hill
sbor
ough
Co
Sch
Dis
t, FL
Wak
e, N
CN
ew Y
ork
City
, NY
Gui
lford
, NC
Sprin
gfie
ld, M
AD
uval
Co
Sch
Dis
t, FL
Bro
war
d C
o Sc
hool
Dis
t, FL
San
Die
go C
ity U
nif S
ch D
ist,
CA
Prov
iden
ce C
ity, R
IM
eckl
enbu
rg, N
CD
urha
m C
ount
y, N
CM
anch
este
r City
, NH
Pine
llas C
o Sc
h D
ist,
FLO
rang
e C
o Sc
h B
oard
, FL
Fairf
ax, V
AFr
eder
ick,
MD
Mia
mi-D
ade
Cou
nty
Publ
ic S
choo
l Dis
trict
, FL
Anc
hora
ge, A
KC
ypre
ss-F
airb
anks
Ind
Scho
ol D
istri
ct 9
07, T
XW
orce
ster
City
, MA
Arli
ngto
n, V
AN
ewpo
rt N
ews,
VA
Virg
inia
Bea
ch, V
AFa
irban
ks N
orth
Sta
r Bor
ough
, AK
Ric
hmon
d, V
AN
orfo
lk, V
AM
ontg
omer
y, T
NC
hesa
peak
e, V
AD
alla
s Ind
Sch
Dt 9
05, T
XN
ew H
aven
City
, CT
Shel
by, T
NH
oust
on In
d Sc
h D
ist 9
12, T
XB
altim
ore,
MD
Kno
x, T
NB
osto
n, M
AH
amilt
on, T
NH
artfo
rd, C
TA
nne
Aru
ndel
Cou
nty,
MD
Nas
hvill
e &
Dav
idso
n C
ount
y, T
NW
ashi
ngto
n D
C, D
CPr
ince
Geo
rges
Cou
nty,
MD
Required paymentsCurrent payments

31
Appendix B Figure 19. States: Current and Required Pension, OPEB, and Interest Payments as a Percentage of Net Revenue, 2014
Source: Authors’ calculations based on various FY 2014 plan and government financial reports and actuarial valuations; and U.S. Census Bureau (2014).
0%
10%
20%
30%
40%
50%
60%
70%
IL NJ
CT HI
KY
MA RI
DE
MD LA AK SC WV PA CA TX ME IN NH VT
CO
MO
NY
MT
NM MS
MI
AL
WA
GA
VA SD OH
NV
OK KS
WI
AR
OR
NC
TN FL UT ID WY
MN AZ IA ND NE
Required paymentsCurrent payments

32
Figure 20. Large Counties: Current and Required Pension, OPEB, and Interest Payments as a Percentage of Net Revenue, 2014
Source: Authors’ calculations based on various FY 2014 plan and government financial reports and actuarial valuations; and U.S. Census Bureau (2014).
0%10%20%30%40%50%60%70%
Coo
k C
ount
y, IL
Fairf
ax, V
AH
amilt
on, O
HPr
ince
Geo
rges
Cou
nty,
MD
Cla
rk, N
VLo
s Ang
eles
, CA
Sacr
amen
to, C
ATa
rran
t, TX
Trav
is, T
XK
ern,
CA
Ora
nge,
CA
Mia
mi-D
ade,
FL
Wak
e, N
CFr
esno
, CA
Milw
auke
e, W
IH
arris
, TX
Sant
a C
lara
, CA
Way
ne, M
ISa
n D
iego
, CA
Mec
klen
burg
, NC
Con
tra C
osta
, CA
San
Ber
nard
ino,
CA
Esse
x C
ount
y, N
JK
ing,
WA
Du
Page
Cou
nty,
ILEr
ie, N
YM
aric
opa
Cou
nty,
AZ
Col
lin C
ount
y, T
XA
lam
eda,
CA
Wes
tche
ster
, NY
Mac
omb,
MI
Ora
nge,
FL
Hill
sbor
ough
, FL
Bro
war
d C
ount
y, F
LC
uyah
oga,
OH
St L
ouis
, MO
Fran
klin
, OH
Fulto
n, G
ASa
lt La
ke, U
TPi
ma,
AZ
Riv
ersi
de, C
AM
ontg
omer
y C
ount
y, M
DEl
Pas
o C
ount
y, T
XD
alla
s, TX
Bex
ar, T
XSh
elby
, TN
Alle
ghen
y, P
APi
nella
s, FL
Hen
nepi
n, M
NPi
erce
Cou
nty,
WA
Required paymentsCurrent payments

33
Figure 21. Large Cities: Current and Required Pension, OPEB, and Interest Payments as a Percentage of Net Revenue, 2014
Source: Authors’ calculations based on various FY 2014 plan and government financial reports and actuarial valuations; and U.S. Census Bureau (2014).
0%
10%
20%
30%
40%
50%
60%
70%C
hica
go, I
LSa
n Jo
se, C
AD
etro
it C
ity, M
IH
oust
on, T
XM
iam
i City
, FL
Om
aha,
NE
Portl
and,
OR
Wic
hita
, KS
Dal
las,
TXB
osto
n, M
AFo
rt W
orth
, TX
Oak
land
City
, CA
Loui
svill
e-Je
ffer
son
Cou
nty,
KY
Mes
a, A
ZPh
oeni
x, A
ZB
altim
ore,
MD
Sacr
amen
to C
ity, C
AM
inne
apol
is, M
NLo
s Ang
eles
, CA
New
Yor
k C
ity, N
YA
tlant
a, G
AM
ilwau
kee,
WI
Col
umbu
s City
, OH
El P
aso,
TX
Las V
egas
, NV
Hon
olul
u, H
ITu
cson
, AZ
City
Of C
leve
land
, OH
Nas
hvill
e &
Dav
idso
n C
ount
y, T
NA
lbuq
uerq
ue C
ity, N
MSa
n Fr
anci
sco,
CA
Phila
delp
hia,
PA
Aus
tin, T
XFr
esno
, CA
Jack
sonv
ille,
FL
San
Die
go, C
AK
ansa
s City
, MO
City
And
Cou
nty
Of D
enve
r, C
OC
harlo
tte, N
CLo
ng B
each
City
, CA
Indi
anap
olis
, IN
Tuls
a C
ity, O
KR
alei
gh C
ity, N
CSe
attle
, WA
Virg
inia
Bea
ch, V
AO
klah
oma
City
, OK
Mem
phis
, TN
Was
hing
ton
D C
, DC
San
Ant
onio
, TX
Col
orad
o Sp
rings
, CO
Required paymentsCurrent payments

34
Figure 22. Large School Districts: Current and Required Pension, OPEB, and Interest Payments as a Percentage of Net Revenue, 2014
Source: Authors’ calculations based on various FY 2014 plan and government financial reports and actuarial valuations; and U.S. Census Bureau (2014).
0%
10%
20%
30%
40%
50%
60%
70%Y
onke
rs C
ity, N
YSy
racu
se, N
YN
ew Y
ork
City
, NY
City
of C
hica
go S
choo
l Dis
trict
299
, IL
Cla
rk C
ount
y Sc
h D
ist,
NV
Cob
b C
o Sc
h D
istri
ct, G
AW
ake,
NC
Buf
falo
, NY
Fairf
ax, V
AA
rling
ton,
VA
Phila
delp
hia
Scho
ol D
istri
ct, P
AG
uilfo
rd, N
CM
anch
este
r City
, NH
Prov
iden
ce C
ity, R
IFr
eder
ick,
MD
Los A
ngel
es U
nif S
ch D
ist,
CA
Hill
sbor
ough
Co
Sch
Dis
t, FL
San
Die
go C
ity U
nif S
ch D
ist,
CA
Bro
war
d C
o Sc
hool
Dis
t, FL
Mec
klen
burg
, NC
Shel
by, T
ND
urha
m C
ount
y, N
CR
oche
ster
City
, NY
Pine
llas C
o Sc
h D
ist,
FLA
ncho
rage
, AK
Duv
al C
o Sc
h D
ist,
FLO
rang
e C
o Sc
h B
oard
, FL
Ric
hmon
d, V
AN
ewpo
rt N
ews,
VA
Mia
mi-D
ade
Cou
nty
Publ
ic S
choo
l Dis
trict
, FL
Virg
inia
Bea
ch, V
AC
ypre
ss-F
airb
anks
Ind
Scho
ol D
istri
ct 9
07, T
XD
alla
s Ind
Sch
Dt 9
05, T
XN
orfo
lk, V
AW
orce
ster
City
, MA
Che
sape
ake,
VA
Mon
tgom
ery,
TN
Sprin
gfie
ld, M
AH
oust
on In
d Sc
h D
ist 9
12, T
XK
nox,
TN
Bos
ton,
MA
Fairb
anks
Nor
th S
tar B
orou
gh, A
KH
amilt
on, T
NN
ew H
aven
City
, CT
Bal
timor
e, M
DA
nne
Aru
ndel
Cou
nty,
MD
Nas
hvill
e &
Dav
idso
n C
ount
y, T
NW
ashi
ngto
n D
C, D
CH
artfo
rd, C
TPr
ince
Geo
rges
Cou
nty,
MD
Required paymentsCurrent payments