AN OPTIMIZATION OF MIXING PROCESS...
22
AN OPTIMIZATION OF MIXING PROCESS PARAMETERS FOR SOY SAUCE PRODUCTION NOORILYANA BINTI ABU BAKAR A project report submitted in partial fulfilment of the requirements for the award of the degree of Master of Engineering (Industrial Engineering) Faculty of Mechanical Engineering Universiti Teknologi Malaysia JUNE 2015
Transcript of AN OPTIMIZATION OF MIXING PROCESS...
AN OPTIMIZATION OF MIXING PROCESS PARAMETERS FOR SOY SAUCE
PRODUCTION
NOORILYANA BINTI ABU BAKAR
A project report submitted in partial fulfilment of the
requirements for the award of the degree of
Master of Engineering (Industrial Engineering)
Faculty of Mechanical Engineering
Universiti Teknologi Malaysia
JUNE 2015

Buat Keluarga Tersayang
Mak abah
Jummelah binti Tahir
Abu Bakar bin Daud
Zaharah binti Othman
Keni bin Miskon
Abang-abang
Adik-adik
dan teristimewa buat suami
Khairul Luthfi bin Keni
serta anak-anak tercinta
Muhammad Althof bin Khairul Luthfi
Muhammad Afiq bin Khairul Luthfi
Muhammad Alfatih bin Khairul Luthfi
Terima kasih atas segalanya!

ACKNOWLEDGEMENT
First and foremost, all praise be to Allah, the Mighty, the Benevolent for His
blessings and guidance for giving the inspiration to embark on the project and instilling the
strength to see that the report project becomes a reality. Many people have contributed to
the creation and completion of this book. I would like to express my gratitude to my
project’s supervisor, Associate Professor Dr. Adnan bin Hassan for his valuable guidance,
encouragement, attractive ideas, information, illustration and advice throughout the
completion of this project and hopes the Al – Mighty will make his life so pleasant.
Thank you to my family who gave so much support, encouragement, inspiration and
always pray for my success. Very special thanks to Puan Noryanti binti Kasnan, Quality
Controller of Zara Foodstuff Industries Sendirian Berhad who have given me a golden
opportunity to complete this project at her company and always guide, advice and assist me
to the completion of this project.
I would like also to dedicate this project report to all my friends who have always
shown great comfort in those stressful days with their advice, care and support. To the
Faculty of Mechanical Engineering and Perpustakaan Sultanah Zanariah’staffs, my
lecturers in Universiti Teknologi Malaysia (UTM) and anywhere in the world, thanks for
your valuable help and understanding. May Allah bless you all.

ABSTRACT
This research was done to reduce the variation of brixs in mixing process to produce
sweet soy sauce. The objective of this research is to find the optimum setting in mixing
process. Design of Experiment was used to analyze various combination of process
parameters. The process parameters investigated were sugar, caramel, monosodium
glutamate (MSG) for Experiment 1 and sugar, salt, water, acid acetic for Experiment 2
respectively. It was not economically practical to run experiments in the real life factory
environment. As such, lab experiment was used in this study. Full factorial of design matrix
has been used. The significant factors for Experiment 1 are sugar, MSG and caramel. This
is including two way interactions between sugar and MSG, Sugar and caramel, MSG and
caramel and the last one is three way interaction of all factors. Normally, 3 way interaction
and above are assumed as insignificant factors. The significant factors for Experiment 2 are
sugar, salt, water and caramel. This is including two way interactions between sugar and
salt, Sugar and acetic acid, salt and acetic acid, water and acetic acid and three way
interaction between sugar, salt and water and last three way interaction are sugar, water and
acetic acid. The study reveals that the optimum setting is the low level (-1) of sugar
(450~500 kilogram), caramel (200~225 kilogram) and MSG (64~68 kilogram) for
Experiment 1. The optimum setting for Experiment 2 is the low level (-1) of sugar
(1350~1450 kilogram), salt (45~55 kilogram), and acetic acid (0.35~0.45 litres) but higher
level (+1) for water (800~900 litres) in order to ensure the brix reading fulfil the
specification. Mathematical models have been proposed to predict the performance of
mixing process with brix reading as the response within the investigated ranges. There are a
few suggestions and suitable action plan were proposed to increase the quality of
production.
ABSTRAK
Kajian ini dijalankan untuk mengurangkan variasi ke atas bacaan brix di dalam
proses campuran menghasilkan kicap soya manis. Objektif utama kajian ini adalah untuk
mencari pemboleh ubah yang optima dalam proses ini. Rekabentuk Eksperimen telah
digunakan untuk menganalisa pelbagai gabungan pemboleh ubah dalam proses ini.
Pemboleh ubah yang dikaji adalah gula, caramel dan perasa monosodium glutamate (MSG)
untuk Eksperimen 1 dan gula, garam, air serta asid asetik untuk Eksperimen 2. Tidak
praktikal dari segi ekonomi untuk menjalankan eksperimen sebenar seperti di kilang
melainkan eksperimen makmal digunakan. Faktorial penuh digunakan dalam eksperimen
ini. Faktor-faktor yang ketara untuk Eksperiman 1 adalah gula, MSG dan caramel, interaksi
dua hala adalah antara gula dan MSG, gula dan karamel, MSG dan karamel dan yang
terakhir interaksi tiga hala adalah melibatkan ketiga-tiga faktor iaitu, gula, MSG dan
karamel. Kebiasaannya, interaksi 3 hala atau lebih adalah dianggap sebagai faktor yang
tidak penting. Untuk Eksperimen 2, faktor-faktor yang ketara adalah gula, garam, air dan
asid asetik, interaksi dua hala pula menunjukkan perkaitan antara gula dan garam, gula dan
asid asetik, garam dan asid asetik, air dan asid asetik manakala untuk interaksi 3 hala pula
melibatkan interaksi antara gula, garam dan air serta gula, air dan asid asetik.
Kebiasaannya, interaksi tiga hala adalah dianggap sebagai faktor yang tidak penting. Hasil
daripada kajian ini, pemboleh ubah yang optima adalah nilai rendah (-1) pada gula
(450~500kilogram), karamel (200~225kilogram) dan MSG (64~68kilogram) untuk
Eksperimen 1. Penetapan nilai optimum untuk Eksperimen 2 pula adalah nilai rendah (-1)
untuk gula (1350~1450kilogram), garam (45~55kilogram) dan asid asetik(0.35~0.45litres)
tetapi nilai tinggi (+1) adalah untuk air (800~900liter) untuk memastikan bacaan brix
adalah memenuhi spesifikasi yang ditetapkan. Matematik model telah dicadangkan untuk
menganggar keupayaan proses campuran dengan mengunakan brix sebagai respon dan
beberapa eksperimen telah dijalankan. Beberapa cadangan telah dikemukakan untuk
meningkatkan kualiti pengeluaran
TABLE OF CONTENTS
CHAPTER TITLE PAGE
DECLARATION ii
DEDICATION iii
ACKNOWLEDGEMENTS iv
ABSTRACT v
ABSTRAK vi
TABLE OF CONTENTS vii
LIST OF TABLES x
LIST OF FIGURES xi
1 INTRODUCTION
1.1 Background of Project 1
1.2 Problem Statement 3
1.3 Objectives of the project 3
1.4 Scope of the Project 3
1.5 Methodology of the Project 4
1.6 Expected Result 4
1.7 Summary 5
2 LITERATURE REVIEW
2.1 Introduction 6
2.2 Quality 6
2.3 Statictical Process Control (SPC) 9
2.4 Design of Experiment Process 20
2.5 Effects to the Process Mean Shift and Variation 28

2.6 Soy Sauce Production Process 30
2.6.1 Plant-based Fermentation 33
2.6.2 Raw Material Preparation 34
2.6.3 Koji 34
2.6.4 Mashing 35
2.6.5 Fermentation 35
2.6.6 Pressing and Refining 35
2.7 Related Previous Work 36
2.8 Summary 37
3 BACKGROUND OF COMPANY
3.1 Introduction 39
3.2 Organizational Chart 41
3.3 Quality Policy 41
3.4 Product of Zara Foodstuff Industries Sdn. Bhd. 42
3.4.1 Soy sauce 42
3.4.2 Process Flow of Fermentation 43
3.4.3 Soy Sauce Manufactuting Process 45
3.5 Methodology of the Project 46
3.6 Summary 50
4 CHARACTERIZATION OF EXISTING CONDITION AND
PROBLEM IDENTIFICATION
4.1 Current Monitoring process in industry 51
4.2 Characterization of Existing Condition 52
4.3 Variation of Brix 52
4.4 Process Variation and Process Capability 54
4.5 Issues in Optimization 56
4.6 Factor, Levels and Ranges Selection 57
4.7 Summary 59
5 DESIGN OF EXPERIMENT AND DATA ANALYSIS
5.1 Introduction 60
5.2 Selection of Factors 60
5.3 Design of Experiment for Ingredient B (Experiment 1) 62
5.3.1 Main Effect and Interaction Analysis 64
5.3.2 Normal Probability and Pareto Chart 65
5.3.3 Factorial Fit and ANOVA 67
5.3.4 Residual Plot 68
5.4 Design of Experiment for Ingredient C (Experiment 2) 70
5.4.1 Main Effect and Interaction Analysis 72
5.4.2 Normal Probability and Pareto Chart 74
5.4.3 Factorial Fit and ANOVA 74
5.4.4 Residual Plot 77
5.5 Summary 78
6 RESULT AND DISCUSSION
6.1 Introduction 79
6.2 Confirmation run for Experiment 1 79
6.3 Confirmation run for Experiment 2 81
6.4 Discussion of Result 83
6.5 Summary 83
7 CONCLUSION AND RECOMMENDATION
7.1 Conclusion 84
7.2 Recommendation 85
7.2.1 Suggestion for further research 85
7.2.2 Suggestion to Industry 85
REFERENCES
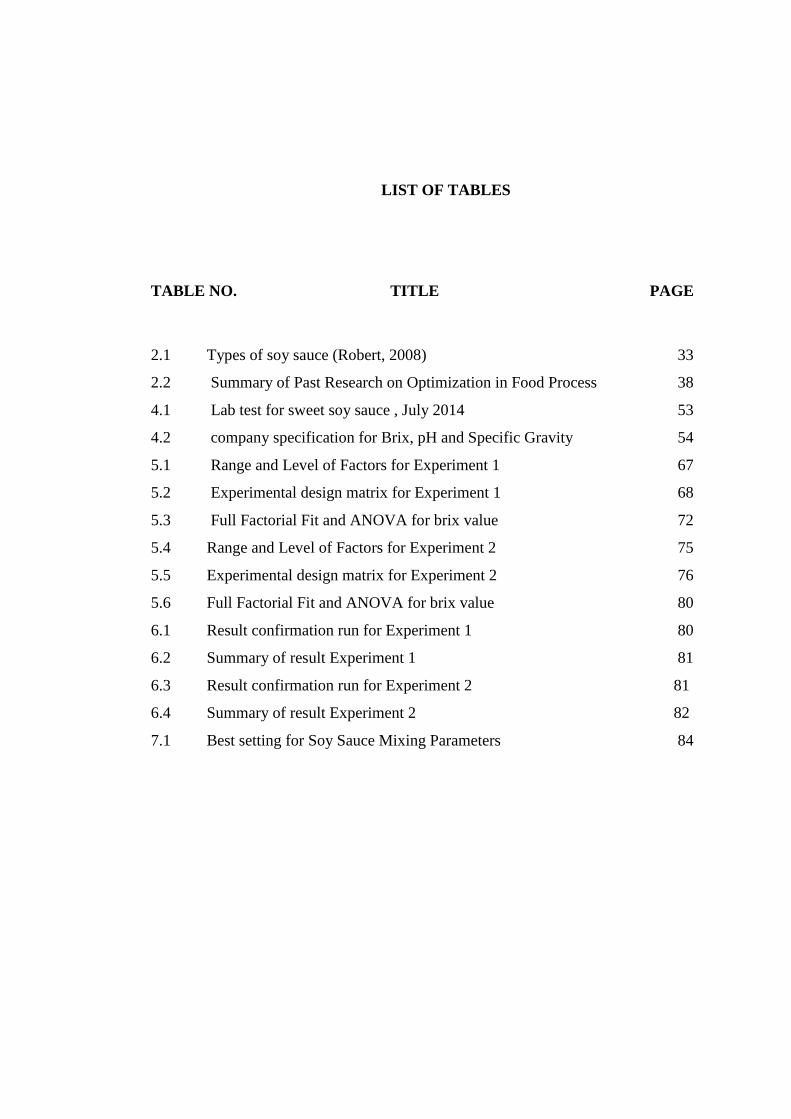
LIST OF TABLES
TABLE NO. TITLE PAGE
2.1 Types of soy sauce (Robert, 2008) 33
2.2 Summary of Past Research on Optimization in Food Process 38
4.1 Lab test for sweet soy sauce , July 2014 53
4.2 company specification for Brix, pH and Specific Gravity 54
5.1 Range and Level of Factors for Experiment 1 67
5.2 Experimental design matrix for Experiment 1 68
5.3 Full Factorial Fit and ANOVA for brix value 72
5.4 Range and Level of Factors for Experiment 2 75
5.5 Experimental design matrix for Experiment 2 76
5.6 Full Factorial Fit and ANOVA for brix value 80
6.1 Result confirmation run for Experiment 1 80
6.2 Summary of result Experiment 1 81
6.3 Result confirmation run for Experiment 2 81
6.4 Summary of result Experiment 2 82
7.1 Best setting for Soy Sauce Mixing Parameters 84

LIST OF FIGURES
FIGURE NO. TITLE PAGE
2.1 Areas responsible for quality (Source: Besterfield, 2004) 9
2.2 Pareto Chart 13
2.3 Cause and Effect Diagram 13
2.4 Check Sheet 14
2.5 Process Flow Diagram 15
2.6 Scatter Diagram 16
2.7 Histogram 17
2.8 Control Chart 18
2.9 Causes effect to process mean and variance (Montgomery, 1996) 29
2.10 Soy and wheat with Aspergillus sojae cultures to brew soy sauce 32
3.1 Building of Zara Foodstuff Industries Sdn Bhd 39
3.2 Organizational Chart of Zara Foodstuff 41
3.3 Fermentation process flow for soy sauce 43
3.4 Process Flow of soy sauce manufacturing process 45
3.5 Steps of Project Implementation 47
4.1 Illustrates the Refractometer 52
4.2 Individual chart for Brix , July 2014 53
4.3 EWMA chart of data 55
4.4 Histogram of current Brix and USL,LSL line 56
4.5 Cause and effect diagram for Brix reading 57
5.1 Ingredient in Mixing Process 61
5.2 Factors need to be controlled 61
5.3 Mixing in lab scale using overhead stirrer 62
5.4 Main Effect Plot for Brix (Experiment 1) 64

5.5 Interaction plot for Brix value (Experiment 1) 65
5.6 Normal Probability Plot (Experiment1) 66
5.7 Pareto Chart (Experiment 1) 66
5.8 Residual Plot for Brix value 69
5.9 Main Effect Plot for Brix (Experiment 2) 72
5.10 Interaction plot for Brix value (Experiment 2) 73
5.11 Normal Probability Plot (Experiment 2) 73
5.12 Pareto Chart (Experiment 2) 74
5.13 Residual Plot for Brix value 77

1
CHAPTER 1
INTRODUCTION
1.1 Background of the Project
In general, companies compete on three main issues: quality, price and
delivery. This is true for all types of organizations, whether they are in
manufacturing, services or public sector (Ho and Fung, 1994). Moreover, the
business trend nowadays has also shifted to the global market. Competition is
becoming more intense especially when there will be no more trade barrier and
national boundary.
Statistical Process Control (SPC) plays a major part in the efforts of many
organizations and industries to improve the competitiveness of their products,
services, prices and deliveries. SPC is an effective approach to problem solving and
process improvement or even stop producing chaos ( Oakland, 2010). In continuous
production activity, usually seven basic SPC tools such as flow chart, check sheet,
scatter plot, control chart, histogram, Pareto analysis and Ishikawa fish bone chart are
applied concurrently. Control charts are classified to the variable and attribute control
charts. Control chart for variables consists of several types such as Shewhart X-bar,R
and X-bar,S, Cumulative sum (Cusum), exponentially weighted moving average
(EWMA), individual moving range and others. Control charts function as the
statistical method to monitor and control the process variable or attribute within the
computed or historical control limits. Control limits are usually computed based on
drawing specification, machine capability or historical process mean and standard

2
deviation. Most production practices will use the tightened control limits which are
1.33 times smaller than the specification limits. For stable process, a centerline
between these two control limits need to be maintained continuously. Basically,
control charts acts to monitor a process by signals any plotted data that is out from
the control limits.
Soy sauce is a dominant savory in Asian dietary. In order to ensure the taste
and the aroma is maintained delicious and exotic, the ingredient and the procedures to
manufacture the soy sauce must be standards and comply with the food safety control
system. Soy sauce (also called soya sauce) is a condiment made from a fermented
paste of boiled soybeans, roasted grain, brine, and Aspergillus oryzae or Aspergillus
sojae molds. After fermentation, the paste is pressed, producing a liquid, which is the
soy sauce, and a solid byproduct, which is often used as animal feed. Soy sauce is a
traditional ingredient in East and Southeast Asian cuisines, where it is used in
cooking and as a condiment. It originated in China and spread throughout Asia. Soy
sauce has a distinct yet basic taste of umami, due to naturally occurring free
glutamates (Khaterine,2003).
Varieties of soy sauce are salty, earthy, brownish liquids intended to season
food while cooking. Many kinds of soy sauce are made in Japan, Taiwan, China,
Korea, Indonesia, Vietnam, Malaysia and other countries. Variation is usually
achieved as the result of different methods and durations of fermentation, different
ratios of water, salt, and fermented soy, or through the addition of other ingredients.
This study focused on soy sauce company, Zara Foodstuff Industries Sdn Bhd
current practice shows that the company did not measure the ingredients because they
believe that the total weight stated at every pack of raw material is accurate. This
situation could affect the variability of brix value of sweet soy sauce. In order to
improve the quality of brix, design of experiment adopted as analyzed tools.
3
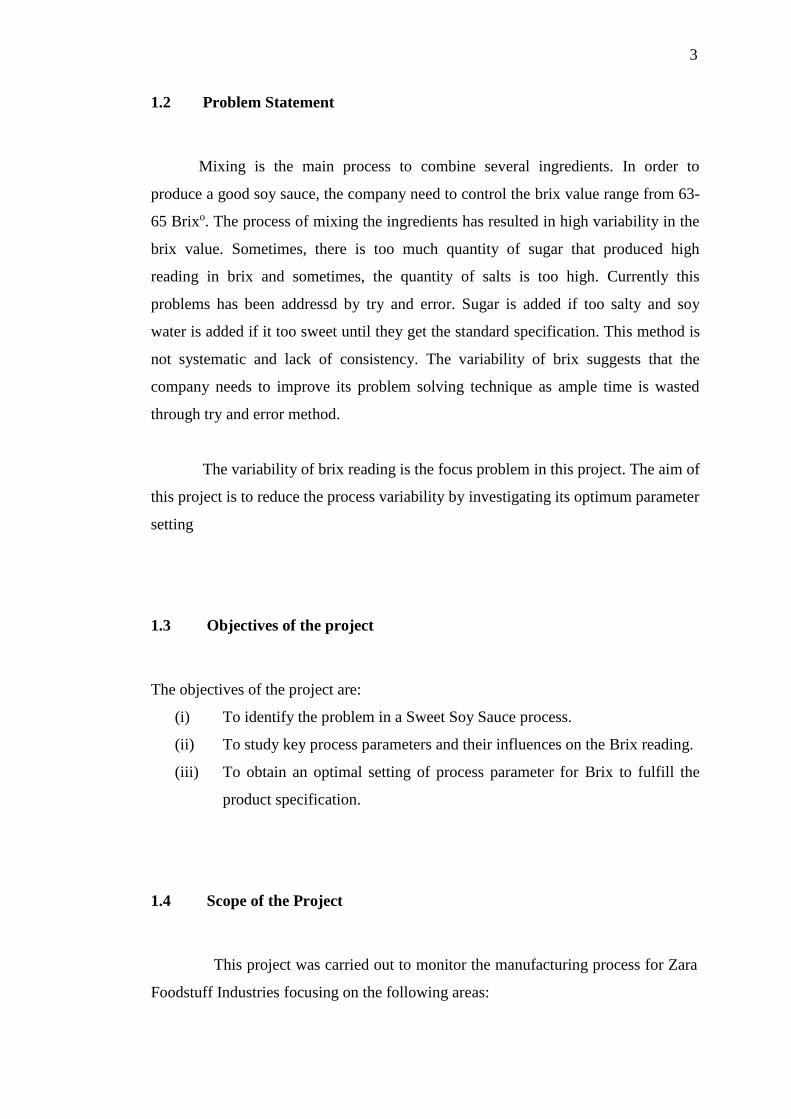
1.2 Problem Statement
Mixing is the main process to combine several ingredients. In order to
produce a good soy sauce, the company need to control the brix value range from 63-
65 Brixo. The process of mixing the ingredients has resulted in high variability in the
brix value. Sometimes, there is too much quantity of sugar that produced high
reading in brix and sometimes, the quantity of salts is too high. Currently this
problems has been addressd by try and error. Sugar is added if too salty and soy
water is added if it too sweet until they get the standard specification. This method is
not systematic and lack of consistency. The variability of brix suggests that the
company needs to improve its problem solving technique as ample time is wasted
through try and error method.
The variability of brix reading is the focus problem in this project. The aim of
this project is to reduce the process variability by investigating its optimum parameter
setting
1.3 Objectives of the project
The objectives of the project are:
(i) To identify the problem in a Sweet Soy Sauce process.
(ii) To study key process parameters and their influences on the Brix reading.
(iii) To obtain an optimal setting of process parameter for Brix to fulfill the
product specification.
1.4 Scope of the Project
This project was carried out to monitor the manufacturing process for Zara
Foodstuff Industries focusing on the following areas:
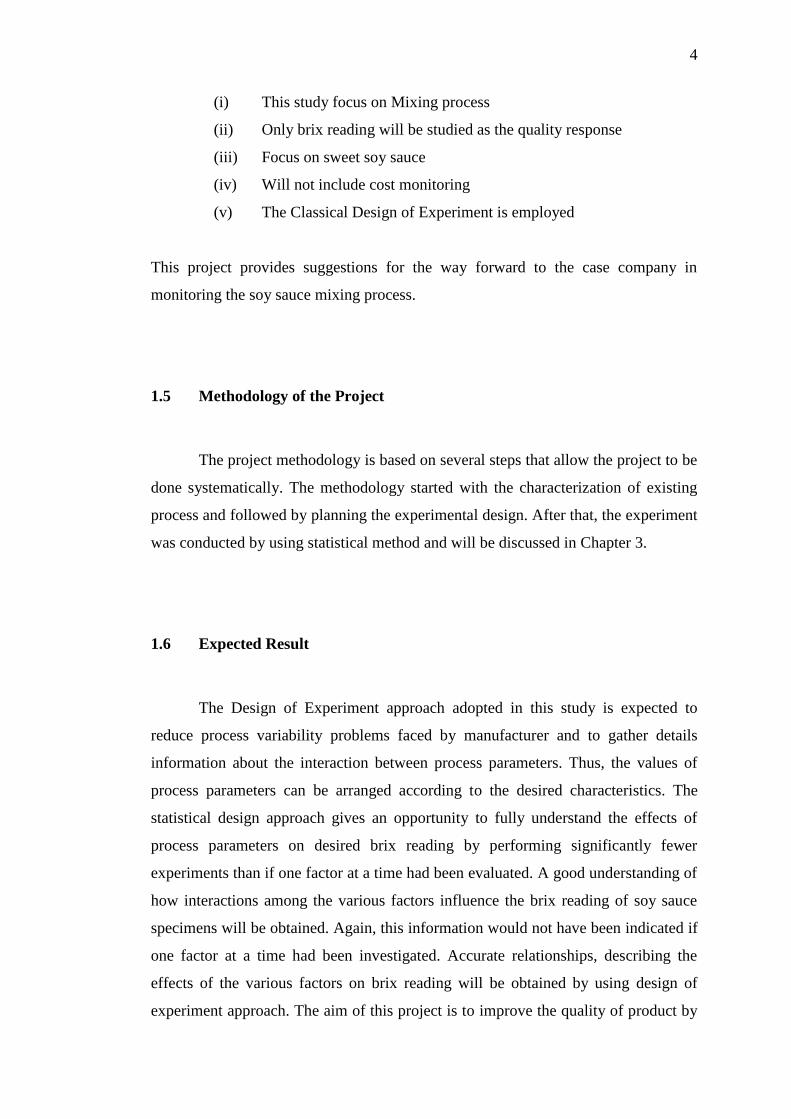
4
(i) This study focus on Mixing process
(ii) Only brix reading will be studied as the quality response
(iii) Focus on sweet soy sauce
(iv) Will not include cost monitoring
(v) The Classical Design of Experiment is employed
This project provides suggestions for the way forward to the case company in
monitoring the soy sauce mixing process.
1.5 Methodology of the Project
The project methodology is based on several steps that allow the project to be
done systematically. The methodology started with the characterization of existing
process and followed by planning the experimental design. After that, the experiment
was conducted by using statistical method and will be discussed in Chapter 3.
1.6 Expected Result
The Design of Experiment approach adopted in this study is expected to
reduce process variability problems faced by manufacturer and to gather details
information about the interaction between process parameters. Thus, the values of
process parameters can be arranged according to the desired characteristics. The
statistical design approach gives an opportunity to fully understand the effects of
process parameters on desired brix reading by performing significantly fewer
experiments than if one factor at a time had been evaluated. A good understanding of
how interactions among the various factors influence the brix reading of soy sauce
specimens will be obtained. Again, this information would not have been indicated if
one factor at a time had been investigated. Accurate relationships, describing the
effects of the various factors on brix reading will be obtained by using design of
experiment approach. The aim of this project is to improve the quality of product by

5
reducing the variation of brix reading. When the performance is constantly closer to
the target, fewer products are produced out of target. Meaning that the products are
produced within specification limits or in this case study products are within
Guaranty Limits.
1.7 Summary
This chapter introduces the problem in the case study company, Zara
Foodstuff Industries Sdn. Bhd. The variability of brix reading is the focus problem.
The aim of this project is to reduce the process variability by investigating its
optimum parameter setting.
6
CHAPTER 2
LITERATURE REVIEW
2.1 Introduction
There are several aspects that will be covered in this chapter which are the
Quality, Statistical Process Control (SPC), process, control and Design of
Experiment (DOE) to be more related to food processing regarding the case study
company are manufacture of food product.
For the quality, the definition of quality from several gurus will be explained.
A detailed explanation on quality procurement will be given. The next issue is
regarding SPC definition, function and the important role in manufacturing. The
main topic relating to process monitoring will also be discussed.
Consecutively, the basis on what should consist in process monitoring will be
explained using the SPC method focused on requirements that relatives to the
process.
2.2 Quality
Nowadays, the word quality appears on almost in every product such as food,
automobiles and software. No matter where people go, they will see or hear about
quality. In fact, people demand a certain level of quality in everything that they want
86
REFERENCES
A. Bulent Koc, Mudhafer Abdullah and Mohammad Fereidouni (2011) Soybeans
Processing for Biodiesel Production. University of Missouri. United States
AR Jambrak (2011). Experimental Design and Optimization of Ultrasound
Treatment of Food Products. Faculty of Food Technology and Biotechnology,
University of Zagreb, Zagreb, Pierottijeva 6, Croatia.
Adnan bin Hassan,( 2002), On-Line Recognition of Developing Control Patterns,
Phd Thesis, Skudai: Universiti Teknologi Malaysia.
Antony, J. (1998) Some Key Things Industrial Engineers Should Know about
Experimental Design. Journal of Quality Technology, Vol. 19, No. 2.
Antony, J. (1999). Taguchi or classical design of experiments: a perspective from a
practitioner. CRISSPI, Caledonian Business School, Glasgow, UK.
Besterfield, D.H., (2004), Quality Control, 11th ed. New Jersey: Prentice Hall Inc.
Box, W. H., G.E.P. and Hunter, J. (1978). Statistics for Experimenters. John Wiley &
Sons, New York.
Box, G. E. P. and Wilson, K. (1951). On the Experimental Attainment of Optimum
Conditions. Journal of the Royal Statistical Society Series,. B 13(1).
Bossert,J.L.,(1994). Total Quality in Purchasing & Supplier Management. United
States: St. Lucie Press
87
Butler, D. and Kavanagh, D. (2001) The British General Election of 2001. London:
Palgrave.
Cheng C.C, Meei.Y.L, (1998) Biochemical changes in soy sauce prepared with
extruded and traditional raw materials, Food Research International, Vol.31, No.6-
7,pp.487-492.
Chung, K.J., (1992), Economically Optimal Determination of the Parameters of
Cusum Charts, International Journal of Quality and Reliability Management, Vol.
19, No. 6.
Crowder, S.V., (1987), ARL of EWMA Control Charts, Journal of Quality
Technology, Vol. 17, No. 3.
Crowder, S.V., (1989), Design of Exponentially Weighted Moving Average Schemes,
Journal of Quality Technology, Vol. 21, No. 3.
DeVor, T. C., R.E. and Sutherland, J. (1992). Statistical Quality Design and Control.
Macmillan Publishing Company, New York.
Doty, L.A., (2006), Statistical Process Control, 2nd ed. USA: Industrial Press Inc.
Dovich, B.A., (2012), Quality Engineering Statistics. Milwaukee, Wisconsin: ASQC
Quality Press.
Dyer, J.N., (2003), The Reverse Moving Average Control Chart for Monitoring Auto-
Correlated Process, Journal of Quality Technology, Vol. 35, No. 2.
G. E. P. Box and A. Luceno, (1997), Statistical Control by Monitoring and Feedback
Adjustment, New York: John Wiley and Sons.
Hawkins, D.M.; Qiu, Peihua and Kang, Chang Wook, (2003), The Changepoint
Model for SPC, Journal of Quality Technology, Vol. 35, No. 4.

88
Hinkelmann, K. and Kempthorne, (2010). Design and Analysis of Experiments.
Volume 2: Advanced Experimental Design (First ed.). ISBN 978-0-471- 55177-5.
Ho, S.K. and Fung, C.H.(1994). Developing a TQM Excellence Model. The TQM
Magazine. Vol.6 No.6, pp.24-30
Hoyle, D.(2005). Qs-9000 Quality System Handbook. United States: British Library.
Juran, J.M. and Gryna F.M (1980). Quality Planning and Analysis. United States:
McGraw Hill.
Johnson,P.L. (1997). ISO 9000 Meeting the International Standards. 2nd Edition,
United States: McGraw Hill.
Kenett, R.S. and Zacks, S., (1998), Modern Industrial Statistics, Design and Control
of Quality and Reliability, Brooks/ Cole Publishing Co.
Khaterine (1997), Food Engineering Practice, CRC Press, New York.
Kittliz, Rudy, (2003), Detection of Multiple Change Points from Clustering
Individual Observations, Journal of Quality Technology, Vol. 35, No. 3.
Kircher,T.A, McMordie, B.G, and Richards,K.(2010) Use of experimental Designs to
Evaluate Formation of Aluminide and Platinum Aluminide Coating. Surface and
Coating Technology 108-109 pp24-29
Klein, Morton, (2000), Two Alternatives to the Shewhart Xbar Control Chart,
Journal of Quality Technology, Vol. 32, No.4
Lochner, R. H. and Matar, J. E. (1990).Designing For Quality: An Introduction to
the Best of Taguchi and Western Methods of Statistical Experimental Design.
London: Chapman and Hall, ASQC Quality Press.

89
Lucas, J.M, (1982), Combined Shewhart-Cusum Quality Control Schemes, Journal of
Quality Technology, Vol. 14, No. 2.
Lucas, J.M and Saccucci, M.S., (1990), Exponentially Weighted Moving Average
Control Schemes: Properties and Enhancements, Technometrics, Vol. 32.
Montgomery, D.C., (2012), Introduction to Statistical Quality Control, 7rd ed. USA:
John Wiley and Son Inc.
Montgomery, D. (2005). Design and Analysis of Experiments. 6th Edition. John
Wiley & Sons, New York.
Mostafa Galal,Michael Scheller. (2011). Finished Product Applications for Process
Cheese Show Improved Appearance Using Design of Experiments. The Agricultural
Experiment Station, University of Vermont.
Myers, K. A. I., Raymond H. and Carter, J., Walter H. (1989). Response surface
methodology. 1966-1988. Technometrics 31 (2).
Nathalie,A.,(1999), Statistical Process Control for Serially Correlated Data.
Netherlands: Labyrith.
Oakland, J.S., (1996), Statistical Process Control, A Really Practical Guide, 3rd ed.
Heinemann.
Ott, E.R.; Schilling, E.G. and Neubauer, D.V., (2000), Process Quality Control,
TroubleShooting and Interpretation of Data, 3rd ed. USA: McGraw-Hill.
S.Linko and P.Linko, (1998), Developments in monitoring and Control of Food
Processes, Institution of Chemical Engineers, Vol 176, Part C.
Seraj Yousef Abed. (2008) Improving Productivity in Food Processing Industries
Using Simulation - A Case Study. 12th WSEAS International Conference on
Systems, Heraklion, Greece.

90
Shamma, S.E. and Shamma, A.K., (1992), Development and Evaluation of Control
Charts Using Double Exponentially Weighted Moving Averages, International
Journal of Quality and Reliability Management, Vol. 9, No. 6.
Shamma, S.E. and Amin, R.W., (1992), An EWMA Quality Control Procedure for
Jointly Monitoring the Mean and Variance, International Journal of Quality and
Reliability Management, Vol. 10, No. 7.
Shigero Kataoka, (2012). Functional Effects of Japanese Style Fermented Soy Sauce
(Shoyu) amd Its Components, International Journal of Food, Vol 3, No.3.
Taguchi, (1986). G. Tokyo: Asian Productivity Organization.
Trietsch, D., (1999), Statistical Quality Control, A Loss Minimization Approach,
Singapore: World Scientific.
Woodall, W.H., (2000), Controversies and Contradiction in SPC, Journal of Quality
Technology, Vol. 32, No. 4.
Zhang.W, Mei.Y,Michael B.C.K, Fong.J.Y, (2010), Optimization designs and
performance comparison of two CUSUM schemes for monitoring process shifs in
mean and variance, European Journal of Operational Research 205,pp 136-150.
Zhou.K.L, Li.Q.Q, Guo.R.S, (2012), Improving Monitoring Accuracy of Process
Based on SPC Method, Journal of Quality Technology, Vol. 41 No. 12.


![TABLA RESUMEN REFRACTÓMETROS DE MANOf...REFRACTÓMETROS - ESCALA DE BRIX [H] EQUIPOS ÓPTICOS refractómetros - escala de brix 6 28-62% Brix Referencia Rango Precisión CAT (10-30ºC)](https://static.fdocuments.net/doc/165x107/5ea4deb5087e893d2616ded3/tabla-resumen-refractmetros-de-mano-f-refractmetros-escala-de-brix-h.jpg)